Embed Size (px)
Citation preview
CORRELATING ANTISENSE RNA PERFORMANCE WITH THERMODYNAMIC
CALCULATIONS
Imen Tanniche
A thesis presented to the faculty of the
Virginia Polytechnic Institute and State University
in partial fulfillment for the requirements for the degree of
Master of Science
in
Biological Systems Engineering
Ryan S. Senger, Chair
Mike Zhang
Foster Agblevor
Hafedh Belghith
December 5, 2012
Blacksburg, Virginia
Keywords: antisense RNA, fluorescent proteins, expression level, minimum free energy,
down-regulation, complex stability.
CORRELATING ANTISENSE RNA PERFORMANCE WITH THERMODYNAMIC
CALCULATIONS
Imen Tanniche
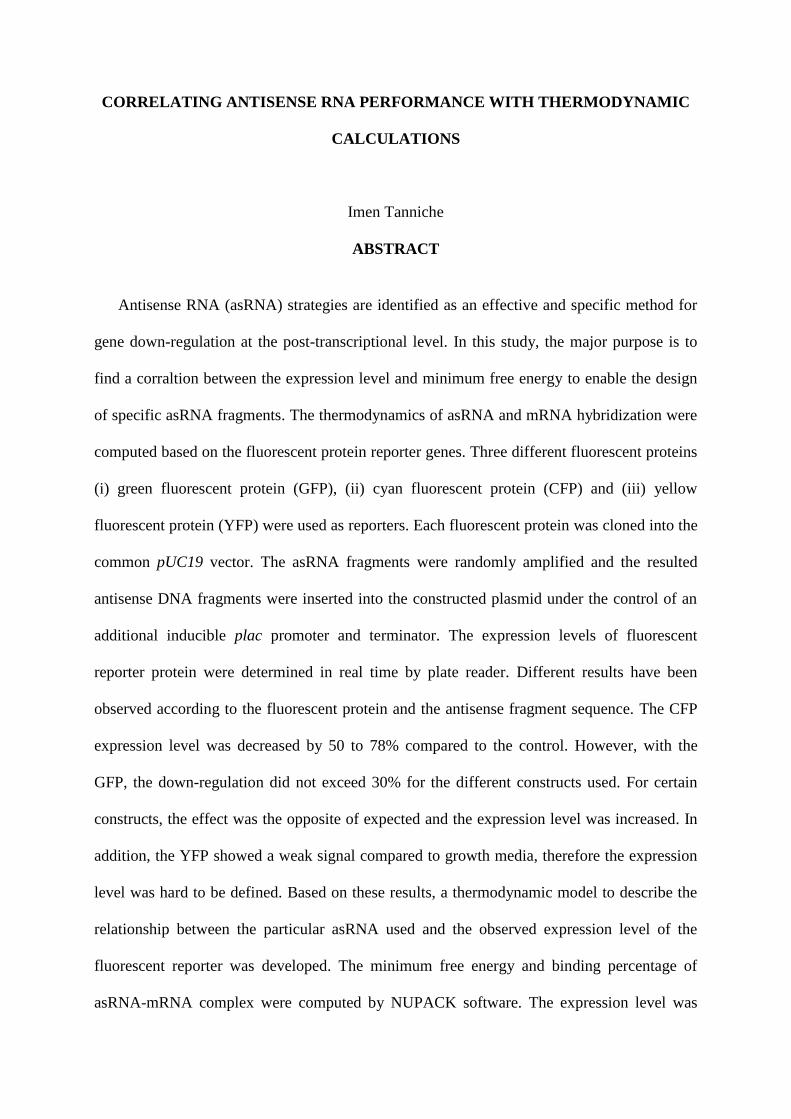
ABSTRACT
Antisense RNA (asRNA) strategies are identified as an effective and specific method for
gene down-regulation at the post-transcriptional level. In this study, the major purpose is to
find a corraltion between the expression level and minimum free energy to enable the design
of specific asRNA fragments. The thermodynamics of asRNA and mRNA hybridization were
computed based on the fluorescent protein reporter genes. Three different fluorescent proteins
(i) green fluorescent protein (GFP), (ii) cyan fluorescent protein (CFP) and (iii) yellow
fluorescent protein (YFP) were used as reporters. Each fluorescent protein was cloned into the
common pUC19 vector. The asRNA fragments were randomly amplified and the resulted
antisense DNA fragments were inserted into the constructed plasmid under the control of an
additional inducible plac promoter and terminator. The expression levels of fluorescent
reporter protein were determined in real time by plate reader. Different results have been
observed according to the fluorescent protein and the antisense fragment sequence. The CFP
expression level was decreased by 50 to 78% compared to the control. However, with the
GFP, the down-regulation did not exceed 30% for the different constructs used. For certain
constructs, the effect was the opposite of expected and the expression level was increased. In
addition, the YFP showed a weak signal compared to growth media, therefore the expression
level was hard to be defined. Based on these results, a thermodynamic model to describe the
relationship between the particular asRNA used and the observed expression level of the
fluorescent reporter was developed. The minimum free energy and binding percentage of
asRNA-mRNA complex were computed by NUPACK software. The expression level was
iii
drawn as a function of the minimum free energy. The results showed a weak correlation, but
linear trends were observed for low energy values and low expression levels the CFP gene.
The linear aspect is not verified for higher energy values. These findings suggest that the
lower the energy is, the more stable is the complex asRNA-mRNA and therefore more
reduction of the expression is obtained. Meanwhile, the non-linearity involves that there are
other parameters to be investigated to improve the mathematical correlation. This model is
expected to offer the chance to “fine-tune” asRNA effectiveness and subsequently modulate
gene expression and redirect metabolic pathways toward the desired component. In addition,
the investigation of the localization of antisense binding indicates that there are some regions
that favors the hybridization and promote hence the down-regulation mechanisms.

iv
ACKNOWLEDGMENTS
This project was primarily supported by a grant from the US Department of State (#S-
TS800-09-GR-204) entitled, Virginia Tech-National Engineering School of Sfax partnership:
towards strengthening of higher education & research capacities for better serving the
economic development priorities in Tunisia. The grant was administered by the US Embassy
in Tunis, Tunisia. This project was also partially supported by a fund from Virginia Tech
(#425997).
This work would not have been completed without help and support of many individuals.
I would like to thank everyone who has helped me along the way.
I would like to thank particularly my advisors. First and foremost, I would like to express
my deepest gratitude to Dr. Ryan Senger for providing me with the opportunity to conduct
my master thesis in his laboratory. He offered me so much advice, patiently supervising me
and guiding me to the right direction. I have leant a lot from him. It was an honor to work
with him and his team. I am also very grateful to Pr. Hafedh Belghith for his scientific
advice and knowledge, many insightful discussions and valuable suggestions.
I would like to gratefully acknowledge the supervision of Yang Yue who has been
abundantly helpful and has assisted me in numerous ways.
My special thanks go to Virginia Tech committee members: Dr. Chenming Zhang and
Dr. Foster Agblevor and ENIS committee members: Pr. Radhia Gargouri and Dr. Maha
Karra who accepted to review and judge my work.
Special thanks go also to all professors who contributed to the master of Fuel Processing
Engineering, especially Pr. Kamel Halouani, Pr. Sami Sayedi, Pr. Ali Gargouri and Pr.
Slim Choura for their continuous help and guidance.

v
The members of the Metabolic Engineering and Systems Biology Laboratory have
contributed immensely to my personal and professional time at Virginia Tech. The team has
been a source of friendships as well as good advice and collaboration. I would like to thank
specially Hadi Nazem-Bokaee, Ben Freedman, Ahmad Athamneh, Theresah Korbieh,
Advait Apte and Jiun Yen. I also thank undergrad students: Nick Mangili and Parker Lee
for their precious help.
I do thank all Biological Engineering System staff for their kindness and willingness to
help. Special thanks go to Susan Rosebrough.
I am forever grateful to my friends for their constant support and encouragement
throughout my research work and whose support motivated me in attaining my goal.
Finally, I take this opportunity to express the profound gratitude to my beloved family for
their constant encouragement and support. Their prayers have enabled me to reach the present
position in life.
Imen Tanniche
vi
LIST OF ABBREVIATIONS
°C: Degree Celsius
µg: Micrograms
2’-MOE: 2'-O-methoxyethyl
2'O-Me: 2'-O-methyl
asRNA: Antisense RNA
Bp: Base pair
cDNA: Complementary DNA
CFP: Cyan Fluorescent Protein
cm: centimeter
DNA: Deoxyribonucleic acid
dsRNA: Double stranded RNA
E. coli: Escherichia coli
EB: Elution Buffer from QIAGEN
FDA: Food and Drug Administration
GFP: Green Fluorescent Protein
h: hours
IPTG: Isopropylthio-β-galactoside
kb: kilo base
kcal: Kilo calorie
KCl: Potassium Chloride
L: Liter
LB: Luria Bertani
LNA: Locked nucleic acid
M: Molar
MFE: Minimum Free Energy
Mg2+
: Magnesium ion
MgCl2: Magnesium Dichloride
MgSO4: Magnesium Sulfate
Min: Minute
mL: Milliliter
mol: mole
mRNA: messenger RNA
Na+: Sodium ion
NaCl: Sodium Chloride
ng: Nanogram
OD: Optical density
ON: Oligonucleotide
PCR: Polymerase Chain Reaction
PMO: Phosphoroamidate Morpholino oligomer
PNA: Peptide Nucleic Acid
pro: promoter
RBS: Ribosome Binding Site
RFU: Relative Fluorescence Unit
RNA: Ribonucleic Acid
rRNA: Ribosomal RNA
SD: Shine Dalgarno
siRNA: Small (Short) Interfering RNA
SOC: Super Optimal broth
term: terminator
Tm: Melting temperature
X-gal: 5-bromo-4-chloro-3-indolyl-β-D-galactopyranoside
YFP: Yellow Fluorescent Protein
ZsYFP: Zoanthus sp Yellow Fluorescent Protein
vii
TABLE OF CONTENTS
Chapter 1: INTRODUCTION .............................................................................................. 1
Chapter 2: LITERATURE REVIEW .................................................................................. 3
2.1. BACKGROUND: ANITSENSE RNA TECHNOLOGY ............................................... 3
2.1.1. Naturally occurring asRNAs (Endogenous asRNAs) .............................................. 5
2.1.1.1. Prokaryotes and viruses ..................................................................................... 5
2.1.1.2. Eukaryotes ......................................................................................................... 6
2.1.1.3. Double-stranded RNA ....................................................................................... 6
2.1.2. Synthetic asRNA ...................................................................................................... 6
2.1.2.1. First generation of chemically modified asRNA ............................................... 7
2.1.2.2. Second generation of chemically modified asRNA .......................................... 8
2.1.2.3. Third generation of chemically modified asRNA ............................................. 8
2.1.2.4. Naturally occurring antisense versus chemically modified antisense ............. 10
2.1.3. The antisense strategy ............................................................................................ 11
2.1.3.1. RNase-H-dependent oligonucleotides ............................................................. 12
2.1.3.2. Steric-blocker oligonucleotides ....................................................................... 13
2.1.4. Pairing mechanism and kinetics ............................................................................. 13
2.1.4.1. Pairing mechanism .......................................................................................... 13
2.1.4.2. Pairing kinetics ................................................................................................ 15
2.1.5. Factors affecting asRNA efficiency ....................................................................... 15
2.1.5.1. AsRNA stability .............................................................................................. 16
2.1.5.2. Antisense concentration .................................................................................. 16
2.1.5.3. Target accessibility .......................................................................................... 16
2.1.5.4. RNA binding proteins ..................................................................................... 17
2.1.5.5. Cellular metabolism ........................................................................................ 17
2.1.6. Applications of asRNA in metabolic engineering .................................................. 17
2.2. FLUORESCENT PROTEINS AS REPORTERS ......................................................... 21
2.2.1. Generalities ............................................................................................................. 21
2.2.2. Properties of reef coral fluorescent proteins .......................................................... 21
2.3. THERMODYNAMICS OF NUCLEOTIDE BOND FORMATION ........................... 22
2.3.1. RNA secondary structure ....................................................................................... 22
2.3.2. NUPACK thermodynamic software ....................................................................... 23
2.3.2.1. Minimum free energy ...................................................................................... 24
2.3.2.2. Binding percentage .......................................................................................... 26
2.4. REFRENCES ................................................................................................................ 28
viii
Chapter 3: MATERIAL AND METHODS ....................................................................... 44
3.1. STRAINS ...................................................................................................................... 44
3.2. PLASMIDS ................................................................................................................... 44
3.3. REAGENTS .................................................................................................................. 45
3.4. GENETIC MANIPULATIONS .................................................................................... 45
3.4.1. PCR amplification of fluorescent protein genes..................................................... 46
3.4.2. Construction of the pUC19-pro-term-fluorescent protein plasmid ........................ 47
3.4.2.1. Extraction of pU19-pro-term .......................................................................... 47
3.4.2.2. Digestion of pU19-pro-term ............................................................................ 47
3.4.2.3. Purification and ligation of pU19-pro-term with the fluorescent gene ........... 48
3.4.3. Chemical transformation of pUC19-pro-term-fluorescent protein plasmid into E.
coli Top10 cells ................................................................................................................ 48
3.4.4. Construction of pUC19-pro-term-fluorescent protein-asRNA .............................. 49
3.4.4.1. Amplification of asRNA genes ....................................................................... 49
3.4.4.2. Purification of asRNA genes ........................................................................... 51
3.4.4.3. Extraction and digestion of pUC19-pro-term-fluorescent protein .................. 51
3.4.4.4. Infusion cloning method .................................................................................. 52
3.5. FLUORESCENT PROTEIN EXPRESSION LEVEL DETERMINATION ................ 52
3.6. DETERMINATION OF FREE ENERGY AND BINDING PERCENTAGE ............. 53
3.7. SOFTWARES ............................................................................................................... 54
3.8. REFRENCES ................................................................................................................ 55
Chapter 4: RESULTS AND DISCUSSION ....................................................................... 56
4.1. CYAN FLUORESCENT PROTEIN ............................................................................ 56
4.1.1. Construction of pUC19-pro-term-CFP .................................................................. 56
4.1.2. Amplification of antisense CFP gene fragment ..................................................... 57
4.1.3. Construction of pUC19-pro-term-CFP-asCFP ..................................................... 60
4.1.4. Quantitative analysis of CFP expression level ....................................................... 61
4.1.5. Verification of antisense CFP fragments................................................................ 64
4.1.6. Hybridization of CFP antisense RNA fragments with mRNA .............................. 65
4.2. GREEN FLUORESCENT PROTEIN .......................................................................... 68
4.2.1. Amplification of antisense GFP gene fragment ..................................................... 68
4.2.2. Results of pUC19-pro-term-GFP-asGFP construction ......................................... 70
4.2.3. Determination of GFP expression level ................................................................. 70
4.2.4. Identification of asGFP fragments ......................................................................... 70
4.2.5. Analysis of GFP expression level .......................................................................... 71
4.2.6. Hybridization of antisense RNA fragments with mRNA ....................................... 75
ix
4.3. YELLOW FLUORESCENT PROTEIN ....................................................................... 76
4.3.1. Construction of pUC19-pro-term-YFP .................................................................. 76
4.3.2. Construction of pUC19-pro-term-YFP-asYFP ...................................................... 77
4.3.3. Expression level of YFP under the control of different antisense fragments ......... 78
4.3.4. Analysis of DNA sequences ................................................................................... 82
4.3.5. Quantitative analysis of YFP expression level ....................................................... 83
4.4. DISCUSSION ............................................................................................................... 86
4.4.1. Antisense design and location ................................................................................ 86
4.4.2. Thermodynamic model .......................................................................................... 88
4.5. REFRENCES ................................................................................................................ 89
Chapter 5: CONCLUSION AND RECOMMENDATIONS ........................................... 91
5.1. CONCLUSION ............................................................................................................. 91
5.2. RECOMMENDATIONS .............................................................................................. 92
x
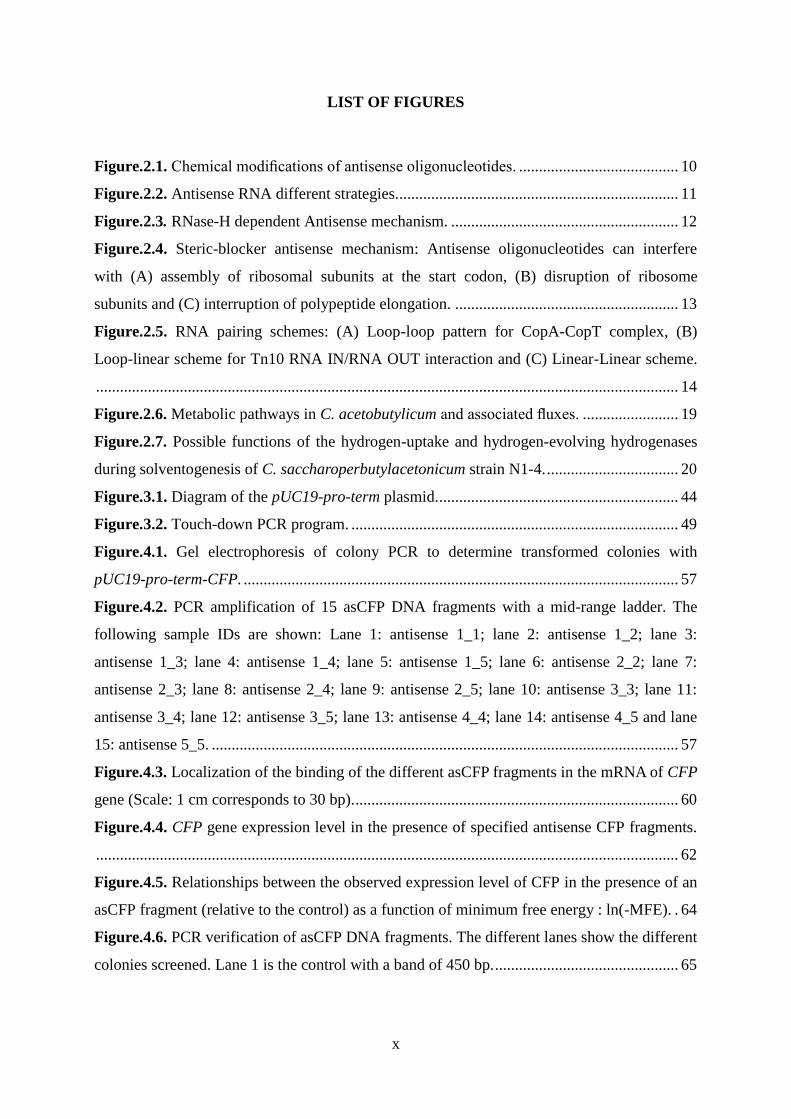
LIST OF FIGURES
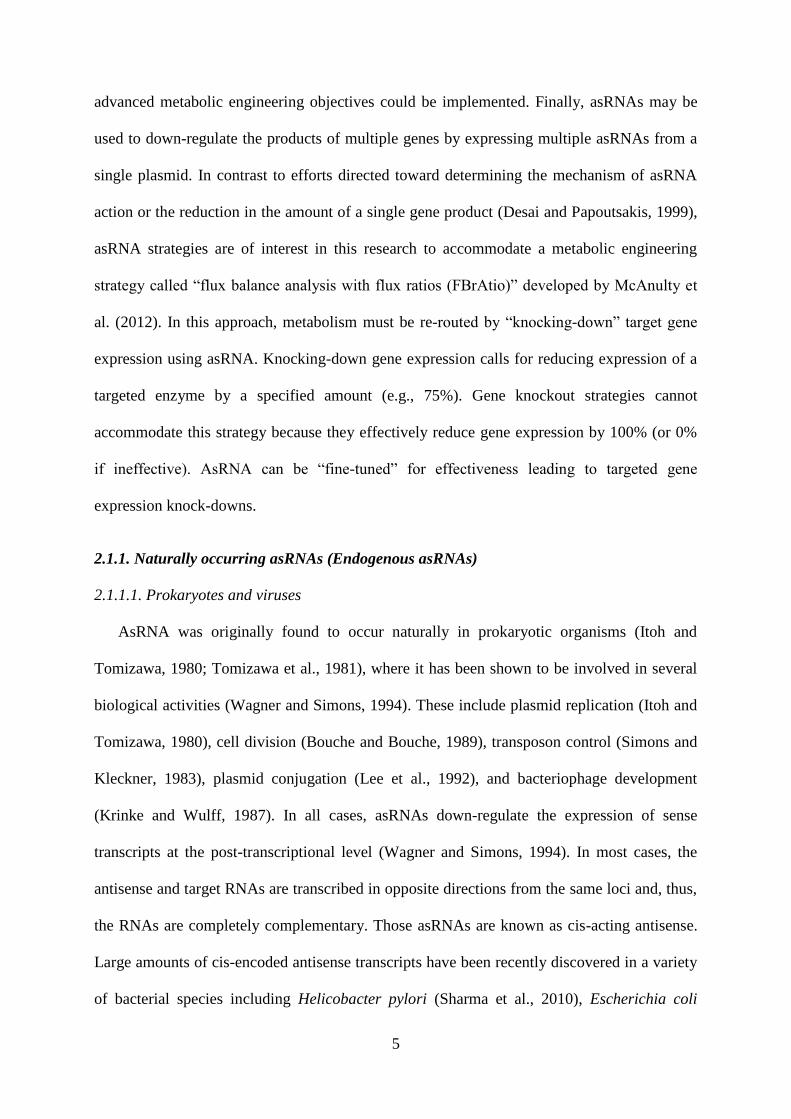
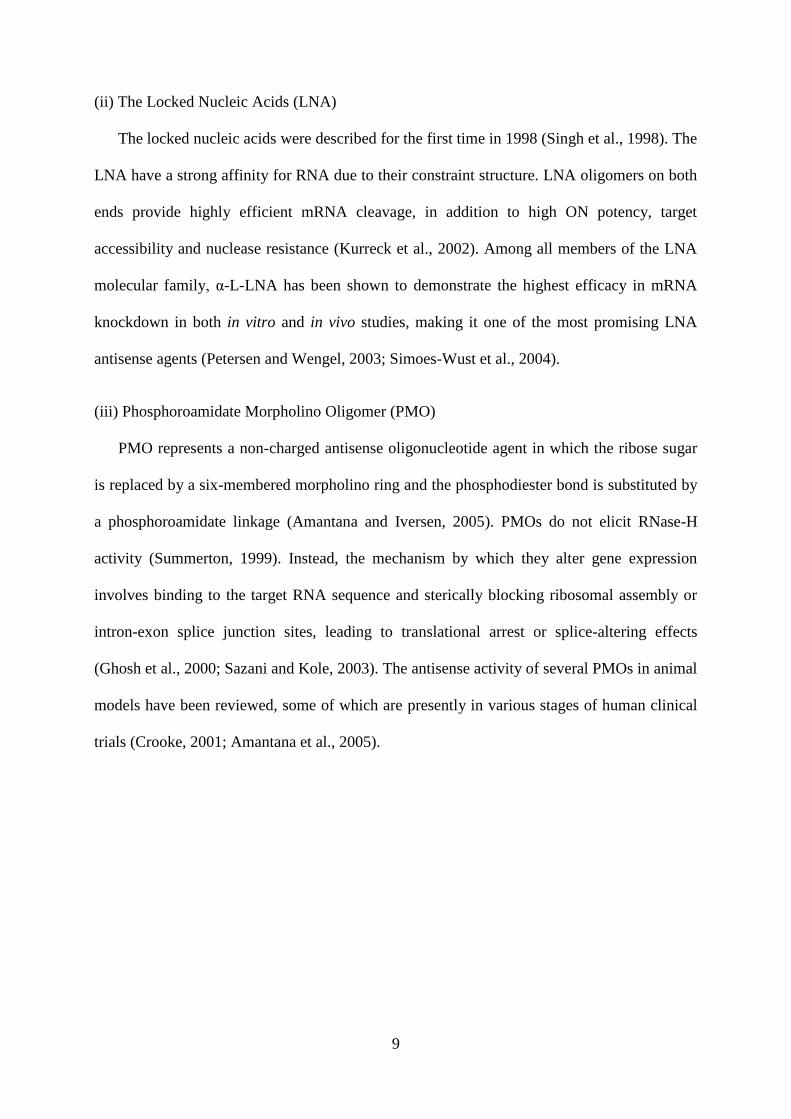
Figure.2.1. Chemical modifications of antisense oligonucleotides. ........................................ 10
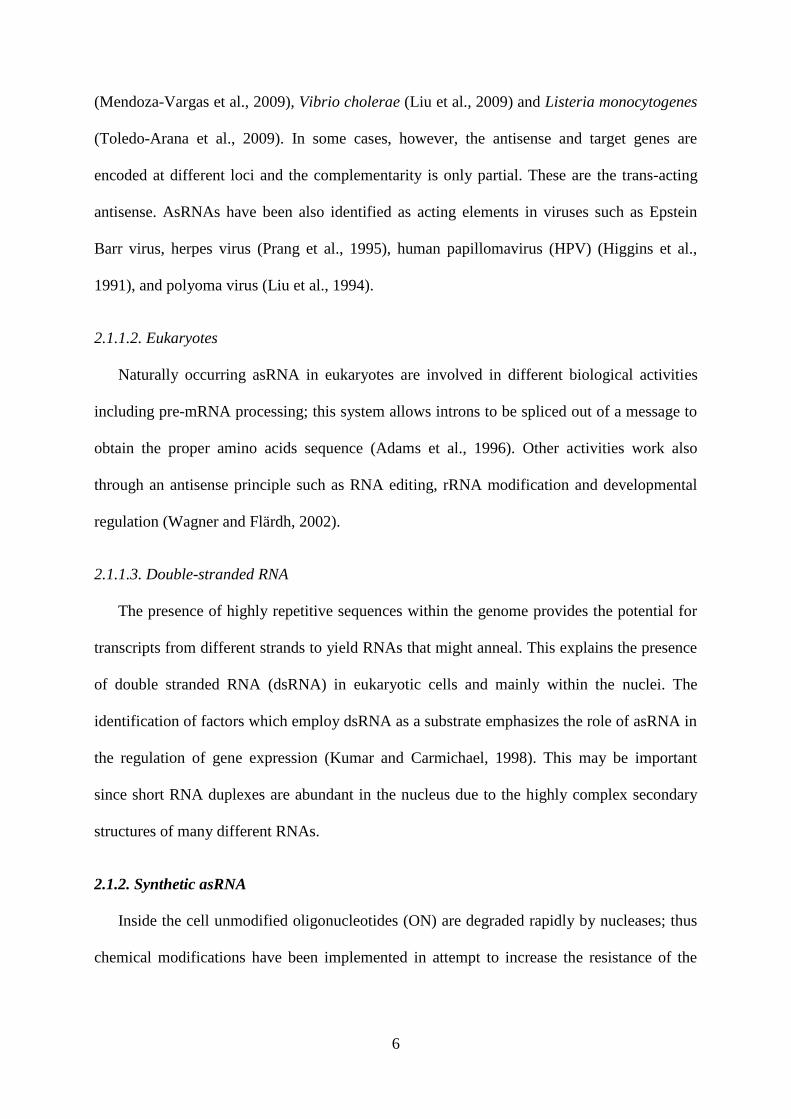
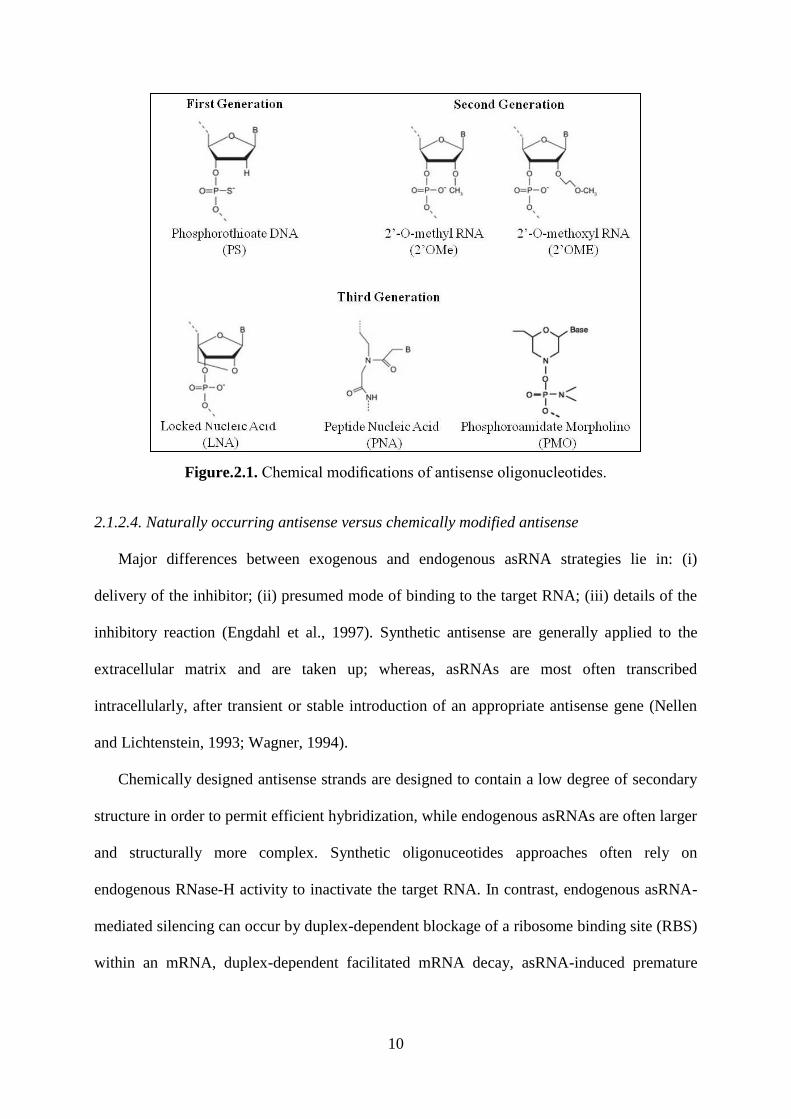
Figure.2.2. Antisense RNA different strategies....................................................................... 11
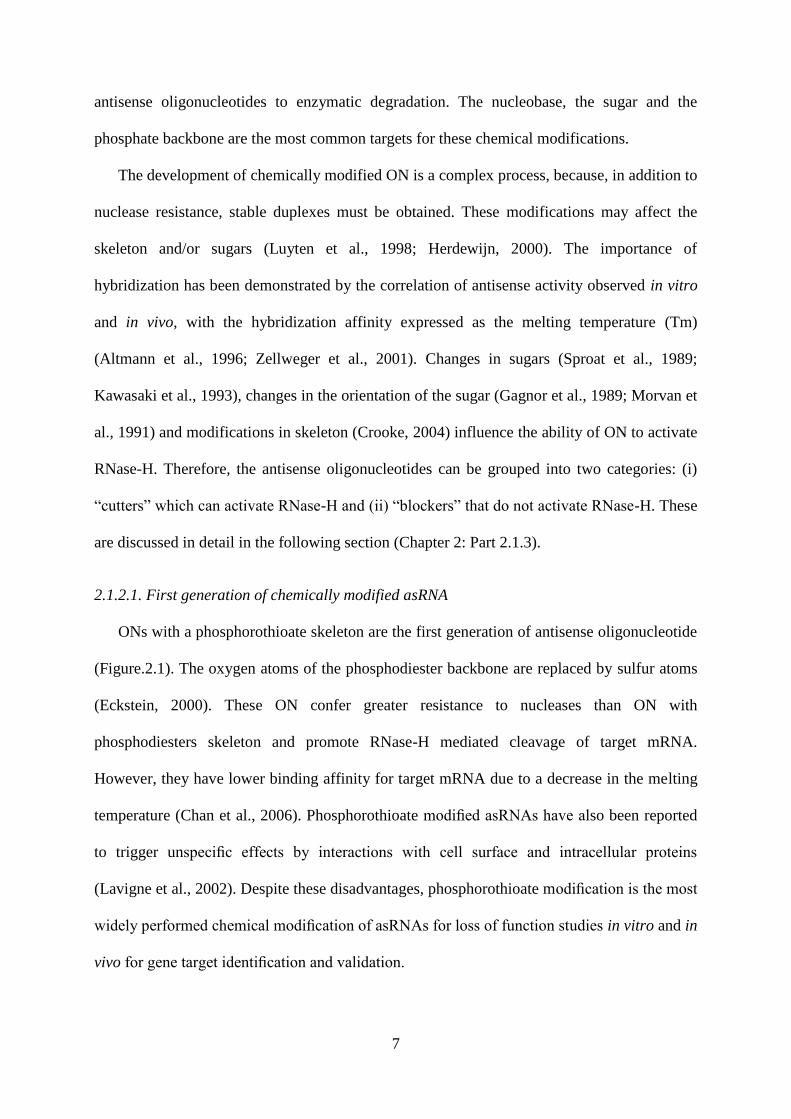
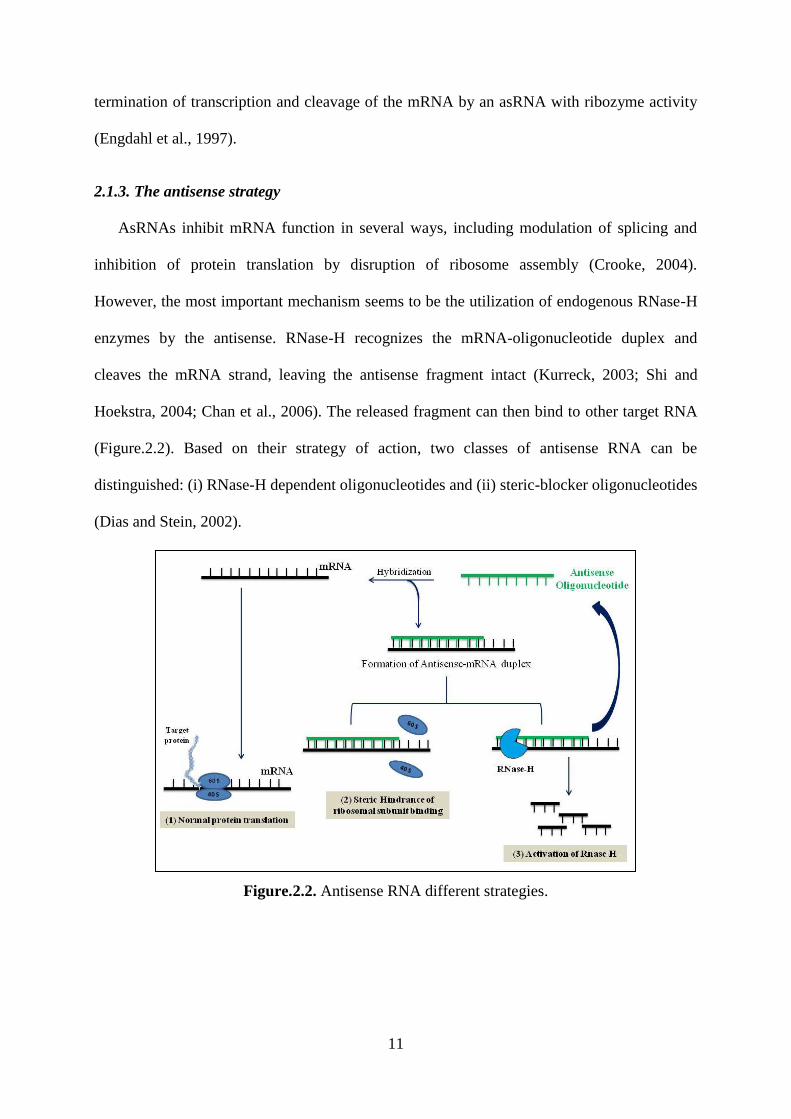
Figure.2.3. RNase-H dependent Antisense mechanism. ......................................................... 12
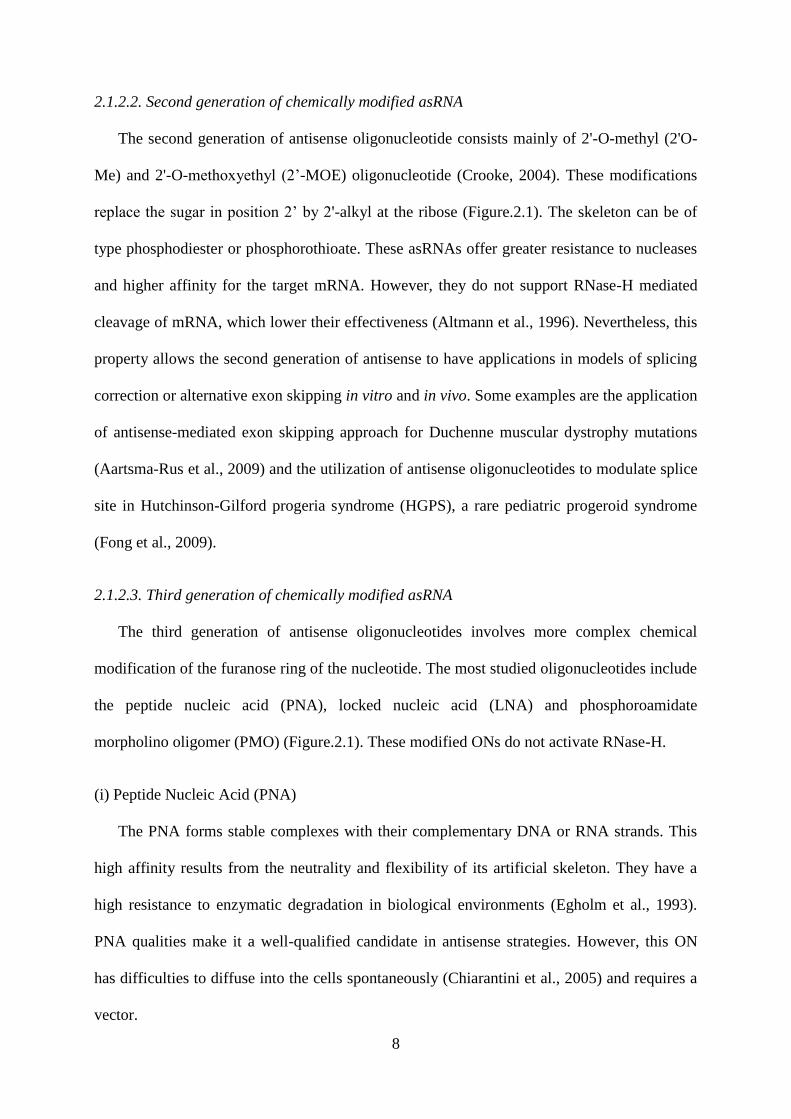
Figure.2.4. Steric-blocker antisense mechanism: Antisense oligonucleotides can interfere
with (A) assembly of ribosomal subunits at the start codon, (B) disruption of ribosome
subunits and (C) interruption of polypeptide elongation. ........................................................ 13
Figure.2.5. RNA pairing schemes: (A) Loop-loop pattern for CopA-CopT complex, (B)
Loop-linear scheme for Tn10 RNA IN/RNA OUT interaction and (C) Linear-Linear scheme.
.................................................................................................................................................. 14
Figure.2.6. Metabolic pathways in C. acetobutylicum and associated fluxes. ........................ 19
Figure.2.7. Possible functions of the hydrogen-uptake and hydrogen-evolving hydrogenases
during solventogenesis of C. saccharoperbutylacetonicum strain N1-4. ................................. 20
Figure.3.1. Diagram of the pUC19-pro-term plasmid. ............................................................ 44
Figure.3.2. Touch-down PCR program. .................................................................................. 49
Figure.4.1. Gel electrophoresis of colony PCR to determine transformed colonies with
pUC19-pro-term-CFP. ............................................................................................................. 57
Figure.4.2. PCR amplification of 15 asCFP DNA fragments with a mid-range ladder. The
following sample IDs are shown: Lane 1: antisense 1_1; lane 2: antisense 1_2; lane 3:
antisense 1_3; lane 4: antisense 1_4; lane 5: antisense 1_5; lane 6: antisense 2_2; lane 7:
antisense 2_3; lane 8: antisense 2_4; lane 9: antisense 2_5; lane 10: antisense 3_3; lane 11:
antisense 3_4; lane 12: antisense 3_5; lane 13: antisense 4_4; lane 14: antisense 4_5 and lane
15: antisense 5_5. ..................................................................................................................... 57
Figure.4.3. Localization of the binding of the different asCFP fragments in the mRNA of CFP
gene (Scale: 1 cm corresponds to 30 bp). ................................................................................. 60
Figure.4.4. CFP gene expression level in the presence of specified antisense CFP fragments.
.................................................................................................................................................. 62
Figure.4.5. Relationships between the observed expression level of CFP in the presence of an
asCFP fragment (relative to the control) as a function of minimum free energy : ln(-MFE). . 64
Figure.4.6. PCR verification of asCFP DNA fragments. The different lanes show the different
colonies screened. Lane 1 is the control with a band of 450 bp. .............................................. 65
xi
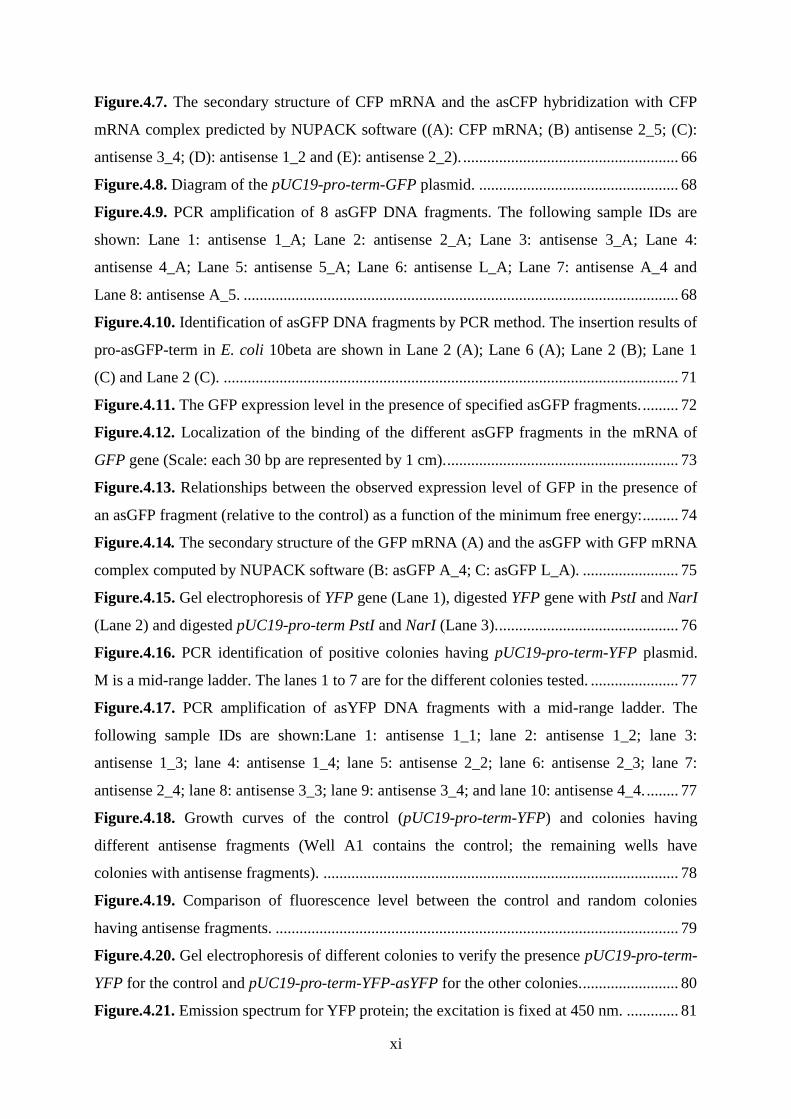
Figure.4.7. The secondary structure of CFP mRNA and the asCFP hybridization with CFP
mRNA complex predicted by NUPACK software ((A): CFP mRNA; (B) antisense 2_5; (C):
antisense 3_4; (D): antisense 1_2 and (E): antisense 2_2). ...................................................... 66
Figure.4.8. Diagram of the pUC19-pro-term-GFP plasmid. .................................................. 68
Figure.4.9. PCR amplification of 8 asGFP DNA fragments. The following sample IDs are
shown: Lane 1: antisense 1_A; Lane 2: antisense 2_A; Lane 3: antisense 3_A; Lane 4:
antisense 4_A; Lane 5: antisense 5_A; Lane 6: antisense L_A; Lane 7: antisense A_4 and
Lane 8: antisense A_5. ............................................................................................................. 68
Figure.4.10. Identification of asGFP DNA fragments by PCR method. The insertion results of
pro-asGFP-term in E. coli 10beta are shown in Lane 2 (A); Lane 6 (A); Lane 2 (B); Lane 1
(C) and Lane 2 (C). .................................................................................................................. 71
Figure.4.11. The GFP expression level in the presence of specified asGFP fragments. ......... 72
Figure.4.12. Localization of the binding of the different asGFP fragments in the mRNA of
GFP gene (Scale: each 30 bp are represented by 1 cm). .......................................................... 73
Figure.4.13. Relationships between the observed expression level of GFP in the presence of
an asGFP fragment (relative to the control) as a function of the minimum free energy: ......... 74
Figure.4.14. The secondary structure of the GFP mRNA (A) and the asGFP with GFP mRNA
complex computed by NUPACK software (B: asGFP A_4; C: asGFP L_A). ........................ 75
Figure.4.15. Gel electrophoresis of YFP gene (Lane 1), digested YFP gene with PstI and NarI
(Lane 2) and digested pUC19-pro-term PstI and NarI (Lane 3). ............................................. 76
Figure.4.16. PCR identification of positive colonies having pUC19-pro-term-YFP plasmid.
M is a mid-range ladder. The lanes 1 to 7 are for the different colonies tested. ...................... 77
Figure.4.17. PCR amplification of asYFP DNA fragments with a mid-range ladder. The
following sample IDs are shown:Lane 1: antisense 1_1; lane 2: antisense 1_2; lane 3:
antisense 1_3; lane 4: antisense 1_4; lane 5: antisense 2_2; lane 6: antisense 2_3; lane 7:
antisense 2_4; lane 8: antisense 3_3; lane 9: antisense 3_4; and lane 10: antisense 4_4. ........ 77
Figure.4.18. Growth curves of the control (pUC19-pro-term-YFP) and colonies having
different antisense fragments (Well A1 contains the control; the remaining wells have
colonies with antisense fragments). ......................................................................................... 78
Figure.4.19. Comparison of fluorescence level between the control and random colonies
having antisense fragments. ..................................................................................................... 79
Figure.4.20. Gel electrophoresis of different colonies to verify the presence pUC19-pro-term-
YFP for the control and pUC19-pro-term-YFP-asYFP for the other colonies. ........................ 80
Figure.4.21. Emission spectrum for YFP protein; the excitation is fixed at 450 nm. ............. 81
xii
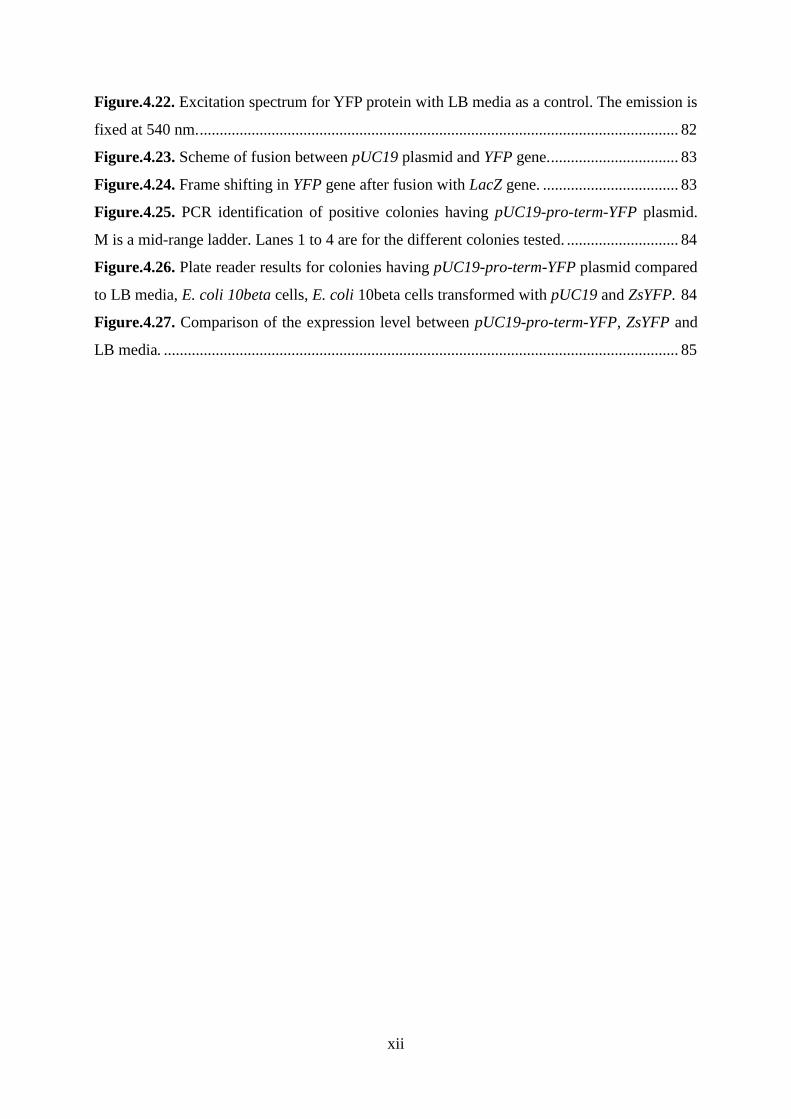
Figure.4.22. Excitation spectrum for YFP protein with LB media as a control. The emission is
fixed at 540 nm. ........................................................................................................................ 82
Figure.4.23. Scheme of fusion between pUC19 plasmid and YFP gene. ................................ 83
Figure.4.24. Frame shifting in YFP gene after fusion with LacZ gene. .................................. 83
Figure.4.25. PCR identification of positive colonies having pUC19-pro-term-YFP plasmid.
M is a mid-range ladder. Lanes 1 to 4 are for the different colonies tested. ............................ 84
Figure.4.26. Plate reader results for colonies having pUC19-pro-term-YFP plasmid compared
to LB media, E. coli 10beta cells, E. coli 10beta cells transformed with pUC19 and ZsYFP. 84
Figure.4.27. Comparison of the expression level between pUC19-pro-term-YFP, ZsYFP and
LB media. ................................................................................................................................. 85
xiii
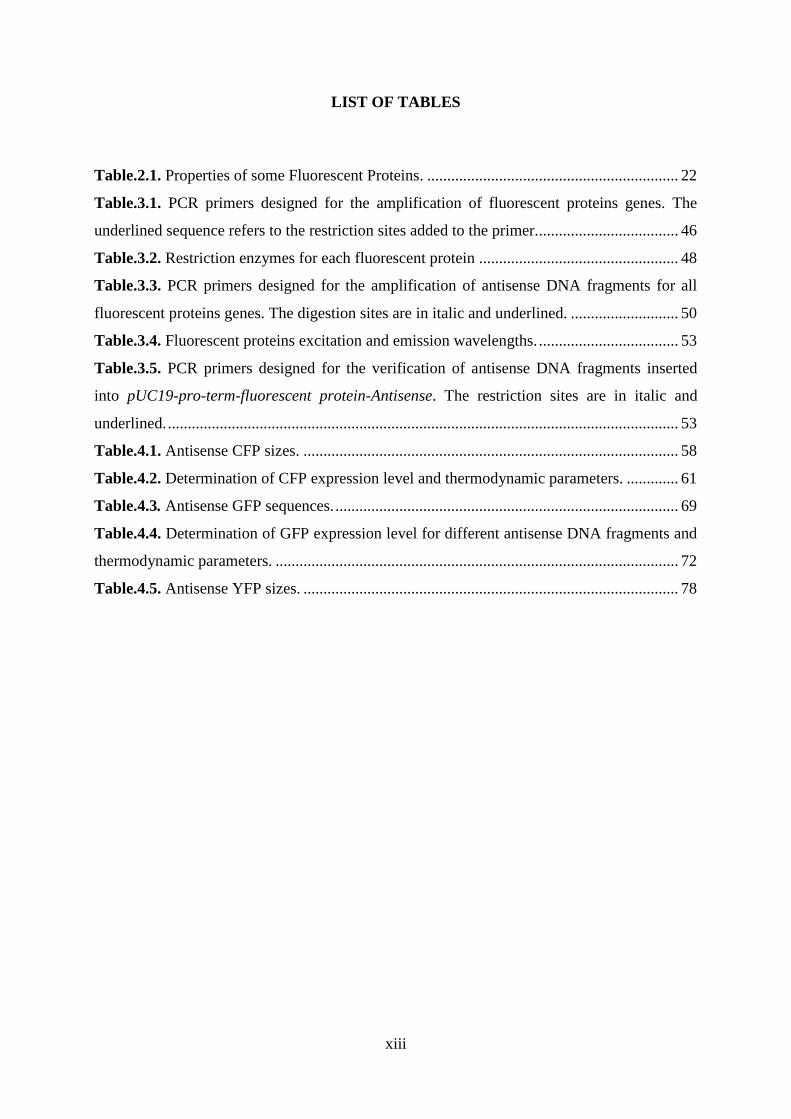
LIST OF TABLES
Table.2.1. Properties of some Fluorescent Proteins. ............................................................... 22
Table.3.1. PCR primers designed for the amplification of fluorescent proteins genes. The
underlined sequence refers to the restriction sites added to the primer.................................... 46
Table.3.2. Restriction enzymes for each fluorescent protein .................................................. 48
Table.3.3. PCR primers designed for the amplification of antisense DNA fragments for all
fluorescent proteins genes. The digestion sites are in italic and underlined. ........................... 50
Table.3.4. Fluorescent proteins excitation and emission wavelengths. ................................... 53
Table.3.5. PCR primers designed for the verification of antisense DNA fragments inserted
into pUC19-pro-term-fluorescent protein-Antisense. The restriction sites are in italic and
underlined. ................................................................................................................................ 53
Table.4.1. Antisense CFP sizes. .............................................................................................. 58
Table.4.2. Determination of CFP expression level and thermodynamic parameters. ............. 61
Table.4.3. Antisense GFP sequences. ...................................................................................... 69
Table.4.4. Determination of GFP expression level for different antisense DNA fragments and
thermodynamic parameters. ..................................................................................................... 72
Table.4.5. Antisense YFP sizes. .............................................................................................. 78
1
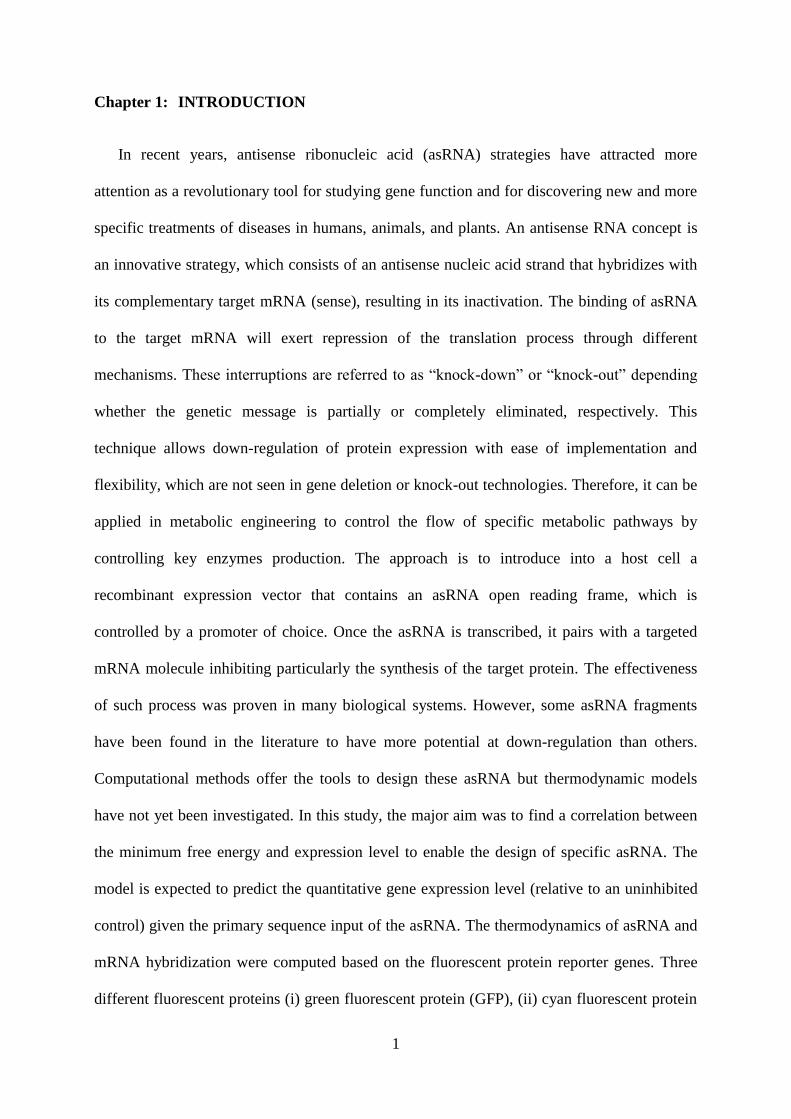
Chapter 1: INTRODUCTION
In recent years, antisense ribonucleic acid (asRNA) strategies have attracted more
attention as a revolutionary tool for studying gene function and for discovering new and more
specific treatments of diseases in humans, animals, and plants. An antisense RNA concept is
an innovative strategy, which consists of an antisense nucleic acid strand that hybridizes with
its complementary target mRNA (sense), resulting in its inactivation. The binding of asRNA
to the target mRNA will exert repression of the translation process through different
mechanisms. These interruptions are referred to as “knock-down” or “knock-out” depending
whether the genetic message is partially or completely eliminated, respectively. This
technique allows down-regulation of protein expression with ease of implementation and
flexibility, which are not seen in gene deletion or knock-out technologies. Therefore, it can be
applied in metabolic engineering to control the flow of specific metabolic pathways by
controlling key enzymes production. The approach is to introduce into a host cell a
recombinant expression vector that contains an asRNA open reading frame, which is
controlled by a promoter of choice. Once the asRNA is transcribed, it pairs with a targeted
mRNA molecule inhibiting particularly the synthesis of the target protein. The effectiveness
of such process was proven in many biological systems. However, some asRNA fragments
have been found in the literature to have more potential at down-regulation than others.
Computational methods offer the tools to design these asRNA but thermodynamic models
have not yet been investigated. In this study, the major aim was to find a correlation between
the minimum free energy and expression level to enable the design of specific asRNA. The
model is expected to predict the quantitative gene expression level (relative to an uninhibited
control) given the primary sequence input of the asRNA. The thermodynamics of asRNA and
mRNA hybridization were computed based on the fluorescent protein reporter genes. Three
different fluorescent proteins (i) green fluorescent protein (GFP), (ii) cyan fluorescent protein
2
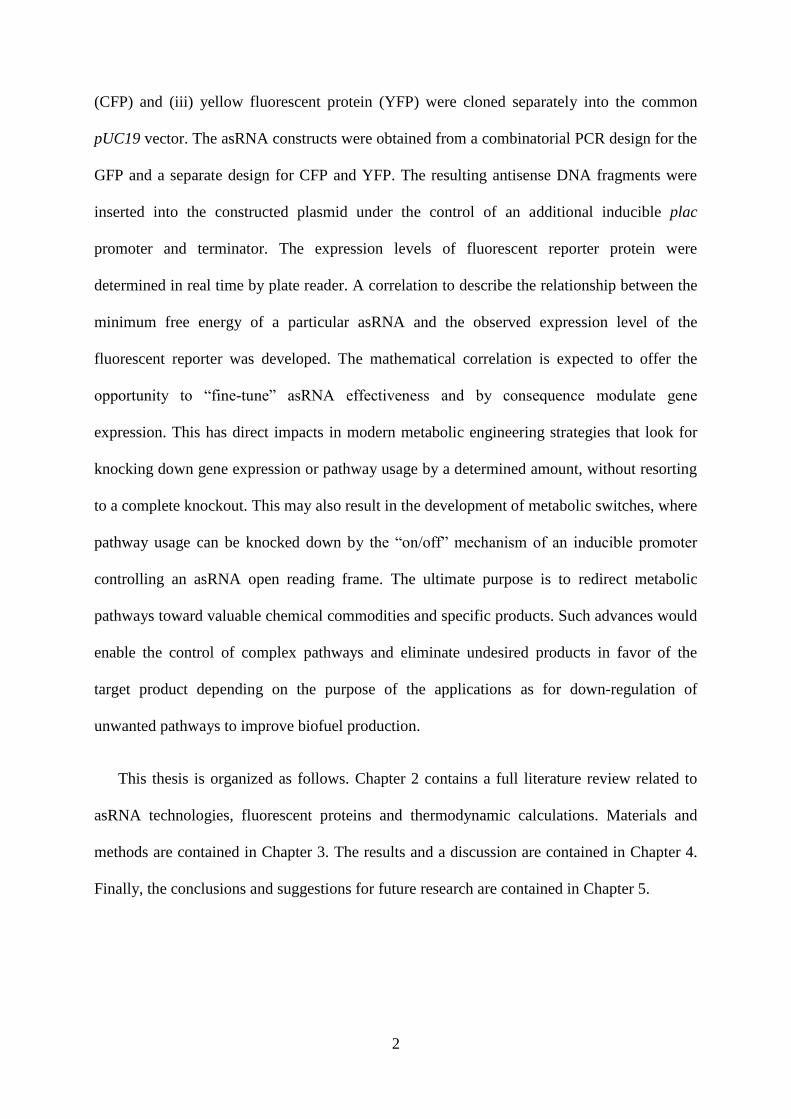
(CFP) and (iii) yellow fluorescent protein (YFP) were cloned separately into the common
pUC19 vector. The asRNA constructs were obtained from a combinatorial PCR design for the
GFP and a separate design for CFP and YFP. The resulting antisense DNA fragments were
inserted into the constructed plasmid under the control of an additional inducible plac
promoter and terminator. The expression levels of fluorescent reporter protein were
determined in real time by plate reader. A correlation to describe the relationship between the
minimum free energy of a particular asRNA and the observed expression level of the
fluorescent reporter was developed. The mathematical correlation is expected to offer the
opportunity to “fine-tune” asRNA effectiveness and by consequence modulate gene
expression. This has direct impacts in modern metabolic engineering strategies that look for
knocking down gene expression or pathway usage by a determined amount, without resorting
to a complete knockout. This may also result in the development of metabolic switches, where
pathway usage can be knocked down by the “on/off” mechanism of an inducible promoter
controlling an asRNA open reading frame. The ultimate purpose is to redirect metabolic
pathways toward valuable chemical commodities and specific products. Such advances would
enable the control of complex pathways and eliminate undesired products in favor of the
target product depending on the purpose of the applications as for down-regulation of
unwanted pathways to improve biofuel production.
This thesis is organized as follows. Chapter 2 contains a full literature review related to
asRNA technologies, fluorescent proteins and thermodynamic calculations. Materials and
methods are contained in Chapter 3. The results and a discussion are contained in Chapter 4.
Finally, the conclusions and suggestions for future research are contained in Chapter 5.
3
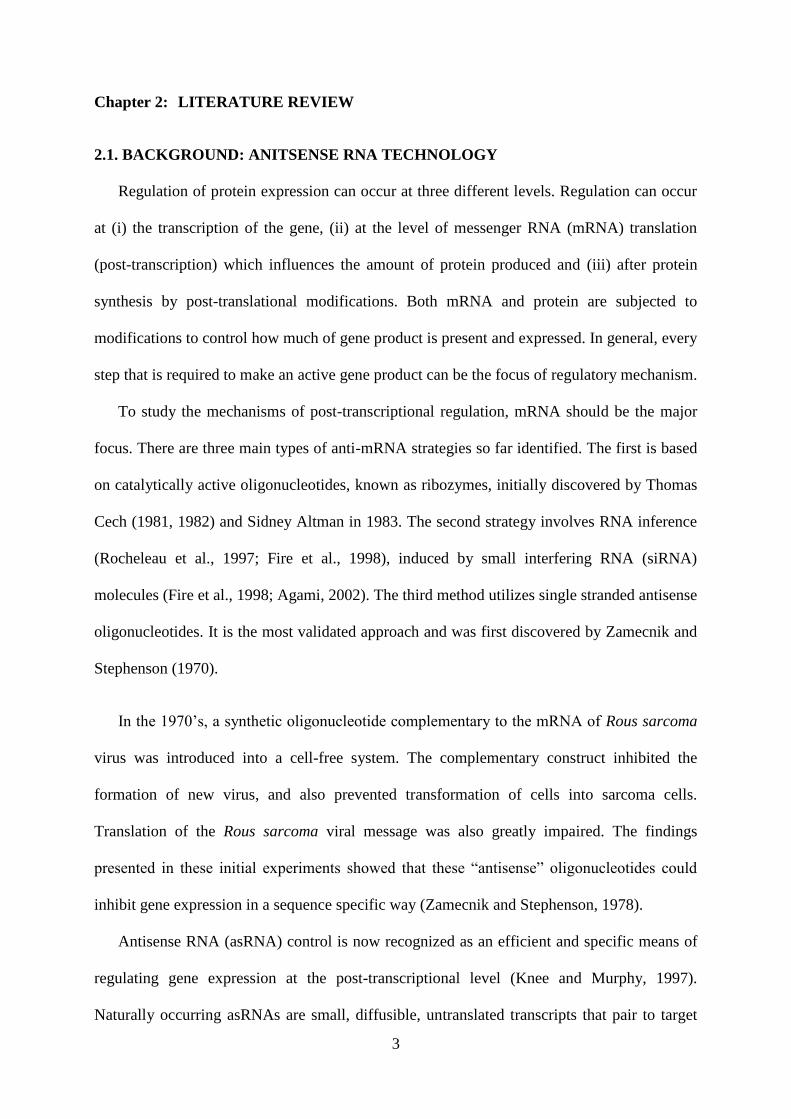
Chapter 2: LITERATURE REVIEW
2.1. BACKGROUND: ANITSENSE RNA TECHNOLOGY
Regulation of protein expression can occur at three different levels. Regulation can occur
at (i) the transcription of the gene, (ii) at the level of messenger RNA (mRNA) translation
(post-transcription) which influences the amount of protein produced and (iii) after protein
synthesis by post-translational modifications. Both mRNA and protein are subjected to
modifications to control how much of gene product is present and expressed. In general, every
step that is required to make an active gene product can be the focus of regulatory mechanism.
To study the mechanisms of post-transcriptional regulation, mRNA should be the major
focus. There are three main types of anti-mRNA strategies so far identified. The first is based
on catalytically active oligonucleotides, known as ribozymes, initially discovered by Thomas
Cech (1981, 1982) and Sidney Altman in 1983. The second strategy involves RNA inference
(Rocheleau et al., 1997; Fire et al., 1998), induced by small interfering RNA (siRNA)
molecules (Fire et al., 1998; Agami, 2002). The third method utilizes single stranded antisense
oligonucleotides. It is the most validated approach and was first discovered by Zamecnik and
Stephenson (1970).
In the 1970’s, a synthetic oligonucleotide complementary to the mRNA of Rous sarcoma
virus was introduced into a cell-free system. The complementary construct inhibited the
formation of new virus, and also prevented transformation of cells into sarcoma cells.
Translation of the Rous sarcoma viral message was also greatly impaired. The findings
presented in these initial experiments showed that these “antisense” oligonucleotides could
inhibit gene expression in a sequence specific way (Zamecnik and Stephenson, 1978).
Antisense RNA (asRNA) control is now recognized as an efficient and specific means of
regulating gene expression at the post-transcriptional level (Knee and Murphy, 1997).
Naturally occurring asRNAs are small, diffusible, untranslated transcripts that pair to target
4
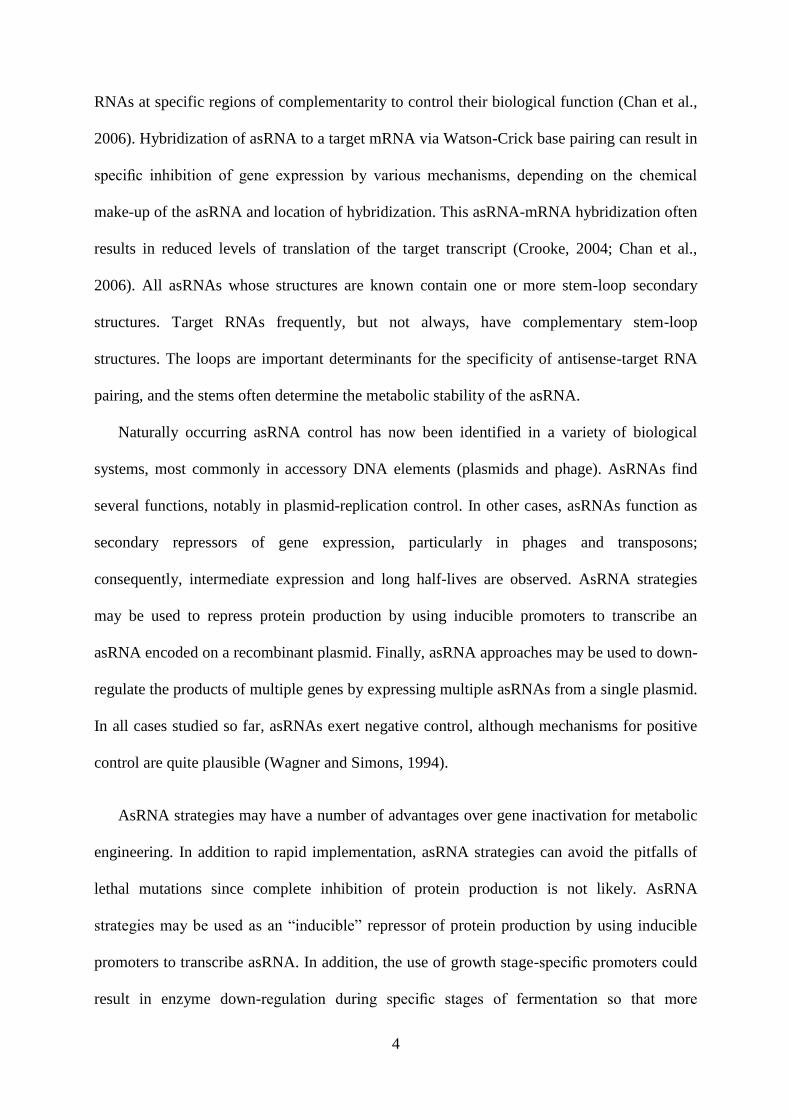
RNAs at specific regions of complementarity to control their biological function (Chan et al.,
2006). Hybridization of asRNA to a target mRNA via Watson-Crick base pairing can result in
specific inhibition of gene expression by various mechanisms, depending on the chemical
make-up of the asRNA and location of hybridization. This asRNA-mRNA hybridization often
results in reduced levels of translation of the target transcript (Crooke, 2004; Chan et al.,
2006). All asRNAs whose structures are known contain one or more stem-loop secondary
structures. Target RNAs frequently, but not always, have complementary stem-loop
structures. The loops are important determinants for the specificity of antisense-target RNA
pairing, and the stems often determine the metabolic stability of the asRNA.
Naturally occurring asRNA control has now been identified in a variety of biological
systems, most commonly in accessory DNA elements (plasmids and phage). AsRNAs find
several functions, notably in plasmid-replication control. In other cases, asRNAs function as
secondary repressors of gene expression, particularly in phages and transposons;
consequently, intermediate expression and long half-lives are observed. AsRNA strategies
may be used to repress protein production by using inducible promoters to transcribe an
asRNA encoded on a recombinant plasmid. Finally, asRNA approaches may be used to down-
regulate the products of multiple genes by expressing multiple asRNAs from a single plasmid.
In all cases studied so far, asRNAs exert negative control, although mechanisms for positive
control are quite plausible (Wagner and Simons, 1994).
AsRNA strategies may have a number of advantages over gene inactivation for metabolic
engineering. In addition to rapid implementation, asRNA strategies can avoid the pitfalls of
lethal mutations since complete inhibition of protein production is not likely. AsRNA
strategies may be used as an “inducible” repressor of protein production by using inducible
promoters to transcribe asRNA. In addition, the use of growth stage-specific promoters could
result in enzyme down-regulation during specific stages of fermentation so that more
5
advanced metabolic engineering objectives could be implemented. Finally, asRNAs may be
used to down-regulate the products of multiple genes by expressing multiple asRNAs from a
single plasmid. In contrast to efforts directed toward determining the mechanism of asRNA
action or the reduction in the amount of a single gene product (Desai and Papoutsakis, 1999),
asRNA strategies are of interest in this research to accommodate a metabolic engineering
strategy called “flux balance analysis with flux ratios (FBrAtio)” developed by McAnulty et
al. (2012). In this approach, metabolism must be re-routed by “knocking-down” target gene
expression using asRNA. Knocking-down gene expression calls for reducing expression of a
targeted enzyme by a specified amount (e.g., 75%). Gene knockout strategies cannot
accommodate this strategy because they effectively reduce gene expression by 100% (or 0%
if ineffective). AsRNA can be “fine-tuned” for effectiveness leading to targeted gene
expression knock-downs.
2.1.1. Naturally occurring asRNAs (Endogenous asRNAs)
2.1.1.1. Prokaryotes and viruses
AsRNA was originally found to occur naturally in prokaryotic organisms (Itoh and
Tomizawa, 1980; Tomizawa et al., 1981), where it has been shown to be involved in several
biological activities (Wagner and Simons, 1994). These include plasmid replication (Itoh and
Tomizawa, 1980), cell division (Bouche and Bouche, 1989), transposon control (Simons and
Kleckner, 1983), plasmid conjugation (Lee et al., 1992), and bacteriophage development
(Krinke and Wulff, 1987). In all cases, asRNAs down-regulate the expression of sense
transcripts at the post-transcriptional level (Wagner and Simons, 1994). In most cases, the
antisense and target RNAs are transcribed in opposite directions from the same loci and, thus,
the RNAs are completely complementary. Those asRNAs are known as cis-acting antisense.
Large amounts of cis-encoded antisense transcripts have been recently discovered in a variety
of bacterial species including Helicobacter pylori (Sharma et al., 2010), Escherichia coli
6
(Mendoza-Vargas et al., 2009), Vibrio cholerae (Liu et al., 2009) and Listeria monocytogenes
(Toledo-Arana et al., 2009). In some cases, however, the antisense and target genes are
encoded at different loci and the complementarity is only partial. These are the trans-acting
antisense. AsRNAs have been also identified as acting elements in viruses such as Epstein
Barr virus, herpes virus (Prang et al., 1995), human papillomavirus (HPV) (Higgins et al.,
1991), and polyoma virus (Liu et al., 1994).
2.1.1.2. Eukaryotes
Naturally occurring asRNA in eukaryotes are involved in different biological activities
including pre-mRNA processing; this system allows introns to be spliced out of a message to
obtain the proper amino acids sequence (Adams et al., 1996). Other activities work also
through an antisense principle such as RNA editing, rRNA modification and developmental
regulation (Wagner and Flärdh, 2002).
2.1.1.3. Double-stranded RNA
The presence of highly repetitive sequences within the genome provides the potential for
transcripts from different strands to yield RNAs that might anneal. This explains the presence
of double stranded RNA (dsRNA) in eukaryotic cells and mainly within the nuclei. The
identification of factors which employ dsRNA as a substrate emphasizes the role of asRNA in
the regulation of gene expression (Kumar and Carmichael, 1998). This may be important
since short RNA duplexes are abundant in the nucleus due to the highly complex secondary
structures of many different RNAs.
2.1.2. Synthetic asRNA
Inside the cell unmodified oligonucleotides (ON) are degraded rapidly by nucleases; thus
chemical modifications have been implemented in attempt to increase the resistance of the
7
antisense oligonucleotides to enzymatic degradation. The nucleobase, the sugar and the
phosphate backbone are the most common targets for these chemical modifications.
The development of chemically modified ON is a complex process, because, in addition to
nuclease resistance, stable duplexes must be obtained. These modifications may affect the
skeleton and/or sugars (Luyten et al., 1998; Herdewijn, 2000). The importance of
hybridization has been demonstrated by the correlation of antisense activity observed in vitro
and in vivo, with the hybridization affinity expressed as the melting temperature (Tm)
(Altmann et al., 1996; Zellweger et al., 2001). Changes in sugars (Sproat et al., 1989;
Kawasaki et al., 1993), changes in the orientation of the sugar (Gagnor et al., 1989; Morvan et
al., 1991) and modifications in skeleton (Crooke, 2004) influence the ability of ON to activate
RNase-H. Therefore, the antisense oligonucleotides can be grouped into two categories: (i)
“cutters” which can activate RNase-H and (ii) “blockers” that do not activate RNase-H. These
are discussed in detail in the following section (Chapter 2: Part 2.1.3).
2.1.2.1. First generation of chemically modified asRNA
ONs with a phosphorothioate skeleton are the first generation of antisense oligonucleotide
(Figure.2.1). The oxygen atoms of the phosphodiester backbone are replaced by sulfur atoms
(Eckstein, 2000). These ON confer greater resistance to nucleases than ON with
phosphodiesters skeleton and promote RNase-H mediated cleavage of target mRNA.
However, they have lower binding affinity for target mRNA due to a decrease in the melting
temperature (Chan et al., 2006). Phosphorothioate modified asRNAs have also been reported
to trigger unspecific effects by interactions with cell surface and intracellular proteins
(Lavigne et al., 2002). Despite these disadvantages, phosphorothioate modification is the most
widely performed chemical modification of asRNAs for loss of function studies in vitro and in
vivo for gene target identification and validation.
8
2.1.2.2. Second generation of chemically modified asRNA
The second generation of antisense oligonucleotide consists mainly of 2'-O-methyl (2'O-
Me) and 2'-O-methoxyethyl (2’-MOE) oligonucleotide (Crooke, 2004). These modifications
replace the sugar in position 2’ by 2'-alkyl at the ribose (Figure.2.1). The skeleton can be of
type phosphodiester or phosphorothioate. These asRNAs offer greater resistance to nucleases
and higher affinity for the target mRNA. However, they do not support RNase-H mediated
cleavage of mRNA, which lower their effectiveness (Altmann et al., 1996). Nevertheless, this
property allows the second generation of antisense to have applications in models of splicing
correction or alternative exon skipping in vitro and in vivo. Some examples are the application
of antisense-mediated exon skipping approach for Duchenne muscular dystrophy mutations
(Aartsma-Rus et al., 2009) and the utilization of antisense oligonucleotides to modulate splice
site in Hutchinson-Gilford progeria syndrome (HGPS), a rare pediatric progeroid syndrome
(Fong et al., 2009).
2.1.2.3. Third generation of chemically modified asRNA
The third generation of antisense oligonucleotides involves more complex chemical
modification of the furanose ring of the nucleotide. The most studied oligonucleotides include
the peptide nucleic acid (PNA), locked nucleic acid (LNA) and phosphoroamidate
morpholino oligomer (PMO) (Figure.2.1). These modified ONs do not activate RNase-H.
(i) Peptide Nucleic Acid (PNA)
The PNA forms stable complexes with their complementary DNA or RNA strands. This
high affinity results from the neutrality and flexibility of its artificial skeleton. They have a
high resistance to enzymatic degradation in biological environments (Egholm et al., 1993).
PNA qualities make it a well-qualified candidate in antisense strategies. However, this ON
has difficulties to diffuse into the cells spontaneously (Chiarantini et al., 2005) and requires a
vector.
9
(ii) The Locked Nucleic Acids (LNA)
The locked nucleic acids were described for the first time in 1998 (Singh et al., 1998). The
LNA have a strong affinity for RNA due to their constraint structure. LNA oligomers on both
ends provide highly efficient mRNA cleavage, in addition to high ON potency, target
accessibility and nuclease resistance (Kurreck et al., 2002). Among all members of the LNA
molecular family, α-L-LNA has been shown to demonstrate the highest efficacy in mRNA
knockdown in both in vitro and in vivo studies, making it one of the most promising LNA
antisense agents (Petersen and Wengel, 2003; Simoes-Wust et al., 2004).
(iii) Phosphoroamidate Morpholino Oligomer (PMO)
PMO represents a non-charged antisense oligonucleotide agent in which the ribose sugar
is replaced by a six-membered morpholino ring and the phosphodiester bond is substituted by
a phosphoroamidate linkage (Amantana and Iversen, 2005). PMOs do not elicit RNase-H
activity (Summerton, 1999). Instead, the mechanism by which they alter gene expression
involves binding to the target RNA sequence and sterically blocking ribosomal assembly or
intron-exon splice junction sites, leading to translational arrest or splice-altering effects
(Ghosh et al., 2000; Sazani and Kole, 2003). The antisense activity of several PMOs in animal
models have been reviewed, some of which are presently in various stages of human clinical
trials (Crooke, 2001; Amantana et al., 2005).
10
Figure.2.1. Chemical modifications of antisense oligonucleotides.
2.1.2.4. Naturally occurring antisense versus chemically modified antisense
Major differences between exogenous and endogenous asRNA strategies lie in: (i)
delivery of the inhibitor; (ii) presumed mode of binding to the target RNA; (iii) details of the
inhibitory reaction (Engdahl et al., 1997). Synthetic antisense are generally applied to the
extracellular matrix and are taken up; whereas, asRNAs are most often transcribed
intracellularly, after transient or stable introduction of an appropriate antisense gene (Nellen
and Lichtenstein, 1993; Wagner, 1994).
Chemically designed antisense strands are designed to contain a low degree of secondary
structure in order to permit efficient hybridization, while endogenous asRNAs are often larger
and structurally more complex. Synthetic oligonuceotides approaches often rely on
endogenous RNase-H activity to inactivate the target RNA. In contrast, endogenous asRNA-
mediated silencing can occur by duplex-dependent blockage of a ribosome binding site (RBS)
within an mRNA, duplex-dependent facilitated mRNA decay, asRNA-induced premature
11
termination of transcription and cleavage of the mRNA by an asRNA with ribozyme activity
(Engdahl et al., 1997).
2.1.3. The antisense strategy
AsRNAs inhibit mRNA function in several ways, including modulation of splicing and
inhibition of protein translation by disruption of ribosome assembly (Crooke, 2004).
However, the most important mechanism seems to be the utilization of endogenous RNase-H
enzymes by the antisense. RNase-H recognizes the mRNA-oligonucleotide duplex and
cleaves the mRNA strand, leaving the antisense fragment intact (Kurreck, 2003; Shi and
Hoekstra, 2004; Chan et al., 2006). The released fragment can then bind to other target RNA
(Figure.2.2). Based on their strategy of action, two classes of antisense RNA can be
distinguished: (i) RNase-H dependent oligonucleotides and (ii) steric-blocker oligonucleotides
(Dias and Stein, 2002).
Figure.2.2. Antisense RNA different strategies.
12
2.1.3.1. RNase-H-dependent oligonucleotides
RNase-H is a ubiquitous enzyme that hydrolyzes the RNA strand of an RNA/DNA
duplex. This enzyme will recognize selectively the hybrid and will degrade the mRNA at the
site of complex formation (Seitz, 1999). The released antisense goes back to the catalytic
cycle for further action (Figure.2.3). The oligonucleotides that activate RNase-H are
potentially capable of destroying many RNA transcripts in their lifetime, which suggests that
lower concentrations of these oligonucleotides may be sufficient to significantly inhibit gene
expression (Zamecnik and Stephenson, 1978). The RNase-H-dependent oligonucleotides
effectively reach 80-95% of the protein and target mRNA expression. This category of
antisense inhibits protein expression when targeted to any region of mRNA (Dias and Stein,
2002). The importance of the RNase-H-dependent antisense has been investigated and
demonstrated for several systems including wheat germ extract (Cazenave et al., 1993), rabbit
reticulocyte lysate (Minshull and Hunt, 1986), and Myotonic Dystrophy type 1 (Lee et al.,
2012; Wheeler et al., 2012). However, the mechanism of degradation of mRNA is not well
elucidated.
Figure.2.3. RNase-H dependent Antisense mechanism.
13
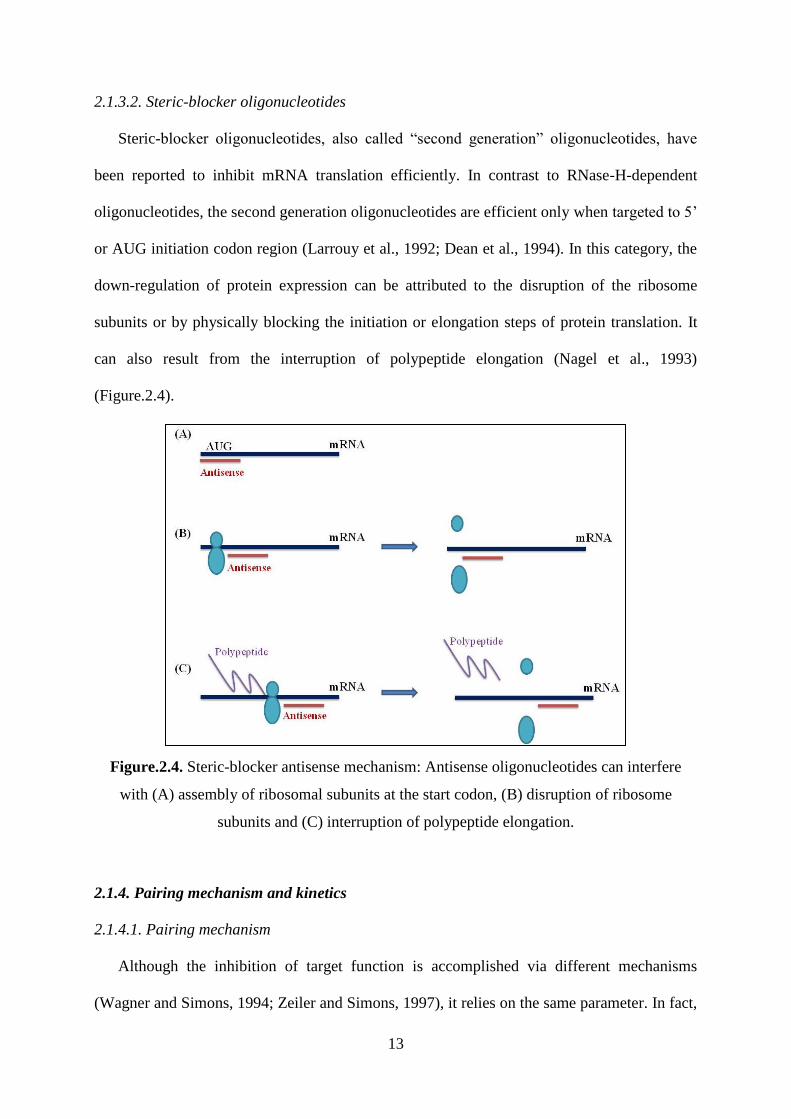
2.1.3.2. Steric-blocker oligonucleotides
Steric-blocker oligonucleotides, also called “second generation” oligonucleotides, have
been reported to inhibit mRNA translation efficiently. In contrast to RNase-H-dependent
oligonucleotides, the second generation oligonucleotides are efficient only when targeted to 5’
or AUG initiation codon region (Larrouy et al., 1992; Dean et al., 1994). In this category, the
down-regulation of protein expression can be attributed to the disruption of the ribosome
subunits or by physically blocking the initiation or elongation steps of protein translation. It
can also result from the interruption of polypeptide elongation (Nagel et al., 1993)
(Figure.2.4).
Figure.2.4. Steric-blocker antisense mechanism: Antisense oligonucleotides can interfere
with (A) assembly of ribosomal subunits at the start codon, (B) disruption of ribosome
subunits and (C) interruption of polypeptide elongation.
2.1.4. Pairing mechanism and kinetics
2.1.4.1. Pairing mechanism
Although the inhibition of target function is accomplished via different mechanisms
(Wagner and Simons, 1994; Zeiler and Simons, 1997), it relies on the same parameter. In fact,
14
all mechanisms depend closely on rapid binding of asRNA to its target mRNA regardless of
the pairing scheme. In all antisense control systems, the initial recognition element is
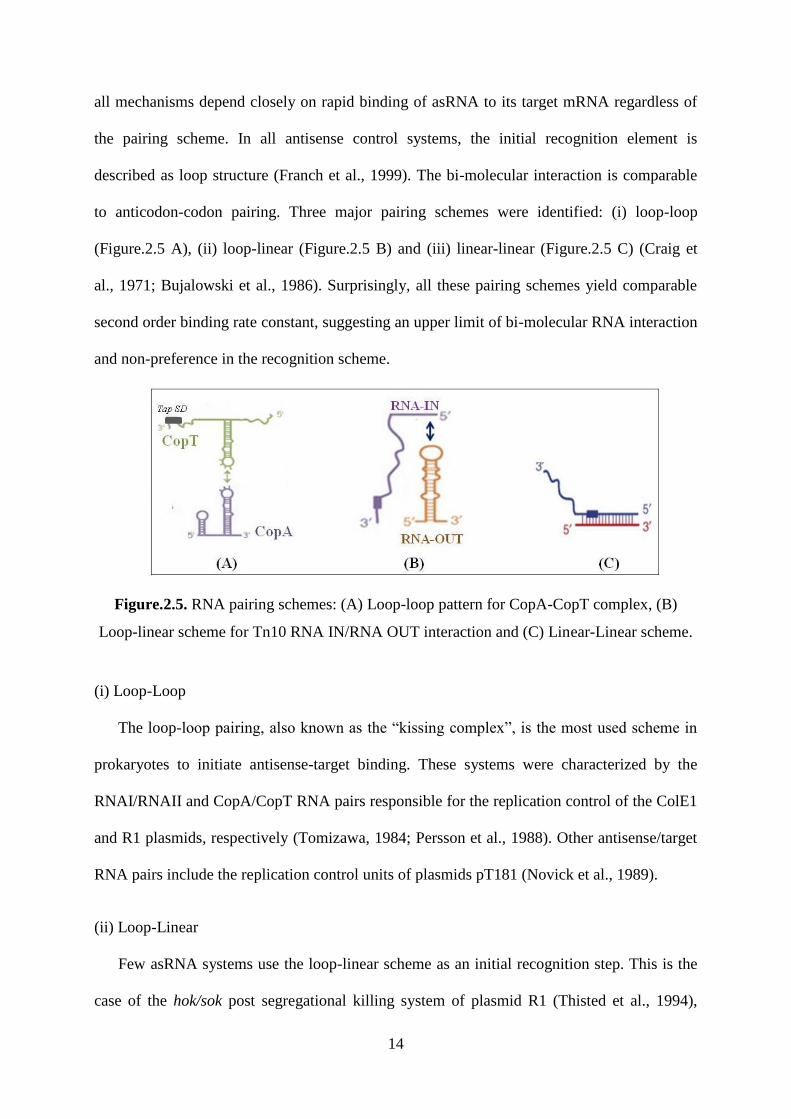
described as loop structure (Franch et al., 1999). The bi-molecular interaction is comparable
to anticodon-codon pairing. Three major pairing schemes were identified: (i) loop-loop
(Figure.2.5 A), (ii) loop-linear (Figure.2.5 B) and (iii) linear-linear (Figure.2.5 C) (Craig et
al., 1971; Bujalowski et al., 1986). Surprisingly, all these pairing schemes yield comparable
second order binding rate constant, suggesting an upper limit of bi-molecular RNA interaction
and non-preference in the recognition scheme.
Figure.2.5. RNA pairing schemes: (A) Loop-loop pattern for CopA-CopT complex, (B)
Loop-linear scheme for Tn10 RNA IN/RNA OUT interaction and (C) Linear-Linear scheme.
(i) Loop-Loop
The loop-loop pairing, also known as the “kissing complex”, is the most used scheme in
prokaryotes to initiate antisense-target binding. These systems were characterized by the
RNAI/RNAII and CopA/CopT RNA pairs responsible for the replication control of the ColE1
and R1 plasmids, respectively (Tomizawa, 1984; Persson et al., 1988). Other antisense/target
RNA pairs include the replication control units of plasmids pT181 (Novick et al., 1989).
(ii) Loop-Linear
Few asRNA systems use the loop-linear scheme as an initial recognition step. This is the
case of the hok/sok post segregational killing system of plasmid R1 (Thisted et al., 1994),
15
RNA-IN/RNA-OUT of Tn10, controlling transposition frequency (Kittle et al., 1989). A
comparison of the antisense target loops in the family of hok mRNAs shows the presence of
an invariant sequence motif. In fact, this conserved motif has been identified in the majority
of recognition loops of endogenous asRNA regulated gene systems (Franch et al., 1999).
2.1.4.2. Pairing kinetics
The binding rate is determined by the formation of an early intermediate, thus the kinetic
scheme is approximated to Briggs-Haldane kinetics (Fersht, 1977). Binding kinetics of this
kind appears ideal for the purpose of plasmid copy number control, because binding rates
increase linearly with substrate concentration. This observation implies that proper regulation
is possible over a wide range of plasmid copy numbers. Negative regulators that follow
Michaelis-Menten kinetics would eventually reach plateau levels where binding rates and,
therefore, inhibition, cannot be increased. Consequently, control would be lost at high copy
numbers (Wagner and Simons, 1994).
2.1.5. Factors affecting asRNA efficiency
The design of an effective antisense remains largely an empirical process. In practice,
many candidates are tested for their ability to down-regulate target gene expression, and then
the most effective ones are selected (Milligan et al., 1993; Monia et al., 1996). Techniques
such as gel-shift or oligonucleotide array assays are also used for the rapid screening of
several candidates in vitro (Stull et al., 1996; Milner et al., 1997). Computational predictions
have as well been applied to identify effective target sites on mRNA (Ding and Lawrence,
2001; Sipes and Freier, 2008). However, once inside the cell, several parameters intervene
and can affect the efficiency and should be taken into consideration. These factors include (i)
asRNA thermodynamic stability, (ii) antisense dose and position effects, (iii) target
accessibility, (iv) RNA binding proteins and (v) cellular metabolism (Denhardt, 1992).
16
2.1.5.1. AsRNA stability
The stability of asRNA transcript is primarily affected by its sequence and it is partly
determined by RNA-binding proteins (Pontius, 1993; Sczakiel, 1997). Antisense
oligonucleotides are designed to be single stranded and are prone to adopt secondary and
tertiary structure in vivo (Wyatt et al., 1994). Advances in research allow the prediction and
pre-visualization of RNA secondary structure (Mathews, 2006; Wiese et al., 2008). For
example, mfold and RnaPredict provide a computational efficient method for determining the
lowest free energy structure and a set of diverse suboptimal structures. These computational
methods improved the screening of potent asRNA fragments (Chan et al., 2006).
2.1.5.2. Antisense concentration
Generally, there is a correlation between intracellular dose of antisense and target gene
inhibition. But, commonly, an excess of antisense over target RNA is more efficient at
inhibiting protein synthesis (Harland and Weintraub, 1985; Melton, 1985). This surplus in
antisense ratio is accomplished by using strong promoters for antisense genes.
2.1.5.3. Target accessibility
Target secondary structure and accessibility has been suggested by numerous studies
based on computational modeling (Luo and Chang, 2004; Heale et al., 2005; Schubert et al.,
2005). These studies were supported by compelling data based on experimental evaluation for
target accessibility (Bohula et al., 2003; Overhoff et al., 2005; Westerhout et al., 2005).
The secondary and tertiary structures of mRNA have been proven to influence the
hybridization efficiency and potency of antisense oligonucleotide in vivo (Vickers et al.,
2000). In fact, RNA structure produces asymmetrical binding sites that result in very
divergent affinity constants depending on the position of oligonucleotide in that structure.
Consequently, the optimal length of oligonucleotide needed to achieve maximal affinity is
affected (Crooke, 2000).
17
2.1.5.4. RNA binding proteins
RNA structure, annealing dynamics, and stability are dependent on RNA-binding proteins
(Pontius, 1993; Sczakiel, 1997). Several proteins (RNA helicases, RNase III) bind to mRNA
strand and may affect antisense efficiency (Fierro-Monti and Mathews, 2000).
On the other hand, many cellular proteins have been identified to facilitate the
hybridization mechanism (Bertrand and Rossi., 1994). Examples of these proteins are (i) the
ribonucleoprotein (RNP) A1 (Munroe and Dong, 1992), (ii) the tumour suppressor protein
p53 (Wu et al., 1995; Nedbal et al., 1997), and (iii) the yeast initiation factor Tif III (Altmann
et al., 1995).
2.1.5.5. Cellular metabolism
Several parameters influence asRNA based technology in vivo. Detailed studies by Chen
et al., (1997) illustrate how these parameters can affect the antisense efficacy. In these
experiments, an E. coli model system was used. They observed that when the rate of
transcription is increased, the inhibition of target gene is absent. In contrast, when the
translation is slowed, the target gene expression is decreased efficiently.
2.1.6. Applications of asRNA in metabolic engineering
Although the mechanism of asRNA action is not completely understood, asRNA
strategies have been used to down-regulate levels of targeted gene products in prokaryotes
(Engdahl et al., 1997; Kernodle et al., 1997). Antisense approaches have been successfully
used to selectively reduce or eliminate the expression of mRNA targets and to study gene
function (Patzel et al., 1999). Recently, more research efforts have been directed to the use of
antisense techniques to engineer alterations in cellular pathways, including metabolic pathway
regulation by altering crucial gene expression and metabolic fluxes. Generally, a particular
product is of interest and its production requires the redirection of the cellular metabolism.
18
This can be done by gene over-expression and using pathway knockout, but with asRNA
strategies only partial shut-down of the pathway is involved.
AsRNA strategies were employed to partially block biosynthesis of two major acetate
pathway enzymes, phosphotransacetylase (PTA) and acetate kinase (ACK). This strategy was
successful in limiting acetate accumulation and reducing its negative effects to increase the
productivity of recombinant proteins in E. coli cells (Kim and Cha, 2003; Bakhtiari et al.,
2010).
Some applications of asRNA technology in Clostridium acetobutylicum included the
improvement of the production of commodity chemicals. In fact, asRNA fragments were
designed with complementarities to two enzymes involved in the conversion of key products
to undesirable chemicals. This method lowered their activities by 85 to 90% resulting in the
augmentation of butanol (desired) and acetone (undesired) titers by +35 and -50%,
respectively (Desai et al., 1999).
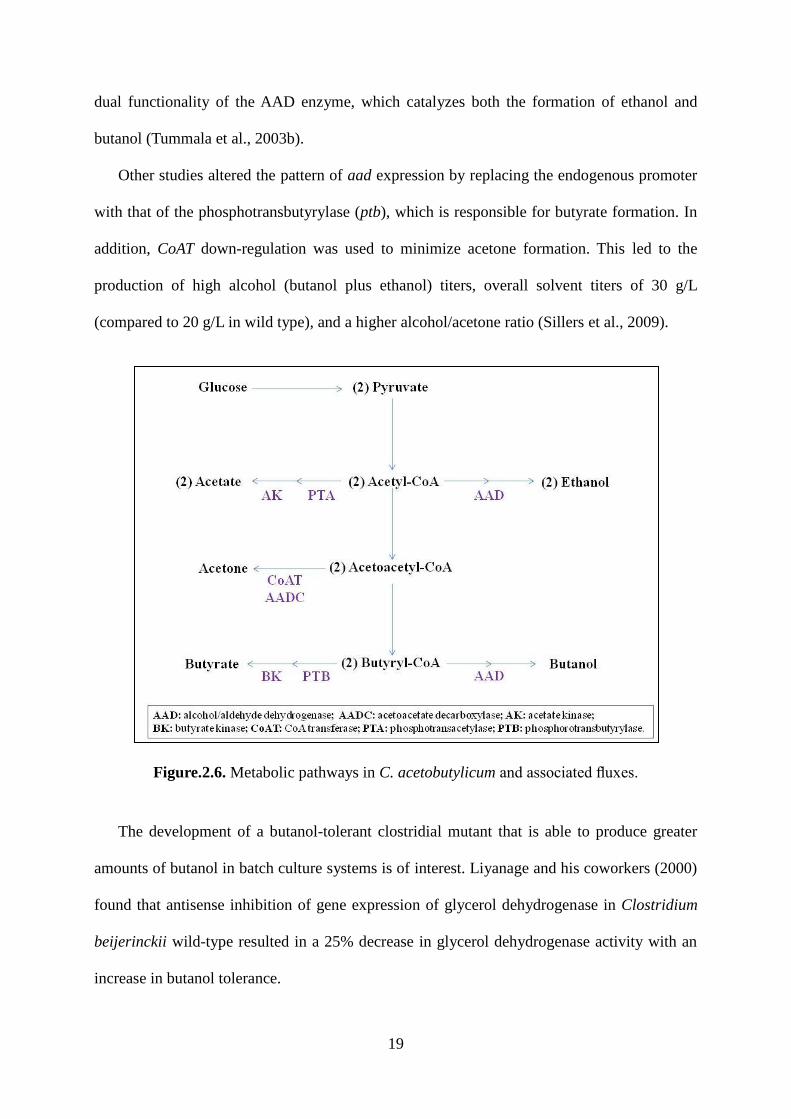
Another application combined both asRNA approaches and gene over-expression
technologies to effectively alter the metabolism of wild-type Clostridium acetobutylicum
(Figure.2.6). This application offered an opportunity to re-establish the acetone, butanol, and
ethanol fermentation as an economically viable process. The study has shown that asRNA
based down-regulation of CoA transferase (CoAT, the first enzyme in the acetone formation
pathway) resulted in an increase on butanol to acetone selectivity with an overall reduction in
butanol titers and yields (Tummala et al., 2003a). Further metabolic engineering enabled the
re-establishment of butanol titer levels while maintaining low acetone production. This result
was obtained by combining the ctfB (the second CoAT gene) asRNA with the over-expression
of the alcohol-aldehyde dehydrogenase (aad, encoding the bi-functional aldehyde-alcohol
dehydrogenase (AAD)). Significantly, this metabolically engineered strain produced the
highest ethanol level ever in C. acetobutylicum. The high ethanol production was due to the
19
dual functionality of the AAD enzyme, which catalyzes both the formation of ethanol and
butanol (Tummala et al., 2003b).
Other studies altered the pattern of aad expression by replacing the endogenous promoter
with that of the phosphotransbutyrylase (ptb), which is responsible for butyrate formation. In
addition, CoAT down-regulation was used to minimize acetone formation. This led to the
production of high alcohol (butanol plus ethanol) titers, overall solvent titers of 30 g/L
(compared to 20 g/L in wild type), and a higher alcohol/acetone ratio (Sillers et al., 2009).
Figure.2.6. Metabolic pathways in C. acetobutylicum and associated fluxes.
The development of a butanol-tolerant clostridial mutant that is able to produce greater
amounts of butanol in batch culture systems is of interest. Liyanage and his coworkers (2000)
found that antisense inhibition of gene expression of glycerol dehydrogenase in Clostridium
beijerinckii wild-type resulted in a 25% decrease in glycerol dehydrogenase activity with an
increase in butanol tolerance.
20
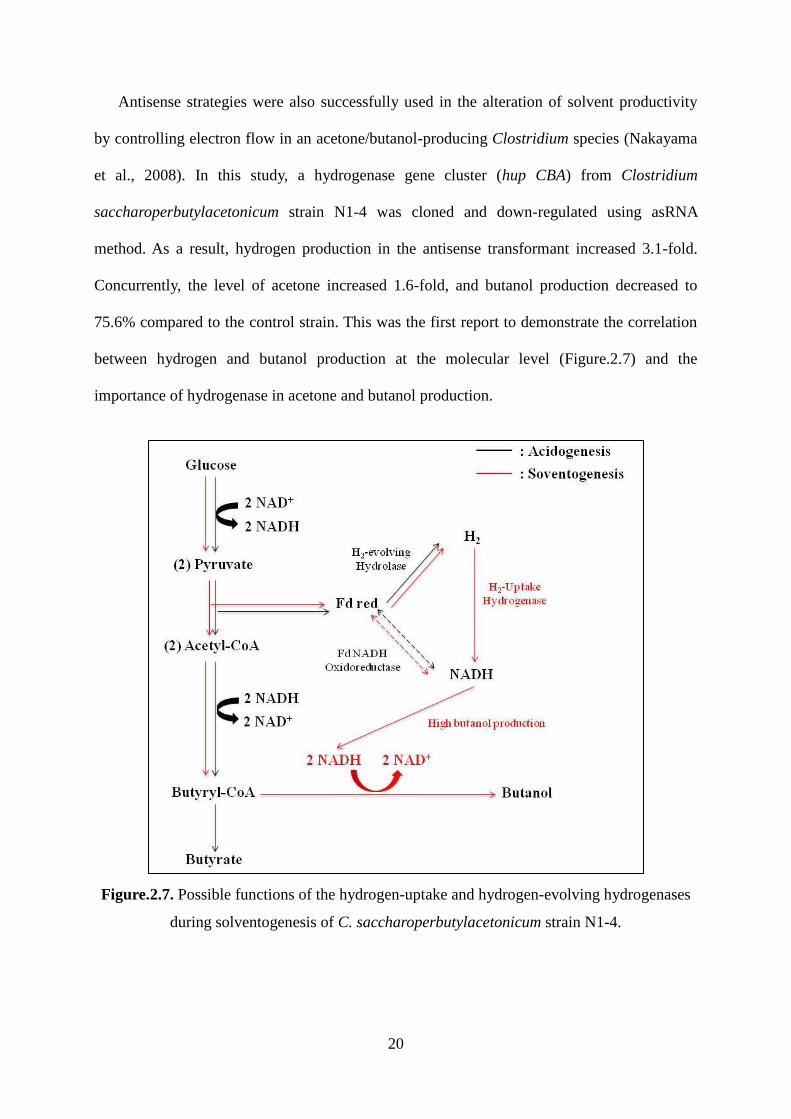
Antisense strategies were also successfully used in the alteration of solvent productivity
by controlling electron flow in an acetone/butanol-producing Clostridium species (Nakayama
et al., 2008). In this study, a hydrogenase gene cluster (hup CBA) from Clostridium
saccharoperbutylacetonicum strain N1-4 was cloned and down-regulated using asRNA
method. As a result, hydrogen production in the antisense transformant increased 3.1-fold.
Concurrently, the level of acetone increased 1.6-fold, and butanol production decreased to
75.6% compared to the control strain. This was the first report to demonstrate the correlation
between hydrogen and butanol production at the molecular level (Figure.2.7) and the
importance of hydrogenase in acetone and butanol production.
Figure.2.7. Possible functions of the hydrogen-uptake and hydrogen-evolving hydrogenases
during solventogenesis of C. saccharoperbutylacetonicum strain N1-4.
21
2.2. FLUORESCENT PROTEINS AS REPORTERS
2.2.1. Generalities
Fluorescent proteins have become an essential tool in the production and analysis of
transgenic organisms in basic and applied biology. These fluorescent proteins are obtained
from reef coral (Matz et al., 1999). They confer a valuable, non-invasive approach for
investigating biological systems in living cells and tissues. Reef coral fluorescent proteins are
used as “reporters” that visualize, track and quantify several cellular mechanisms including
protein synthesis and turnover in vivo. These fluorescent proteins exist in different colors
ranging from green to cyan and red (among many others), and each fluorescent protein is
characterized by its unique spectra. Thus, it can be combined with other proteins and used for
simultaneous detection of multiple events in the same cell or mixed cell population. In
addition, they do not require any additional substrates or cofactors for their fluorescence
which makes them convenient to use in the laboratory.
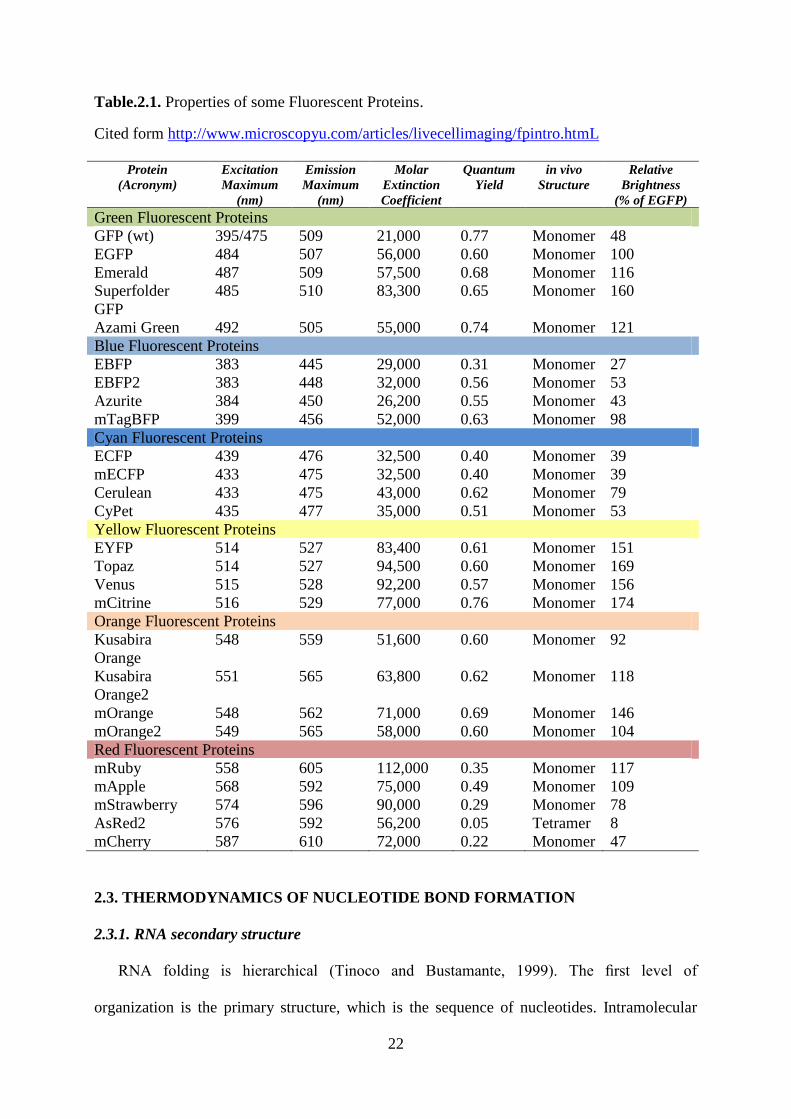
2.2.2. Properties of reef coral fluorescent proteins
A large number of fluorescent proteins, their differently colored mutants and fusion
proteins have been identified and isolated, resulting in a remarkable expansion of the color
palette in recent years (Shaner et al., 2007). The table below summarizes some properties of
the commonly used fluorescent proteins.
22
Table.2.1. Properties of some Fluorescent Proteins.
Cited form http://www.microscopyu.com/articles/livecellimaging/fpintro.htmL
Protein
(Acronym)
Excitation
Maximum
(nm)
Emission
Maximum
(nm)
Molar
Extinction
Coefficient
Quantum
Yield
in vivo
Structure
Relative
Brightness
(% of EGFP)
Green Fluorescent Proteins
GFP (wt) 395/475 509 21,000 0.77 Monomer 48
EGFP 484 507 56,000 0.60 Monomer 100
Emerald 487 509 57,500 0.68 Monomer 116
Superfolder
GFP
485 510 83,300 0.65 Monomer 160
Azami Green 492 505 55,000 0.74 Monomer 121
Blue Fluorescent Proteins
EBFP 383 445 29,000 0.31 Monomer 27
EBFP2 383 448 32,000 0.56 Monomer 53
Azurite 384 450 26,200 0.55 Monomer 43
mTagBFP 399 456 52,000 0.63 Monomer 98
Cyan Fluorescent Proteins
ECFP 439 476 32,500 0.40 Monomer 39
mECFP 433 475 32,500 0.40 Monomer 39
Cerulean 433 475 43,000 0.62 Monomer 79
CyPet 435 477 35,000 0.51 Monomer 53
Yellow Fluorescent Proteins
EYFP 514 527 83,400 0.61 Monomer 151
Topaz 514 527 94,500 0.60 Monomer 169
Venus 515 528 92,200 0.57 Monomer 156
mCitrine 516 529 77,000 0.76 Monomer 174
Orange Fluorescent Proteins
Kusabira
Orange
548 559 51,600 0.60 Monomer 92
Kusabira
Orange2
551 565 63,800 0.62 Monomer 118
mOrange 548 562 71,000 0.69 Monomer 146
mOrange2 549 565 58,000 0.60 Monomer 104
Red Fluorescent Proteins
mRuby 558 605 112,000 0.35 Monomer 117
mApple 568 592 75,000 0.49 Monomer 109
mStrawberry 574 596 90,000 0.29 Monomer 78
AsRed2 576 592 56,200 0.05 Tetramer 8
mCherry 587 610 72,000 0.22 Monomer 47
2.3. THERMODYNAMICS OF NUCLEOTIDE BOND FORMATION
2.3.1. RNA secondary structure
RNA folding is hierarchical (Tinoco and Bustamante, 1999). The first level of
organization is the primary structure, which is the sequence of nucleotides. Intramolecular
23
base pairs can be formed between these nucleotides, folding the sequence onto itself; this is
the secondary structure. Tertiary structure is the three-dimensional arrangement of atoms and
the quaternary structure is the interaction with other molecules, which are often either proteins
or other RNA strands (Mathews, 2006).
RNA folding is driven by secondary structural features. Therefore, the determination of
RNA tertiary structure and function goes necessary through the elucidation of RNA secondary
structure (Ding and Lawrence, 2003). Experimental determination of RNA structure remains
difficult (Fürtig and al., 2003). Hence, research efforts have been directed to computational
methods. Currently, there are three approaches for RNA secondary structure prediction. The
first method is the comparative sequence analysis. This method infers base-pairs by
determining canonical pairs that are common among multiple homologous sequences (Pace et
al., 1999). Comparative analysis, however, requires multiple sequences, can be time-
consuming, and requires significant insight. The second method consists of algorithms adding
substructures to an initially unfolded sequence: pseudoknotted structures (Shapiro and Wu,
1997; Bindewald et al., 2010). The third and most popular prediction approach is the
Minimum Free Energy (MFE) method with computer algorithm based on dynamic
programming (Gardner and Giegerich, 2004).
2.3.2. NUPACK thermodynamic software
The NUPACK thermodynamic software package (http://www.nupack.org) arises among a
multitude of free available software packages for RNA secondary structure prediction. The
package currently enables thermodynamic analysis of dilute solutions of interacting nucleic
acid strands and sequence design for systems involving one or more species of interacting
strands (Zadeh et al., 2011).
24
The software allows the user to input the components and conditions of the solution: (i)
temperature (or range of temperatures for melts), (ii) number of strand species, (iii) maximum
complex size, (iv) strand sequences, and (v) strand concentrations (for calculations with
maximum complex size greater than one). After compilation, the NUPACK software outputs
(i) the melt profile plot, which describes the fraction of unpaired bases at equilibrium as a
function of temperature. (ii) The ensemble pair fractions plot that depicts equilibrium base-
pairing information for the dilute solution, taking into account the equilibrium concentration
and base-pairing properties of each ordered complex, and (iii) the equilibrium concentration
histogram which represents the equilibrium concentrations of the ordered complexes (Zadeh
et al., 2011).
The basic features of the NUPACK software are: (i) calculation of the partition function
and minimum free energy of secondary structure for un-pseudoknotted complexes of arbitrary
numbers of interacting RNA or DNA strands. MFE is calculated using the nearest-neighbor
empirical parameters for RNA in 1M Na+ (Serra and Turner, 1995; Mathews et al., 1999) or
for DNA in user-specified Na+ and Mg
2+ concentrations (SantaLucia, 1998; SantaLucia and
Hicks, 2004; Koehler and Peyret, 2005). (ii) Calculation of the equilibrium concentrations for
arbitrary species of complexes in a dilute solution (Dirks et al., 2007). (iii) Sequence design
for one or more strands intended to adopt an un-pseudoknotted target secondary structure at
equilibrium (Zadeh et al., 2011).
2.3.2.1. Minimum free energy
The stability of RNA secondary structure is quantified by the free energy change “ΔG”. In
fact, ΔG measures the difference in free energy between the folded and unfolded state of the
RNA molecule. A folded RNA has negative free energy change, and the lower it is, the more
stable the structure is (Layton and Bundschuh, 2005). The base pairs are usually favorable to
stability and contribute a negative free energy change, while the loops are usually
25
destabilizing since they have positive energy values (Mohsen et al., 2010). ΔG represents the
work done by a system at constant temperature and pressure when undergoing a reversible
process. It is a function of enthalpy change “ΔH”, entropy change “ΔS” and temperature T (in
Kelvin), according to the Gibbs function (Gibbs, 1873):
ΔH (kcal/mol) is the enthalpy change for RNA folding. The formation of RNA stems
contributes the most to the enthalpy value through hydrogen bonding and stacking
interactions. This reaction is qualified as exothermic; therefore, ΔH value is negative. ΔS
(kcal/mol K) is the entropy change. It measures the change in the degree of disorder and
represents also the quantity of dispersal of energy per temperature, or by the change in the
number of microstates. While folding, RNA undergoes a number of structural transitions
(microstates). The folding process limits the microstates of the loop nucleotides as compared
to the unfolded strand. Hence, the loops contribute to the entropy more than to the enthalpy.
(Tinoco and Bustamante, 1999).
There is significant evidence that RNA secondary structures usually adopt their MFE
configuration in their natural environments (Tinoco and Bustamante, 1999). The most popular
model for the predicting of MFE is the nearest-neighbor model (Tinoco et al., 1973). This
model assumes that the stability of a given base pair depends on the identity of its adjacent
base pair. Thermodynamic parameters for all possible double-helical nearest neighbors of
Watson-Crick and G-U pairs have been determined (Freier et al., 1986a; He et al., 1991).
Values for the free energy change at 37°C ( ), enthalpy change ( ), and entropy change
( ) are predicted from the parameters for the three nearest-neighbor interactions and the
initiation contribution (Hickey and Turner, 1985; Freier et al., 1986a; Freier et al., 1986b;
Turner et al., 1988; He et al., 1991).The enthalpy and entropy changes are considered to be
26
temperature independent and allow prediction of the free energy of formation at any
temperature:
Where , and are the standard change in free energy, the standard change in
enthalpy and the standard change in entropy, respectively.
For a given sequence, the free energy of secondary structure “s” is estimated as the
summation of the empirically determined free energies of the constituent loops (Tinoco et al.,
1971; SantaLucia, 1998; Mathews et al., 1999).
For perfectly base-paired regions, the nearest neighbor model can predict within 10% the
free energy change for duplex formation, (Serra and Turner, 1995).
Where is the equilibrium constant for duplex formation at 37°C and R is the gas constant.
This allows the calculation of the equilibrium constant for the reaction: .
2.3.2.2. Binding percentage
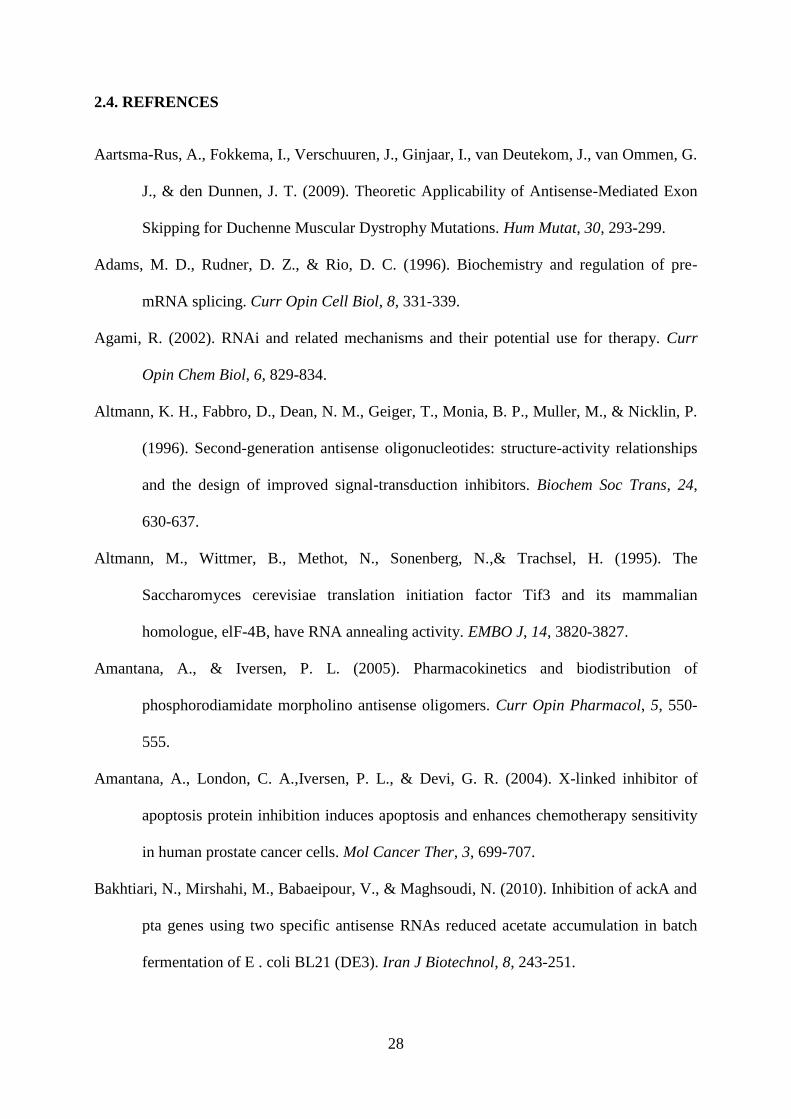
NUPACK calculates equilibrium concentration of ordered complexes as described in
Dirks et al., 2007. For example, considering a dilute solution at equilibrium containing two
strands A and B that can interact and form an ordered duplex AB. These relations are given:
27
where for each ordered complex i, xi is the mole fraction, [i] is the concentration (e.g. in units
of molar), ΔGi is the free energy as reported by NUPACK, and ρH2O (≈ 55.14 mol/L at 37.0
°C) is the concentration of water.
Given the initial concentrations of the two strand species ( , the concentration
of AB is determined by finding the appropriate root of:
The value of equilibrium concentrations are used as the binding percentage for the
analysis of data.
28
2.4. REFRENCES
Aartsma-Rus, A., Fokkema, I., Verschuuren, J., Ginjaar, I., van Deutekom, J., van Ommen, G.
J., & den Dunnen, J. T. (2009). Theoretic Applicability of Antisense-Mediated Exon
Skipping for Duchenne Muscular Dystrophy Mutations. Hum Mutat, 30, 293-299.
Adams, M. D., Rudner, D. Z., & Rio, D. C. (1996). Biochemistry and regulation of pre-
mRNA splicing. Curr Opin Cell Biol, 8, 331-339.
Agami, R. (2002). RNAi and related mechanisms and their potential use for therapy. Curr
Opin Chem Biol, 6, 829-834.
Altmann, K. H., Fabbro, D., Dean, N. M., Geiger, T., Monia, B. P., Muller, M., & Nicklin, P.
(1996). Second-generation antisense oligonucleotides: structure-activity relationships
and the design of improved signal-transduction inhibitors. Biochem Soc Trans, 24,
630-637.
Altmann, M., Wittmer, B., Methot, N., Sonenberg, N.,& Trachsel, H. (1995). The
Saccharomyces cerevisiae translation initiation factor Tif3 and its mammalian
homologue, elF-4B, have RNA annealing activity. EMBO J, 14, 3820-3827.
Amantana, A., & Iversen, P. L. (2005). Pharmacokinetics and biodistribution of
phosphorodiamidate morpholino antisense oligomers. Curr Opin Pharmacol, 5, 550-
555.
Amantana, A., London, C. A.,Iversen, P. L., & Devi, G. R. (2004). X-linked inhibitor of
apoptosis protein inhibition induces apoptosis and enhances chemotherapy sensitivity
in human prostate cancer cells. Mol Cancer Ther, 3, 699-707.
Bakhtiari, N., Mirshahi, M., Babaeipour, V., & Maghsoudi, N. (2010). Inhibition of ackA and
pta genes using two specific antisense RNAs reduced acetate accumulation in batch
fermentation of E . coli BL21 (DE3). Iran J Biotechnol, 8, 243-251.
29
Bertrand, E., & Rossi, J. (1994). Facilitation of hammerhead ribozyme catalysis by the
nucleocapsid protein of HIV-1 and the heterogeneous nuclear ribonucleoprotein A1.
EMBO J, 13, 2904-2912.
Bindewald, E., Kluth, T., & Shapiro, B. A. (2010). CyloFold: secondary structure prediction
including pseudoknots. Nucleic Acids Res, 38, W368-W372.
Bohula, E. A., Salisbury, A. J., Sohail, M., Playford, M. P., Riedemann, J., Southern, E. M., &
Macaulay, V. M. (2003). The efficacy of small interfering RNAs targeted to the type 1
insulin-like growth factor receptor (IGF1R) is influenced by secondary structure in the
IGF1R transcript. J Mol Biol, 278, 15991-15997.
Bouche, F., & Bouche, J. (1989). Genetic evidence that DicF, a second division inhibitor
encoded by the Escherichia coli dicB operon, is probably RNA. Mol Microbiol, 3,
991-994.
Bujalowski, W., Jung, M., McLaughlin, L. W., & Pörschke, D. (1986). Codon-induced
association of the isolated anticodon loop of tRNA phe. Biochem, 25, 6372-6378.
Cazenave, C., Frank, P., & Busen, W. (1993). Characterization of ribonuclease H activities
present in two cell-free protein synthesizing systems, the wheat germ extract and the
rabbit reticulocyte lysate. Biochimie, 75, 113-122.
Cech, T. R., Zaug, A. J., & Grabowski, P. J. (1981). In vitro splicing of the ribosomal RNA
precursor of tetrahymena: Involvement of a guanosine nucleotide in the excision of the
intervening sequence. Cell, 27, 487-496.
Chan, J. H., Shuhui, L., & Wong, W. S. (2006). Antisense oligonucleotides: from design to
therapeutic application. Clin Exp Pharmacol, 33, 533-540.
Chen, H., Ferbeyre, G., & Cedergren, R. (1997). Efficient hammerhead ribozyme and
antisense RNA targeting in a slow ribosome Escherichia coli mutant. Nat Biotech, 15,
432-435.
30
Chiarantini, L., Cerasi, A., Fraternale, A., Millo, E., Benatti, U., Sparnacci, K., Laus, L.,
Ballestri, M. & Tondelli, L. (2005). Comparison of novel delivery systems for
antisense peptide nucleic acids. J Control Release, 109, 24-36.
Craig, M. E., Crothers, D. M., & Doty, P. (1971). Relaxation kinetics of dimer formation by
self-complementary oligonucleotides. J Mol Biol, 62, 383-401.
Crooke, S. T. (2000). Progress in Antisense Technology: The End of the Beginning. 313, 3-
45.
Crooke,S. T. (2001). Antisense Drug Techcology- Principles, Strategies and Applications. In
I. Book News (Ed.), (Vol. 25): Scitech Book News.
Crooke, S. T. (2004). Progress in antisense technology. Annu Rev Med, 55, 61-95.
Denhardt, D. (1992). Mechanism of action of antisense RNA. Sometime inhibition of
transcription, processing, transport, or translation. Ann NY Acad Sci, 660, 70-76.
Desai, R. P., & Papoutsakis, E. T. (1999). Antisense RNA Strategies for Metabolic
Engineering of Clostridium acetobutylicum. Appl Microbiol Biotechnol, 65, 936-945.
Ding, Y., & Lawrence, C. E. (2001). Statistical prediction of single-stranded regions in RNA
secondary structure and application to predicting effective antisense target sites and
beyond. Nucleic Acids Res, 29, 1034-1046.
Ding, Y., & Lawrence, C. E. (2003). A statistical sampling algorithm for RNA secondary
structure prediction. Nucleic Acids Res, 31, 7280-7301.
Dirks, R. M., Bois, J. S., Schaeffer, J. M., Winfree, E., & Pierce, N.A. (2007).
Thermodynamic analysis of interacting nucleic acid strands. SIAM Rev, 49, 65-88.
Eckstein, F. (2000). Phosphorothioate oligodeoxynucleotides: what is their origin and what is
unique about them? Antisense Nucleic Acid Drug Dev, 10, 117-121.
Egholm, M., Buchardt, O., Christensen, L., Behrens, C., Freier, S. M., Driver, D. A., Berg, R.
H., Kim, S. K., Norden, B. & Nielsen, P. E. (1993). PNA hybridizes to complementary
31
oligonucleotides obeying the Watson-Crick hydrogen-bonding rules. Nature, 365,
566-568.
Engdahl, H. M., Hjalt, T. A. H., & Wagner, E. G. H. (1997). A two unit antisense RNA
cassette test system for silencing of target genes. Nucleic Acids Res, 25, 3218-3227.
Fersht, A. (1977). Enzymes Structure and Mechanism (W. H. Freeman Ed.).
Fierro-Monti, I., & Mathews, M. (2000). Proteins binding to duplexed RNA: one motif,
multiple functions. Trends Biochem Sci, 25, 241-246.
Fire, A., Xu, S., Montgomery, M. K., Kostas, S. A., Driver, S. E., & Mello, C. C. (1998).
Potent and specific genetic interference by double-stranded RNA in Caenorhabditis
elegans. Nature, 391, 806-811.
Fong, L. G.,Vickers,T. A., Farber,E. A., Choi, C., Yun, U. J., Hu, Y., Yang, S. H., Coffinier,
C., Lee, R., Yin, L., Davies,B. S. J., Andres, D. A., Spielmann, H. P., Bennett, C. F.
&Young, S. G. (2009). Activating the synthesis of progerin, the mutant prelamin A in
Hutchinson-Gilford progeria syndrome, with antisense oligonucleotides. Hum Mol
Gen, 18, 2462-2471.
Franch, T., Petersen, M., Wagner, E. G. H., Jacobsen, J. P., & Gerdes, K. (1999). Antisense
RNA Regulation in Prokaryotes: Rapid RNA/RNA Interaction Facilitated by a
General U-turn Loop Structure. J Mol Biol, 294, 1115-1125.
Freier, S. M., Kierzek, R., Jaeger, J. A., Sugimoto, N., Caruthers, M. H., Neilson, T. &
Turner, D. H. (1986a). Improved free-energy parameters for predictions of RNA
duplex stability. Proc Natl Acad Sci, 83, 9373-9377
Freier, S. M., Kierzek, R., Caruthers, M., Neilson, T., and Turner, D. (1986b). Free energy
contributions of G.U and other terminal mismatches to helix stability. Biochem, 25,
3209–3213.
32
Fürtig, B., Richter, C., Wöhnert, J., & Schwalbe, H. (2003). NMR spectroscopy of RNA.
Chembiochem, 4, 936-962.
Gagnor, C., Rayner, B., Leonetti, J. P., Imbach, J. L., & Lebleu, B. (1989). Alpha-DNA.IX:
Parallel annealing of alpha-anomeric oligodeoxyribonucleotides to natural mRNA is
required for interference in RNase H mediated hydrolysis and reverse transcription.
Nucleic Acids Res, 17, 5107-5114.
Gardner, P. P., & Giegerich, R. (2004). A comprehensive comparison of comparative RNA
structure prediction approaches. BMC Bioinformatics, 5, 140.
Ghosh, C., Stein, D., Weller, D., & Iversen, P. (2000). Evaluation of antisense mechanisms of
action. Methods Enzymol, 313, 135-143.
Gibbs, J. W. (1873). A Method of Geometrical Representation of the Thermodynamic
Properties of Substances by Means of Surfaces. Transactions of the Connecticut
Academy of Arts and Sciences, 2, 382-404.
Guerrier-Takada, C., Gardiner, K., Marsh, T., Pace, N., & Altman, S. (1983). The RNA
moiety of ribonuclease P is the catalytic subunit of the enzyme. Cell, 35, 849-857.
Harland, R., & Weintraub, H. (1985). Translation of mRNA injected into Xenopus oocytes is
specifically inhibited by antisense RNA. J. Cell Biol, 101, 1094-1099.
He, L., Kierzek, R., SantaLucia, J. Jr., Walter, A.E., & Turner, D.H. (1991). Nearest-neighbor
parameters for G.cntdot.U mismatches: 5'GU3'/3'UG5' is destabilizing in the contexts
CGUG/GUGC, UGUA/AUGU, and AGUU/UUGA but stabilizing in GGUC/CUGG.
Biochem, 30, 11124-11132.
Heale, B. S., Soifer, H. S., Bowers, C., & Rossi, J. J. (2005). siRNA target site secondary
structure predictions using local stable substructures. Nucleic Acids Res, 33, e30.
Herdewijn, P. (2000). Heterocyclic modifications of oligonucleotides and antisense
technology. Antisense Nucleic Acid Drug Dev, 10, 297-310.
33
Hickey, D. R., & Turner, D. H. (1985). Effects of terminal mismatches on RNA stability:
thermodynamics of duplex formation for ACCGGGp, ACCGGAp, and ACCGGCp.
Biochem, 24, 3987-3991.
Higgins, G., Uzelin, D., Phillips, G., & Burrell, C. (1991). Presence and distribution of human
papillomavirus sense and antisense RNA transcripts in genital cancers. J Gen Virol,
72, 885-895.
Itoh, T., & Tomizawa, J. (1980). Formation of an RNA primer for initiation of replication of
ColE1 DNA by ribonuclease H. Proc Natl Acad Sci, 77, 2450-2454.
Kawasaki, A. M., Casper, M. D., Freier, S. M., A., Lesnik E., Zounes, M. C., Cummins, L. L.,
Gonzalez, C. & Cook, P. D. (1993). Uniformly modified 2'-deoxy-2'-fluoro
phosphorothioate oligonucleotides as nuclease-resistant antisense compounds with
high affinity and specificity for RNA targets. J Med Chem, 36, 831-841.
Kernodle, D. S., Voladri, R. K., Menzies, B. E., Hager, C. C., & Edwards, K. M. (1997).
Expression of an antisense hla fragment in Staphylococcus aureus reduces alpha-toxin
production in vitro and attenuates lethal activity in a murine model. Infect Immun, 65,
179-184.
Kim, J. Y. H., & Cha, H. J. (2003). Down-Regulation of Acetate Pathway Through Antisense
Strategy in Escherichia coli: Improved Foreign Protein Production. Biotechnol
Bioeng, 83, 841-853.
Kittle, J. D., Simons, R. W., Lee, J., & Kleckner, N. (1989). Insertion sequence IS10 anti-
sense pairing initiates by an interaction between the 50 end of the target RNA and a
loop in the anti-sense RNA. J Mol Biol, 210, 561-572.
Koehler, R.T., & Peyret, N. (2005). Thermodynamic properties of DNA sequences:
characteristic values for the human genome. Bioinformatics, 21, 3333-3339.
34
Krinke, L., & Wulff, D. (1987). OOP RNA, produced from multicopy plasmids, inhibits λ cII
gene expression though an RNAse III-dependent mechanism. Genes Devel, 1, 1005-
1013.
Kruger, K., Grabowski, P. J., Zaug, A. J., Sands, J., Gottschling, D. E., & Cech, T. R. (1982).
Self-splicing RNA: Autoexcision and autocyclization of the ribosomal RNA
intervening sequence of tetrahymena. Cell, 31(1), 147-157.
Kumar, M., & Carmichael, G. (1998). Antisense RNA: function and fate of duplex RNA in
cells of higher eukaryotes. Microbiol Mol Biol Rev, 62, 1415-1434.
Kurreck, J. (2003). Antisense technologies: improvement through novel chemical
modifications. Eur J Biochem, 270, 1628-1644.
Kurreck, J., Wyszko, E., Gillen, C., & Erdmann, V. A. (2002). Design of antisense
oligonucleotides stabilized by locked nucleic acid. Nucleic Acids Res, 30, 1911-1918.
Larrouy, B., Blonski, C., Boiziau, C., Stuer, M., Moreau, S., Shire, D., & Toulme, J. J. (1992).
RNase H-mediated inhibition of translation by antisense oligodeoxyribonucleotides:
use of backbone modification to improve specificity. Gene, 121, 189-194.
Lavigne, C., Yelle, J., Sauve, G., & Thierry, A. R. (2002). Is antisense an appropriate
nomenclature or design for oligodeoxynucleotides aimed at the inhibition of HIV-1
replication? AAPS Pharm Sci, 4, E9.
Layton, D. M., & Bundschuh, R. (2005). A statistical analysis of rna folding algorithms
through thermodynamic parameter perturbation. Nucleic Acids Res, 33,. 519-524.
Lee, J. E., Bennett, C. F., & Cooper, T. A. (2012). RNase H-mediated degradation of toxic
RNA in myotonic dystrophy type 1. Proc Natl Acad Sci USA, 109, 4221 - 4226.
Lee, S., Frost, L., & Paranchych, W. (1992). FinOP repression of the F plasmid involves
extension of the half-life of FinP antisense RNA by FinO. Mol Gen Genet, 235, 131-
139.
35
Liu, J. M., Livny, J., Lawrence, M. S., Kimball, M. D., Waldor, M. K., & Camilli, A. (2009).
Experimental discovery of sRNAs in Vibrio cholerae by direct cloning, 5S/tRNA
depletion and parallel sequencing. Nucleic Acids Res, 37, e46.
Liu, Z., Batt, D. B., & Carmichael, G. G. (1994). Targeted nuclear antisense RNA mimics
natural antisense-induced degradation of polyoma virus early RNA. Proc Natl Acad
Sci USA, 91, 4258-4262.
Liyanage, H., Young, M., & Kashket, E. R. (2000). Butanol tolerance of Clostridium
beijerinckii NCIMB 8052 associated with down-regulation of gldA by antisense RNA.
J Mol Microbiol Biotechnol, 2, 87-93.
Luo, K.Q., & Chang, D.C. (2004). The gene-silencing efficiency of siRNA is strongly
dependent on the local structure of mRNA at the targeted region. Biochem Biophys
Res, 318, 303-310.
Luyten, G. P., van der Spek, C. W., Brand, I., Sintnicolaas, K., de Waard-Siebinga, I., Jager,
M. J., de Jong, P. T., Schrier, P.T., & Luider, T. M. (1998). Expression of MAGE,
gp100 and tyrosinase genes in uveal melanoma cell lines. Melanoma Res, 8, 11-16.
Mathews, D. H. (2006). Revolutions in RNA Secondary Structure Prediction. J Mol Biol, 359,
526-532.
Mathews, D. H., Sabina, J., Zuker, M., & Turner, D.H. (1999). Expanded sequence
dependence of thermodynamic parameters improves prediction of RNA secondary
structure. J Mol Biol, 288, 911-940.
Matz, M. V., Fradkov, A. F., Labas, Y. A., Savitsky, A. P. , Zaraisky, A. G., Markelov, M. L.,
& A, Lukyanov S. (1999). Fluorescent proteins from nonbioluminescent Anthozoa
species. Nature Biotech, 17, 969-973.
36
McAnulty, M. .J., Yen, J. Y., Freedman, B. G., & Senger, R. S. (2012). Genome-scale
modeling using flux ratio constraints to enable metabolic engineering of clostridial
metabolism in silico. BMC Systems Biology, 6, 42.
Melton, D. (1985) Injected anti-sense RNAs specifically block messenger RNA translation in
vivo. Proc Natl Acad Sci, 82, 144-148.
Mendoza-Vargas, A., Olvera, L., Olvera, M., Grande, R., Vega-Alvarado, L., Taboada, B.,
Jimenez-Jacinto,V., Salgado, H., Juárez, K., Contreras-Moreira, B., Huerta, A. M.,
Collado-Vides, J., & Morett, E. (2009). Genome-wide identification of transcription
start sites, promoters and transcription factor binding sites in E. coli. PLoS ONE, 4,
e7526.
Milligan, J. F., Matteucci, M. D., & Martin, J. C. (1993). Current concepts in antisense drug
design. J Med Chem, 36, 1923-1937.
Milner, N., Mir, K. U., & Southern, E. M. (1997). Selecting effective antisense reagents on
combinatorial oligonucleotide arrays. Nat Biotechnol, 15, 537-541.
Minshull, J., & Hunt, T. (1986). The use of single-stranded DNA and RNase H to promote
quantitative ’hybrid arrest of translation’ of mRNA/DNA hybrids in reticulocyte lysate
cell-free translations. Nucleic Acids Res, 14, 6433-6451.
Mohsen, A. M., Khader, A. T., Ramachandram, D. & Ghallab, A. (2010). Predicting the
minimum free energy RNA Secondary Structures using Harmony Search Algorithm.
Int. J. Biol. Life Sci, 6, 157-163.
Monia, B. P., Johnston, J. F., Geiger, T., Muller, M., & Fabbro, D. (1996). Antitumor activity
of a phosphorothioate antisense oligo-deoxynucleotide targeted against C-raf kinase.
Nat Med, 2, 668- 675.
Morvan, F., Rayner, B., & Imbach, J. L. (1991). Alpha-oligonucleotides: a unique class of
modified chimeric nucleic acids. Anticancer Drug Des, 6 (521-529).
37
Munroe, S., & Dong, X. (1992). Heterogeneous nuclear ribonucleoprotein A1 catalyzes
RNA.RNA annealing. Proc Natl Acad Sci., 89, 895-899.
Murphy, P.,& Knee, R. (1994). Identification and characterization of an antisense RNA
transcript (gfg) from the human basic fibroblast growth factor gene. Mol Endocrinol,
8, 852-859.
Nagel, K. M., Holstad, S. G., & Isenberg, K. E. (1993). Oligonucleotide pharmacotherapy: an
antigene strategy. Pharmacotherapy, 13, 177-188.
Nakayama, S., Kosaka, T., Hirakawa, H., Matsuura, K., Yoshino, S., & Furukawa, K. (2008).
Metabolic engineering for solvent productivity by downregulation of the hydrogenase
gene cluster hupCBA in Clostridium saccharoperbutylacetonicum strain N1-4. Appl
Microbiol Biotechnol, 78, 483-493.
Nedbal, W., Frey, M., Willemann, B., Zentgraf, H., & Sczakiel, G. (1997). Mechanistic
insights into p53-promoted RNA-RNA annealing. J Mol Biol, 266, 677-687.
Nellen, W., & Lichtenstein, C. (1993). What makes an mRNA anti-sense-itive? Trends
Biochem Sci, 18, 419-423.
Novick, R. P., Iordanescu, S., Projan, S. J., Kornblum, J., & Edelman, I. (1989). pT181
plasmid replication is regulated by a countertranscript driven transcriptional
attenuator. Cell, 59, 395-404.
Overhoff, M., Alken, M., Far, R. K., Lemaitre, M., Lebleu, B., Sczakiel, G., & Robbins, I.
(2005). Local RNA target structure influences siRNA efficacy: A systematic global
analysis. J Mol Biol, 348, 871-881.
Pace, N. R., Thomas, B. C., & Woese, C. R. (1999). Probing RNA structure, function, and
history by comparative analysis. NY: Cold Spring Harbor Laboratory Press.
38
Patzel, V., Steidl, U., Kronenwett, R., Haas, R., & Sczakiel, G. (1999). A theoretical approach
to select effective antisense oligodeoxyribonucleotides at high statistical probability.
Nucleic Acids Res, 27, 4328-4334.
Persson, C., Wagner, E. G. H., & Nordström, K. (1988). Control of replication of plasmid R1:
kinetics of in vitro interaction between the antisense RNA, CopA, and its target, CopT.
EMBO J, 7, 3279-3288.
Petersen, M., & Wengel, J. (2003). LNA: a versatile tool for therapeutics and genomics.
Trends in Biotechnology, 21, 74-81.
Pontius, B. (1993). Close encounters: why unstructured, polymeric domains can increase rates
of specific macromolecular association. Trends Biochem Sci, 18, 181-186.
Prang, N., Wolf, H., & Schwarzmann, F. (1995). Epstein-Barr virus lytic replication is
controlled by posttrancriptional negative regulation of BZLF1. J Virol, 69, 2644-2648.
Rocheleau, C. E., Downs, W. D., Lin, R., Wittmann, C., Bei, Y., Cha, Y., Ali, M., Priess, J.
R., & Mello, C. C. (1997). Wnt Signaling and an APC-Related Gene Specify
Endoderm in Early C. elegans Embryos. Cell, 90 (4), 707-716.
SantaLucia, J. Jr. (1998). A unified view of polymer, dumbbell, and oligonucleotide DNA
nearestneighbor thermodynamics. Proc. Natl. Acad. Sci. USA, 95, 1460-1465.
SantaLucia, J. Jr., & Hicks, D. (2004). The thermodynamics of DNA structural motifs. Annu
Rev Bioph Biom Struct, 33, 415-440.
Sazani, P., & Kole, R. (2003). Therapeutic potential of antisense oligonucleotides as
modulators of alternative splicing. J Clin Invest, 112, 481-486.
Schubert, S., Grunweller, A., Erdmann, V.A., & Kurreck, J. (2005). Local RNA target
structure influences siRNA efficacy: Systematic analysis of intentionally designed
binding regions. J Mol Biol, 348, 883-893.
39
Sczakiel, G. (1997). The design of antisense RNA. Antisense Nucleic Acid Drug Dev, 7, 439-
444.
Seitz, O. (1999). Chemically Modified Antisense Oligonucleotides - Recent Improvements of
RNA Binding and Ribonuclease H Recruitment. Angew Chem, 38, 3466-3469.
Serra, M. J., & Turner, D.H. (1995). Predicting thermodynamic properties of RNA. Methods
Enzymol, 259, 242-261.
Shapiro, B. A., & Wu, J. C. (1997). Predicting RNA H-type pseudoknots with the massively
parallel genetic algorithm. Comput Appl Biosci, 13, 459-471.
Sharma, C. M., Hoffmann, S., Darfeuille, F., Reignier, J., Findeiss, S., Sittka, A., Chabas, S.,
Reiche, K., Hackermüller, J., Reinhardt, R., Stadler, P. F., & Vogel, J. (2010.). The
primary transcriptome of the major human pathogen Helicobacter pylori. Nature, 464,
250-255.
Shi, F., & Hoekstra, D. (2004). Effective intracellular delivery of oligonucleotides in order to
make sense of antisense. J Control Release, 97, 189-209.
Sillers, R., Al-Hinai, M. A., & Papoutsakis, E. T. (2009). Aldehyde-Alcohol Dehydrogenase
and/or Thiolase Overexpression Coupled With CoA Transferase Downregulation Lead
to Higher Alcohol Titers and Selectivity in Clostridium acetobutylicum Fermentations.
Biotechnol Bioeng, 102, 38-49.
Simoes-Wust, A. P., Hopkins-Donaldson, S., Sigrist, B., Belyanskaya, L., Stahel, R. A., &
Zangemeister-Wittke, U. (2004). A functionally improved locked nucleic acid
antisense oligonucleotide inhibits Bcl-2 and Bcl-xL expression and facilitates tumor
cell apoptosis. Oligonucleotides, 14, 199-209.
Simons, R., & Kleckner, N. (1983). Translational control of IS10 transposition. . Cell, 34,
683-691.
40
Singh, S. K., Kuma, R., & Wengel, J. (1998). Synthesis of Novel Bicyclo[2.2.1]
Ribonucleosides: 2'-Amino- and 2'-Thio-LNA Monomeric Nucleosides. J Org Chem,
63, 6078-6079.
Sipes, T. B., & Freier, S. M. (2008). Prediction of antisense oligonucleotide efficacy using
aggregate motifs. Journal of Bioinformatics and Computational Biology, 6, 919-932.
Sproat, B. S., Lamond, A. I., Beijer, B., Neuner, P., & Ryder, U. (1989). Highly efficient
chemical synthesis of 2'-O-methyloligoribonucleotides and tetrabiotinylated
derivatives; novel probes that are resistant to degradation by RNA or DNA specific
nucleases. Nucleic Acids Res, 17, 3373-3386.
Stephenson, M. L., & Zamecnik, P. C. (1978). Inhibition of Rous sarcoma viral RNA
translation by a specific oligodeoxyribonucleotide. Proc Natl Acad Sci USA, 75, 280-
284.
Stull, R. A., Taylor, L. A.,& Szoka, Jr. F. C. (1992). Predicting antisense oligonucleotide
inhibitory efficacy: a computational approach using histograms and thermodynamic
indices. Nucleic Acids Res, 20, 3501- 3508.
Stull, R. A., Zon, G., & Szoka, F. C. (1996). An in vitro messenger RNA binding assay as a
tool for identifying hybridization-competent antisense oligonucleotides. Antisense
Nucleic Acid Drug Dev, 6, 221-228.
Summerton, J. (1999). Morpholino antisense oligomers: the case for an RNase H-independent
structural type. Biochim Biophys Acta, 1489, 141-158.
Thisted, T., Sørensen, N. S., Wagner, E. G. H., & Gerdes, K. (1994). Mechanism of post-
segregational killing: Sok antisense RNA interacts with hok mRNA via its 5’-end
singlestranded leader and competes with the 3’-end of hok mRNA for binding to the
mok translational initiation region. EMBO J, 13, 1960-1968.
Tinoco, I., & Bustamante, C. (1999). How RNA folds. J Mol Biol, 293, 271-281.
41
Tinoco, Jr. I., Borer, P. N., Dengler, B., Levine, M. D., Uhlenbeck, O. C., Crothers, D. M., &
Gralla, J. (1973). Improved Estimation of Secondary Structure in Ribonucleic Acids.
Nature. New. Biol, 246, 40-41.
Tinoco, Jr. I., Uhlenbeck, O.C. & Levine, M. D. (1971). Estimation of secondary structure in
ribonucleic acids. Nature, 230, 362-367.
Toledo-Arana, A., Dussurget, O., Nikitas, G., Sesto, N., Guet-Revillet, H., Balestrino, D.,
Loh, E., Gripenland, J., Tiensuu, T., Vaitkevicius, K., Barthelemy, M., Vergassola,
M., Nahori, M. A., Soubigou, G., Régnault, B., Coppée, J. Y., Lecuit, M., Johansson,
J., & Cossart, P. (2009). The Listeria transcriptional landscape from saprophytism to
virulence. Nature, 459, 950-956.
Tomizawa, J. I. (1984). Control of ColE1 plasmid replication: the process of binding of RNAI
to the primer transcript. Cell, 38, 861-870.
Tomizawa, J., Itoh, T., Selzer, G., & Som, T. (1981). Inhibition of ColE1 RNA primer
formation by a plasmid-specified small RNA. Proc Natl Acad Sci, 78, 1421-1425.
Tummala, S. B., Welker, N. E., & Papoutsakis, E. T. (2003a). Design of antisense RNA
constructs for downregulation of the acetone formation pathway of Clostridium
acetobutylicum. J Bacteriol, 185, 1923-1934.
Tummala, S. B., Junne, S. G., & Papoutsakis, E. T. (2003b). Antisense RNA down-regulation
of coenzyme A transferase combined with alcohol-aldehydedehydrogenase
overexpression leads to predominantly alcohologenic Clostridium acetobutylicum
fermentations. J Bacteriol, 185, 3644-3653.
D H Turner, N Sugimoto, and S M Freier. (1988). RNA Structure Prediction. Annu Rev
Biophys Biophys Chem. 17: 167-192.
Vickers, T. A., Wyatt, J. R., & Freier, S. M. (2000). Effects of RNA secondary structure on
cellular antisense activity. Nucleic Acids Res, 28, 1341-1347.
42
Wagner, E. G. H., & Flärdh, K. (2002). Antisense RNAs everywhere? TIG, 18, 223-226.
Wagner, R. W. (1994). Gene inhibition using antisense oligodeoxynucleotides. Nature, 372,
333-335.
Westerhout, E. M., Ooms, M., Vink, M., Das, A. T., & Berkhout, B. (2005). HIV-1 can
escape from RNA interference by evolving an alternative structure in its RNA
genome. Nucleic Acids Res, 33, 796-804.
Wheeler, T. M., Leger, A. J., Pandey,S. K., MacLeod, A. R., Nakamori, M., Cheng, S. H.,
Wentworth, B. M., & Bennett, C. F., & Thornton, C. A. (2012). Targeting nuclear
RNA for in vivo correction of myotonic dystrophy. Nature, 487, 111-117.
Wiese, K. C., Deschenes, A. A., & Hendriks, A. G. (2008). RnaPredict-An Evolutionary
Algorithm for RNA Secondary Structure Prediction. Trans Comput Biol Bioinform, 5,
25-41.
Wu, L., Bayle, J., Elenbaas, B., Pavletich, N., & Levine, A. (1995). Alternatively spliced
forms in the carboxy-terminal domain of the p53 protein regulate its ability to promote
annealing of complementary single strands of nucleic acids. Mol Cell Biol, 15, 497-
504.
Wyatt, J. R., Vickers, T. A., Roberson, J. L., Buckheit, R. W., Klimkait, T., DeBaets, E.,
Davis, P. W., Rayner, B., Imbach, J. L., & Ecker, D. J. (1994). Combinatorially
selected guanosine-quartet structure is a potent inhibitor of human immunodeficiency
virus envelope-mediated cell fusion. Proc Nat Acad Sci USA, 91, 1356-1360.
Zadeh, J. N., Steenberg, C. D., Bois, J. S., Wolfe, B .R., Khan, A. R., Pierce, M. B., Dirks, R.
M., Pierce, N. A. (2011). NUPACK: analysis and design of nucleic acid systems. J
Comput Chem, 32, 170-173.
43
Zamecnik, P. C., & Stephenson, M. L. (1978). Inhibition of Rous sarcoma virus replication
and cell transformation by a specific oligodeoxynucleotide. Proc Natl Acad Sci USA,
75, 280-284.
Zeiler, B. N., & Simons, R. W. (1997). Antisense RNA structure and function. In RNA
Structure and Function. NY: Cold Spring Harbor Laboratory Press.
Zellweger, T., Miyake, H., Cooper, S., Chi, K., Conklin, B. S., Monia, B. P., & Gleave, M. E.
(2001). Antitumor activity of antisense clusterin oligonucleotides is improved in vitro
and in vivo by incorporation of 2'-O-(2-methoxy)ethyl chemistry. J Pharmacol Exp
Ther., 298, 934-940.
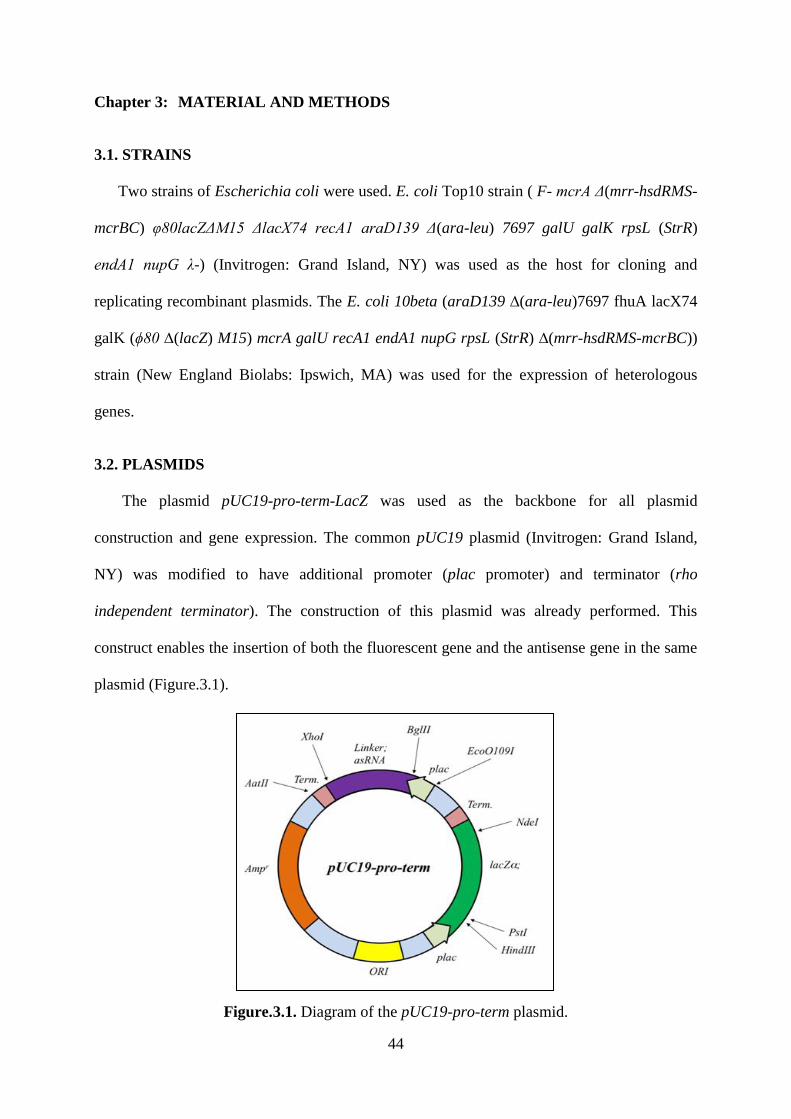
44
Chapter 3: MATERIAL AND METHODS
3.1. STRAINS
Two strains of Escherichia coli were used. E. coli Top10 strain ( F- mcrA Δ(mrr-hsdRMS-
mcrBC) φ80lacZΔM15 ΔlacΧ74 recA1 araD139 Δ(ara-leu) 7697 galU galK rpsL (StrR)
endA1 nupG λ-) (Invitrogen: Grand Island, NY) was used as the host for cloning and
replicating recombinant plasmids. The E. coli 10beta (araD139 ∆(ara-leu)7697 fhuA lacX74
galK (ϕ80 ∆(lacZ) M15) mcrA galU recA1 endA1 nupG rpsL (StrR) ∆(mrr-hsdRMS-mcrBC))
strain (New England Biolabs: Ipswich, MA) was used for the expression of heterologous
genes.
3.2. PLASMIDS
The plasmid pUC19-pro-term-LacZ was used as the backbone for all plasmid
construction and gene expression. The common pUC19 plasmid (Invitrogen: Grand Island,
NY) was modified to have additional promoter (plac promoter) and terminator (rho
independent terminator). The construction of this plasmid was already performed. This
construct enables the insertion of both the fluorescent gene and the antisense gene in the same
plasmid (Figure.3.1).
Figure.3.1. Diagram of the pUC19-pro-term plasmid.
45
Other plasmids containing different fluorescent genes were used. These plasmids are: (i)
pAmCyan plasmid (Clontech: Montain View, CA) for Cyan fluorescent protein (CFP)
cloning, (ii) pZsYellow (Clontech: Montain View, CA) used to amplify Yellow fluorescent
protein (YFP) gene and (iii) Green fluorescent protein (GFP) plasmid.
3.3. REAGENTS
Liquid Luria Bertani (LB) medium and LB agar plates were used to culture E. coli cells.
The liquid media was prepared according to the following protocol: 5 g yeast extract, 10 g
tryptone and 10 g NaCl were dissolved in 950 mL deionized water. Once the pH was adjusted
to 7.0 with sodium hydroxide (1M), the total volume was brought to 1 L with deionized water.
The vessel was autoclaved at 121°C for 25 min. After cooling to about 55°C, antibiotic
(Ampicilin with a final concentration of 100 µg/mL) or chemical indictors (X-gal and IPTG)
were added in proper concentrations. For solid media, the same ingredients were mixed with
15 g agar and the same procedure was followed. 20 mL of liquid medium was placed into
each plate, the medium solidified at room temperature, and the plates were sealed with
parafilm, and both liquid media and plates were stored +4°C.
Super Optimal broth with added glucose (SOC) medium was used for the transformation
protocol (2% tryptone, 0.5% yeast extract, 10 mM NaCl, 2.5 mM KCl, 10 mM MgCl2, 10
mM MgSO4, 20 mM glucose). Vials of SOC media are provided with competent cells.
3.4. GENETIC MANIPULATIONS
The extraction of plasmids from E. coli was carried out after harvest, using a Hurricane
Miniprep Kit (Biotech: Oxford, OH) according to the manufacturer’s protocol. PCR products
were purified using a PCR purification kit (QIAGEN: Valencia, CA) according to
manufacturer’s protocol. The cloning was performed using two methods: (i) Infusion cloning
kit (Clontech: Montain View, CA) according to the manufacturer’s protocol and (ii) ligation
with T4 DNA ligase provided from New England Biolabs (Ipswich, MA). Plasmids were gel
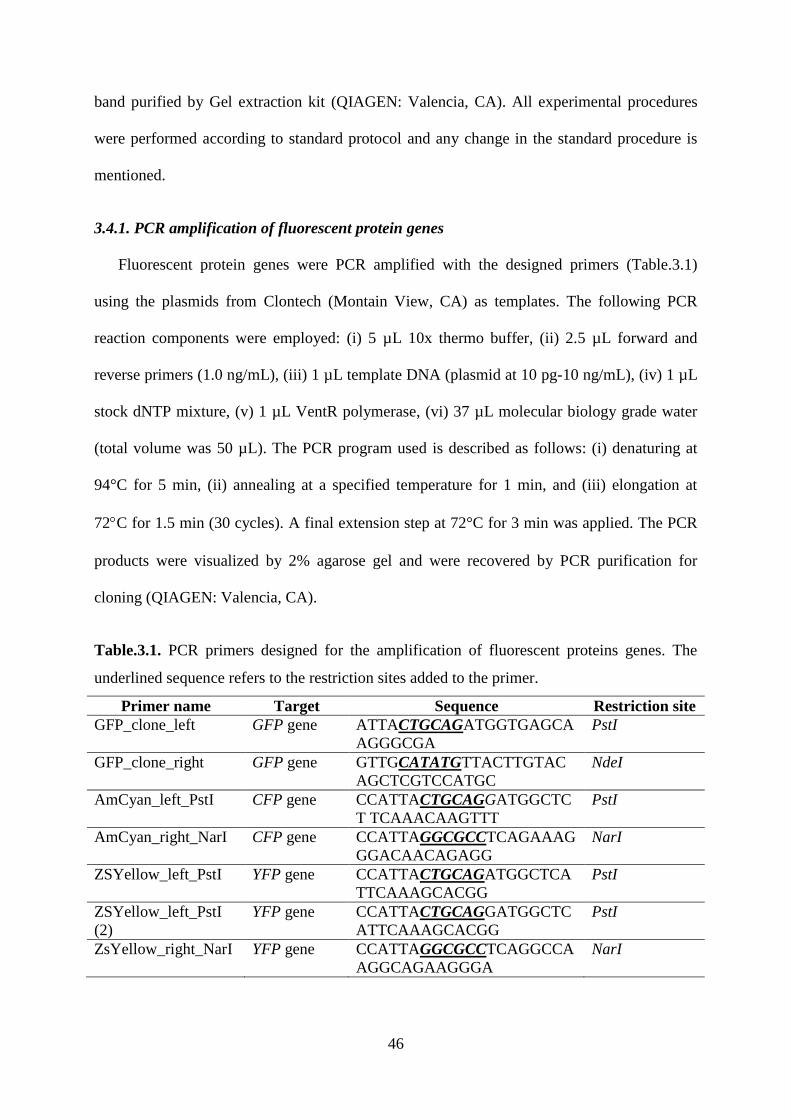
46
band purified by Gel extraction kit (QIAGEN: Valencia, CA). All experimental procedures
were performed according to standard protocol and any change in the standard procedure is
mentioned.
3.4.1. PCR amplification of fluorescent protein genes
Fluorescent protein genes were PCR amplified with the designed primers (Table.3.1)
using the plasmids from Clontech (Montain View, CA) as templates. The following PCR
reaction components were employed: (i) 5 µL 10x thermo buffer, (ii) 2.5 µL forward and
reverse primers (1.0 ng/mL), (iii) 1 µL template DNA (plasmid at 10 pg-10 ng/mL), (iv) 1 µL
stock dNTP mixture, (v) 1 µL VentR polymerase, (vi) 37 µL molecular biology grade water
(total volume was 50 µL). The PCR program used is described as follows: (i) denaturing at
94°C for 5 min, (ii) annealing at a specified temperature for 1 min, and (iii) elongation at
72C for 1.5 min (30 cycles). A final extension step at 72°C for 3 min was applied. The PCR
products were visualized by 2% agarose gel and were recovered by PCR purification for
cloning (QIAGEN: Valencia, CA).
Table.3.1. PCR primers designed for the amplification of fluorescent proteins genes. The
underlined sequence refers to the restriction sites added to the primer.
Primer name Target Sequence Restriction site
GFP_clone_left GFP gene ATTACTGCAGATGGTGAGCA
AGGGCGA
PstI
GFP_clone_right GFP gene GTTGCATATGTTACTTGTAC
AGCTCGTCCATGC
NdeI
AmCyan_left_PstI CFP gene CCATTACTGCAGGATGGCTC
T TCAAACAAGTTT
PstI
AmCyan_right_NarI CFP gene CCATTAGGCGCCTCAGAAAG
GGACAACAGAGG
NarI
ZSYellow_left_PstI YFP gene CCATTACTGCAGATGGCTCA
TTCAAAGCACGG
PstI
ZSYellow_left_PstI
(2)
YFP gene CCATTACTGCAGGATGGCTC
ATTCAAAGCACGG
PstI
ZsYellow_right_NarI YFP gene CCATTAGGCGCCTCAGGCCA
AGGCAGAAGGGA
NarI
47
3.4.2. Construction of the pUC19-pro-term-fluorescent protein plasmid
3.4.2.1. Extraction of pU19-pro-term
An overnight culture (5 mL) at 37°C of E. coli cells transformed with pUC19-pro-term
was centrifuged and the pellet was recovered. The plasmid extraction was performed using
Hurricane Miniprep kit: (i) re-suspend the pelleted cells in 250 µL of solution A by pipetting,
(ii) add 250 µL of buffer B with gentle mixing (iii) add 325 µL of buffer C and mix by
inverting the tube, (iii) centrifuge the tube for 10 min at 10,000 rpm at room temperature, (iv)
transfer the supernatant carefully to the DNA Binding Column Unit and centrifuge for 1 min
at 16,904 x g at room temperature, (v) discard the liquid from the collection tube and add 750
µL of 70% ethanol, (vi) Centrifuge the unit at 16,904 x g for 1 min at room temperature, (vii)
transfer the DNA binding column to a new 1.5 mL collection tube and add 50 µL of pre-
heated sterile water to the center of the DNA binding column and let it stand at room
temperature for 1 minute, and finally (viii) elute the plasmid in a new tube by centrifuging the
unit for 1 minute at 16,904 x g at room temperature.
3.4.2.2. Digestion of pU19-pro-term
The result of extraction was verified by gel electrophoresis. And then the extracted
plasmid was digested with two restriction enzymes specific to each fluorescent protein
(Table.3.2). The same procedure was undertaken to digest the fluorescent gene with its
specific restriction enzymes. The digestion reaction contains (i) 20 µL of pUC19-pro-term for
plasmid digestion (or PCR product for fluorescent gene digestion), (ii) 6 µL 10XBuffer 4, (iii)
6 µL 10X BSA, (iv) 1 µL PstI, (v) 1 µL of the NarI or NdeI depending on the fluorescent
protein, and (vi) 26 µL deionized water (total volume was 60 µL). The digestion was
incubated 2 hrs at 37°C.
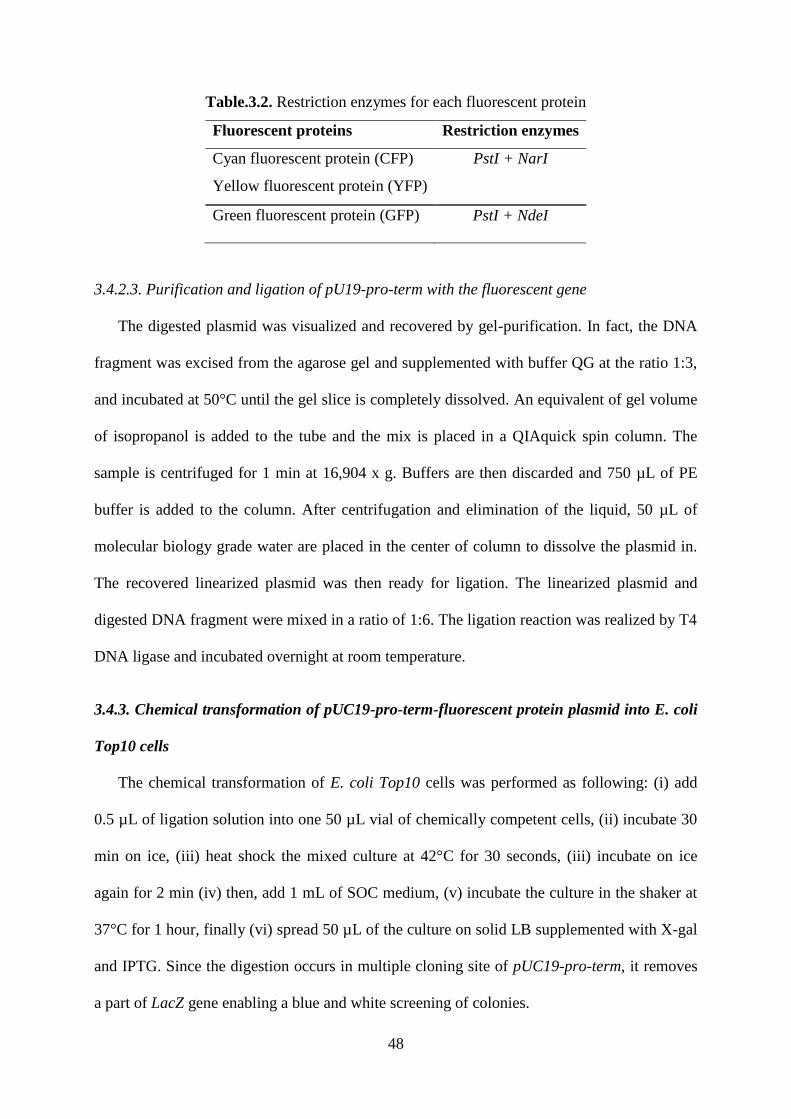
48
Table.3.2. Restriction enzymes for each fluorescent protein
Fluorescent proteins Restriction enzymes
Cyan fluorescent protein (CFP) PstI + NarI
Yellow fluorescent protein (YFP)
Green fluorescent protein (GFP) PstI + NdeI
3.4.2.3. Purification and ligation of pU19-pro-term with the fluorescent gene
The digested plasmid was visualized and recovered by gel-purification. In fact, the DNA
fragment was excised from the agarose gel and supplemented with buffer QG at the ratio 1:3,
and incubated at 50°C until the gel slice is completely dissolved. An equivalent of gel volume
of isopropanol is added to the tube and the mix is placed in a QIAquick spin column. The
sample is centrifuged for 1 min at 16,904 x g. Buffers are then discarded and 750 µL of PE
buffer is added to the column. After centrifugation and elimination of the liquid, 50 µL of
molecular biology grade water are placed in the center of column to dissolve the plasmid in.
The recovered linearized plasmid was then ready for ligation. The linearized plasmid and
digested DNA fragment were mixed in a ratio of 1:6. The ligation reaction was realized by T4
DNA ligase and incubated overnight at room temperature.
3.4.3. Chemical transformation of pUC19-pro-term-fluorescent protein plasmid into E. coli
Top10 cells
The chemical transformation of E. coli Top10 cells was performed as following: (i) add
0.5 µL of ligation solution into one 50 µL vial of chemically competent cells, (ii) incubate 30
min on ice, (iii) heat shock the mixed culture at 42°C for 30 seconds, (iii) incubate on ice
again for 2 min (iv) then, add 1 mL of SOC medium, (v) incubate the culture in the shaker at
37°C for 1 hour, finally (vi) spread 50 µL of the culture on solid LB supplemented with X-gal
and IPTG. Since the digestion occurs in multiple cloning site of pUC19-pro-term, it removes
a part of LacZ gene enabling a blue and white screening of colonies.
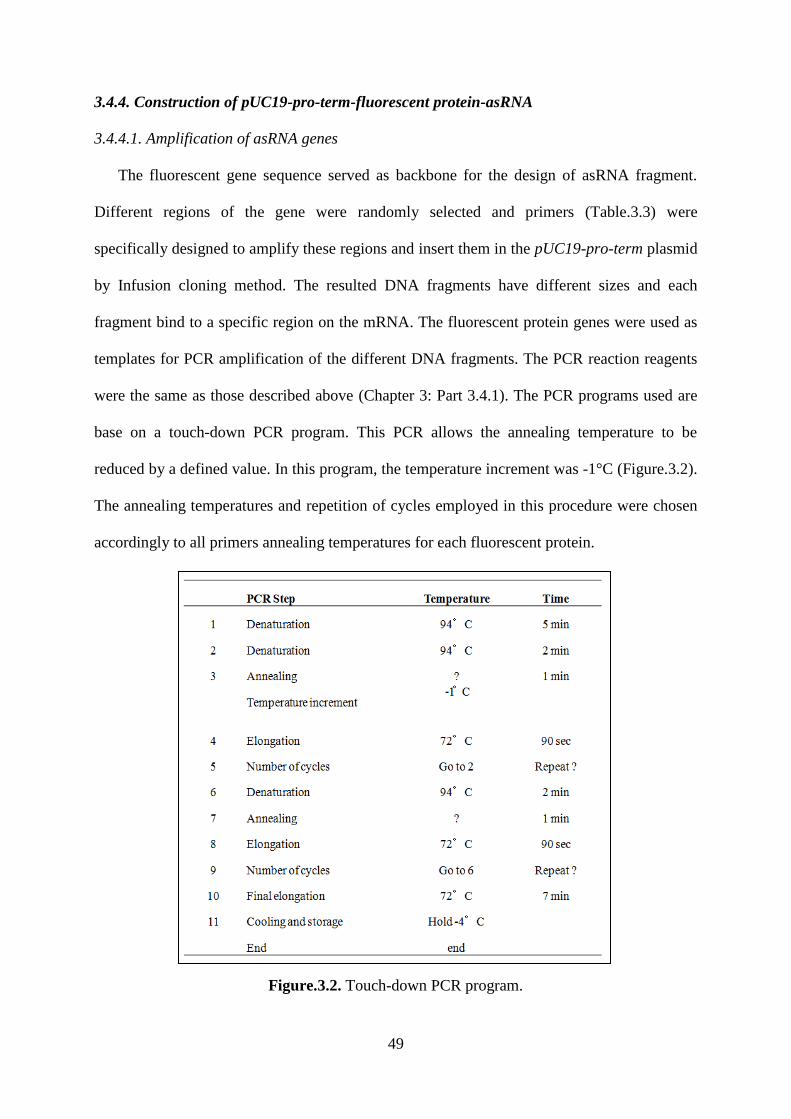
49
3.4.4. Construction of pUC19-pro-term-fluorescent protein-asRNA
3.4.4.1. Amplification of asRNA genes
The fluorescent gene sequence served as backbone for the design of asRNA fragment.
Different regions of the gene were randomly selected and primers (Table.3.3) were
specifically designed to amplify these regions and insert them in the pUC19-pro-term plasmid
by Infusion cloning method. The resulted DNA fragments have different sizes and each
fragment bind to a specific region on the mRNA. The fluorescent protein genes were used as
templates for PCR amplification of the different DNA fragments. The PCR reaction reagents
were the same as those described above (Chapter 3: Part 3.4.1). The PCR programs used are
base on a touch-down PCR program. This PCR allows the annealing temperature to be
reduced by a defined value. In this program, the temperature increment was -1°C (Figure.3.2).
The annealing temperatures and repetition of cycles employed in this procedure were chosen
accordingly to all primers annealing temperatures for each fluorescent protein.
Figure.3.2. Touch-down PCR program.
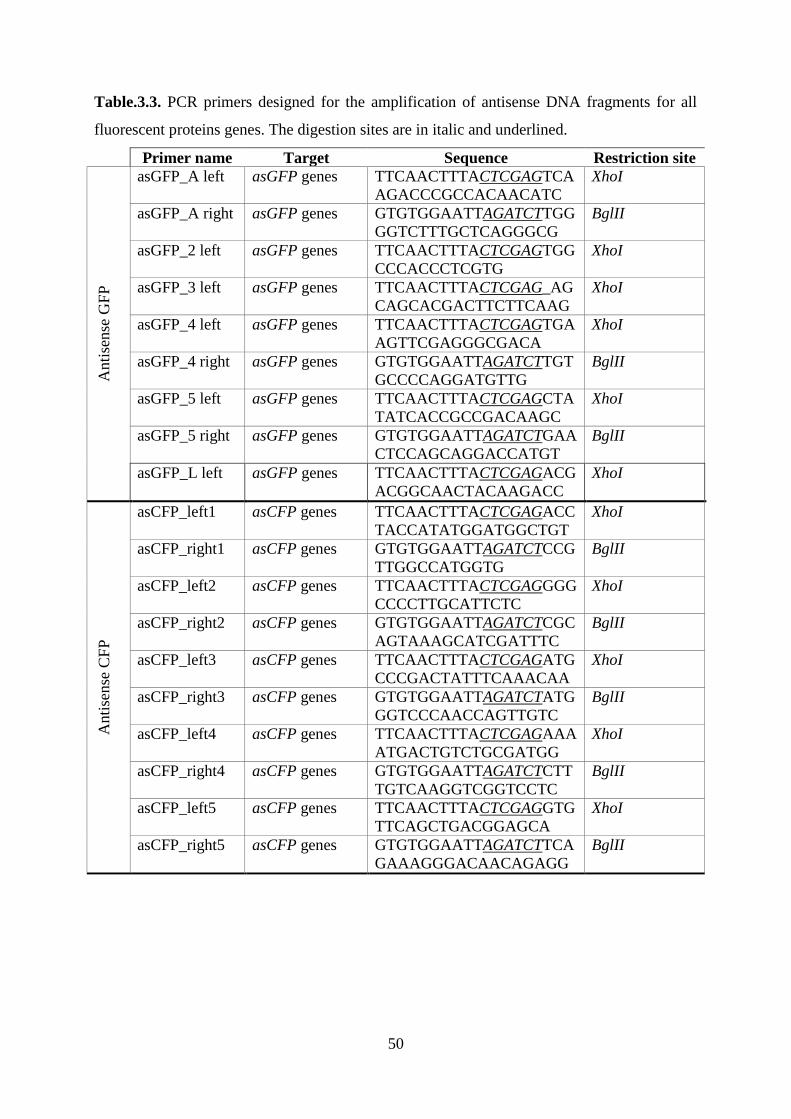
50
Table.3.3. PCR primers designed for the amplification of antisense DNA fragments for all
fluorescent proteins genes. The digestion sites are in italic and underlined.
Primer name Target Sequence Restriction site
Anti
sense
GF
P
asGFP_A left asGFP genes TTCAACTTTACTCGAGTCA
AGACCCGCCACAACATC
XhoI
asGFP_A right
asGFP genes GTGTGGAATTAGATCTTGG
GGTCTTTGCTCAGGGCG
BglII
asGFP_2 left asGFP genes TTCAACTTTACTCGAGTGG
CCCACCCTCGTG
XhoI
asGFP_3 left asGFP genes TTCAACTTTACTCGAG_AG
CAGCACGACTTCTTCAAG
XhoI
asGFP_4 left
asGFP genes TTCAACTTTACTCGAGTGA
AGTTCGAGGGCGACA
XhoI
asGFP_4 right
asGFP genes GTGTGGAATTAGATCTTGT
GCCCCAGGATGTTG
BglII
asGFP_5 left
asGFP genes TTCAACTTTACTCGAGCTA
TATCACCGCCGACAAGC
XhoI
asGFP_5 right
asGFP genes GTGTGGAATTAGATCTGAA
CTCCAGCAGGACCATGT
BglII
asGFP_L left asGFP genes TTCAACTTTACTCGAGACG
ACGGCAACTACAAGACC
XhoI
Anti
sense
CF
P
asCFP_left1
asCFP genes TTCAACTTTACTCGAGACC
TACCATATGGATGGCTGT
XhoI
asCFP_right1
asCFP genes GTGTGGAATTAGATCTCCG
TTGGCCATGGTG
BglII
asCFP_left2
asCFP genes TTCAACTTTACTCGAGGGG
CCCCTTGCATTCTC
XhoI
asCFP_right2
asCFP genes GTGTGGAATTAGATCTCGC
AGTAAAGCATCGATTTC
BglII
asCFP_left3
asCFP genes TTCAACTTTACTCGAGATG
CCCGACTATTTCAAACAA
XhoI
asCFP_right3
asCFP genes GTGTGGAATTAGATCTATG
GGTCCCAACCAGTTGTC
BglII
asCFP_left4
asCFP genes TTCAACTTTACTCGAGAAA
ATGACTGTCTGCGATGG
XhoI
asCFP_right4
asCFP genes GTGTGGAATTAGATCTCTT
TGTCAAGGTCGGTCCTC
BglII
asCFP_left5
asCFP genes TTCAACTTTACTCGAGGTG
TTCAGCTGACGGAGCA
XhoI
asCFP_right5
asCFP genes GTGTGGAATTAGATCTTCA
GAAAGGGACAACAGAGG
BglII
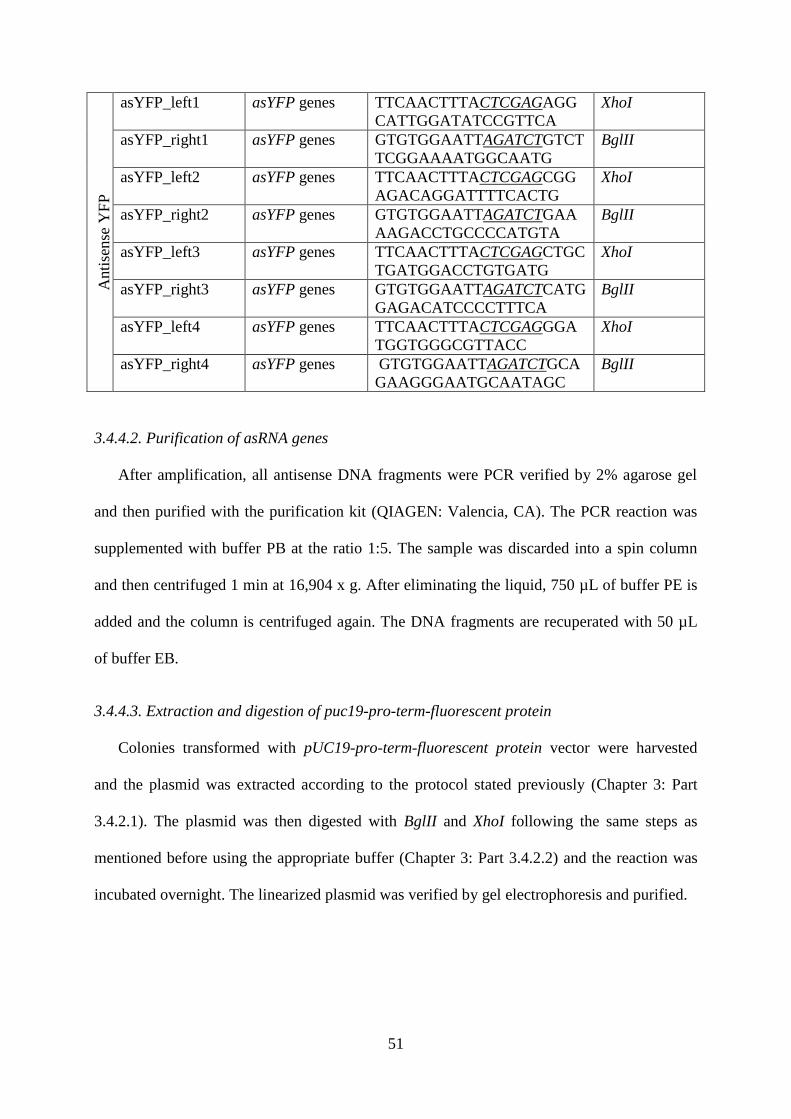
51
3.4.4.2. Purification of asRNA genes
After amplification, all antisense DNA fragments were PCR verified by 2% agarose gel
and then purified with the purification kit (QIAGEN: Valencia, CA). The PCR reaction was
supplemented with buffer PB at the ratio 1:5. The sample was discarded into a spin column
and then centrifuged 1 min at 16,904 x g. After eliminating the liquid, 750 µL of buffer PE is
added and the column is centrifuged again. The DNA fragments are recuperated with 50 µL
of buffer EB.
3.4.4.3. Extraction and digestion of puc19-pro-term-fluorescent protein
Colonies transformed with pUC19-pro-term-fluorescent protein vector were harvested
and the plasmid was extracted according to the protocol stated previously (Chapter 3: Part
3.4.2.1). The plasmid was then digested with BglII and XhoI following the same steps as
mentioned before using the appropriate buffer (Chapter 3: Part 3.4.2.2) and the reaction was
incubated overnight. The linearized plasmid was verified by gel electrophoresis and purified.
Anti
sense
YF
P
asYFP_left1
asYFP genes TTCAACTTTACTCGAGAGG
CATTGGATATCCGTTCA
XhoI
asYFP_right1
asYFP genes GTGTGGAATTAGATCTGTCT
TCGGAAAATGGCAATG
BglII
asYFP_left2
asYFP genes TTCAACTTTACTCGAGCGG
AGACAGGATTTTCACTG
XhoI
asYFP_right2
asYFP genes GTGTGGAATTAGATCTGAA
AAGACCTGCCCCATGTA
BglII
asYFP_left3
asYFP genes TTCAACTTTACTCGAGCTGC
TGATGGACCTGTGATG
XhoI
asYFP_right3
asYFP genes GTGTGGAATTAGATCTCATG
GAGACATCCCCTTTCA
BglII
asYFP_left4
asYFP genes TTCAACTTTACTCGAGGGA
TGGTGGGCGTTACC
XhoI
asYFP_right4
asYFP genes GTGTGGAATTAGATCTGCA
GAAGGGAATGCAATAGC
BglII
52
3.4.4.4. Infusion cloning method
The antisense fragments were cloned into the linearized vector containing the
corresponding fluorescent gene, using InFusion cloning (Clontech: Montain View, CA)
according to the manufacturer’s protocols. The InFusion cloning approach is different from
the conventional ligase approach (“sticky-end” cloning). In fact, the antisense DNA fragments
share 16 bases of homology with the ends of the linearized vector. This sequence homology is
added to the insert through the PCR primers. This method was proven to enhance cloning
efficiency considerably and enabled all PCR fragments to be cloned simultaneously and
located on a single plate. This led to a combinatorial design for evaluating asRNA genes.
AsDNA fragments were purified and each fragment concentration was determined by
Nanodrop machine. Then, they were mixed appropriately to have the same fraction in the mix
(combinatorial approach). The concentration of pUC19-pro-term-fluorescent protein plasmid
was adjusted accordingly to the resulted mixture concentration. The InFusion cloning was
performed according to the following procedure: (i) 2 µL mixtures of vector and insert both
with the concentration of 10 pg-10 ng/mL were added to the reaction with the molar ratio of
1:6 (vector: insert), (ii) 1 µL 5X InFusion HD enzyme premix buffer was added, (iii) the total
volume was adjusted to 5 µL with molecular biology grade water, (iv) the reaction was
incubated at 50°C for 15 min, (v) the reaction was then placed on ice for 30 min for chemical
transformation into E. coli 10beta competent cells (Clontech: Montain View, CA). The
chemical transformation steps were as mentioned above (Chapter 3: Part 3.4.3).
3.5. FLUORESCENT PROTEIN EXPRESSION LEVEL DETERMINATION
Positive colonies on each plate were randomly selected and sub-cultured into 24-well
plate with the final concentration of IPTG 0.8 mM and ampicillin 100 µg/mL. The culture
was incubated in a plate reader at 25°C (Studier, 2005) with slow shaking. OD600 and
fluorescence readings were determined every 30 min or 1 hour. The excitation and emission
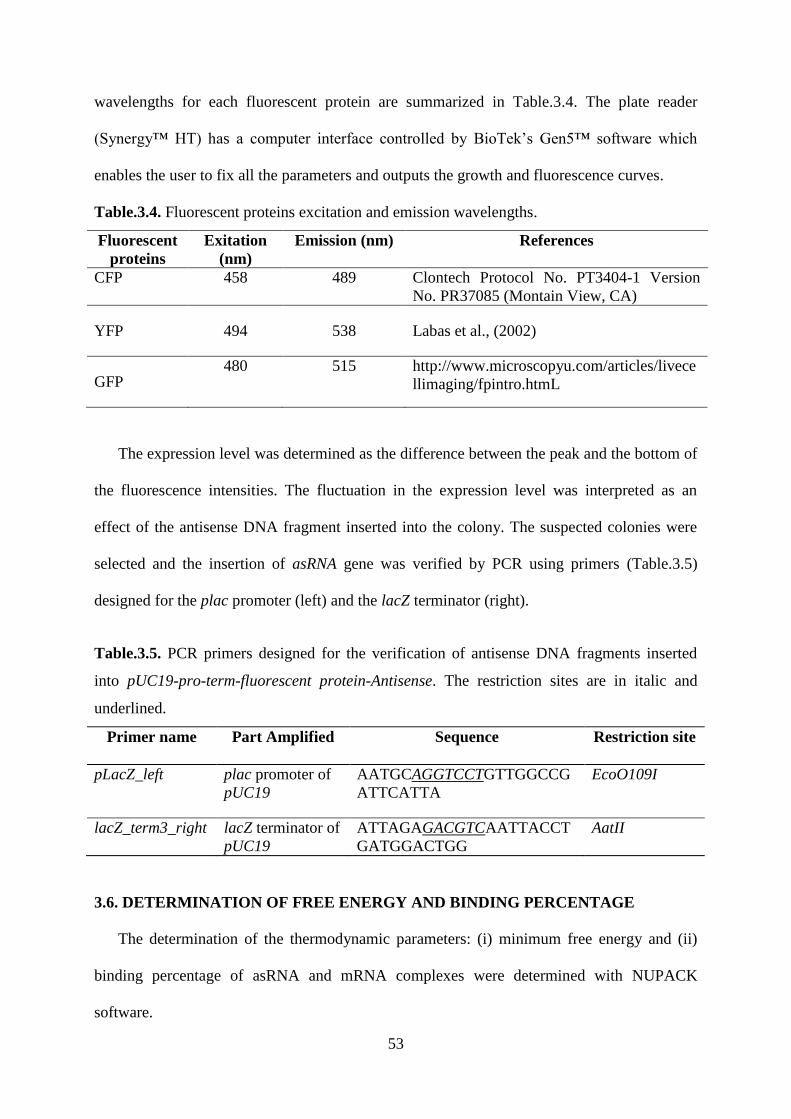
53
wavelengths for each fluorescent protein are summarized in Table.3.4. The plate reader
(Synergy™ HT) has a computer interface controlled by BioTek’s Gen5™ software which
enables the user to fix all the parameters and outputs the growth and fluorescence curves.
Table.3.4. Fluorescent proteins excitation and emission wavelengths.
Fluorescent
proteins
Exitation
(nm)
Emission (nm) References
CFP 458 489 Clontech Protocol No. PT3404-1 Version
No. PR37085 (Montain View, CA)
YFP 494 538 Labas et al., (2002)
GFP 480 515 http://www.microscopyu.com/articles/livece
llimaging/fpintro.htmL
The expression level was determined as the difference between the peak and the bottom of
the fluorescence intensities. The fluctuation in the expression level was interpreted as an
effect of the antisense DNA fragment inserted into the colony. The suspected colonies were
selected and the insertion of asRNA gene was verified by PCR using primers (Table.3.5)
designed for the plac promoter (left) and the lacZ terminator (right).
Table.3.5. PCR primers designed for the verification of antisense DNA fragments inserted
into pUC19-pro-term-fluorescent protein-Antisense. The restriction sites are in italic and
underlined.
Primer name Part Amplified Sequence Restriction site
pLacZ_left plac promoter of
pUC19
AATGCAGGTCCTGTTGGCCG
ATTCATTA
EcoO109I
lacZ_term3_right lacZ terminator of
pUC19
ATTAGAGACGTCAATTACCT
GATGGACTGG
AatII
3.6. DETERMINATION OF FREE ENERGY AND BINDING PERCENTAGE
The determination of the thermodynamic parameters: (i) minimum free energy and (ii)
binding percentage of asRNA and mRNA complexes were determined with NUPACK
software.

54
3.7. SOFTWARE
The thermodynamic analysis of asRNA and mRNA complexes was implemented by
NUPACK software offered from http://www.nupack.org. The primers were designed using
Primer3Plus software (http://www.bioinformatics.nl/cgi-bin/primer3plus/primer3plus.cgi).
The fluorescence and growth curves were provided from BioTek’s Gen5™ software with the
plate reader.

55
3.8. REFRENCES
Labas, Y. A., Gurskaya,N. G., Yanushevich, Y. G., Fradkov, A. F., Lukyanov, K. A.,
Lukyanov, S. A., & Matz, M. V. (2002). Diversity and evolution of the green
fluorescent protein family. PNAS, 99, 4256-4261.
Studier, F. W. (2005). Protein production by auto-induction in high-density shaking cultures.
Protein Expr Purif, 41, 207-234.
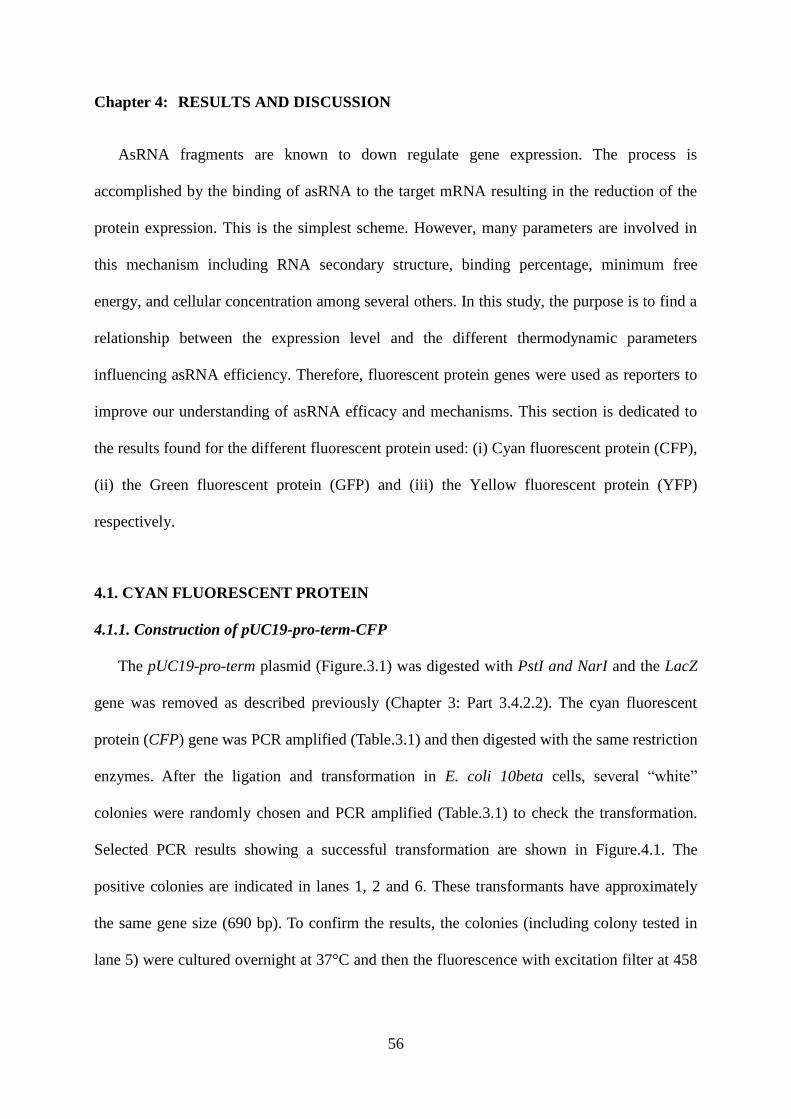
56
Chapter 4: RESULTS AND DISCUSSION
AsRNA fragments are known to down regulate gene expression. The process is
accomplished by the binding of asRNA to the target mRNA resulting in the reduction of the
protein expression. This is the simplest scheme. However, many parameters are involved in
this mechanism including RNA secondary structure, binding percentage, minimum free
energy, and cellular concentration among several others. In this study, the purpose is to find a
relationship between the expression level and the different thermodynamic parameters
influencing asRNA efficiency. Therefore, fluorescent protein genes were used as reporters to
improve our understanding of asRNA efficacy and mechanisms. This section is dedicated to
the results found for the different fluorescent protein used: (i) Cyan fluorescent protein (CFP),
(ii) the Green fluorescent protein (GFP) and (iii) the Yellow fluorescent protein (YFP)
respectively.
4.1. CYAN FLUORESCENT PROTEIN
4.1.1. Construction of pUC19-pro-term-CFP
The pUC19-pro-term plasmid (Figure.3.1) was digested with PstI and NarI and the LacZ
gene was removed as described previously (Chapter 3: Part 3.4.2.2). The cyan fluorescent
protein (CFP) gene was PCR amplified (Table.3.1) and then digested with the same restriction
enzymes. After the ligation and transformation in E. coli 10beta cells, several “white”
colonies were randomly chosen and PCR amplified (Table.3.1) to check the transformation.
Selected PCR results showing a successful transformation are shown in Figure.4.1. The
positive colonies are indicated in lanes 1, 2 and 6. These transformants have approximately
the same gene size (690 bp). To confirm the results, the colonies (including colony tested in
lane 5) were cultured overnight at 37°C and then the fluorescence with excitation filter at 458
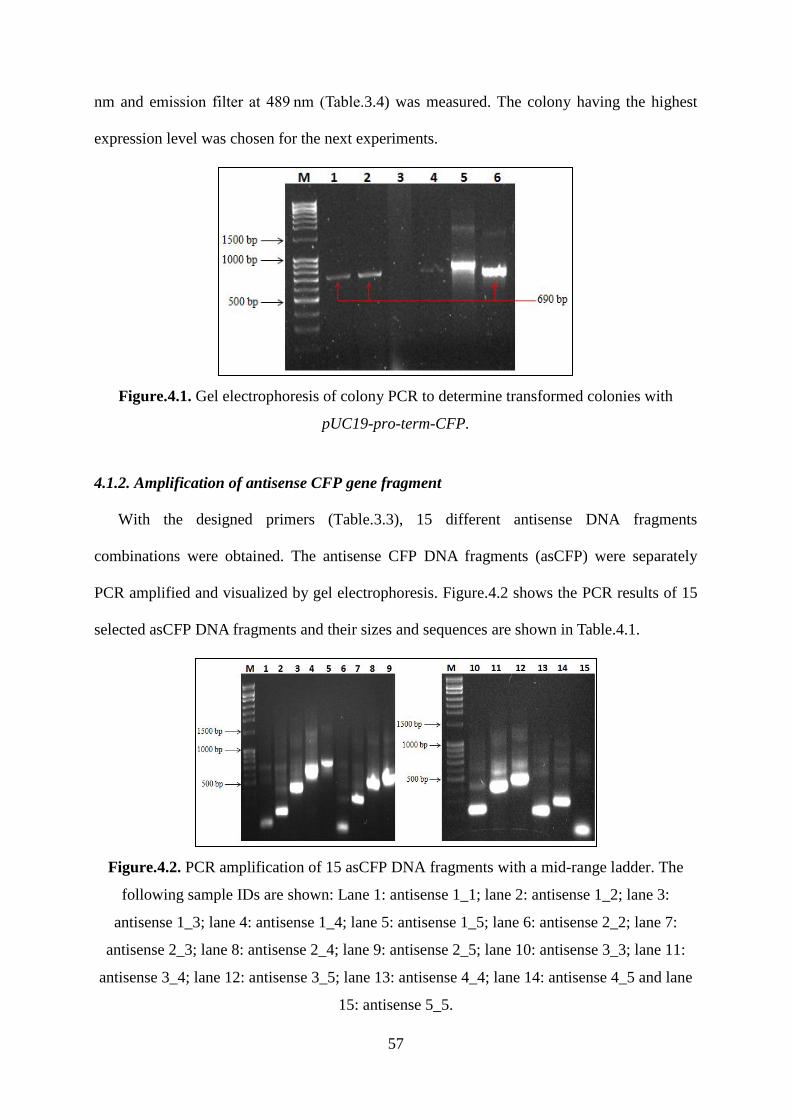
57
nm and emission filter at 489 nm (Table.3.4) was measured. The colony having the highest
expression level was chosen for the next experiments.
Figure.4.1. Gel electrophoresis of colony PCR to determine transformed colonies with
pUC19-pro-term-CFP.
4.1.2. Amplification of antisense CFP gene fragment
With the designed primers (Table.3.3), 15 different antisense DNA fragments
combinations were obtained. The antisense CFP DNA fragments (asCFP) were separately
PCR amplified and visualized by gel electrophoresis. Figure.4.2 shows the PCR results of 15
selected asCFP DNA fragments and their sizes and sequences are shown in Table.4.1.
Figure.4.2. PCR amplification of 15 asCFP DNA fragments with a mid-range ladder. The
following sample IDs are shown: Lane 1: antisense 1_1; lane 2: antisense 1_2; lane 3:
antisense 1_3; lane 4: antisense 1_4; lane 5: antisense 1_5; lane 6: antisense 2_2; lane 7:
antisense 2_3; lane 8: antisense 2_4; lane 9: antisense 2_5; lane 10: antisense 3_3; lane 11:
antisense 3_4; lane 12: antisense 3_5; lane 13: antisense 4_4; lane 14: antisense 4_5 and lane
15: antisense 5_5.
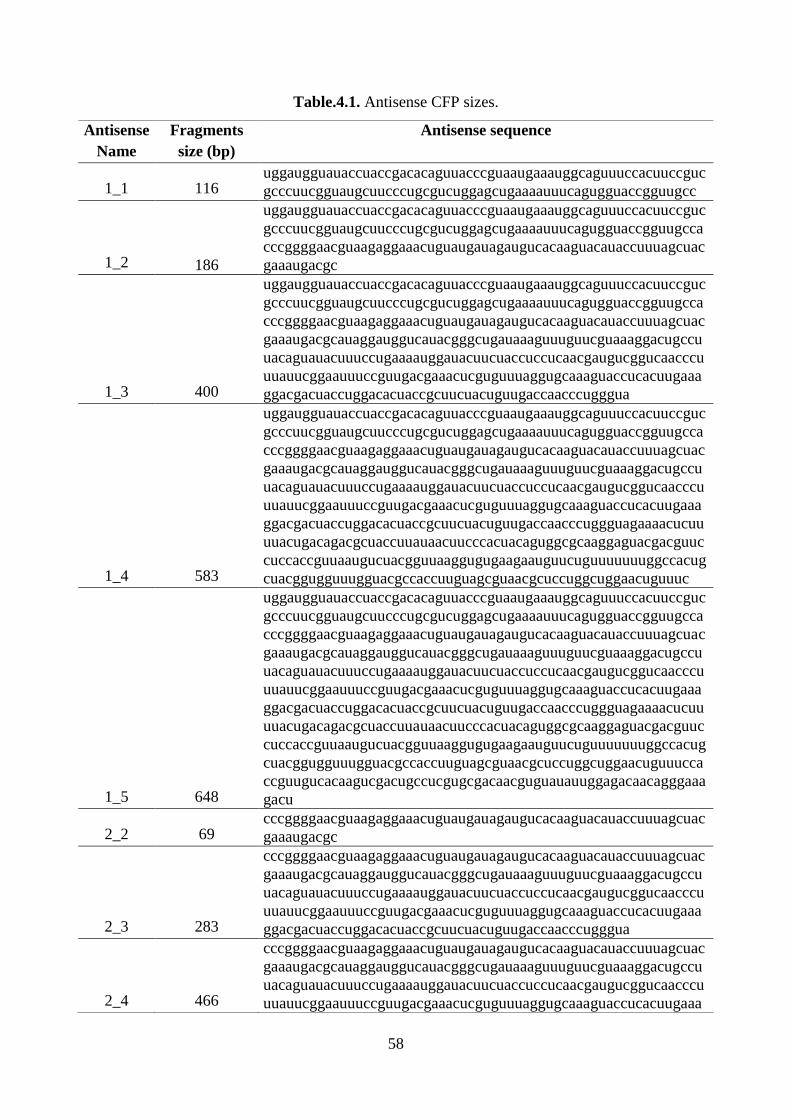
58
Table.4.1. Antisense CFP sizes.
Antisense
Name
Fragments
size (bp)
Antisense sequence
1_1 116 uggaugguauaccuaccgacacaguuacccguaaugaaauggcaguuuccacuuccguc
gcccuucgguaugcuucccugcgucuggagcugaaaauuucagugguaccgguugcc
1_2 186
uggaugguauaccuaccgacacaguuacccguaaugaaauggcaguuuccacuuccguc
gcccuucgguaugcuucccugcgucuggagcugaaaauuucagugguaccgguugcca
cccggggaacguaagaggaaacuguaugauagaugucacaaguacauaccuuuagcuac
gaaaugacgc
1_3 400
uggaugguauaccuaccgacacaguuacccguaaugaaauggcaguuuccacuuccguc
gcccuucgguaugcuucccugcgucuggagcugaaaauuucagugguaccgguugcca
cccggggaacguaagaggaaacuguaugauagaugucacaaguacauaccuuuagcuac
gaaaugacgcauaggauggucauacgggcugauaaaguuuguucguaaaggacugccu
uacaguauacuuuccugaaaauggauacuucuaccuccucaacgaugucggucaacccu
uuauucggaauuuccguugacgaaacucguguuuaggugcaaaguaccucacuugaaa
ggacgacuaccuggacacuaccgcuucuacuguugaccaacccugggua
1_4 583
uggaugguauaccuaccgacacaguuacccguaaugaaauggcaguuuccacuuccguc
gcccuucgguaugcuucccugcgucuggagcugaaaauuucagugguaccgguugcca
cccggggaacguaagaggaaacuguaugauagaugucacaaguacauaccuuuagcuac
gaaaugacgcauaggauggucauacgggcugauaaaguuuguucguaaaggacugccu
uacaguauacuuuccugaaaauggauacuucuaccuccucaacgaugucggucaacccu
uuauucggaauuuccguugacgaaacucguguuuaggugcaaaguaccucacuugaaa
ggacgacuaccuggacacuaccgcuucuacuguugaccaacccuggguagaaaacucuu
uuacugacagacgcuaccuuauaacuucccacuacaguggcgcaaggaguacgacguuc
cuccaccguuaaugucuacgguuaaggugugaagaauguucuguuuuuuuggccacug
cuacggugguuugguacgccaccuuguagcguaacgcuccuggcuggaacuguuuc
1_5 648
uggaugguauaccuaccgacacaguuacccguaaugaaauggcaguuuccacuuccguc
gcccuucgguaugcuucccugcgucuggagcugaaaauuucagugguaccgguugcca
cccggggaacguaagaggaaacuguaugauagaugucacaaguacauaccuuuagcuac
gaaaugacgcauaggauggucauacgggcugauaaaguuuguucguaaaggacugccu
uacaguauacuuuccugaaaauggauacuucuaccuccucaacgaugucggucaacccu
uuauucggaauuuccguugacgaaacucguguuuaggugcaaaguaccucacuugaaa
ggacgacuaccuggacacuaccgcuucuacuguugaccaacccuggguagaaaacucuu
uuacugacagacgcuaccuuauaacuucccacuacaguggcgcaaggaguacgacguuc
cuccaccguuaaugucuacgguuaaggugugaagaauguucuguuuuuuuggccacug
cuacggugguuugguacgccaccuuguagcguaacgcuccuggcuggaacuguuucca
ccguugucacaagucgacugccucgugcgacaacguguauauuggagacaacagggaaa
gacu
2_2 69 cccggggaacguaagaggaaacuguaugauagaugucacaaguacauaccuuuagcuac
gaaaugacgc
2_3 283
cccggggaacguaagaggaaacuguaugauagaugucacaaguacauaccuuuagcuac
gaaaugacgcauaggauggucauacgggcugauaaaguuuguucguaaaggacugccu
uacaguauacuuuccugaaaauggauacuucuaccuccucaacgaugucggucaacccu
uuauucggaauuuccguugacgaaacucguguuuaggugcaaaguaccucacuugaaa
ggacgacuaccuggacacuaccgcuucuacuguugaccaacccugggua
2_4 466
cccggggaacguaagaggaaacuguaugauagaugucacaaguacauaccuuuagcuac
gaaaugacgcauaggauggucauacgggcugauaaaguuuguucguaaaggacugccu
uacaguauacuuuccugaaaauggauacuucuaccuccucaacgaugucggucaacccu
uuauucggaauuuccguugacgaaacucguguuuaggugcaaaguaccucacuugaaa
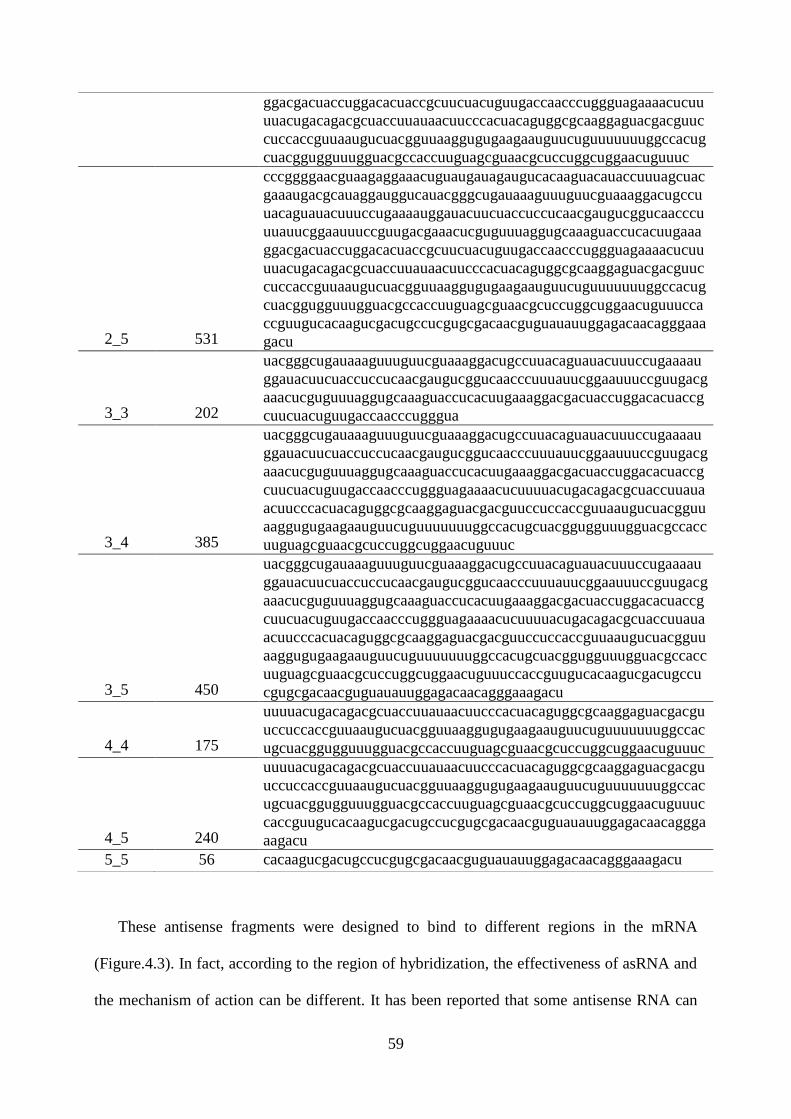
59
ggacgacuaccuggacacuaccgcuucuacuguugaccaacccuggguagaaaacucuu
uuacugacagacgcuaccuuauaacuucccacuacaguggcgcaaggaguacgacguuc
cuccaccguuaaugucuacgguuaaggugugaagaauguucuguuuuuuuggccacug
cuacggugguuugguacgccaccuuguagcguaacgcuccuggcuggaacuguuuc
2_5 531
cccggggaacguaagaggaaacuguaugauagaugucacaaguacauaccuuuagcuac
gaaaugacgcauaggauggucauacgggcugauaaaguuuguucguaaaggacugccu
uacaguauacuuuccugaaaauggauacuucuaccuccucaacgaugucggucaacccu
uuauucggaauuuccguugacgaaacucguguuuaggugcaaaguaccucacuugaaa
ggacgacuaccuggacacuaccgcuucuacuguugaccaacccuggguagaaaacucuu
uuacugacagacgcuaccuuauaacuucccacuacaguggcgcaaggaguacgacguuc
cuccaccguuaaugucuacgguuaaggugugaagaauguucuguuuuuuuggccacug
cuacggugguuugguacgccaccuuguagcguaacgcuccuggcuggaacuguuucca
ccguugucacaagucgacugccucgugcgacaacguguauauuggagacaacagggaaa
gacu
3_3 202
uacgggcugauaaaguuuguucguaaaggacugccuuacaguauacuuuccugaaaau
ggauacuucuaccuccucaacgaugucggucaacccuuuauucggaauuuccguugacg
aaacucguguuuaggugcaaaguaccucacuugaaaggacgacuaccuggacacuaccg
cuucuacuguugaccaacccugggua
3_4 385
uacgggcugauaaaguuuguucguaaaggacugccuuacaguauacuuuccugaaaau
ggauacuucuaccuccucaacgaugucggucaacccuuuauucggaauuuccguugacg
aaacucguguuuaggugcaaaguaccucacuugaaaggacgacuaccuggacacuaccg
cuucuacuguugaccaacccuggguagaaaacucuuuuacugacagacgcuaccuuaua
acuucccacuacaguggcgcaaggaguacgacguuccuccaccguuaaugucuacgguu
aaggugugaagaauguucuguuuuuuuggccacugcuacggugguuugguacgccacc
uuguagcguaacgcuccuggcuggaacuguuuc
3_5 450
uacgggcugauaaaguuuguucguaaaggacugccuuacaguauacuuuccugaaaau
ggauacuucuaccuccucaacgaugucggucaacccuuuauucggaauuuccguugacg
aaacucguguuuaggugcaaaguaccucacuugaaaggacgacuaccuggacacuaccg
cuucuacuguugaccaacccuggguagaaaacucuuuuacugacagacgcuaccuuaua
acuucccacuacaguggcgcaaggaguacgacguuccuccaccguuaaugucuacgguu
aaggugugaagaauguucuguuuuuuuggccacugcuacggugguuugguacgccacc
uuguagcguaacgcuccuggcuggaacuguuuccaccguugucacaagucgacugccu
cgugcgacaacguguauauuggagacaacagggaaagacu
4_4 175
uuuuacugacagacgcuaccuuauaacuucccacuacaguggcgcaaggaguacgacgu
uccuccaccguuaaugucuacgguuaaggugugaagaauguucuguuuuuuuggccac
ugcuacggugguuugguacgccaccuuguagcguaacgcuccuggcuggaacuguuuc
4_5 240
uuuuacugacagacgcuaccuuauaacuucccacuacaguggcgcaaggaguacgacgu
uccuccaccguuaaugucuacgguuaaggugugaagaauguucuguuuuuuuggccac
ugcuacggugguuugguacgccaccuuguagcguaacgcuccuggcuggaacuguuuc
caccguugucacaagucgacugccucgugcgacaacguguauauuggagacaacaggga
aagacu
5_5 56 cacaagucgacugccucgugcgacaacguguauauuggagacaacagggaaagacu
These antisense fragments were designed to bind to different regions in the mRNA
(Figure.4.3). In fact, according to the region of hybridization, the effectiveness of asRNA and
the mechanism of action can be different. It has been reported that some antisense RNA can
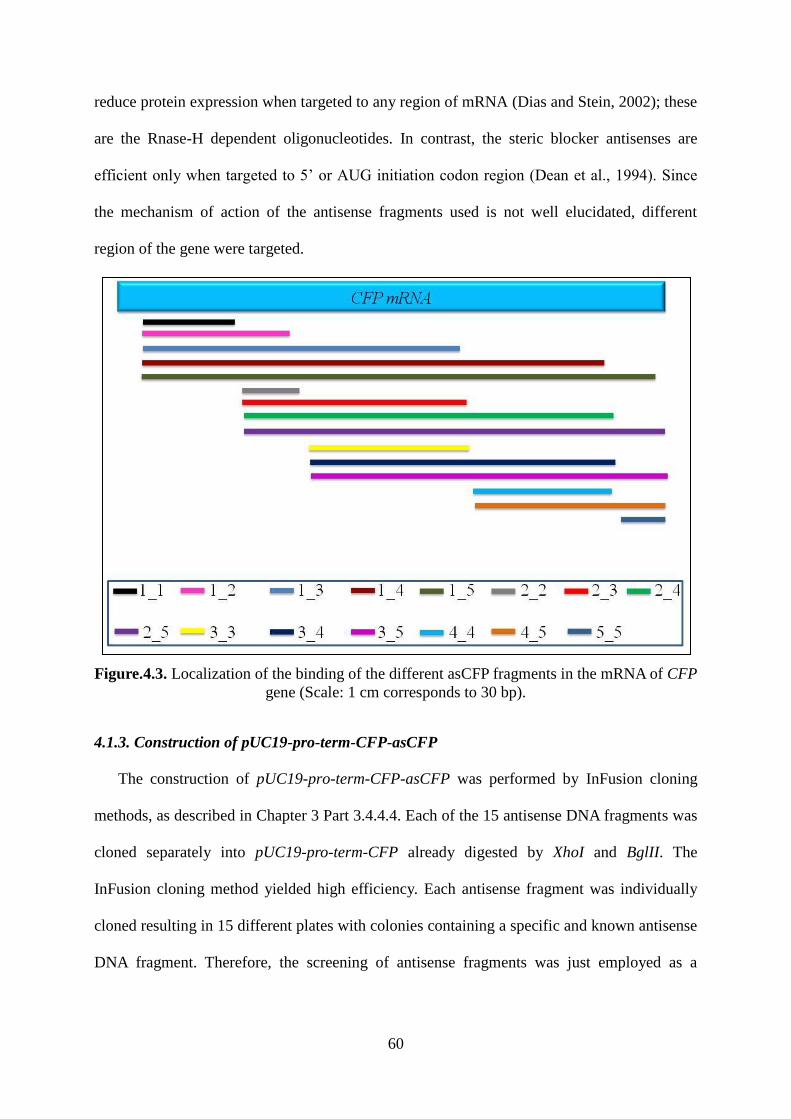
60
reduce protein expression when targeted to any region of mRNA (Dias and Stein, 2002); these
are the Rnase-H dependent oligonucleotides. In contrast, the steric blocker antisenses are
efficient only when targeted to 5’ or AUG initiation codon region (Dean et al., 1994). Since
the mechanism of action of the antisense fragments used is not well elucidated, different
region of the gene were targeted.
Figure.4.3. Localization of the binding of the different asCFP fragments in the mRNA of CFP
gene (Scale: 1 cm corresponds to 30 bp).
4.1.3. Construction of pUC19-pro-term-CFP-asCFP
The construction of pUC19-pro-term-CFP-asCFP was performed by InFusion cloning
methods, as described in Chapter 3 Part 3.4.4.4. Each of the 15 antisense DNA fragments was
cloned separately into pUC19-pro-term-CFP already digested by XhoI and BglII. The
InFusion cloning method yielded high efficiency. Each antisense fragment was individually
cloned resulting in 15 different plates with colonies containing a specific and known antisense
DNA fragment. Therefore, the screening of antisense fragments was just employed as a
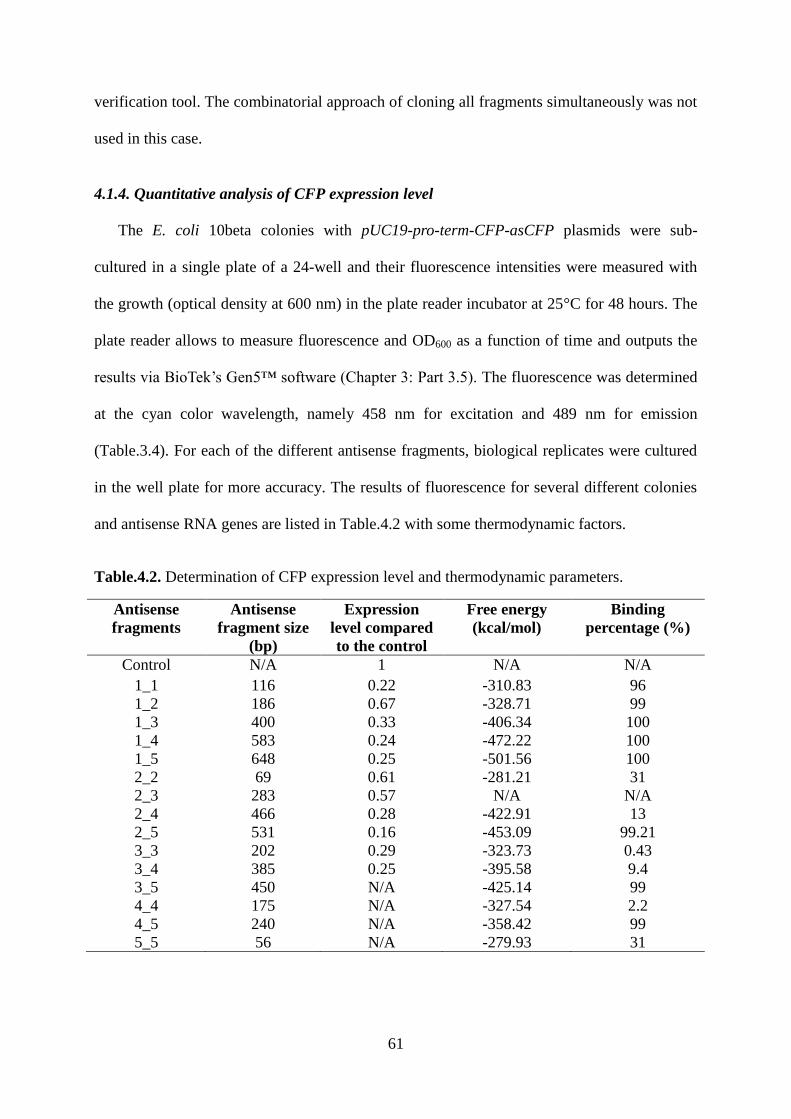
61
verification tool. The combinatorial approach of cloning all fragments simultaneously was not
used in this case.
4.1.4. Quantitative analysis of CFP expression level
The E. coli 10beta colonies with pUC19-pro-term-CFP-asCFP plasmids were sub-
cultured in a single plate of a 24-well and their fluorescence intensities were measured with
the growth (optical density at 600 nm) in the plate reader incubator at 25°C for 48 hours. The
plate reader allows to measure fluorescence and OD600 as a function of time and outputs the
results via BioTek’s Gen5™ software (Chapter 3: Part 3.5). The fluorescence was determined
at the cyan color wavelength, namely 458 nm for excitation and 489 nm for emission
(Table.3.4). For each of the different antisense fragments, biological replicates were cultured
in the well plate for more accuracy. The results of fluorescence for several different colonies
and antisense RNA genes are listed in Table.4.2 with some thermodynamic factors.
Table.4.2. Determination of CFP expression level and thermodynamic parameters.
Antisense
fragments
Antisense
fragment size
(bp)
Expression
level compared
to the control
Free energy
(kcal/mol)
Binding
percentage (%)
Control N/A 1 N/A N/A
1_1 116 0.22 -310.83 96
1_2 186 0.67 -328.71 99
1_3 400 0.33 -406.34 100
1_4 583 0.24 -472.22 100
1_5 648 0.25 -501.56 100
2_2 69 0.61 -281.21 31
2_3 283 0.57 N/A N/A
2_4 466 0.28 -422.91 13
2_5 531 0.16 -453.09 99.21
3_3 202 0.29 -323.73 0.43
3_4 385 0.25 -395.58 9.4
3_5 450 N/A -425.14 99
4_4 175 N/A -327.54 2.2
4_5 240 N/A -358.42 99
5_5 56 N/A -279.93 31
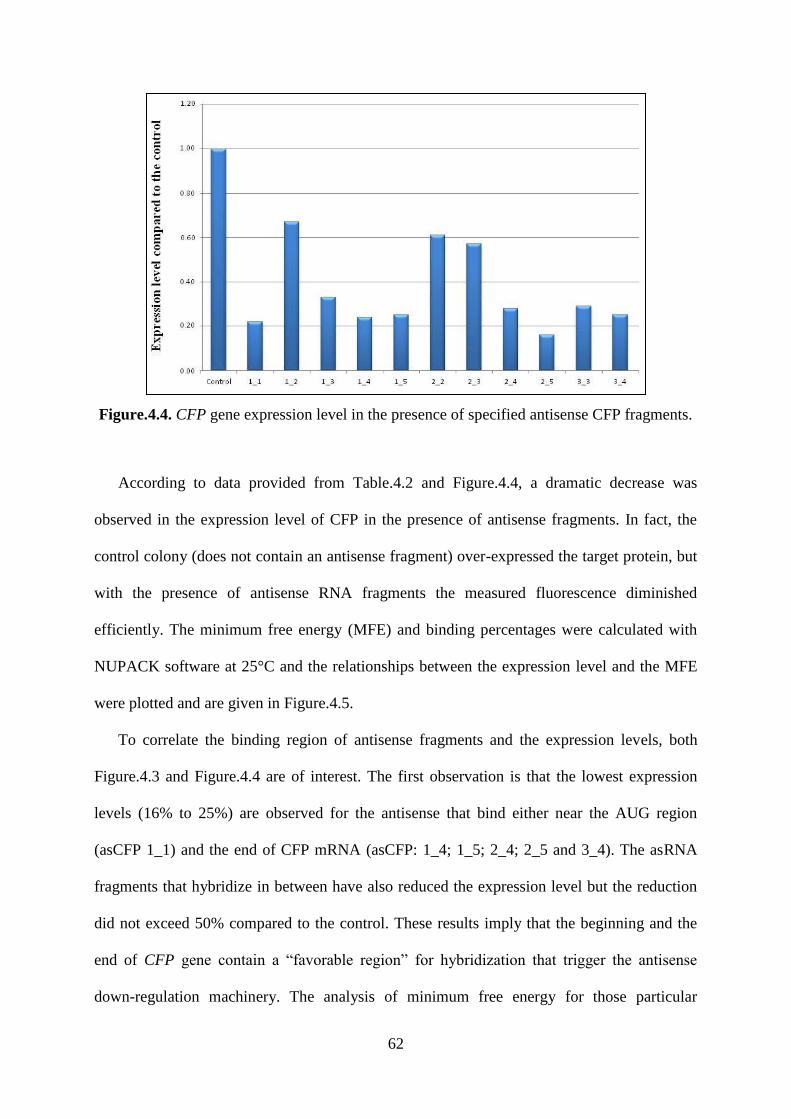
62
Figure.4.4. CFP gene expression level in the presence of specified antisense CFP fragments.
According to data provided from Table.4.2 and Figure.4.4, a dramatic decrease was
observed in the expression level of CFP in the presence of antisense fragments. In fact, the
control colony (does not contain an antisense fragment) over-expressed the target protein, but
with the presence of antisense RNA fragments the measured fluorescence diminished
efficiently. The minimum free energy (MFE) and binding percentages were calculated with
NUPACK software at 25°C and the relationships between the expression level and the MFE
were plotted and are given in Figure.4.5.
To correlate the binding region of antisense fragments and the expression levels, both
Figure.4.3 and Figure.4.4 are of interest. The first observation is that the lowest expression
levels (16% to 25%) are observed for the antisense that bind either near the AUG region
(asCFP 1_1) and the end of CFP mRNA (asCFP: 1_4; 1_5; 2_4; 2_5 and 3_4). The asRNA
fragments that hybridize in between have also reduced the expression level but the reduction
did not exceed 50% compared to the control. These results imply that the beginning and the
end of CFP gene contain a “favorable region” for hybridization that trigger the antisense
down-regulation machinery. The analysis of minimum free energy for those particular
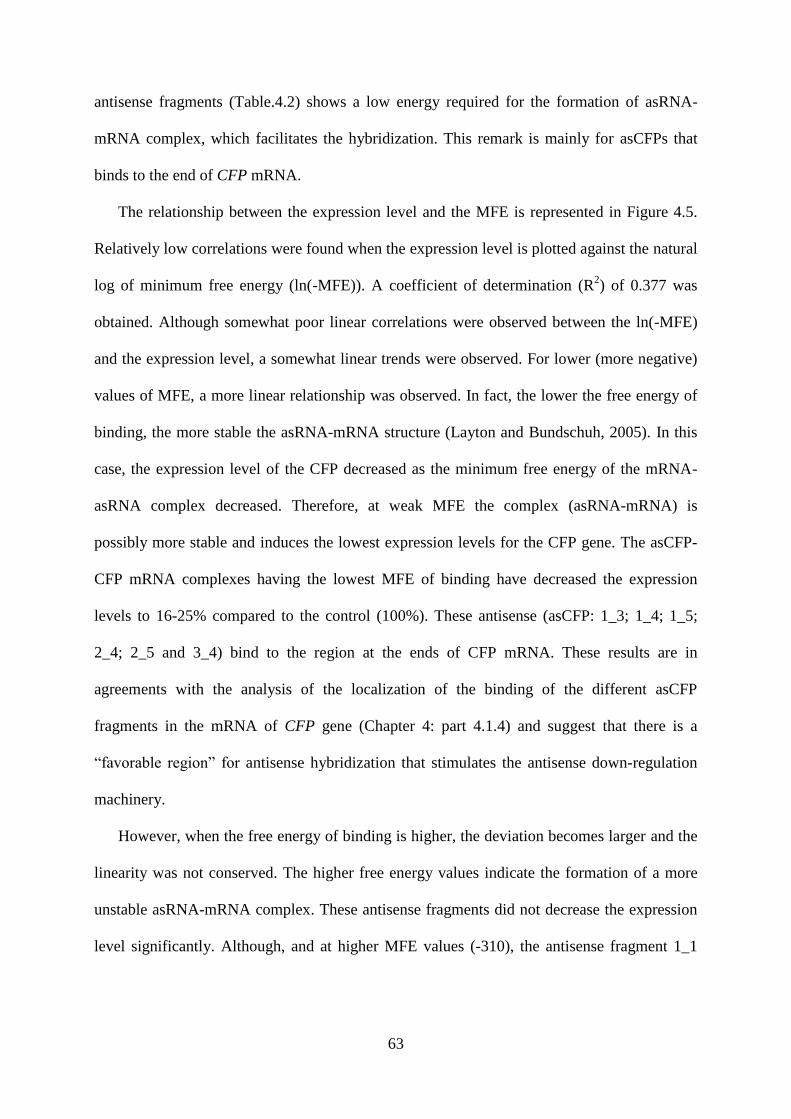
63
antisense fragments (Table.4.2) shows a low energy required for the formation of asRNA-
mRNA complex, which facilitates the hybridization. This remark is mainly for asCFPs that
binds to the end of CFP mRNA.
The relationship between the expression level and the MFE is represented in Figure 4.5.
Relatively low correlations were found when the expression level is plotted against the natural
log of minimum free energy (ln(-MFE)). A coefficient of determination (R2) of 0.377 was
obtained. Although somewhat poor linear correlations were observed between the ln(-MFE)
and the expression level, a somewhat linear trends were observed. For lower (more negative)
values of MFE, a more linear relationship was observed. In fact, the lower the free energy of
binding, the more stable the asRNA-mRNA structure (Layton and Bundschuh, 2005). In this
case, the expression level of the CFP decreased as the minimum free energy of the mRNA-
asRNA complex decreased. Therefore, at weak MFE the complex (asRNA-mRNA) is
possibly more stable and induces the lowest expression levels for the CFP gene. The asCFP-
CFP mRNA complexes having the lowest MFE of binding have decreased the expression
levels to 16-25% compared to the control (100%). These antisense (asCFP: 1_3; 1_4; 1_5;
2_4; 2_5 and 3_4) bind to the region at the ends of CFP mRNA. These results are in
agreements with the analysis of the localization of the binding of the different asCFP
fragments in the mRNA of CFP gene (Chapter 4: part 4.1.4) and suggest that there is a
“favorable region” for antisense hybridization that stimulates the antisense down-regulation
machinery.
However, when the free energy of binding is higher, the deviation becomes larger and the
linearity was not conserved. The higher free energy values indicate the formation of a more
unstable asRNA-mRNA complex. These antisense fragments did not decrease the expression
level significantly. Although, and at higher MFE values (-310), the antisense fragment 1_1
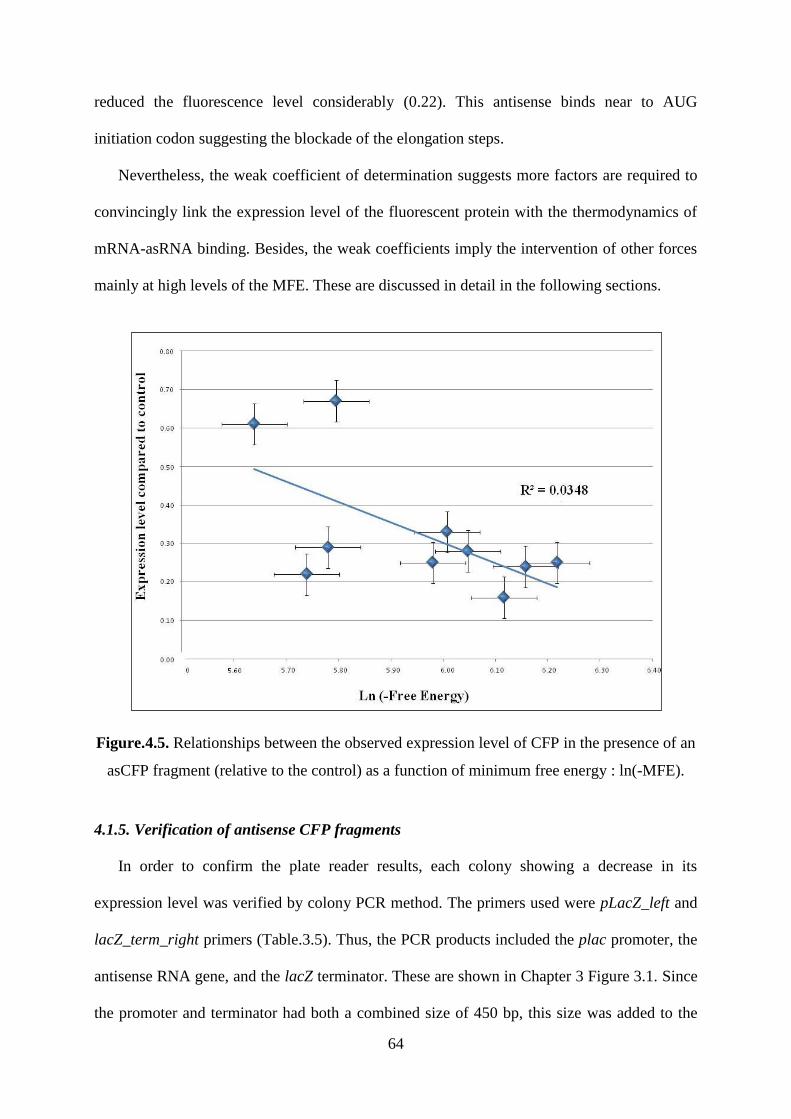
64
reduced the fluorescence level considerably (0.22). This antisense binds near to AUG
initiation codon suggesting the blockade of the elongation steps.
Nevertheless, the weak coefficient of determination suggests more factors are required to
convincingly link the expression level of the fluorescent protein with the thermodynamics of
mRNA-asRNA binding. Besides, the weak coefficients imply the intervention of other forces
mainly at high levels of the MFE. These are discussed in detail in the following sections.
Figure.4.5. Relationships between the observed expression level of CFP in the presence of an
asCFP fragment (relative to the control) as a function of minimum free energy : ln(-MFE).
4.1.5. Verification of antisense CFP fragments
In order to confirm the plate reader results, each colony showing a decrease in its
expression level was verified by colony PCR method. The primers used were pLacZ_left and
lacZ_term_right primers (Table.3.5). Thus, the PCR products included the plac promoter, the
antisense RNA gene, and the lacZ terminator. These are shown in Chapter 3 Figure 3.1. Since
the promoter and terminator had both a combined size of 450 bp, this size was added to the
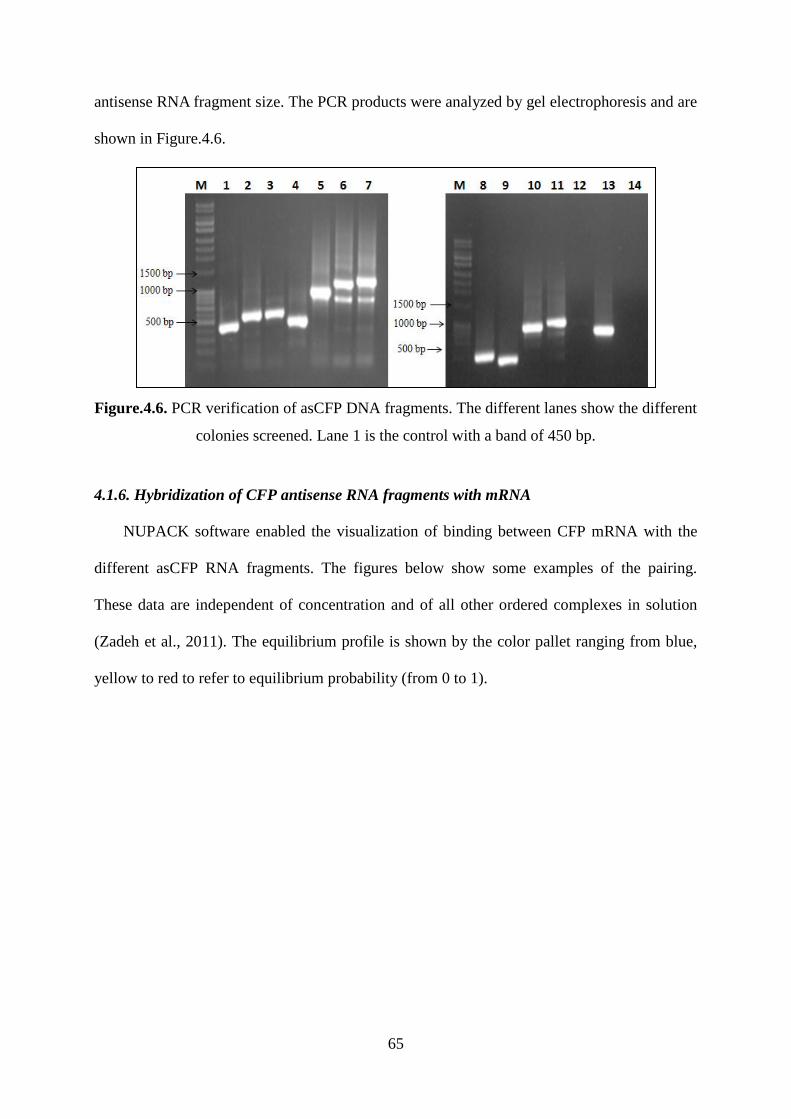
65
antisense RNA fragment size. The PCR products were analyzed by gel electrophoresis and are
shown in Figure.4.6.
Figure.4.6. PCR verification of asCFP DNA fragments. The different lanes show the different
colonies screened. Lane 1 is the control with a band of 450 bp.
4.1.6. Hybridization of CFP antisense RNA fragments with mRNA
NUPACK software enabled the visualization of binding between CFP mRNA with the
different asCFP RNA fragments. The figures below show some examples of the pairing.
These data are independent of concentration and of all other ordered complexes in solution
(Zadeh et al., 2011). The equilibrium profile is shown by the color pallet ranging from blue,
yellow to red to refer to equilibrium probability (from 0 to 1).
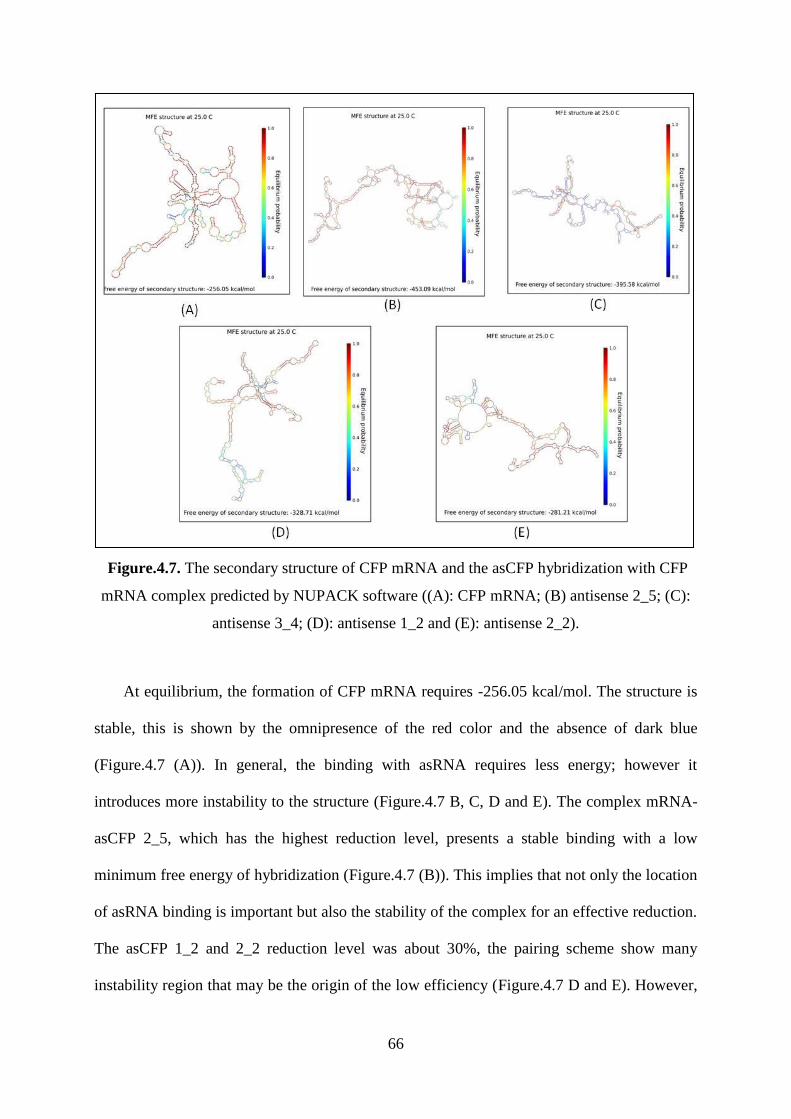
66
Figure.4.7. The secondary structure of CFP mRNA and the asCFP hybridization with CFP
mRNA complex predicted by NUPACK software ((A): CFP mRNA; (B) antisense 2_5; (C):
antisense 3_4; (D): antisense 1_2 and (E): antisense 2_2).
At equilibrium, the formation of CFP mRNA requires -256.05 kcal/mol. The structure is
stable, this is shown by the omnipresence of the red color and the absence of dark blue
(Figure.4.7 (A)). In general, the binding with asRNA requires less energy; however it
introduces more instability to the structure (Figure.4.7 B, C, D and E). The complex mRNA-
asCFP 2_5, which has the highest reduction level, presents a stable binding with a low
minimum free energy of hybridization (Figure.4.7 (B)). This implies that not only the location
of asRNA binding is important but also the stability of the complex for an effective reduction.
The asCFP 1_2 and 2_2 reduction level was about 30%, the pairing scheme show many
instability region that may be the origin of the low efficiency (Figure.4.7 D and E). However,

67
the asCFP 3_4, which reduced the expression by 75%, when it binds with CFP mRNA shows
many dark blue regions referring to low equilibrium domains (Figure.4.7 (C)). The conclusion
is that the reduction level could be related to both asRNA binding location and secondary
structure of the asRNA-mRNA complex.
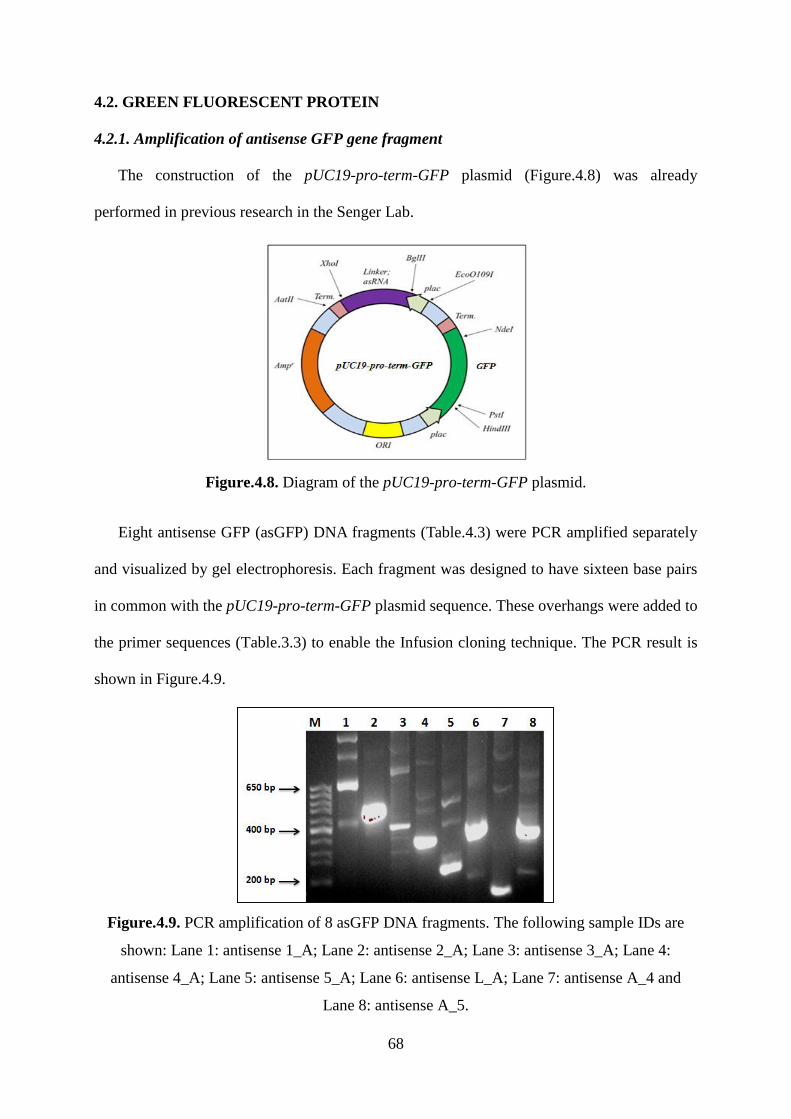
68
4.2. GREEN FLUORESCENT PROTEIN
4.2.1. Amplification of antisense GFP gene fragment
The construction of the pUC19-pro-term-GFP plasmid (Figure.4.8) was already
performed in previous research in the Senger Lab.
Figure.4.8. Diagram of the pUC19-pro-term-GFP plasmid.
Eight antisense GFP (asGFP) DNA fragments (Table.4.3) were PCR amplified separately
and visualized by gel electrophoresis. Each fragment was designed to have sixteen base pairs
in common with the pUC19-pro-term-GFP plasmid sequence. These overhangs were added to
the primer sequences (Table.3.3) to enable the Infusion cloning technique. The PCR result is
shown in Figure.4.9.
Figure.4.9. PCR amplification of 8 asGFP DNA fragments. The following sample IDs are
shown: Lane 1: antisense 1_A; Lane 2: antisense 2_A; Lane 3: antisense 3_A; Lane 4:
antisense 4_A; Lane 5: antisense 5_A; Lane 6: antisense L_A; Lane 7: antisense A_4 and
Lane 8: antisense A_5.
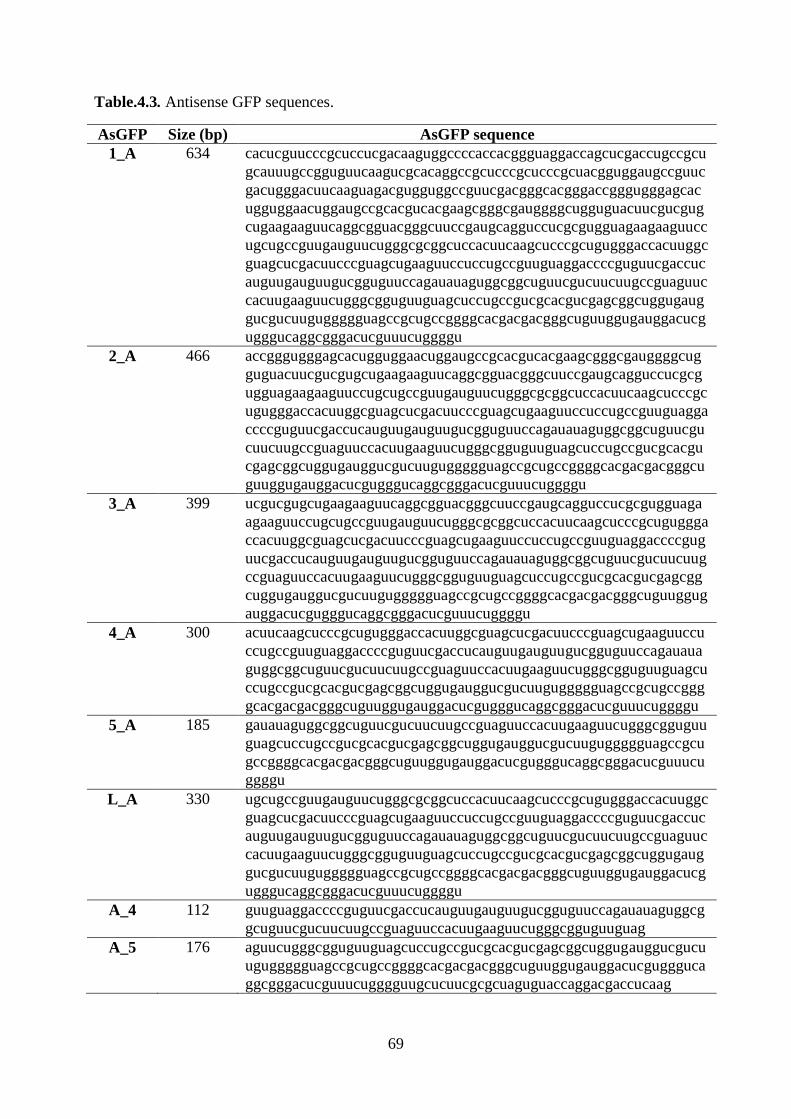
69
Table.4.3. Antisense GFP sequences.
AsGFP Size (bp) AsGFP sequence
1_A 634 cacucguucccgcuccucgacaaguggccccaccacggguaggaccagcucgaccugccgcu
gcauuugccgguguucaagucgcacaggccgcucccgcucccgcuacgguggaugccguuc
gacugggacuucaaguagacgugguggccguucgacgggcacgggaccgggugggagcac
ugguggaacuggaugccgcacgucacgaagcgggcgauggggcugguguacuucgucgug
cugaagaaguucaggcgguacgggcuuccgaugcagguccucgcgugguagaagaaguucc
ugcugccguugauguucugggcgcggcuccacuucaagcucccgcugugggaccacuuggc
guagcucgacuucccguagcugaaguuccuccugccguuguaggaccccguguucgaccuc
auguugauguugucgguguuccagauauaguggcggcuguucgucuucuugccguaguuc
cacuugaaguucugggcgguguuguagcuccugccgucgcacgucgagcggcuggugaug
gucgucuuguggggguagccgcugccggggcacgacgacgggcuguuggugauggacucg
ugggucaggcgggacucguuucuggggu
2_A 466 accgggugggagcacugguggaacuggaugccgcacgucacgaagcgggcgauggggcug
guguacuucgucgugcugaagaaguucaggcgguacgggcuuccgaugcagguccucgcg
ugguagaagaaguuccugcugccguugauguucugggcgcggcuccacuucaagcucccgc
ugugggaccacuuggcguagcucgacuucccguagcugaaguuccuccugccguuguagga
ccccguguucgaccucauguugauguugucgguguuccagauauaguggcggcuguucgu
cuucuugccguaguuccacuugaaguucugggcgguguuguagcuccugccgucgcacgu
cgagcggcuggugauggucgucuuguggggguagccgcugccggggcacgacgacgggcu
guuggugauggacucgugggucaggcgggacucguuucuggggu
3_A 399 ucgucgugcugaagaaguucaggcgguacgggcuuccgaugcagguccucgcgugguaga
agaaguuccugcugccguugauguucugggcgcggcuccacuucaagcucccgcuguggga
ccacuuggcguagcucgacuucccguagcugaaguuccuccugccguuguaggaccccgug
uucgaccucauguugauguugucgguguuccagauauaguggcggcuguucgucuucuug
ccguaguuccacuugaaguucugggcgguguuguagcuccugccgucgcacgucgagcgg
cuggugauggucgucuuguggggguagccgcugccggggcacgacgacgggcuguuggug
auggacucgugggucaggcgggacucguuucuggggu
4_A 300 acuucaagcucccgcugugggaccacuuggcguagcucgacuucccguagcugaaguuccu
ccugccguuguaggaccccguguucgaccucauguugauguugucgguguuccagauaua
guggcggcuguucgucuucuugccguaguuccacuugaaguucugggcgguguuguagcu
ccugccgucgcacgucgagcggcuggugauggucgucuuguggggguagccgcugccggg
gcacgacgacgggcuguuggugauggacucgugggucaggcgggacucguuucuggggu
5_A 185 gauauaguggcggcuguucgucuucuugccguaguuccacuugaaguucugggcgguguu
guagcuccugccgucgcacgucgagcggcuggugauggucgucuuguggggguagccgcu
gccggggcacgacgacgggcuguuggugauggacucgugggucaggcgggacucguuucu
ggggu
L_A 330 ugcugccguugauguucugggcgcggcuccacuucaagcucccgcugugggaccacuuggc
guagcucgacuucccguagcugaaguuccuccugccguuguaggaccccguguucgaccuc
auguugauguugucgguguuccagauauaguggcggcuguucgucuucuugccguaguuc
cacuugaaguucugggcgguguuguagcuccugccgucgcacgucgagcggcuggugaug
gucgucuuguggggguagccgcugccggggcacgacgacgggcuguuggugauggacucg
ugggucaggcgggacucguuucuggggu
A_4 112 guuguaggaccccguguucgaccucauguugauguugucgguguuccagauauaguggcg
gcuguucgucuucuugccguaguuccacuugaaguucugggcgguguuguag
A_5 176 aguucugggcgguguuguagcuccugccgucgcacgucgagcggcuggugauggucgucu
uguggggguagccgcugccggggcacgacgacgggcuguuggugauggacucguggguca
ggcgggacucguuucugggguugcucuucgcgcuaguguaccaggacgaccucaag
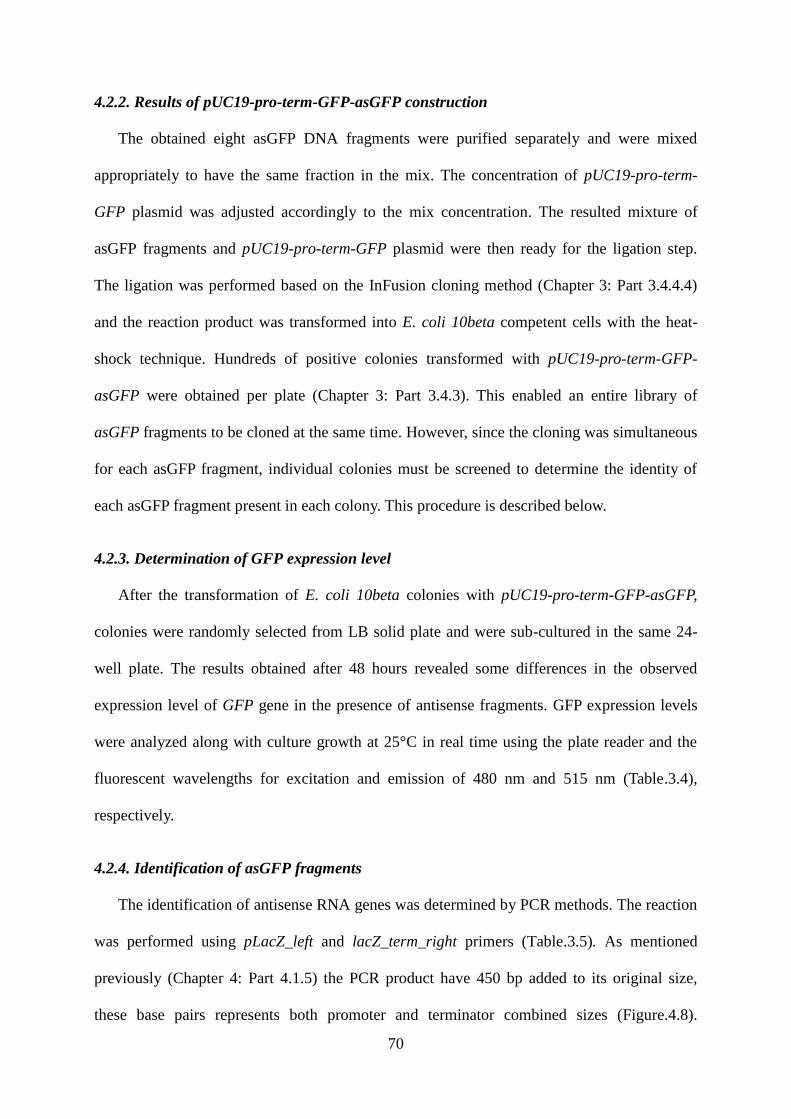
70
4.2.2. Results of pUC19-pro-term-GFP-asGFP construction
The obtained eight asGFP DNA fragments were purified separately and were mixed
appropriately to have the same fraction in the mix. The concentration of pUC19-pro-term-
GFP plasmid was adjusted accordingly to the mix concentration. The resulted mixture of
asGFP fragments and pUC19-pro-term-GFP plasmid were then ready for the ligation step.
The ligation was performed based on the InFusion cloning method (Chapter 3: Part 3.4.4.4)
and the reaction product was transformed into E. coli 10beta competent cells with the heat-
shock technique. Hundreds of positive colonies transformed with pUC19-pro-term-GFP-
asGFP were obtained per plate (Chapter 3: Part 3.4.3). This enabled an entire library of
asGFP fragments to be cloned at the same time. However, since the cloning was simultaneous
for each asGFP fragment, individual colonies must be screened to determine the identity of
each asGFP fragment present in each colony. This procedure is described below.
4.2.3. Determination of GFP expression level
After the transformation of E. coli 10beta colonies with pUC19-pro-term-GFP-asGFP,
colonies were randomly selected from LB solid plate and were sub-cultured in the same 24-
well plate. The results obtained after 48 hours revealed some differences in the observed
expression level of GFP gene in the presence of antisense fragments. GFP expression levels
were analyzed along with culture growth at 25°C in real time using the plate reader and the
fluorescent wavelengths for excitation and emission of 480 nm and 515 nm (Table.3.4),
respectively.
4.2.4. Identification of asGFP fragments
The identification of antisense RNA genes was determined by PCR methods. The reaction
was performed using pLacZ_left and lacZ_term_right primers (Table.3.5). As mentioned
previously (Chapter 4: Part 4.1.5) the PCR product have 450 bp added to its original size,
these base pairs represents both promoter and terminator combined sizes (Figure.4.8).
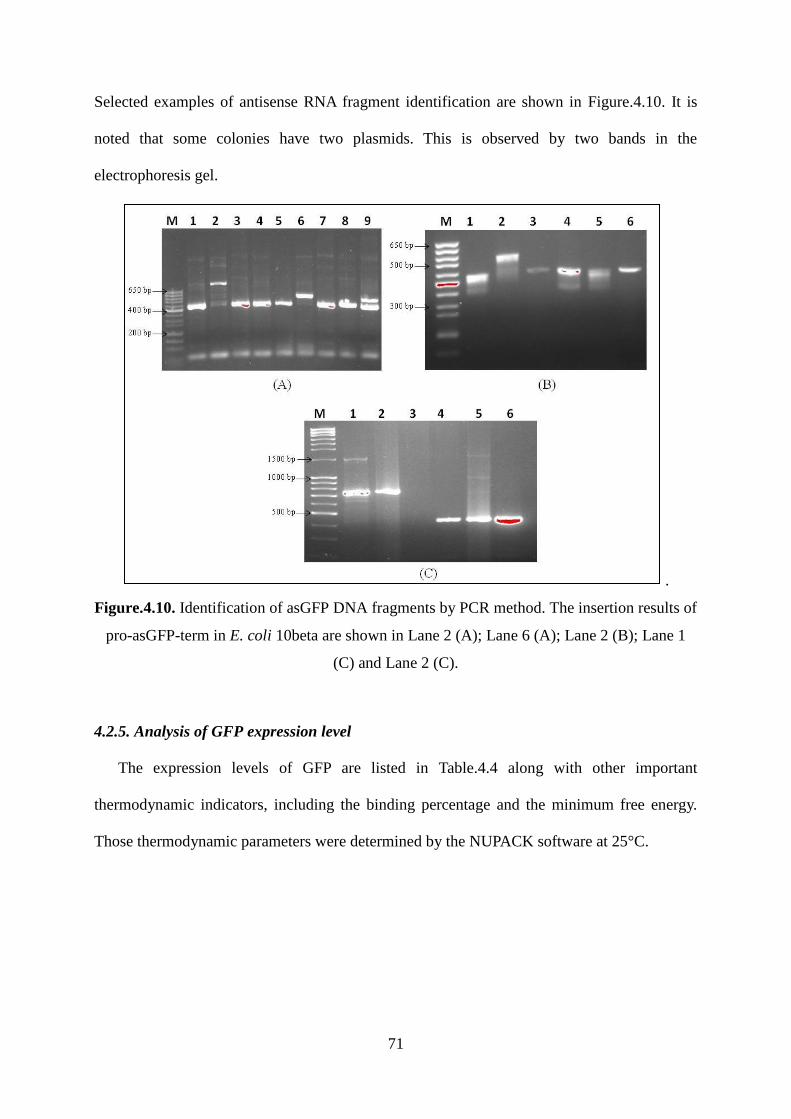
71
Selected examples of antisense RNA fragment identification are shown in Figure.4.10. It is
noted that some colonies have two plasmids. This is observed by two bands in the
electrophoresis gel.
.
Figure.4.10. Identification of asGFP DNA fragments by PCR method. The insertion results of
pro-asGFP-term in E. coli 10beta are shown in Lane 2 (A); Lane 6 (A); Lane 2 (B); Lane 1
(C) and Lane 2 (C).
4.2.5. Analysis of GFP expression level
The expression levels of GFP are listed in Table.4.4 along with other important
thermodynamic indicators, including the binding percentage and the minimum free energy.
Those thermodynamic parameters were determined by the NUPACK software at 25°C.
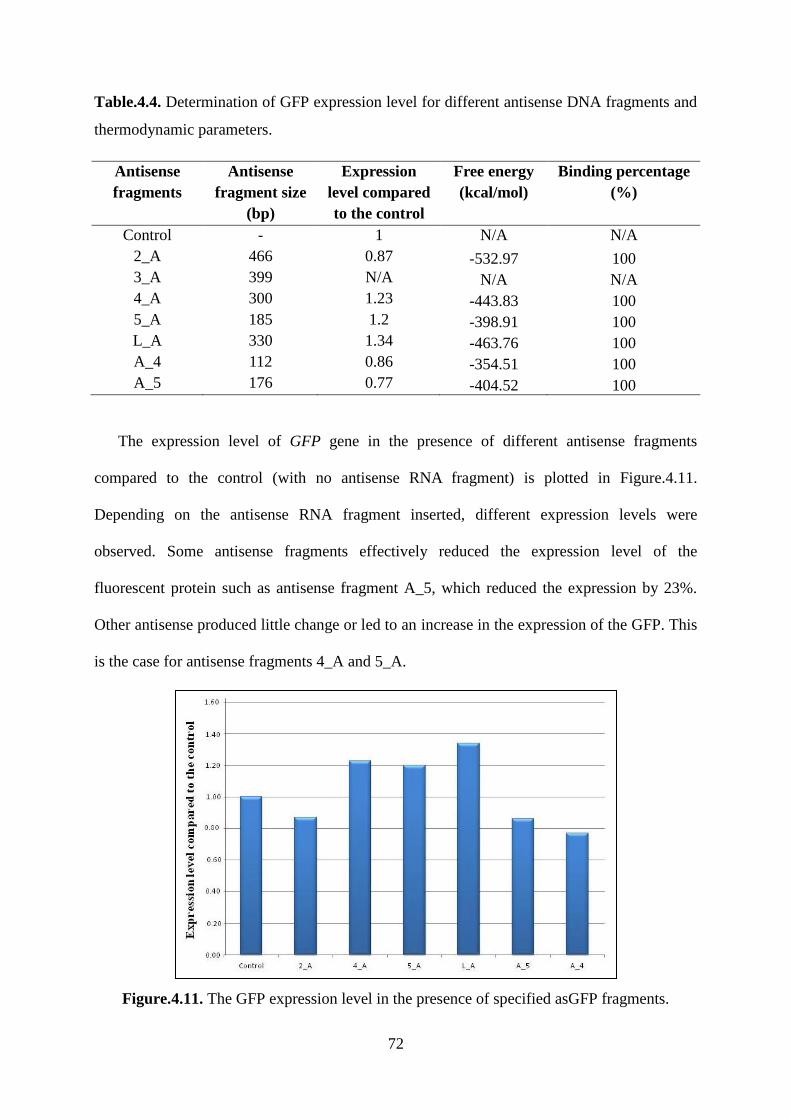
72
Table.4.4. Determination of GFP expression level for different antisense DNA fragments and
thermodynamic parameters.
Antisense
fragments
Antisense
fragment size
(bp)
Expression
level compared
to the control
Free energy
(kcal/mol)
Binding percentage
(%)
Control - 1 N/A N/A
2_A 466 0.87 -532.97 100
3_A 399 N/A N/A N/A
4_A 300 1.23 -443.83 100
5_A 185 1.2 -398.91 100
L_A 330 1.34 -463.76 100
A_4 112 0.86 -354.51 100
A_5 176 0.77 -404.52 100
The expression level of GFP gene in the presence of different antisense fragments
compared to the control (with no antisense RNA fragment) is plotted in Figure.4.11.
Depending on the antisense RNA fragment inserted, different expression levels were
observed. Some antisense fragments effectively reduced the expression level of the
fluorescent protein such as antisense fragment A_5, which reduced the expression by 23%.
Other antisense produced little change or led to an increase in the expression of the GFP. This
is the case for antisense fragments 4_A and 5_A.
Figure.4.11. The GFP expression level in the presence of specified asGFP fragments.
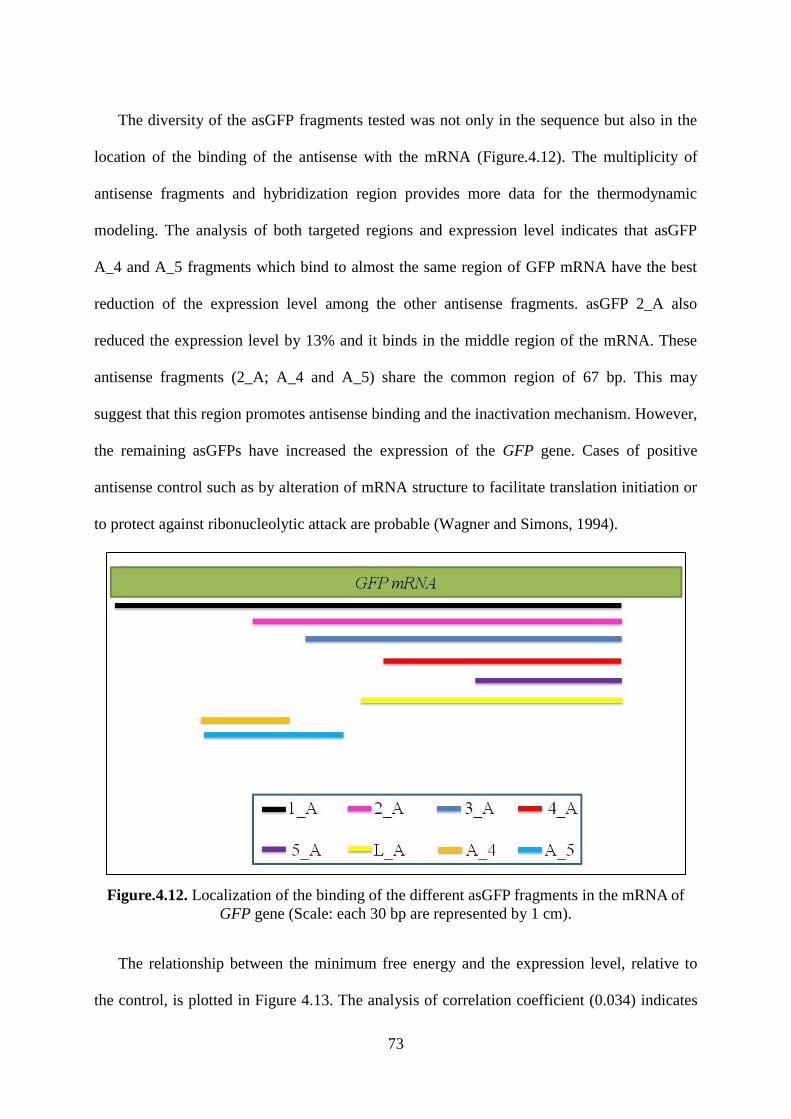
73
The diversity of the asGFP fragments tested was not only in the sequence but also in the
location of the binding of the antisense with the mRNA (Figure.4.12). The multiplicity of
antisense fragments and hybridization region provides more data for the thermodynamic
modeling. The analysis of both targeted regions and expression level indicates that asGFP
A_4 and A_5 fragments which bind to almost the same region of GFP mRNA have the best
reduction of the expression level among the other antisense fragments. asGFP 2_A also
reduced the expression level by 13% and it binds in the middle region of the mRNA. These
antisense fragments (2_A; A_4 and A_5) share the common region of 67 bp. This may
suggest that this region promotes antisense binding and the inactivation mechanism. However,
the remaining asGFPs have increased the expression of the GFP gene. Cases of positive
antisense control such as by alteration of mRNA structure to facilitate translation initiation or
to protect against ribonucleolytic attack are probable (Wagner and Simons, 1994).
Figure.4.12. Localization of the binding of the different asGFP fragments in the mRNA of
GFP gene (Scale: each 30 bp are represented by 1 cm).
The relationship between the minimum free energy and the expression level, relative to
the control, is plotted in Figure 4.13. The analysis of correlation coefficient (0.034) indicates
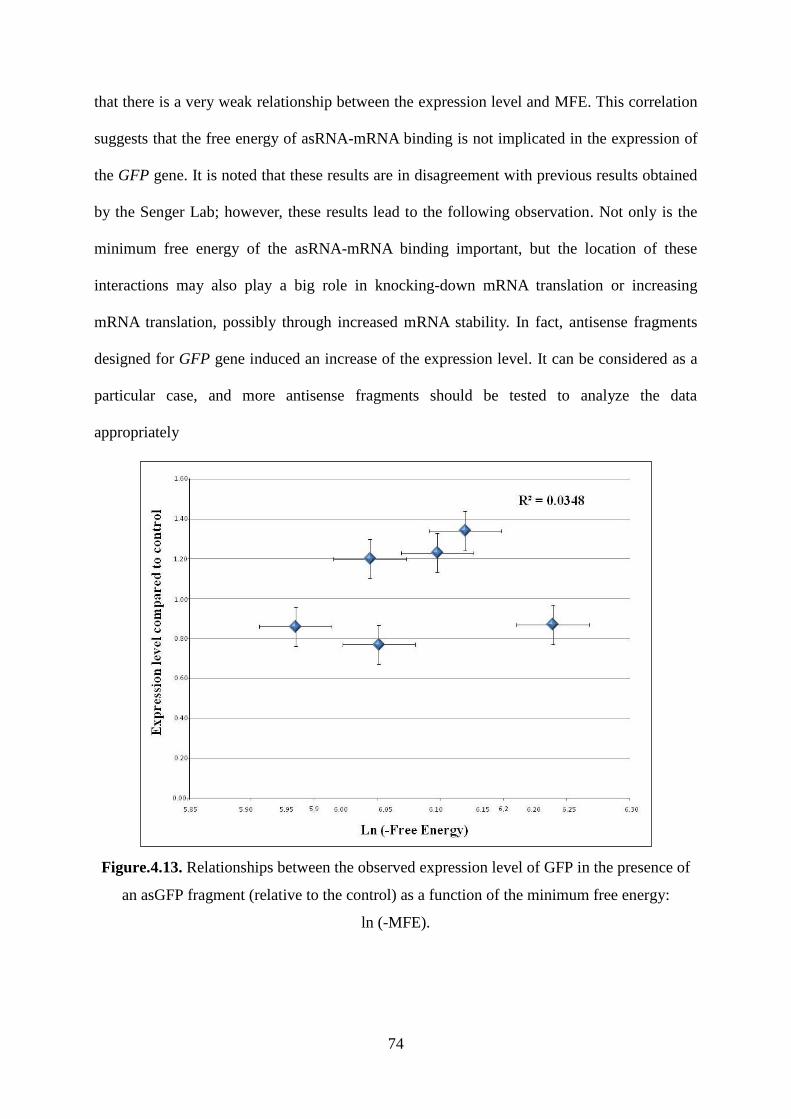
74
that there is a very weak relationship between the expression level and MFE. This correlation
suggests that the free energy of asRNA-mRNA binding is not implicated in the expression of
the GFP gene. It is noted that these results are in disagreement with previous results obtained
by the Senger Lab; however, these results lead to the following observation. Not only is the
minimum free energy of the asRNA-mRNA binding important, but the location of these
interactions may also play a big role in knocking-down mRNA translation or increasing
mRNA translation, possibly through increased mRNA stability. In fact, antisense fragments
designed for GFP gene induced an increase of the expression level. It can be considered as a
particular case, and more antisense fragments should be tested to analyze the data
appropriately
Figure.4.13. Relationships between the observed expression level of GFP in the presence of
an asGFP fragment (relative to the control) as a function of the minimum free energy:
ln (-MFE).
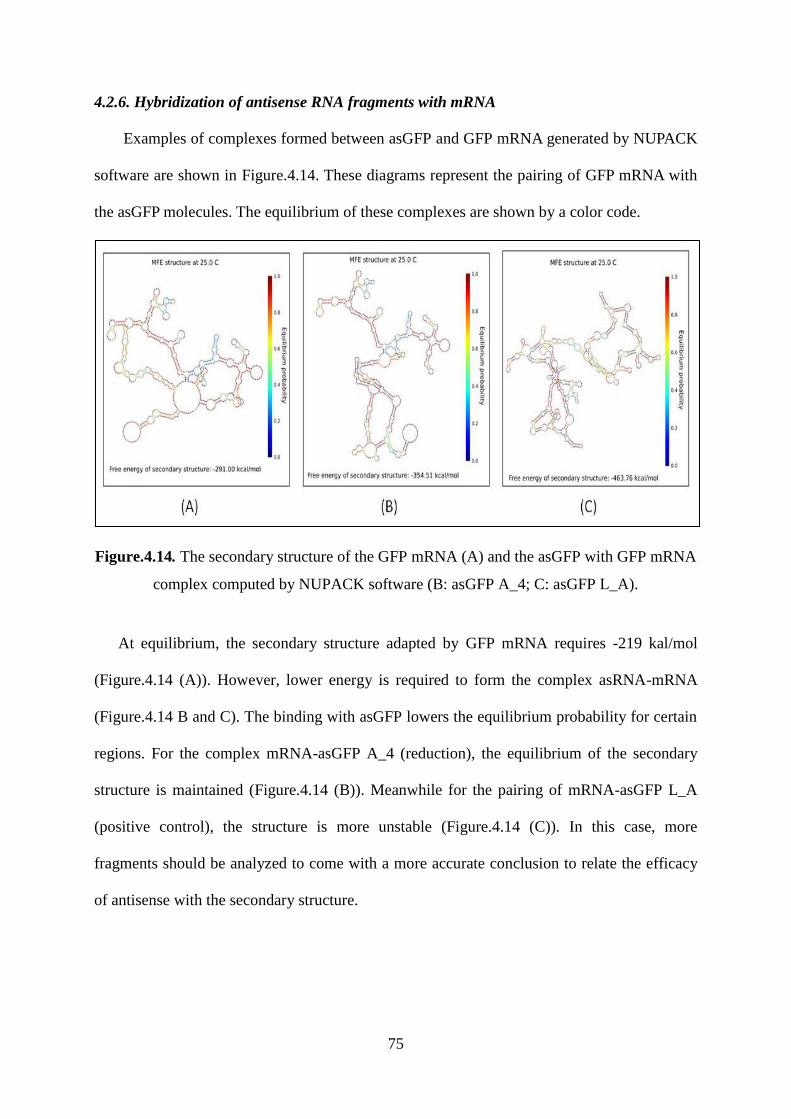
75
4.2.6. Hybridization of antisense RNA fragments with mRNA
Examples of complexes formed between asGFP and GFP mRNA generated by NUPACK
software are shown in Figure.4.14. These diagrams represent the pairing of GFP mRNA with
the asGFP molecules. The equilibrium of these complexes are shown by a color code.
Figure.4.14. The secondary structure of the GFP mRNA (A) and the asGFP with GFP mRNA
complex computed by NUPACK software (B: asGFP A_4; C: asGFP L_A).
At equilibrium, the secondary structure adapted by GFP mRNA requires -219 kal/mol
(Figure.4.14 (A)). However, lower energy is required to form the complex asRNA-mRNA
(Figure.4.14 B and C). The binding with asGFP lowers the equilibrium probability for certain
regions. For the complex mRNA-asGFP A_4 (reduction), the equilibrium of the secondary
structure is maintained (Figure.4.14 (B)). Meanwhile for the pairing of mRNA-asGFP L_A
(positive control), the structure is more unstable (Figure.4.14 (C)). In this case, more
fragments should be analyzed to come with a more accurate conclusion to relate the efficacy
of antisense with the secondary structure.
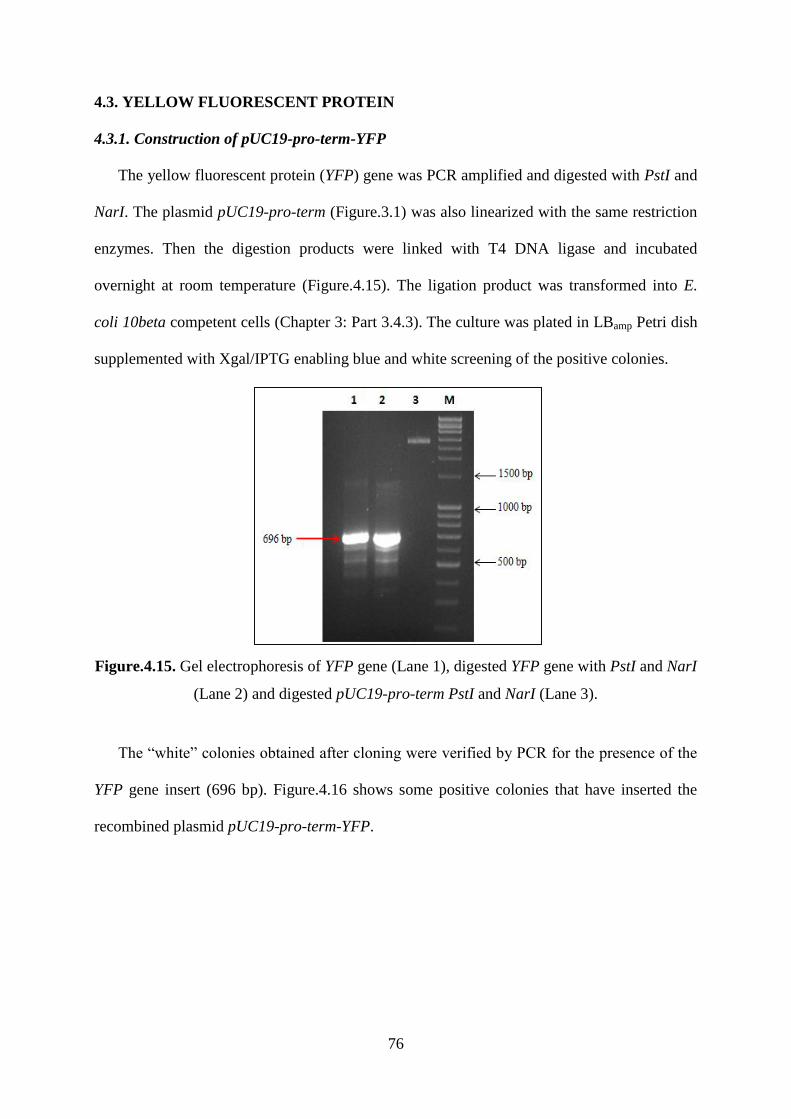
76
4.3. YELLOW FLUORESCENT PROTEIN
4.3.1. Construction of pUC19-pro-term-YFP
The yellow fluorescent protein (YFP) gene was PCR amplified and digested with PstI and
NarI. The plasmid pUC19-pro-term (Figure.3.1) was also linearized with the same restriction
enzymes. Then the digestion products were linked with T4 DNA ligase and incubated
overnight at room temperature (Figure.4.15). The ligation product was transformed into E.
coli 10beta competent cells (Chapter 3: Part 3.4.3). The culture was plated in LBamp Petri dish
supplemented with Xgal/IPTG enabling blue and white screening of the positive colonies.
Figure.4.15. Gel electrophoresis of YFP gene (Lane 1), digested YFP gene with PstI and NarI
(Lane 2) and digested pUC19-pro-term PstI and NarI (Lane 3).
The “white” colonies obtained after cloning were verified by PCR for the presence of the
YFP gene insert (696 bp). Figure.4.16 shows some positive colonies that have inserted the
recombined plasmid pUC19-pro-term-YFP.
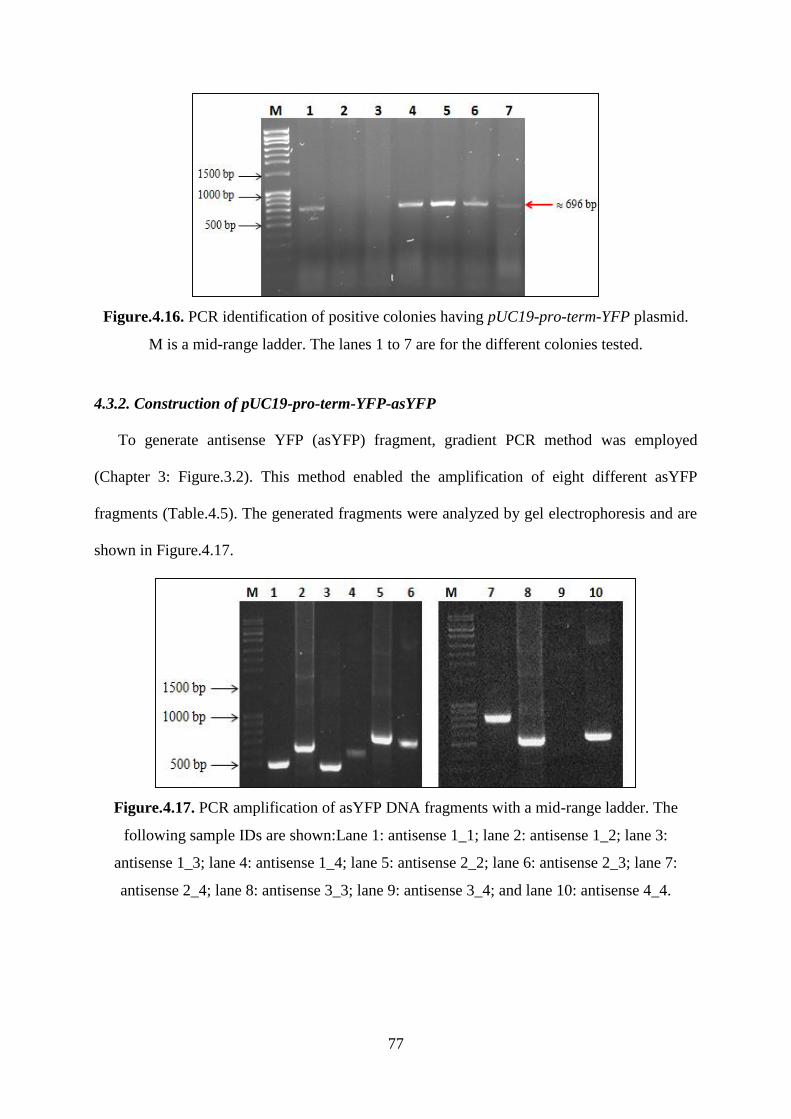
77
Figure.4.16. PCR identification of positive colonies having pUC19-pro-term-YFP plasmid.
M is a mid-range ladder. The lanes 1 to 7 are for the different colonies tested.
4.3.2. Construction of pUC19-pro-term-YFP-asYFP
To generate antisense YFP (asYFP) fragment, gradient PCR method was employed
(Chapter 3: Figure.3.2). This method enabled the amplification of eight different asYFP
fragments (Table.4.5). The generated fragments were analyzed by gel electrophoresis and are
shown in Figure.4.17.
Figure.4.17. PCR amplification of asYFP DNA fragments with a mid-range ladder. The
following sample IDs are shown:Lane 1: antisense 1_1; lane 2: antisense 1_2; lane 3:
antisense 1_3; lane 4: antisense 1_4; lane 5: antisense 2_2; lane 6: antisense 2_3; lane 7:
antisense 2_4; lane 8: antisense 3_3; lane 9: antisense 3_4; and lane 10: antisense 4_4.
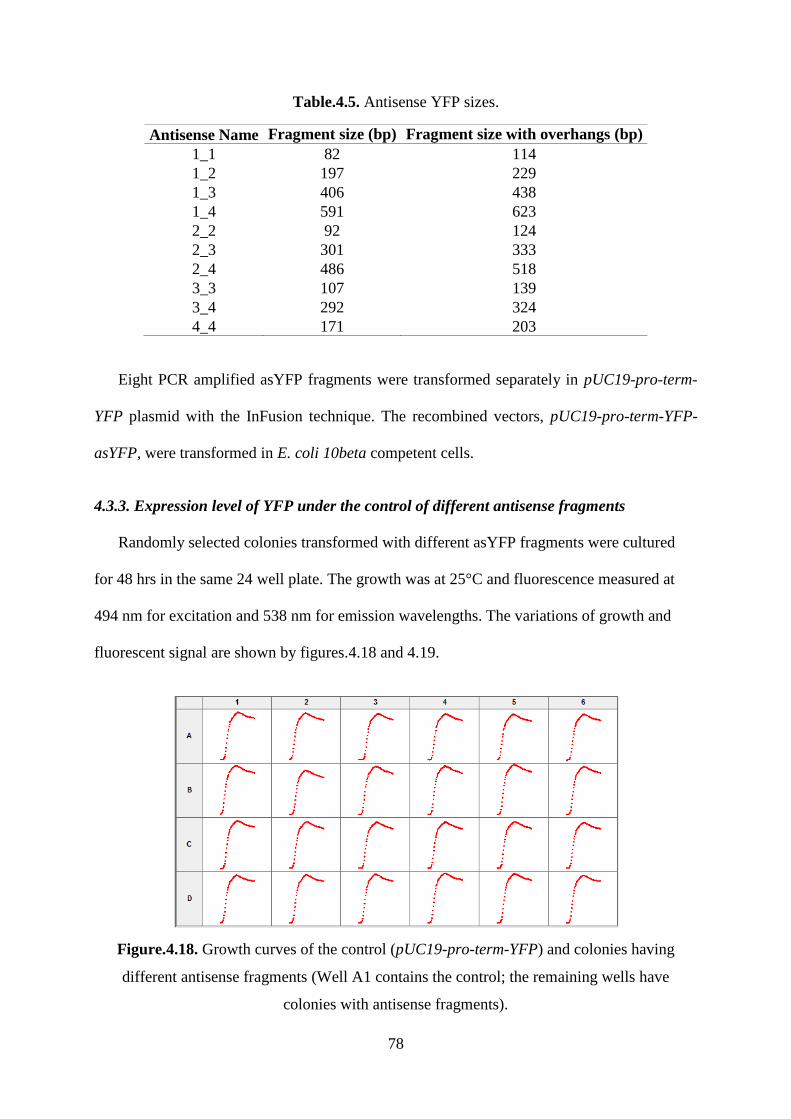
78
Table.4.5. Antisense YFP sizes.
Antisense Name Fragment size (bp) Fragment size with overhangs (bp)
1_1 82 114
1_2 197 229
1_3 406 438
1_4 591 623
2_2 92 124
2_3 301 333
2_4 486 518
3_3 107 139
3_4 292 324
4_4 171 203
Eight PCR amplified asYFP fragments were transformed separately in pUC19-pro-term-
YFP plasmid with the InFusion technique. The recombined vectors, pUC19-pro-term-YFP-
asYFP, were transformed in E. coli 10beta competent cells.
4.3.3. Expression level of YFP under the control of different antisense fragments
Randomly selected colonies transformed with different asYFP fragments were cultured
for 48 hrs in the same 24 well plate. The growth was at 25°C and fluorescence measured at
494 nm for excitation and 538 nm for emission wavelengths. The variations of growth and
fluorescent signal are shown by figures.4.18 and 4.19.
Figure.4.18. Growth curves of the control (pUC19-pro-term-YFP) and colonies having
different antisense fragments (Well A1 contains the control; the remaining wells have
colonies with antisense fragments).
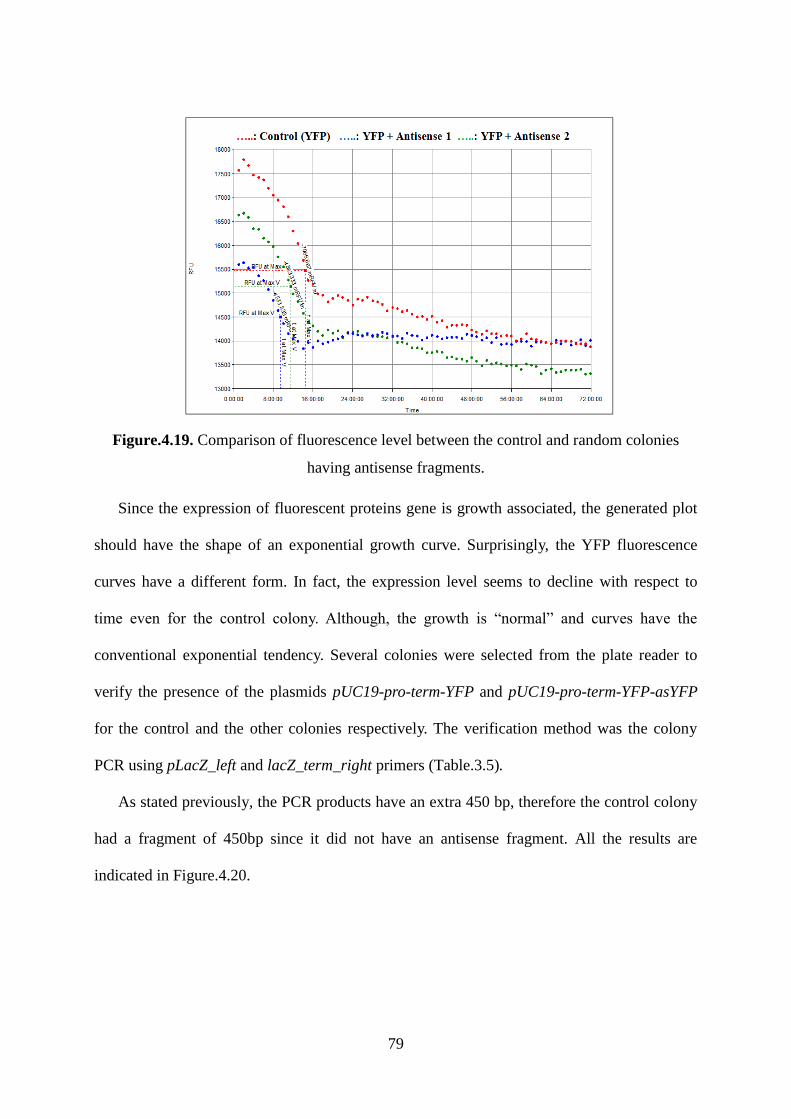
79
Figure.4.19. Comparison of fluorescence level between the control and random colonies
having antisense fragments.
Since the expression of fluorescent proteins gene is growth associated, the generated plot
should have the shape of an exponential growth curve. Surprisingly, the YFP fluorescence
curves have a different form. In fact, the expression level seems to decline with respect to
time even for the control colony. Although, the growth is “normal” and curves have the
conventional exponential tendency. Several colonies were selected from the plate reader to
verify the presence of the plasmids pUC19-pro-term-YFP and pUC19-pro-term-YFP-asYFP
for the control and the other colonies respectively. The verification method was the colony
PCR using pLacZ_left and lacZ_term_right primers (Table.3.5).
As stated previously, the PCR products have an extra 450 bp, therefore the control colony
had a fragment of 450bp since it did not have an antisense fragment. All the results are
indicated in Figure.4.20.
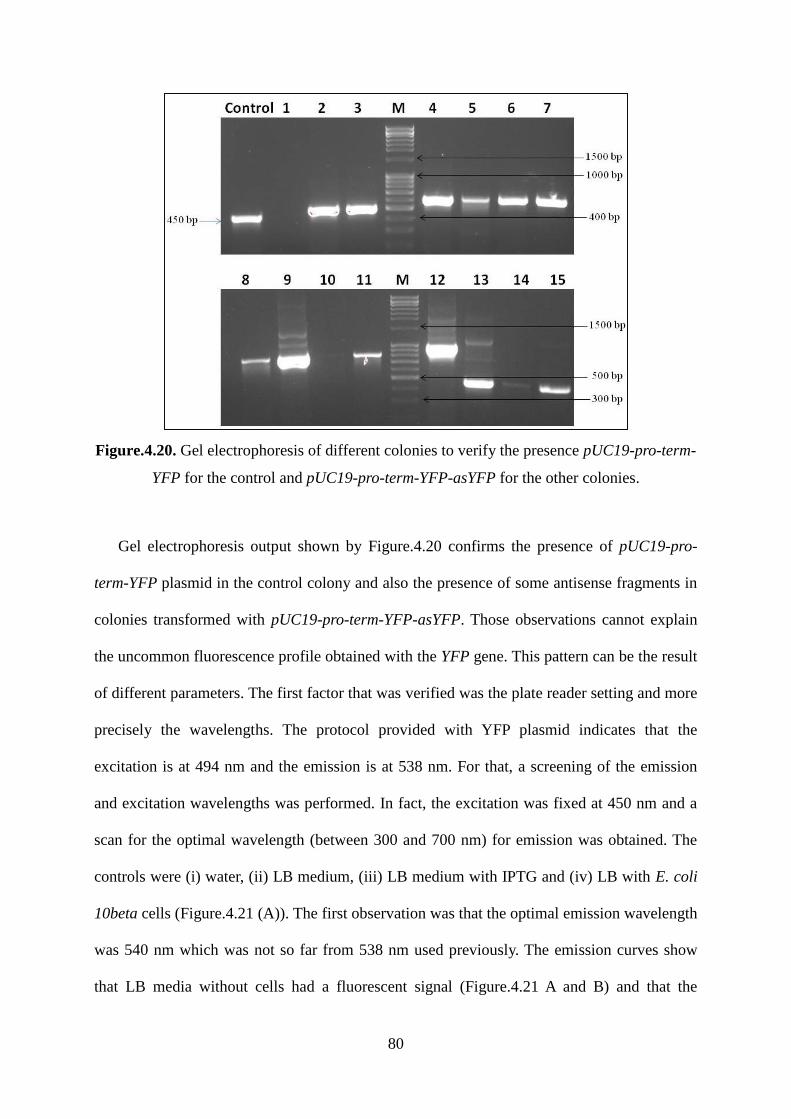
80
Figure.4.20. Gel electrophoresis of different colonies to verify the presence pUC19-pro-term-
YFP for the control and pUC19-pro-term-YFP-asYFP for the other colonies.
Gel electrophoresis output shown by Figure.4.20 confirms the presence of pUC19-pro-
term-YFP plasmid in the control colony and also the presence of some antisense fragments in
colonies transformed with pUC19-pro-term-YFP-asYFP. Those observations cannot explain
the uncommon fluorescence profile obtained with the YFP gene. This pattern can be the result
of different parameters. The first factor that was verified was the plate reader setting and more
precisely the wavelengths. The protocol provided with YFP plasmid indicates that the
excitation is at 494 nm and the emission is at 538 nm. For that, a screening of the emission
and excitation wavelengths was performed. In fact, the excitation was fixed at 450 nm and a
scan for the optimal wavelength (between 300 and 700 nm) for emission was obtained. The
controls were (i) water, (ii) LB medium, (iii) LB medium with IPTG and (iv) LB with E. coli
10beta cells (Figure.4.21 (A)). The first observation was that the optimal emission wavelength
was 540 nm which was not so far from 538 nm used previously. The emission curves show
that LB media without cells had a fluorescent signal (Figure.4.21 A and B) and that the
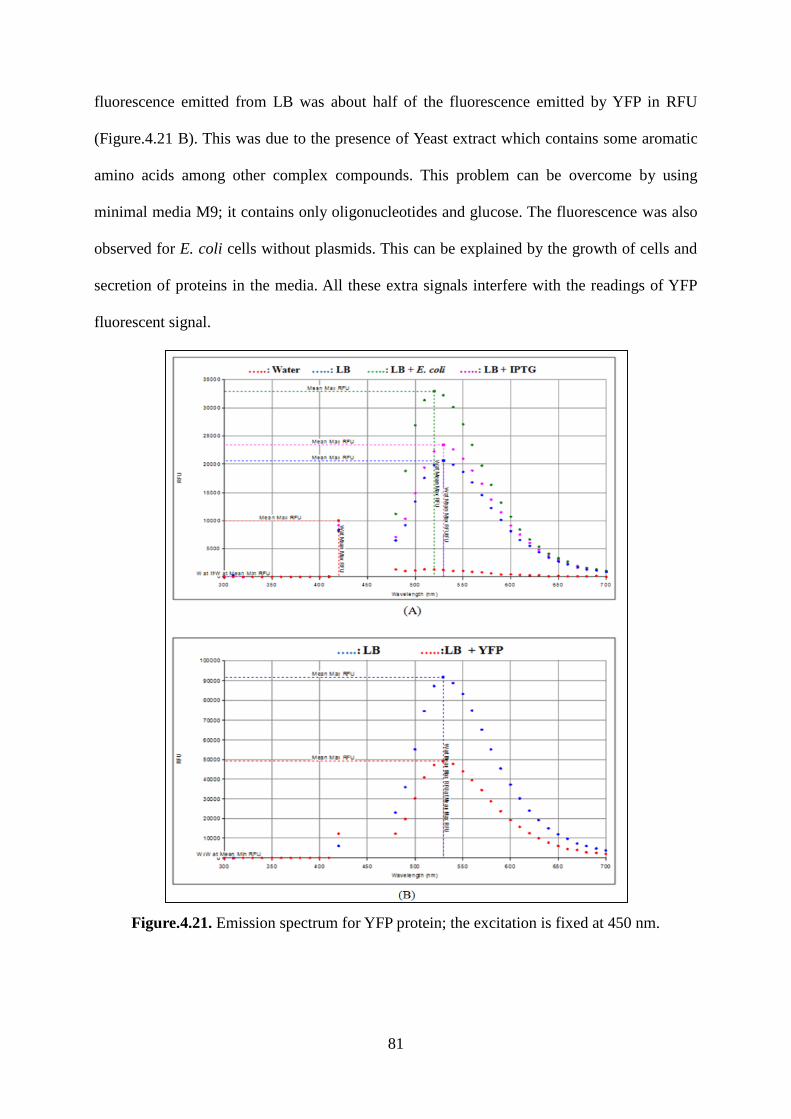
81
fluorescence emitted from LB was about half of the fluorescence emitted by YFP in RFU
(Figure.4.21 B). This was due to the presence of Yeast extract which contains some aromatic
amino acids among other complex compounds. This problem can be overcome by using
minimal media M9; it contains only oligonucleotides and glucose. The fluorescence was also
observed for E. coli cells without plasmids. This can be explained by the growth of cells and
secretion of proteins in the media. All these extra signals interfere with the readings of YFP
fluorescent signal.
Figure.4.21. Emission spectrum for YFP protein; the excitation is fixed at 450 nm.
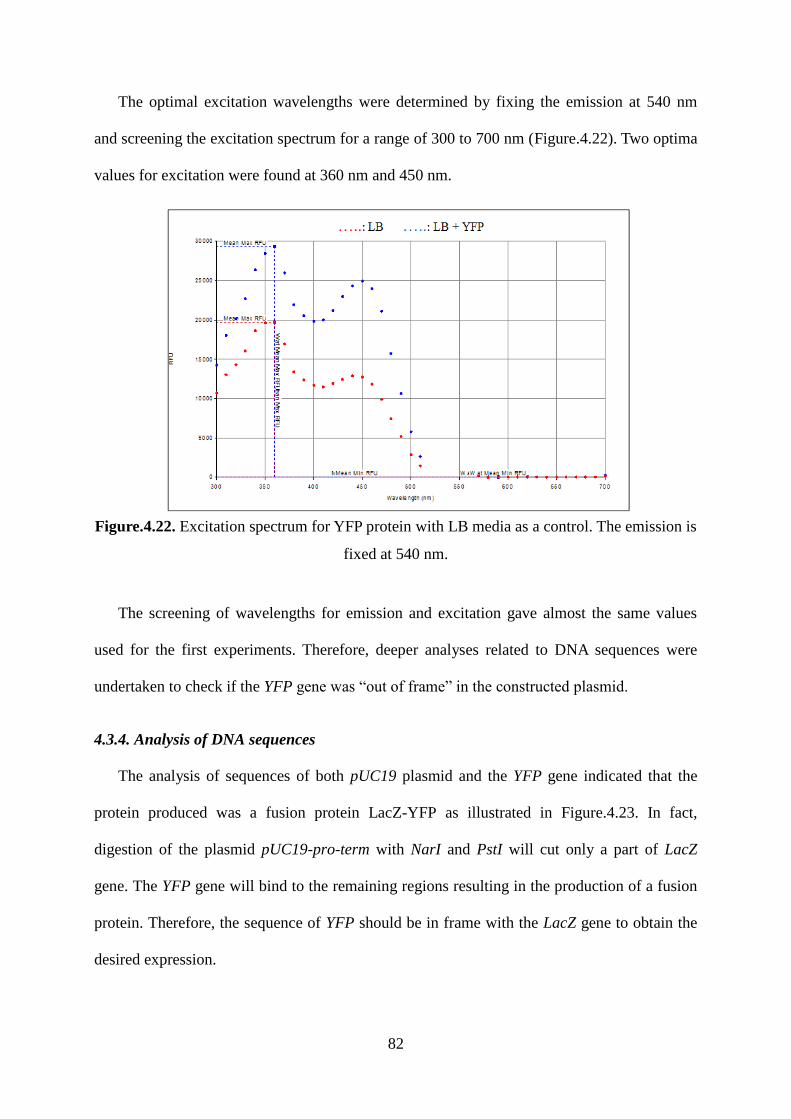
82
The optimal excitation wavelengths were determined by fixing the emission at 540 nm
and screening the excitation spectrum for a range of 300 to 700 nm (Figure.4.22). Two optima
values for excitation were found at 360 nm and 450 nm.
Figure.4.22. Excitation spectrum for YFP protein with LB media as a control. The emission is
fixed at 540 nm.
The screening of wavelengths for emission and excitation gave almost the same values
used for the first experiments. Therefore, deeper analyses related to DNA sequences were
undertaken to check if the YFP gene was “out of frame” in the constructed plasmid.
4.3.4. Analysis of DNA sequences
The analysis of sequences of both pUC19 plasmid and the YFP gene indicated that the
protein produced was a fusion protein LacZ-YFP as illustrated in Figure.4.23. In fact,
digestion of the plasmid pUC19-pro-term with NarI and PstI will cut only a part of LacZ
gene. The YFP gene will bind to the remaining regions resulting in the production of a fusion
protein. Therefore, the sequence of YFP should be in frame with the LacZ gene to obtain the
desired expression.
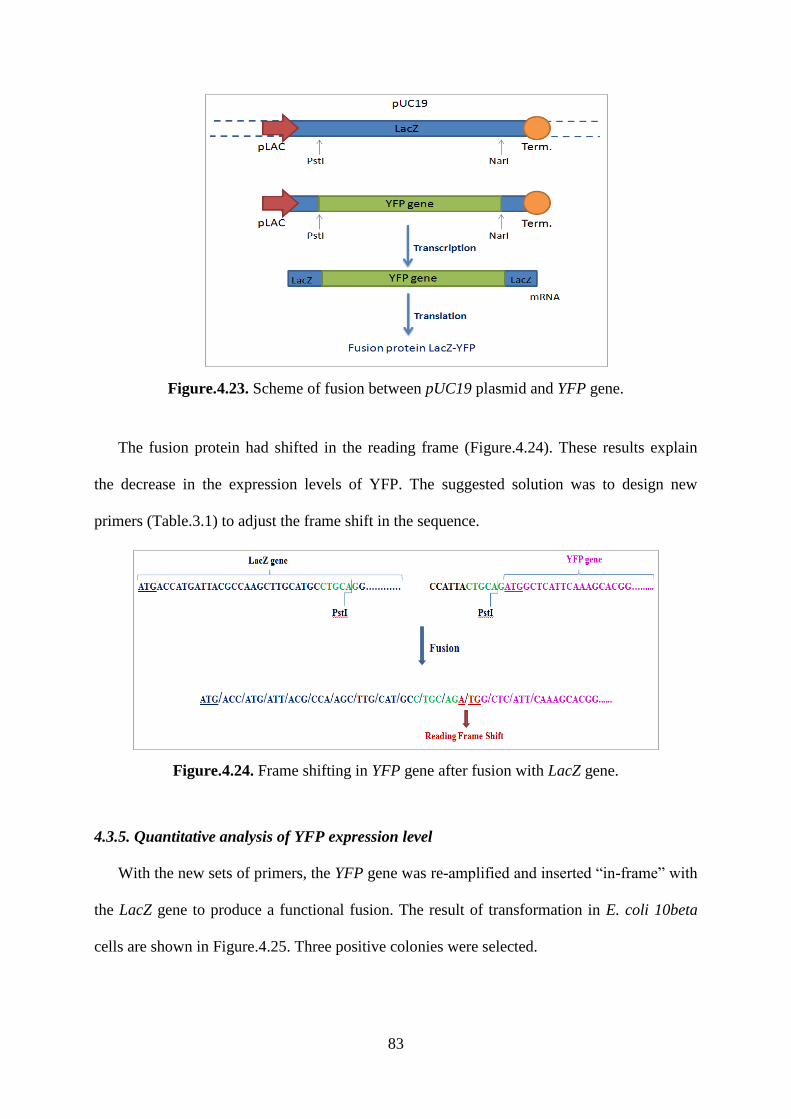
83
Figure.4.23. Scheme of fusion between pUC19 plasmid and YFP gene.
The fusion protein had shifted in the reading frame (Figure.4.24). These results explain
the decrease in the expression levels of YFP. The suggested solution was to design new
primers (Table.3.1) to adjust the frame shift in the sequence.
Figure.4.24. Frame shifting in YFP gene after fusion with LacZ gene.
4.3.5. Quantitative analysis of YFP expression level
With the new sets of primers, the YFP gene was re-amplified and inserted “in-frame” with
the LacZ gene to produce a functional fusion. The result of transformation in E. coli 10beta
cells are shown in Figure.4.25. Three positive colonies were selected.
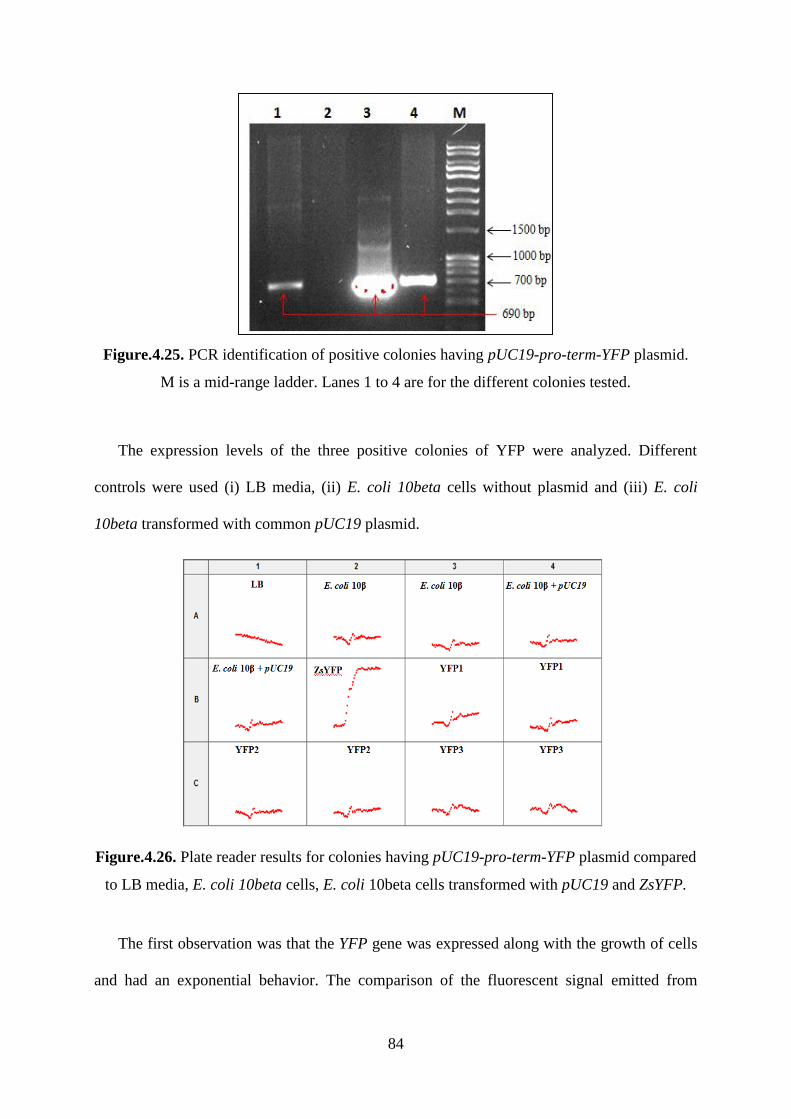
84
Figure.4.25. PCR identification of positive colonies having pUC19-pro-term-YFP plasmid.
M is a mid-range ladder. Lanes 1 to 4 are for the different colonies tested.
The expression levels of the three positive colonies of YFP were analyzed. Different
controls were used (i) LB media, (ii) E. coli 10beta cells without plasmid and (iii) E. coli
10beta transformed with common pUC19 plasmid.
Figure.4.26. Plate reader results for colonies having pUC19-pro-term-YFP plasmid compared
to LB media, E. coli 10beta cells, E. coli 10beta cells transformed with pUC19 and ZsYFP.
The first observation was that the YFP gene was expressed along with the growth of cells
and had an exponential behavior. The comparison of the fluorescent signal emitted from
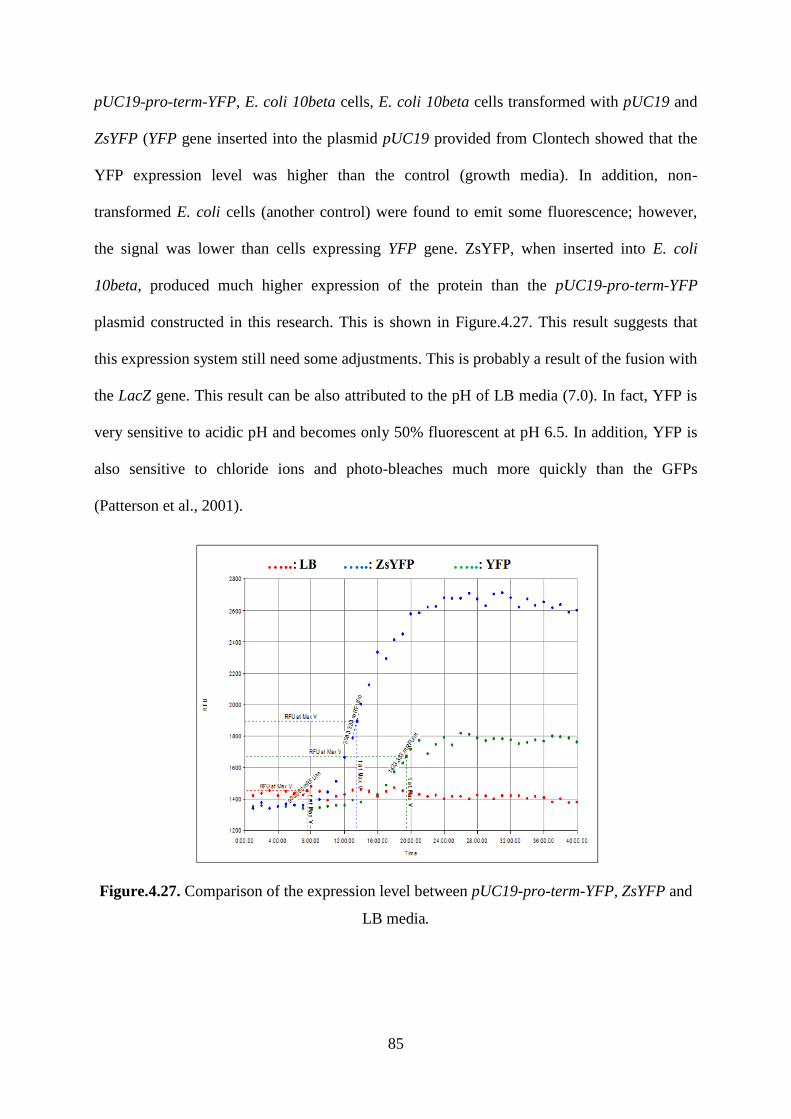
85
pUC19-pro-term-YFP, E. coli 10beta cells, E. coli 10beta cells transformed with pUC19 and
ZsYFP (YFP gene inserted into the plasmid pUC19 provided from Clontech showed that the
YFP expression level was higher than the control (growth media). In addition, non-
transformed E. coli cells (another control) were found to emit some fluorescence; however,
the signal was lower than cells expressing YFP gene. ZsYFP, when inserted into E. coli
10beta, produced much higher expression of the protein than the pUC19-pro-term-YFP
plasmid constructed in this research. This is shown in Figure.4.27. This result suggests that
this expression system still need some adjustments. This is probably a result of the fusion with
the LacZ gene. This result can be also attributed to the pH of LB media (7.0). In fact, YFP is
very sensitive to acidic pH and becomes only 50% fluorescent at pH 6.5. In addition, YFP is
also sensitive to chloride ions and photo-bleaches much more quickly than the GFPs
(Patterson et al., 2001).
Figure.4.27. Comparison of the expression level between pUC19-pro-term-YFP, ZsYFP and
LB media.
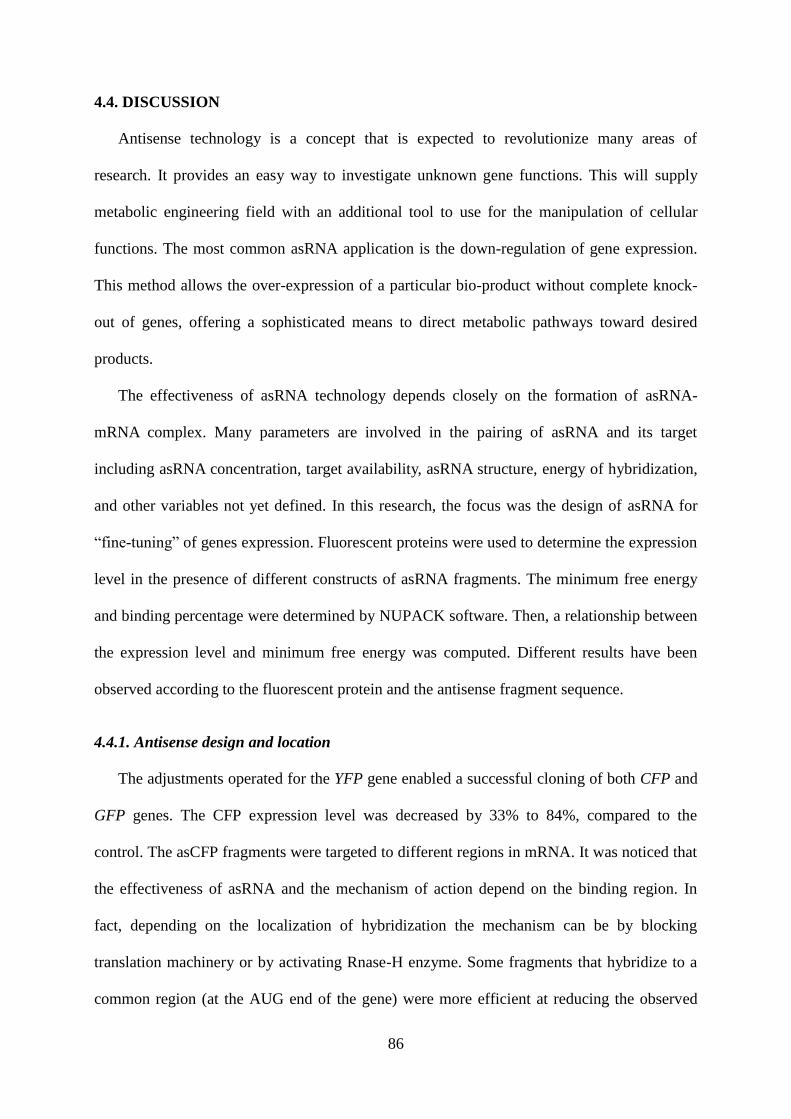
86
4.4. DISCUSSION
Antisense technology is a concept that is expected to revolutionize many areas of
research. It provides an easy way to investigate unknown gene functions. This will supply
metabolic engineering field with an additional tool to use for the manipulation of cellular
functions. The most common asRNA application is the down-regulation of gene expression.
This method allows the over-expression of a particular bio-product without complete knock-
out of genes, offering a sophisticated means to direct metabolic pathways toward desired
products.
The effectiveness of asRNA technology depends closely on the formation of asRNA-
mRNA complex. Many parameters are involved in the pairing of asRNA and its target
including asRNA concentration, target availability, asRNA structure, energy of hybridization,
and other variables not yet defined. In this research, the focus was the design of asRNA for
“fine-tuning” of genes expression. Fluorescent proteins were used to determine the expression
level in the presence of different constructs of asRNA fragments. The minimum free energy
and binding percentage were determined by NUPACK software. Then, a relationship between
the expression level and minimum free energy was computed. Different results have been
observed according to the fluorescent protein and the antisense fragment sequence.
4.4.1. Antisense design and location
The adjustments operated for the YFP gene enabled a successful cloning of both CFP and
GFP genes. The CFP expression level was decreased by 33% to 84%, compared to the
control. The asCFP fragments were targeted to different regions in mRNA. It was noticed that
the effectiveness of asRNA and the mechanism of action depend on the binding region. In
fact, depending on the localization of hybridization the mechanism can be by blocking
translation machinery or by activating Rnase-H enzyme. Some fragments that hybridize to a
common region (at the AUG end of the gene) were more efficient at reducing the observed
87
expression of CFP. Others were efficient when targeted to the 5’ region. These results can
suggest that there are some “favorable regions” more accessible to the asRNA. These regions
should be exploited for the down-regulation process and which need more investigations.
However, the down-regulation of GFP gene did not exceed 30% for the different
constructs used. The analysis of both targeted regions and expression level indicates that
asGFPs that have in common a region of 67 bp (position 171-238) have inhibited the
translation of GFP mRNA more efficiently compared to the other antisense fragments. This
result is in agreement with the findings for the CFP. There are probably some regions which
promote antisense binding and favorite the down-regulation. Though, some of the antisense
fragments improved the expression level of GFP suggesting a possible positive antisense
control.
Since some regions in the mRNA might be implicated in the antisense hybridization and
reduction of expression, these regions should be investigated. In fact, protein synthesis
requires a series of catalytic and regulatory elements including ribosomal recognition of the
mRNA ribosome binding site (RBS) (Shine, J. & Dalgarno, 1974, Yusupova et al., 2001) and
the start codon (Wikstrom et al., 1992). The 5’UTRs regions, which contain RBS, keep
mRNAs from degradation and protect them from cleavage. (Hambraeus et al., 2002).
Annealing of the asRNA to the RBS of the mRNAs not only inhibits ribosome binding but
also produces a target for mRNA cleavage by RNase III (Blomberg et al., 1990; Case et al.,
1990). Several cases of RBS blocking by natural asRNA have been reported in bacteria
(Wagner and Simons, 1994). This property was exploited by Bonoli et al. (2006) to
demonstrate the effectiveness of antisense-based gene silencing in Saccharomyces cerevisiae.
In addition, novel regulatory RNA elements acting as riboswitches have been developed using
asRNA techniques to provide a more valuable means of controlling gene expression. (Isaacs
et al., 2004). These examples provide a promising method for designing new antisense
88
fragments targeted either to the 5’UTR or RBS region. Other important regions can be
targeted including the conserved polyadenylation signal, the primer binding site (PBS), the
major splicing donor (SD) or the major packaging signal (Psi), and AUG (in Eukaryotes).
Those elements led to a highly efficient inhibition of HIV-1 gene expression and virus
production in cell culture (Reyes-Darias et al., 2012).
4.4.2. Thermodynamic calculations
The exploitation of the minimum free energy as a function of the observed expression
level of CFP revealed weak correlations. Although a poor correlation was obtained, linear
trends were observed at low values of free energy of binding and low expression levels. In
fact, the stability of the complex formed by the asRNA-mRNA is closely related to the free
energy. This complex is more stable at low energy values and the more stable the complex is,
the more efficient is the asRNA to trigger the knock-down mechanisms. Therefore, it can be
concluded that the antisense fragments which hybridize to the CFP mRNA with lower energy
are more efficient at reducing the fluorescence level of the protein. These fragments are the
same fragments that have been shown in the previous section to share a common region of
175 bp that is suspected to promote the binding of the antisense and induce the decrease of the
expression.
Meanwhile, at high values of minimum free energy, the linearity is no longer observed
and the expression level is not correlated to this thermodynamic parameter. The complex
asRNA-mRNA is unstable at high energy of binding; hence, the antisense acting machinery
was not induced efficiently and therefore the reduction of the expression was not significant
(only 33% of fluorescence was lost). However, the antisense fragment 1_1, which binds near
the AUG initiation codon, has reduced the fluorescence level by 78% and it has a high energy
of hybridization. This suggests that not only the minimum free energy is involved in the
89
variation of the expression level but there are other parameters and forces implicated in this
mechanism. These parameters should be determined and investigated.
As for the GFP, the relationship between the minimum free energy and the expression
level, relative to the control, indicate that there is a very weak relationship. These results are
in disagreement with previous results obtained by the Senger Lab. In fact, not only is the free
energy of the mRNA and asRNA binding is essential, but the location of these interactions
may also play an important role in knocking-down mRNA translation. Nevertheless, the weak
correlation implies more factors are required to correlate the expression level of the
fluorescent protein with the thermodynamics of asRNA-mRNA complex formation. More
data points are required to get more information about the behavior of the antisense fragments
inside cells and to enable fitting the thermodynamic model. Other fluorescent proteins should
be investigated for more accuracy.
89
4.5. REFRENCES
Blomberg, P., Wagner, E.G., & Nordström, K. (1990). Control of replication of plasmid R1:
The duplex between the antisense RNA, CopA, and its target, CopT, is processed
specifically in vivo and in vitro by RNase III. EMBO J, 9, 2331-2340.
Bonoli, M., Graziola, M., Poggi, V., & Hochkoeppler, A. (2006). RNA complementary to the
5' UTR of mRNA triggers effective silencing in Saccharomyces cerevisiae. Biochem
Biophys Res Commun, 339, 1224-1231.
Case, C.C., Simons, E.L., & Simons, R.W. (1990). The IS10 transposase mRNA is
destabilized during antisense RNA control. EMBO J, 9, 1259-1266.
Dean, N. M., McKay, R., Condon, T. P., & Bennett, C. F. (1994). Inhibition of protein kinase
C- expression in human A549 cells by antisense oligonucleotides inhibits induction of
intercellular adhesion molecule 1 (ICAM-1) mRNA by phorbol esters. J Biol Chem,
26, 16416-16424.
Dias, N., & Stein, C. A. (2002). Antisense Oligonucleotides: Basic Concepts and
Mechanisms. Mol Cancer Ther, 1, 347-355.
Hambraeus, G., Karhumaa, K.,& Rutberg, B. (2002). A 5' stem-loop and ribosome binding
but not translation are important for the stability of Bacillus subtilis aprE leader
mRNA. Microbiol, 148, 1795-1803.
Isaacs, F. J., Dwyer, D. J., Ding, C., Pervouchine, D. D., Cantor, C. R., & Collins, J. (2004).
Engineered riboregulators enable post-transcriptional control of gene expression. J Nat
Biotechnol, 22(841-847).
Layton, D. M., & Bundschuh, R. (2005). A statistical analysis of rna folding algorithms
through thermodynamic parameter perturbation. Nucleic Acids Res, 33,. 519-524.
90
Patterson, G., Day, R. N., & Piston, D. (2001). Fluorescent protein spectra. J Cell Sci, 114,
837-838.
Reyes-Darias, J. A., Sánchez-Luque, F. J., & Berzal-Herranz, A. (2012). HIV RNA
dimerisation interference by antisense oligonucleotides targeted to the 5' UTR
structural elements. Virus Res, 1, 63-71.
Shine, J., & Dalgarno, L. (1974). The 3'-terminal sequence of Escherichia coli 16S ribosomal
RNA: complementarity to nonsense triplets and ribosome binding sites. Proc Natl
Acad Sci, 71 1342-1346.
Wagner, E. G. H.,& Simons, R. W. (1994). Antisense RNA control in bacteria, phages, and
plasmids. Annu Rev Microbiol, 48, 713-742.
Wikström, P. M., Lind, L. K., Berg, D. E., & Björk, G. R. (1992). Importance of mRNA
folding and start codon accessibility in the expression of genes in a ribosomal protein
operon of Escherichia coli. J Mol Biol, 4, 949-966.
Yusupova, G. Z., Yusupov, M. M.,Cate, J. H. D.,& Noller, H. F. (2001). The path of
messenger RNA through the ribosome. Cell, 106, 233-241.
91
Chapter 5: CONCLUSION AND RECOMMENDATIONS
5.1. CONCLUSION
Antisense strategies were employed as a means for the down-regulation of fluorescent
protein expression. Three fluorescent proteins (i) CFP, (ii) GFP and (iii) YFP were studied
and their expression levels were determined in the presence of different antisense fragments.
Then, the minimum free energy and binding percentage were calculated by NUPACK
software. These systems allowed the investigation of the quantitative relationships between
the target gene expression level and designed asRNA sequence. Generally, there is a weak
correlation between the expression level and minimum free energy; however, linear trends
were observed at low (highly negative) free energy values and low fluorescence levels (high
degree of gene expression knock-down) for the CFP gene. In fact, the minimum free energy
of hybridization is involved in the expression level of the target gene. The stability of the
complex asRNA-mRNA is maintained at lower free energies. Therefore, the lower the energy,
the more stable is the asRNA-mRNA complex, and greater reduction of the expression is
obtained. The stability of the asRNA-mRNA complex would favor the knock-down
mechanisms. Nevertheless, the low correlation at higher free energy values pointed to the
existence of other parameters implicated in the design of antisense fragments. This study also
revealed that target accessibility is a crucial parameter for the design of antisense fragments.
There are specific regions in the gene that are more accessible to asRNA and promote the
down-regulation mechanism. These regions include the AUG start codon region and should be
further investigated. This leads to targeting new regions in the mRNA, mainly the ribosome
binding site (RBS). The ribosome is known to confer to the mRNA the protection of
degradation by nucleases. Consequently, targeting this region or 5’UTR would destabilize the
mRNA and make it more susceptible to degradation and reducing thus the protein expression
92
level. These adjustments enlarge the domain of work and may introduce more accuracy to a
thermodynamic model. Expanding this model to other genes is also of interest. The
development of such a model, that is applicable to all genes, will enable the down-regulation
of any protein. More insights are for the implementation of these “fine-tuned” asRNA
strategies in cellular pathways to engineer metabolic shifts to increase synthesis of desired
end-products without resorting to gene knock-out. The most attractive and modern application
is to re-route cellular metabolism to the production and the improvement of biofuel and
chemical commodities yields and the establishment of renewable, economically friendly
energy sources.
Further attempts will be directed to the development of a program to create new asRNA
fragments that can reduce gene expression of a target protein by any degree desired. This
would be accomplished after the validation of a thermodynamic model.
5.2. RECOMMENDATIONS
More fluorescent proteins should be investigated to gather more data for more accuracy.
In addition, more thermodynamic parameters should be joined to the minimum free energy to
elucidate the relation between the expression level and the thermodynamic aspects. A complex
mathematical model will be developed and should be tested for precision for other protein
(not only fluorescent proteins). To make a more accurate design, preliminary researches are
needed to have information about (i) the target mRNA secondary structure, (ii) the stability of
the complex asRNA-mRNA secondary structure studied via the minimum free energy analysis
and (iii) the exactitude of the open reading frame of the fluorescent gene after the insertion in
pUC19-pro-term plasmid.


![Regulation of plant gene expression by antisense RNA · the flavonoid pathway, but also in the starch biosyn- thetic pathway [22]. 6. CONCLUSIONS AND PROSPECTS Sense and antisense](https://img.pdfslide.us/doc/110x75/5e308c83f94d9d11990783e4/regulation-of-plant-gene-expression-by-antisense-rna-the-flavonoid-pathway-but.jpg)