Embed Size (px)
Citation preview
Correctional Industries
preparing inmates for re-entry:
Recidivism & post-release employment
State Report
For Iowa
Final draft report
September 30, 2005
Cindy J. Smith, Ph.D.
Jennifer Bechtel, M.S.
1

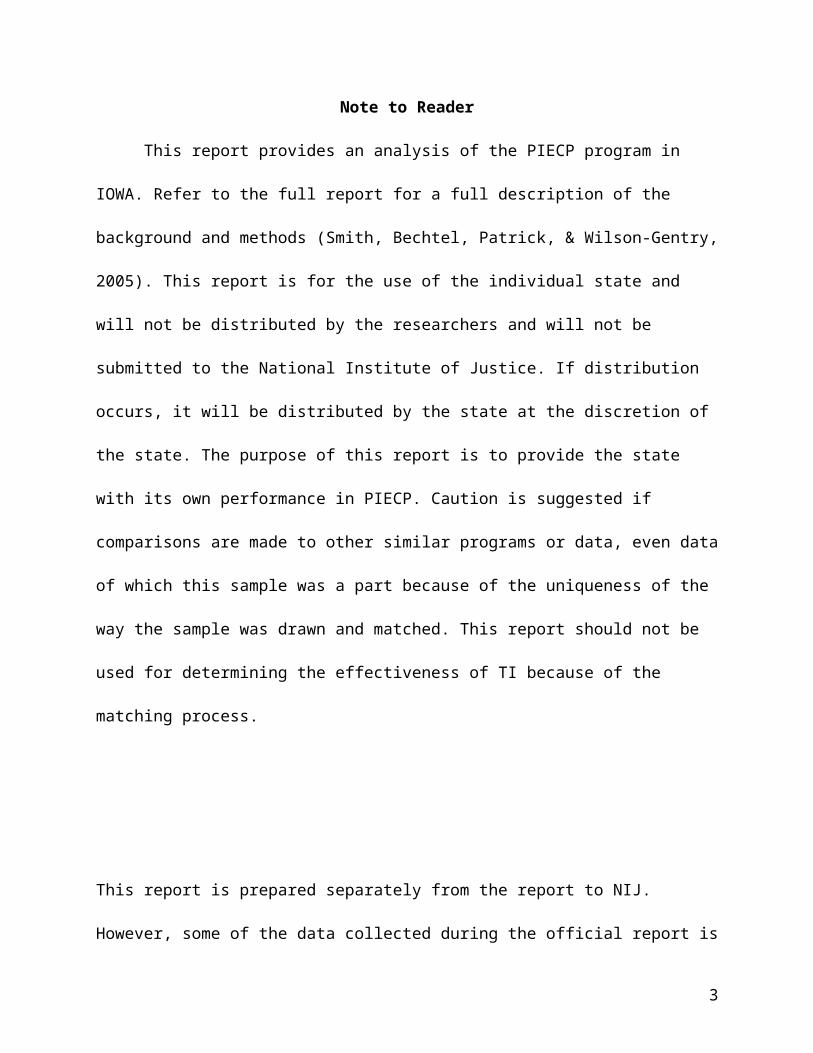
Note to Reader
This report provides an analysis of the PIECP program in IOWA. Refer to the full
report for a full description of the background and methods (Smith, Bechtel, Patrick, &
Wilson-Gentry, 2005). This report is for the use of the individual state and will not be
distributed by the researchers and will not be submitted to the National Institute of
Justice. If distribution occurs, it will be distributed by the state at the discretion of the
state. The purpose of this report is to provide the state with its own performance in
PIECP. Caution is suggested if comparisons are made to other similar programs or
data, even data of which this sample was a part because of the uniqueness of the way
the sample was drawn and matched. This report should not be used for determining the
effectiveness of TI because of the matching process.
This report is prepared separately from the report to NIJ. However, some of the data
collected during the official report is used to prepare this individual report. Therefore, the
usual disclaimer is necessary.
This project was supported by Grant No. 2004-DD-BX-1001 awarded by the National
Institute of Justice, Office of Justice Programs, US Department of Justice. Points of view
in this document are those of the author and do not necessarily represent the official
position or policies of the US Department of Justice.
2
Executive Summary
Using a matched sample of 1091 inmates released between April 1,1999 and
June 30, 2001, Prison Industries Enhancement Certification Program (PIECP)
participants re-enter society more successfully than Traditional Industries (TI) or other
than work (OTW) releasees in terms of employment. The primary findings of this
research are that Iowa state prison inmates who worked in open-market jobs in PIECP
were found to be significantly more successful in post-release employment. That is to
say, they became tax-paying citizens quicker and remain in that status longer than TI
and OTW releasees. Additionally, PIECP releasees were incarcerated post release at a
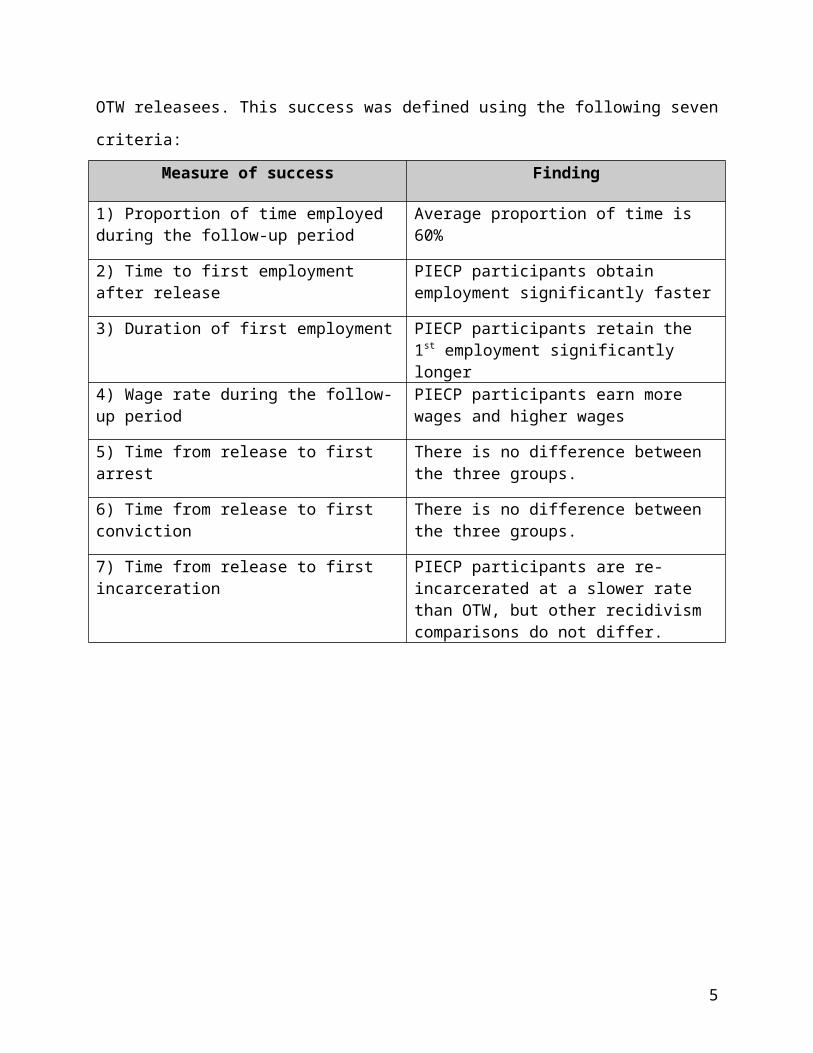
slower rate than OTW releasees. This success was defined using the following seven
criteria:
Measure of success Finding
1) Proportion of time employed during the follow-up period
Average proportion of time is 60%
2) Time to first employment after release PIECP participants obtain employment significantly faster
3) Duration of first employment PIECP participants retain the 1st employment significantly longer
4) Wage rate during the follow-up period PIECP participants earn more wages and higher wages
5) Time from release to first arrest There is no difference between the three groups.
6) Time from release to first conviction There is no difference between the three groups.
7) Time from release to first incarceration PIECP participants are re-incarcerated at a slower rate than OTW, but other recidivism comparisons do not differ.
3
Introduction
This is the first review of the recidivism and post-release employment effects of
the Prison Industries Enhancement Certification Program (PIECP) engaging state
prison inmates in private sector jobs since 1979. The report is based on results from a
records review of outcomes for three matched samples, each of approximately 230
Traditional Industries (TI) to PIECP and TI to other than work (OTW) releasees and 474
each for PIECP and OTW releasees, released from Iowa between 1999 and 2001. It
examines whether sampled inmates participating in PIECP return to prison less
frequently (e.g., recidivism effects) or enjoy more successful employment (e.g.,
employment effects) than otherwise similar inmates who either participated only in TI or
were involved in OTW activities while in prison.
Key findings and discussion
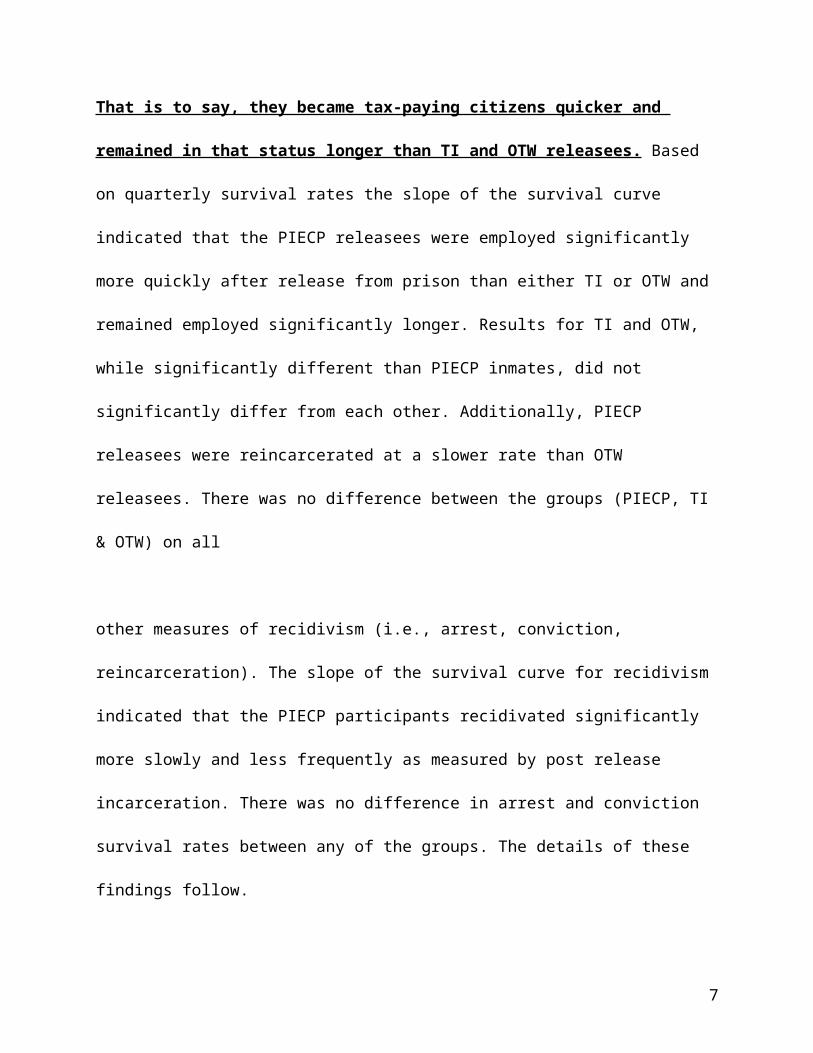
The primary findings of this research are that Iowa state prison inmates
who worked in open-market jobs in PIECP were found to be significantly more
successful in post-release employment. That is to say, they became tax-paying
citizens quicker and remained in that status longer than TI and OTW releasees.
Based on quarterly survival rates the slope of the survival curve indicated that the
PIECP releasees were employed significantly more quickly after release from prison
than either TI or OTW and remained employed significantly longer. Results for TI and
OTW, while significantly different than PIECP inmates, did not significantly differ from
each other. Additionally, PIECP releasees were reincarcerated at a slower rate than
OTW releasees. There was no difference between the groups (PIECP, TI & OTW) on all
4
other measures of recidivism (i.e., arrest, conviction, reincarceration). The slope of the
survival curve for recidivism indicated that the PIECP participants recidivated
significantly more slowly and less frequently as measured by post release incarceration.
There was no difference in arrest and conviction survival rates between any of the
groups. The details of these findings follow.
Research Question 1: Does PIECP participation increase post release employment
as compared to TI work and OTW?
This research question is answered through a variety of measures. Based on a
panel of experts' and states' guidance, measures for success include the following
criteria1: 1) proportion of time employed during the follow-up period (e.g., the time from
release from prison until the end of data collection)2 (See Table 1: Post-release
employment descriptive measures), 2) time to first employment after release, 3)
duration of first employment, and 4) wage rate during the follow-up period. Details of
each analysis are described in the following section.
1) Proportion of time post release the releasee worked
The general descriptive data relative to the post-release employment measures
are presented in Table 1: Post-release employment descriptive measures. Employment
data were available for Iowa from the first quarter of 1999 to the last quarter of 2002.
Therefore, some releasees were followed for four years, while other were followed for
1 One additional measure of success is the types of PIECP occupations within prisons versus free world occupations. Currently, these data are not divided into pre-release and post-release groups. Therefore, they do not measure success but are included as general characteristics.2 Ideally, this variable would first calculate the available "street time" and then determine the proportion of available time. However, the data were not available at this time to calculate the amount of time each individual may have been unavailable for work (i.e., incarcerated).
5
one and one-half years. Approximately 12.3 percent (n=134) of the total sample
(n=1091) had no reported earnings at any time during data collection and 16.5 percent
had no reported earnings during the follow-up period (e.g., the time from release from
prison until the end of data collection). The reasons for no reported earnings are
unknown, but could include failure to report or record earnings, work in industries in
which wages may traditionally not be reported (i.e., agriculture or illegal employment), or
employment in other states. And, of course, the data include those who did not work
and had no earnings. There is no way of knowing what proportion of this percentage is
explained by each of these without an individual follow-up. The range of the follow-up
period for this measure is a minimum of 5 calendar quarters to a maximum of 15
quarters for the sample. The average follow-up period for the entire sample is 9.4
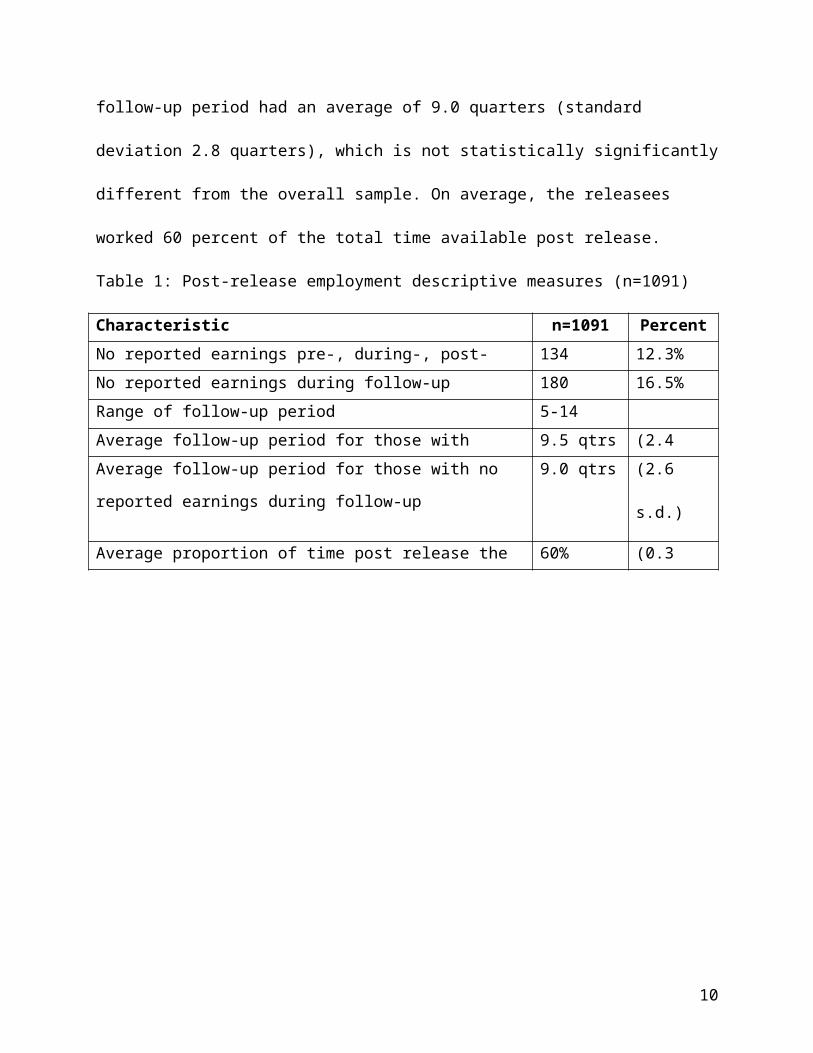
quarters (standard deviation 2.4 quarters). Those who had no employment during the
follow-up period had an average of 9.0 quarters (standard deviation 2.8 quarters), which
is not statistically significantly different from the overall sample. On average, the
releasees worked 60 percent of the total time available post release.
Table 1: Post-release employment descriptive measures (n=1091)
Characteristic n=1091 Percent
No reported earnings pre-, during-, post- incarceration 134 12.3%
No reported earnings during follow-up 180 16.5%
Range of follow-up period 5-14 qtrs
Average follow-up period for those with reported earnings 9.5 qtrs (2.4 s.d.)
Average follow-up period for those with no reported earnings
during follow-up
9.0 qtrs (2.6 s.d.)
Average proportion of time post release the releasee worked 60% (0.3 s.d.)
6
7
2) Length of time to employment
The second measure of success for releasees was the amount of time that
lapsed between release and employment. This included a comparison of PIECP, TI and
OTW to each other to determine who obtained employment faster. Based on the
survival analysis, PIECP participants obtained post release employment
significantly faster than either TI or OTW. The survival rate is equal to the proportion
of those who begin the quarter to those who remain at the end of the quarter without
experiencing employment. The steepest slope indicates that comparably more
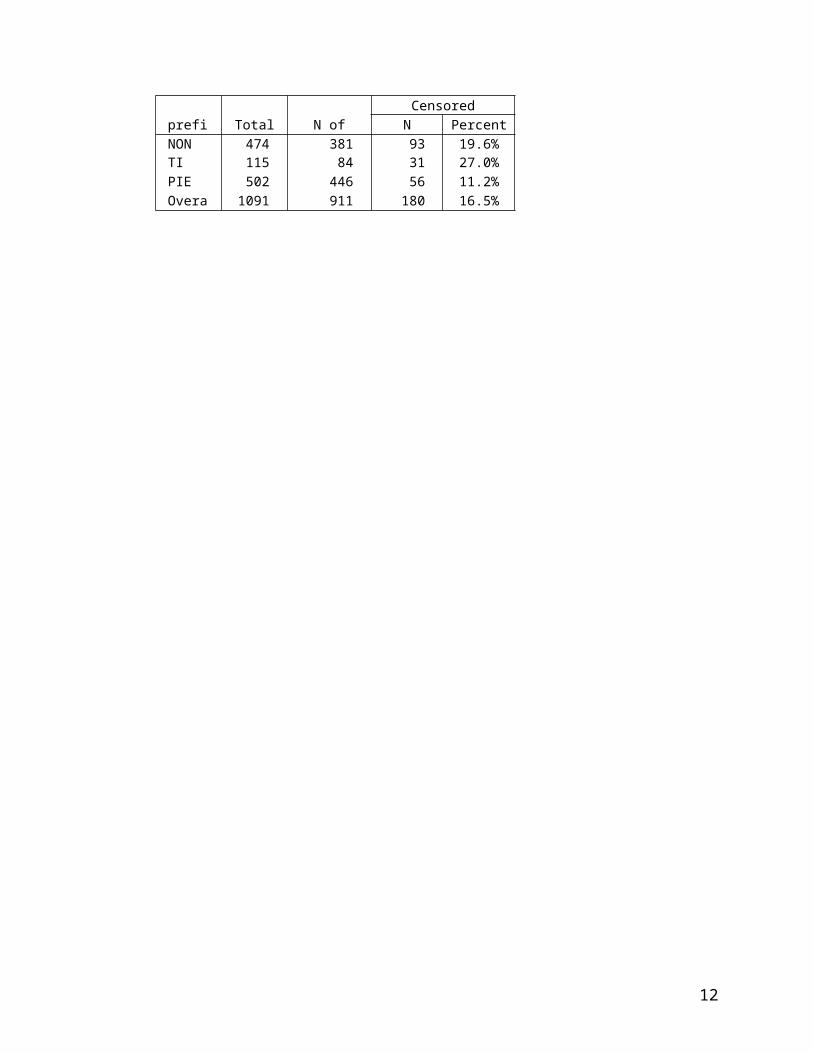
releasees than other groups have found employment. Approximately 27 and 20 percent
of the TI and OTW releasees did not have reported earnings, whereas less than 11
percent of the PIECP's did not have earnings over the course of follow-up (See Table 2:
Censored cases – release to employment). (In survival analysis, the total N is the
sample size, the N of events is the portion of the sample who experienced the event –
employment, and the censored cases are the number of cases who did not experience
the event during the follow-up period).
Table 2: Censored cases – release to employment
Censoredprefix Total N N of Events N PercentNON 474 381 93 19.6%TI 115 84 31 27.0%PIE 502 446 56 11.2%Overall 1091 911 180 16.5%
8
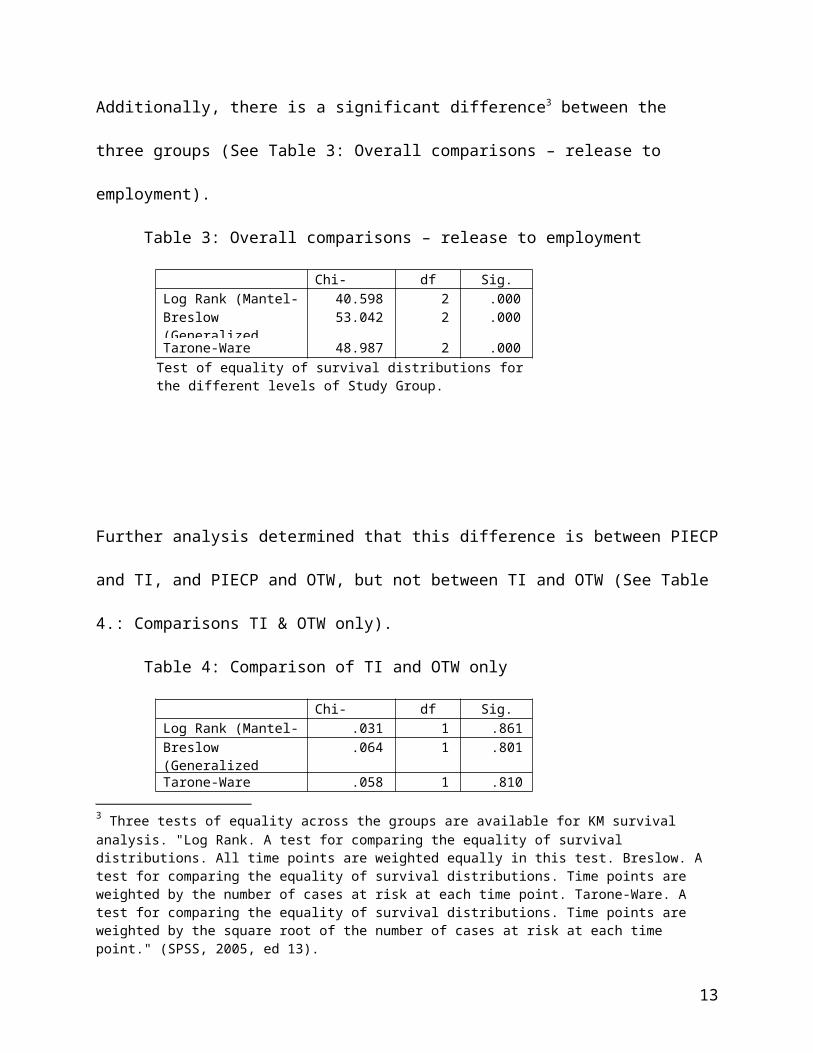
Additionally, there is a significant difference3 between the three groups (See Table 3:
Overall comparisons – release to employment).
Table 3: Overall comparisons – release to employment
Chi-Square df Sig.Log Rank (Mantel-Cox) 40.598 2 .000Breslow (Generalized Wilcoxon)
53.042 2 .000
Tarone-Ware 48.987 2 .000Test of equality of survival distributions for the different levels of Study Group.
Further analysis determined that this difference is between PIECP and TI, and PIECP
and OTW, but not between TI and OTW (See Table 4.: Comparisons TI & OTW only).
Table 4: Comparison of TI and OTW only
Chi-Square df Sig.Log Rank (Mantel-Cox) .031 1 .861Breslow (Generalized Wilcoxon)
.064 1 .801
Tarone-Ware .058 1 .810Test of equality of survival distributions for the different levels of Study Group.
Finally, examining the survival curve provides insight into several issues relative
to the time it takes for a releasee to obtain employment (See Figure 1: Survival
3 Three tests of equality across the groups are available for KM survival analysis. "Log Rank. A test for comparing the equality of survival distributions. All time points are weighted equally in this test. Breslow. A test for comparing the equality of survival distributions. Time points are weighted by the number of cases at risk at each time point. Tarone-Ware. A test for comparing the equality of survival distributions. Time points are weighted by the square root of the number of cases at risk at each time point." (SPSS, 2005, ed 13).
9
Function: Release to employment).
Figure 1: Survival function: Release to employment
First, approximately 80 percent of the PIECP and 60 percent of the TI and OTW
obtained employment within the first quarter upon release. Conversely,
approximately 20 percent PIECP and 40 percent of the TI and OTW releasees ended
the first quarter without experiencing the terminal event (i.e., not obtaining employment,
death). Once the releasee obtains employment, he or she is dropped from further
analysis shown in the survival curve. Second, survival analysis provides the amount of
time that passes before the curve associated with change in status becomes flattened.
By the end of the second quarter the line has flattened. An additional 10 percentage
point decline occurs over the next 3 years indicating that few releasees obtain
employment after the first quarter. This would suggest that employment assistance
should be focused during the first quarter after release to assist those who obtain
10
work more readily and focused differently for the 10 to 30 percent who do not
obtain employment for the remaining follow-up period. Finally, this analysis shows
which group obtained employment faster. Although it appears that TI and OTW survival
curves are different4, they are not significantly different. This indicates that it took about
the same amount of time for individuals in either group to obtain employment. The PIE
line drops faster and remains below the other two, which shows that releasees
participating in PIECP obtained employment faster than those who do not have the
PIECP experience.
3) Duration of employment
The third measure of success relative to post-release employment is the length
of the time between first employment and the first full quarter without reported earnings
or employment. A sequence of jobs or multiple jobs in one quarter (i.e., changing
employment, working two jobs), is not counted as a loss of employment. Unemployment
within a quarter remains counted as employment so long as there are reported earnings
within the quarter, and the releasee may be unemployed for large parts of the quarter.
Hypothetically, a person only needs to work some part of one day in a quarter to be
considered employed for that quarter.
The post-release duration measures are presented in Table 5: Post-release
employment duration descriptive measures. Among those in the sample with one year
or more of follow-up (n=1091) and three years or more of follow-up (n=289), PIECP
releasees are more likely to be continuously employed than either TI or OTW. Of the
502 available PIECP participants, 49.2 percent of them were employed for one
4 This appearance is a result of the differences in the sample sizes between the twin sets of PIECP to TI, TI to OTW, and PIECP to OTW.
11
year or more continuously and 7.0 percent of them were employed for three years
or more continuously, whereas 43.9 percent and 45.6 percent of the TI and OTW
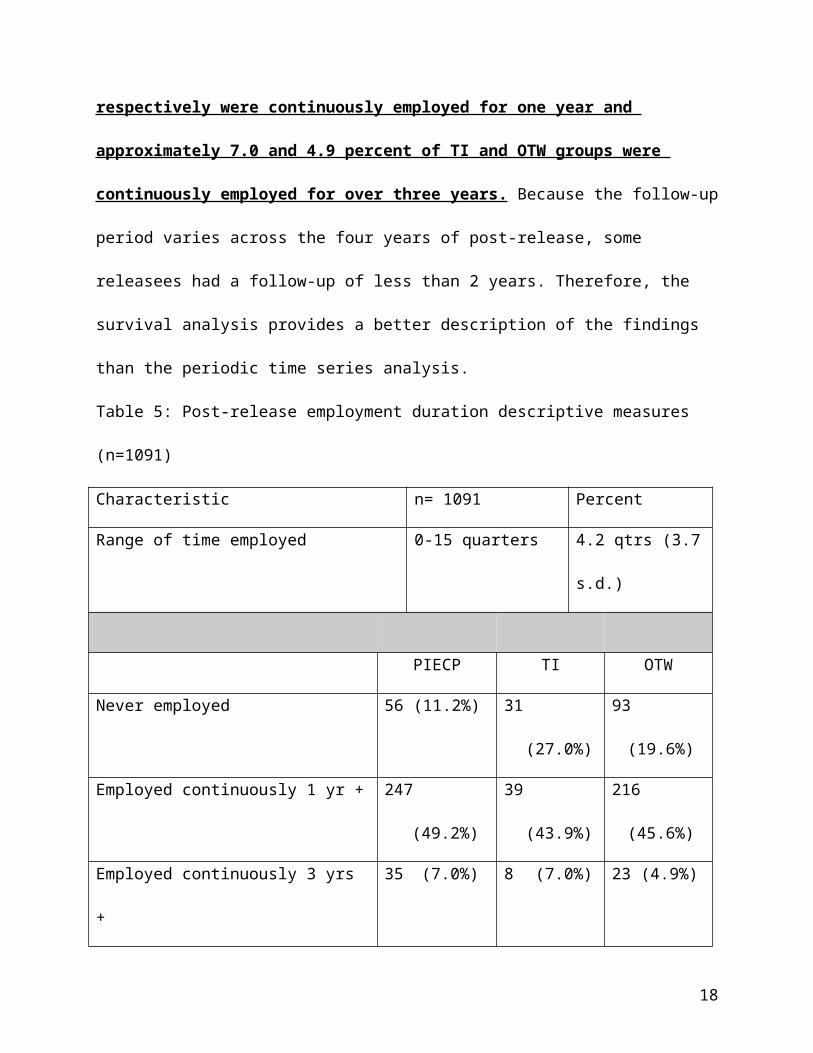
releasees respectively were continuously employed for one year and
approximately 7.0 and 4.9 percent of TI and OTW groups were continuously
employed for over three years. Because the follow-up period varies across the four
years of post-release, some releasees had a follow-up of less than 2 years. Therefore,
the survival analysis provides a better description of the findings than the periodic time
series analysis.
Table 5: Post-release employment duration descriptive measures (n=1091)
Characteristic n= 1091 Percent
Range of time employed 0-15 quarters 4.2 qtrs (3.7 s.d.)
PIECP TI OTW
Never employed 56 (11.2%) 31 (27.0%) 93 (19.6%)
Employed continuously 1 yr + 247 (49.2%) 39 (43.9%) 216 (45.6%)
Employed continuously 3 yrs + 35 (7.0%) 8 (7.0%) 23 (4.9%)
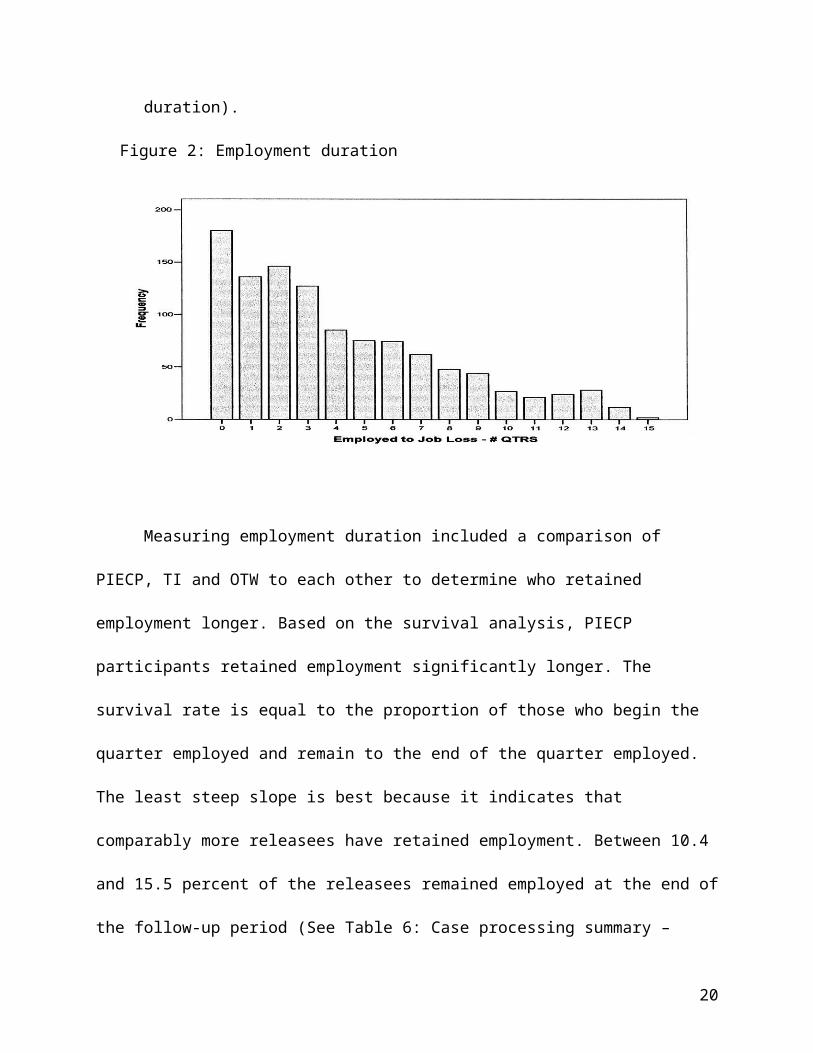
The average length of duration of employment for all three groups is best
represented by the median of three quarters as a result of the skewed distribution
caused by the large number of releasees who do not obtain employment during the
follow-up period or are employed for less than four quarters (See Figure 2: Employment
12
duration).
Figure 2: Employment duration
Measuring employment duration included a comparison of PIECP, TI and OTW
to each other to determine who retained employment longer. Based on the survival
analysis, PIECP participants retained employment significantly longer. The survival rate
is equal to the proportion of those who begin the quarter employed and remain to the
end of the quarter employed. The least steep slope is best because it indicates that
comparably more releasees have retained employment. Between 10.4 and 15.5 percent
of the releasees remained employed at the end of the follow-up period (See Table 6:
Case processing summary – employment duration). In other words, the releasees did
not lose employment during the follow-up period, so they were censored from the
analysis during the quarter in which the individual's follow-up period ended.
13
Table 6: Case processing summary – employment duration
Censoredprefix Total N N of Events N PercentOTW 474 424 50 10.5%TI 115 103 12 10.4%PIE 502 424 78 15.5%Overall 1091 951 140 12.8%
Additionally, there is a significant difference between the three groups (See Table 7:
Overall comparisons – employment duration).
Table 7 Overall comparisons – employment duration
Chi-Square df Sig.Log Rank (Mantel-Cox) 17.519 2 .000Breslow (Generalized Wilcoxon)
21.495 2 .000
Tarone-Ware 20.384 2 .000Test of equality of survival distributions for the different levels of Study Group.
Once again, the analysis demonstrates the significant difference is between PIECP and
TI, and between PIECP and OTW, not between TI and OTW.
Finally, examining the survival curve provides insight into employment duration
(See Figure 3: Survival function: employment duration).
14
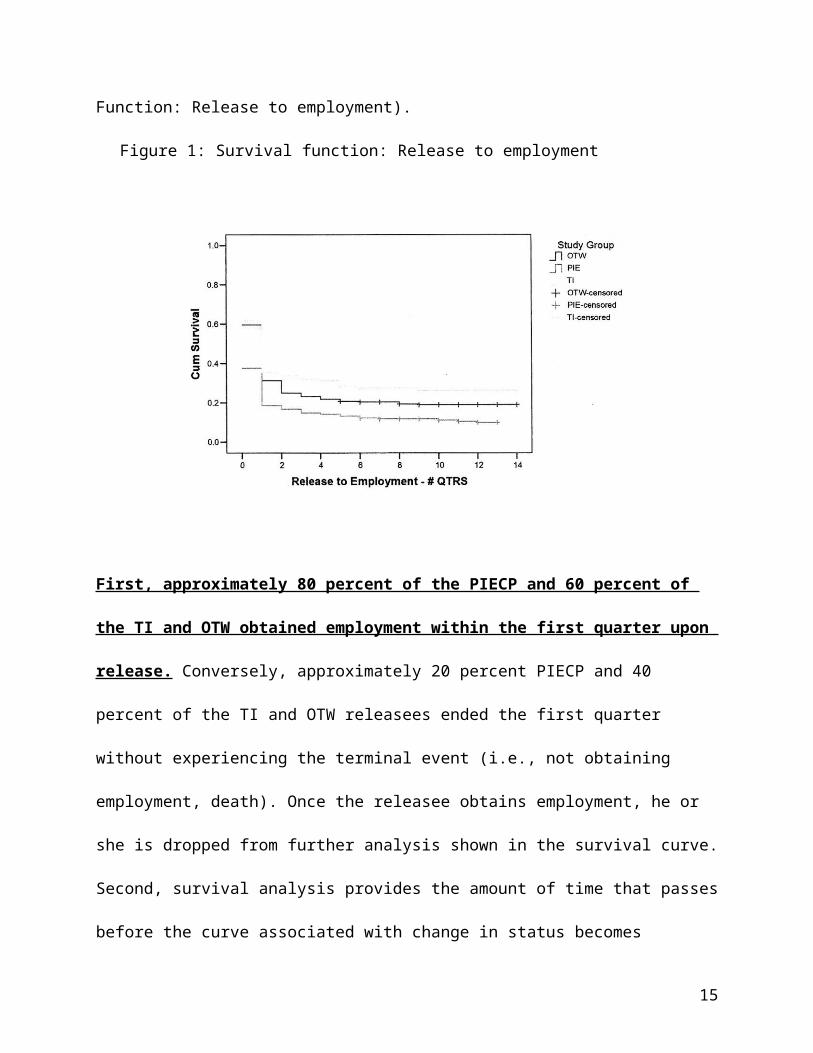
Figure 3 Survival function – employment duration
First, PIECP releasees retain employment longer than TI or OTW releasees (See Figure
3 Survival function – employment duration). Nevertheless, over 50 percent of all three
groups had a full quarter of unemployment by the end of the third quarter after release.
5) Wage rate
Finally, wages earned by the sample were examined. Approximately 41% of the
releasees earned at an hourly rate less than the Federal minimum wage during the post
release follow-up period. It is possible that the sample were either under-employed (i.e.,
working part time or working intermittent) or under-paid.
Table 8 Wages earned post-releasePIECP TI OTW
Wages earned (mean) $24,287 $18,667 $19,906
# quarters employed at least one day (mean)
6.6 quarters 5.6 quarters 5.9 quarters
15
In addition, there is a significant difference between PIECP and TI, PIECP and
OTW, but not between OTW and TI based on the t test on the amount of wages earned.
RQ 2: Does PIECP participation reduce recidivism as compared to TI work or
OTW?
The analysis for recidivism is similar to post release employment. Recidivism is
measured in the three traditional ways; new arrest, conviction, and incarceration.
Technical violations were not measured as a new arrest. Survival analysis measures
how long a releasee is in the free world community until he or she recidivates. The
terminal event for the analysis may be an arrest, conviction or incarceration. At that
time, the individual is removed from further analysis. Therefore, this measure does not
take into account future free world time or additional recidivism measures. This analysis
technique allows the survival curve to measure the percent of those who are still in the
free world at the end of each interval for the first recidivism event. Recidivism is
measured in units of days from the time an individual was released from prison to the
time in which he or she was first arrested, convicted or incarcerated.
The three measurements are based on the recidivism definition debates over the
years. One school of thought is that the number of arrests over count crime. Others
think that convictions are only incidents that can be proven in court, thereby
undercounting crime. And, finally, others think that measuring re-incarceration is best
because prison should be responsible for reducing prison stays.
The follow-up period began on the date of release into the community (e.g., any
day between April 1, 1999 and June 30, 2001) until mid 2003. This results in a follow-up
period of slightly less than two years up to four and one-half years.
16
Arrest
This matched sample of releasees have relatively low recidivism rates. The
average amount of time from release to first arrest is approximately 813 days,
suggesting that many (84 percent) of the releasees were arrest free at the end of the
first year. The range of time between the time released and the time arrested is 6-1532
days. Almost 52.2 percent of those in PIE successfully reentered society, whereas
approximately 51 and 52 percent of the TI & OTW were not arrested during the
follow-up period. The rate of success at the end of the first year is high for all three
groups, 64.7 percent of PIECP, and 69.6 percent for TI and 70.2 percent for OTW did
not get arrested in the first year post release. Convictions and incarcerations are higher
than we would expect in a random sample of released inmates.
Table 9: Release to arrest
Total sample size 1091
No post-release arrests 568 (52.1%)
Range from release to arrest 6-1532 days
PIECP TI OTW
No post-release arrest 262 (52.2%) 59 (51.3%) 247 (52.1%)
Success rate for one year (no post-release arrest during 1st year)
325 (64.7%) 80 (69.6%) 333 (70.2%)
No post-release conviction 336 (66.9%) 77 (67.0%) 327 (69.0%)
No post-release incarceration 478 (95.2%) 110 (95.7%) 433 (91.4%)
17
Measuring recidivism included a comparison of PIECP, TI and OTW to each
other to determine who stayed crime free longer. Based on the survival analysis, PIECP
participants stayed clime free significantly longer in comparison to OTW for
reincarceration. The survival rate is equal to the proportion of those who begin the
quarter arrest free post release and remain to the end of the quarter arrest free. The
slowest dropping survival curve is best because it indicates that comparably more
releasees have remained arrest free.
Between 50.9 and 53.3 percent of the releasees remained arrest free at the end
of the follow-up period (See Table 10: Case processing summary – arrest). In other
words, the releasees did not get arrested for a new crime during the follow-up period, so
they were censored from the analysis during the quarter in which the individual's follow-
up period ended. There is no statistical difference between the three groups.
Table 10: Case processing summary – arrest
Censoredprefix Total N N of Events N PercentOTW 460 220 240 52.2%TI 110 54 56 50.9%PIE 475 222 253 53.3%Overall 1045 496 549 52.5%
Convictions
Between 67.9 and 69.5 percent of the releasees remained conviction free at the
end of the follow-up period (See Table 11: Case processing summary – conviction). In
other words, the releasees did not get convicted for a new crime during the follow-up
period, so they were censored from the analysis during the quarter in which the
18
individual's follow-up period ended. However, there is no statistical difference between
the three groups.
Table 11: Case processing summary – conviction
Censoredprefix Total N N of Events N PercentOTW 462 141 321 69.5%TI 111 35 76 68.5%PIE 480 154 326 67.9%Overall 1053 330 723 68.7%
Incarcerations
Between 91.2 and 95.6 percent of the releasees remained incarceration free at
the end of the follow-up period (See Table 12: Case processing summary –
incarceration). In other words, the releasees did not get incarcerated for a new crime
during the follow-up period, so they were censored from the analysis during the quarter
in which the individual's follow-up period ended.
Table 12: Case processing summary – incarceration
Censoredprefix Total N N of Events N PercentOTW 468 41 427 91.2%TI 114 5 109 95.6%PIE 490 22 468 95.5%Overall 1072 68 1004 93.7%
Additionally, there is a significant difference between the three groups (See Table
13: Overall comparisons – incarceration).
Table 13: Overall comparisons – incarceration
19
Chi-Square df Sig.Log Rank (Mantel-Cox) 9.367 2 .009Breslow (Generalized Wilcoxon)
8.618 2 .013
Tarone-Ware 9.076 2 .011Test of equality of survival distributions for the different levels of Study Group.
Further analysis identifies a significant difference between PIECP and OTW, but
not between PIECP and TI or TI and OTW (See Table 14: Comparison TI & OTW only –
incarceration).
Table 14: Comparison PIECP & OTW only – incarceration
Chi-Square df Sig.Log Rank (Mantel-Cox) 7.531 1 .006Breslow (Generalized Wilcoxon)
6.352 1 .012
Tarone-Ware 6.948 1 .008Test of equality of survival distributions for the different levels of Study Group.
Finally, examining the survival curve provides insight into post release (See
Figure 15: Survival function- incarceration). The difference in post release incarceration
does not appear to be different until 500 days have passed from release.
Figure 15: Survival function- incarceration
20