Embed Size (px)
Citation preview
CHARLES W. MEYRICK, MICHAEL M. FEEN, and ROBERT L. STRAUCH
CORRECTING FOR THE EFFECTS OF THE IONOSPHERE ON RF TRANSMISSIONS AS USED IN THE SATRACK SYSTEM
It is important to the accuracy of the SA TRACK missile-tracking system that corrections be applied to compensate for ionospheric effects. This article contains a background description of the SATRACK system and discusses how corrections based on ionospheric models and on two-frequency data are calculated. The corrections used in the early SA TRACK system for Trident I tests and the follow-on SATRACK II system for Trident II tests are presented. Also examined are the merits and shortcomings of the implemented corrections.
BACKGROUND
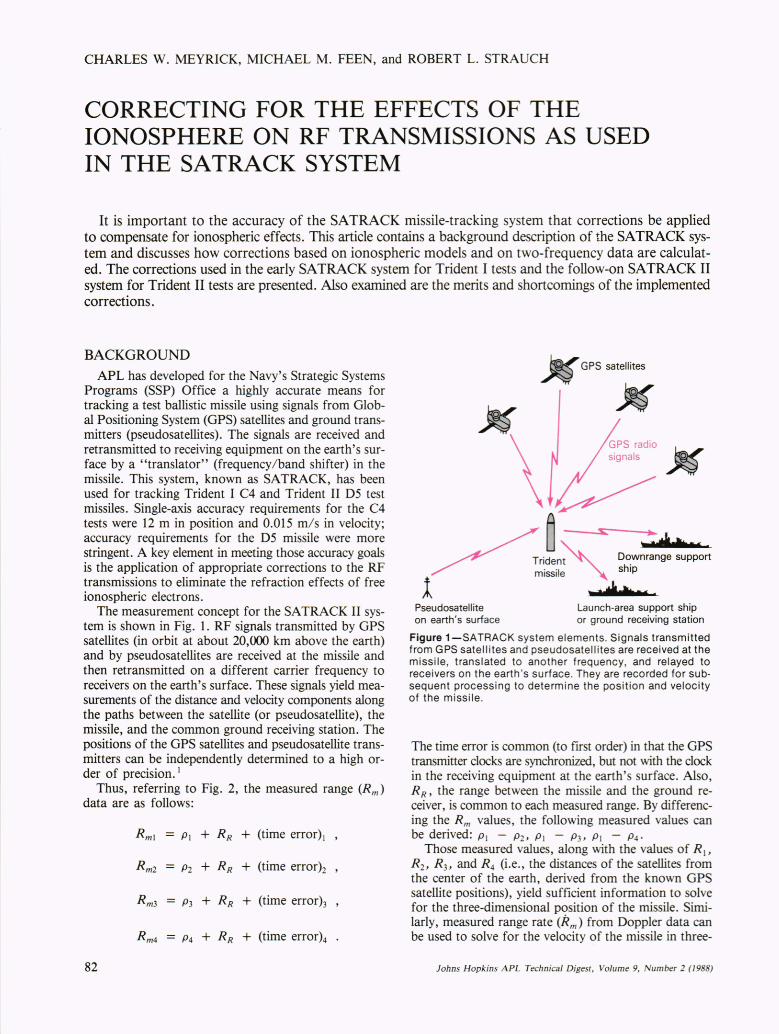
APL has developed for the Navy's Strategic Systems Programs (SSP) Office a highly accurate means for tracking a test ballistic missile using signals from Global Positioning System (GPS) satellites and ground transmitters (pseudosatellites). The signals are received and retransmitted to receiving equipment on the earth's surface by a "translator" (frequency/band shifter) in the missile. This system, known as SA TRACK, has been used for tracking Trident I C4 and Trident II D5 test missiles. Single-axis accuracy requirements for the C4 tests were 12 m in position and 0.015 m/ s in velocity; accuracy requirements for the D5 missile were more stringent. A key element in meeting those accuracy goals is the application of appropriate corrections to the RF transmissions to eliminate the refraction effects of free ionospheric electrons.
The measurement concept for the SA TRACK II system is shown in Fig. 1. RF signals transmitted by GPS satellites (in orbit at about 20,000 km above the earth) and by pseudo satellites are received at the missile and then retransmitted on a different carrier frequency to receivers on the earth's surface. These signals yield measurements of the distance and velocity components along the paths between the satellite (or pseudosatellite), the missile, and the common ground receiving station. The positions of the GPS satellites and pseudo satellite transmitters can be independently determined to a high order of precision. '
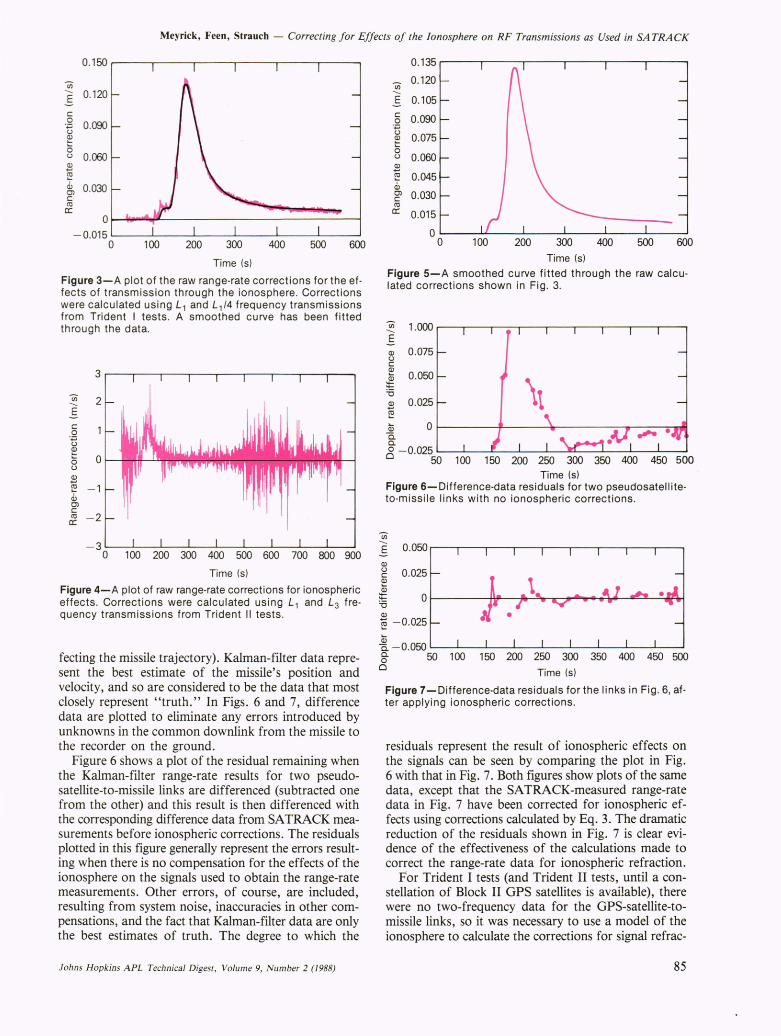
Thus, referring to Fig. 2, the measured range (Rm) data are as follows:
R m , = p, + RR + (time error) , ,
Rm2 = P2 + RR + (time error)2 ,
Rm3 = P3 + RR + (time error)3 ,
Rm4 = P4 + RR + (time error)4
82
Pseudosatellite on earth's surface
~ GPS satellites
~
~ .
'plMh Downrange support ship
'p1Mh ( Launch-area support ship or ground receiving station
Figure 1-SATRACK system elements. Signals transmitted from GPS satell ites and pseudosatellites are received at the missil e, translated to another frequency, and relayed to receivers on the earth 's surface. They are recorded for subsequent processing to determ ine the position and velocity of the missile .
The time error is common (to first order) in that the GPS transmitter clocks are synchronized, but not with the clock in the receiving equipment at the earth's surface. Also, R R' the range between the missile and the ground receiver, is common to each measured range. By differencing the R m values, the following measured values can be derived: p, - P2, p , - P3, p , - P4'
Those measured values, along with the values of R " R2 , R3, and R4 (i.e., the distances of the satellites from the center of the earth, derived from the known GPS satellite positions), yield sufficient information to sol e for the three-dimensional position of the missile. Similarly, measured range rate (Rm) from Doppler data can be used to solve for the velocity of the missile in three-
Johns Hopkins APL Technical Digest , Volume 9, umber 2 (198 J

Earth
~ Receiver on surface of the earth
Figure 2-The basic geometry used by the SATRACK system. The values of R 1, R 2, R 3, and R4 are derived from precise knowledge of the GPS satellite positions. The values of P1 + RR, P2 + RR, P3 + RR, and P4 + RR are measured by the SATRACK system.
dimensional space_ In the solutions, measurements from pseudo satellite transmissions can be treated in the same manner as transmissions from GPS satellites. If there are more than the minimum of four GPS satellites and pseudosatellites, redundant data are available, frequently permitting a more refined solution for position and velocity. The basic computations, however, assume that the transmissions are taking place in a vacuum, which they are not. A similar situation also holds for those velocity calculations determined from Doppler measurements. Thus, to achieve the missile-position accuracy required, the range and range-rate measurements must be corrected for the refraction effects of the ionosphere on the signals. (Similar correction must also be made for tropospheric effects.) We discuss below how the corrections for ionospheric effects on signals used in the SA TRACK system have been calculated, and comment briefly on procedures that will be implemented in the next available generation of GPS satellites.
MECHANIZATION AND FREQUENCY SELECTION
The original SA TRACK concept was to use a special constellation of satellites that would have permitted the selection of optimized frequencies. The concept became moot when the decision was made to use navigational GPS satellites. These satellites transmit three frequencies, LI (1575.42 MHz), L2 (1227.60 MHz), and L3 (1381.05 MHz), and use the pseudorandom noise spreadspectrum phase modulation, which gives the required information for determining slant range. On the early GPS satellites (Block I), however, only the Ll frequency is normally used to transmit the narrow 1.023-MHz clear acquisition code, while all frequencies transmit the wider 1O.23-MHz precision pseudorandom code. Later (Block II and subsequent) generations of the GPS satellites will
Johns Hopkins APL Technical Digest, Volume 9, Number 2 (1988)
also be able to transmit the clear acquisition code on the L3 frequency. Since the time span for the primary use of SA TRACK for Trident I tests occurred when the Block I GPS satellites alone would be available, only the LI frequency would be usable for SATRACK purposes. This was so because the bandwidth of the missile's translator was limited to the bandwidth of the clear acquisition code spectrum, so as to have sufficient translator output spectral power density. Thus, for Trident I tests, only one frequency could be used from the GPS satellites. For the pseudosatellites, however, LI and a second frequency could be used, and there was no requirement that that second frequency match one of the GPS frequencies. The LI /4 frequency (approximately 394 MHz) was therefore selected because there were other test range requirements for that transmission and because it was well separated from the LI frequency and thus suited to calculating ionospheric corrections to the LI -frequency data of the pseudosatellite-to-missile links. For Trident I tests, then, ionospheric corrections for the pseudosatellite-to-missile links could be calculated using two-frequency data. For the GPS satellite-to-missile links, however, the only available approach was to use an ionospheric model. This was achieved by fitting the model with the measured ionospheric data, . obtained from the dual-frequency pseudosatellite data for the missile flight time, and calculating the satellite-to-missile corrections based on the fitted ionospheric model.
BASIC COMPUTATION TO CORRECT FOR IONOSPHERIC EFFECTS
The satellites and pseudo satellites of the original SA TRACK system concept were designed to broadcast signals at two different frequencies. Data from one frequency would be used to calculate the required basic range and range-rate (Doppler) information, and these data and the additional data from the second frequency would be used to calculate directly the corrections for refraction by the ionosphere. The classical equations for calculating these ionospheric corrections to range-rate or Doppler data using two-frequency data are, to first order, as follows: 2
-II il K illl - - - P + - M+ EI
c II (1)
and
-12 K il12 - -- ilp + -M+ E2 ,
C 12 (2)
where ill = measured frequency shift or "Doppler measurement" over a measurement time interval,
1 = frequency (subscripts denote frequencies 1 and 2),
c speed of light, p true (vacuum) range between transmitter
and receiver,
83

Meyrick, FeeD, Strauch - Correcting for Effects of the Ionosphere on RF Transmissions as Used in SA TRACK
/l.p = change in P over the measurement time interval,
K constant, I integrated electron density along the line
of-sight path from transmitter to receiver, !lI change in lover the measurement time
interval, E noise in the Doppler measurement (/l./).
If ex = 11 /12, then solving Eqs. 1 and 2 for !lI results in
K _ -!lI+
II (3)
For the SATRACK system, /l.Iis a measured output from the system, and the desired quantity is /l.p. Thus, if Eq. 3 is solved for !lI, that value can be used in Eq. 1 or 2 to solve for /l.p. The problem of noise magnification when II and 12 are not sufficiently separated can be noted in the term (EI - ex (2)/(1 - ex 2
).
The classical equations for calculating ionospheric corrections to range using two-frequency data are, to first order, as follows:
PI
and
P2
where Pi
P
K' I I
-
-
K ' P +
112 1+01 (4)
K' P + Il I + 02 , (5)
range measured using frequency J;, true (vacuum) range between transmitter and receiver, constant, frequency, integrated electron density along the lineof-sight path from transmitter to receiver, noise in the range measurement.
Solving for I results in
(6)
Again, the value of I could be determined from the measured values of PI and P2, and the result could be used in Eqs. 4 and 5 to solve for the desired value of range (P) or range rate (/l.p). Because the mechanization of the SA TRACK system precludes very high precision in measuring the large value of P (thereby degrading the precision of Pil - Ph for any data point), the solution for I in Eq. 6 is inherently noisy. If, however, the values
84
of !lI derived from Eq. 3 are integrated, the result is significantly less noisy; the problem with this approach by itself is that the constant of integration is unknown. To obtain the constant of integration, curves of I versus time can be derived by integrating the !lIvalues ofEq. 3 and by computing I using Eq. 6. These values of I at common times can be differenced , and the result is the desired constant of integration. The difference values contain the noise of the curve derived from range measurements; but, if many difference values are used and averaged, the result is a satisfactory value for the constant of integration, which permits use of the values of I derived by integrating!lI alues obtained with the quieter /l.I from the SATRACK signals.
For those links between the GPS Block I atellites and the missile where only the single LI frequency is available, an ionospheric model would have to be used. The required values of !lI and I in Eqs. 1 and 4 would be obtained from this model.
EXPERIENCE In the final processing of SA TRACK data in a
Kalman fIlter program, Doppler data are more significant than range data. Also, conclusions that can be drawn from an examination of the range-rate corrections for ionospheric refraction are generally applicable to the corresponding range corrections. Therefore we will limit our discussion of details about the use of two-frequency data and ionospheric models to calculate ionospheric corrections to the case of corrections applied to range-rate data. Some of the plots shown here represent single links between the GPS satellite (or pseudosatellite) transmitters and the missile; others are derived from differencing the data from two different links. Link difference data are significant because they eliminate all anomalies and errors associated with the common link from the missile's translator to the ground recording station.
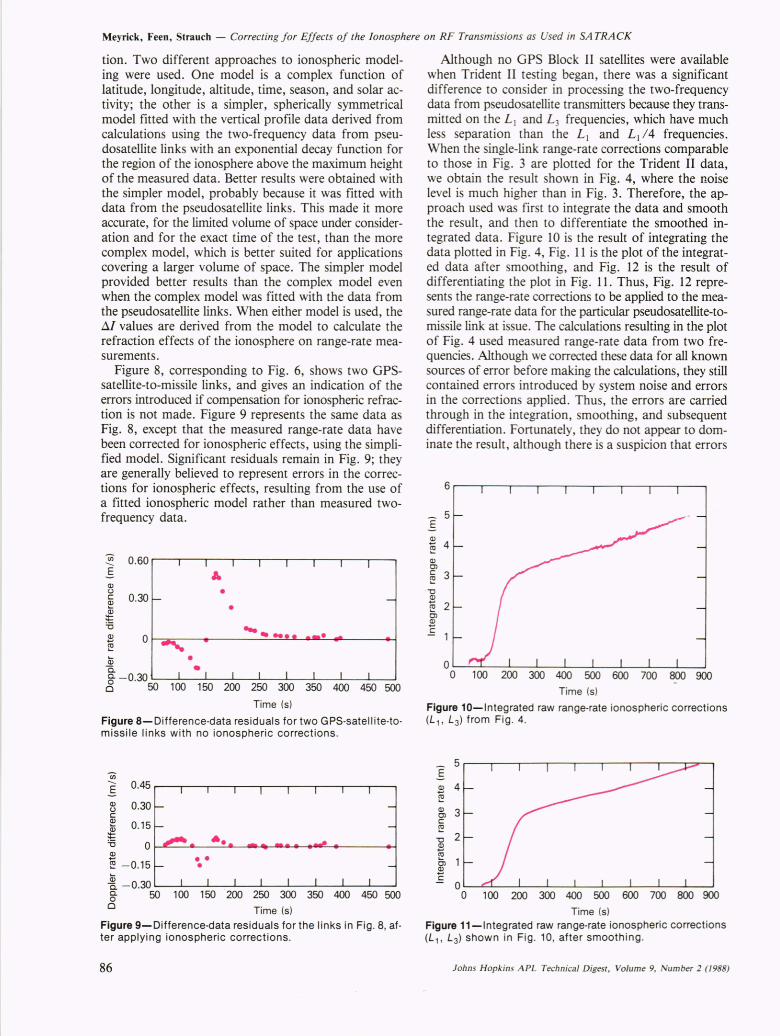
Range-rate corrections calculated using Eq. 3 for Trident I and II tests showed a significant difference in noise level because of the good separation between the LI and LI / 4 frequencies used in the Trident I tests and the poor separation between the L I and L 3 frequencies used in the Trident II tests. This difference can be seen by comparing Figs. 3 and 4. One can clearly see the increase in the noise in the Trident II test calculations (Fig. 4), resulting from -the lower value of ex (=11 /12) in the (E I - ex E2 )/ (1 - ex 2
) expre sion for noise. The curve in Fig. 3 shows "typical" characteristics of the ionospheric corrections for range rate on a pseudosatelliteto-missile link. Here, the noise Ie el is sufficiently low that a curve-fitting technique can be used to smooth the data before applying them as correction to the L )frequency Doppler measurements. The smoothed curve is shown superimposed on the raw data. Figure 5 show the smoothed curve by itself.
To see the effectiveness of these range-rate corrections, comparisons can be made with the final range-rate data produced by the Kalman filter (which is supplied with all SA TRACK data, data from the instrumentation in the missile, initial conditions data, and other data af-
Johns Hopkins APL Technical Digesc, Volume 9, umber 2 (19 J
Meyrick, FeeD, Strauch - Correcting for Effects of the Ionosphere on RF Transmissions as Used in SATRACK
0.150
~ E 0.120
c 0
0.090 '+=" u ~ 0 u 0.060 ~ ~ <h 0.030 Cl c ro a:
0
- 0.015 0 100 200 300 400 500 600
Time (s)
Figure 3-A plot of the raw range-rate corrections for the effects of transmission through the ionosphere. Corrections were calculated using L1 and L1/4 frequency transmissions from Trident I tests. A smoothed curve has been fitted through the data.
en 2 E
_3~ __ L-__ L-__ L-__ L-__ L-__ L-__ L-__ L-~
o 100 200 300 400 500 600 700 800 900
Time (s)
Figure 4-A plot of raw range-rate corrections for ionospheric effects. Corrections were calculated using L1 and L3 frequency transmissions from Trident II tests.
fecting the missile trajectory)_ Kalman-filter data represent the best estimate of the missile's position and velocity, and so are considered to be the data that most closely represent "truth." In Figs. 6 and 7, difference data are plotted to eliminate any errors introduced by unknowns in the common downlink from the missile to the recorder on the ground.
Figure 6 shows a plot of the residual remaining when the Kalman-filter range-rate results for two pseudosatellite-to-missile links are differenced (subtracted one from the other) and this result is then differenced with the corresponding difference data from SATRACK measurements before ionospheric corrections. The residuals plotted in this figure generally represent the errors resulting when there is no compensation for the effects of the ionosphere on the signals used to obtain the range-rate measurements. Other errors, of course, are included, resulting from system noise, inaccuracies in other compensations, and the fact that Kalman-filter data are only the best estimates of truth. The degree to which the
fohn s Hopkins APL Technical Digest, Volume 9, Number 2 (1988)
0.135
~ 0.120
E 0.105 c 0.090 0 '+=" u
0.075 ~ 0 u 0.060 ~ ~ 0.045 <h Cl 0.030 c ro a: 0.015
0 0 100 200 300 400 500 600
Time (s)
Figure 5-A smoothed curve fitted through the raw calculated corrections shown in Fig. 3.
~ 1.000 E Q) 0.075 u c Q)
0.050 Qj
\t :t:: '0 ~ 0.025 ~
Qj 0 ~------~------~--------__ ----~~ 0. 0. o - 0.025 L-----.J'------.JI:...-----.J'------.J __ .....JE:I'------.J'------.J'------.J'------'
o 50 100 150 200 250 300 350 400 450 500 Time (s)
Figure 6-Difference-data residuals for two pseudosatelliteto-missile links with no ionospheric corrections.
en ~ 0.050 Q) u 0.025 c Q)
Qj :t:: 0 '0 Q)
~ -0.025
Qj 0. - O. 050 ~ __ '--__ L-__ L-__ L-__ "--__ "--__ ..L...-__ -'-----'
§- 50 100 o
150 200 250 300 350 400 450 500
Time (s)
Figure 7-Difference-data residuals for the links in Fig . 6, after applying ionospheric corrections.
residuals represent the result of ionospheric effects on the signals can be seen by comparing the plot in Fig. 6 with that in Fig. 7. Both figures show plots of the same data, except that the SATRACK-measured range-rate data in Fig. 7 have been corrected for ionospheric effects using corrections calculated by Eq. 3 _ The dramatic reduction of the residuals shown in Fig. 7 is clear evidence of the effectiveness of the calculations made to correct the range-rate data for ionospheric refraction.
For Trident I tests (and Trident II tests, until a constellation of Block II GPS satellites is available), there were no two-frequency data for the GPS-satellite-tomissile links, so it was necessary to use a model of the ionosphere to calculate the corrections for signal refrac-
85
Meyrick, FeeD, Strauch - Correcting for Effects of the Ionosphere on RF Transmissions as Used in SA TRACK
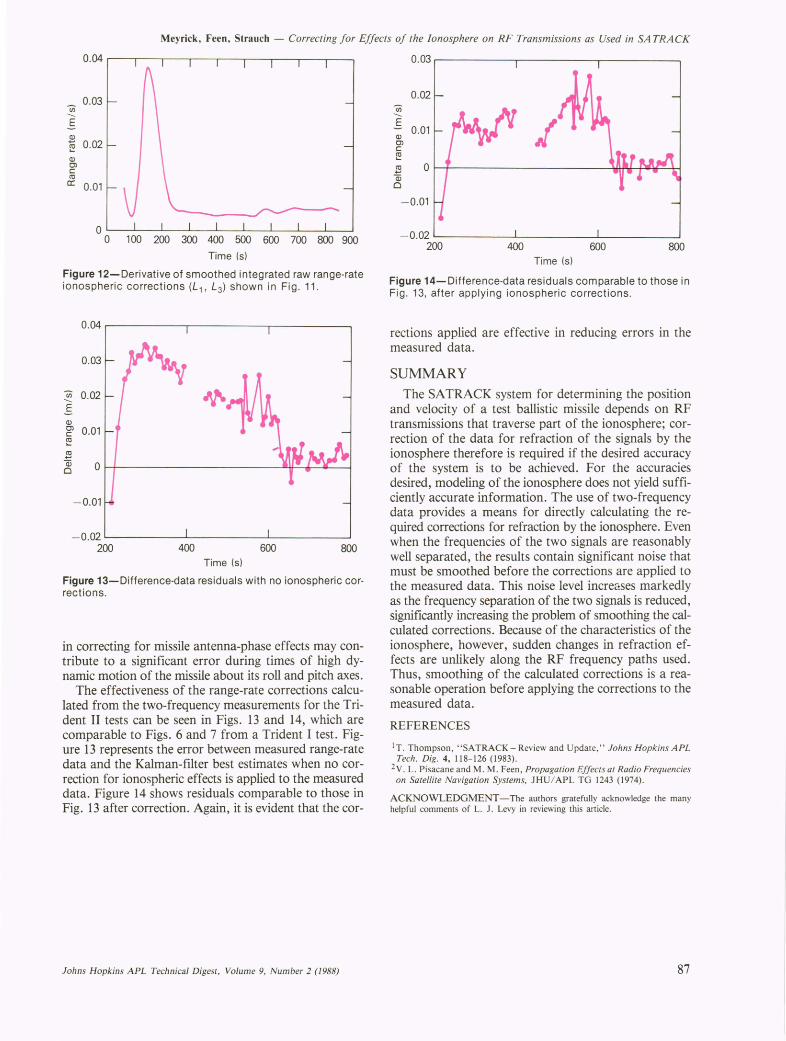
tion. Two different approaches to ionospheric modeling were used. One model is a complex function of latitude, longitude, altitude, time, season, and solar activity; the other is a simpler, spherically symmetrical model fitted with the vertical profile data derived from calculations using the two-frequency data from pseudosatellite links with an exponential decay function for the region of the ionosphere above the maximum height of the measured data. Better results were obtained with the simpler model, probably because it was fitted with data from the pseudosatellite links. This made it more accurate, for the limited volume of space under consideration and for the exact time of the test, than the more complex model, which is better suited for applications covering a larger volume of space. The simpler model provided better results than the complex model even when the complex model was fitted with the data from the pseudosatellite links. When either model is used, the M values are derived from the model to calculate the refraction effects of the ionosphere on range-rate measurements.
Figure 8, corresponding to Fig. 6, shows two GPSsatellite-to-missile links, and gives an indication of the errors introduced if compensation for ionospheric refraction is not made. Figure 9 represents the same data as Fig. 8, except that the measured range-rate data have been corrected for ionospheric effects, using the simplified model. Significant residuals remain in Fig. 9; they are generally believed to represent errors in the corrections for ionospheric effects, resulting from the use of a fitted ionospheric model rather than measured twofrequency data.
en 0.60 E I , I , , I I ,
A Q) u
0.30 • c f- -Q)
Cii • ~ '6
............ _e ~ 0 - ... ~ ...... Cii • a. , - , , , I I I I g- -0.30 o 50 100 150 200 250 300 350 400 450 500
Time (s)
Figure 8-Difference-data residuals for two GPS-satellite-tomissile links with no ionospheric corrections.
en E 0.45
Q) 0.30 u c Q)
0.15 Cii ~ '6 0 Q)
~ -0.15 •• •
A.
Cii a. - 0.30 L-------'_----'-_--'-_----'--_-'--_--'---_-'--------''---''
g- 50 100 150 ·200 250 300 350 400 450 500 o Time (s)
Figure 9-Difference-data residuals for the links in Fig . 8, after applying ionospheric corrections.
86
Although no GPS Block II satellites were available when Trident II testing began, there was a significant difference to consider in processing the two-frequency data from pseudosatellite transmitters because they transmitted on the L ) and L3 frequencies, which have much less separation than the L ) and L) 14 frequencies. When the single-link range-rate corrections comparable to those in Fig. 3 are plotted for the Trident II data, we obtain the result hown in Fig. 4, where the noise level is much higher than in Fig. 3. Therefore, the approach used was first to integrate the data and smooth the result, and then to differentiate the smoothed integrated data. Figure 10 is the result of integrating the data plotted in Fig. 4, Fig. 11 is the plot of the integrated data after smoothing, and Fig. 12 is the result of differentiating the plot in Fig. 11. Thus, Fig. 12 represents the range-rate corrections to be applied to the measured range-rate data for the particular pseudosatellite-tomissile link at issue. The calculations resulting in the plot of Fig. 4 used measured range-rate data from two frequencies. Although we corrected these data for all known sources of error before making the calculations, they still contained errors introduced by system noise and errors in the corrections applied . Thus, the errors are carried through in the integration, smoothing, and subsequent differentiation. Fortunately, they do not appear to dominate the result, although there is a suspicion that errors
6
E 5
~ 4 ~ Q) C'l c 3 ~ '0 ~
2 ro 0, ~ c
OL--~'-------''-------'_~_~_----'-_----'-_-L_~
o 100 200 300 400 500 600 700 800 900
Time (s)
Figure 10-lntegrated raw range-rate ionospheric corrections (L1 ' L3 ) from Fig. 4.
100 200 300 400 500 600 700 800 900
Time (s) Figure 11-lntegrated raw range-rate ionospheric correct ions (L b L3 ) shown in Fig . 10, after smooth ing.
f ohns Hopkins APL Technical Digesc, Volume 9, umber 2 (19 J
Meyrick, Feen, Strauch - Correcting f or Effects of the Ionosphere on RF Transmissions as Used in SA TRACK
0.04
~ 0.03
E
~ 0.02 ~ Q) CJ) c co a: 0.01
o ~--~ __ ~~~~ __ ~ __ -J __ -J __ ~ __ ~
o 100 200 300 400 500 600 700 800 900
Time (s)
Figure 12-Derivative of smoothed integrated raw range-rate ionospheric corrections (L 1 , L3) shown in Fig. 11 .
0.04 ,..---- --,------,-------,
0.03
~ 0.02 E Q) CJ) 0.01 c ~
~ Q3 0 0
-0.01
- 0.02 200 400 600 800
Time (s)
Figure 13-Difference-data residuals with no ionospheric corrections.
in correcting for missile antenna-phase effects may contribute to a significant error during times of high dynamic motion of the missile about its roll and pitch axes.
The effectiveness of the range-rate corrections calculated from the two-frequency measurements for the Trident II tests can be seen in Figs. 13 and 14, which are comparable to Figs. 6 and 7 from a Trident I test. Figure 13 represents the error between measured range-rate data and the Kalman-filter best estimates when no correction for ionospheric effects is applied to the measured data. Figure 14 shows residuals comparable to those in Fig. 13 after correction. Again, it is evident that the cor-
fohns Hopkins APL Technical Digest, Volume 9, Number 2 (1988)
0.03
0.02 en --E I 0.01 Q) CJ) c ~
~ 0 Q3 0
-0.01
- 0.02 200 400 600 800
Time (s)
Figure 14-Difference-data residuals comparable to those in Fig . 13, after applying ionospheric corrections.
rections applied are effective in reducing errors in the measured data.
SUMMARY
The SATRACK system for determining the position and velocity of a test ballistic missile depends on RF transmissions that traverse part of the ionosphere; correction of the data for refraction of the signals by the ionosphere therefore is required if the desired accuracy of the system is to be achieved. For the accuracies desired, modeling of the ionosphere does not yield sufficiently accurate information. The use of two-frequency data provides a means for directly calculating the required corrections for refraction by the ionosphere. Even when the frequencies of the two signals are reasonably well separated, the results contain significant noise that must be smoothed before the corrections are applied to the measured data. This noise level increr:ses markedly as the frequency separation of the two signals is reduced, significantly increasing the problem of smoothing the calculated corrections. Because of the characteristics of the ionosphere, however, sudden changes in refraction effects are unlikely along the RF frequency paths used. Thus, smoothing of the calculated corrections is a reasonable operation before applying the corrections to the measured data.
REFERENCES
IT . Thompson , "SATRACK - Review and Update," Johns Hopkins A PL Tech. Dig. 4, 118- 126 (1983).
2 V. L. Pisacane and M . M . Feen, Propagation Effects at Radio Frequencies on Satellite Navigation Systems, JHU/ APL TO 1243 (1974).
ACKNOWLEDGMENT-The authors gratefully acknowledge the many helpful comments of L. J . Levy in reviewing this article.
87

Meyrick, FeeD, Strauch - Correcting for Ef fects of the Ionosphere on RF Transmissions as Used in SATRACK
THE AUTHORS
CHARLES W. MEYRICK was born in Green Bay, Wis., in 1925. He received a B.S. degree from the U.S. Naval Academy in 1949, a B.S. in aeronautical engineering from the U.S. Naval Postgraduate School in 1955, and an M.S. in aeronautical engineering from the Massachusetts Institute of Technology in 1956. While on active duty in the Navy, he was an aviator and an Aeronautical Engineering Duty Officer. He was also program manager for the Navy's TRANSIT navigation satellite program. After retiring from the Navy in 1967, he joined Raytheon Co., where he was program man
MICHAEL M. FEEN received a B.S. in mathematics from Tulane University in 1960 and an M.S. in chemistry from the University of Wisconsin, Madison, in 1962. Mter joining APL in 1962, he studied ionospheric effects on satellite radio navigation signals and techniques for providing corrections for these effects in single- and dual-frequency satellite navigation systems. This work resulted in the development of ionospheric models that were subsequently used in SA TRACK signal processing. In 1979, he joined the Strategic Systems Department to work on the tracking, correction,
ager for the SPARROW missile. Mr. Meyrick joined APL in 1978 and works in the Strategic Systems Department as Group Supervisor of the SATRACK Preprocessing Group, which is responsible for the initial analysis and processing of raw SA TRACK data from TRIDENT missile flight tests. Mr. Meyrick has also been involved with various biomedical programs at APL.
and editing of the SA TRACK I system signals. With the advent of the SA TRACK II system, he has been involved in the design, development, and implementation of the system and is responsible for SA TRACK I and II signal preprocessing and analysis efforts.
88
ROBERT L. STRAUCH was born in Baltimore in 1936. He received a B.S. degree in mathematics from Loyola College in 1958 and an M.S. in mathematics from the University of Notre Dame in 1960. He was a teaching assistant in mathematics while at Notre Dame and an instructor in mathematics at Loyola College from 1960 to 1962.
Mr. Strauch worked for VItrO LaIr oratories from 1962 to 1967, participating in modeling and system simulation studies for guided missile and ballistic weapon systems. Since joining Challenger Research, Inc. in 1967 (acquired by EG&G,
Inc. in 1972), he has done modeling, simulation, and computer programming for various Navy missile and shipboard fIre control and sonar systems. Under contract to APL since 1976, he has participated in the development and operation of the SA TRACK processing facilities for the TRIDENT I and II weapon system programs. He is a member of the Mathematical Association of America and the Society for Industrial and Applied Mathematics .
Johns Hopkins A PL Technical Digesr, Volum e 9, umber 2 (1 9 J