Embed Size (px)
Citation preview

Corpus methods in linguistics and NLPLecture 4: Quantitative methods
UNIVERSITY OF
GOTHENBURG
Richard Johansson
November 17, 2015

-20pt
UNIVERSITY OF
GOTHENBURG
the remaining lectures
I all: quantitative methods (today)
I technical track: distributional semantics (Nov 24)
I nontechnical track: historical corpora (Nov 26)
I technical track: large-scale data processing (Dec 1)
I nontechnical track: investigations in syntax (Dec 8)

-20pt
UNIVERSITY OF
GOTHENBURG
basic idea in quantitative investigations
I our research question might be hard to measure directly!
I a proxy is something that is easy to observe, but that we think
gives us information about what we really care about
I so we need to reduce the research question to something thatcan be measured numerically and automatically
I for instance, we're interested in text complexity and we use thesentence length as a proxy
I the selection of a proxy must be well motivated unless it is
already well established
I don't forget that the proxy is a proxy
-20pt
UNIVERSITY OF
GOTHENBURG
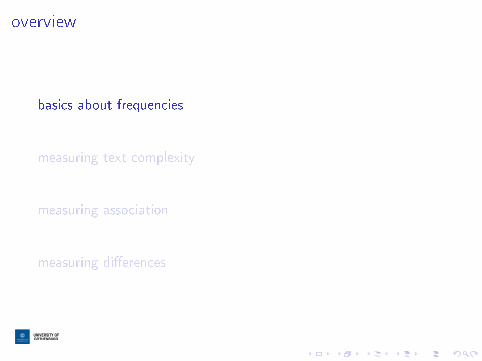
overview
basics about frequencies
measuring text complexity
measuring association
measuring di�erences

-20pt
UNIVERSITY OF
GOTHENBURG
frequencies
I the most basic quantitative measure is probably some sort offrequency
I for instance, that's what you use in the two search assignments
I absolute frequency: �how many X are there�?
I relative frequency: �how common is X�?
I comparing frequencies: � is X more common than Y�?
-20pt
UNIVERSITY OF
GOTHENBURG
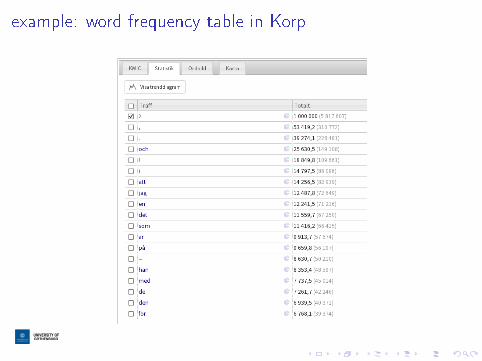
example: word frequency table in Korp

-20pt
UNIVERSITY OF
GOTHENBURG
example: word frequency table in Antconc

-20pt
UNIVERSITY OF
GOTHENBURG
terminology: type/token distinction
I a word token is a single occurrence of a word: a corpus
consists of tokens
I a word type is a unique word: a vocabulary consists of types

-20pt
UNIVERSITY OF
GOTHENBURG
properties of word frequencies
I word frequencies follow a Zipf distribution
I the corpus is dominated by common word typesI the 50 most frequent word types cover about 41% of the
corpora at the Swedish Language Bank
I the vocabulary is dominated by rare word typesI of the 11,927,698 observed word types, 7,881,083 (66%)
occur only once (hapax legomena)I in an English corpus I investigated, about 42%
I a couple of references on word distributions:I Baayen, R.H. 2001. Word frequency distributions. Kluwer.I Baroni, M. 2009. Distributions in text. In Corpus linguistics:
An international handbook, Volume 2. Mouton de Gruyter.

-20pt
UNIVERSITY OF
GOTHENBURG
practical consequences of Zipf's law
I the Zipf distribution has a heavy tailI there are lots of rare wordsI even if each rare word occurs with a very small probablity, it's
very likely to encounter some rare word

-20pt
UNIVERSITY OF
GOTHENBURG
overview
basics about frequencies
measuring text complexity
measuring association
measuring di�erences

-20pt
UNIVERSITY OF
GOTHENBURG
simple complexity measures: overview
I complexity measures of various kinds are used in a wide
range of research
I examples:I how does the language change in people a�ected by
Alzheimer's disease? Hirst & Wei Feng: Changes in Style in Authors with
Alzheimer's Disease, English Studies 93:3, 2012
I which features are typical of translated text? Volansky et al.: On the
Features of Translationese, Literary and Linguistic Computing
I what features from L1 can we see in L2? Tetreault et al.: A Report on
the First Native Language Identi�cation Shared Task, WS on Innovative Use of NLP for
Building Educational Applications
I for an overview of a wide range of complexity measures, see K.
Heimann Mühlenbock, I see what you mean, dissertation from
two years ago

-20pt
UNIVERSITY OF
GOTHENBURG
average sentence length
number of words
number of sentences
0 20 40 60 80 100meningslängd
0.00
0.01
0.02
0.03
0.04
0.05
0.06
0.07
0.08
0.09
rela
tiv f
rekv
ens
Läkartidningen (18.28)Läsbart (10.85)Samhällsvetenskap (20.02)

-20pt
UNIVERSITY OF
GOTHENBURG
in Korp

-20pt
UNIVERSITY OF
GOTHENBURG
type�token ratio
I simple idea: if the text is more complex, the author uses a
more varied vocabulary so there's a larger number of word
types (unique words)
I the type�token ratio is de�ned:
TTR =number of word types
number of word tokens
I TTR is very popular, e.g. when studying how child language
develops over time, or the e�ect of some impairment

-20pt
UNIVERSITY OF
GOTHENBURG
problems with TTR
I despite its popularity, using TTR can be risky, because it is
sensitive to the size of the text
I a 2000-word text doesn't normally have twice the vocabularysize of a 1000-word text!
I extreme case: if the text consists of one word, the TTR is100%
I see for instance B.J. Richards (1987): Type/Token Ratios:What Do They Tell Us? J. of Child Language 14:201-9.
I solution: split the text into pieces of the same length, compute
TTR over each piece, and take the average

-20pt
UNIVERSITY OF
GOTHENBURG
readability indices
I a readability index attempts to quantify how hard a text is to
read
I the Flesch�Kincaid score:
FC = 206.835−1.015 · nbr of tokens
nbr of sentences−84.6 · nbr of syllables
nbr of tokens
I in Swedish readability research, the LIX score
(läsbarhetsindex) is popular:
LIX =nbr of tokens
nbr of sentences+ 100 · nbr of tokens of length > 6
nbr of tokens
I < 25: very easy (e.g. children's books)I . . .I > 60: very dense (e.g. scienti�c prose)

-20pt
UNIVERSITY OF
GOTHENBURG
other measures. . .
I lexical density:
LD =number of content words
number of word tokens
I frequencies for the most common function words

-20pt
UNIVERSITY OF
GOTHENBURG
example: the e�ect of Alzheimer's disease
I see Hirst & Wei Feng: Changes in Style in Authors withAlzheimer's Disease, English Studies 93:3, 2012

-20pt
UNIVERSITY OF
GOTHENBURG
example: selecting suitable sentences for a learner
I what learner level (e.g. according to CEFR) do you need tounderstand the following Swedish sentences?
I Flickan sover. → A1
I Under förberedelsetiden har en baslinjestudie utförts för attkartlägga bland annat diabetesärftlighet, oral glukostolerans,mat och konditionsvanor och socialekonomiska faktorer iåldrarna 35-54 år i �era kommuner inom Nordvästra ochSydöstra sjukvårdsområdena (NVSO resp SÖSO). → C2
I Pilán et al. (2014) Rule-based and machine learning approaches for second
language sentence-level readability

-20pt
UNIVERSITY OF
GOTHENBURG
Ildikó's sentence complexity measures

-20pt
UNIVERSITY OF
GOTHENBURG
overview
basics about frequencies
measuring text complexity
measuring association
measuring di�erences

-20pt
UNIVERSITY OF
GOTHENBURG
measures of strength of association
I what are the most typical objects of the verb write?
I what words would we expect to see near the word Lumpur?
I with association measures, we can discover statistical
connections between linguistic units
I . . . for instance, between wordsI idioms, �xed phrases, cliches, collocations, . . .
I naively, we could count the most frequently occurring pairsI but this can be misleading � why?

-20pt
UNIVERSITY OF
GOTHENBURG
measures of strength of association: better
I most association measured used in practice check whether two
word types x and y cooccur unexpectedly often
I that is, more often than what could be expected from x and yconsidered independently
I a comprehensive survey of association measures:I Evert, S. 2005. The statistics of word cooccurrences: Word
pairs and collocations. IMS, Stuttgart.

-20pt
UNIVERSITY OF
GOTHENBURG
example of an association measure: PMI
I we de�ne the PMI (Pointwise Mutual Information) as
PMI = logP(x , y)
P(x) · P(y)
(where P(x) means the chance of observing x , etc)
I intuition: this score isI large positive number if x and y co-occur more often than
would be expected by chanceI and conversely, large negative number if x and y co-occur less
often than expectedI near zero if they are independent
I remember: κ for inter-annotator agreement

-20pt
UNIVERSITY OF
GOTHENBURG
improved PMI: LMI and normalized PMI
I PMI has a tendency to give too much importance to rare words
I Adam Kilgarrif has suggested a PMI variant that he terms
Lexicographer's Mutual Information:
LMI = count(x,y) · log P(x , y)
P(x) · P(y)
I Gerlof Bouma (see here) proposed a normalized PMI that
gives values between 1 and -1:
NPMI = logP(x , y)
P(x) · P(y)/− logP(x , y)

-20pt
UNIVERSITY OF
GOTHENBURG
example: frequencies vs normalized PMI in Europarl
of the 137051
in the 77307
to the 53954
, the 52695
, and 45135
on the 43023
the European 41172
that the 40803
and the 38411
the Commission 36225
, I 34503
for the 32333
to be 31677
President , 29707
, which 29358
it is 27150
Middle East 0.971
Amendments Nos 0.968
Member States 0.934
Amendment No 0.918
Human Rights 0.902
Mr President 0.846
next item 0.846
human rights 0.840
United Nations 0.840
laid down 0.838
once again 0.826
United Kingdom 0.792
European Union 0.792
Of course 0.780
With regard 0.769
carried out 0.763

-20pt
UNIVERSITY OF
GOTHENBURG
AntConc

-20pt
UNIVERSITY OF
GOTHENBURG
word sketches
I corpus search tools such as the Sketch Engine and Korp can
make �word sketches� (Korp: ordbild)
I for a word: print the words most strongly associated with it

-20pt
UNIVERSITY OF
GOTHENBURG
overview
basics about frequencies
measuring text complexity
measuring association
measuring di�erences

-20pt
UNIVERSITY OF
GOTHENBURG
measuring di�erences between corpora
I is news text more similar to �ction than to chat logs?
I useless question: we need to operationalize it somehowI we �rst make a �pro�le� of each corpus that summarizes some
statistical properties we're interested inI we then use some measure to compare the pro�les
I for an overview, see Kilgarri� (2001) Comparing corpora
I in the examples, we'll assume that the pro�les are based on
word frequencies, but in principle we could use some other
information as well (e.g. PoS tags or syntax)

-20pt
UNIVERSITY OF
GOTHENBURG
example: frequencies in Europarl and Wikipedia
the 893691
of 448588
to 429379
and 353080
in 276178
that 223706
is 214560
a 210742
I 140165
for 139694
on 125430
this 118811
be 116139
we 109064
not 97283
are 96053
the 791106
of 517461
and 358059
in 276556
to 271909
a 248975
is 156074
as 106784
was 98185
by 93357
that 93127
for 92585
with 79604
on 71310
are 65161
from 59820

-20pt
UNIVERSITY OF
GOTHENBURG
comparing frequency pro�les
I Kilgarri�'s article describes a number of ways to comparefrequency pro�les
I for instance, comparing distributions or ranks
I Spearman's rank correlation coe�cient compares how
much the ranks di�er between two frequency tables:
r = 1−6 ·
∑d2i
n · (n2 − 1)
where di is the rank di�erence for word i , and n the number of
words
I the maximal value is 1: the pro�les are identical
I can be computed in Excel and many data analysis packages

-20pt
UNIVERSITY OF
GOTHENBURG
example: comparing three corpora
I frequency pro�les (the top 500 words) for two news corpora:
Dagens Nyheter (1987), Göteborgsposten (2009), and a
collection of novels
I comparison using Spearman's coe�cient:
DN 1987 GP 2009 novels
DN 1987 1 0.98 0.89
GP 2009 1 0.88
novels 1

-20pt
UNIVERSITY OF
GOTHENBURG
using the comparison function in Korp
I in addition to just printing a measure of the di�erences
between the corpora, it can be informative to highlight the
di�erences

-20pt
UNIVERSITY OF
GOTHENBURG
words in easy-to-read and academic writing

-20pt
UNIVERSITY OF
GOTHENBURG
PoS tags in easy-to-read and academic writing
-20pt
UNIVERSITY OF
GOTHENBURG
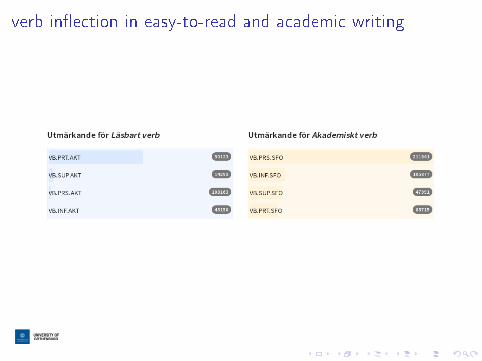
verb in�ection in easy-to-read and academic writing

-20pt
UNIVERSITY OF
GOTHENBURG
adjectives describing girls and boys in Göteborgsposten

-20pt
UNIVERSITY OF
GOTHENBURG
introduction to the next assignment (technical track)
I measuring associations:I what are the most important objects of the verb eat?
I comparing genres

![JUDGING CORPUS LINGUISTICS...2020] JUDGING CORPUS LINGUISTICS 15 determines in part whether corpus linguistics should displace other interpretive sources. In that light, perhaps the](https://img.pdfslide.us/doc/110x75/6137f1e90ad5d2067648f402/judging-corpus-linguistics-2020-judging-corpus-linguistics-15-determines-in.jpg)