Embed Size (px)
Citation preview

Half year results 2018.
Presented by: Jamie Pherous, Founder & Managing Director
Date: 20th February, 2018
CORPORATE TRAVEL MANAGEMENT
For
per
sona
l use
onl
y
Disclaimer
The information in this presentation does not constitute personal investment advice. The presentation is not intended to be comprehensive or provide all
information required by investors to make an informed decision on any investment in Corporate Travel Management Limited ACN 131 207 611 (Company). In
preparing this presentation, the Company did not take into account the investment objectives, financial situation and particular needs of any particular
investor.
Further advice should be obtained from a professional investment adviser before taking any action on any information dealt with in the presentation. Those
acting upon any information without advice do so entirely at their own risk.
Whilst this presentation is based on information from sources which are considered reliable, no representation or warranty, express or implied, is made or
given by or on behalf of the Company, any of its directors, or any other person about the accuracy, completeness or fairness of the information or opinions
contained in this presentation. No responsibility or liability is accepted by any of them for that information or those opinions or for any errors, omissions,
misstatements (negligent or otherwise) or for any communication written or otherwise, contained or referred to in this presentation.
Accordingly, neither the Company nor any of its directors, officers, employees, advisers, associated persons or subsidiaries are liable for any direct, indirect or
consequential loss or damage suffered by any person as a result of relying upon any statement in this presentation or any document supplied with this
presentation, or by any future communications in connection with those documents and all of those losses and damages are expressly disclaimed.
Any opinions expressed reflect the Company’s position at the date of this presentation and are subject to change. No assurance is given by the Company
that any capital raising referred to in this presentation will proceed.
The distribution of this presentation in jurisdictions outside Australia may be restricted by law and you should observe any such restrictions. This presentation
may not be transmitted in the United States or distributed, directly or indirectly, in the United States or to any US persons, and does not constitute an offer to
sell, or a solicitation of an offer to buy, securities in the United States, and is not available to persons in the United States or to US persons.
PAGE 2
For
per
sona
l use
onl
y
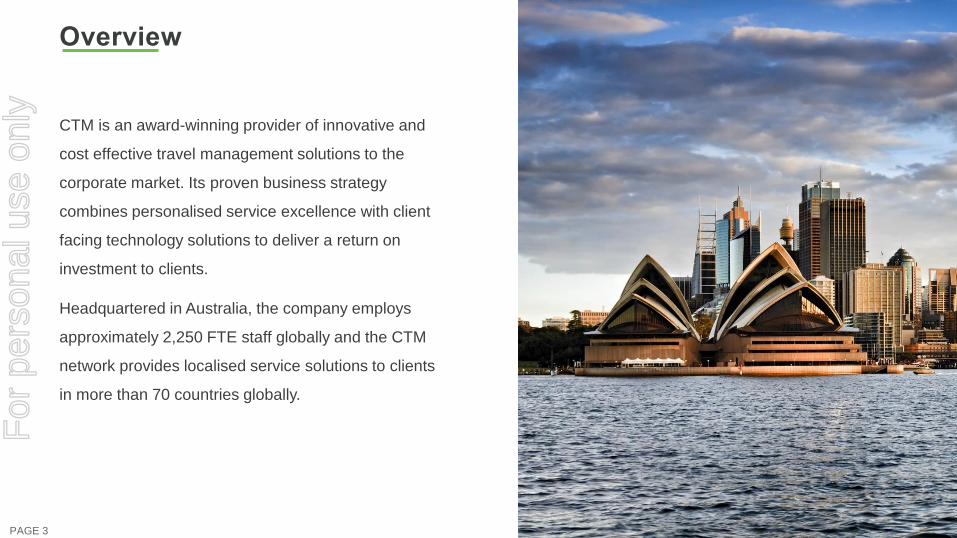
CTM is an award-winning provider of innovative and
cost effective travel management solutions to the
corporate market. Its proven business strategy
combines personalised service excellence with client
facing technology solutions to deliver a return on
investment to clients.
Headquartered in Australia, the company employs
approximately 2,250 FTE staff globally and the CTM
network provides localised service solutions to clients
in more than 70 countries globally.
Overview
PAGE 3
For
per
sona
l use
onl
y
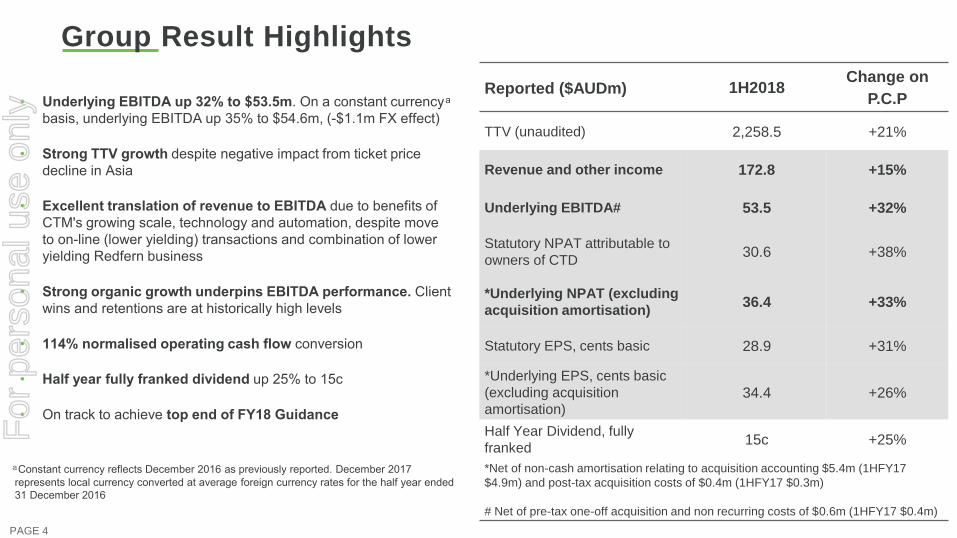
Group Result Highlights
Underlying EBITDA up • 32% to $53.5m. On a constant currency
basis, underlying EBITDA up 35% to $54.6m, (-$1.1m FX effect)
Strong TTV growth • despite negative impact from ticket price
decline in Asia
Excellent translation of revenue to EBITDA • due to benefits of
CTM's growing scale, technology and automation, despite move
to on-line (lower yielding) transactions and combination of lower
yielding Redfern business
Strong organic growth underpins EBITDA performance. • Client
wins and retentions are at historically high levels
114• % normalised operating cash flow conversion
Half year fully franked dividend • up 25% to 15c
On track to achieve • top end of FY18 Guidance
Reported ($AUDm) 1H2018Change on
P.C.P
TTV (unaudited) 2,258.5 +21%
Revenue and other income 172.8 +15%
Underlying EBITDA# 53.5 +32%
Statutory NPAT attributable to
owners of CTD30.6 +38%
*Underlying NPAT (excluding
acquisition amortisation) 36.4 +33%
Statutory EPS, cents basic 28.9 +31%
*Underlying EPS, cents basic
(excluding acquisition
amortisation) 34.4 +26%
Half Year Dividend, fully
franked15c +25%
*Net of non-cash amortisation relating to acquisition accounting $5.4m (1HFY17
$4.9m) and post-tax acquisition costs of $0.4m (1HFY17 $0.3m)
# Net of pre-tax one-off acquisition and non recurring costs of $0.6m (1HFY17 $0.4m)
PAGE 4
Constant currency reflects December 2016 as previously reported. December 2017
represents local currency converted at average foreign currency rates for the half year ended
31 December 2016
For
per
sona
l use
onl
y

Growth profile.
For
per
sona
l use
onl
y
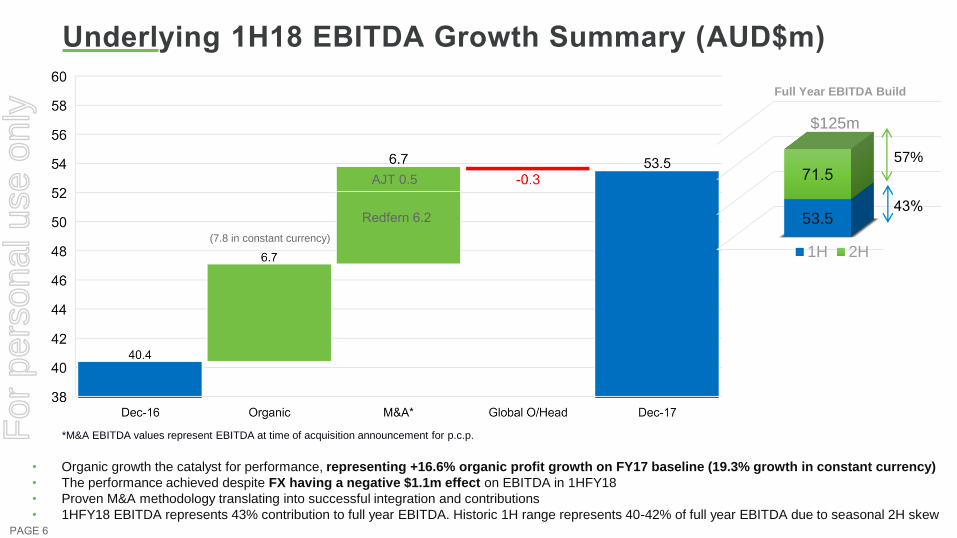
Underlying 1H18 EBITDA Growth Summary (AUD$m)
• Organic growth the catalyst for performance, representing +16.6% organic profit growth on FY17 baseline (19.3% growth in constant currency)
• The performance achieved despite FX having a negative $1.1m effect on EBITDA in 1HFY18
• Proven M&A methodology translating into successful integration and contributions
• 1HFY18 EBITDA represents 43% contribution to full year EBITDA. Historic 1H range represents 40-42% of full year EBITDA due to seasonal 2H skew
*M&A EBITDA values represent EBITDA at time of acquisition announcement for p.c.p.
PAGE 6
AJT 0.5
Redfern 6.2
(7.8 in constant currency)
53.5
71.5
$125m
Full Year EBITDA Build
1H 2H
43%
57%
For
per
sona
l use
onl
y
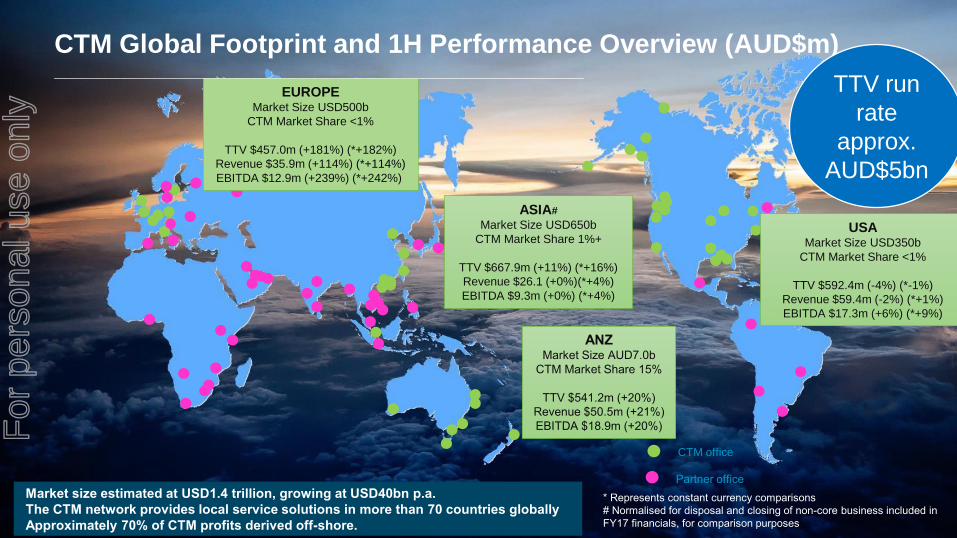
Market size estimated at USD1.4 trillion, growing at USD40bn p.a.
The CTM network provides local service solutions in more than 70 countries globally
Approximately 70% of CTM profits derived off-shore.
CTM office
Partner office
USAMarket Size USD350b
CTM Market Share <1%
TTV $592.4m (-4%) (*-1%)
Revenue $59.4m (-2%) (*+1%)
EBITDA $17.3m (+6%) (*+9%)
EUROPEMarket Size USD500b
CTM Market Share <1%
TTV $457.0m (+181%) (*+182%)
Revenue $35.9m (+114%) (*+114%)
EBITDA $12.9m (+239%) (*+242%)
ASIA#
Market Size USD650b
CTM Market Share 1%+
TTV $667.9m (+11%) (*+16%)
Revenue $26.1 (+0%)(*+4%)
EBITDA $9.3m (+0%) (*+4%)
ANZMarket Size AUD7.0b
CTM Market Share 15%
TTV $541.2m (+20%)
Revenue $50.5m (+21%)
EBITDA $18.9m (+20%)
CTM Global Footprint and 1H Performance Overview (AUD$m) _____________________________________________________
* Represents constant currency comparisons
# Normalised for disposal and closing of non-core business included in
FY17 financials, for comparison purposes
TTV run
rate
approx.
AUD$5bn
For
per
sona
l use
onl
y
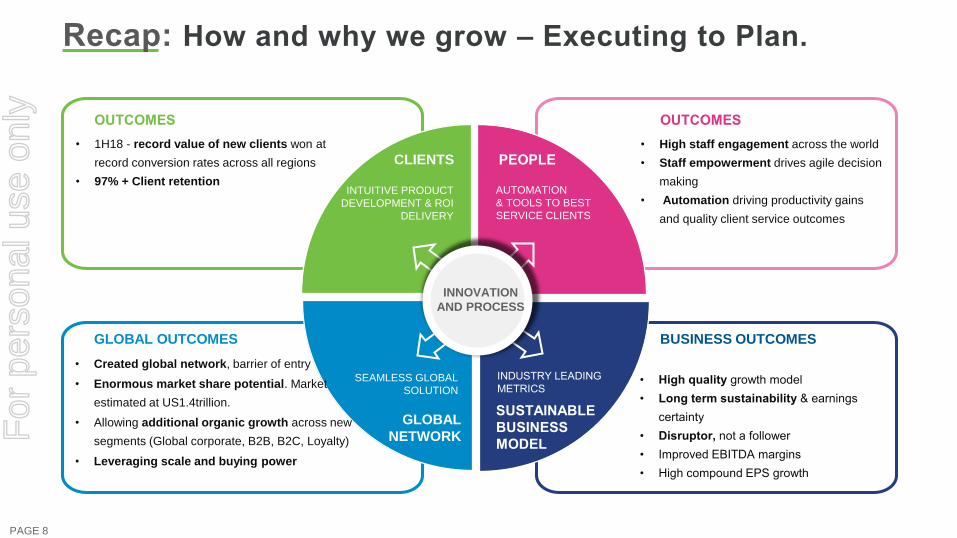
Recap: How and why we grow – Executing to Plan.
AUTOMATION
& TOOLS TO BEST
SERVICE CLIENTS
INTUITIVE PRODUCT
DEVELOPMENT & ROI
DELIVERY
SEAMLESS GLOBAL
SOLUTION
INDUSTRY LEADING
METRICS
CLIENTS PEOPLE
GLOBAL
NETWORK
SUSTAINABLE
BUSINESS
MODEL
• High staff engagement across the world
• Staff empowerment drives agile decision
making
• Automation driving productivity gains
and quality client service outcomes
• 1H18 - record value of new clients won at
record conversion rates across all regions
• 97% + Client retention
• Created global network, barrier of entry
• Enormous market share potential. Market
estimated at US1.4trillion.
• Allowing additional organic growth across new
segments (Global corporate, B2B, B2C, Loyalty)
• Leveraging scale and buying power
High quality • growth model
Long term sustainability • & earnings
certainty
Disruptor,• not a follower
Improved EBITDA margins•
High compound EPS growth•
INNOVATION
AND PROCESS
OUTCOMES
GLOBAL OUTCOMES
OUTCOMES
BUSINESS OUTCOMES
PAGE 8
For
per
sona
l use
onl
y

Regional
Performance.
For
per
sona
l use
onl
y
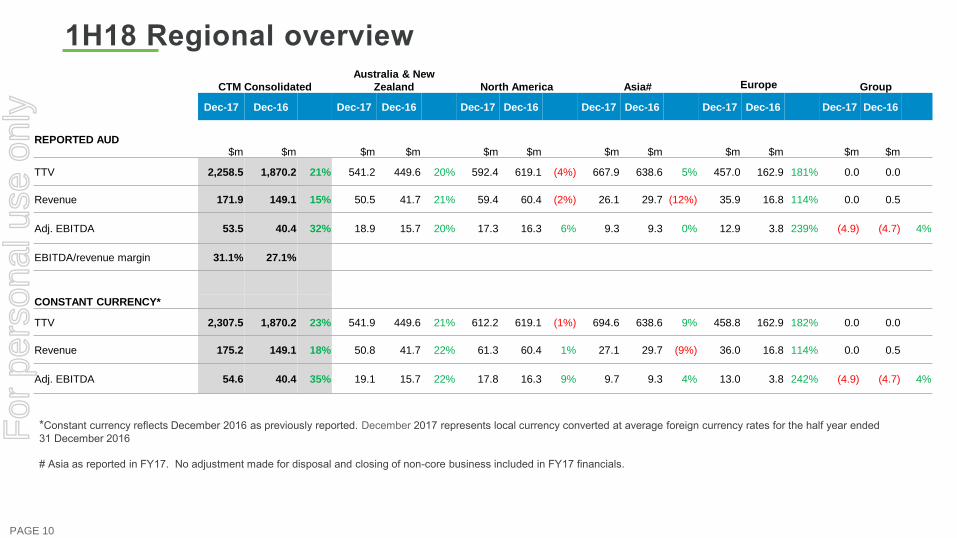
1H18 Regional overview
PAGE 10
*Constant currency reflects December 2016 as previously reported. December 2017 represents local currency converted at average foreign currency rates for the half year ended
31 December 2016
# Asia as reported in FY17. No adjustment made for disposal and closing of non-core business included in FY17 financials.
CTM Consolidated
Australia & New
Zealand North America Asia# Europe Group
Dec-17 Dec-16 Dec-17 Dec-16 Dec-17 Dec-16 Dec-17 Dec-16 Dec-17 Dec-16 Dec-17 Dec-16
REPORTED AUD$m $m $m $m $m $m $m $m $m $m $m $m
TTV 2,258.5 1,870.2 21% 541.2 449.6 20% 592.4 619.1 (4%) 667.9 638.6 5% 457.0 162.9 181% 0.0 0.0
Revenue 171.9 149.1 15% 50.5 41.7 21% 59.4 60.4 (2%) 26.1 29.7 (12%) 35.9 16.8 114% 0.0 0.5
Adj. EBITDA 53.5 40.4 32% 18.9 15.7 20% 17.3 16.3 6% 9.3 9.3 0% 12.9 3.8 239% (4.9) (4.7) 4%
EBITDA/revenue margin 31.1% 27.1%
CONSTANT CURRENCY*
TTV 2,307.5 1,870.2 23% 541.9 449.6 21% 612.2 619.1 (1%) 694.6 638.6 9% 458.8 162.9 182% 0.0 0.0
Revenue 175.2 149.1 18% 50.8 41.7 22% 61.3 60.4 1% 27.1 29.7 (9%) 36.0 16.8 114% 0.0 0.5
Adj. EBITDA 54.6 40.4 35% 19.1 15.7 22% 17.8 16.3 9% 9.7 9.3 4% 13.0 3.8 242% (4.9) (4.7) 4%
For
per
sona
l use
onl
y
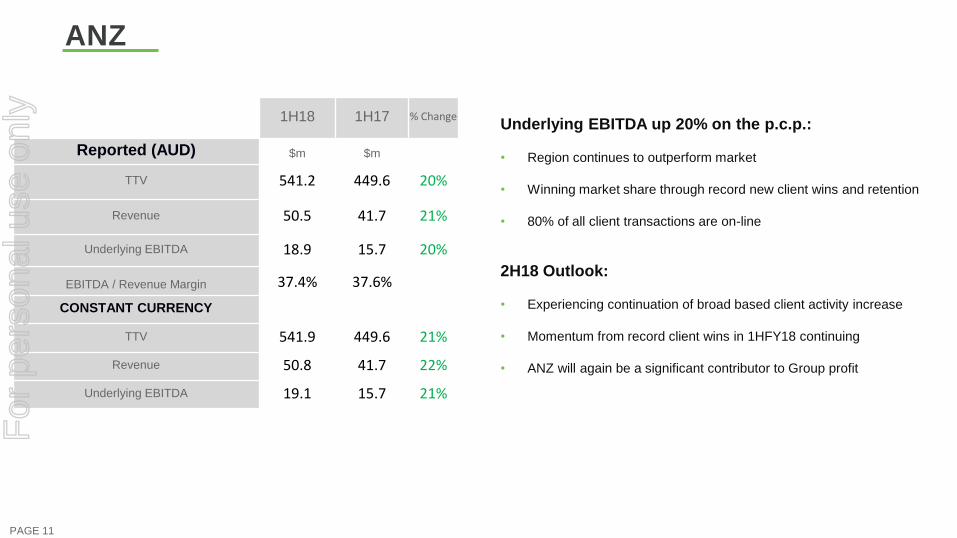
ANZ
1H18 1H17 % Change
Reported (AUD) $m $m
TTV 541.2 449.6 20%
Revenue 50.5 41.7 21%
Underlying EBITDA 18.9 15.7 20%
EBITDA / Revenue Margin 37.4% 37.6%
CONSTANT CURRENCY
TTV 541.9 449.6 21%
Revenue 50.8 41.7 22%
Underlying EBITDA 19.1 15.7 21%
Underlying EBITDA up 20% on the p.c.p.:
• Region continues to outperform market
• Winning market share through record new client wins and retention
• 80% of all client transactions are on-line
2H18 Outlook:
• Experiencing continuation of broad based client activity increase
• Momentum from record client wins in 1HFY18 continuing
• ANZ will again be a significant contributor to Group profit
PAGE 11
For
per
sona
l use
onl
y
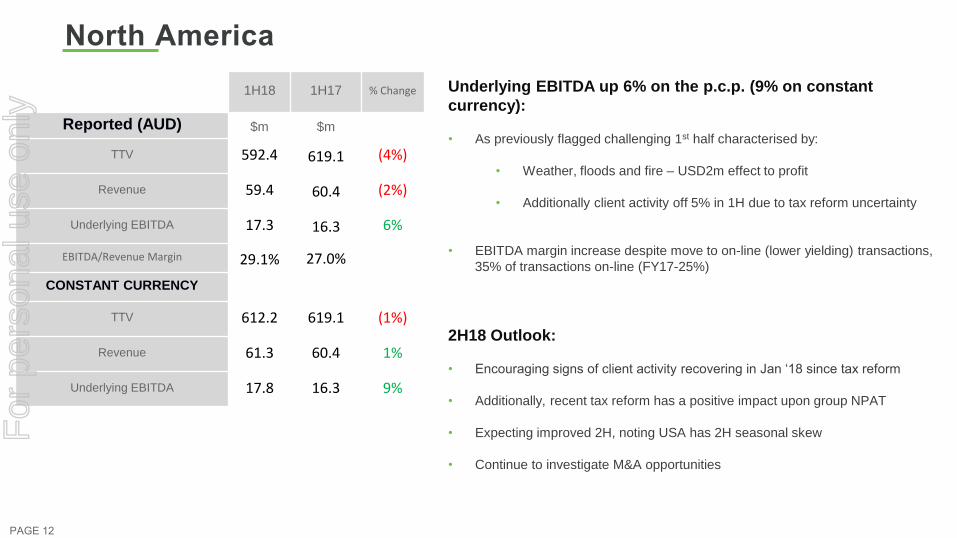
North America
1H18 1H17 % Change
Reported (AUD) $m $m
TTV 592.4 619.1 (4%)
Revenue 59.4 60.4 (2%)
Underlying EBITDA 17.3 16.3 6%
EBITDA/Revenue Margin 29.1% 27.0%
CONSTANT CURRENCY
TTV 612.2 619.1 (1%)
Revenue 61.3 60.4 1%
Underlying EBITDA 17.8 16.3 9%
Underlying EBITDA up 6% on the p.c.p. (9% on constant
currency):
• As previously flagged challenging 1st half characterised by:
• Weather, floods and fire – USD2m effect to profit
• Additionally client activity off 5% in 1H due to tax reform uncertainty
• EBITDA margin increase despite move to on-line (lower yielding) transactions,
35% of transactions on-line (FY17-25%)
2H18 Outlook:
• Encouraging signs of client activity recovering in Jan ‘18 since tax reform
• Additionally, recent tax reform has a positive impact upon group NPAT
• Expecting improved 2H, noting USA has 2H seasonal skew
• Continue to investigate M&A opportunities
PAGE 12
For
per
sona
l use
onl
y
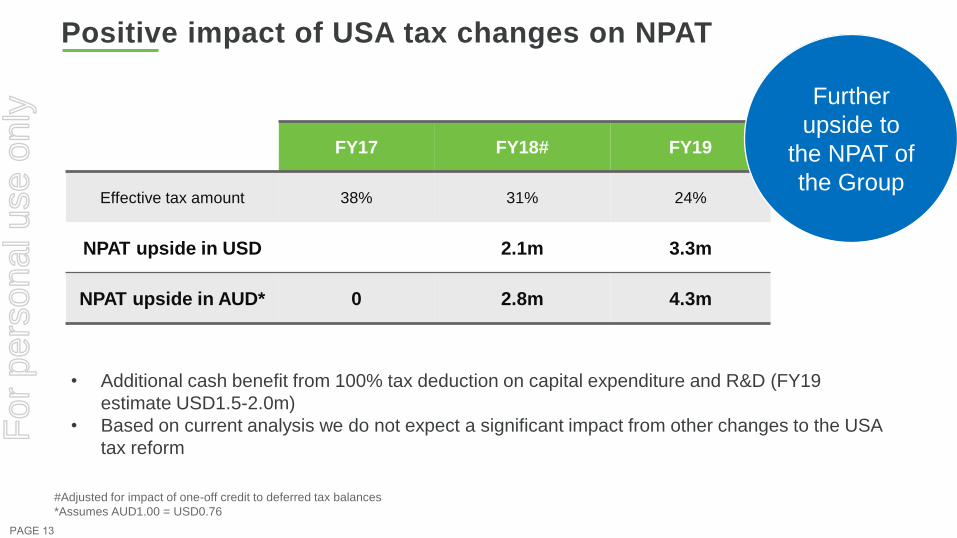
Positive impact of USA tax changes on NPAT
PAGE 13
FY17 FY18# FY19
Effective tax amount 38% 31% 24%
NPAT upside in USD 2.1m 3.3m
NPAT upside in AUD* 0 2.8m 4.3m
#Adjusted for impact of one-off credit to deferred tax balances
*Assumes AUD1.00 = USD0.76
Further
upside to
the NPAT of
the Group
• Additional cash benefit from 100% tax deduction on capital expenditure and R&D (FY19
estimate USD1.5-2.0m)
• Based on current analysis we do not expect a significant impact from other changes to the USA
tax reform
For
per
sona
l use
onl
y
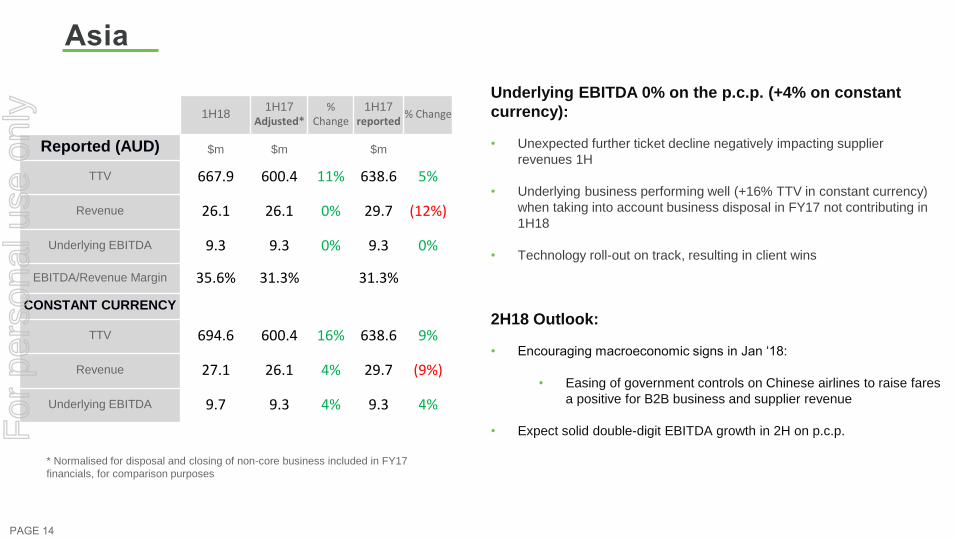
Asia
1H181H17
Adjusted*%
Change1H17
reported% Change
Reported (AUD) $m $m $m
TTV 667.9 600.4 11% 638.6 5%
Revenue 26.1 26.1 0% 29.7 (12%)
Underlying EBITDA 9.3 9.3 0% 9.3 0%
EBITDA/Revenue Margin 35.6% 31.3% 31.3%
CONSTANT CURRENCY
TTV 694.6 600.4 16% 638.6 9%
Revenue 27.1 26.1 4% 29.7 (9%)
Underlying EBITDA 9.7 9.3 4% 9.3 4%
Underlying EBITDA 0% on the p.c.p. (+4% on constant
currency):
• Unexpected further ticket decline negatively impacting supplier
revenues 1H
• Underlying business performing well (+16% TTV in constant currency)
when taking into account business disposal in FY17 not contributing in
1H18
• Technology roll-out on track, resulting in client wins
2H18 Outlook:
• Encouraging macroeconomic signs in Jan ‘18:
• Easing of government controls on Chinese airlines to raise fares
a positive for B2B business and supplier revenue
• Expect solid double-digit EBITDA growth in 2H on p.c.p.
PAGE 14
* Normalised for disposal and closing of non-core business included in FY17
financials, for comparison purposes
For
per
sona
l use
onl
y
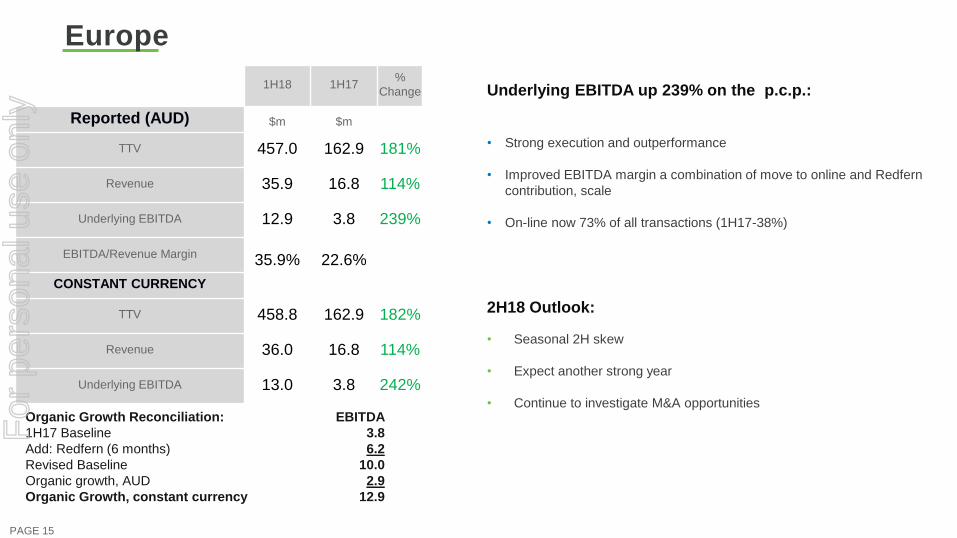
Europe
1H18 1H17%
Change
Reported (AUD) $m $m
TTV 457.0 162.9 181%
Revenue 35.9 16.8 114%
Underlying EBITDA 12.9 3.8 239%
EBITDA/Revenue Margin 35.9% 22.6%
CONSTANT CURRENCY
TTV 458.8 162.9 182%
Revenue 36.0 16.8 114%
Underlying EBITDA 13.0 3.8 242%
Underlying EBITDA up 239% on the p.c.p.:
• Strong execution and outperformance
• Improved EBITDA margin a combination of move to online and Redfern
contribution, scale
• On-line now 73% of all transactions (1H17-38%)
2H18 Outlook:
• Seasonal 2H skew
• Expect another strong year
• Continue to investigate M&A opportunities
PAGE 15
Organic Growth Reconciliation:
1H17 Baseline
Add: Redfern (6 months)
Revised Baseline
Organic growth, AUD
Organic Growth, constant currency
EBITDA
3.8
6.2
10.0
2.9
12.9
For
per
sona
l use
onl
y

Group Financial
Performance.
For
per
sona
l use
onl
y
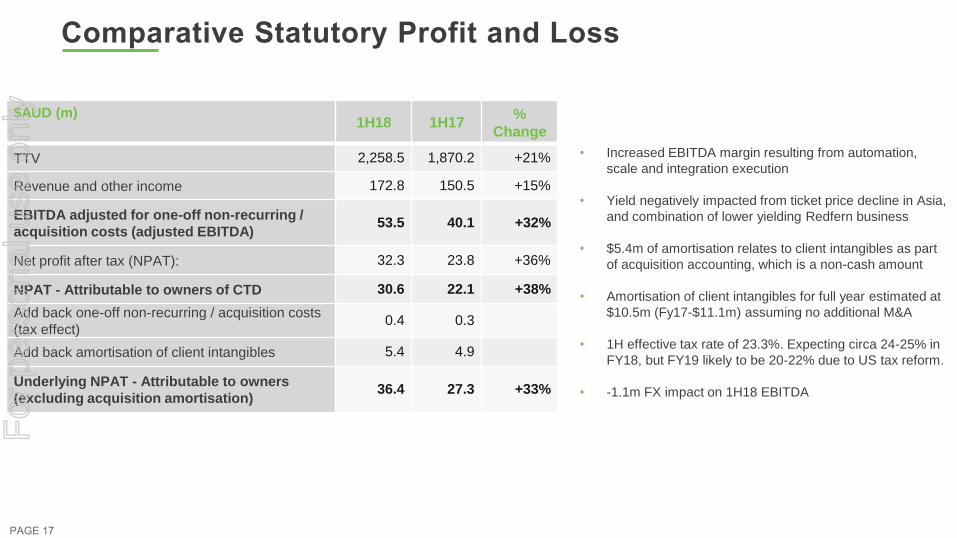
Comparative Statutory Profit and Loss
• Increased EBITDA margin resulting from automation,
scale and integration execution
• Yield negatively impacted from ticket price decline in Asia,
and combination of lower yielding Redfern business
• $5.4m of amortisation relates to client intangibles as part
of acquisition accounting, which is a non-cash amount
• Amortisation of client intangibles for full year estimated at
$10.5m (Fy17-$11.1m) assuming no additional M&A
• 1H effective tax rate of 23.3%. Expecting circa 24-25% in
FY18, but FY19 likely to be 20-22% due to US tax reform.
• -1.1m FX impact on 1H18 EBITDA
$AUD (m)1H18 1H17
%
Change
TTV 2,258.5 1,870.2 +21%
Revenue and other income 172.8 150.5 +15%
EBITDA adjusted for one-off non-recurring /
acquisition costs (adjusted EBITDA)53.5 40.1 +32%
Net profit after tax (NPAT): 32.3 23.8 +36%
NPAT - Attributable to owners of CTD 30.6 22.1 +38%
Add back one-off non-recurring / acquisition costs
(tax effect)0.4 0.3
Add back amortisation of client intangibles 5.4 4.9
Underlying NPAT - Attributable to owners
(excluding acquisition amortisation)36.4 27.3 +33%
PAGE 17
For
per
sona
l use
onl
y
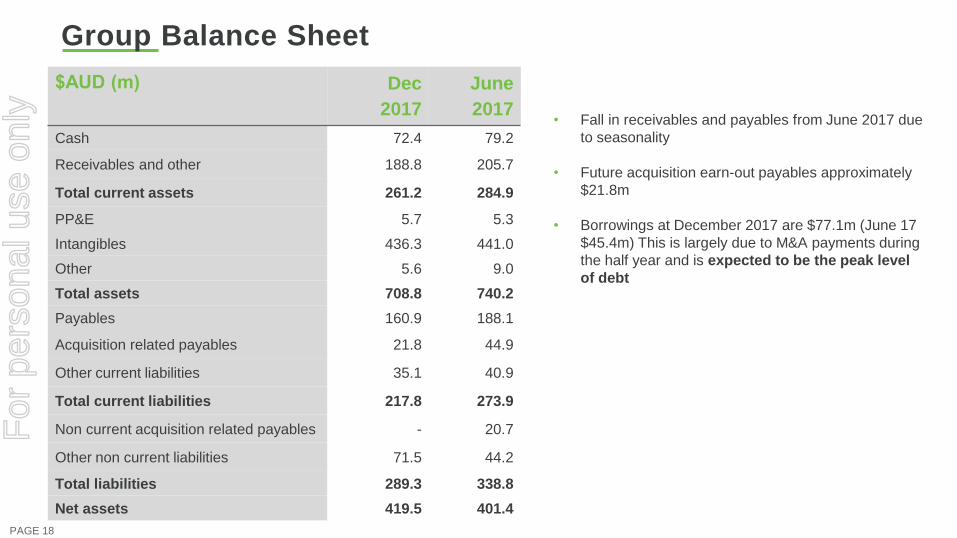
Group Balance Sheet
$AUD (m) Dec
2017
June
2017
Cash 72.4 79.2
Receivables and other 188.8 205.7
Total current assets 261.2 284.9
PP&E 5.7 5.3
Intangibles 436.3 441.0
Other 5.6 9.0
Total assets 708.8 740.2
Payables 160.9 188.1
Acquisition related payables 21.8 44.9
Other current liabilities 35.1 40.9
Total current liabilities 217.8 273.9
Non current acquisition related payables - 20.7
Other non current liabilities 71.5 44.2
Total liabilities 289.3 338.8
Net assets 419.5 401.4
PAGE 18
• Fall in receivables and payables from June 2017 due
to seasonality
• Future acquisition earn-out payables approximately
$21.8m
• Borrowings at December 2017 are $77.1m (June 17
$45.4m) This is largely due to M&A payments during
the half year and is expected to be the peak level
of debt
For
per
sona
l use
onl
y
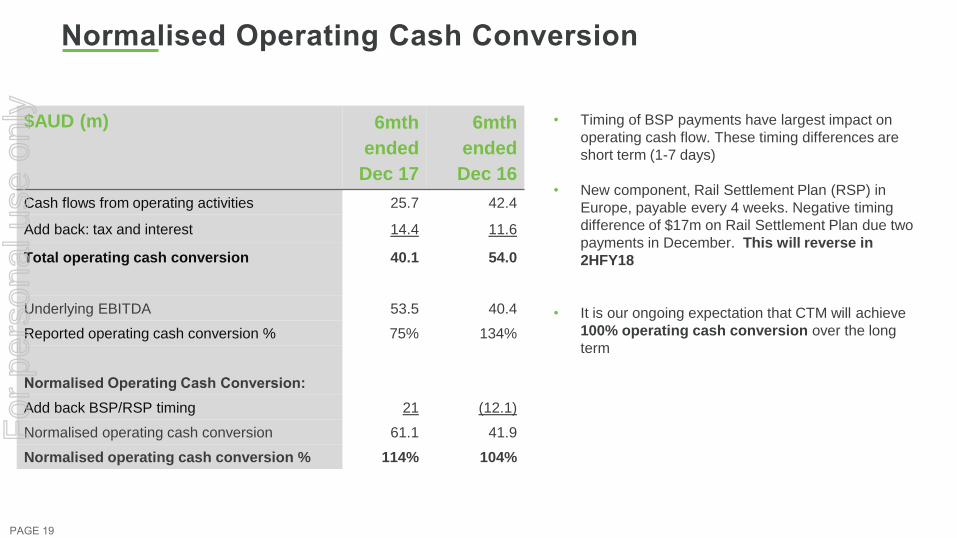
Normalised Operating Cash Conversion
• Timing of BSP payments have largest impact on
operating cash flow. These timing differences are
short term (1-7 days)
• New component, Rail Settlement Plan (RSP) in
Europe, payable every 4 weeks. Negative timing
difference of $17m on Rail Settlement Plan due two
payments in December. This will reverse in
2HFY18
• It is our ongoing expectation that CTM will achieve
100% operating cash conversion over the long
term
$AUD (m) 6mth
ended
Dec 17
6mth
ended
Dec 16
Cash flows from operating activities 25.7 42.4
Add back: tax and interest 14.4 11.6
Total operating cash conversion 40.1 54.0
Underlying EBITDA 53.5 40.4
Reported operating cash conversion % 75% 134%
Normalised Operating Cash Conversion:
Add back BSP/RSP timing 21 (12.1)
Normalised operating cash conversion 61.1 41.9
Normalised operating cash conversion % 114% 104%
PAGE 19
For
per
sona
l use
onl
y
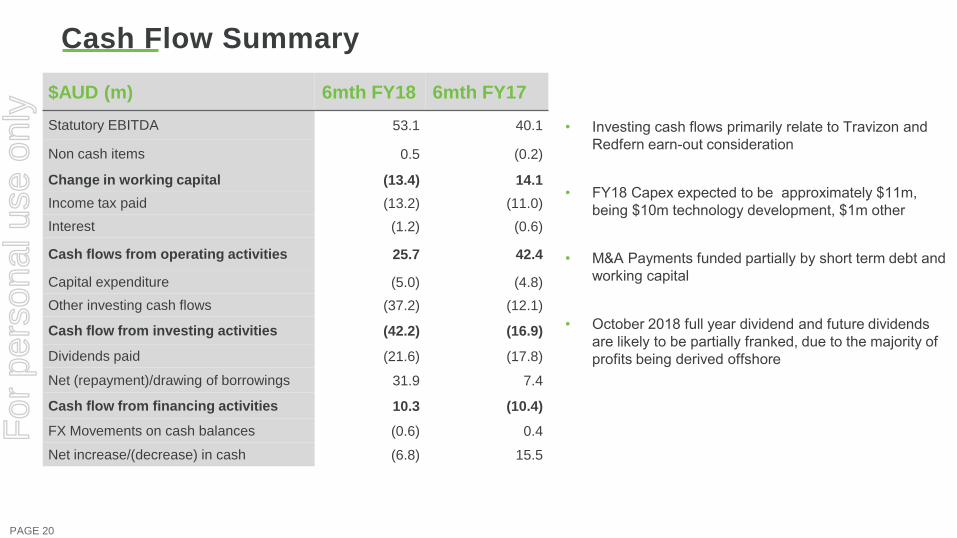
Cash Flow Summary
Investing cash flows primarily relate to • Travizon and
Redfern earn-out consideration
FY• 18 Capex expected to be approximately $11m,
being $10m technology development, $1m other
M&A Payments funded partially by short term debt and •
working capital
October • 2018 full year dividend and future dividends
are likely to be partially franked, due to the majority of
profits being derived offshore
$AUD (m) 6mth FY18 6mth FY17
Statutory EBITDA 53.1 40.1
Non cash items 0.5 (0.2)
Change in working capital (13.4) 14.1
Income tax paid (13.2) (11.0)
Interest (1.2) (0.6)
Cash flows from operating activities 25.7 42.4
Capital expenditure (5.0) (4.8)
Other investing cash flows (37.2) (12.1)
Cash flow from investing activities (42.2) (16.9)
Dividends paid (21.6) (17.8)
Net (repayment)/drawing of borrowings 31.9 7.4
Cash flow from financing activities 10.3 (10.4)
FX Movements on cash balances (0.6) 0.4
Net increase/(decrease) in cash (6.8) 15.5
PAGE 20
For
per
sona
l use
onl
y

Acquisition
Discipline.
For
per
sona
l use
onl
y
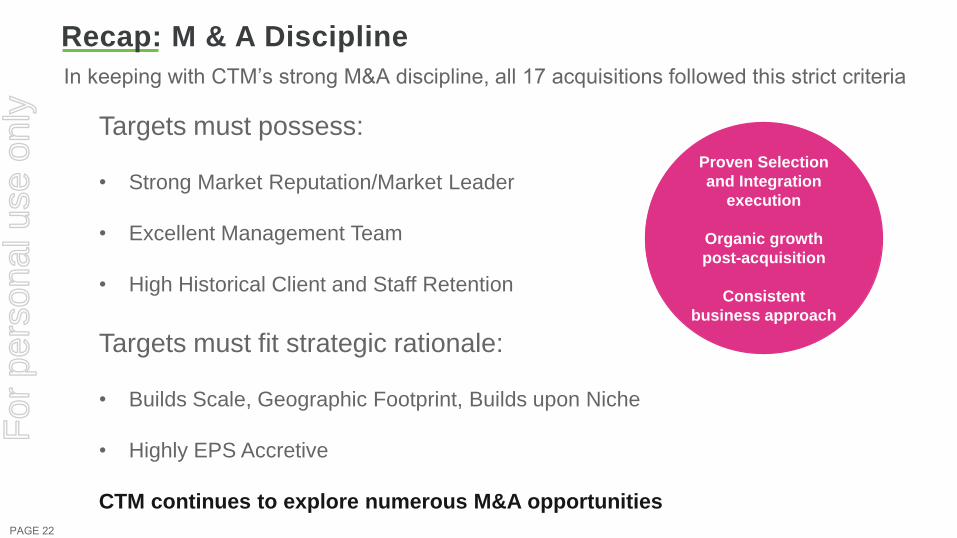
Recap: M & A Discipline
PAGE 22
Targets must possess:
• Strong Market Reputation/Market Leader
• Excellent Management Team
• High Historical Client and Staff Retention
Targets must fit strategic rationale:
• Builds Scale, Geographic Footprint, Builds upon Niche
• Highly EPS Accretive
CTM continues to explore numerous M&A opportunities
In keeping with CTM’s strong M&A discipline, all 17 acquisitions followed this strict criteria
Proven Selection
and Integration
execution
Organic growth
post-acquisition
Consistent
business approach
For
per
sona
l use
onl
y

CTM SMART
Technology.
For
per
sona
l use
onl
y
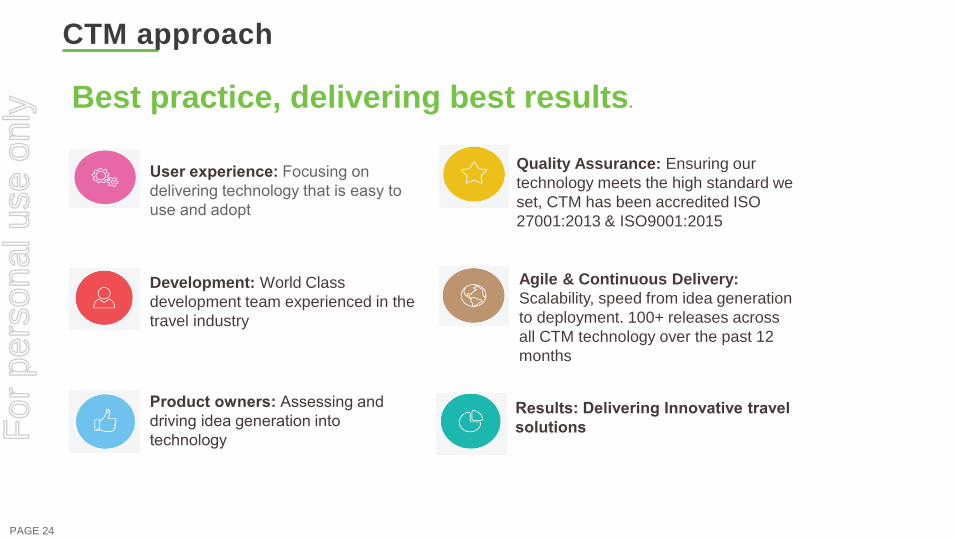
CTM approach
PAGE 24
Best practice, delivering best results.
User experience: Focusing on
delivering technology that is easy to
use and adopt
Development: World Class
development team experienced in the
travel industry
Product owners: Assessing and
driving idea generation into
technology
Quality Assurance: Ensuring our
technology meets the high standard we
set, CTM has been accredited ISO
27001:2013 & ISO9001:2015
Results: Delivering Innovative travel
solutions
Agile & Continuous Delivery:
Scalability, speed from idea generation
to deployment. 100+ releases across
all CTM technology over the past 12
months
For
per
sona
l use
onl
y
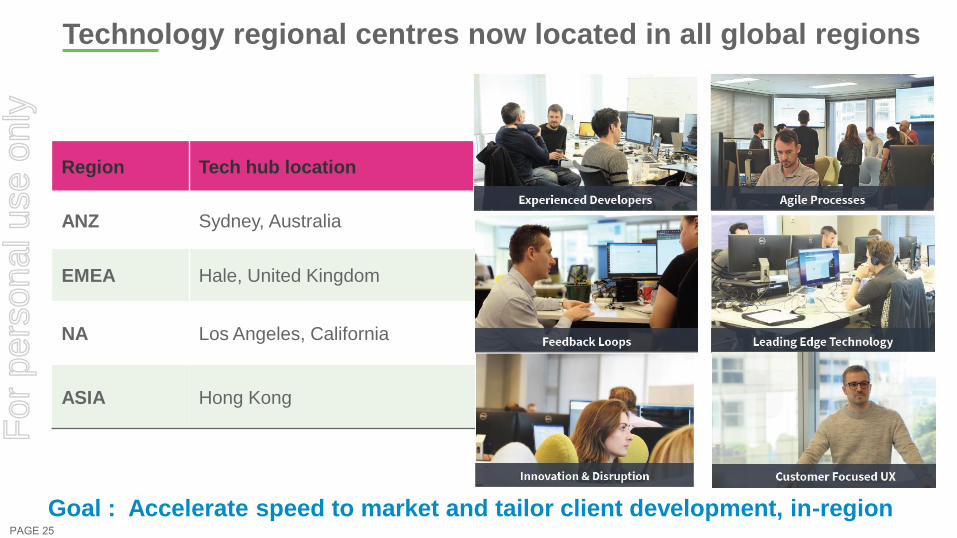
Technology regional centres now located in all global regions
Goal : Accelerate speed to market and tailor client development, in-region
Region Tech hub location
ANZ Sydney, Australia
EMEA Hale, United Kingdom
NA Los Angeles, California
ASIA Hong Kong
PAGE 25
For
per
sona
l use
onl
y

FY18 Guidance
Update and
Strategy.
For
per
sona
l use
onl
y
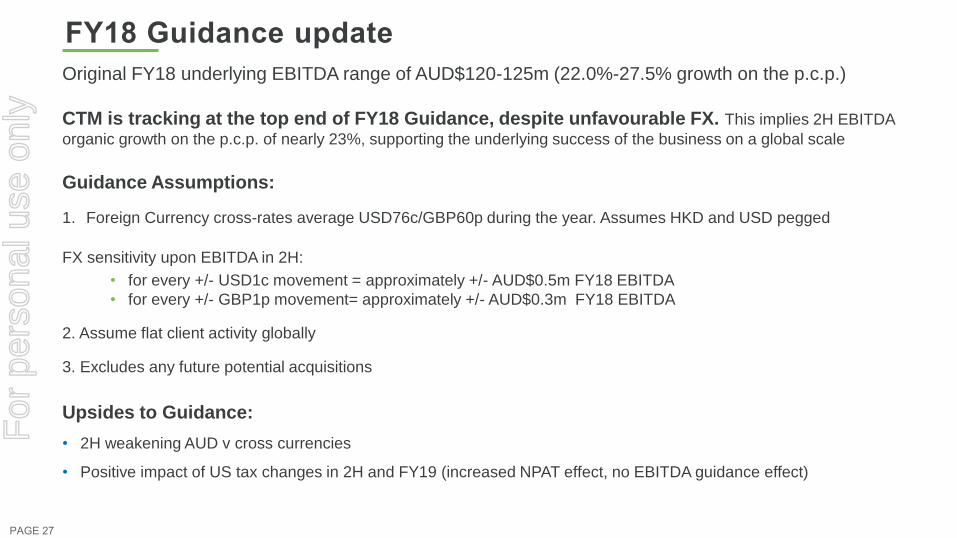
FY18 Guidance update
Original FY18 underlying EBITDA range of AUD$120-125m (22.0%-27.5% growth on the p.c.p.)
CTM is tracking at the top end of FY18 Guidance, despite unfavourable FX. This implies 2H EBITDA
organic growth on the p.c.p. of nearly 23%, supporting the underlying success of the business on a global scale
Guidance Assumptions:
1. Foreign Currency cross-rates average USD76c/GBP60p during the year. Assumes HKD and USD pegged
FX sensitivity upon EBITDA in 2H:
• for every +/- USD1c movement = approximately +/- AUD$0.5m FY18 EBITDA
• for every +/- GBP1p movement= approximately +/- AUD$0.3m FY18 EBITDA
2. Assume flat client activity globally
3. Excludes any future potential acquisitions
Upsides to Guidance:
• 2H weakening AUD v cross currencies
• Positive impact of US tax changes in 2H and FY19 (increased NPAT effect, no EBITDA guidance effect)
PAGE 27
For
per
sona
l use
onl
y
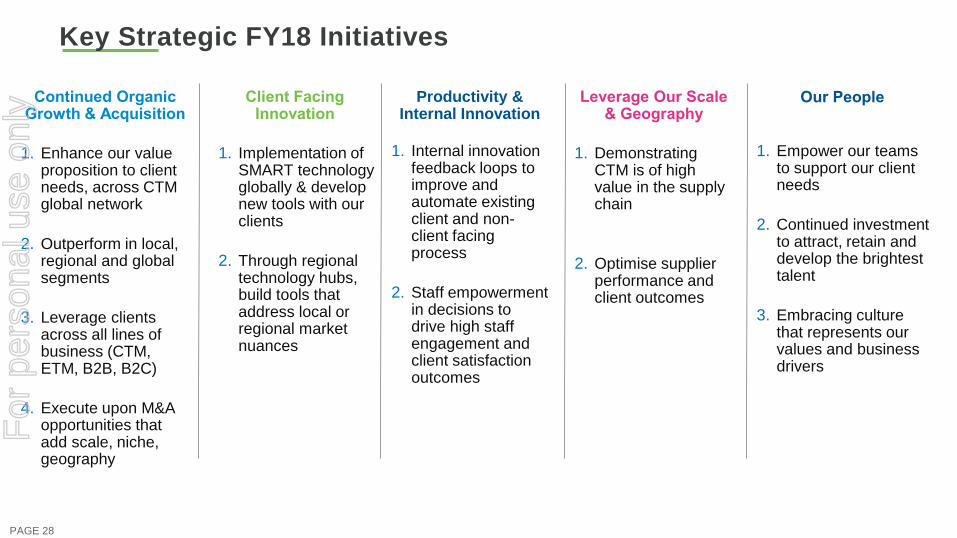
Key Strategic FY18 Initiatives
PAGE 28
1. Enhance our value proposition to client needs, across CTM global network
2. Outperform in local, regional and global segments
3. Leverage clients across all lines of business (CTM, ETM, B2B, B2C)
4. Execute upon M&A opportunities that add scale, niche, geography
Continued Organic Growth & Acquisition
1. Implementation of SMART technology globally & develop new tools with our clients
2. Through regional technology hubs, build tools that address local or regional market nuances
Client Facing Innovation
1. Demonstrating CTM is of high value in the supply chain
2. Optimise supplier performance and client outcomes
Leverage Our Scale & Geography
1. Internal innovation feedback loops to improve and automate existing client and non-client facing process
2. Staff empowerment in decisions to drive high staff engagement and client satisfaction outcomes
Productivity & Internal Innovation
1. Empower our teams to support our client needs
2. Continued investment to attract, retain and develop the brightest talent
3. Embracing culture that represents our values and business drivers
Our People
For
per
sona
l use
onl
y

Questions?
For
per
sona
l use
onl
y

Thank you.
For
per
sona
l use
onl
y