Embed Size (px)
Citation preview

Corporate Tax Reform: Issues for Congress
Updated June 11, 2021
Congressional Research Service
https://crsreports.congress.gov
RL34229
Congressional Research Service
SUMMARY
Corporate Tax Reform: Issues for Congress In 2017, the corporate tax rate was cut from 35% to 21%, major changes were made in the
international tax system, and changes were made in other corporate provisions, including
allowing expensing (an immediate deduction) for equipment investment. Recently, proposals
have been made to increase revenue from corporate taxes, including an increased tax rate, and
revise the international tax provisions to raise revenue. These revenues may be needed to fund
additional spending or reduce the deficit.
Some level of corporate tax is needed to prevent corporations from becoming a tax shelter for
high-income taxpayers. The lower corporate taxes adopted in 2017 made the corporate form of organization more attractive
to individuals. At the same time, higher corporate taxes have traditionally led to concerns about economic distortions arising
from the corporate tax and newer concerns arising from the increasingly global nature of the economy. In addition, leading up
to the 2017 tax cut, some claimed that lowering the corporate tax rate would raise revenue because of the behavioral
responses, an effect that is linked to an open economy. Although the corporate tax has generally been viewed as contributing
to a more progressive tax system because the burden falls on capital income and thus on higher-income individuals, claims
were also made that the burden falls not on owners of capital, but on labor income—an effect also linked to an open
economy.
The analysis in this report suggests that many of the concerns expressed about the corporate tax are not supported by
empirical evidence. Claims that behavioral responses could cause revenues to rise if rates were cut do not hold up on either a
theoretical or an empirical basis. Studies that purport to show a revenue-maximizing corporate tax rate of 30% (a rate lower
than the prior statutory tax rate) contain econometric errors that lead to biased and inconsistent results; when those problems
are corrected the results disappear. Cross-country studies to provide direct evidence showing that the burden of the corporate
tax actually falls on labor yield unreasonable results and prove to suffer from econometric flaws that also lead to a
disappearance of the results when corrected, in those cases where data were obtained and the results replicated. Many studies
that have been cited are not relevant to the United States because they reflect wage bargaining approaches and unions have
virtually disappeared from the private sector in the United States. Overall, the evidence suggests that the tax is largely borne
by capital. Similarly, claims that high U.S. tax rates created problems for the United States in a global economy suffer from a
misrepresentation of the U.S. tax rate compared with other countries, because the comparisons focus on statutory rate. Tax
rates are less important when capital is imperfectly mobile, as it appears to be, and because these concerns did not address the
fundamental issues of efficiency in international taxation.
Although these new arguments appear to rely on questionable methods, the traditional concerns about the corporate tax
appear valid. Although an argument may be made that the tax is still needed as a backstop to individual tax collections, it
does result in some economic distortions. These economic distortions, however, have declined substantially over time as
corporate rates and shares of output have fallen, even before the 2017 tax cut. Lower corporate taxes also create a way of
sheltering individual income given the low tax rates on dividends and capital gains.
In addition to higher tax rates, a number of revisions could be made to increase corporate tax revenue, including
eliminating preferences in the corporate tax that mismeasure income or lead to economic inefficiencies,
revising the tax treatment of foreign source income, and
changing shareholder level taxes.
RL34229
June 11, 2021
Jane G. Gravelle Senior Specialist in Economic Policy
Corporate Tax Reform: Issues for Congress
Congressional Research Service
Contents
Introduction ..................................................................................................................................... 1
The Corporate Tax as a Revenue Source ......................................................................................... 4
Magnitude and Historical Pattern .............................................................................................. 5 The Role of the Corporate Tax in Backstopping the Individual Tax ......................................... 6
Behavioral Responses and Revenue-Maximizing Tax Rate ............................................................ 8
Theoretical Issues .................................................................................................................... 10 Revenue Feedback from a General Equilibrium Model to Illustrate Likelihood of a
Laffer Curve Near Pre-2017 Rates ....................................................................................... 13 Reduced Form Empirical Analysis .......................................................................................... 13 Brill and Hassett Study ............................................................................................................ 13 Clausing Study ........................................................................................................................ 14 Cross-Country Investment Estimates: The Djankov Study ..................................................... 16 Theoretical Issues .................................................................................................................... 16 Empirical Analysis .................................................................................................................. 17
Distributional Effects ..................................................................................................................... 18
The Harberger and Randolph Studies ..................................................................................... 20 The Hassett and Mathur Study ................................................................................................ 22 Other Empirical Wage Studies ................................................................................................ 26
Other Cross-Country Studies of General Burden ............................................................. 26 Cross-State Regressions .................................................................................................... 28 Rent Sharing Studies ......................................................................................................... 29
What Should Be Concluded About Incidence? ....................................................................... 35
Economic Efficiency Issues .......................................................................................................... 35
Allocation of Capital Within the Domestic Economy ............................................................. 35 Savings Effects ........................................................................................................................ 40 International Capital Flows ..................................................................................................... 40
Potential Revisions in the Corporate Tax ...................................................................................... 41
Corporate Tax Expenditures .................................................................................................... 42 CBO Budget Options .............................................................................................................. 43 Biden Administration’s Proposals ........................................................................................... 43 Congressional Proposals ......................................................................................................... 45 Other Options Proposed in Prior Congresses .......................................................................... 46 Evaluating Tax Revisions ........................................................................................................ 48 Increasing Individual Level Taxes; Shifting Between Corporate and Individual Form .......... 49
Conclusion ..................................................................................................................................... 50
Tables
Table 1. Effective Tax Rates for Alternative Forms of Organization Under
Alternative Rate Structures, Individual at 39.6% (43.4%) Rate ................................................... 8
Table 2. Revenue-Maximizing Tax Rates and Share of Variance
Explained in the Clausing Study ................................................................................................ 10
Table 3. Coefficient Estimates: Dependent Variable is Corporate Revenues
as a Percentage of GDP (Brill and Hassett Model) .................................................................... 14

Corporate Tax Reform: Issues for Congress
Congressional Research Service
Table 4. Coefficient Estimates: Dependent Variable is Corporate Revenues
as a Percentage of GDP (Clausing Model) ................................................................................. 15
Table 5. Coefficient Estimates: Key Independent Variable is Constructed Effective Tax
Rate (Djankov, Ganser, McLiesh, Ramalho, and Shleifer Model) ............................................. 18
Table 6. Coefficient Estimates: Dependent Variable is the Logarithm of the Five-Year
Average of Wage Rates .............................................................................................................. 24
Table 7. Coefficient Estimates: Dependent Variable is Annual Logarithm
of Real PPP-Adjusted Wage Rates ............................................................................................. 25
Table 8. Differential Tax Rates Across Asset Types ...................................................................... 36
Table 9. Effective Tax Rates by Sector and Type of Finance ........................................................ 38
Table 10. Ten-Largest Corporate Tax Expenditures, 2020 ............................................................ 42
Table 11. Revenue Gain from CBO Budget Options, FY2021-FY2030 ....................................... 43
Table 12. Estimated Revenue Gain from the Biden Administration’s Corporate Tax
Proposals, FY2022-FY2031 ....................................................................................................... 43
Table 13. Revenue Gain from International Provisions in S. 991 (Sanders), FY2022-
FY2031 ....................................................................................................................................... 46
Table 14. Relevant Corporate and Business Tax Provisions in the Wyden-Gregg Bill, S.
3018, Introduced in 2010 ........................................................................................................... 47
Table B-1. Standard Deviation of Corporate Tax Rate Variables in the Three Data Sets .............. 56
Appendixes
Appendix A. Revenue-Maximizing Tax Rates in an Open Economy ........................................... 52
Appendix B. Data and Estimation Methods .................................................................................. 54
Appendix C. Modeling Problems of the Desai, Foley, and Hines Study ....................................... 57
Appendix D. Bargaining Models and Rent-Sharing of Corporate Taxes ...................................... 59
Contacts
Author Information ........................................................................................................................ 62
Corporate Tax Reform: Issues for Congress
Congressional Research Service 1
Introduction As Congress considers tax revisions, an important and challenging component is the tax treatment
of the corporation. Following an extensive debate, corporate tax rates were reduced and other
major changes were made to the corporate tax system in 2017 (P.L. 115-97), especially to the
international tax treatment. Proposals have now been made to increase the corporate tax rate,
revise international tax rules, and make other changes to raise revenue.
The traditional arguments surrounding the corporate tax, which largely focus on distortions
introduced by the tax, were discussed in a January 2017 Treasury study.1 This study also
discussed choice of organizational form and international issues. The debate leading up to the
2017 revision included arguments that cutting the corporate tax rate would stimulate economic
growth, and even raise revenue, or on claims that the tax is a burden not on capital but on labor.
Leading up to the revision, Steven Mnuchin, then-Secretary of the Treasury, advanced the
argument that the corporate tax is paid by workers, citing a study by Azémar and Hubbard as
evidence.2 A news report indicated three additional articles referenced by the Treasury press
office in support of the burden falling on wages (although the Treasury Office of Tax Analysis
currently assigns most of the burden to capital income): studies by Randolph, Hassett and Mathur,
and Lui and Altshuler.3
Opinion pieces at that time referenced a variety of other studies that found large effects of
corporate taxes on economic growth or the burden of the tax falls on wages,4 whereas others
expressed disagreement.5
These issues remain important ones to consider with a new debate on the corporate tax rate and
on revisions in international tax rules.
The current debate raises issues similar to one that began more than 10 years ago and might be
viewed as the beginning of the 2017 reduction in the corporate rate,6 as well as the more recent
proposals for partially reversing the 2017 rate cut and revising the international system. Before
1 U.S. Department of the Treasury’s Office of Tax Analysis, The Case for Responsible Business Tax Reform, January
2017, https://home.treasury.gov/system/files/131/Report-Responsible-Business-Tax-Reform-2017.pdf.
2 Richard Rubin, “Who Ultimately Pays for Corporate Taxes? The Answer May Color the Republican Overhaul,” Wall
Street Journal, August 8, 2017. The paper referenced is Céline Azémar and Glenn Hubbard, “Country Characteristics
and the Incidence of Capital Income Taxes on Wages: An Empirical Assessment,” Canadian Journal of Economics,
vol. 48, iss. 5 (December 2015), pp. 1762-1802.
3 Robert Farley, “Who Benefits from Corporate Tax Cut, The Wire, September 7, 2017 at
http://www.factcheck.org/2017/09/benefits-corporate-tax-cut/. The papers cited are William C. Randolph, International
Burdens of the Corporate Tax, Congressional Budget Office, Working Paper no. 2006-09, August 2006; Kevin A.
Hassett and Aparna Mathur, “A Spatial Model of Corporate Tax Incidence,” Applied Economics, vol. 47, no. 3 (2015),
pp. 1350-1365; and Li Liu and Rosanne Altshuler, Measuring the Burden of a Corporate Tax Under Imperfect
Competition, Oxford Working Paper no. 11/05. A version was subsequently published in the National Tax Journal, vol.
66, no. 1 (September 2013), pp. 215-237.
4 Gordon Gray, “Corporate Tax Reform and How It affects Economic Growth, American Action Forum,” April 18,
2017, https://www.americanactionforum.org/research/corporate-tax-reform-affects-economic-growth-2/. Kevin A.
Hassett, “The Cure for Wage Stagnation,” Wall Street Journal, August 14, 2016, at http://www.aei.org/publication/the-
cure-for-wage-stagnation/.
5 Center on Budget and Policy Priorities, “Corporate Rate Cuts Are a Poor Way to Help the Economy and Most
Workers-and Could Hurt Them,” June 9, 2017; Kimberly Clausing, “In Search of Corporate Tax Incidence,” Tax Law
Review, vol. 65 (2012), pp. 433-471, http://piketty.pse.ens.fr/files/Clausing2012.pdf.
6 This report was initially prepared to discuss some of the issues raised at that time and has been updated to follow the
developments in research, especially concerning whether the tax burden falls on capital or labor.
Corporate Tax Reform: Issues for Congress
Congressional Research Service 2
turning to the basic issues surrounding the corporate tax, it is useful to trace this history of the
discussion of issues and proposals for corporate reform.
In November 2005, President George W. Bush’s Advisory Panel on Tax Reform reported on a
variety of proposals for major reform of the tax system, including those for corporate and
business income taxes.7 Hearings were held on these proposals in 2006, but no further action
occurred.
On July 16, 2007, The Wall Street Journal published an opinion article by Treasury Secretary
Henry M. Paulson addressing concerns that the U.S. corporate tax rate is high relative to other
countries and announcing a conference to be held July 26 that would examine the U.S. business
tax system and its effects on the economy.8 The Department of the Treasury also released a
background paper that addressed several issues associated with the corporate tax and identified
some base broadening provisions.9 An opinion piece by R. Glenn Hubbard, President Bush’s first
chairman of the Council of Economic Advisors, referred to the conference as well as to a study by
Hassett and Mathur finding that the tax fell on labor and a study by Devereux considering the
revenue-maximizing tax rate.10 Hubbard concluded by suggesting that cutting the corporate tax
rate would reduce a tax that is largely, or even fully, borne by labor and that behavioral responses
would offset much of the static revenue cost.
During the conference, discussions included whether business representatives would trade tax
preferences for lower rates, whether reform should take the form of lower rates or write-offs of
investments, and methods of avoiding the corporate tax by income shifting in a global economy.
Some participants complained that the corporate tax is outdated, too complex, distorts decisions,
and undermines the ability of firms to complete in a global economy. Echoing some issues raised
in Hubbard’s article, Kevin Hassett indicated that the corporate tax was not an effective way to
raise revenues and suggested that lowering the rate would raise revenues.11
At the time of the Treasury conference, Chairman Charles B. Rangel of the House Ways and
Means Committee released a statement inviting the Bush Administration to discuss such issues as
tax reform, especially the alternative minimum tax (AMT), addressing tax havens, and increasing
equity and fairness in the tax structure.12 Chairman Rangel introduced a bill, H.R. 3970, on
October 25, 2007, with a revenue-neutral subsection that included some of the base broadeners
included in the 2007 Treasury paper noted above. The rate reduction, from 35% to 30.5%, was
7 Tax Policy Center, Simple, Fair, and Pro-Growth: Proposals to Fix America’s Tax System, November 2005, at
http://www.taxreformpanel.gov/.
8 Henry M. Paulson Jr., “Our Broken Corporate Tax Code,” The Wall Street Journal, July 19, 2007.
9 U.S. Department of the Treasury, “Treasury Tax Conference on Business Taxation and Global Competitiveness:
Background Paper,” July 30, 2007, at https://www.treasury.gov/press-center/press-releases/Documents/07230%20r.pdf.
10 R. Glenn Hubbard, “The Corporate Tax Myth,” The Wall Street Journal, July 26, 2007. The paper was the first
version of the Hassett and Mathur study: Kevin A. Hassett and Aparna Mathur, Taxes and Wages, American Enterprise
Institute, working paper, March 6, 2006, presented at a conference of the American Enterprise Institute on May 2,
2006. The reference to Michael Devereux apparently refers to a paper also presented at the American Enterprise
Institute Symposium.
11 This summary and other references to the issues discussed at the conference are based on two detailed media
accounts of the conference: Heidi Glenn, “Business Leaders would Give Up Tax Breaks for Lower Rates,” Tax Notes,
July 30, 2007, pp. 324-327, and Joanne M. Weiner, “U.S. Corporate Tax Reform: All Talk, No Action,” Tax Notes,
August 27, 2007, pp. 716-728.
12 Statement released by the Honorable Charles B. Rangel, chairman, Ways and Means Committee, July 26, 2007.
Corporate Tax Reform: Issues for Congress
Congressional Research Service 3
not as large as the 27% discussed in the 2007 Treasury study. Base broadeners in H.R. 3970 were
criticized by some business groups.13
The corporate tax debate and the issues of burden and effects on growth continued to be in the
news. In May 2008, N. Gregory Mankiw published an article suggesting that most of the burden
of the tax falls on labor, citing research suggesting the corporate tax is borne by labor and that
revenue losses may be fully or largely offset by behavioral responses.14
In the 111th Congress, S. 3018, introduced by Senators Ron Wyden and Judd Gregg, also provided
for a lower corporate tax rate in exchange for a somewhat broader corporate tax base. A similar
bill, S. 727, was introduced by Senators Wyden and Coats in the 112th Congress. The Fiscal
Commission proposed a corporate reform similar to the Wyden-Gregg bill. In addition to the
Wyden-Gregg and Wyden-Coats proposals and the Fiscal Commission proposals, there were
general proposals by Republican leaders in the House (Majority Leader Eric Cantor, Ways and
Means Chairman Dave Camp, and Budget Committee Chairman Paul Ryan) for corporate tax
reform with rate reductions.
In 2014, Chairman Camp introduced H.R. 1, a comprehensive proposal that reformed both
individual and corporate income taxes and was revenue neutral during the 10-year budget
horizon, as well as distributionally neutral. It cut the corporate tax rate to 25%. President Barack
Obama also supported revenue-neutral corporate tax reform, although some groups proposed
raising additional revenue from corporations.15 During 2016, Senator Hatch, chairman of the
Senate Finance Committee, indicated an interest in corporate tax integration (where only one
level of tax would be imposed on corporate income).16 Subsequently, Speaker Paul Ryan and
Ways and Means Committee Chairman Kevin Brady proposed a major revision in the tax
treatment of business income in their “Better Way” blueprint. It partially transformed the current
income tax into, effectively, a domestic consumption tax. The border adjustments that make this
proposal a domestic consumption tax appeared no longer on the table and a new plan was under
discussion in cooperation with the House, Senate, and Administration.17
13 See Jeffrey H. Birnbaum, “Democrat Overhaul of Taxes: Rangel Would Annul AMT, Shift Burden,” Washington
Post, October 26, 2007, p. D1.
14 N. Gregory Mankiw, “The Problem with the Corporate Tax,” New York Times, June 2, 2008. For empirical evidence
on incidence he cites an empirical study by Wiji Aralampalam, Michael P. Devereux, and Giorgia Maffini, The Direct
Incidence of Corporate Income Tax on Wages, Oxford University Center for Business Taxation, May, 2008. For
empirical evidence on the feedback effects on revenue, he cites Alex Brill and Kevin Hassett, Revenue Maximizing
Corporate Income Taxes, American Enterprise Institute, Working Paper no. 137, July 31, 2007.
15 See “Leader Cantor Unveils Pro-Growth Economic Plan at Stanford University,” press release, March 21, 2011,
http://majorityleader.house.gov/newsroom/2011/03/embargoed-leader-cantor-unveils-pro-growth-economic-plan-at-
stanford-university.htm and “Obama Backs Corporate Tax Cut If Won’t Raise Deficit,” Bloomberg, January 25, 2011,
http://www.bloomberg.com/news/2011-01-26/obama-backs-cut-in-u-s-corporate-tax-rate-only-if-it-won-t-affect-
deficit.html. For proposals in the deficit reduction plans, see CRS Report R41970, Addressing the Long-Run Budget
Deficit: A Comparison of Approaches, by Jane G. Gravelle and CRS Report R41641, Reducing the Budget Deficit: Tax
Policy Options, by Molly F. Sherlock.
16 See CRS Report R44638, Corporate Tax Integration and Tax Reform, by Jane G. Gravelle.
17 Although the border adjustments that led it to be a domestic consumption tax appeared no longer on the table, the
proposal was similar in its effects on investment to a consumption tax in that it had expensing and disallowed interest
deductions, which means it did not tax the return to marginal investments. For a more detailed discussion, see CRS
Report R44823, The “Better Way” House Tax Plan: An Economic Analysis, by Jane G. Gravelle. For a discussion of
the plan under development, see Jonathan Curry, Luca Gattoni-Celli, and Asha Glover, “’Big Six’ Tout Tax Reform
Unity, Drop Border Tax,” Tax Analysts, July 28, 2017, http://www.taxanalysts.org/content/big-6-tout-tax-reform-unity-
drop-border-tax.
Corporate Tax Reform: Issues for Congress
Congressional Research Service 4
The 2017 tax revision, which included temporary individual tax revisions and permanent
corporate and business tax changes that reduced revenue, lowered the corporate tax rate from
35% to 21%. It made major changes to international tax rules by moving from a regime where
income of foreign subsidiaries was taxed only when profits were repatriated as dividends were
paid to the U.S. parent to one where dividends were exempt but foreign profits taxed after an
exemption for a deemed return on tangible assets and after a deduction to lower the rate. This
provision was designed to tax global intangible low-taxed income (GILTI) at a lower rate and is
referred to as a global minimum tax. (In prior and current law, credits were allowed against U.S.
tax for foreign taxes paid, although these credits are allowed on an overall basis that allows
foreign taxes in high-tax countries in excess of the U.S. rate to shield income in low-tax countries
from U.S. tax). GILTI allowed a deduction for a deemed return on tangible assets of 10%. The
GILTI regime was accompanied with a deduction for foreign derived intangible income (FDII)
that allowed a deduction for U.S. firms based on their share of foreign sales, with a similar
deduction for a deemed return on tangible assets. It was designed to equalize the treatment of
return on intangible investments whether held in the United States or abroad. International
provisions also included the base-erosion and anti-abuse tax (BEAT), which imposed an
alternative tax at a lower rate on a base that included certain payments by U.S. multinationals to
foreign related parties (such as interest and royalties) and that denied certain credits. Numerous
other revisions were made in the corporate tax base, most notably allowing the expensing (an
immediate deduction) of the cost of equipment, although this treatment is scheduled to be phased
out over four years beginning in 2023.18 The revision also provided for a five-year period to
deduct the cost of research expenses after 2021, which are currently deducted immediately.
This report provides an overview of corporate tax issues and discusses potential reforms in the
context of these issues, with particular attention to some of the research concerning large
behavioral responses and their implications for revenue and distribution. The first section reviews
the size and history of the corporate income tax, and it discusses an important issue that has been
given little attention by those who proposed deep cuts in the corporate tax: its role in preventing
the use of the corporate form as a tax shelter by wealthy business owners. The second section
discusses the potential effect of behavioral responses on corporate tax revenues. The third section
examines the role of the corporate tax in contributing to a progressive tax system and discusses
claims that the burden falls on workers. The fourth section reviews arguments relating to
efficiency and revenue yield and traditional criticisms of the corporate tax as one that causes
important behavioral distortions. One aspect of this discussion is the question of how the tax
might be viewed differently in a more global economy. The final section examines options for
reform.
The Corporate Tax as a Revenue Source The corporate tax is the third-largest source of federal revenue, but its importance as a revenue
source has diminished considerably over time.
18 For a summary of the 2017 changes, see CRS Report R45092, The 2017 Tax Revision (P.L. 115-97): Comparison to
2017 Tax Law, coordinated by Molly F. Sherlock and Donald J. Marples. For a detailed explanation of the international
changes, see CRS Report R45186, Issues in International Corporate Taxation: The 2017 Revision (P.L. 115-97), by
Jane G. Gravelle and Donald J. Marples.
Corporate Tax Reform: Issues for Congress
Congressional Research Service 5
Magnitude and Historical Pattern
Despite concerns expressed about the size of the corporate tax rate, current corporate taxes are
low by historical standards, whether measured as a share of output or based on the effective tax
rate on income.19 In 1953, the corporate tax accounted for 5.6% of GDP and 30% of federal tax
revenues. In recent years, prior to the 2017 revision, the tax has fluctuated at around 2% of GDP
and 10% of revenues, reaching a low of 1.2% of GDP in 2003, and standing at 2.7% in 2006
before falling as a share due to the recession and certain measures to stimulate the economy. By
2014, the tax was 1.9% of GDP falling to 1.5% in 2017; after the 2017 revisions, the tax was
1.0% of GDP. Projections indicate that the tax, after falling to 0.7% of GDP in FY2021 due to the
recession, will rise and remain at around 1.3% of GDP. Today, it is the third-largest federal
revenue source, lagging behind the individual income tax, which is 7.7% of GDP in 2020, rising
to 9.4% in FY2031, and the payroll tax, which was about 6% of GDP. It is more significant,
however, than excise taxes, which are 0.4% of GDP, and estate and gift taxes at less than 0.1%. In
FY2020, the corporate tax is estimated at 6.2% of revenues, rising to 6.85% by FY2031.
Much of the historical decline arises from legislated reductions in the corporate effective tax rate
on the return to new investment, which has fallen from 63% of corporate profits in 1953 to about
3% today. These changes include a reduction in the top statutory rate from 52% to 21%, more
liberal depreciation rules, and the growth of tax favored intangibles investments.20 The total tax
burden on corporate source income has declined even more due to lower rates on dividends and
capital gains at the shareholder level and the increased fraction of stocks held in tax exempt form.
Although a large fraction of the decline in corporate tax revenues is associated with these changes
in rates and depreciation, other causes may be more liberal rules that allow firms to obtain
benefits of corporate status (such as limited liability) while still being taxed as unincorporated
businesses and tax evasion, particularly through international tax shelters. The 2007 Treasury
study documented the significant rise in the share of total business net income received by
unincorporated businesses from 1980 to 2004, from 21% of total net income to 50%. Whereas the
share of proprietorships (which have no limited liability) had declined slightly, from 17% to 14%,
the share of Subchapter S firms (firms that are incorporated but are allowed to elect taxation as an
unincorporated business) rose from 1% to 15%. These changes followed a dramatic increase in
the number of shareholders allowed for the election (the limit of 10 was raised to 35 in 1982, to
75 in 1996, and to 100 in 2004). Partnerships (including limited liability corporations and limited
liability partnerships) increased from 3% to 21%, with most of the increase occurring after 1990.
This growth reflects in part the growth of limited liability corporations established under state law
(the first state adopted such a provision in 1982), which qualify as an unincorporated businesses
19 The data discussed in this paragraph are taken from Jane G. Gravelle, “The Corporate Tax: Where Has it Been and
Where is it Going?,” National Tax Journal, vol. 57 (December 2004), pp. 903-923; U.S. Congressional Budget Office
(CBO), Historical Data, http://cbo.gov/publication/42911; CBO, The Budget and Economic Outlook, Fiscal Years
2012-2022, http://cbo.gov/sites/default/files/cbofiles/attachments/01-31-2012_Outlook.pdf; and CBO, The Budget and
Economic Outlook, Fiscal Years 2017-2027, https://www.cbo.gov/sites/default/files/115th-congress-2017-
2018/reports/52370-outlookonecolumn.pdf and supplementary data at https://www.cbo.gov/about/products/budget-
economic-data#2. More recent data and projections are at https://www.cbo.gov/about/products/budget-economic-
data#2.
20 See CRS Report RS21706, Historical Effective Marginal Tax Rates on Capital Income, by Jane G. Gravelle and CRS
Report R45186, Issues in International Corporate Taxation: The 2017 Revision (P.L. 115-97), by Jane G. Gravelle and
Donald J. Marples for current effective tax rates. The 63% rate may be slightly overstated because that rate does not
capture the effect of intangible investments. Intangible investments were taxed at zero (but not at negative rates since
there was no research tax credit). If the share of intangibles were the same as currently (23%), the tax rate in 1953
would be 57%; however, intangibles were likely less important at that time. These tax rates are for equity investments.
Corporate Tax Reform: Issues for Congress
Congressional Research Service 6
for corporate tax purposes. Whereas Subchapter S firms are constrained by the shareholder limit,
partnerships are not.21
The latest data (for 2015) indicate that unincorporated businesses accounted for 50% of the total
of flow through and corporate business net income, with S Corporations accounting for 15%,
partnerships for 25%, and proprietorships for 11%.22
The Role of the Corporate Tax in Backstopping the Individual Tax
Measuring corporate tax revenue falls short of describing the full role of the corporate tax in
contributing to federal revenues because the corporate tax protects the collection of individual
income taxes. As long as taxes on individual income are imposed, a significant corporate income
tax is likely to be necessary to forestall the use of the corporation as a tax shelter. Without a
corporate tax, high-income individuals could channel funds into corporations, and, with a large
part of earnings retained, obtain lower tax rates than if they operated in partnership or
proprietorship form or in a way that allowed them to be taxed as such. As suggested by the
growth in unincorporated business forms above, wealthy business owners may be quick to take
advantage of tax rate differentials, which currently tend to favor unincorporated businesses. In
1986, individual tax rates were lowered dramatically (the top rate fell from 70% to 28%, although
it was eventually increased to 39.6%), but the combined corporate tax rate (on the firm and on
distributions) has been high relative to the individual tax rate. The 2007 Treasury study indicated
that 61% of the income of unincorporated businesses was associated with taxpayers in the top
income tax bracket.
Although the top tax rate on corporations prior to the 2017 revisions (35%) was close to the top
individual rate (39.6%), the corporate tax was graduated. Consequently, for high-income
taxpayers, there was an advantage to shifting part of one’s income into a corporation because
corporate tax rates are graduated (15% on the first $50,000 and 25% on the next $25,000) and are
lower than the top marginal tax. This opportunity, however, was restricted by (1) limiting to one
the number of corporations income can be shifted to; (2) the amount on which rates are
graduated; and (3) disallowing graduated rates for personal service corporations. In recognition of
the potential use of the corporation as a shelter, tax law has in the past contained a tax on
accumulated earnings. As long as dividends were taxed as ordinary income and the accumulated
earnings tax was strict enough, it was difficult to use the corporate form to shelter a great deal of
income.
This tax shelter constraint on lowering the corporate rate may have become more binding because
of the lower rates on dividends enacted as part of the Administration’s corporate relief package in
the Jobs and Growth Tax Relief Reconciliation Act of 2003 (P.L. 108-27), although rates were
increased in 2010 and 2013.23 The 2017 revision also changed the relative benefits of operating in
corporate versus noncorporate form by lowering the corporate rate to 21% and the individual rate
to 37%, which would tend to make the corporate organizational form more attractive to high-
21 See also CRS Report R42113, Reasons for the Decline in Corporate Tax Revenues, by Mark P. Keightley, which
traces the decline in average effective tax rates, the reduction in the share of business income represented by the
corporate sector, and the falling rate of profit.
22 Internal Revenue Service, Statistics of Income, Integrated Business Data, Table 1, at https://www.irs.gov/uac/soi-tax-
stats-integrated-business-data.
23 The law lowered the top rate to 15%, although subsequent legislation taxed very high-income individuals’ dividends
and capital gains at 20%. In addition, a 3.8% additional tax was enacted in 2010, applying to dividends and capital
gains.
Corporate Tax Reform: Issues for Congress
Congressional Research Service 7
income individuals. It also, however, eliminated the graduated rates that allowed a restricted
opportunity for use of the corporate form as a shelter and also, allowed a deduction for 20% of
pass-through income for unincorporated businesses, although the deductions was phased out for
certain taxpayers.24 The individual provisions are scheduled to expire after 2025, but the
corporate rate cut is permanent. Businesses at high income levels are subject to an additional
3.8% tax on their income either due to the Medicare A hospital insurance tax or the net
investment income tax applied to passive investment income, passive business income, dividends,
and capital gains. Active income from a Subchapter S firm that is not wages is not subject to the
tax.
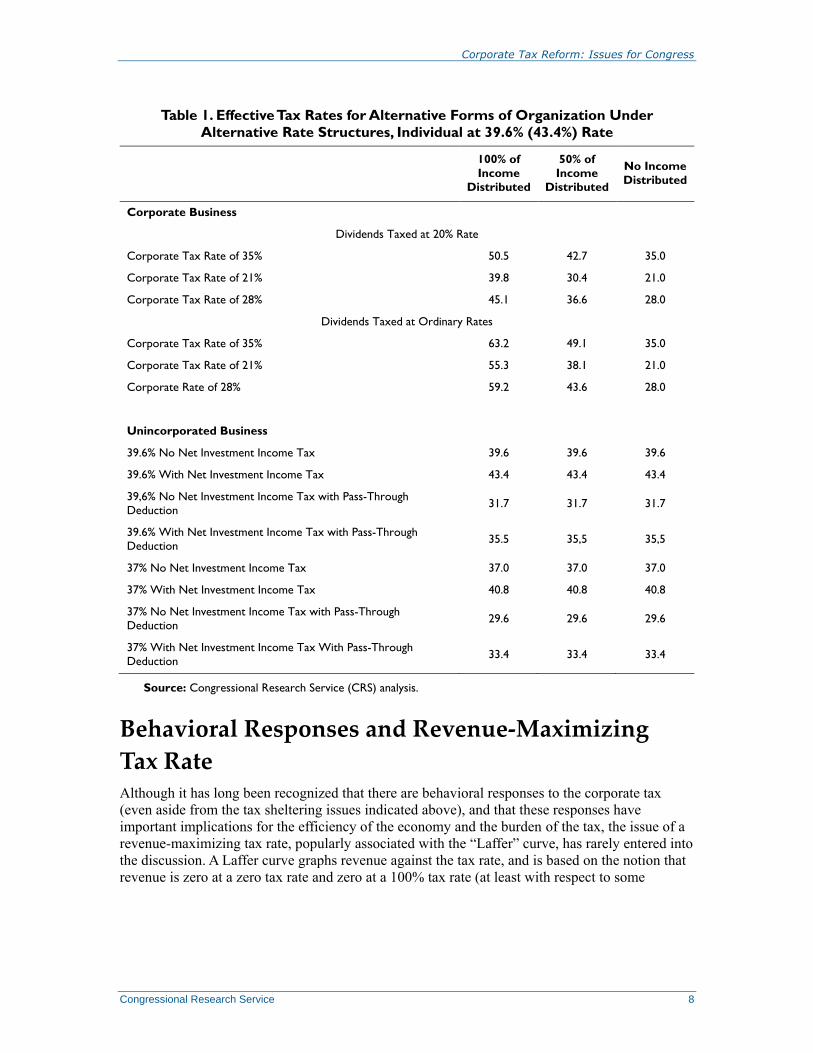
Table 1 calculates the effective tax rate for operating through a corporation for high-income
taxpayers versus an unincorporated business for several cases: (1) pre-2017 law (a 39.6% top
individual tax rate with and without the 3.8% and a 35% corporate rate), (2) current law (a 37%
top rate with and without the pass-through deduction or the 3.8% additional tax and a 21%
corporate tax rate), and (3) law after the lapse of the individual tax rates (a 39.6% tax rate with
and without the 3.8% tax and a 21% corporate tax rate). In all cases, corporate dividends are
subject to a top rate of 23.8% (a tax rate of 20% plus the 3.8% investment tax).25 Table 1 also
presents proposals discussed by the Biden Administration to raise the corporate tax rate to 28%,
the top individual rate to 39.6%, and to tax capital gains at ordinary income.
Under prior law, the effective corporate tax rate ranged from 35% to 50.5% depending on the
share of dividends, whereas the top effective individual rate was typically 43.4%. Unless a
corporation distributed very little of its income, corporate tax rates were usually higher than
individual rates, favoring the unincorporated form even more for individuals in lower tax rates.
After the 2017 revision, the corporate form could sometimes become beneficial even without the
graduated rates. For taxpayers not eligible for the pass-through deduction and especially those
subject to the net investment income tax, the corporate form becomes preferable, whereas for
firms eligible for the pass-through deduction the noncorporate form would often become
preferable. However, if the lower tax rate and pass-through deduction expire, as scheduled in
2025, corporate organization becomes more attractive. (Individuals with lower individual rates
could still find noncorporate organization preferable.) Although the 2017 changes weakened the
preference for noncorporate form and therefore could be argued to weaken the use of the
corporation as a backstop for the individual tax, it also eliminated the graduated corporate rates.
All of these changes, along with the uncertainty about the future, create a complex picture of
organizational preference.
The proposals advanced by the Biden Administration to raise the corporate rate to 28% and
restore the 39.6% top individual rate, as well as taxing dividends and capital gains at ordinary
rates, would make the corporate form unattractive as a tax shelter as long as the pass-through
deduction expires and the corporation distributes dividends.
24 The deduction is phased out at high income levels for personal service businesses and, for other businesses subject to
the phase out limited to a share of wages or a combination of wages and depreciable assets. See CRS Report R46650,
Section 199A Deduction: Economic Effects and Policy Options, by Gary Guenther for further information.
25 The 3.8% additional tax on high-income individuals applies to all earnings of proprietors and general partners,
because they are classified as labor income for purposes of the payroll tax, as well as the labor share of income in any
other unincorporated business. Active participants in Subchapter S firms with a small amount of labor income could
have lower taxes in the Subchapter S form approaching the ordinary income tax rate.
Corporate Tax Reform: Issues for Congress
Congressional Research Service 8
Table 1. Effective Tax Rates for Alternative Forms of Organization Under
Alternative Rate Structures, Individual at 39.6% (43.4%) Rate
100% of
Income
Distributed
50% of
Income
Distributed
No Income
Distributed
Corporate Business
Dividends Taxed at 20% Rate
Corporate Tax Rate of 35% 50.5 42.7 35.0
Corporate Tax Rate of 21% 39.8 30.4 21.0
Corporate Tax Rate of 28% 45.1 36.6 28.0
Dividends Taxed at Ordinary Rates
Corporate Tax Rate of 35% 63.2 49.1 35.0
Corporate Tax Rate of 21% 55.3 38.1 21.0
Corporate Rate of 28% 59.2 43.6 28.0
Unincorporated Business
39.6% No Net Investment Income Tax 39.6 39.6 39.6
39.6% With Net Investment Income Tax 43.4 43.4 43.4
39,6% No Net Investment Income Tax with Pass-Through
Deduction 31.7 31.7 31.7
39.6% With Net Investment Income Tax with Pass-Through
Deduction 35.5 35,5 35,5
37% No Net Investment Income Tax 37.0 37.0 37.0
37% With Net Investment Income Tax 40.8 40.8 40.8
37% No Net Investment Income Tax with Pass-Through
Deduction 29.6 29.6 29.6
37% With Net Investment Income Tax With Pass-Through
Deduction 33.4 33.4 33.4
Source: Congressional Research Service (CRS) analysis.
Behavioral Responses and Revenue-Maximizing
Tax Rate Although it has long been recognized that there are behavioral responses to the corporate tax
(even aside from the tax sheltering issues indicated above), and that these responses have
important implications for the efficiency of the economy and the burden of the tax, the issue of a
revenue-maximizing tax rate, popularly associated with the “Laffer” curve, has rarely entered into
the discussion. A Laffer curve graphs revenue against the tax rate, and is based on the notion that
revenue is zero at a zero tax rate and zero at a 100% tax rate (at least with respect to some
Corporate Tax Reform: Issues for Congress
Congressional Research Service 9
taxes).26 In a Laffer curve, the revenue first rises with the tax rate and then falls, and at the point it
reverses direction is the revenue-maximizing tax rate.
The notion that a corporate tax cut could pay for itself continued to enter the debate in 2017,27 as
it did 15 years ago during that corporate debate, where it was proposed or alluded to in several
articles in the popular press during the debate. One is the article by Glenn Hubbard, cited above.
In National Review, Kevin Hassett discussed the Laffer curve and presented a chart that he
indicated is an illustration that appears to show a negative relationship between corporate
revenues as a share of GDP and the tax rate.28 Only 13 countries are shown on this graph,
however, and the negative relationship is clearly strongly affected by an outlier, Ireland, which is
a well-known tax haven; most economists would not find this illustration persuasive proof.29 The
Hubbard and Hassett articles do, however, cite some more sophisticated research. Hassett referred
to a paper by Kimberly Clausing,30 and Hubbard referred to a paper by Michael Devereux.31 In
addition, Alex Brill and Kevin Hassett also prepared a statistical analysis examining the change in
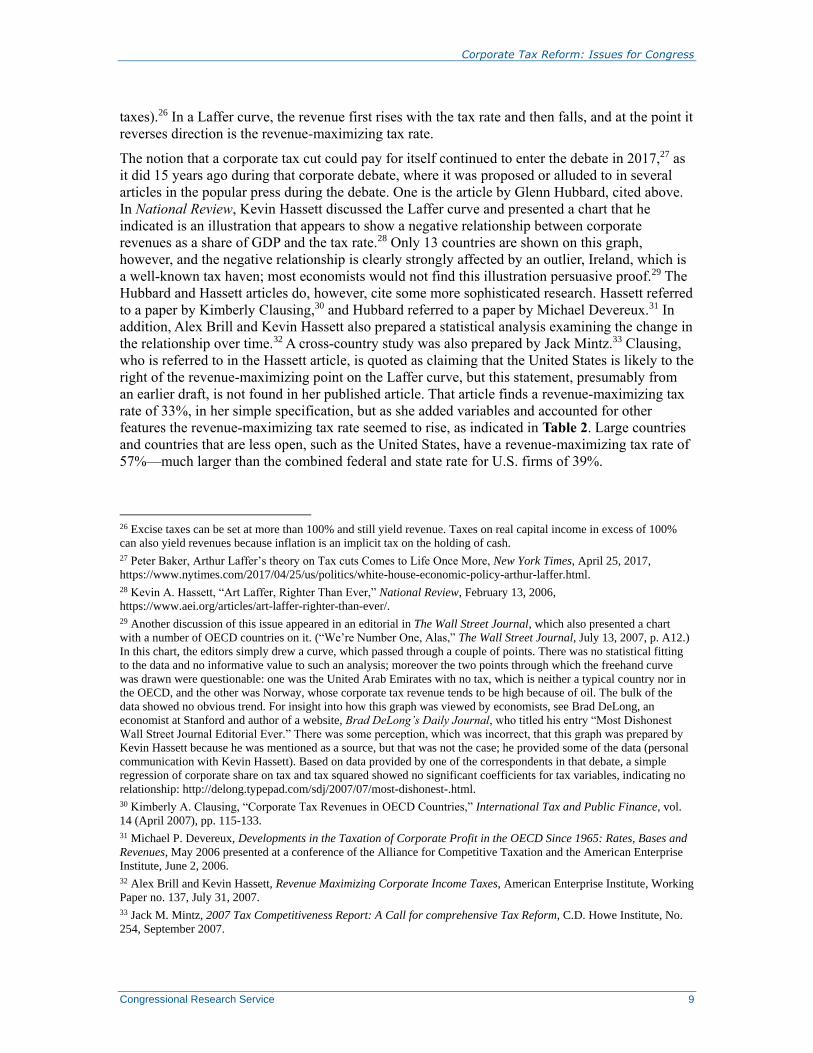
the relationship over time.32 A cross-country study was also prepared by Jack Mintz.33 Clausing,
who is referred to in the Hassett article, is quoted as claiming that the United States is likely to the
right of the revenue-maximizing point on the Laffer curve, but this statement, presumably from
an earlier draft, is not found in her published article. That article finds a revenue-maximizing tax
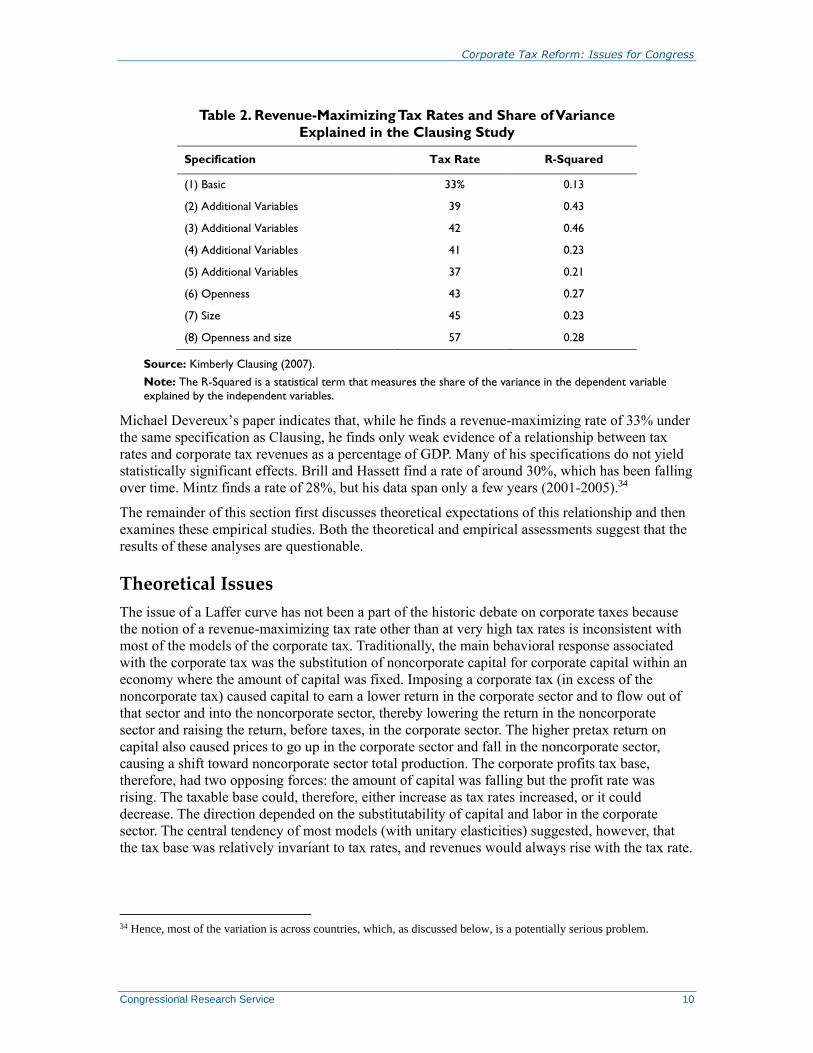
rate of 33%, in her simple specification, but as she added variables and accounted for other
features the revenue-maximizing tax rate seemed to rise, as indicated in Table 2. Large countries
and countries that are less open, such as the United States, have a revenue-maximizing tax rate of
57%—much larger than the combined federal and state rate for U.S. firms of 39%.
26 Excise taxes can be set at more than 100% and still yield revenue. Taxes on real capital income in excess of 100%
can also yield revenues because inflation is an implicit tax on the holding of cash.
27 Peter Baker, Arthur Laffer’s theory on Tax cuts Comes to Life Once More, New York Times, April 25, 2017,
https://www.nytimes.com/2017/04/25/us/politics/white-house-economic-policy-arthur-laffer.html.
28 Kevin A. Hassett, “Art Laffer, Righter Than Ever,” National Review, February 13, 2006,
https://www.aei.org/articles/art-laffer-righter-than-ever/.
29 Another discussion of this issue appeared in an editorial in The Wall Street Journal, which also presented a chart
with a number of OECD countries on it. (“We’re Number One, Alas,” The Wall Street Journal, July 13, 2007, p. A12.)
In this chart, the editors simply drew a curve, which passed through a couple of points. There was no statistical fitting
to the data and no informative value to such an analysis; moreover the two points through which the freehand curve
was drawn were questionable: one was the United Arab Emirates with no tax, which is neither a typical country nor in
the OECD, and the other was Norway, whose corporate tax revenue tends to be high because of oil. The bulk of the
data showed no obvious trend. For insight into how this graph was viewed by economists, see Brad DeLong, an
economist at Stanford and author of a website, Brad DeLong’s Daily Journal, who titled his entry “Most Dishonest
Wall Street Journal Editorial Ever.” There was some perception, which was incorrect, that this graph was prepared by
Kevin Hassett because he was mentioned as a source, but that was not the case; he provided some of the data (personal
communication with Kevin Hassett). Based on data provided by one of the correspondents in that debate, a simple
regression of corporate share on tax and tax squared showed no significant coefficients for tax variables, indicating no
relationship: http://delong.typepad.com/sdj/2007/07/most-dishonest-.html.
30 Kimberly A. Clausing, “Corporate Tax Revenues in OECD Countries,” International Tax and Public Finance, vol.
14 (April 2007), pp. 115-133.
31 Michael P. Devereux, Developments in the Taxation of Corporate Profit in the OECD Since 1965: Rates, Bases and
Revenues, May 2006 presented at a conference of the Alliance for Competitive Taxation and the American Enterprise
Institute, June 2, 2006.
32 Alex Brill and Kevin Hassett, Revenue Maximizing Corporate Income Taxes, American Enterprise Institute, Working
Paper no. 137, July 31, 2007.
33 Jack M. Mintz, 2007 Tax Competitiveness Report: A Call for comprehensive Tax Reform, C.D. Howe Institute, No.
254, September 2007.
Corporate Tax Reform: Issues for Congress
Congressional Research Service 10
Table 2. Revenue-Maximizing Tax Rates and Share of Variance
Explained in the Clausing Study
Specification Tax Rate R-Squared
(1) Basic 33% 0.13
(2) Additional Variables 39 0.43
(3) Additional Variables 42 0.46
(4) Additional Variables 41 0.23
(5) Additional Variables 37 0.21
(6) Openness 43 0.27
(7) Size 45 0.23
(8) Openness and size 57 0.28
Source: Kimberly Clausing (2007).
Note: The R-Squared is a statistical term that measures the share of the variance in the dependent variable
explained by the independent variables.
Michael Devereux’s paper indicates that, while he finds a revenue-maximizing rate of 33% under
the same specification as Clausing, he finds only weak evidence of a relationship between tax
rates and corporate tax revenues as a percentage of GDP. Many of his specifications do not yield
statistically significant effects. Brill and Hassett find a rate of around 30%, which has been falling
over time. Mintz finds a rate of 28%, but his data span only a few years (2001-2005).34
The remainder of this section first discusses theoretical expectations of this relationship and then
examines these empirical studies. Both the theoretical and empirical assessments suggest that the
results of these analyses are questionable.
Theoretical Issues
The issue of a Laffer curve has not been a part of the historic debate on corporate taxes because
the notion of a revenue-maximizing tax rate other than at very high tax rates is inconsistent with
most of the models of the corporate tax. Traditionally, the main behavioral response associated
with the corporate tax was the substitution of noncorporate capital for corporate capital within an
economy where the amount of capital was fixed. Imposing a corporate tax (in excess of the
noncorporate tax) caused capital to earn a lower return in the corporate sector and to flow out of
that sector and into the noncorporate sector, thereby lowering the return in the noncorporate
sector and raising the return, before taxes, in the corporate sector. The higher pretax return on
capital also caused prices to go up in the corporate sector and fall in the noncorporate sector,
causing a shift toward noncorporate sector total production. The corporate profits tax base,
therefore, had two opposing forces: the amount of capital was falling but the profit rate was
rising. The taxable base could, therefore, either increase as tax rates increased, or it could
decrease. The direction depended on the substitutability of capital and labor in the corporate
sector. The central tendency of most models (with unitary elasticities) suggested, however, that
the tax base was relatively invariant to tax rates, and revenues would always rise with the tax rate.
34 Hence, most of the variation is across countries, which, as discussed below, is a potentially serious problem.
Corporate Tax Reform: Issues for Congress
Congressional Research Service 11
Consequently, under any reasonable set of assumptions there would either be no revenue-
maximizing tax rate or an extremely high one.35
If behavioral responses caused the total capital in the U.S. economy to contract, the outcome
could be different. One such model, the open economy model, appears to be a motivation for the
belief in a relatively low revenue-maximizing tax rate. Brill and Hassett discuss elasticity
estimates of foreign capital flows to after tax returns in the range of 1.5 to 3 (they also cite a
recent study with an elasticity of 3.3) in their paper that finds a revenue-maximizing tax rate of
around 30%. They conclude that “[t]hese high elasticities are consistent with the view that
reductions in corporate rates could lure a significant enough amount of economic activity to a
locality to create a Laffer curve in the corporate tax space.”36
As shown in the Appendix A, however, this tax rate even with infinite elasticities cannot be
achieved. In the most extreme case, where (1) the country is too small to affect worldwide prices
and rates of return; (2) capital is perfectly mobile; and (3) products in international trade are
perfectly substitutable; the revenue-maximizing tax rate would be the ratio of the labor share of
income to the factor substitution elasticity. Assuming fairly common values for a model without
depreciation of 75% for labor’s share of income and a factor substitution elasticity of 1, the tax
rate would be 75%—far above the rates of around 30% reported by Brill and Hassett. This rate
could rise as these conditions are relaxed. If the United States is assumed to have 30% of world
resources, the rate rises to 81%; if imperfect substitutability between investments across countries
and between foreign and domestic products is allowed, it would rise further. It would also rise if
the tax system included elements of a residence-based system that increases the tax rate on
foreign investment by imposing a tax on foreign branch income and on dividends paid by foreign
subsidiaries to the U.S. parent, reducing the tax advantage of outbound investment.
Although it is possible to have a revenue-maximizing tax rate that does not asymptotically
approach 100%, it is probably not possible to find a rate that maximizes revenues as a percentage
of GDP because GDP falls as well as tax revenues. In this case, the same circumstances apply as
in the reallocation of capital in the closed economy: with unitary elasticities, the corporate share
of income is constant relative to GDP, and with other elasticities, it can rise or fall.
A related circumstance where capital can contract would be in a model where savings responds so
powerfully that the savings supply is infinitely elastic, that is, when a tax is imposed, the capital
stock must contract so much, and the pretax rate of return rises so much that the after-tax return
comes back to its original value. This extreme savings response model yields the same revenue-
maximizing tax rate as the extreme open economy, 75%, and probably no revenue-maximizing
tax rate for revenues as a percentage of GDP. Moreover, the slowness with which the capital stock
adjusts (most models allow 150 years for full adjustments) means that the revenue would be
affected by tax rates in the past.
The result of this discussion makes it clear that revenue-maximizing tax rates cannot arise from
physical reallocations or contractions of capital. Nor are they likely to arise from a substitution
between debt and equity, since the debt share has changed very little despite significant changes
in the relative tax burden, and estimates of elasticities that do exist are small.37
35 An invariant tax base would occur when both production and utility were of the Cobb Douglas form, which is unitary
factor substitution elasticities and unitary product substitution elasticities. At 100% tax rate a corner solution would be
presumably be reached where the corporate sector would entirely disappear, but only at that extreme rate would such an
effect occur.
36 Brill and Hassett, Revenue Maximizing Corporate Income Taxes, p. 6.
37 See Ruud de Mooij, The Tax Elasticity of Corporate Debt: A Synthesis of Size and Variations, International
Corporate Tax Reform: Issues for Congress
Congressional Research Service 12
A remaining source of a different outcome is profit shifting. This effect could involve firms
maintaining the same activity and shifting the form of operation to unincorporated businesses.
Profit shifting could be a possibility (although the point of revenue maximization would be much
too low because much of the tax has not disappeared, but rather has shifted). But, at least in the
United States, this shift is probably less the result of high corporate tax rates and more the result
of increasingly loose restrictions on operating with limited liability outside the corporate form,
actions that have not been taken by other countries.38 The other profit shifting issue is the shifting
of profits (rather than activity) to foreign countries. Such effects are possible, but it would seem
unlikely that tax avoidance could be of this magnitude, given the amount of profits shifted and the
behavioral response. Although a small low-income country, as is characteristic of most tax
havens, might have little enough domestic capital that it could afford the loss from lowering the
rate to attract more capital, such an outcome is much less likely for the United States. Recent
estimates of elasticities also suggest that cutting the corporate tax rate would lower revenue much
more than enough to offset the tax on profits shifted back into the United States.39
In addition, profit shifting can be prevented or limited by revisions in international tax rules.
Concerns about this issue led to the imposition of tax on GILTI in 2017, which imposes a
minimum tax on foreign source intangible income. Early evidence indicated, however, that the
share of related company profits reported in tax havens did not change despite the lower tax rate
or the global minimum tax.40 One explanation is that a smaller tax rate may not result in much
change in the location of profits from intangible assets, which can be shifted easily as much as the
law allows to zero-tax rate countries. That is, even if the U.S. rate is lowered from 35% to 21%,
both rates are still higher than a zero rate and there is little incentive to shift profits back to the
United States. GILTI lowered the rate to 10.5% although the cross crediting of foreign taxes
means zero rates can persist in some locations. One solution is to tax income from tax havens at
the full U.S. rate by raising GILTI rates and imposing a per country limit on the foreign tax credit
so income in tax havens cannot be shielded from U.S. tax by credits from foreign taxes in high-
tax countries.
Monetary Fund, Working Paper no. WP-11-95, April, 2011, http://www.imf.org/external/pubs/ft/wp/2011/wp1195.pdf.
38 The Treasury study provides data on the growth over time in unincorporated business forms and suggests that the
large share of this income in the United States relative to other countries is due to the ability to avoid the corporate tax
and still retain limited liability in the United States. The growth in Subchapter S income (partnerships that can elect to
be taxed as corporations) corresponds to increasing limits on the number of permissible shareholders, and the growth in
partnership income to the growth in the number of states allowing limited liability companies that do not fall under the
corporate tax. Proprietorship income shares have changed very little. In any case, this growth occurred during a period
when the corporate tax was constant or falling.
39 Jane G. Gravelle, “Policy Options to Address Profit Shifting: Carrots or Sticks?” Tax Notes, July 4, 2016, pp. 121-
134. Even the largest elasticities suggested that a dollar of revenue loss would be offset by only nine cents due to
induced profit shifting; the smallest suggested only one cent.
40 See Joint Committee on Taxation, U.S. International Tax Policy: Overview and Analysis, JCX-16R-21, April 19,
2021, https://www.jct.gov/CMSPages/GetFile.aspx?guid=aa66e305-74cc-40bc-acad-55bb3e6d5971, which compared
2017 and 2018 tax data; and Testimony of Kimberly A. Clausing, Deputy Assistant Secretary, Tax Analysis, Before the
Senate Committee on Finance, U.S. Department of the Treasury, March 21, 2021,
https://home.treasury.gov/news/press-releases/jy0079, which compared data from 2000 through 2019 from the
Commerce Department.
Corporate Tax Reform: Issues for Congress
Congressional Research Service 13
Revenue Feedback from a General Equilibrium Model to Illustrate
Likelihood of a Laffer Curve Near Pre-2017 Rates
A Laffer curve with a revenue-maximizing tax rate implies that there is a point where the tax base
contracts so much that no revenue is gained from a tax increase, and, conversely that cutting tax
rates could raise revenue. Revenue offsets that arise from behavioral responses are often referred
to as a revenue feedback. For a tax cut, revenue feedback would be the revenue gain from an
expanded base as a percentage of the original revenue loss (for a tax increase, it would be the loss
from a contraction in the base as a percentage of the original gain). The revenue-maximizing tax
rate is the point where induced changes in the tax rate provide 100% revenue feedback.
An approach that is empirically based but which is not the result of a direct estimate involves
using a general equilibrium model, which is based on empirical estimates of underlying
relationships (such as capital mobility). A CRS report used such a model and concluded that
cutting the corporate tax from 35% to 25% in isolation would result in a revenue offset of 5% due
to taxes on increased output in the United States.41 This effect was not due to the increase in
corporate taxes on the additional output, which was negligible, but to an increase in both labor
and capital income taxes on increased output. Thus the revenue-maximizing tax rate cannot be
near the current 35% tax rate.
As noted earlier, some have argued that the revenue feedback for the corporate tax arises not from
real changes in investment but from artificial profit shifting, where multinationals use a variety of
techniques to declare income in low tax countries. Analysis and evidence, however, does not
support this effect.
Finally, all of these feedback effects would eventually be swamped for a stand-alone tax cut by
the increase in the debt, which would crowd out capital and reduce output, leading to an
additional loss of revenues of 23% by the 10th year. This loss of revenues on reduced output is in
addition to the direct effect on the budget deficit due to an increase in interest costs of 25% of the
revenue loss over the first 10 years.
Reduced Form Empirical Analysis
As noted above, several recent studies have examined the relationship between corporate tax rates
and corporate tax revenues as a percentage of GDP. The data used for two of these studies were
obtained to replicate and extend the analyses. Both studies and the analysis estimate the effect of
the top corporate tax rate (and its square) on corporate tax revenues as a percentage of GDP. Panel
data for 29 OECD countries is used for the analysis.
Brill and Hassett Study
In their study, Brill and Hassett use panel data for the OECD countries from 1981 to 2003.42 They
use regression analysis (OLS) to estimate the effects. Brill and Hassett find that the corporate tax
rate has at first a positive effect on corporate tax revenues as a percentage of GDP and then a
decreasing effect—the effect looks like an inverted U, the shape of the classic Laffer curve. All of
their coefficient estimates are statistically significant. However, they do not account for problems
41 CRS Report R41743, International Corporate Tax Rate Comparisons and Policy Implications, by Jane G. Gravelle.
42 See Alex Brill and Kevin A. Hassett, Revenue-Maximizing Corporate Income Taxes: The Laffer Curve in OECD
Countries. The authors obtained data from the same sources as Brill and Hassett.
Corporate Tax Reform: Issues for Congress
Congressional Research Service 14
often encountered with the use of panel data, and their coefficient estimates would appear to be
biased and inconsistent.43
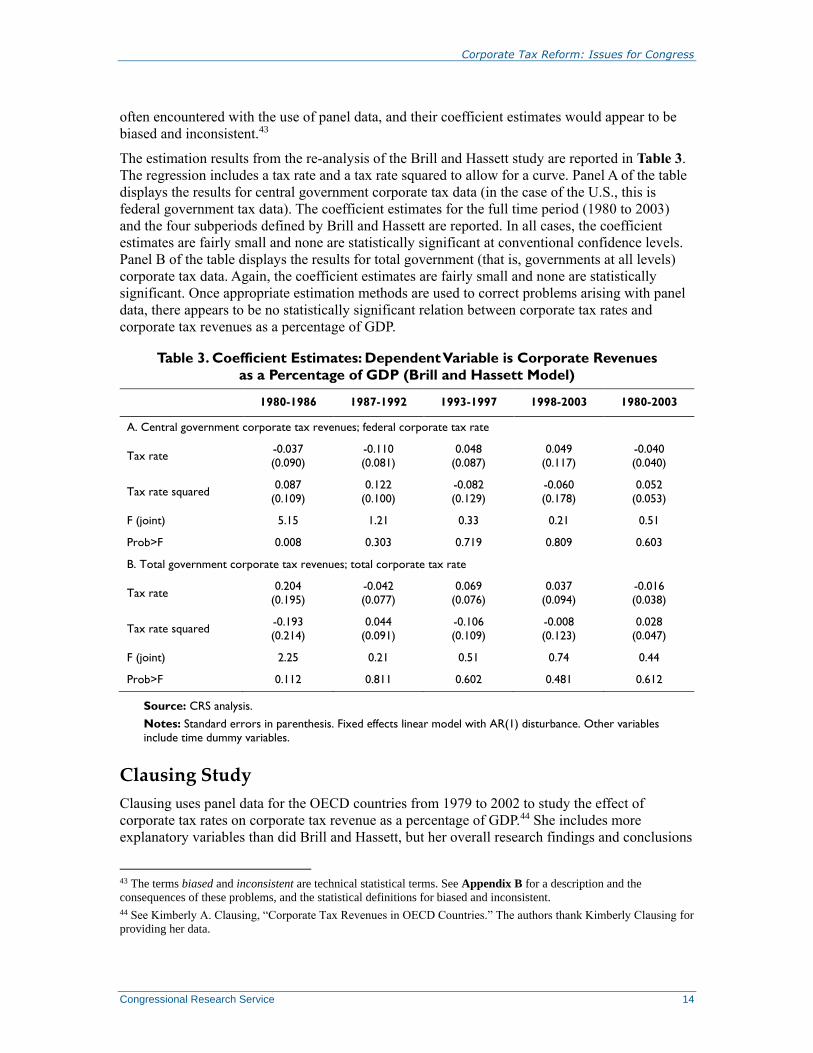
The estimation results from the re-analysis of the Brill and Hassett study are reported in Table 3.
The regression includes a tax rate and a tax rate squared to allow for a curve. Panel A of the table
displays the results for central government corporate tax data (in the case of the U.S., this is
federal government tax data). The coefficient estimates for the full time period (1980 to 2003)
and the four subperiods defined by Brill and Hassett are reported. In all cases, the coefficient
estimates are fairly small and none are statistically significant at conventional confidence levels.
Panel B of the table displays the results for total government (that is, governments at all levels)
corporate tax data. Again, the coefficient estimates are fairly small and none are statistically
significant. Once appropriate estimation methods are used to correct problems arising with panel
data, there appears to be no statistically significant relation between corporate tax rates and
corporate tax revenues as a percentage of GDP.
Table 3. Coefficient Estimates: Dependent Variable is Corporate Revenues
as a Percentage of GDP (Brill and Hassett Model)
1980-1986 1987-1992 1993-1997 1998-2003 1980-2003
A. Central government corporate tax revenues; federal corporate tax rate
Tax rate -0.037
(0.090)
-0.110
(0.081)
0.048
(0.087)
0.049
(0.117)
-0.040
(0.040)
Tax rate squared 0.087
(0.109)
0.122
(0.100)
-0.082
(0.129)
-0.060
(0.178)
0.052
(0.053)
F (joint) 5.15 1.21 0.33 0.21 0.51
Prob>F 0.008 0.303 0.719 0.809 0.603
B. Total government corporate tax revenues; total corporate tax rate
Tax rate 0.204
(0.195)
-0.042
(0.077)
0.069
(0.076)
0.037
(0.094)
-0.016
(0.038)
Tax rate squared -0.193
(0.214)
0.044
(0.091)
-0.106
(0.109)
-0.008
(0.123)
0.028
(0.047)
F (joint) 2.25 0.21 0.51 0.74 0.44
Prob>F 0.112 0.811 0.602 0.481 0.612
Source: CRS analysis.
Notes: Standard errors in parenthesis. Fixed effects linear model with AR(1) disturbance. Other variables
include time dummy variables.
Clausing Study
Clausing uses panel data for the OECD countries from 1979 to 2002 to study the effect of
corporate tax rates on corporate tax revenue as a percentage of GDP.44 She includes more
explanatory variables than did Brill and Hassett, but her overall research findings and conclusions
43 The terms biased and inconsistent are technical statistical terms. See Appendix B for a description and the
consequences of these problems, and the statistical definitions for biased and inconsistent.
44 See Kimberly A. Clausing, “Corporate Tax Revenues in OECD Countries.” The authors thank Kimberly Clausing for
providing her data.

Corporate Tax Reform: Issues for Congress
Congressional Research Service 15
are essentially the same as theirs—there is a Laffer curve relationship between corporate tax rates
and corporate tax revenue as a percentage of GDP. However, her estimation methods would lead
to biased and inconsistent coefficient estimates.45
The estimation results for five different specifications are reported in Table 4. The five
specifications differ by what explanatory variables are included in the analysis. In all five
specifications, the coefficient estimates of the corporate tax rate (and its square) are smaller than
those estimated by Clausing and have the opposite signs. Most of the coefficient estimates are not
statistically significant at conventional confidence levels, but two are statistically significant at
the 10% level only. (In these cases where the coefficients are significant on the tax squared term
they still do not produce the Laffer curve shape but rather suggest rising revenue with a rising tax
rate). Overall, these results suggest that the corporate tax rate has little effect on corporate tax
revenues as a percentage of GDP. Consequently, there is little evidence to support the existence of
a corporate tax Laffer curve.
Table 4. Coefficient Estimates: Dependent Variable is Corporate Revenues
as a Percentage of GDP (Clausing Model)
Specification
(1) (2) (3) (4) (5)
Tax rate -0.055
(0.035)
-0.073
(0.111)
-0.075
(0.046)
-0.048
(0.036)
-0.067
(0.047)
Tax rate squared 0.078*
(0.047)
0.118
(0.147)
0.102*
(0.061)
0.069
(0.048)
0.093
(0.061)
Profit rate X
Corporate share X
Unemployment rate X X
Per capita GDP growth rate X X
Per capita GDP X X
Openness X X
F (joint) 1.39 0.75 1.45 1.04 1.21
Prob>F 0.251 0.473 0.236 0.354 0.298
Source: CRS analysis.
Notes: Standard errors in parenthesis. Fixed effects linear model with AR(1) disturbance. Other variables
include the indicated variables and time dummy variables. *significant at 10% level.
Even if an empirical study found a statistically significant relationship that indicated a revenue-
maximizing tax rate, such results could not be considered reliable if they do not control for base
changes. If the rate is lowered but the base is broadened, the data could show rising tax revenues
that would be due to the base changes. In a recent paper, Slemrod and Kawano provide estimates
controlling for the direction of changes in the base (although not the magnitude, a much more
45 Clausing included two variables in her analysis indicating the type of corporate tax system that do not vary over time
for a country. The coefficients of these variables are not identified when using the fixed effect estimation method,
which is probably why she estimated the coefficients using OLS. While she obtained coefficient estimates for these two
variables, the estimates are biased and inconsistent.
Corporate Tax Reform: Issues for Congress
Congressional Research Service 16
daunting task) and find these controls raise the estimated revenue-maximizing tax rate.46 Thus,
until studies can adequately control for the magnitude of changes in the base, they cannot be the
basis for estimating a revenue-maximizing tax rate.
Cross-Country Investment Estimates: The Djankov Study
Cross-country empirical studies, as noted above, have recently been employed to address the
Laffer curve issue and, as will be discussed subsequently, the incidence of the corporate tax on
wages. In addition to these direct estimates, there are numerous empirical studies that examine
underlying relationships, such as the effect of the user cost of capital (which incorporates the tax
rate along with other variables) on investment. Most of these studies have found modest effects
on domestic investment and have employed times series estimates within the United States.47
One recent study on investment, Djankov et al.,48 is similar to the other studies in that it employs
a cross-country data base and an independent variable reflecting the tax rate to directly estimate
the effect of the corporate tax rate on investment, entrepreneurship and other variables. The study
found no effect on investment for statutory tax rates, but very large effects for constructed first
year and five year cash flow tax rates. This study, unlike the others discussed in this paper, is a
single cross section, so there is no way to introduce fixed country effects.
Theoretical Issues
Several difficulties arise in the Djankov analysis. First, the cash flow tax rate variable they
construct is a hypothetical one (for a hypothetical firm), which is not representative of the capital
stock or the firm size in a country (or in all countries). The denominator is income measured
before labor income taxes paid by the firm (such as social security taxes in the United States) and
economic depreciation. The first is very problematic because the capital income tax rate increases
as the labor income tax rate falls, which is a relationship that seems to have no obvious economic
justification. It also measures taxes on a cash flow basis for the first year (or the first five years in
an alternative scenario), rather than over the life of the investment.
An examination of scatter-plots of their data suggest that the results are highly affected by
outliers, particularly Bolivia (which has a very high tax rate and a very low investment rate) and
Mongolia, a low tax country where investment has been flowing in recently due to mining.
The tax rate for Bolivia is about twice the typical tax rate and is inconsistent with the corporate
rate in Bolivia. According to the authors, the tax rate reflects an alternative transactions tax.
However, a transactions tax is not a tax on corporate income but falls on all income in the
economy. Assuming that about a quarter of income is capital incomes, the tax should be reduced
by 75%.
46 Laura Kawano & Joel Slemrod, “How Do Corporate Tax Bases Change When Corporate Tax Rates Change? With
Implications for the Tax Rate Elasticity of Corporate Tax Revenues,” International Tax and Public Finance, vol. 23,
no. 3 (June 2016), pp. 401-433.
47 For reviews, see Robert Chirinko, “Investment Tax Credits,” in The Encyclopedia of Taxation and Tax Policy, ed. by
Joseph J. Cordes, Robert D. Ebel and Jane G. Gravelle, Washington, DC, the Urban Institute, 2005, pp. 226-229 and
Kevin A. Hassett and R. Glenn Hubbard, “Tax Policy and Business Investment,” Handbook of Public Economics (New
York: Elsiever, 2002), pp. 1293-1343.
48 Simeon Djankov, Tim Ganser, Caralee McLiesh, Rita Ramalho, and Andrei Shleifer, “The Effect of Corporate Taxes
on Investment and Entrepreneurship,” National Bureau of Economic Research, Working Paper no. 13756, January
2008. This paper was subsequently published in the American Economic Journal: Macroeconomics, vol. 2, pp. 31-64.

Corporate Tax Reform: Issues for Congress
Congressional Research Service 17
As with the Laffer-curve estimates, the results of this study, at least for the United States, are not
plausible. According to their estimates, a 10 percentage point drop in corporate tax increased
investment by 2.2 percentage points. According to an open economy model developed by
Gravelle and Smetters,49 however, U.S. capital would increase a maximum of 0.7 percentage
points with the elimination of corporate tax; with more reasonable elasticities, it would increase
by 0.3 percentage points. (This study was directed at the question of tax incidence and will be
discussed in more detail in the section below which addresses distributional issues and the burden
on labor). Moreover, these effects may understate the investment effects because they do not take
into account debt. Thus, their results suggest an investment increase that is at least 11 times too
large and that could be 25 or more times too large.
Empirical Analysis
Although the issue of fixed effects would cause this study to remain problematic in any case, this
section explores the effects of the tax rate changes and of specifications that include multiple
control variables.
The Djankov et al. sample consists of 2004 tax and economic data for 85 countries. They examine
the effect of the corporate tax rate on (1) aggregate investment, (2) foreign direct investment, and
(3) two measures of entrepreneurial activity. The main results of their study and the authors’
reanalysis are reported in Table 5. The first row of the table displays the coefficient estimate of
the effective corporate tax rate variable taken from the Djankov et al. study. Their basic
specification includes only the tax rate as an independent variable. The second row of the table
reports the range of estimates when a single additional independent variable is added—the
authors add 10 variables, one at a time. In all but one instance, the estimates are statistically
significant at the 1% or 5% confidence level, and at the 10% level in the remaining case.
Their data was reanalyzed after correcting an error in their tax rate for Bolivia, and cumulatively
adding selected independent variables that Djankov et al. included in their analysis; the new
analysis also included a region-of-the-world variable for each country. The first row of the bottom
panel in Table 5 presents the coefficient estimates for the basic model with only a single
independent variable: the effective corporate tax rate. For each dependent variable, the coefficient
estimate of the tax rate variable is smaller than Djankov et al.’s estimate, which illustrates the
importance of Bolivia to their results. Furthermore, the estimated effect of the tax rate on
aggregate investment is not statistically significant. The final row of Table 5 reports the
coefficient estimate of the tax rate when the full set of independent variables is included in the
analysis. The estimated effect of the tax rate on aggregate investment is much smaller than
Djankov et al.’s estimate and not statistically significant. The estimated effect of the corporate tax
rate on foreign direct investment and entrepreneurial activity is somewhat smaller than the effects
estimated by Djankov et al., but the estimates are statistically significant.
49 Jane G. Gravelle and Kent A. Smetters, “Does the Open Economy Assumption Really Mean That Labor Bears the
Burden of a Capital Income Tax?” Advances in Economic Policy and Analysis, vol. 6, no. 1, 2006.
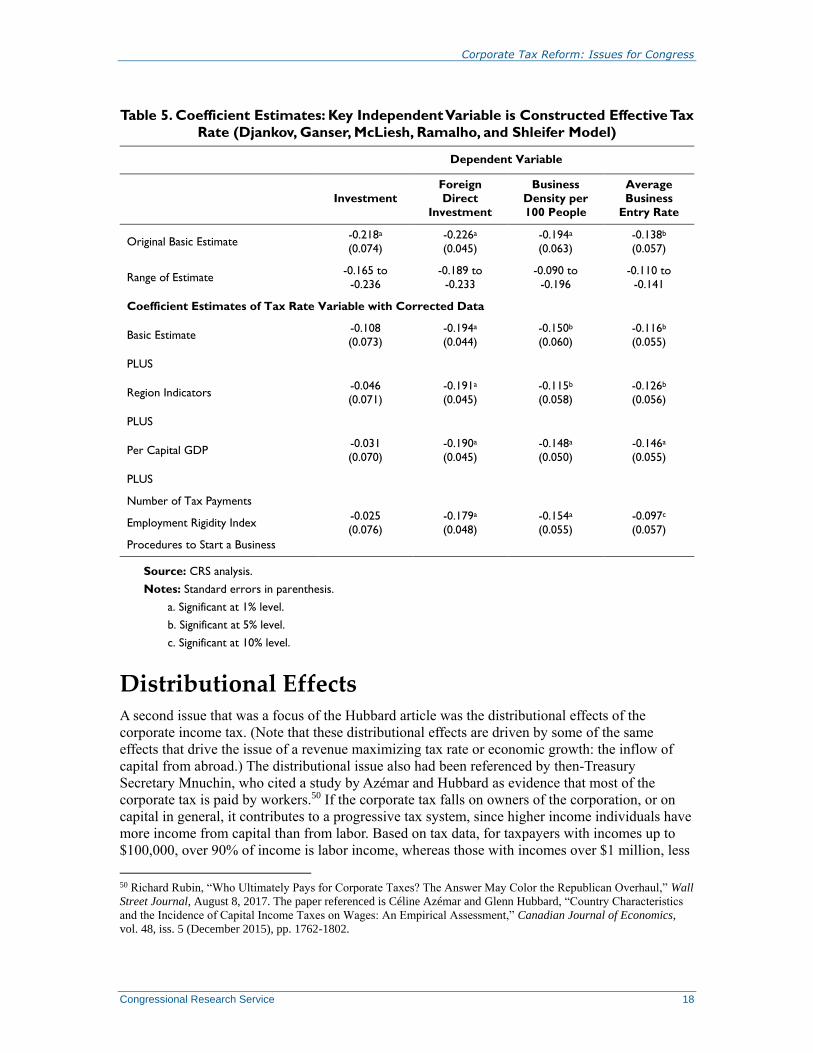
Corporate Tax Reform: Issues for Congress
Congressional Research Service 18
Table 5. Coefficient Estimates: Key Independent Variable is Constructed Effective Tax
Rate (Djankov, Ganser, McLiesh, Ramalho, and Shleifer Model)
Dependent Variable
Investment
Foreign
Direct
Investment
Business
Density per
100 People
Average
Business
Entry Rate
Original Basic Estimate -0.218a
(0.074)
-0.226a
(0.045)
-0.194a
(0.063)
-0.138b
(0.057)
Range of Estimate -0.165 to
-0.236
-0.189 to
-0.233
-0.090 to
-0.196
-0.110 to
-0.141
Coefficient Estimates of Tax Rate Variable with Corrected Data
Basic Estimate -0.108
(0.073)
-0.194a
(0.044)
-0.150b
(0.060)
-0.116b
(0.055)
PLUS
Region Indicators -0.046
(0.071)
-0.191a
(0.045)
-0.115b
(0.058)
-0.126b
(0.056)
PLUS
Per Capital GDP -0.031
(0.070)
-0.190a
(0.045)
-0.148a
(0.050)
-0.146a
(0.055)
PLUS
Number of Tax Payments
-0.025
(0.076)
-0.179a
(0.048)
-0.154a
(0.055)
-0.097c
(0.057) Employment Rigidity Index
Procedures to Start a Business
Source: CRS analysis.
Notes: Standard errors in parenthesis.
a. Significant at 1% level.
b. Significant at 5% level.
c. Significant at 10% level.
Distributional Effects A second issue that was a focus of the Hubbard article was the distributional effects of the
corporate income tax. (Note that these distributional effects are driven by some of the same
effects that drive the issue of a revenue maximizing tax rate or economic growth: the inflow of
capital from abroad.) The distributional issue also had been referenced by then-Treasury
Secretary Mnuchin, who cited a study by Azémar and Hubbard as evidence that most of the
corporate tax is paid by workers.50 If the corporate tax falls on owners of the corporation, or on
capital in general, it contributes to a progressive tax system, since higher income individuals have
more income from capital than from labor. Based on tax data, for taxpayers with incomes up to
$100,000, over 90% of income is labor income, whereas those with incomes over $1 million, less
50 Richard Rubin, “Who Ultimately Pays for Corporate Taxes? The Answer May Color the Republican Overhaul,” Wall
Street Journal, August 8, 2017. The paper referenced is Céline Azémar and Glenn Hubbard, “Country Characteristics
and the Incidence of Capital Income Taxes on Wages: An Empirical Assessment,” Canadian Journal of Economics,
vol. 48, iss. 5 (December 2015), pp. 1762-1802.
Corporate Tax Reform: Issues for Congress
Congressional Research Service 19
than a third is labor income.51 The traditional analysis of the corporate income tax indicates that
the burden generally spread to all capital, but does not fall on labor income. Most government and
private agencies that routinely do distributional analysis allocate the corporate tax largely to
capital income.52
Hubbard referred to three studies in his article: a working paper by economist Arnold Harberger,53
a working paper by William Randolph of the Congressional Budget Office (CBO),54 and a recent
empirical cross-country study using data similar to the studies discussed above, by Hassett and
Mathur.55 At about the same time or shortly thereafter three other empirical studies that use cross-
country data were released in 2006-2008, by Felix,56 by Desai, Foley and Hines,57 and by
Arulampalam, Devereux, and Maffini.58 Mankiw referred to the Randolph and Arulampalam,
Devereux, and Maffini studies, although as will be shown subsequently the Arulampalam et al.
study is examining an entirely different phenomenon which is unlikely to be very relevant to the
United States corporate tax, as is the case with the Azémar and Hubbard article referred to by
then-Treasury Secretary Mnuchin.
These studies reflect differing fundamental approaches to studying corporate tax incidence. One
approach uses a general equilibrium model that estimates incidence based on empirical estimates
51 See CRS Report RL33285, Tax Reform and Distributional Issues, by Jane G. Gravelle.
52 In the past, the Congressional Budget Office (CBO), the Department of the Treasury, and the Urban-Brookings Tax
Policy Center attributed 100% of the tax to capital income. In the past few years, all three organizations have moved to
assigning a small share to labor income. CBO assigns 25%, the Department of the Treasury 18%, and the Urban-
Brookings Tax Policy Center 20%. The Department of Treasury and the Tax Policy center assign a large share of the
tax to stockholders based on the idea that a large share of income is supra-normal returns. This share is based in part on
an estimate of the share of the corporate tax that is above a risk-free return. While some part of this return may be rent,
it probably also largely reflects risk premiums. There is, however, little justification for assigning the part of a return
due to anticipated risk as an “excess return” since such returns compensate for risk-taking. With risk and imperfect loss
offset, the tax on the risk premium falls in part in the same way as the normal return, in part on taxpayers to the extent
the tax reduces the variance of return but increases variance in revenues, and to some extent disappears because the
government is less risk-adverse than individuals. The CBO allocates the tax based on results from general equilibrium
models, modified for certain issues such as debt finance and rents. For further explanation, see CBO, The Distribution
of Household Income and Federal Taxes, 2008 and 2009, http://cbo.gov/sites/default/files/cbofiles/attachments/43373-
06-11-HouseholdIncomeandFedTaxes.pdf; Julie-Anne Cronin, Emily Y. Lin, Laura Power, and Michael Cooper,
Distributing the Corporate Income Tax: Revised U.S. Treasury Methodology, Office of Tax Analysis Technical Paper
5, May 2012. This paper was subsequently published in the National Tax Journal, March 2013, vol. 66, no. 1, pp. 239-
262, https://www.ntanet.org/NTJ/66/1/ntj-v66n01p239-62-distributing-corporate-income-tax.pdf; Jim Nunns, How the
TPC Distributes the Corporate Income Tax, Urban-Brookings Tax Policy Center, http://www.taxpolicycenter.org/
UploadedPDF/412651-Tax-Model-Corporate-Tax-Incidence.pdf.
53 It is not clear which of Harberger’s papers is being referred to, but it is presumably the more recent one: Arnold C.
Harberger, Corporate Tax Incidence: What is Known, Unknown, and Unknowable, University of California, 2006. This
paper was presented at a conference at Rice University in 2006, and subsequently published as in Fundamental Tax
Reform: Issues, Choices, and Implications, ed. John W. Diamond and George R. Zodrow, Cambridge, MA, MIT Press,
2008.
54 The paper in question is not an official CBO paper but rather a working paper by William Randolph. William C.
Randolph, International Burdens of the Corporate Tax, CBO, Working Paper no. 2006-09, August 2006.
55 Kevin A. Hassett and Aparna Mathur, Taxes and Wages, American Enterprise Institute, Working Paper, April 2008.
56 Rachel Alison Felix, Passing the Burden: Corporate Tax Incidence in Open Economies, November 2006. This paper
was a dissertation essay, University of Michigan.
57 Mihir A. Desai, C. Fritz Foley, and James R. Hines Jr., Labor and Capital shares of the corporate Tax Burden:
International Evidence. Prepared for the International Tax forum and Urban-Brookings Tax Policy Center conference
on Who Pays the Corporate Tax in an Open Economy, December 18, 2007.
58 Wiji Aralampalam, Michael P. Devereux, and Giorgia Maffini, The Direct Incidence of Corporate Income Tax on
Wages, Oxford University Center for Business Taxation, May, 2008. A revised version was subsequently released in
March, 2011. The paper was published in the European Economic Review, vol. 56 (2012), pp. 1038-1054.
Corporate Tax Reform: Issues for Congress
Congressional Research Service 20
of various behavioral responses and other aspects (such as size). The burden that falls on labor
versus capital depends on international capital flows and how well they can be used in different
countries (which in turn depend on the technology of production and the preferences of
consumers). The second approach is to directly estimate wages as a function of tax rates and other
variables from a set of data (this approach is called a reduced form estimate). These direct
estimates, in turn, fall into two types: (1) some studies are considering the effects of international
capital flows and (2) others are examining the share of the tax on excess profits (or rents) that is
born by labor by reducing the share of rents that is captured by labor in wage bargaining. Of the
studies mentioned in the previous paragraph, two (Harberger and Randolph) are of the general
equilibrium type; three (Hassett and Mathur, Felix, and Desai, Foley, and Hines) are reduced form
empirical estimates that reflect capital flows; and two (Arulampalam, Devereux, and Maffini and
Azémar and Hubbard) are estimating rent sharing through wage bargaining.
A news report indicated three articles referenced by the Treasury press office in support of the
burden falling on wages (although the Treasury Office of Tax Analysis currently assigns most of
the burden to capital income): two studies already mentioned, Randolph, and Hassett and Mathur,
and a study by Lui and Altshuler.59 The last study does not clarify what behavioral response it is
measuring, but because it is based on considering wage effects by industry it would be capturing
wage bargaining effects.
The Harberger and Randolph Studies
The first two studies explicitly focus on the effects of an open economy. It is a standard finding
that for a small open single-good economy with perfect capital mobility and perfect product
substitution, the burden of any source based capital income tax falls on labor (whereas for
residence based taxes, that is taxes that apply to domestic owners of capital regardless of where
they are domiciled, the burden would fall on capital). The corporate tax had some aspects of a
source based tax and some of a residence based tax.
Both the Harberger and the Randolph studies are based on this simple model of perfect
substitution, altered to account for the United States as a large county (which lowers the
elasticities) and to account for multiple sectors. Randolph’s study does not so much predict the
burden of the tax as explore incidence in certain types of models; he acknowledges that less
capital mobility causes the burden to shift from labor to capital. Harberger’s model has four
sectors, corporate and noncorporate tradable sectors and corporate and noncorporate nontradable
sectors. He assumes that the corporate tradable sector is more capital intensive than the average
industry, which leads to a burden of greater than 100% of the tax falling on capital. Despite the
vision of the manufacturing sector as highly capital intensive, it actually is not: housing services,
which are 100% capital, account for over a third of the capital stock in the country, and many
other industries, such as utilities and agriculture are also more capital intensive than
manufacturing. Using the same assumptions about mobility, but with a less capital intensive
manufacturing sector, Randolph finds 70% of the corporate tax burden falls on labor.
To permit other than perfect substitutability, a much more complex computable general
equilibrium model would be required, which neither Harberger nor Randolph has provided. Such
59 Robert Farley, “Who Benefits from Corporate Tax Cut, The Wire,” September 7, 2017, at
http://www.factcheck.org/2017/09/benefits-corporate-tax-cut/. The last study is Li Liu and Rosanne Altshuler,
Measuring the Burden of a Corporate Tax Under Imperfect Competition, Oxford Working Paper no. 11/05,
subsequently published in the National Tax Journal, vol. 66, no. 1 (March 2013), pp. 215-238.
Corporate Tax Reform: Issues for Congress
Congressional Research Service 21
a model has been developed by Gravelle and Smetters60 who find, with reasonable elasticities,
that capital still bears most of the burden, about 80%. A recent CBO working paper by Jennifer
Gravelle provides an extensive review of the existing general equilibrium models and the factors
that drive the results.61 She finds that five factors tend to move the burden toward falling on
capital: a smaller willingness of consumers to substitute between foreign and domestic products, a
higher substitutability of labor and capital in the production process, a smaller willingness of
investors to substitute investments in different countries, a less capital intensive corporate
tradable sector, and a larger country. Her review of the evidence on these factors suggests that,
based on these models, the majority of the tax (about 60%) is born by capital, with results
differing from the Gravelle and Smetters findings due to a lower substitution elasticity between
capital and labor in production.62 She subsequently considers, however, other factors that could
increase the burden on capital (and even benefit labor), including the use of debt (discussed
below).
Although the general equilibrium models can be very complex, they still abstract from some
important features of the corporate tax. There are several other factors that would further push the
corporate tax burden toward capital. First, if some share of profits is rent, it would be expected to
fall on capital in the United States, because only a small share of the private sector (less than 7%)
is unionized.63 Second, the current corporate tax actually subsidizes debt finance at the firm level,
and if debt is much more substitutable than equity, total capital would be less likely to be
exported: indeed, raising the corporate tax rate could cause capital to flow in. A study by Grubert
and Mutti found that in a general equilibrium model that included debt, such a capital inflow
occurred when capital income taxes were raised, an outcome that would lead to labor benefitting
from the corporate tax.64 The burden would also be likely to fall on capital if elements of a
residence tax were reimposed in the United States (there are some minor current elements
because branch income abroad is subject to tax). The current international tax regime under
GILTI allows a deduction for 10% of tangible income, largely exempting the income from
tangible investments of foreign subsidiaries from tax. Eliminating that exemption and raising the
GILTI rate to the full U.S. rate would lead to a worldwide, or residence-based tax (such a change
could be accompanied by an elimination of the deduction for FDII, whose exemption for tangible
investment discourages the investment tangible capital in the United States because an increase
decreases the deduction).
Finally, note that as long as countries tend to choose tax rates similar to each other, which appears
to be the case, the world becomes like the original closed economy, a model stressed by
Harberger, with the burden falling on capital. According to the 2007 Treasury study, the U.S.
combined state and federal corporate statutory rate was 39%, the G-7 average was 36%, and the
60 Jane G. Gravelle and Kent A. Smetters, “Does the Open Economy Assumption Really Mean That Labor Bears the
Burden of a Capital Income Tax?” Advances in Economic Policy and Analysis, vol. 6, no. 1, 2006.
61 Jennifer Gravelle, Corporate Tax Incidence: Review of General Equilibrium Estimates and Analysis, CBO, Working
Paper no. 2010-03, May 2010, http://www.cbo.gov/ftpdocs/115xx/doc11519/05-2010-Working_Paper-
Corp_Tax_Incidence-Review_of_Gen_Eq_Estimates.pdf. A version of this paper was published in the National Tax
Journal, vol. 16, no. 1 (March 2013), pp. 185-215.
62 Note that a lower ability to substitute capital for labor in production, while increasing the burden on labor, reduces
the capital inflow, leads to a smaller increase in output, and a higher revenue maximizing tax rate.
63 See Megan Dunn and James Walker, Union Membership in the United States, Bureau of Labor Statistics, September
2016, https://www.bls.gov/spotlight/2016/union-membership-in-the-united-states/pdf/union-membership-in-the-united-
states.pdf.
64 Harry Grubert and John Mutti, “International Aspects of Corporate Tax Integration: The Role of Debt and Equity
Flows,” National Tax Journal, vol. 47, March, 1994, pp. 111-133.
Corporate Tax Reform: Issues for Congress
Congressional Research Service 22
OECD average was 31%. In 2013, the rates had declined slightly, with rates of 29% in the OECD
and 30% for the largest 15 countries (both excluding the United States). Effective tax rates, which
should govern the movement of capital, are even closer together, and in some cases are lower for
the United States than for other countries. More recent updates of tax rates indicated that U.S.
rates were similar to the rest of the world.65 Jennifer Gravelle used OECD tax rates to estimate the
share of the U.S. tax falling on labor using a global approach and finds that over 90% falls on
capital.66
An argument is often made that the burden of any capital income tax tends to fall on labor
because it reduces savings, an effect that would also occur in a closed economy. While one
version of the model predicts that the entire burden of a capital income tax eventually falls on
labor, this version requires some extreme assumptions about human behavior such as perfect
information, an infinite planning horizon, perfect liquidity, and asexual reproduction. Models
allowing for finite lives (such as the life-cycle models) find results that vary, but if the revenue
loss is made up by higher taxes on labor, there is little or no effect. Some economists believe that
these models are inappropriate, as they assume too much information and skill on the part of
individuals; they suggest that individuals use rules of thumb, such as fixed savings rates or
targets, instead. These rules of thumb suggest that a cut in capital income taxes either has no
effect on saving or reduces savings. These economists also point out that most empirical evidence
does not point to an increase in savings; historically, savings rates do not appear to respond to
reduced tax rates.67
The Hassett and Mathur Study
Whereas the general equilibrium models do not provide much support for the corporate tax
burden falling on labor, Hubbard also referred to an empirical study by Hassett and Mathur that
uses the corporate tax rate to explain differences in manufacturing wages.68 They find a
statistically significant result that indicates a 1% increase in the corporate tax causes
manufacturing wages to fall by 0.8% to 1%. These results are impossible, however, to reconcile
with the magnitudes in the economy. Through competition, wage changes in manufacturing
65 See CRS Report R41743, International Corporate Tax Rate Comparisons and Policy Implications, by Jane G.
Gravelle.
66 Jennifer Gravelle, Corporate Tax Incidence: Review of General Equilibrium Estimates and Analysis, CBO, Working
Paper no. 2010-03, May 2010, http://www.cbo.gov/ftpdocs/115xx/doc11519/05-2010-Working_Paper-
Corp_Tax_Incidence-Review_of_Gen_Eq_Estimates.pdf.
67 These issues surrounding savings are discussed in greater detail in CRS Report R42111, Tax Rates and Economic
Growth, by Jane G. Gravelle and Donald J. Marples; CRS Report RL32517, Distributional Effects of Taxes on
Corporate Profits, Investment Income, and Estates, by Jane G. Gravelle and Sean Lowry; CRS Report RL33545, The
Advisory Panel’s Tax Reform Proposals, by Jane G. Gravelle; and CRS Report RL33482, Saving Incentives: What May
Work, What May Not, by Thomas L. Hungerford, which is available upon request. The recognition that replacement of
capital income taxes by wage taxes in a life cycle model could have little effect on savings or contract them can be
found in numerous simulation studies, for example, Alan Auerbach and Laurence Kotlikoff, Dynamic Fiscal Policy
(Cambridge, MA: Cambridge University Press, 1987).
68 This study is one of a number of empirical studies that try to estimate incidence from a direct examination of wages
(as opposed to embedding capital flow and other elasticities into a model). For other reviews of these studies see
William M. Gentry, A Review of the Evidence on the Incidence of the Corporate Income Tax, U.S. Department of
Treasury, Office of Tax Analysis, Working Paper no. 101, December 2007, http://www.treasury.gov/resource-center/
tax-policy/tax-analysis/Documents/ota101.pdf; Jennifer C. Gravelle, Corporate Tax Incidence: A Review of Empirical
Estimates and Analysis, CBO, Working Paper no. 2011-01, June 2011, http://www.cbo.gov/ftpdocs/122xx/doc12239/
06-14-2011-CorporateTaxIncidence.pdf; and Kimberly A. Clausing, In Search of Corporate Tax Incidence, September
2011, Presented at a Conference of the American Tax Policy Institute, http://americantaxpolicyinstitute.org/15papers/
Clausing%20ATPI.pdf.
Corporate Tax Reform: Issues for Congress
Congressional Research Service 23
should be reflected in wages throughout the economy, implying that a 1% rise in corporate
revenues would cause a 0.8% to 1% fall in wage income. However, corporate taxes are only about
2.5% of GDP at best, whereas labor income is about two thirds. These results imply that a dollar
increase in the corporate tax would decrease wages by $22 to $26, an effect that no model could
ever come close to predicting.69
The lack of theoretical reasonableness of the results may be explained by statistical issues. The
Hassett and Mathur study used data from 72 developed and developing countries for the 1981 to
2003 period.70 For their analysis, their dependent variable is the logarithm of the five-year
average of the average manufacturing wage. They justify their use of the five-year average wage
by (1) noting that due to capital adjustment costs, the economic effects of corporate tax rate
changes show up over longer time periods, and (2) arguing that this may control for possible
measurement error induced by the business cycle.71 The wage rates for all countries were
converted to U.S. dollars using annual exchange rates. Hassett and Mathur include the price level
of consumption as an explanatory variable to capture cost of living differences across countries.
The main explanatory variable of interest is the logarithm of the top corporate tax rate. Hassett
and Mathur also use the average effective and marginal effective corporate tax rates (in
logarithms) as explanatory variables in some specifications.
The Hassett and Mathur basic estimation exercise was replicated: the results are reported in the
first row of Table 6.72 The coefficient estimate reported in the first column (-0.759) suggests that
a 10% increase in the top corporate tax rate will lead to a 7.6% decrease in the average
manufacturing wage rate. This estimate is statistically significant at the 5% level.73 The results are
not as strong (the estimates are closer to zero) when using alternative measures of the corporate
tax rate (see the next two columns of Table 6).
The exchange rate between two currencies reflects the relative supply and demand for those two
currencies, and is affected by financial markets and government policies. Exchange rates may not
be good indicators of the relative buying power of wage rates in two countries. Purchasing Power
Parities (PPPs), however, are specifically designed to equalize the internal purchasing power of
the currencies. Workers in Australia, for example, are concerned with what their wages will
69 To convert an elasticity into an incidence measure, the coefficient should be multiplied by the ratio of labor income
to the corporate tax. Two other studies using cross-country data have examined the incidence of the tax on labor
income. Passing the Burden: Corporate Tax Incidence in Open Economies, by Rachel Alison Felix, November 2006,
finds smaller effects than Hassett and Mathur, but ones that are still too large to be predicted by a theoretical model.
This study has problems similar to those that are discussed subsequently and, in addition, do not control for country
fixed effects.
70 Hassett and Mathur, Taxes and Wages. The authors are grateful to Kevin Hassett and Aparna Mathur for providing
their data. Several of the countries only have data for shorter periods.
71 Their independent or explanatory variables take their value from the beginning of the five-year period over which
wages are averaged. It should also be noted that Hassett and Mathur calculate the five-year average with nominal
wages (that is, they are not corrected for inflation).
72 See Appendix B for a description of the estimation method. Visual inspection of the Hassett and Mathur data
uncovered some errors with their five-year averages of wage rates—some averages were based on six years of data and
others were based on less than five years of data. The authors corrected the errors so that each five-year period for each
country contains five years of data. Some of the averages are based on less than five years of data because of missing
values in the wage series; most of the missing values are in the 2001 to 2005 period.
73 The specific test of statistical significance of the coefficient estimates is the t-test. This is a test of whether or not the
estimate is equal to zero (the null hypothesis is the estimate is equal to zero). The significance level indicates the risk of
rejecting the null hypothesis when it is, in fact, true. A significance level of 5% indicates that the null hypothesis will
be inadvertently rejected only 5% of the time. Significance levels commonly used in empirical social science work are
the 1%, 5%, and 10% levels.

Corporate Tax Reform: Issues for Congress
Congressional Research Service 24
purchase in Australia, and not how many dollars their wages will buy. Using PPPs is a more
appropriate way to convert national currencies to a common currency (U.S. dollars).
The second row of Table 6 reports the coefficient estimates when the wage rates are converted to
U.S. dollars using the consumption PPPs. Consumption PPPs are more appropriate for converting
wages than using general PPPs (over GDP) because they omit national expenditures for
government and investment goods. Again, nominal wages are the dependent variable. The
coefficient estimates are closer to zero than the estimates reported in the first row, but the
coefficient estimate reported in the first column (-0.728) is statistically significant at the 5% level.
The estimates for the alternative measures of the corporate tax rate are not statistically significant
at the conventional confidence levels.
Table 6. Coefficient Estimates: Dependent Variable is the Logarithm of the
Five-Year Average of Wage Rates
How Wage Variable Converted to
U.S. Dollars
Corporate Tax Rate Variable
Top Tax Rate Effective Average Effective Marginal
Exchange Rate -0.759a
(0.297)
-0.630b
(0.334)
-0.384b
(0.226)
Purchasing Power Parity Exchange Rate (PPP) -0.728a
(0.303)
-0.528
(0.340)
-0.334
(0.230)
PPP—Constant Dollars -0.488b
(0.298)
-0.294
(0.318)
-0.218
(0.215)
Observations with Five-Year Averages Based on Five Years of Data
Exchange Rate 0.089
(0.353)
-0.229
(0.363)
-0.184
(0.240)
Purchasing Power Parity Exchange Rate (PPP) -0.037
(0.354)
-0.187
(0.373)
-0.156
(0.246)
PPP—Constant Dollars -0.064
(0.350)
-0.230
(0.351)
-0.180
(0.231)
Source: CRS analysis.
Notes: Standard errors in parenthesis. Fixed effects linear model. Other variables include time dummies, log
personal tax rate, log real value-added, log consumer price variable (except for real PPP).
a. Significant at 5% level.
b. Significant at 10% level.
The most appropriate measure of wages is the inflation-adjusted consumption PPP-adjusted wage
rate. Wages in each country were converted to U.S. dollars using the consumption PPP and then
converted to constant (inflation-adjusted) dollars using the CPI-U before calculating the five-year
average. The final row of Table 6 displays the coefficient estimates for the model using this
measure as the dependent variable. The estimates are closer to zero than in the other two cases.
The coefficient estimate in the first column (-0.488) is statistically significant at the 10% level but
not at the 5% level. The other two estimates in columns two and three are not statistically
significant at the conventional confidence levels. Although there is still some evidence of
corporate tax rates having a negative influence on wage rates in manufacturing, the effect is
smaller and less robust than reported in the Hassett and Mathur study.
Hassett and Mathur averaged wages over five-year periods. They justify using five-year averages
by arguing that it helps to control for possible measurement error induced by the business cycle.
But, because of missing values in the wage data, 66 observations have the average wage based on

Corporate Tax Reform: Issues for Congress
Congressional Research Service 25
less than five years of data (60 observations use only two consecutive years of data for the
calculation of the average, which would likely not affect any measurement error). The bottom
panel of Table 6 reports the estimation results when these 66 observations are excluded from the
analysis (leaving 153 observations). In all cases, the coefficient estimates for all measures of the
corporate tax rate are not statistically significant.
Averaging the wage data over five years and using the beginning of period value for the
explanatory variables, however, eliminates much of the variation in wages and tax rates, thus
throwing away much of the information needed to estimate the economic effects. The statistical
analysis is repeated using annual data and including various lagged values of the corporate tax
rate as explanatory variables.74 The results are reported in Table 7. The first column of the table
displays the coefficient estimates for the current value of the corporate tax rate (labeled t in the
first column) and the values for the previous five years (t-1 to t-5), which allows for longer term
effects of tax rates on wages. In each case, the coefficient estimates are negative but very close to
zero; none are statistically significant at the conventional confidence levels. Furthermore, all the
tax rate variables in column (1) are not jointly statistically significant. The next six columns
report the results when the corporate tax rate values (current and lagged) are entered individually.
In every case, the coefficient estimates are close to zero and are not statistically significant at
conventional confidence levels. In using annual data, there is no evidence that changes in the top
corporate tax rate affects wage rates in manufacturing.75
Table 7. Coefficient Estimates: Dependent Variable is Annual Logarithm
of Real PPP-Adjusted Wage Rates
Tax Rate
Lag (1) (2) (3) (4) (5) (6) (7)
t -0.031
(0.208)
0.010
(0.140)
t-1 -0.217
(0.188)
-0.219
(0.143)
t-2 -0.076
(0.166)
-0.074
(0.144)
t-3 -0.040
(0.159)
0.021
(0.145)
t-4 -0.113
(0.156)
-0.070
(0.146)
t-5 -0.154
(0.155)
-0.165
(0.147)
F (joint) 0.49
Prob>F 0.819
Source: CRS analysis.
74 Including the lagged values of the corporate tax rate allows the tax rates for the previous five years to individually
have an impact on wages. All tax rates are entered into the model in logarithms.
75 The authors obtain the same estimation results when the exchange rate is used to convert wage rates to U.S. dollars—
the method used by Hassett and Mathur.
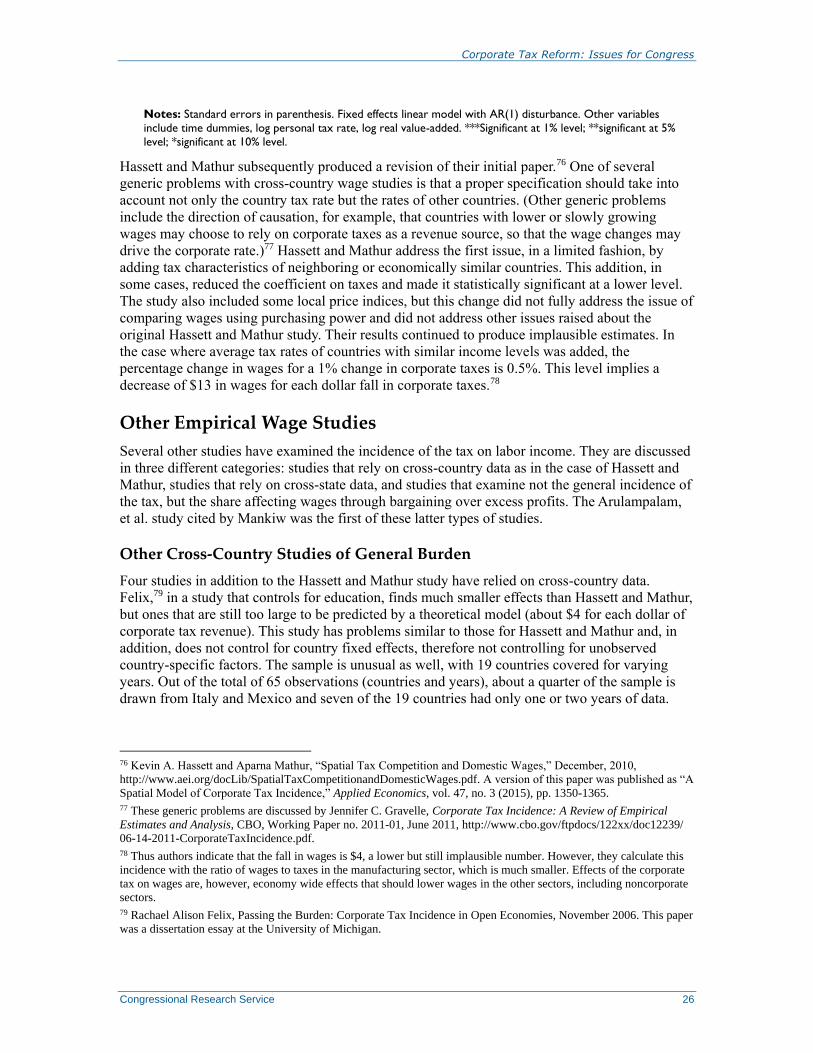
Corporate Tax Reform: Issues for Congress
Congressional Research Service 26
Notes: Standard errors in parenthesis. Fixed effects linear model with AR(1) disturbance. Other variables
include time dummies, log personal tax rate, log real value-added. ***Significant at 1% level; **significant at 5%
level; *significant at 10% level.
Hassett and Mathur subsequently produced a revision of their initial paper.76 One of several
generic problems with cross-country wage studies is that a proper specification should take into
account not only the country tax rate but the rates of other countries. (Other generic problems
include the direction of causation, for example, that countries with lower or slowly growing
wages may choose to rely on corporate taxes as a revenue source, so that the wage changes may
drive the corporate rate.)77 Hassett and Mathur address the first issue, in a limited fashion, by
adding tax characteristics of neighboring or economically similar countries. This addition, in
some cases, reduced the coefficient on taxes and made it statistically significant at a lower level.
The study also included some local price indices, but this change did not fully address the issue of
comparing wages using purchasing power and did not address other issues raised about the
original Hassett and Mathur study. Their results continued to produce implausible estimates. In
the case where average tax rates of countries with similar income levels was added, the
percentage change in wages for a 1% change in corporate taxes is 0.5%. This level implies a
decrease of $13 in wages for each dollar fall in corporate taxes.78
Other Empirical Wage Studies
Several other studies have examined the incidence of the tax on labor income. They are discussed
in three different categories: studies that rely on cross-country data as in the case of Hassett and
Mathur, studies that rely on cross-state data, and studies that examine not the general incidence of
the tax, but the share affecting wages through bargaining over excess profits. The Arulampalam,
et al. study cited by Mankiw was the first of these latter types of studies.
Other Cross-Country Studies of General Burden
Four studies in addition to the Hassett and Mathur study have relied on cross-country data.
Felix,79 in a study that controls for education, finds much smaller effects than Hassett and Mathur,
but ones that are still too large to be predicted by a theoretical model (about $4 for each dollar of
corporate tax revenue). This study has problems similar to those for Hassett and Mathur and, in
addition, does not control for country fixed effects, therefore not controlling for unobserved
country-specific factors. The sample is unusual as well, with 19 countries covered for varying
years. Out of the total of 65 observations (countries and years), about a quarter of the sample is
drawn from Italy and Mexico and seven of the 19 countries had only one or two years of data.
76 Kevin A. Hassett and Aparna Mathur, “Spatial Tax Competition and Domestic Wages,” December, 2010,
http://www.aei.org/docLib/SpatialTaxCompetitionandDomesticWages.pdf. A version of this paper was published as “A
Spatial Model of Corporate Tax Incidence,” Applied Economics, vol. 47, no. 3 (2015), pp. 1350-1365.
77 These generic problems are discussed by Jennifer C. Gravelle, Corporate Tax Incidence: A Review of Empirical
Estimates and Analysis, CBO, Working Paper no. 2011-01, June 2011, http://www.cbo.gov/ftpdocs/122xx/doc12239/
06-14-2011-CorporateTaxIncidence.pdf.
78 Thus authors indicate that the fall in wages is $4, a lower but still implausible number. However, they calculate this
incidence with the ratio of wages to taxes in the manufacturing sector, which is much smaller. Effects of the corporate
tax on wages are, however, economy wide effects that should lower wages in the other sectors, including noncorporate
sectors.
79 Rachael Alison Felix, Passing the Burden: Corporate Tax Incidence in Open Economies, November 2006. This paper
was a dissertation essay at the University of Michigan.
Corporate Tax Reform: Issues for Congress
Congressional Research Service 27
Another study, by Desai, Foley and Hines80 uses observations on foreign owned affiliates of U.S.
firms across countries and in different time periods. This study uses data on multinational
subsidiaries of U.S. firms to estimate the allocation of the tax burden between labor and capital
using a seeming unrelated regression for capital income (which they measure by the interest rate)
and labor income. In their model, labor and capital burdens are restricted to the total of taxes, and
they impose a cross-equation restriction on the estimated burdens. They find the share of the
burden on labor income to fall between about 45% and 75% of the total, a number that is not
inconsistent with theoretical expectations.
This approach, however, has the fundamental theoretical problem that wages at an individual firm
should not reflect tax burdens at an individual firm. In deriving a model that assumes it does, they
assume that the price level of their goods is fixed and base their results only on their sample of
firms (which is comprised solely of multinational corporate sector firms). This approach creates
both econometric problems in their analysis and also means that their results cannot be construed
as reflecting actual burdens in any of their economies, as discussed in more detail in Appendix C.
They also represented equity returns through the interest rate, under the assumptions that
investors equate (net of risk) debt and equity returns. If these assets are generally substitutable,
the increase in corporate tax should cause portfolios to shift toward debt and drive the interest rate
up (while driving the equity return down). Moreover, the tax burdens on debt and equity differ at
the individual level and those differences depend, among other things, on any special tax rates for
dividends and capital gains, the deferral advantage of capital gains, and the inflation rate.
Aside from these theoretical problems, an important issue with their study is that it appears that
their results are forced by the cross equation restriction. William Randolph, a discussant at a 2008
conference, found that if the restriction is eliminated there are no statistically significant results
from their study.81 In an example he presented, the estimates of the wage effect was 48% of the
burden, with a standard error of 18% in the original study; in a regression without the restriction
the share was 19% with a standard error of 100%.82 Randolph considered a number of other
specifications, including excluding the largest countries, but found no statistically significant
results. He also suggested that only manufacturing subsidiaries be considered since other
subsidiaries may be involved in tax sheltering operations. In the case where he considered only
manufacturing subsidiaries, the sign reversed (indicating labor benefitted from the tax) but it was
not statistically significant.
Across-country study by Clausing used a data set covering the OECD countries.83 Her study
examined a number of different specifications, econometric approaches, and alternative data
measurements. Two aspects that differed from the Hassett and Mathur study were comparing
wages using purchasing power parity and excluding value-added variables, which Clausing
suggests is capturing the effect of corporate taxes (whose burden on labor operates by reducing
labor productivity). She expects this latter change would make results for the corporate tax
variable larger. Overall, however, while trying many specifications and approaches, she
characterizes the results as indicating no robust evidence that corporate tax burdens have large
80 Mihir A. Desai, C. Fritz Foley, and James R. Hines Jr., “Labor and Capital Shares of the Corporate Tax Burden:
International Evidence,” prepared for the International Tax Policy Forum and Urban-Brookings Tax Policy Center
conference on Who Pays the Corporate Tax in an Open Economy?, December 18, 2007.
81 His remarks were made at a seminar at the American Enterprise Institute, March 17, 2008.
82 The coefficient must be close to twice the standard error to be statistically significant; thus the result from the
unrestricted regression showed no relationship between taxes and wages.
83 Kimberly A. Clausing, “In Search of Corporate Tax Incidence,” November 2011.
Corporate Tax Reform: Issues for Congress
Congressional Research Service 28
depressing effects of wages. She notes, however, that this outcome does not necessarily mean
there is no incidence on labor, but that these effects cannot be detected with aggregate cross-
country data, a point also made by Jennifer Gravelle in her review of empirical studies.84
The most recent study, by Ebrayet and Geys, estimates a model that allows for countries to
compensate for high labor costs by reducing the corporate tax. Their estimates, using 24 OECD
countries, indicate that a 1% increase in the corporate tax rate reduces the average wage by from
$0.51 to $0.89, implying a $6 to $11 increase in wages for a dollar increase in the corporate tax,
an implausible result.85
Cross-State Regressions
Three studies estimate tax incidence based on cross-state comparisons, as if each state were a
separate country. Felix examines wages by residents of states depending, among other factors, on
the state corporate tax rates.86 She finds a smaller effect than the Hassett and Mathur or her own
cross-country study, although the results remain implausible, suggesting that a $1 dollar increase
in taxes reduces wages by between $1.40 and $3.60.87 Other problems with her data set is that it is
not a panel, so there is no individual specific control, and the data set also does not allow the
identification of place of work, but rather place of residence.
Felix and Hines use a similar cross-state data set.88 Although the stated objective of this study is
to examine rent sharing by considering union and nonunion differentials, the paper also contains
direct estimates of the effects on tax rates on wages. The relationships, however, are positive, not
negative. Although the authors conclude that higher corporate tax rates reduce union wage
differentials (a point associated with bargaining over surplus discussed in the next section), this
differential arises in their empirical estimates because union wages rise less with corporate taxes
than do nonunion wages. Thus these results directly contradict the results in the previous Felix
study.
Carroll also examines individual workers across the states using a different data set. He estimates
the effects of the statutory rate (combined federal and state) and also an average state tax rate.89
The first is only marginally statistically significant (and he does not highlight that result), but the
second is highly significant. However, the average tax rate is measured not as taxes divided by
profits but as taxes divided by personal income. Since personal income is strongly correlated with
wages, this measure of tax would likely produce a powerful negative relationship without any
direct relationship with taxes. As with other studies, the incidence estimated in this study is very
large relative to the expected shares (he calculates $2.50 for every dollar of tax).
84 Jennifer C, Gravelle, Corporate Tax Incidence: A Review of Empirical Estimates and Analysis, CBO, Working Paper
no. 2011-01, June 2011, http://www.cbo.gov/ftpdocs/122xx/doc12239/06-14-2011-CorporateTaxIncidence.pdf.
85 Nelly Exbrayat and Benny Geys, “Economic Integration, Corporate Tax Incidence and Fiscal Compensation,” The
World Economy, 2016, pp. 1792-1811. For a semi-elastic estimate, the coefficient should be multiplied by labor
income and divided by the tax and the average wage.
86 R. Alison Felix, “Do State Corporate Income Taxes Reduce Wages?” Economic Review, Federal Reserve Bank of
Kansas City, vol. 94, no. 9, 2009.
87 Jennifer C, Gravelle, Corporate Tax Incidence: A Review of Empirical Estimates and Analysis, CBO, Working Paper
2011-01, June 2011, http://www.cbo.gov/ftpdocs/122xx/doc12239/06-14-2011-CorporateTaxIncidence.pdf.
88 R. Alison Felix, and James R. Hines, Corporate Taxes and Union Wages in the United States, National Bureau of
Economic Research, Working Paper no. 15263, August, 2009.
89 Robert Carroll, Corporate Taxes and Wages: Evidence from the 50 States, Tax Foundation, Working Paper no. 8,
August 2009, http://www.taxfoundation.org/files/wp8.pdf.

Corporate Tax Reform: Issues for Congress
Congressional Research Service 29
Another problem with cross-state studies is that states often allocate profits based on formulas
and these formulas change the dynamics of capital flows. For example, if a firm’s taxes are based
on the share of sales, changing the location of production would not be relevant to the state tax
burden. One recent study, by Suarez Serrato and Zidar, explicitly addressed the apportionment
issue by controlling for the share of the tax that was based on a sales factor (other factors are
capital and labor) and thus should not affect location.90 The study found 30% to 35% of the tax
borne by labor. The study also used a spatial approach to address geographic location. A study by
McKenzie and Ferede of the Canadian provinces did not control for the effect of formula
apportionment (Canadian provincial taxes are levied 50% by sales and 50% by wages). The
results of this study, were, however, implausible, finding a range of $0.96 to $1.59, depending on
the province.91
One issue with cross-state studies is whether, even were there no concerns with particular studies,
the results could provide guidance to the effects of the federal tax. Capital is likely significantly
more mobile across states and products across states are probably closer substitutes, both factors
that make the incidence more likely to fall on labor. Labor, however, is also mobile but its relative
increase in mobility is probably less than that of capital. The states are also more like small
economies on average. As in the case of cross-country studies, the tax rates of other states should
be included in the regression. In addition, state corporate tax rates are much lower than the federal
tax rate and it would be even more difficult to use this small explanatory variable to explain
wages.
Rent Sharing Studies
Several studies have appeared recently that discuss the potential burden of the corporate tax on
wages via an entirely different mechanism, which has been misinterpreted in some ways. As
noted earlier, Greg Mankiw92 cited a study by Arulampalam, Devereux, and Maffini (hereinafter,
ADM) finding a labor share of the corporate tax burden of 96% as evidence that the corporate tax
fell largely on labor. (The most recent version of their study reports 49%).93 More recently, former
Treasury Secretary Steve Mnuchin cited a study of this type by Azémar and Hubbard (AH) as
evidence that the burden falls largely on labor (they found 60%).94 ADM, AH and other studies of
this nature do not estimate the general equilibrium effects of corporate taxes on economy wide
wages through capital flows but rather the share of the tax on excess profits that falls on workers
due to bargaining and rent sharing, as do the other studies reviewed in this section. Because of the
method of estimation, the Liu and Altshuler paper referenced by the Treasury Press Office would
also be classed with rent-sharing studies. These rent-sharing studies have relatively little
relevance to the general issue of the corporate income tax for the United States (in part, because
the shares of workers who belong to unions that bargain on wages is so small). However, their
results have been invoked as evidence on the general tax burden and these types of studies began
90 Juan Carlos Suarez Serrato and Owen Zidar, “Who Benefits from State Corporate Tax Cuts? A Local labor Markets
Approach with Heterogeneous Firms,” American Economic Review, vol. 109, no. 9 (September 2016), pp. 2582-2624.
91 The Incidence of the Corporate Income Tax on Wages: Evidence from Canadian Provinces Kenneth J. McKenzie
and Ergete Ferede, April 2017, at
http://econ.ucalgary.ca/manageprofile/sites/econ.ucalgary.ca.manageprofile/files/unitis/publications/1-
7833135/UCWP_04_2017.pdf.
92 N. Gregory Mankiw, “The Problem with the Corporate Tax,” New York Times, June 2, 2008.
93 The lower share is due to valuation at the mean rather than the median. Most studies evaluate at the mean since the
estimates reflect the mean values.
94 Céline Azémar and Glenn Hubbard. “Country Characteristics and the Incidence of Capital Income Taxes on Wages:
An Empirical Assessment, Canadian Journal of Economics, vol. 48, iss. 5 (December 2015), pp. 1762-1802.
Corporate Tax Reform: Issues for Congress
Congressional Research Service 30
proliferating, and they were cited as evidence that the burden falls on capital. The ADM study has
apparently inspired several other studies of this nature, which are discussed here. These studies
use individual firm or sector observations, which, as noted earlier, are not appropriate for the
general incidence of the corporate tax, but are appropriate for the study of rent-sharing.
Before proceeding to examine both the ADM study and other studies specifically, it is important
to make some general points about these types of studies as measures of the share of the corporate
tax borne by labor.
First, even if a reliable measure of labor’s share could be found, the share cannot be interpreted as
the share of total tax falling on wages because the analysis relates only to excess profits, which
are in turn only a part, perhaps a small part, of total profits. The share of rents also suggests an
upper boundary to the share of the tax which falls on labor that should be detected through these
studies. A widely cited study by Gentry and Hubbard estimated that 60% of corporate profits
represented earnings in excess of a risk-free return.95 Since some (perhaps most) of the excess
return is a risk premiums and is part of the opportunity cost of capital (not excess profit), the
excess profit share should be lower. Some evidence suggests that it is in the neighborhood of 10%
to 20%.96 Every empirical study discussed in this section exceeds that level, with the smallest
about 35% and the largest many multiples of 100%. Moreover, the burden relates only to those
firms that both have some excess profits and engage in bargaining. Whereas bargaining may be
common in some European countries, in the United States, where unions would be expected to do
the bargaining, less than 7% of private wage and salary workers are covered by unions.97
Second, there is an existing literature that has attempted to estimate the share of labor in excess
profits (without focusing on tax issues). Most studies have found that, even in those
circumstances where bargaining is to be expected, labor tends to capture a relatively small share,
typically less than10% and rarely more than 20% or 30%.98 This small share suggests the amount
95 Gentry, William M. and R. Glenn Hubbard, “Distributional Implications of Introducing a Broad-Based Consumption
Tax,” Tax Policy and the Economy, vol. 11 (1997), pp. 1-47.
96 Jennifer Gravelle, Corporate Tax Incidence with Excess Profits, presented at the Proceedings of the National Tax
Association Conference, 2015, at https://www.ntanet.org/wp-content/uploads/proceedings/2015/160-gravelle-
corporate-tax-incidence-effect.pdf. A much earlier estimate of the excess profits on manufacturing seems consistent
with a small magnitude, as the authors found a q value (stock market value relative to replacement value of capital) of
1.28, which implies a rent share of 22% (0.28/1.28). The authors suggest that this value is too high because the capital
stock does not include intangible capital. See Lawrence F. Katz and Lawrence H. Summers, “Industry Rents: Evidence
and Implications,” Brookings Papers: Microeconomics, 1989, pp. 209-290, at https://www.brookings.edu/wp-
content/uploads/1989/01/1989_bpeamicro_katz.pdf.
97 See Megan Dunn and James Walker, Union Membership in the United States, Bureau of Labor Statistics, September
2016, https://www.bls.gov/spotlight/2016/union-membership-in-the-united-states/pdf/union-membership-in-the-united-
states.pdf.
98 Most studies found labor’s share of to be less than 10%. See Andrew K. Hildreth and Andrew T. Oswald, “Rent-
Sharing and Wages: Evidence from Country and Establishment Panels,” Journal of Labor Economics, vol. 15 (April
1997), pp. 318-337. Based on the means of the sample, their study of the UK indicated that labor’s share of excess
profit was about 5%. Four other articles, and a book, were cited as having similar results: Kevin Denny and Steve
Machin, “The Role of Profitability and Industrial Wages in Firm-Level Wage Determination,” Fiscal Studies, May
1991, pp. 34-45; Louis Christofides and Andrew J. Oswald, “Real Wage Determination and Rent-sharing in Collective
Bargaining Agreements,” The Quarterly Journal of Economics, vol. 107 (August 1992), pp. 985-1002; David G.
Blanchflower, Andrew J. Oswald and Peter Sanfey, ‘Wages Profits and Rent-Sharing,” The Quarterly Journal of
Economics, vol. 111 (February 1996), pp. 227-251; and Alan A. Carruth and Andrew J. Oswald, Pay Determination
and Industrial Prosperity (Oxford University Press: New York, 1989). These studies generally used U.K. data,
although one used U.S. data and one used Canadian data. These studies were generally not economy wide but confined
to sectors such as manufacturing. Two studies found, in one case, larger effects and in the other, mixed effects. John A.
Abowd and Thomas Lemieux, “The Effects of Product market Competition on Collective Bargaining Agreements: The
Case of Foreign Competition in Canada,” The Quarterly Journal of Economics, vol. 198 (November 1993), pp. 983-

Corporate Tax Reform: Issues for Congress
Congressional Research Service 31
of labor income due to rent sharing is small, and that is consistent with estimates that the union
wage premium is about 15% (with a range of 0 to 30%).99 Thus the share of the total wage bill
that reflects rents of union workers is 1% (the share of union workers, 7%, times the wage
premium of 15%).
Thirdly, and perhaps the most important point to make, in the standard bargaining model (such as
that employed by ADM), a corporate tax rate that applies to excess profits would not be expected
to affect wages through the bargaining process. If taxes are treated in a standard way as a rate
applied to a firm’s revenue minus cost, the tax term does not appear (see Appendix D). The
workers and firm would split pretax profits, with each paying tax (corporate or individual) on
their share. The economic intuition behind this is that while a higher tax rate reduces the surplus
or size of the pie to be divided, it also makes the “price” of giving a dollar to labor lower because
wages are deductible. Economists might think of these as offsetting income and substitution
effects and in this model they offset exactly.100
The only tax effect left is the one that arises (potentially) from the general equilibrium effects on
the economy that occur due to the imposition of the tax on normal profits, an effect that applies to
firms without excess profits and unions as well and could only be uncovered through some
analysis appropriate to economy-wide effects. Under reasonable assumptions the proportional
effect on rents is similar to the proportional effect of wages. Because the taxes on the excess
profits themselves do not directly drive payments to labor, considering the possibility of rents
simply means that an even smaller share of the total corporate tax burden falls on labor than
suggested by the general equilibrium models. (For example, if the model estimates 20% of the
burden will fall on labor and 25% of profits is excess, then only 75% times 20%, or 15%, of the
burden falls on labor.) Given these theoretical insights, one might question why empirical studies
of rent-sharing are being pursued at all as a question of tax incidence, and why such significant
effects have been found.
The ADM study used firm level data (for about 55,000 firms) from several European countries
(primarily France, Italy, Spain and Germany) over a relatively short time frame of 1996-2003.101
It controlled for firm-specific effects. About a quarter of the observations are for only four years
and about 45% only five years so that the panel, like that of Felix, shows changes over the short
run. The same authors had an earlier version of their study with a smaller sample. Although the
authors control for firm level fixed effects, they do not control for country-specific effects. The
1014 found a larger effect of 18% when they used instrumental variables to address endogeneity. John Van Reenen,
“The Creation and Capture of Rents: Wages and Innovation in a Panel of U.K. Companies,” Quarterly Journal of
Economics, vol.111 (February 1996), pp. 195-226, also using instruments, finds a share of about 5% when using quasi-
rents (sales minus the alternative wage) but 35% when using profits. (Note: All of the shares presented in this note are
derived by CRS and are calculated using the sample means.) These studies, of course, vary in quality and are subject to
various critiques.
99 This literature is summarized in R. Alison Felix and James R. Hines, Corporate Taxes and Union Wages in the
United States, National Bureau of Economic Research, Working Paper no. 15263, August 2009.
100 Nadine Riedel, “Taxing Multi-Nationals Under Union Wage Bargaining,” International Tax and Public Finance,
vol. 18 (August 2011), pp. 399-421 makes this point when she argues that increasing the domestic tax on a
multinational with a surplus would actually, through this mechanism, cause domestic wages to rise and foreign wages
to fall since the latter do not benefit from the higher value of deductibility.
101 Wiji Arulampalam, Michael P. Devereux, and Giorgia Maffini, The Direct Incidence of Corporate Income Tax on
Wages, Oxford University Centre for Business Taxation, March, 2011, published in the European Economic Review,
vol. 56 (2012), pp. 1038-1054.

Corporate Tax Reform: Issues for Congress
Congressional Research Service 32
authors have subsequently revised their study reporting, for the preferred specification, that labor
bears 64% of the tax in the short run and 49% in the long run.102
The ADM study properly derives a model where the tax on revenues minus wages disappears and
claims not to consider the tax on normal profits. Instead the authors hypothesize an extra tax term
that is not associated with profit that will affect wages directly. It is difficult to imagine exactly
what type of tax provision would fall into this category. In any case, the share of the corporate tax
arising from this type of provision seems likely to be vanishingly small.103
Whatever the authors theorize about, it is not what they include in their regression. The variable is
total taxes paid per worker (although it is instrumented with tax rates and other variables). The
study also excludes other important variables which cannot be observed such as the competitive
wage (they use a minimum wage which is obviously far too low). The empirical implementation
examines the change in wages as a function of the change in output and taxes (all taxes, not just
lump sum taxes) which are closely linked as major elements of a contemporaneous identity and
may explain their findings. Thus, it is possible that the statistically significant relationships
obtained derive from some other linkage and do not represent a share of the tax burden.104 There
are also some important reservations about the econometric methods. Panel data with short time
periods (where persistence effects can be serious) and the need to control for firm specific effects
face some significant econometric problems. The authors use a number of different specifications,
with widely varying results, which suggest that the results are not robust.105 There are several
other aspects of the econometrics that are not transparent.106
Overall, it is not clear what relationship or phenomenon the study is measuring. Interest ideally is
in how an exogenous tax change affects wages. Yet for some of the countries that constitute a
large share of the data, there were no changes in tax rates. In others, tax rate changes were
virtually all declines, with most of those declines occurring during the growth period of the late
1990s, when productivity and output was rising. It is possible that the results are capturing that
phenomenon.
Another study using European data directed at capturing the bargaining share was recently
released by aus dem Moore, Kasten, and Schmidt.107 This study compared the changes in wages
102 Prior versions of this study reported larger results (in a 2008 version, that labor bears 96% of an increase in tax in
the short run, and 92% in the long run, and in a 2007 version that labor bore 54% in the short run and 176% in the long
run, at least for the specification that the authors reported.), which appear to reflect initially an increase in the sample
and subsequently measuring incidence based on the mean rather than the median. These results seemed quite
implausible.
103 A number of proposed types of provisions, such as interest deductions, losses, and pension contribution would
nevertheless be costs that are related to profits.
104 This point is made by Jennifer C, Gravelle, Corporate Tax Incidence: A Review of Empirical Estimates and
Analysis, CBO, Working Paper no. 2011-01, June 2011, http://www.cbo.gov/ftpdocs/122xx/doc12239/06-14-2011-
CorporateTaxIncidence.pdf. Note also that the regression is also run in logs that does not allow for negative tax liability
even though the model is in levels.
105 The tests used by the authors to determine their preferred specification are not without problems. See David
Roodman, “How to Do xtabond2: An Introduction to “Difference” and “System” GMM in Stata,” Center for Global
Development, Working Paper no. 103, December 2006.
106 For example, no reason is presented for using a dynamic specification or the specific number of lagged variables,
and the number of instruments was not reported.
107 Nils aus dem Moore, Tanja Kasten, and Christoph M. Schmidt, “Do Wages Rise When Corporate Tax Rates Fall?
Evidence from the German Business Tax Reform 2000,” January 11, 2011. An updated version of this working paper
for 2014 found an even larger effect in the long run, see Ruhr Economic papers, no. 532, at
https://www.econstor.eu/bitstream/10419/107692/1/819623113.pdf.
Corporate Tax Reform: Issues for Congress
Congressional Research Service 33
of German manufacturing compared with French manufacturing, spanning a time when the
German taxes were reformed (including rate cuts) and the French tax was not. This analysis finds
a very large effect: an increase in German wages of 6.4% due to the rate cuts. This finding seems
large. According to the reported means of the data, the ratio of wages to taxes is 11.9; that is
wages are about 12 times the amount of taxes. If wages rose by 6.4%, that amount is 76% of the
total corporate tax. It appears that the reduction in German taxes was around 20%, which implies,
in dollar terms, that wages rose $4 for each dollar reduction in tax, when it should have been a
share of only a small part of the tax. It seems likely that the empirical estimates are capturing
some other type of influence, and the authors indicate their study is preliminary and uncertain.
The authors never discuss the theoretical finding that this type of tax rate change is the kind of
change that would not be expected to show up as a part of rent sharing.
Another study, by Dwenger, Rattenhuber, and Steiner, also uses firm data to examine the German
tax cut.108 As with the aus dem Moore et al. study, they do not address theoretical concerns and
simply assume that labor will bear some of the burden of the tax via bargaining. Their estimates
of this initial wage effect indicate labor bears 156% of the tax. They also assume that the higher
or lower wages will lead to employment shifts (so that when wages rise, employment falls and
thus the wage bill does not fall as much), which results in a total wage bill effect of 47% of the
tax. This line of reasoning regarding employment is also inconsistent with theory, as the wage
does not change from the direct bargaining effect. Rather it arises from the increase in the cost of
capital via increased taxes, which, while decreasing the demand for capital (assuming there is a
nontaxed noncorporate or foreign sector), has effects on employment in the corporate sector that
are uncertain. In a general equilibrium model, employment is assumed to be fixed in the
economy. In any case, these general equilibrium effects cannot be uncovered with firm specific
data within a country because the effect should not relate to the specific taxes of the firm. As with
the aus dem Moore et al. study, it is not clear what the authors are measuring when they regress
wage rates on tax rates, although it could reflect differential wage growth across industries.
A study of subnational taxes in Germany by Bauer, Kasten, and Siemers found a significant effect
of the corporate tax on wages.109 In some ways, this study was similar to the cross-state studies
done in the United States in that the explanatory variable was the tax rate. But it also addressed
rent sharing by examining the differences between low-skilled workers with less bargaining
power. As is the case with some other studies, the results are implausible. They found that a 1%
increase in tax rate decreased wages by between 0.28% and 0.46%. Although the incidence was
not as large as the Hassett and Mathur results, using the same ratio of wages to taxes as the aus
dem Moore, Kasten, and Schmidt study indicated a dollar of corporate tax reduced wages
between $3.36 and $5.52 or by 336% to 550%.
Fuest, Peichl, and Sioegloch report an incidence of 47% in a wage bargaining model, using data
from German municipalities and a series of tax changes in the local business tax. This 47%
includes an externally estimated excess burden (efficiency cost); without it the incidence would
be 36%.110
108 Nadja Dwenger, Pia Rattenhuber, and Victor Steiner, “Sharing the Burden: Empirical Evidence on Corporate Tax
Incidence,” Max Planck Institute for Tax Law and Finance, 2011-14, October, 2011, http://www.tax.mpg.de/files/pdf1/
Dwenger-Rattenhuber-Steiner_Incidence_MPI.pdf.
109 Thomas K. Bauer, Tanja Kasten, and Lars-H. R. Siemers, Business Taxation and Wages: Evidence from Individual
Panel Data, Institute for the Study of Labor, Discussion Paper 6717, July 2012, at http://ftp.iza.org/dp6717.pdf.
110 Clemens Fuest, Andreas Peichl, and Sebastian Siegloch, “Do Higher Corporate Taxes Reduce Wages?” Micro
Evidence from Germany, December 2016, at http://gabriel-zucman.eu/files/teaching/FuestEtal16.pdf, forthcoming,
American Economic Review.
Corporate Tax Reform: Issues for Congress
Congressional Research Service 34
A study by aus dem Moore, comparing outcomes in France and the UK in a wage bargaining
model follows the approach of ADM, and finds the share falling on wages 39% in France and
40% in the UK in the short run. In the long run, the results indicate a share of 66% in France and
73% in the UK.111
Azémar and Hubbard estimated the incidence in a wage bargaining model using data on 13
OECD countries.112 Using the values for 2004, their estimates indicate 60% of the burden falls on
labor. Further estimates that include measures of union density indicate that this effect is highly
driven by union density and would probably be negligible for the United States.113
Two studies have been based on data in the United States. As noted earlier, Felix and Hines
actually found wages to rise with increases in state tax rates, but the union differential fell. They
indicate that their findings show that workers in a unionized firm bear 54% of the tax burden.
Several important points should be understood about their analysis. First, as they make clear, they
are not trying to estimate the effect of direct taxes on rents, as this effect disappears from their
model. They are rather examining the indirect effect that would arise due to the increase in the
cost of capital and the subsequent general equilibrium effects that would arise. Although they
have correctly measured a statewide tax rate as their tax variable (rather than a firm specific rate),
the model they use to drive their theoretical expectations has a mistake (as shown in Appendix
D) and the expectation from a properly derived model is likely a close to zero effect, and if not
zero probably positive. Their estimate appears outside the range of reasonable theoretical
prediction and probably in the wrong direction. In addition in calculating incidence they have
applied the elasticity to the entire wage bill, not the share that is rent. If the rent share is about
15%, 8% of the tax, not 54%, falls on rents. As shown in the appendix, for a nationwide incidence
taking into account union membership and theoretical expectations, the share of the tax that falls
on rents is no more than 3% (keeping wages constant) and rents would more likely benefit.
The most recent study of the United States is one by Liu and Altshuler. Their theoretical approach
is difficult to interpret. As discussed in this review, there are general equilibrium effects that can
shift the tax to wages, but within a closed economy with a fixed capital stock the central tendency
is for the burden to be spread to all capital, but not to wages.114 Only in an open economy, where
capital can flow across countries (and which would require country observations) could wage
shares be estimated through this mechanism and the wage would be an economy-wide (country-
wide) wage.
111 Nils aus dem Moore, Shifting the Burden of Corporate Taxes: Heterogeneity in Direct Wage Incidence, Ruhr
Economic Papers, no. 531, 2014, at https://www.econstor.eu/bitstream/10419/107694/1/819591319.pdf.
112 Céline Azémar and R. Glenn Hubbard, “Country Characteristics and the Incidence of Capital Income Taxation on
Wages: An Empirical Assessment,” Canadian Journal of Economics, vol. 48, iss. 5 (December 2015), pp. 1601-2004.
The authors investigate an estimate that would capture both wage bargaining and capital movement but found the
estimate unreliable because of endogeneity issues, although the upper limit is large, a $2.65 decline in wages for each
dollar of corporate revenue.
113 This discussion indicates that the coefficient would fall from 0.1 to 0.02 for countries with average labor union
density such as France or Germany, implying an incidence of around 10%, and presumably would be less for the
United States which had half the average union density over the period of study and has been declining since.
114 Li Liu and Rosanne Altshuler, Measuring the Burden of a Corporate Tax Under Imperfect Competition, Oxford
Working Paper no. 11/05, published in the National Tax Journal, vol. 66, no. 1 (March 2013), pp 215-238. This
outcome occurs with unitary production and utility functions; when these functions are changed labor can bear a small
amount of the burden, or labor can benefit from the tax with capital bearing slightly more than 100% of the burden.
Labor can bear some nonnegligible share of the tax when factor substitution is much smaller in the corporate as
compared to the noncorporate sector, but the reverse is likely to be the case since a large part of the noncorporate sector
is housing services. See Jane G. Gravelle and Laurence J. Kotlikoff, “The Incidence and Efficiency Costs of Corporate
Taxation When Corporate and Noncorporate Firms Produce the Same Goods, Journal of Political Economy, vol. 97,
no. 4 (August 1979), pp. 749-780. This article has tables of incidence measures with different elasticities.

Corporate Tax Reform: Issues for Congress
Congressional Research Service 35
Generally, using a single country’s data is aimed at measuring a burden that would fall on labor
through the rent-sharing mechanism, except that the standard bargaining framework shows that
while rents might be shared by labor, the tax on rents should not be. Liu and Altshuler never
discuss a bargaining equilibrium and therefore never confront the offsetting price and income
effects that tend to eliminate rent-sharing arising from taxes. In fact, at one point in their model,
the wage rate becomes the numeraire (is fixed) that implies there are no industry wage
differentials.
Their empirical approach is to examine how relative wage rates in each industry changed over
time based on the mix of assets and the change in marginal tax rates over that period. They
conclude that labor bears 60% to 80% of the tax. Why do they obtain such large effects, when
theory says they should be zero or negligible? The most likely reason is because the marginal tax
rate fell primarily for equipment, and those industries whose investments were more concentrated
in equipment (manufacturing, transportation, construction, but especially manufacturing)
probably saw slower wage growth over the period due to the decline in unions and international
competition.
What Should Be Concluded About Incidence?
Although there has a resurgence of interest in direct empirical estimates of incidence, this review
suggests that these reduced form empirical studies are seriously flawed, produce unreasonable
estimates, are not robust (changes in specification change the results), or are inconsistent with
theory, as is the case in the rent-sharing studies. Certainly, a serious problem with even the best of
these studies is that the corporate tax tends to be dwarfed by the size of labor income so that it is
difficult to detect this relationship or control for other factors that affect wages. The advantage of
studying incidence through a general equilibrium model is that such a model can control for the
factors affecting the incidence (including the limits to the effects), and, even though they are
models, they are informed by empirical evidence.
Based on these models, it appears that most of the burden of the corporate tax falls on capital. The
effect on capital flows without considering debt or rents suggest that labor bears 20% to 40% of
the burden. If rents were 20% of total profits (and taxes) the labor share would fall to 16% to
32%. Consideration of debt could easily cause more that 100% of the burden to fall on capital.
Thus the tax is a progressive one that falls on capital incomes and thus largely on higher incomes.
Economic Efficiency Issues The traditional criticism of the corporate tax is that the tax causes distortions, and that these
distortions are exacerbated by corporate tax preferences that prevent, for a given level of tax
revenue, a lower tax rate. The issues discussed in this section include allocation of capital within
the domestic economy, savings effects, and international capital flows.
Allocation of Capital Within the Domestic Economy
Traditionally, the efficiency concern about the corporate tax is related to the misallocation of
resources between corporate and noncorporate production (including owner-occupied housing).
Over time, efficiency issues have also encompassed differential taxation of the returns to assets of
different physical types, and financial distortions, which affect the debt-equity ratio, payout
choice, and decision to realize capital gains.
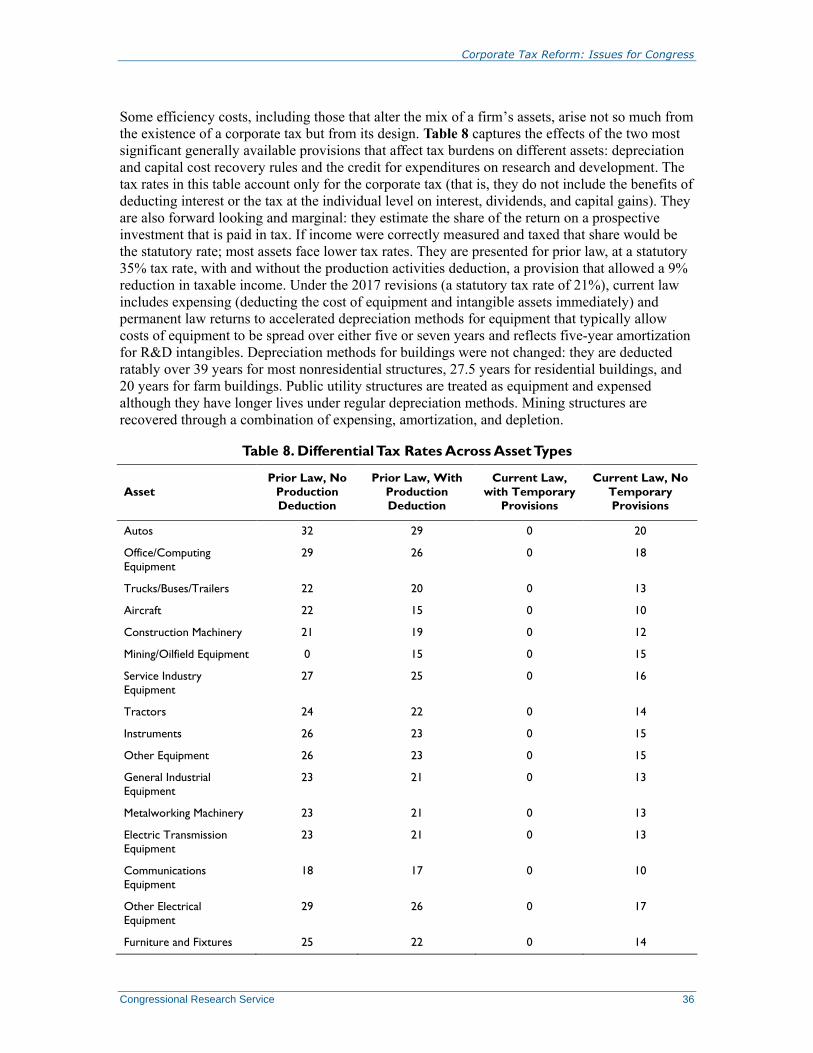
Corporate Tax Reform: Issues for Congress
Congressional Research Service 36
Some efficiency costs, including those that alter the mix of a firm’s assets, arise not so much from
the existence of a corporate tax but from its design. Table 8 captures the effects of the two most
significant generally available provisions that affect tax burdens on different assets: depreciation
and capital cost recovery rules and the credit for expenditures on research and development. The
tax rates in this table account only for the corporate tax (that is, they do not include the benefits of
deducting interest or the tax at the individual level on interest, dividends, and capital gains). They
are also forward looking and marginal: they estimate the share of the return on a prospective
investment that is paid in tax. If income were correctly measured and taxed that share would be
the statutory rate; most assets face lower tax rates. They are presented for prior law, at a statutory
35% tax rate, with and without the production activities deduction, a provision that allowed a 9%
reduction in taxable income. Under the 2017 revisions (a statutory tax rate of 21%), current law
includes expensing (deducting the cost of equipment and intangible assets immediately) and
permanent law returns to accelerated depreciation methods for equipment that typically allow
costs of equipment to be spread over either five or seven years and reflects five-year amortization
for R&D intangibles. Depreciation methods for buildings were not changed: they are deducted
ratably over 39 years for most nonresidential structures, 27.5 years for residential buildings, and
20 years for farm buildings. Public utility structures are treated as equipment and expensed
although they have longer lives under regular depreciation methods. Mining structures are
recovered through a combination of expensing, amortization, and depletion.
Table 8. Differential Tax Rates Across Asset Types
Asset
Prior Law, No
Production
Deduction
Prior Law, With
Production
Deduction
Current Law,
with Temporary
Provisions
Current Law, No
Temporary
Provisions
Autos 32 29 0 20
Office/Computing
Equipment
29 26 0 18
Trucks/Buses/Trailers 22 20 0 13
Aircraft 22 15 0 10
Construction Machinery 21 19 0 12
Mining/Oilfield Equipment 0 15 0 15
Service Industry
Equipment
27 25 0 16
Tractors 24 22 0 14
Instruments 26 23 0 15
Other Equipment 26 23 0 15
General Industrial
Equipment
23 21 0 13
Metalworking Machinery 23 21 0 13
Electric Transmission
Equipment
23 21 0 13
Communications
Equipment
18 17 0 10
Other Electrical
Equipment
29 26 0 17
Furniture and Fixtures 25 22 0 14
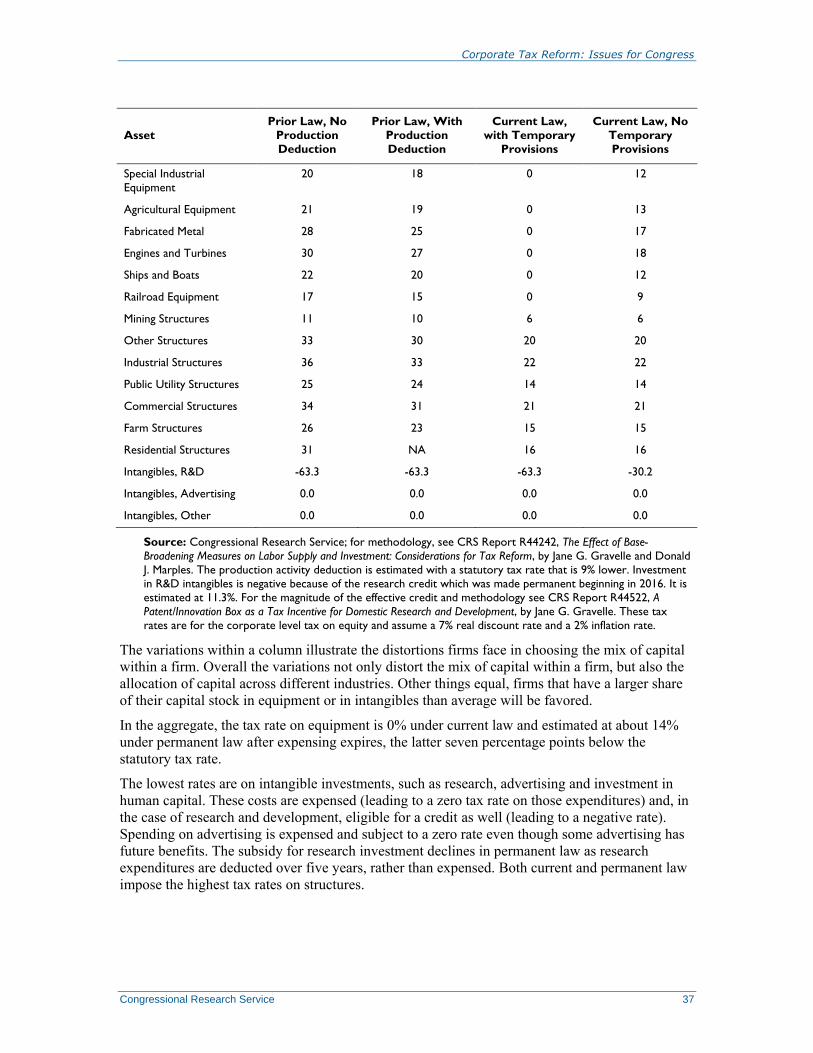
Corporate Tax Reform: Issues for Congress
Congressional Research Service 37
Asset
Prior Law, No
Production
Deduction
Prior Law, With
Production
Deduction
Current Law,
with Temporary
Provisions
Current Law, No
Temporary
Provisions
Special Industrial
Equipment
20 18 0 12
Agricultural Equipment 21 19 0 13
Fabricated Metal 28 25 0 17
Engines and Turbines 30 27 0 18
Ships and Boats 22 20 0 12
Railroad Equipment 17 15 0 9
Mining Structures 11 10 6 6
Other Structures 33 30 20 20
Industrial Structures 36 33 22 22
Public Utility Structures 25 24 14 14
Commercial Structures 34 31 21 21
Farm Structures 26 23 15 15
Residential Structures 31 NA 16 16
Intangibles, R&D -63.3 -63.3 -63.3 -30.2
Intangibles, Advertising 0.0 0.0 0.0 0.0
Intangibles, Other 0.0 0.0 0.0 0.0
Source: Congressional Research Service; for methodology, see CRS Report R44242, The Effect of Base-
Broadening Measures on Labor Supply and Investment: Considerations for Tax Reform, by Jane G. Gravelle and Donald
J. Marples. The production activity deduction is estimated with a statutory tax rate that is 9% lower. Investment
in R&D intangibles is negative because of the research credit which was made permanent beginning in 2016. It is
estimated at 11.3%. For the magnitude of the effective credit and methodology see CRS Report R44522, A
Patent/Innovation Box as a Tax Incentive for Domestic Research and Development, by Jane G. Gravelle. These tax
rates are for the corporate level tax on equity and assume a 7% real discount rate and a 2% inflation rate.
The variations within a column illustrate the distortions firms face in choosing the mix of capital
within a firm. Overall the variations not only distort the mix of capital within a firm, but also the
allocation of capital across different industries. Other things equal, firms that have a larger share
of their capital stock in equipment or in intangibles than average will be favored.
In the aggregate, the tax rate on equipment is 0% under current law and estimated at about 14%
under permanent law after expensing expires, the latter seven percentage points below the
statutory tax rate.
The lowest rates are on intangible investments, such as research, advertising and investment in
human capital. These costs are expensed (leading to a zero tax rate on those expenditures) and, in
the case of research and development, eligible for a credit as well (leading to a negative rate).
Spending on advertising is expensed and subject to a zero rate even though some advertising has
future benefits. The subsidy for research investment declines in permanent law as research
expenditures are deducted over five years, rather than expensed. Both current and permanent law
impose the highest tax rates on structures.

Corporate Tax Reform: Issues for Congress
Congressional Research Service 38
Table 9 reports the types of distortions that are an artifact of the corporate tax as a separate tax.
These estimates, unlike those in Table 8, take into account all levels of taxes.115 They indicate
that the overall tax burden on both corporate and noncorporate investment is negative under
current law and with the corporate rate lower but both small, indicating little difference. Tax rates
are positive under permanent law and higher for the noncorporate sector due to the higher rate
and loss of the pass-through deduction as well as the loss of expensing for equipment. Within the
corporate sector, in addition to asset differences, there is a large differential with respect to debt
versus equity finance; a large differential also exists for the noncorporate sector. The aggregate
tax burden on debt is negative, whereas equity is taxed at a positive rate. Rates are higher for the
noncorporate sector, due both to the higher statutory rate and the tendency of the noncorporate
sector to hold more highly taxed assets. Shareholder taxes do not add much to the corporate tax
burden due largely to the significant share of tax exempt investors, and, to a lesser extent, the
lower tax rates applied to capital gains and dividends and the failure to realize about half of
capital gains. If economic income were measured correctly, interest would be subject to the
individual income tax rate. Debt is subsidized at the firm level, however, because nominal interest
is deducted (including the inflation premium) while profits before this deduction are effectively
taxed at a rate below the statutory rate on real income. The offsetting effect of taxing interest to
creditors is small because most interest is not subject to tax. The overall corporate tax rate at the
firm level, which would be relevant to the international allocation of capital is -5.4% under
current law and 3.0% under permanent law.
Table 9. Effective Tax Rates by Sector and Type of Finance
Sector Prior Law
Current Law, with
Temporary
Provisions
Current Law, no Temporary
Provisions
All Business 12.5 -2.0 13.1
Corporate Business 9.6 -2.8 5.2
—Debt -44.0 -42.2 -21.1
—Equity 22.4 6.2 13.8
Noncorporate business 16.4 0.9 16.7
—Debt -28.1 -42.5 -28.3
—Equity 25.3 10.6 25.3
Owner Occupied Housing -9.0 3.9 -9.0
115 One of the complications of estimating these tax rates is whether the estimates should consider the significant (over
50%) fraction of individual passive income that is held in tax exempt form through pensions, IRAs, life insurance
annuities and nonprofits. In some ways, these sources can be viewed largely as not affecting marginal investment (for
example, overall savings) because they are capped or not controlled directly by the investors and in other ways they
affect choices (such as debt or equity of pension funds). The estimates in Table 9 use the share of stock held by U.S.
individuals in taxable form, 25%. Setting the share at 50% would raise the tax rate on corporate equity from 6.2% to
9% under current law and from 13.8% to 15.3% under permanent law, and the overall effect on the corporate sector,
total business, and economy wide taxes would be even smaller. The Congressional Budget Office (CBO) uses a higher
share of taxable stockholders and has some other assumptions that differ from the ones underlying these estimates.
CBO, Taxing Capital Income: Effective Marginal Tax Rates Under 2014 Law and Selected Policy Options, December
2014, at https://www.cbo.gov/sites/default/files/113th-congress-2013-2014/reports/49817-
Taxing_Capital_Income_0.pdf. These measures are discussed in detail in CRS Report R44638, Corporate Tax
Integration and Tax Reform, by Jane G. Gravelle.
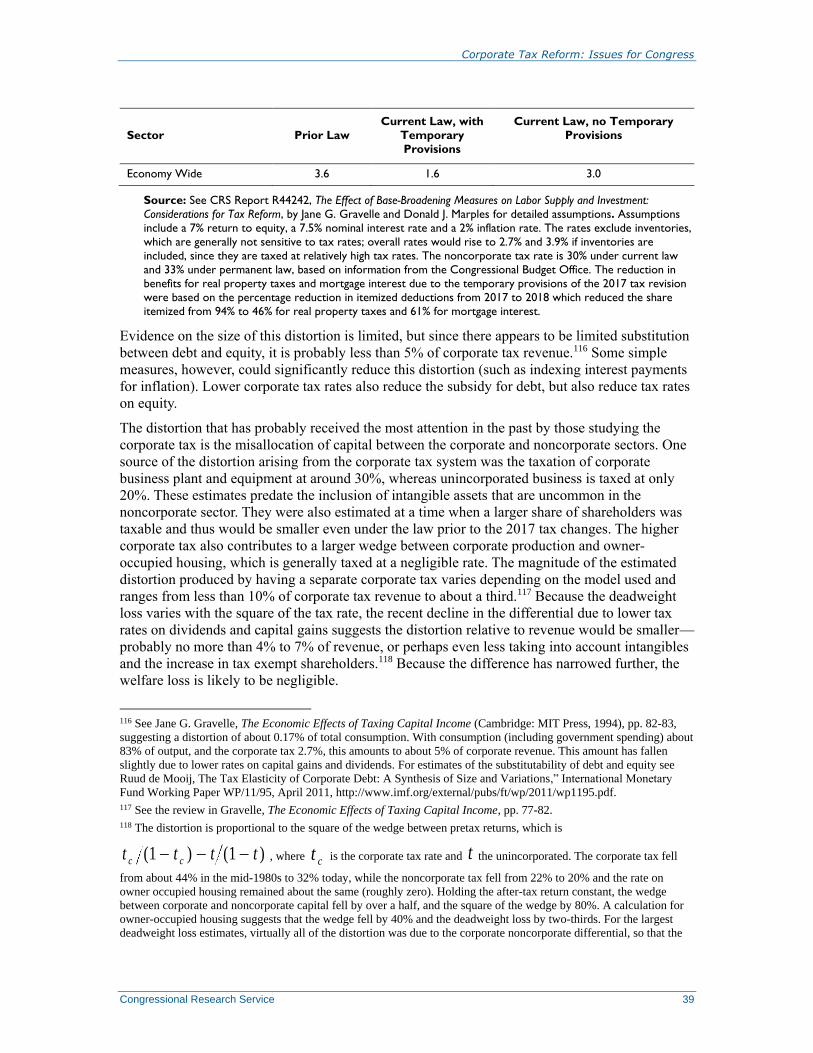
Corporate Tax Reform: Issues for Congress
Congressional Research Service 39
Sector Prior Law
Current Law, with
Temporary
Provisions
Current Law, no Temporary
Provisions
Economy Wide 3.6 1.6 3.0
Source: See CRS Report R44242, The Effect of Base-Broadening Measures on Labor Supply and Investment:
Considerations for Tax Reform, by Jane G. Gravelle and Donald J. Marples for detailed assumptions. Assumptions
include a 7% return to equity, a 7.5% nominal interest rate and a 2% inflation rate. The rates exclude inventories,
which are generally not sensitive to tax rates; overall rates would rise to 2.7% and 3.9% if inventories are
included, since they are taxed at relatively high tax rates. The noncorporate tax rate is 30% under current law
and 33% under permanent law, based on information from the Congressional Budget Office. The reduction in
benefits for real property taxes and mortgage interest due to the temporary provisions of the 2017 tax revision
were based on the percentage reduction in itemized deductions from 2017 to 2018 which reduced the share
itemized from 94% to 46% for real property taxes and 61% for mortgage interest.
Evidence on the size of this distortion is limited, but since there appears to be limited substitution
between debt and equity, it is probably less than 5% of corporate tax revenue.116 Some simple
measures, however, could significantly reduce this distortion (such as indexing interest payments
for inflation). Lower corporate tax rates also reduce the subsidy for debt, but also reduce tax rates
on equity.
The distortion that has probably received the most attention in the past by those studying the
corporate tax is the misallocation of capital between the corporate and noncorporate sectors. One
source of the distortion arising from the corporate tax system was the taxation of corporate
business plant and equipment at around 30%, whereas unincorporated business is taxed at only
20%. These estimates predate the inclusion of intangible assets that are uncommon in the
noncorporate sector. They were also estimated at a time when a larger share of shareholders was
taxable and thus would be smaller even under the law prior to the 2017 tax changes. The higher
corporate tax also contributes to a larger wedge between corporate production and owner-
occupied housing, which is generally taxed at a negligible rate. The magnitude of the estimated
distortion produced by having a separate corporate tax varies depending on the model used and
ranges from less than 10% of corporate tax revenue to about a third.117 Because the deadweight
loss varies with the square of the tax rate, the recent decline in the differential due to lower tax
rates on dividends and capital gains suggests the distortion relative to revenue would be smaller—
probably no more than 4% to 7% of revenue, or perhaps even less taking into account intangibles
and the increase in tax exempt shareholders.118 Because the difference has narrowed further, the
welfare loss is likely to be negligible.
116 See Jane G. Gravelle, The Economic Effects of Taxing Capital Income (Cambridge: MIT Press, 1994), pp. 82-83,
suggesting a distortion of about 0.17% of total consumption. With consumption (including government spending) about
83% of output, and the corporate tax 2.7%, this amounts to about 5% of corporate revenue. This amount has fallen
slightly due to lower rates on capital gains and dividends. For estimates of the substitutability of debt and equity see
Ruud de Mooij, The Tax Elasticity of Corporate Debt: A Synthesis of Size and Variations,” International Monetary
Fund Working Paper WP/11/95, April 2011, http://www.imf.org/external/pubs/ft/wp/2011/wp1195.pdf.
117 See the review in Gravelle, The Economic Effects of Taxing Capital Income, pp. 77-82.
118 The distortion is proportional to the square of the wedge between pretax returns, which is
t t t tc c( ) ( )1 1 , where t c is the corporate tax rate and t the unincorporated. The corporate tax fell
from about 44% in the mid-1980s to 32% today, while the noncorporate tax fell from 22% to 20% and the rate on
owner occupied housing remained about the same (roughly zero). Holding the after-tax return constant, the wedge
between corporate and noncorporate capital fell by over a half, and the square of the wedge by 80%. A calculation for
owner-occupied housing suggests that the wedge fell by 40% and the deadweight loss by two-thirds. For the largest
deadweight loss estimates, virtually all of the distortion was due to the corporate noncorporate differential, so that the

Corporate Tax Reform: Issues for Congress
Congressional Research Service 40
A distortion not captured in Table 9 is the one that affects corporate payouts. Given that
appreciation in stock values is not taxed until realized, there is a benefit to retaining earnings.
There is a dispute about what determines payout ratios and what the consequences of the tax are,
but, in general, the welfare cost is small. Some distortion also exists due to the lock-in effect for
capital gains realizations.119
Considering all of these distortions together, they are probably no more than 5% of corporate tax
revenues, a magnitude that could be considered as a significant component of the burden of the
tax. However, given the revenue needs of the government, there would also be distortions,
perhaps smaller, associated with alternative taxes. Ways to reduce these distortions may, however,
be worth considering.
Savings Effects
Much of the 2007 Treasury study’s discussion emphasized effects on savings although this is not
normally the focus of efficiency concerns about the corporate income tax. This distortion is not
unique to corporate income taxes, but occurs with all capital income taxes. There are many
difficulties with analyzing this issue. The first is that, as noted above in the discussion about the
potential effect of savings on the wage rate, the economic distortion depends on the behavioral
response of savings to tax changes, and what tax replaces them. Some economists have a strong
view that taxes on the rate of return are always distorting, but these views are based on dynamic
infinite-horizon models that may not be very realistic. With life-cycle models, the distortions
depend on what revenue substitute is provided; substituting taxes on wages for taxes on capital,
the most likely substitute in the U.S. tax system, could potentially increase distortions, depending
on the responses in the models.120 In models of bounded rationality, where savings are based on
rules of thumb such as fixed shares of income or fixed targets, there is no response, or only an
income effect, which would not produce a distorting effect.
International Capital Flows
Tax rules can affect the efficiency of allocation of capital around the world, and, if the U.S. rate is
different from other countries, it can cause misallocations of capital121. According to a recent
study, prior to the 2017 revision, the U.S. corporate tax rate was 39% compared with an average
of 30% for the largest 15 countries excluding the United States and an average of 28.4% for
OECD countries excluding the United States (both weighted by output).122 For firms eligible for
the U.S. production activities deductions, characteristic of most multinationals, the rate was
36.3%. The effective tax rate (taxes divided by profits) was about the same and the marginal
effective tax rates much lower and about five percentage points higher than the OECD average.
current deadweight loss would be only 20% as large, while for the others, both assets played an important role.
119 Estimates of 0.04% to 0.11% of consumption translate into 1% to 4% of corporate revenues, see Gravelle, The
Economic Effects of Taxing Capital Income, p. 89. With the reduction in tax rates of almost 50%, and the welfare cost
proportional to the square of the tax wedge, the welfare cost would be about 30% of its former value or less than 1%.
There is also a welfare cost from the realizations response of about 1%, but recent evidence has shown this response to
be small, about the same size as the pay-out distortion.
120 See Jane G. Gravelle, “Income Consumption and Wage Taxation in a Life Cycle Model: Separating Efficiency from
Redistribution,” American Economic Review, vol. 81, no. 4 (September 1991), pp. 985-995.
121 See CRS Report R45186, Issues in International Corporate Taxation: The 2017 Revision (P.L. 115-97), by Jane G.
Gravelle and Donald J. Marples for a more detailed discussion of international tax issues.
122 CRS Report R41743, International Corporate Tax Rate Comparisons and Policy Implications, by Jane G. Gravelle.
Corporate Tax Reform: Issues for Congress
Congressional Research Service 41
The 2017 revision lowered corporate and effective marginal tax rates so that the current statutory
tax rate of 27% (federal plus state and local) is similar to the OECD average of 26%; the world
average is 26% as well.123 An estimate comparing the marginal effective tax rate for equipment
and structures indicates that the U.S. tax rate for equipment is among the lowest of the countries
compared under current law and around midpoint for permanent law, whereas the tax rate for
structures higher than most.124 A composite investment is lower than most under current law and
higher than most under permanent law125
These data do not indicate the United States is a notably high-tax country with respect to
investment, even under permanent law. The main source of international distortion, therefore, is
probably the increased investment that occurs in low-tax and tax-haven countries because the
United States and other developed countries do not tax that income at full rates. This inefficiency
is not due to the corporate effective tax rate, but rather is due to the provision of a tax benefit for
investment abroad.126 Under current law, the minimum tax on foreign source income (GILTI)
allows a deduction for 10% of tangible assets abroad; reducing or disallowing this exemption,
raising GILTI tax rates to the United States, and allowing a foreign tax credit on a per country
basis would eliminate the tax favoritism toward investing abroad in lower-tax countries.
Even when tax rates diverge, the efficiency costs appear to be relatively insignificant because the
evidence suggests, as noted in previous sections, limited mobility of capital as a result of varying
tax rates and natural constraints of the economy.127
Potential Revisions in the Corporate Tax A variety of potential revisions could be made to the corporate tax. Most of the current proposals
would focus on revising international provisions and raising the rate, but provisions to address
other preferences could be considered. The revisions discussed here include (1) broadening the
corporate tax base and using the revenues to reduce the rate or to provide investment incentives,
(2) correcting interest deductions and income for inflation, and (3) increasing the individual level
tax to permit a lower tax at the firm level or taxing large unincorporated firms as corporations.
(To provide some reference, latest projections show corporate tax revenues at $300 billion in
FY2016 and projected at $429 billion in FY2027. In 2007, prior to the recession, they were $370
billion, but they were lower during and after the recession due to cyclical factors and legislative
changes.)128
123 Elke Asen, Corporate Tax Rates around the World, 2020, Tax Foundation, Fiscal Fact No. 735, December 2020,
https://files.taxfoundation.org/20201208152358/2020-Corporate-Tax-Rates-around-the-World.pdf.
124 Matthew Higgins, Tax Reform and U.S. Effective Profit Taxes: From Low to Lower, Liberty Street Economics,
October 22, 2018, https://libertystreeteconomics.newyorkfed.org/2018/10/tax-reform-and-us-effective-profit-taxes-
from-low-to-lower.html.
125 See Kyle Pomerleau, who provides a composite equipment and structures measure weighted by capital stock. New
York Fed Blog Post Understates Effective Corporate Tax Rates, Tax Foundation, October 26, 29018,
https://taxfoundation.org/new-york-fed-blog-post-understates-effective-corporate-tax-rates/.
126 The issues of efficiency in international taxation are discussed in much more detail in CRS Report RL34115,
Reform of U.S. International Taxation: Alternatives, by Jane G. Gravelle.
127 Jane G. Gravelle and Kent A. Smetters, “Does the Open Economy Assumption Really Mean That Labor Bears the
Burden of a Capital Income Tax?” Advances in Economic Policy and Analysis, vol. 6, no. 1, 2006 find efficiency gains
of 3% to 5% of revenue assuming the rest of the world had no tax and the United States had a 35% effective tax rate.
Because tax rates are similar to those in the rest of the world, the efficiency effect is negligible and approaching zero.
128 CBO, projections and historical data at https://www.cbo.gov/about/products/budget-economic-data#2. Note that in
considering estimates, it is projections at the time the estimates were made that determine the magnitude.
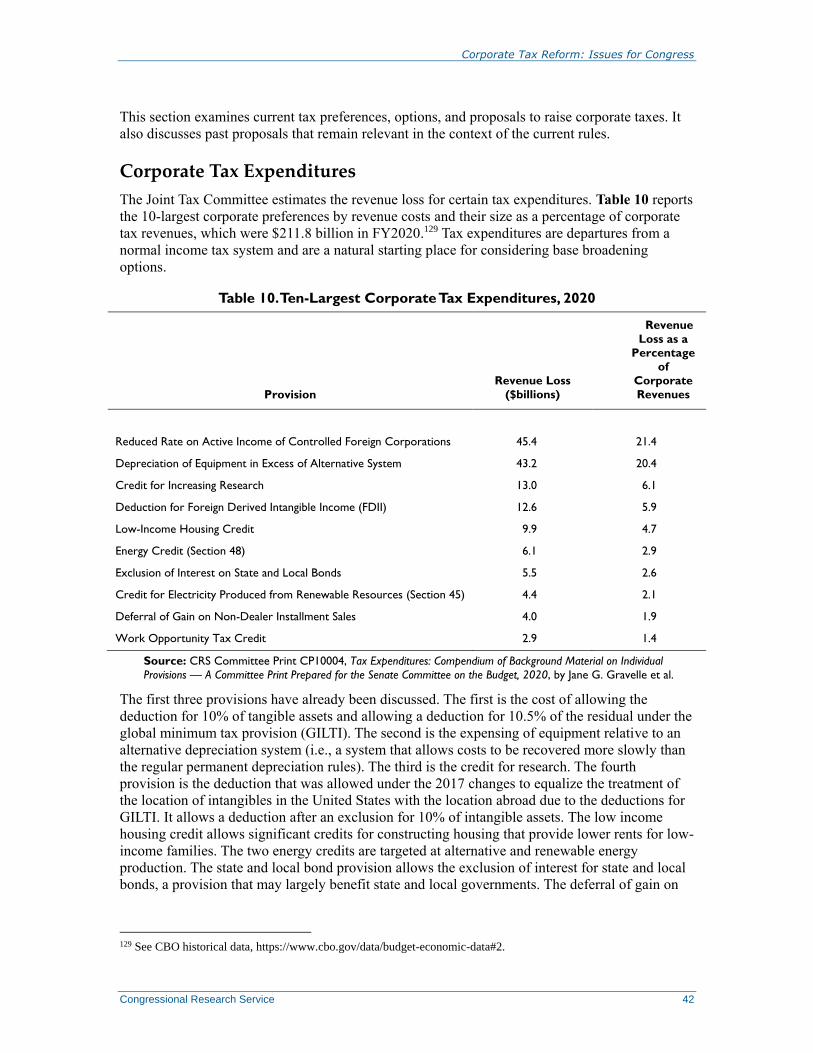
Corporate Tax Reform: Issues for Congress
Congressional Research Service 42
This section examines current tax preferences, options, and proposals to raise corporate taxes. It
also discusses past proposals that remain relevant in the context of the current rules.
Corporate Tax Expenditures
The Joint Tax Committee estimates the revenue loss for certain tax expenditures. Table 10 reports
the 10-largest corporate preferences by revenue costs and their size as a percentage of corporate
tax revenues, which were $211.8 billion in FY2020.129 Tax expenditures are departures from a
normal income tax system and are a natural starting place for considering base broadening
options.
Table 10. Ten-Largest Corporate Tax Expenditures, 2020
Provision
Revenue Loss
($billions)
Revenue
Loss as a
Percentage
of
Corporate
Revenues
Reduced Rate on Active Income of Controlled Foreign Corporations 45.4 21.4
Depreciation of Equipment in Excess of Alternative System 43.2 20.4
Credit for Increasing Research 13.0 6.1
Deduction for Foreign Derived Intangible Income (FDII) 12.6 5.9
Low-Income Housing Credit 9.9 4.7
Energy Credit (Section 48) 6.1 2.9
Exclusion of Interest on State and Local Bonds 5.5 2.6
Credit for Electricity Produced from Renewable Resources (Section 45) 4.4 2.1
Deferral of Gain on Non-Dealer Installment Sales 4.0 1.9
Work Opportunity Tax Credit 2.9 1.4
Source: CRS Committee Print CP10004, Tax Expenditures: Compendium of Background Material on Individual
Provisions — A Committee Print Prepared for the Senate Committee on the Budget, 2020, by Jane G. Gravelle et al.
The first three provisions have already been discussed. The first is the cost of allowing the
deduction for 10% of tangible assets and allowing a deduction for 10.5% of the residual under the
global minimum tax provision (GILTI). The second is the expensing of equipment relative to an
alternative depreciation system (i.e., a system that allows costs to be recovered more slowly than
the regular permanent depreciation rules). The third is the credit for research. The fourth
provision is the deduction that was allowed under the 2017 changes to equalize the treatment of
the location of intangibles in the United States with the location abroad due to the deductions for
GILTI. It allows a deduction after an exclusion for 10% of intangible assets. The low income
housing credit allows significant credits for constructing housing that provide lower rents for low-
income families. The two energy credits are targeted at alternative and renewable energy
production. The state and local bond provision allows the exclusion of interest for state and local
bonds, a provision that may largely benefit state and local governments. The deferral of gain on
129 See CBO historical data, https://www.cbo.gov/data/budget-economic-data#2.

Corporate Tax Reform: Issues for Congress
Congressional Research Service 43
nondealer sales allows taxpayers to defer capital gains taxes. The work opportunity credit is
aimed at hiring individuals who may have difficulties in finding employment.
CBO Budget Options
The Congressional Budget Office produces a set of budget options every two years. Table 11
provides the most recent options over a 10-year period, and as a percentage of revenues during
that period, $3,262 billion.130 The options include an increase in the corporate tax rate. They also
include a provision disallowing the last-in, first-out (LIFO) method of inventory accounting. This
allows the cost of goods sold to reflect the prices of the most recently acquired goods, which
reduces taxes when prices are rising. It also includes some proposals to require half of advertising
costs to be deducted over a period of time. CBO’s budget options also list the repeal of the low-
income housing credit.
Table 11. Revenue Gain from CBO Budget Options, FY2021-FY2030
Provision
Revenue Cost
$Billions
Percentage of
Corporate
Revenues
Increase Corporate Rate by One Percentage Point 99.3 3.0
Repeal LIFO and Other Inventory Cost Methods 60.2 1.8
Amortize Half of Advertising Costs over Five Years 65.8 2.0
Amortize Half of Advertising Costs over Ten Years 133.4 4.1
Repeal Low Income Housing Credit 44.4 1.4
Source: CBO, Options for Reducing the Deficit: 2021-2030, December 9, 2020,
https://www.cbo.gov/publication/56783.
Biden Administration’s Proposals
The Biden Administration has outlined a series of corporate tax changes, and Table 12 provides
revenue estimates of the major provisions.131 The first provision would increase the corporate rate
from 21% to 28%.
Table 12. Estimated Revenue Gain from the Biden Administration’s Corporate Tax
Proposals, FY2022-FY2031
Provision
Revenue Gain
$Billions
Gain as a Percentage
of Corporate
Revenues
Increasing Corporate Tax Rate to 28% 857.8 24.6
Revising GILTI and Anti-Inversion Rules 533.5 15.3
Reform Taxation of Foreign Fossil Fuel Income 86.2 2.5
130 CBO at https://www.cbo.gov/data/budget-economic-data#2.
131 Department of the Treasury, “General Explanations of the Administration’s Fiscal Year 2022 Revenue Proposals,”
May 2021, https://home.treasury.gov/policy-issues/tax-policy/revenue-proposals.
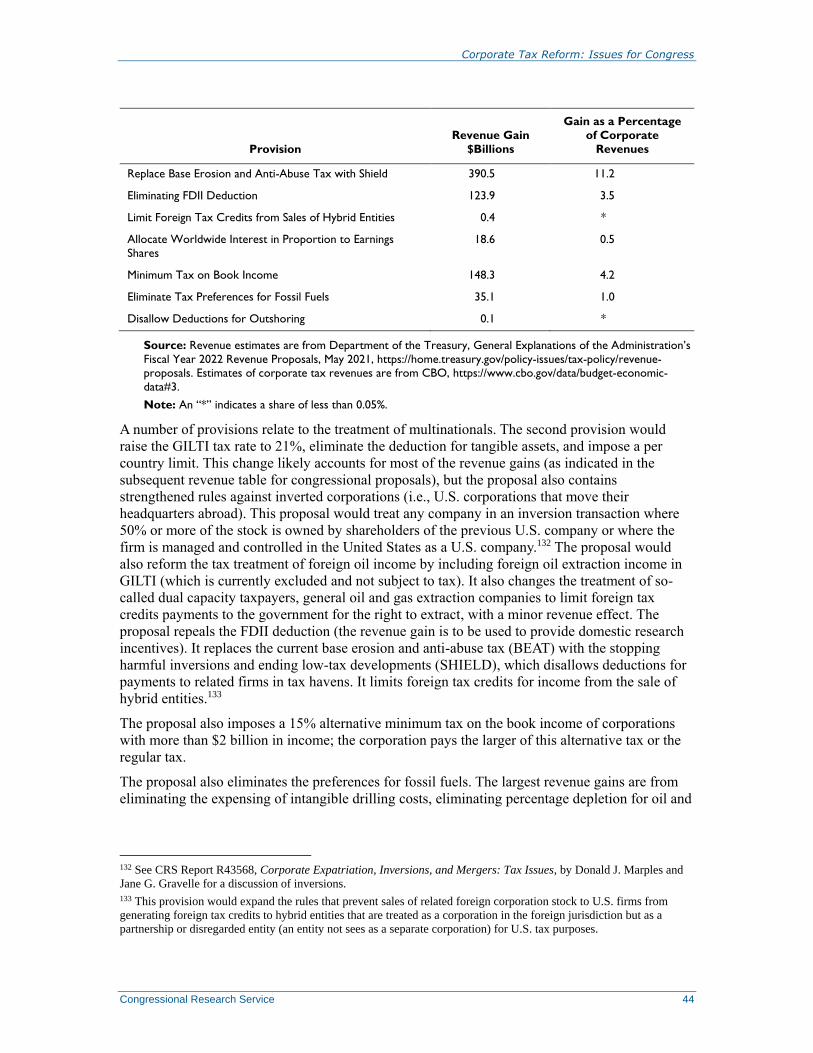
Corporate Tax Reform: Issues for Congress
Congressional Research Service 44
Provision
Revenue Gain
$Billions
Gain as a Percentage
of Corporate
Revenues
Replace Base Erosion and Anti-Abuse Tax with Shield 390.5 11.2
Eliminating FDII Deduction 123.9 3.5
Limit Foreign Tax Credits from Sales of Hybrid Entities 0.4 *
Allocate Worldwide Interest in Proportion to Earnings
Shares
18.6 0.5
Minimum Tax on Book Income 148.3 4.2
Eliminate Tax Preferences for Fossil Fuels 35.1 1.0
Disallow Deductions for Outshoring 0.1 *
Source: Revenue estimates are from Department of the Treasury, General Explanations of the Administration’s
Fiscal Year 2022 Revenue Proposals, May 2021, https://home.treasury.gov/policy-issues/tax-policy/revenue-
proposals. Estimates of corporate tax revenues are from CBO, https://www.cbo.gov/data/budget-economic-
data#3.
Note: An “*” indicates a share of less than 0.05%.
A number of provisions relate to the treatment of multinationals. The second provision would
raise the GILTI tax rate to 21%, eliminate the deduction for tangible assets, and impose a per
country limit. This change likely accounts for most of the revenue gains (as indicated in the
subsequent revenue table for congressional proposals), but the proposal also contains
strengthened rules against inverted corporations (i.e., U.S. corporations that move their
headquarters abroad). This proposal would treat any company in an inversion transaction where
50% or more of the stock is owned by shareholders of the previous U.S. company or where the
firm is managed and controlled in the United States as a U.S. company.132 The proposal would
also reform the tax treatment of foreign oil income by including foreign oil extraction income in
GILTI (which is currently excluded and not subject to tax). It also changes the treatment of so-
called dual capacity taxpayers, general oil and gas extraction companies to limit foreign tax
credits payments to the government for the right to extract, with a minor revenue effect. The
proposal repeals the FDII deduction (the revenue gain is to be used to provide domestic research
incentives). It replaces the current base erosion and anti-abuse tax (BEAT) with the stopping
harmful inversions and ending low-tax developments (SHIELD), which disallows deductions for
payments to related firms in tax havens. It limits foreign tax credits for income from the sale of
hybrid entities.133
The proposal also imposes a 15% alternative minimum tax on the book income of corporations
with more than $2 billion in income; the corporation pays the larger of this alternative tax or the
regular tax.
The proposal also eliminates the preferences for fossil fuels. The largest revenue gains are from
eliminating the expensing of intangible drilling costs, eliminating percentage depletion for oil and
132 See CRS Report R43568, Corporate Expatriation, Inversions, and Mergers: Tax Issues, by Donald J. Marples and
Jane G. Gravelle for a discussion of inversions.
133 This provision would expand the rules that prevent sales of related foreign corporation stock to U.S. firms from
generating foreign tax credits to hybrid entities that are treated as a corporation in the foreign jurisdiction but as a
partnership or disregarded entity (an entity not sees as a separate corporation) for U.S. tax purposes.
Corporate Tax Reform: Issues for Congress
Congressional Research Service 45
gas, and repealing the enhanced oil recovery credit (including tertiary injections).134 These
provisions are accompanied by a number of provisions providing incentives for clean energy.
The proposal disallows expenses for moving operations abroad (offshoring). However, the
proposal would allow a credit for moving operations to the United States (inshoring).
Congressional Proposals
Several bills introduced in the 117th Congress would focus primarily on international tax issues.
S. 20 (Klobuchar), S. 714 (Whitehouse), H.R. 1785 (Doggett), and S. 991 (Sanders) would
increase GILTI by taxing income at ordinary rates, eliminating the deduction for tangible assets,
and providing for a per-country limit on the corporate tax. Except for S. 991, which also returns
the corporate rate to 35%, these proposals are the same as the Administration’s proposal. S. 714,
H.R. 1785, and S. 991 also have several other provisions in common. For example, they allocate
interest deductions among countries based on their share of income, which is aimed at preventing
firms from allocating interest deductions to the United States and out of low-taxed countries. The
bills would also repeal the deduction for FDII (as does the Administration’s proposal). They also
along with the Administration’s proposal and two more narrowly focused bills, S. 1501 (Durbin)
and H.R. 2976 (Doggett), have anti-inversion rules that would treat these new firms as U.S. firms
if the U.S. shareholders have more than 50% ownership or if they are managed in the United
States.
The three bills also have revisions to BEAT—although different from each other and different
from the Administration’s proposal. The current BEAT tax rate is 10% and certain limited credits
are allowed (e.g., the research credit and 80% of the low-income housing credit and the two
major energy credits referenced above). The BEAT rate is scheduled to go to 12.5% and the
credits disallowed. S. 991 would move immediately to these provisions. It would also reduce the
BEAT exemption from $500 million to $25 million and eliminate an exemption based on the
share of base erosion payments in total payments. It eliminates payments that are already
included in income in other international provisions. S. 725 (Whitehouse) and H.R. 1786
(Doggett) also have BEAT provisions, but they do not accelerate the rate change and elimination
of credits or remove certain payments and they reduce the exemption to $100 million. All three
bills include payments that firms elect to capitalize (deduct over several years).
S. 991, S.725, and H.R. 1786 would change the treatment of so-called dual capacity taxpayers,
which would effectively treat taxes paid in countries where governments own the natural
resources as deductible royalties rather than creditable taxes.
S. 991 would also tighten the rules affecting treaty shopping (going through a country that has a
treaty with the United States) to enable treaty benefits for earnings in a nontreaty country.135
S. 725 and H.R. 1786 would address other areas of international corporate taxation. The proposals
would treat swap payments to foreign corporations as sourced to the payor rather than the payee,
134 Other provisions include repealing the credit for marginal wells, eliminating the exemption of oil and gas from the
passive loss limits, eliminating the shorter term amortization of geological and geophysical costs, eliminating the
expensing of mining exploration and development costs, eliminating percentage depletion for hard mineral fossil fuels,
eliminating the capital gains treatment for royalties on coal, eliminating the exemption for fossil fuels from the rule
treating publicly traded partnerships as corporations, and eliminating the shorter term amortization of pollution control
facilities. Most of the fossil fuel changes are discussed in CRS Committee Print CP10004, Tax Expenditures:
Compendium of Background Material on Individual Provisions — A Committee Print Prepared for the Senate
Committee on the Budget, 2020, by Jane G. Gravelle et al.
135 See CRS Report R40468, Tax Treaty Legislation in the 111th Congress: Explanation and Economic Analysis, by
Donald J. Marples for a discussion of treaty shopping.

Corporate Tax Reform: Issues for Congress
Congressional Research Service 46
which would subject swap payments sent abroad to U.S. tax. (Swaps are contracts that allow one
party to take a financial position based on expected future prices, such as currency prices.) The
proposals would require firms that file SEC 10-K reports to disclose actual U.S. federal, state and
local, and foreign taxes paid as well as country-by-country information on revenues, taxes, assets,
employees, earnings, and profits. The proposals would charge interest on installment payments
for the transition tax on accumulated deferred foreign earnings (this provision is also included in
S. 991). The proposals would include foreign oil-related income in Subpart F. The proposals
would tax the gain on the transfer of an intangible asset to a foreign partnership. Generally,
exchanges of assets in return for a share of the partnership would not be taxed. Other sections of
S. 725 and H.R. 1786 are associated with international tax administration and enforcement.
Table 13 provides estimates of the international provisions in S. 991. They are estimated
assuming a 21% tax rate, although S. 991 elsewhere increases the corporate tax rate to 35%; if
estimated at that rate, they would yield larger revenue gains. The increase in the tax rate to 35%
would presumably raise around $1.6 trillion over 10 years, based on the revenue estimate for a
single percentage point in the CBO options.
Table 13. Revenue Gain from International Provisions in S. 991 (Sanders),
FY2022-FY2031
Provision
Revenue Gain
$Billions
Gain as a
Percentage
of Corporate
Revenues
Revisions to GILTI (Taxing at Full Rates with Per Country Foreign
Tax Credit Limit)
676.0 19.4
Allocating Worldwide Interest in Proportion to Earnings Shares 38.1 1.1
Anti-Inversion Rules and Treaty Shopping 22.2 0.6
Changes to BEAT 26.7 0.8
Dual Capacity Taxpayers 4.3 0.1
Eliminate FDII Deduction 216.8 6.2
Source: Joint Committee on Taxation, Letter to Senator Sanders March 21, 2021,
https://www.sanders.senate.gov/wp-content/uploads/Corporate-Tax-Dodging-Prevention-Act-Score-of-offshore-
portion.pdf. Estimates of corporate tax revenues are from CBO, https://www.cbo.gov/data/budget-economic-
data#3.
Note: These estimates are based on a 21% tax rate, although Senator Sanders’ bill elsewhere increases the
corporate tax rate to 35%.
Other Options Proposed in Prior Congresses
A number of reform proposals were made prior to the 2017 revision; some of them designed to
raise revenue to finance a reduction in the corporate rate. Some of the proposals have been
reflected in proposals already discussed or have been eclipsed by the 2017 tax changes. This
section discusses provisions from prior tax reform proposals that have not already been
mentioned.
The 2007 Treasury study, referenced above, includes a list of preferences that contains many of
the major corporate tax expenditures noted above. It also singles out some more minor tax
expenditures, including the exemption of credit unions ($2 billion in FY2020), percentage
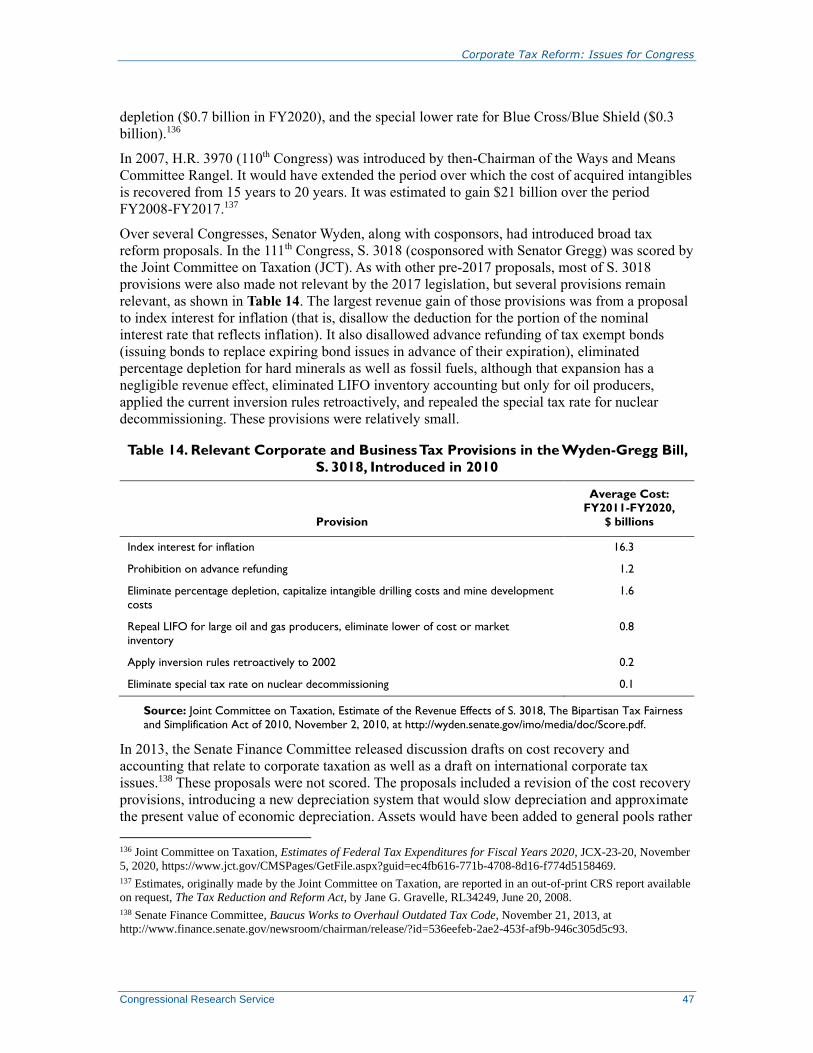
Corporate Tax Reform: Issues for Congress
Congressional Research Service 47
depletion ($0.7 billion in FY2020), and the special lower rate for Blue Cross/Blue Shield ($0.3
billion).136
In 2007, H.R. 3970 (110th Congress) was introduced by then-Chairman of the Ways and Means
Committee Rangel. It would have extended the period over which the cost of acquired intangibles
is recovered from 15 years to 20 years. It was estimated to gain $21 billion over the period
FY2008-FY2017.137
Over several Congresses, Senator Wyden, along with cosponsors, had introduced broad tax
reform proposals. In the 111th Congress, S. 3018 (cosponsored with Senator Gregg) was scored by
the Joint Committee on Taxation (JCT). As with other pre-2017 proposals, most of S. 3018
provisions were also made not relevant by the 2017 legislation, but several provisions remain
relevant, as shown in Table 14. The largest revenue gain of those provisions was from a proposal
to index interest for inflation (that is, disallow the deduction for the portion of the nominal
interest rate that reflects inflation). It also disallowed advance refunding of tax exempt bonds
(issuing bonds to replace expiring bond issues in advance of their expiration), eliminated
percentage depletion for hard minerals as well as fossil fuels, although that expansion has a
negligible revenue effect, eliminated LIFO inventory accounting but only for oil producers,
applied the current inversion rules retroactively, and repealed the special tax rate for nuclear
decommissioning. These provisions were relatively small.
Table 14. Relevant Corporate and Business Tax Provisions in the Wyden-Gregg Bill,
S. 3018, Introduced in 2010
Provision
Average Cost:
FY2011-FY2020,
$ billions
Index interest for inflation 16.3
Prohibition on advance refunding 1.2
Eliminate percentage depletion, capitalize intangible drilling costs and mine development
costs
1.6
Repeal LIFO for large oil and gas producers, eliminate lower of cost or market
inventory
0.8
Apply inversion rules retroactively to 2002 0.2
Eliminate special tax rate on nuclear decommissioning 0.1
Source: Joint Committee on Taxation, Estimate of the Revenue Effects of S. 3018, The Bipartisan Tax Fairness
and Simplification Act of 2010, November 2, 2010, at http://wyden.senate.gov/imo/media/doc/Score.pdf.
In 2013, the Senate Finance Committee released discussion drafts on cost recovery and
accounting that relate to corporate taxation as well as a draft on international corporate tax
issues.138 These proposals were not scored. The proposals included a revision of the cost recovery
provisions, introducing a new depreciation system that would slow depreciation and approximate
the present value of economic depreciation. Assets would have been added to general pools rather
136 Joint Committee on Taxation, Estimates of Federal Tax Expenditures for Fiscal Years 2020, JCX-23-20, November
5, 2020, https://www.jct.gov/CMSPages/GetFile.aspx?guid=ec4fb616-771b-4708-8d16-f774d5158469.
137 Estimates, originally made by the Joint Committee on Taxation, are reported in an out-of-print CRS report available
on request, The Tax Reduction and Reform Act, by Jane G. Gravelle, RL34249, June 20, 2008.
138 Senate Finance Committee, Baucus Works to Overhaul Outdated Tax Code, November 21, 2013, at
http://www.finance.senate.gov/newsroom/chairman/release/?id=536eefeb-2ae2-453f-af9b-946c305d5c93.

Corporate Tax Reform: Issues for Congress
Congressional Research Service 48
than each vintage of investments being depreciated separately. Real property would have
depreciated over 43 years.139
The Obama Administration’s annual budgets also included corporate tax reform provisions,
concentrated in a few areas: international provisions, insurance provisions, inventory accounting,
and fossil fuels. Most of these provisions are no longer relevant or are included in some of the
current proposals or budget options. A number of notable provisions have been included in those
budgets. Some international provisions related to a rule under current and prior law that requires
current taxation at full rates for certain easily shifted income called Subpart F income, named
after the code section specifying these rules. One provision that eventually disappeared from the
proposals was to eliminate “check the box” provisions which allow avoidance of Subpart F
treatment, so that under current law this income falls in the lower taxed GILTI category.140
Another was to expand the Subpart F category to include digital income. A foreign provision was
to disallow a deduction for reinsurance premiums to affiliated but foreign-owned firms. These
budgets also contained two other business provisions of note. One was to limit the gain that can
escape tax through like-kind exchanges (i.e., exchanges of property that avoid capital gains taxes,
limited since the 2017 tax revision to real property) to a dollar amount. The other was to increase
the depreciation period that costs can be recovered for noncommercial aircraft to commercial
aircraft (from five years to seven years), a provision not currently relevant but that would become
so when and if expensing expires.
In 2014, revenue estimates were released for the Tax Reform Act of 2014 (H.R. 1) introduced by
Dave Camp, then-chairman of the Ways and Means Committee.141 This proposal repealed or
revised 115 corporate-related provisions including most corporate-related tax expenditures (which
are discussed above); estimates are found in a 2014 JCT document.142 As with other prior law
provisions, most of the provisions in this proposal are no longer relevant under the 2017 law or
are reflected in the reform proposals already presented, although the proposal did include full
amortization of advertising costs rather than the half in the CBO study and also proposed not only
retaining depreciation for equipment but slowing it.
Evaluating Tax Revisions
A full discussion of the economic merits of these provisions is beyond the scope of this paper, but
the standard tax expenditure items are discussed in the Senate Budget Committee Print, Tax
Expenditure Compendium;143 most would be regarded as provisions that lead to economic
139 Senate Finance Committee, Baucus Unveils Proposals for International Tax Reform, November 19. 2013, at
http://www.finance.senate.gov/newsroom/chairman/release/?id=f946a9f3-d296-42ad-bae4-bcf451b34b14.
140 Check-the-box is a regulatory provision, but there is also a temporary provision that codifies and expands check-the-
box. See CRS In Focus IF11392, H.R. 1865 and the Look-Through Treatment of Payments Between Related Controlled
Foreign Corporations, by Jane G. Gravelle for additional explanation.
141 See Joint Committee on Taxation, “Estimated Revenue Effects of the Tax Reform Act of 2014,” JCX-20-14,
February 26, 2014, https://www.jct.gov/publications.html?func=startdown&id=4562 and “Technical Explanation of the
Tax Reform Act of 2014,” Business Provisions, JCX-14-14, February 26, 2014,
https://www.jct.gov/publications.html?func=startdown&id=4556, Participation Exemption System for the Taxation of
Foreign.
142 See Joint Committee on Taxation, “Estimated Revenue Effects of the Tax Reform Act of 2014,” JCX-20-14 ,
February 26, 2014, https://www.jct.gov/publications.html?func=startdown&id=4562 and “Technical Explanation of the
Tax Reform Act of 2014,” Business Provisions, JCX-14-14, February 26, 2014,
https://www.jct.gov/publications.html?func=startdown&id=4556, Participation Exemption System for the Taxation of
Foreign.
143 See CRS Committee Print CP10004, Tax Expenditures: Compendium of Background Material on Individual

Corporate Tax Reform: Issues for Congress
Congressional Research Service 49
distortions.144 One possible exception is the Research and Experimentation (R&E) credit, because
social returns to research and development appear higher than private returns, but many
economists believe that the credit is probably poorly targeted and possibly abused. This argument
also applies to expensing of research costs. Arguments could also be made that the tax exempt
bond benefit is shifted to state and local governments (which can charge lower interest rates) and
that these assets and revenue losses would be shifted to individuals. Further arguments could be
made that the benefits of the charitable contribution deduction and the low-income housing credit
ultimately accrue to charities and lower-income tenants, at least in part. Many other provisions
have some support, and may, therefore, be difficult to repeal. Aside from increasing the corporate
tax rate, the two most important provisions in terms of revenue are reduced taxation of foreign
source income and expensing of the cost of acquiring equipment.145 Replacing expensing and the
normal accelerated depreciation system with slower depreciation would raise the cost of capital.
However, expensing, as well as the regular depreciation system, favors equipment over structures.
This issue could be addressed by increasing the tax on equipment by extending depreciable lives
and shortening depreciation periods for structures. Accelerated depreciation, including expensing,
also exacerbates negative tax rates on debt financed assets because it maintains the full deduction
for nominal interest while reducing (in the case of expensing, to zero) the effective tax rate on the
earnings. This effect makes a case for limiting interest deductions and supports a proposal to
disallow the inflation portion.146
Increasing Individual Level Taxes; Shifting Between Corporate and
Individual Form
As an alternative or in addition to raising corporate revenues, the individual tax on dividends and
capital gains could be increased. Because individual taxes tend to be collected regardless of
where income is earned, these taxes are neutral with respect to international allocation. One
approach is to reverse the 2003 tax changes that lowered rates on dividends that were previously
taxed as ordinary income to the lower capital gains tax rates. Dividends and capital gains are
currently subject to a top rate of 20%; the top rate for ordinary income is 37%, scheduled to rise
to 39.6% after 2025.
Additional revenue could be raised by taxing capital gains at ordinary rates. The tax expenditure
estimate for lower rates for capital gains and dividends is $1,148.5 billion, although this estimate
Provisions — A Committee Print Prepared for the Senate Committee on the Budget, 2020, by Jane G. Gravelle et al.
144 A number of individual provisions are discussed in CRS Report R41743, International Corporate Tax Rate
Comparisons and Policy Implications, by Jane G. Gravelle, including accelerated depreciation, the production activities
deduction, and the title passage rule inventory accounting. For a detailed discussion of corporate revenue raising
provisions, see Jane G. Gravelle, “Raising Revenue From Reforming the Corporate Tax Base,” in John W. Diamond
and George R. Zodrow., eds., Pathways to Fiscal Reform in the United States, Cambridge, MA: The MIT Press, 2014.
145 See CRS Report R45186, Issues in International Corporate Taxation: The 2017 Revision (P.L. 115-97), by Jane G.
Gravelle and Donald J. Marples for a further discussion of the efficiency issues associated with the favorable treatment
of foreign source income.
146 The 2017 revision tightened a current rule restricting interest deductions, often referred to as the Section 163(j)
limit, which had limited interest deductions to 50% of income before interest, taxes, depreciation, and amortization
(EBITDA). This provision also had a safe harbor that exempted firms with debt-to-equity ratios of less than 1.5, which
meant most firms even with large interest payments would not be affected. The 2017 change eliminated the safe harbor
and lowered the limit to 30%. In 2022, in addition, the measure of income would become larger: income before taxes
and interest (EBIT), which will make the provision more likely to apply to firms with large depreciation deductions,
which are associated with equipment. Thus, there is already a provision limiting interest, which will shortly become
more binding, but it is not associated with the share of nominal interest that reflects inflation.

Corporate Tax Reform: Issues for Congress
Congressional Research Service 50
includes tax on assets other than corporate stock and does not account for behavioral responses.
Based on the JCT revenue estimating methodology, the amount of additional revenue would be
significantly constrained by the behavioral effect on realizations, although there is disagreement
on this effect, including a recent study that found a much smaller effect.147 This behavioral
response would be considerably reduced if taxing capital gains at death, which has been included
in a number of proposals, and would also raise additional revenue.148 The Biden budget proposals
would tax gains and dividends of taxpayers with $1 million or more of income for married
couples and $500,000 of income for singles at the top ordinary rate (currently at 37% but raised
elsewhere in the proposal to the prior rate of 39.6%). It would also tax capital gains in excess of
$2 million for married couples and $1 million for singles when transferred at death or by gift.
(Transfers to spouses or charities would be excluded.) This provision is projected to raise $332
billion over 10 years.
A more extensive proposal, taxing capital gains on an accrual basis would yield dramatically
more revenue.149 This type of change would also eliminate distortions arising from payout
policies and realization responses. Additional revenue could be achieved by taxing nonprofits on
earnings from corporate shares as income to pension and retirement funds and as unrelated
business income to nonprofits, which is important because over half the stock of U.S. firms is
owned by these tax exempt shareholders. Another provision that might be used to raise revenues
if the tax on the corporate sector is raised substantially is to tax the increasing number of large
pass-throughs as corporations, for example, by taxing any entity that benefits from limited
liability as a corporation. (Publicly traded partnerships, with some exceptions, are already taxed
as corporations.) How much, if any, revenue that change would raise depends on any changes in
taxation of dividends and capital gains and the individual and corporate income rates.
Conclusion On the whole, many of the concerns expressed about the corporate tax leading up to the 2017 rate
cut appear not to stand up under empirical examination. The claims that behavioral responses
could cause revenues to rise if rates were cut do not hold up on either a theoretical basis or an
empirical basis. Studies that purport to show a revenue-maximizing tax rate of 30% contain
econometric errors that produce biased and inconsistent results; when those problems are
corrected the results disappear. Evidence from empirically driven models indicate that the
corporate tax largely falls on labor. Reduced form empirical studies that are cited as providing
direct evidence showing that the burden of the corporate tax actually falls on labor generally yield
unreasonable results and prove to suffer from econometric flaws that also lead to a disappearance
of the results when corrected. Similarly, claims that high U.S. tax rates will create problems for
the United States in a global economy suffer from a misrepresentation of the U.S. tax rate
compared with other countries and are less important when capital is imperfectly mobile, as it
appears to be.
Although these arguments appear to rely on questionable data, the traditional concerns about the
corporate tax appear valid. Many economists believe that the tax is still needed as a backstop to
individual tax collections, even though it results in some economic distortions. These economic
147 See CRS Report R41364, Capital Gains Tax Options: Behavioral Responses and Revenues, by Jane G. Gravelle for
a review of the economic evidence.
148 See CRS In Focus IF11812, Tax Treatment of Capital Gains at Death, by Jane G. Gravelle.
149 See CRS Report R41364, Capital Gains Tax Options: Behavioral Responses and Revenues, by Jane G. Gravelle;
and Jane G. Gravelle, “Sharing the Wealth: How to Tax the Rich,” National Tax Journal, vol. 73, no. 4, December
2020, pp. 951-968, for a discussion about revenue and design.

Corporate Tax Reform: Issues for Congress
Congressional Research Service 51
distortions, however, have declined substantially over time as corporate rates and shares of output
have fallen. A number of changes could reduce these distortions.
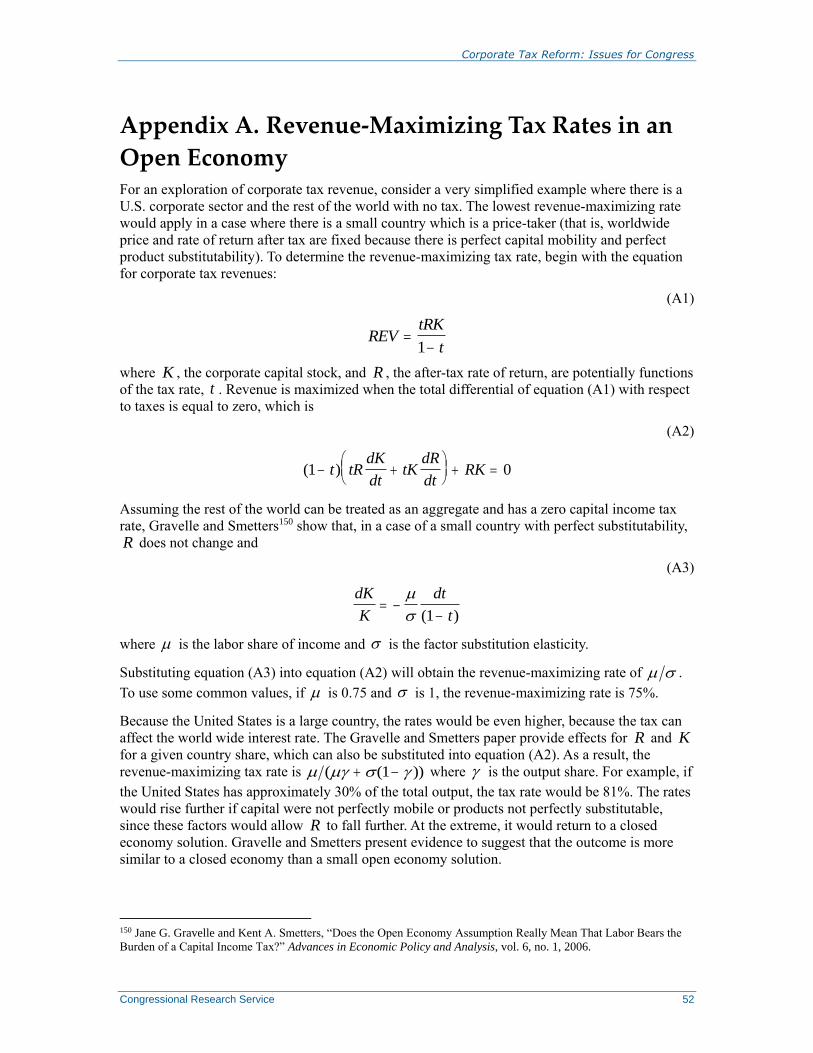
Corporate Tax Reform: Issues for Congress
Congressional Research Service 52
Appendix A. Revenue-Maximizing Tax Rates in an
Open Economy For an exploration of corporate tax revenue, consider a very simplified example where there is a
U.S. corporate sector and the rest of the world with no tax. The lowest revenue-maximizing rate
would apply in a case where there is a small country which is a price-taker (that is, worldwide
price and rate of return after tax are fixed because there is perfect capital mobility and perfect
product substitutability). To determine the revenue-maximizing tax rate, begin with the equation
for corporate tax revenues:
(A1)
REVtRK
t
1
where K , the corporate capital stock, and R , the after-tax rate of return, are potentially functions
of the tax rate, t . Revenue is maximized when the total differential of equation (A1) with respect
to taxes is equal to zero, which is
(A2)
( )1 0
t tR
dK
dttK
dR
dtRK
Assuming the rest of the world can be treated as an aggregate and has a zero capital income tax
rate, Gravelle and Smetters150 show that, in a case of a small country with perfect substitutability,
R does not change and
(A3)
dK
K
dt
t
( )1
where is the labor share of income and is the factor substitution elasticity.
Substituting equation (A3) into equation (A2) will obtain the revenue-maximizing rate of .
To use some common values, if is 0.75 and is 1, the revenue-maximizing rate is 75%.
Because the United States is a large country, the rates would be even higher, because the tax can
affect the world wide interest rate. The Gravelle and Smetters paper provide effects for R and K
for a given country share, which can also be substituted into equation (A2). As a result, the
revenue-maximizing tax rate is ( ( )) 1 where is the output share. For example, if
the United States has approximately 30% of the total output, the tax rate would be 81%. The rates
would rise further if capital were not perfectly mobile or products not perfectly substitutable,
since these factors would allow R to fall further. At the extreme, it would return to a closed
economy solution. Gravelle and Smetters present evidence to suggest that the outcome is more
similar to a closed economy than a small open economy solution.
150 Jane G. Gravelle and Kent A. Smetters, “Does the Open Economy Assumption Really Mean That Labor Bears the
Burden of a Capital Income Tax?” Advances in Economic Policy and Analysis, vol. 6, no. 1, 2006.
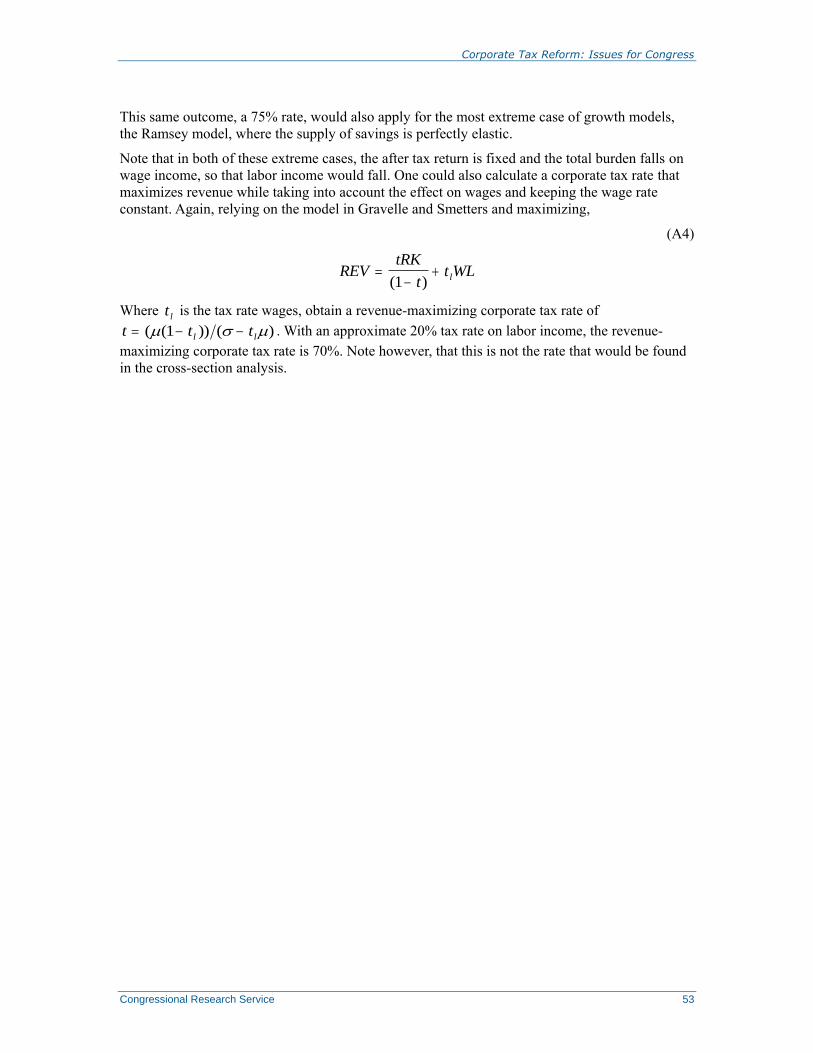
Corporate Tax Reform: Issues for Congress
Congressional Research Service 53
This same outcome, a 75% rate, would also apply for the most extreme case of growth models,
the Ramsey model, where the supply of savings is perfectly elastic.
Note that in both of these extreme cases, the after tax return is fixed and the total burden falls on
wage income, so that labor income would fall. One could also calculate a corporate tax rate that
maximizes revenue while taking into account the effect on wages and keeping the wage rate
constant. Again, relying on the model in Gravelle and Smetters and maximizing,
(A4)
REVtRK
tt WLl
( )1
Where t l is the tax rate wages, obtain a revenue-maximizing corporate tax rate of
t t tl l ( ( )) ( ) 1 . With an approximate 20% tax rate on labor income, the revenue-
maximizing corporate tax rate is 70%. Note however, that this is not the rate that would be found
in the cross-section analysis.
Corporate Tax Reform: Issues for Congress
Congressional Research Service 54
Appendix B. Data and Estimation Methods The data used in the Hassett and Mathur study and the Clausing study were obtained.151 The data
used to replicate the Brill and Hassett study were obtained from the original sources cited in the
study.152 The results reported for all studies were replicated.
The data are for several countries for a period of several years, and are known as panel data. The
model of the relationship between the corporate tax rate (the independent variable) and the
various dependent variables takes a linear form:
(B1)
where Yit is the dependent variable, X it
is the independent variable (the corporate tax rate in our
case), and are the regression parameters to be estimated, and it is a random error term.153
The subscripts, i and t, indicate that information for a particular observation comes from country i
for year t (for example, information for Australia for 1992). The random error term, it, is a
random variable and captures omitted and unobservable factors or variables that affect the
dependent variable. The error term will be discussed in further detail below.
If the following conditions are met:
the expected value (mean) of the random error term, it, is zero;
the variance of the random error term is constant for all observations;
the random error term for one observation is uncorrelated with the error term for
another observation; and
the random error terms are uncorrelated with the explanatory variables...
then the ordinary least squares (OLS) estimators will yield the best linear unbiased estimators of
the parameters ( and ). The parameter shows the true relationship between the dependent
variable and the independent variable, and is the parameter of interest to us. Denote the estimate
of as . Since is an estimate, it is a random variable drawn from a probability or sampling
distribution with an expected value (mean) and variance. This estimator will have the following
desirable properties:
unbiased: the expected value of is ;
efficient: the variance of is smaller than the variance of all other unbiased
estimators; and
consistent: the probability distribution of collapses on as the number of
observations gets arbitrarily large.
151 Thanks to the authors for providing their data. The studies are Kevin A. Hassett and Aparna Mathur, Taxes and
Wages, American Enterprise Institute, working paper, 2006; and Kimberly A. Clausing, “Corporate Tax Revenues in
OECD Countries,” International Tax and Public Finance, Vol. 14 (2007), pp. 115-133.
152 Alex Brill and Kevin A. Hassett, Revenue-Maximizing Corporate Income Taxes: The Laffer Curve in OECD
Countries, American Enterprise Institute, Working Paper no.137, July 31, 2007.
153 For ease of exposition only one independent variable is written in the equation. Generally, several independent
variables are included in the linear model. This simplification does not change the following discussion of the model
and estimation techniques.
Corporate Tax Reform: Issues for Congress
Congressional Research Service 55
Estimation problems often arise with panel data because one or more of the conditions listed
above are not met. The result is the OLS estimator will be biased and inconsistent. Problems arise
with panel data, as is demonstrated when equation (B1) is rewritten as:
(B2)
Y Xit it i t it .
The term i is an effect (unobserved heterogeneity) specific to a particular country capturing
differences among countries in (1) the measurement of economic data, (2) economic institutions,
(3) laws and regulations applying to business, and (4) attitudes toward business, among other
things. The term t is a time specific effect capturing such things as the international business
cycle. Since the corporate tax rate is a reflection of the attitudes toward business in a country, X it
and i will be correlated. Ignoring the country-specific unobserved heterogeneity means that the
OLS estimate of is biased and inconsistent because the error term in equation (B1) is
correlated with the explanatory variable—one of the conditions listed above is violated. Another
problem often encountered with data that has a time dimension is the error terms are correlated
from one year to the next year (called autocorrelation). Statistical tests indicate that these
problems exist with the data obtained. Consequently, the parameters of the model are estimated
using the fixed effect estimation procedure allowing for an AR(1) error structure.154
Identification
Neither Brill and Hassett nor Clausing offer any justification in their studies for using OLS rather
than the fixed effects method to estimate the parameters of their model. A well-known drawback
of the fixed effects method is variables that vary across countries, but not across time within a
country, cannot be included in the estimation (that is, the parameters associated with these
variables are not identified). Devereux (2006) claims “changes in the statutory [corporate tax] rate
within a country are comparatively rare. In practice, as found by Clausing (2006), there is not
enough variation within country to identify an effect of the statutory rate, conditional on country
fixed effects.”155
To check the correctness of this statement and the justification for using OLS, the variation of the
corporate tax rate across countries and over time was directly examined. Table B-1 displays the
results for the data from the three studies reanalyzed. The first row displays the relevant
explanatory corporate tax rate variable used in the study. The second row reports of mean of the
variable. The third row reports the standard deviation (a measure of variation of a variable) of the
corporate tax rate variable. The last two rows decompose the standard deviation into the between
country component and the within country component. If there is no variation in the variable over
time within countries, then the within component of the standard deviation will be zero.
Consequently, the effect of that variable on the dependent variable is not identified conditional on
fixed effects (that is, it cannot be estimated using the fixed effects procedure). As can be seen
from the table, there is almost as much variation within countries (the within component) as there
is between countries (the between component).
154 See Christopher F. Baum, An Introduction to Modern Econometrics Using Stata (College Station, TX: Stata Press,
2006) for a description of this technique. The overall results and conclusions are not changed when using the random
effects estimation procedure allowing for an AR(1) error structure.
155 Michael P. Devereux, Developments in the Taxation of Corporate Profit in the OECD Since 1965: Rates, Bases and
Revenues, University of Warwick, Working Paper, May 2006, p. 20.
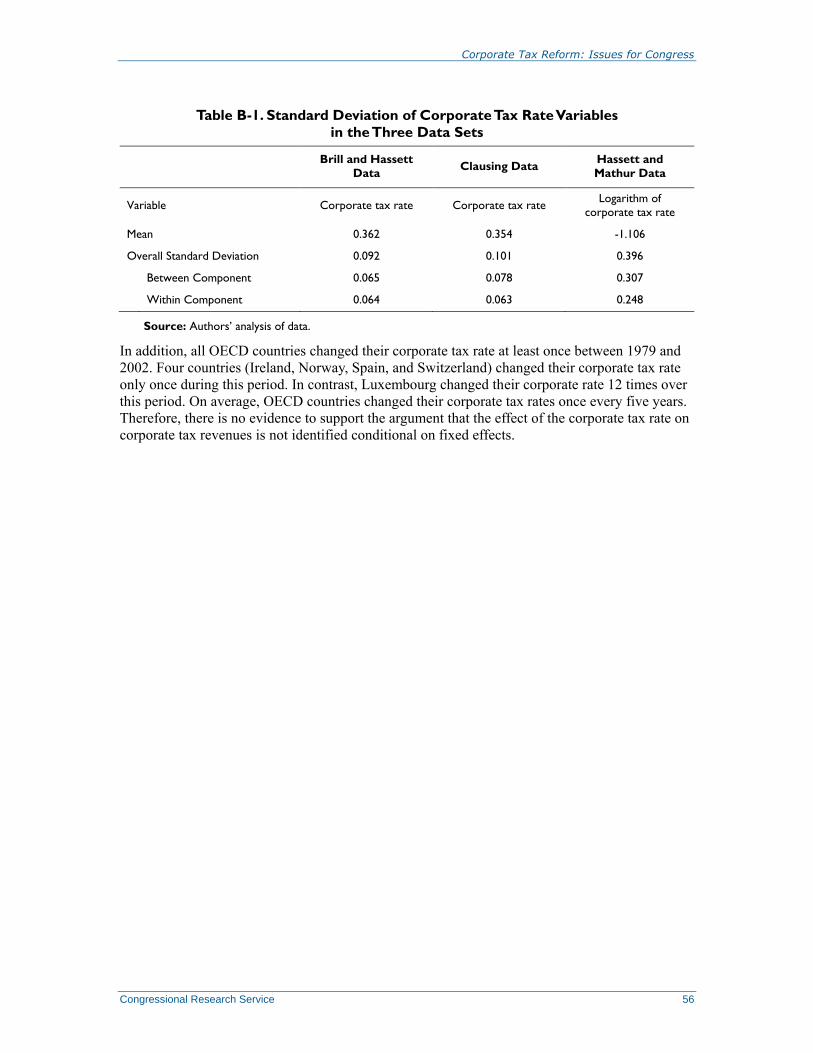
Corporate Tax Reform: Issues for Congress
Congressional Research Service 56
Table B-1. Standard Deviation of Corporate Tax Rate Variables
in the Three Data Sets
Brill and Hassett
Data Clausing Data
Hassett and
Mathur Data
Variable Corporate tax rate Corporate tax rate Logarithm of
corporate tax rate
Mean 0.362 0.354 -1.106
Overall Standard Deviation 0.092 0.101 0.396
Between Component 0.065 0.078 0.307
Within Component 0.064 0.063 0.248
Source: Authors’ analysis of data.
In addition, all OECD countries changed their corporate tax rate at least once between 1979 and
2002. Four countries (Ireland, Norway, Spain, and Switzerland) changed their corporate tax rate
only once during this period. In contrast, Luxembourg changed their corporate rate 12 times over
this period. On average, OECD countries changed their corporate tax rates once every five years.
Therefore, there is no evidence to support the argument that the effect of the corporate tax rate on
corporate tax revenues is not identified conditional on fixed effects.
Corporate Tax Reform: Issues for Congress
Congressional Research Service 57
Appendix C. Modeling Problems of the Desai,
Foley, and Hines Study This appendix explains in further detail the modeling problems associated with the Desai, Foley,
and Hines study (hereinafter, DFH), which include the failure to recognize price variability. This
means that their cross-equation restriction is not justified (and that restriction is what gives rise to
their results). The DFH study also fails to correctly interpret their results given that other sectors
exist in the economy.
The DFH model effectively begins with an equation that forms a basic part of any general
equilibrium model, namely that a percentage change in price is a weighted average of the
percentage in costs for small changes. In the case of an imposition of a tax, that is
(C1)
where p is price, r is rate of return, w is the wage rate, is the tax rate and is the share of
capital income. The hat notation refers to a percentage change except in the case of the tax
variable, where the hat means the change in tax rate divided by one minus the tax rate. Beginning
with a no tax world, that variable is simply d . This relationship can be derived from a profit
maximization problem. DFH derive such an equation to motivate their seemingly unrelated
regression model. They then assume that p, the price of the good, does not change, which
produces an equation of the form:
(C2)
Since is an exogenous variable this equation indicates that the change in the tax would be
shared by interest rates and wages, and this is the basis for the two seemingly unrelated
regressions where the dependent variables are r and w, and the coefficients are constrained so that
the burden will add up to one.
The argument for keeping the price fixed is that such a good would have its price fixed due to
trade (e.g., all commodities have to sell at the same price). There are two difficulties with this
assumption. First, if consumers in different countries have different preferences for goods based,
in part, on country of origin (i.e., they do not consider French wine and German wine to be
perfect substitutes) these prices will not be fixed. Indeed, this phenomenon is widely recognized,
and the price responses are referred to as Armington elasticities—and they have been estimated
empirically. Second, their observations are the weighted average of firms in each country but the
firms themselves produce heterogeneous products, and all of these product prices cannot stay
fixed because they have different capital intensities and because the products will vary from one
country to another. Indeed, the trading of heterogeneous products means that fixed prices cannot
be assumed because, in such a model, countries could not produce, consume and trade numerous
products with differential taxation because such a world economy would be characterized by
corner solutions (i.e., no internal equilibrium).
This problem means that there is another variable—price—that is affecting the results and
presumably is correlated with the error term (that is, the price would tend to be higher when the
tax rate is higher, making the regression suspect and that the coefficient restriction is not
appropriate.
Even if these problems did not exist, there is an additional problem with the interpretation of their
findings, namely that they did not adjust for other sectors in the economy, including nontraded

Corporate Tax Reform: Issues for Congress
Congressional Research Service 58
sectors and sectors not subject to the corporate tax. Incidence results must be adjusted for the fact
that the tax is only a partial one.
To illustrate in the simplest fashion, suppose the remaining sector of the economy is a
noncorporate nontraded sector of the economy whose price is denoted by a capital P:
(C3)
This commodity has no taxes and if the effects on r and w are estimated, those can be used to
determine the change in P.
What ultimately to be determined is the fraction of the tax, rKc d (where Kc is the capital in the
corporate traded sector) that falls on labor, that is what share of Ldw, where L is total labor in the
economy, is of rKc d .
To derive the real change in wages, the change in nominal wage is divided by the change in total
price level in the economy, or, if the corporate sector is responsible for (1- ) of output in the
economy the percentage change in real wage (which is denoted with a capital W) can be
expressed as follows:
(C4)
If s is the share of the burden falling on labor income, from equation (1), and
.
And, by substitution of these values into (3) and in turn into (4), and allowing the initial price
level to be normalized at 1, obtain the equation for incidence in the economy, noting that
/ ( )1 equals rKc/wLc:
(C5) Ldw L L s s s rK dc c ( / )( ( ) ( )( ) / ) 1 1 1
The first term, total labor divided by labor in the tax sector reflects the increased burden from the
spread of the nominal fall in wages to the other sector, and the negative terms inside the next
parenthesis reflects the rise in real wages due to the fall in the price of the untaxed sector.
Whether the burden rises or falls depends on a variety of factors. As the capital intensity of the
untaxed sector rises the burden falls; at the extreme when becomes 1, the first term collapses
to 1 and the second term is less than s, so the total burden on labor is less in the economy than it
is in the estimation. This possibility is more important than it might initially appear, because one
of the most important uses of capital not subject to the corporate income tax is in housing in the
United States.
Corporate Tax Reform: Issues for Congress
Congressional Research Service 59
Appendix D. Bargaining Models and Rent-Sharing
of Corporate Taxes With a number of studies appealing to a bargaining model and rent sharing, it is important to
understand the theory implied.
Bargaining models start from a standard Nash equilibrium which maximizes the product of the
welfare of the two recipients. Using the ADM notation:
(D1) B = {[u(w)-u(w*)] N}(1- µ) {Π-Π*}µ
where w is the wage earned, u(w) is the utility of the wage earned, w* is the competitive wage,
u(w*) is the utility of the competitive wage, N is the number of employees, Π is the profit in the
current undertaking and Π* is the alternative profit that could be earned in the competitive
industry. The exponents (1- µ) and µ reflect the bargaining strength of the parties. The first term
in curly brackets is the value of an excess wage to the workers, and the second is the value of
excess profits to the owners.
Begin with a no tax world. To maximize B differentiate with respect to the wage (which appears
in the value of excess profits because they are reduced by wN), the number of employees and the
capital stock (which is embedded in profits). The result is a bargaining solution of the form:
(D2) wN= w*N+[(1- µ)/µ] (Π-Π*)
This solution is derived in ADM although they express all of their variables in per worker terms.
Assuming away intermediate goods and other costs (which will make no difference) Π can be
defined as PQ-wL (where P is price and Q is quantity). Π* can be defined as rK where r is the
return required to attract capital and the amount earned in the competitive sector.
(D3) wN= w*N + [(1- µ)/µ] (PQ-wN-rK)
This form of the bargaining formula is used by ADM because they are estimating wages.
It is more instructive in understanding the model, however, to examine not the wage but the
excess wage. With some manipulation, and now dividing the variables by N to get per capita
amounts (with lower cases indicating per capita), obtain
(D4) w-w* = (1- µ) (Pq-w*-rk)
The last term on the right hand side is excess profit (revenue minus the competitive wage minus
the competitive return. The left hand side is the wage in excess of the competitive wage. The
workers share is (1- µ) and it is an estimate of this coefficient that the empirical rent sharing
literature is intended to identify.
Suppose now this bargaining model is being estimated assuming a tax of τ. Now profit, (Π-Π*) is
now equal to (PQ – wN)(1- τ) –rK. The first order conditions for wages and labor now contain a
tax term to reflect the fact that wages are deductible from the tax. Therefore equation D2 now
becomes:
(D5) wN= w*N+[(1- µ)/µ] [(Π-Π*)/(1- τ)]
Since the tax term is in the denominator, it suggests that the wage would go up through this effect,
which basically indicates that adding to wages saves taxes, and hence the price of paying the
surplus in wages is smaller.
Corporate Tax Reform: Issues for Congress
Congressional Research Service 60
At the same time the excess profit is reduced because taxes are applied to revenues, with wages,
but not capital deducted, making the profit term (PQ-wN)(1- τ) –rK.
When this term is substituted to provide a version of (4) the tax term in the numerator cancels
with the tax term in the denominator with the only effect of taxes on rK.
(D6) w-w* = (1- µ) (Pq-w*-rk/(1- τ))
A term similar to this one is contained in the Felix and Hines study.
The important point that comes from this last equation is that in discussing rent-sharing the
burden of the tax that falls directly on excess profits is not considered because that tax effect
disappears from the formula. Although the pie is smaller by τ(Pq-w), the price of the wage share
is also lower so the owners bear the entire direct burden of the tax on the firm’s excess profits.
The only way that taxes enter is to increase the normal cost of capital.
ADM ignore this term in their model because this term and its effects on wages are part of the
indirect burden (which would be determined by general equilibrium economy-wide results). That
is, they are interested in the direct effect of taxes outside the general equilibrium effects. They
posit a term (which is neither observable nor clearly defined) which is not related to profit, of the
form;
(D7) w-w* = (1- µ) (Pq-w*-ϕ/(1- τ) - rk/(1- τ))
where ϕ represents a tax payment that is not part of profits or of the cost of capital. It is not clear
what qualifies as part of ϕ or how important it is. Most of the examples they mention such as
deductions for interest and contributions to pension funds seem to qualify as either part of
deductible costs of funds or wage compensation. And when actually estimating the relationship in
D(7) they have no way to measure this value so the regression they run is actually roughly on
total taxes per worker (conceptually τ(VA –w) + ϕ) where VA is value added. The tax term is
estimated using instrumental variables such as tax rates since w is a left hand side variable and
VA. Because of this issue, it is difficult to interpret the importance of their result even if they are
capturing a rent-sharing effect rather than some other relationship.
Felix and Hines are estimating the union wage premium, and their version of (D6) is not per
worker and the premium is divided by the nonunion (competitive) wage. To use their notation,
they use L to denote labor. The left hand side variable is the total excess labor return, (w-w*)L
which is equal to R. Also they denote the competitive wage as w. They also use α as the
bargaining share.
(D8) R = α (Q-wL-rK/(1- τ))
One peculiar point, to return to, is that they do not have a product price P.
They then divide the equation by wL to obtain a ratio:
(D8) R/(wL)= α (Q/wL-1-rK/(wL(1- τ)))
They want to deal with the effect of tax rates on the demand for capital and labor and obtain an
expression for (D8). They also use an optimization model for the firm’s factory choices to
simplify the expression and this term contains both w and the tax rate.
The Felix Hines derivation is in error because they have omitted the product price; as quantity
changes so do prices. The proper form of (D8) is
(D9) R/(wL) = α (PQ/wL-1-rK/(wL(1- τ)))
First, to maximize profit:
Corporate Tax Reform: Issues for Congress
Congressional Research Service 61
(D10) Profit = PQ-wL –rK = P(Q(K,L)Q(K,L) –wL –rK/(1- τ).
Q is a function of K and L and P is a function of Q which is in turn a function of K and L. Q in
turn is a Cobb Douglas function:
(D11) Q = aKγL(1-γ)
The two first order conditions for K and L are:
(D12) P(1-1/e)γQ/K = r/(1- τ)
(D13) P(1-1/e)(1-γ)Q/L = w
where e is the absolute value of the elasticity of demand.
One can see from equation (D13) that PQ/wL = (e/(1-e))(1/(1- γ)) and that the last term by
dividing D12 by D13 is γ/(1- γ). Combining all of the terms together:
(D14) R/(wL) = α [{1/(e-1)}{1/(1-γ)}]
What equation (D14) indicates is that there is no effect of the tax or any other factor price on the
wage premium. It is also quite sensible. If e is infinite which would be the case with a competitive
price taking firm, the premium is zero; as e falls toward one with a less elastic demand (although
one that is of necessity greater than 1) the premium becomes larger. In any case, for a Cobb
Douglas function there is no reason to estimate a wage premium as a function of tax rates.
It also means that rent per employee would fall proportionally with wages.
Without presenting the complicated mathematics, the ratio will rise with higher taxes with a
factor substitution elasticity of less than one and decline with a factor substitution elasticity
higher than one. In the latter case the effect of the tax on rents via general equilibrium effects is
ambiguous. That is (D14) becomes:
(D14) R/(wL) = α [{1/(e-1)}{1+ (b/(1-b)s (r/(w(1- τ))(1-s)}]
where s is the factor substitution elasticity. It is easier to see what happens if expressed as an
elasticity:
(D15) d(R/wL)/(R/wL) = (1-s) γ(dr/r –dw/w+d τ /(1- τ))
The last set of terms is expected to be positive, and measures how much the ratio of returns to
wages changes. Calculations indicate this is a small semi-elasticity (assuming an overall federal
and state tax rate of 30%). If the entire burden is borne by capital the semi-elasticity, as s ranges
from 0.5 to 1.5 is 0.09 to -0.09, (as compared with the elasticity of 0.36 found in the study). If the
burden were borne entirely by wages, the elasticity would range from 0.21 to -0.21. These
calculations assume that γ is 0.25 in the sector under consideration and in the economy as a
whole, and the corporate capital stock is half of the total capital stock. If the incidence falls on
returns, Kdr = -rK1dt/(1- τ)) where K is the total capital stock and K1 is the corporate. If the
incidence falls on wages, Ldw = -rK1dt/(1- τ)). Since evidence suggests that, if the factor
substitution elasticity is not one, it is probably below 1, the expectation is that ratio of rents to
wages
It is difficult to interpret these results without knowing the effect on wages which, in their
estimates was actually positive (although not always statistically significant). However, their
interpretation that 54% of the tax falls on rents is not consistent because they are calculating a
reduction in the entire corporate wage bill, not the small portion that is the rent. Assume, for
example, that the wage does not change and take their 0.36 semi-elasticity. Their formula
indicates that dR/R = -.36d τ. To translate that into incidence on rents, multiply 0.36 times the

Corporate Tax Reform: Issues for Congress
Congressional Research Service RL34229 · VERSION 27 · UPDATED 62
ratio of rents to corporate tax collects. Rents are the rent premium (15%) times the union share
(7%) times the wage share (about 70%), which is 0.7% of output. Corporate taxes are around 2%
of output, so the ratio is .0.37. Thus, at their elasticity the share would 13%. If the highest
elasticity assuming the tax is borne by capital is used the share is about 3% and if the highest
amount assuming the tax is fully borne by capital is used, the share is about 5%.
Author Information
Jane G. Gravelle
Senior Specialist in Economic Policy
Acknowledgments
This report was originally coauthored with Thomas L. Hungerford.
Disclaimer
This document was prepared by the Congressional Research Service (CRS). CRS serves as nonpartisan
shared staff to congressional committees and Members of Congress. It operates solely at the behest of and
under the direction of Congress. Information in a CRS Report should not be relied upon for purposes other
than public understanding of information that has been provided by CRS to Members of Congress in
connection with CRS’s institutional role. CRS Reports, as a work of the United States Government, are not
subject to copyright protection in the United States. Any CRS Report may be reproduced and distributed in
its entirety without permission from CRS. However, as a CRS Report may include copyrighted images or
material from a third party, you may need to obtain the permission of the copyright holder if you wish to
copy or otherwise use copyrighted material.