Embed Size (px)
Citation preview
CORPORATE SUMMARY
April 2019

CAUTIONARY NOTEREGARDING FORWARD-LOOKING STATEMENTSCAUTIONARY NOTE REGARDING FORWARD-LOOKING STATEMENTS: This presentation contains or incorporates by reference “forward-looking statements” and “forward-looking information” under applicable Canadian securities legislation within the meaning of the United States Private Securities Litigation Reform Act of 1995. Forward-looking information includes, but is not limited to the Sale Transaction and timing of the closing of the Sale Transaction and the results on the Company’s operations as a result of the Sale Transaction, the timing of the development of the pyrite roaster, the repayment of debt, leverage rations, information with respect to the Company’s strategy, plans or future financial or operating performance, continued advancements at Chapada, Jacobina, Canadian Malartic, Cerro Moro, El Peñón, Minera Florida and Agua Rica, expected production and costs, future work and drilling programs, anticipated timing for the Chapada feasibility study and the pre-feasibility and feasibility studies for the Agua Rica / Alumbrera integrated project and the potential for future additions to mineral resources and mineral reserves. Forward-looking statements are characterized by words such as “plan,” “expect”, “budget”, “target”, “project”, “intend”, “believe”, “anticipate”, “estimate” and other similar words, or statements that certain events or conditions “may” or “will” occur. Forward-looking statements are based on the opinions, assumptions and estimates of management considered reasonable at the date the statements are made, and are inherently subject to a variety of risks and uncertainties and other known and unknown factors that could cause actual events or results to differ materially from those projected in the forward-looking statements. These factors include the receipt of certain regulatory approvals and consent in connection with the completion of the Sale Transaction, the satisfaction of closing conditions, the Company’s expectations in connection with the production and exploration, development and expansion plans at the Company's projects discussed herein being met, the impact of proposed optimizations at the Company's projects, changes in national and local government legislation, taxation, controls or regulations and/or changes in the administration or laws, policies and practices, and the impact of general business and economic conditions, global liquidity and credit availability on the timing of cash flows and the values of assets and liabilities based on projected future conditions, fluctuating metal prices (such as gold, copper, silver and zinc), currency exchange rates (such as the Brazilian real, the Chilean peso, and the Argentine peso versus the United States dollar), the impact of inflation, possible variations in ore grade or recovery rates, changes in the Company’s hedging program, changes in accounting policies, changes in mineral resources and mineral reserves, risks related to asset disposition, risks related to metal purchase agreements, risks related to acquisitions, changes in project parameters as plans continue to be refined, changes in project development, construction, production and commissioning time frames, unanticipated costs and expenses, higher prices for fuel, steel, power, labour and other consumables contributing to higher costs and general risks of the mining industry, failure of plant, equipment or processes to operate as anticipated, unexpected changes in mine life, final pricing for concentrate sales, unanticipated results of future studies, seasonality and unanticipated weather changes, costs and timing of the development of new deposits, success of exploration activities, permitting timelines, government regulation and the risk of government expropriation or nationalization of mining operations, risks related to relying on local advisors and consultants in foreign jurisdictions, environmental risks, unanticipated reclamation expenses, risks relating to joint venture operations, title disputes or claims, limitations on insurance coverage and timing and possible outcome of pending and outstanding litigation and labour disputes, risks related to enforcing legal rights in foreign jurisdictions, as well as those risk factors discussed or referred to herein and in the Company's Annual Information Form filed with the securities regulatory authorities in all provinces of Canada and available at www.sedar.com, and the Company’s Annual Report on Form 40-F filed with the United States Securities and Exchange Commission. Although the Company has attempted to identify important factors that could cause actual actions, events or results to differ materially from those described in forward-looking statements, there may be other factors that cause actions, events or results not to be anticipated, estimated or intended. There can be no assurance that forward-looking statements will prove to be accurate, as actual results and future events could differ materially from those anticipated in such statements. The Company undertakes no obligation to update forward-looking statements if circumstances or management’s estimates, assumptions or opinions should change, except as required by applicable law. The reader is cautioned not to place undue reliance on forward-looking statements. The forward-looking information contained herein is presented for the purpose of assisting investors in understanding the Company’s expected financial and operational performance and results as at and for the periods ended on the dates presented in the Company’s plans and objectives and may not be appropriate for other purposes.
The Company has included certain non-GAAP financial measures and additional line items or subtotals, which the Company believes that together with measures determined in accordance with IFRS, provide investors with an improved ability to evaluate the underlying performance of the Company. Non-GAAP financial measures do not have any standardized meaning prescribed under IFRS, and therefore they may not be comparable to similar measures employed by other companies. The data is intended to provide additional information and should not be considered in isolation or as a substitute for measures of performance prepared in accordance with IFRS. The non-GAAP financial measures included in this presentation include: Free cash flow, net debt to EBITDA, co-product cash costs per ounce of gold and silver produced, co-product cash costs per pound of copper produced, all-in sustaining co-product costs per ounce of gold and silver produced, all-in sustaining by-product costs per ounce of gold and silver produced and all-in sustaining co-product costs per pound of copper produced. Please refer to section 11 of the Company’s current annual Management’s Discussion and Analysis, which is filed on SEDAR and include a detailed discussion of the usefulness of the non-GAAP measures. The Company believes that in addition to conventional measures prepared in accordance with IFRS, the Company and certain investors and analysts use this information to evaluate the Company’s performance. In particular, management uses these measures for internal valuation for the period and to assist with planning and forecasting of future operations.
Qualified Persons
Scientific and technical information contained in this presentation has been reviewed and approved by Sébastien Bernier (Senior Director, Geology and Mineral Resources). Sébastien Bernier is an employee of Yamana Gold Inc. and a "Qualified Person" as defined by Canadian Securities Administrators' National Instrument 43-101 - Standards of Disclosure for Mineral Projects.
The information presented herein was approved by management of Yamana Gold on April 15, 2019.
All amounts are expressed in United States dollars unless otherwise indicated.
2
Corporate Summary

Significantly improve overall financial flexibility to deliver increased shareholder returns and for the pursuit of near-term value maximizing opportunities that are in the portfolio.
Rebalance the portfolio with a greater concentration of precious metals while still maintaining copper exposure.
Enhance Yamana’s position as a dominant intermediate precious metals producer highlighted by balance sheet strength, a high quality portfolio including scale, scalability, a robust FCF(1) profile and a favorable jurisdictional focus.
WHAT THE BOARD SET OUT TO DOSTRATEGIC PLAN
Corporate Summary
3
1. A non-GAAP measure, additional line item or subtotal. A reconciliation of the IFRS measure to the non-GAAP measure can be found at
www.yamana.com/Q42018. Free cash flow (FCF) defined as cash flow from operations less capex (including stockpile movements) and interest
payments.
ROBUST BALANCE SHEET, HIGH QUALITY PORTFOLIO, INCREASED DIVIDEND

TRANSACTION OVERVIEWIMMEDIATE, ADDITIONAL AND CONTINGENT PAYMENTS
Corporate Summary
4
Immediate consideration: $800 million cash payable at closing.
Additional consideration: up to $125 million based on the price of gold.
Contingent payment: $100 million cash payment with the development of a pyrite roaster at Chapada.
Royalty: a 2% net smelter return royalty on gold production from Suruca.
Opportunities to monetize the additional and contingent payments
as well as the Suruca royalty
TOTAL CONSIDERATION OF OVER $1.0 BILLION

STRATEGIC RATIONALE AND THE BENEFITS OVERVIEW(2)
5
1. A non-GAAP measure, additional line item or subtotal. A reconciliation of the IFRS measure to the non-GAAP measure can be found at
www.yamana.com/Q42018. Net debt to trailing 12-months EBITDA. EBIITDA forecasts assume current metal prices and exchange rates.
2. See Cautionary Note Regarding Forward-Looking Information.Corporate Summary
Multi-Year
Outlook for FCF
Immediate
Leverage
Reduction
• Significant deleveraging benefits highlighted by a decline in ND/EBITDA(1) to 1.5x from 2.5x.
• Contingent payments provide opportunities for further reductions.
Rebalanced
Portfolio
• Repayment of the outstanding revolving credit facility.
• Followed by the repayment of near and medium-term fixed term debt maturities.
Planned Debt
Repayments
• Robust FCF(1) and continued balance sheet improvements.
• ND/EBITDA(1) forecasted to decline to 1.0x at year-end 2021.
Increased
Shareholder
Returns
• Announcing an initial doubling of the annual dividend to $0.04/share.
• Further dividend increases being evaluated with FCF(1) generation.
• Pro forma production platform comprised of five high quality mines in the Americas with an increased revenue contribution from precious metals.
• Maintaining significant long reserve-life copper exposure through Agua Rica.
• Significant and immediate improvement in overall financial flexibility.
• Allowing for the pursuit of near-term value maximizing opportunities that are in the portfolio and increased shareholder returns.
Improved
Financial
Flexibility
A DOMINANT INTERMEDIATE PRECIOUS METALS PRODUCER

STRATEGIC RATIONALEA CLOSER LOOK AT CHAPADA’S CAPITAL REQUIREMENTS
6
1. National Instruments 43-101 Technical Report dated March 2018.2. Illustrative costs using actual 2018 unit costs and waste stripping ratios from the March 2018 43-101 Technical Report.3. Chapada Phase 2 Expansion capex and illustrative timeline, as previously disclosed.4. Assumed using 2018 actual $1.70/t cost per tonne moved with average 2019 to 2023 strip ratio 0.97:1 and stockpile tonnes of 84Mt from the National Instruments 43-101
Technical Report dated March 2018.
Based on Yamana’s Current 5-year
Outlook for Chapada
~$458M of sustaining capex and ore
stockpiling planned through 2023
coincident with declining gold
grades.
An additional $240M of expansionary
capex under review for Phase 2
($140M in 2021-2022 for a mill
expansion) and Phase 3 ($100M in
2024-2025 for a pit wall pushback).
Substantial capital required just to
maintain gold production at 100-
110k oz/year.
Corporate Summary
CHAPADA PROFILE
2018
Actual
2019
Guidance2019 - 2023
Ore stockpile additions
(Mt)14 N/A 84(1)
Stockpiling ($M) $43 $57 $270(4)
Sustaining Capex ($M) $35 $35 $175(2)
Expansionary Capex ($M) $4 $13 $13(3)
Total ($M) $82 $105 $458
Immediate Value on Sale
2018
Actual
2019
Guidance2019 - 2023 Avg
Gold Grade (g/t) 0.26 0.21 0.20(1)
Copper Grade (%) 0.31 0.28 0.31(1)

STRATEGIC RATIONALEFAIR VALUE RECEIVED
At spot metal prices, the $800M of NPV5% (upfront cash) would not have been
recovered.
Value received for Chapada reflects the full value for the asset and also included
value for the plant expansion.
Corporate Summary
7
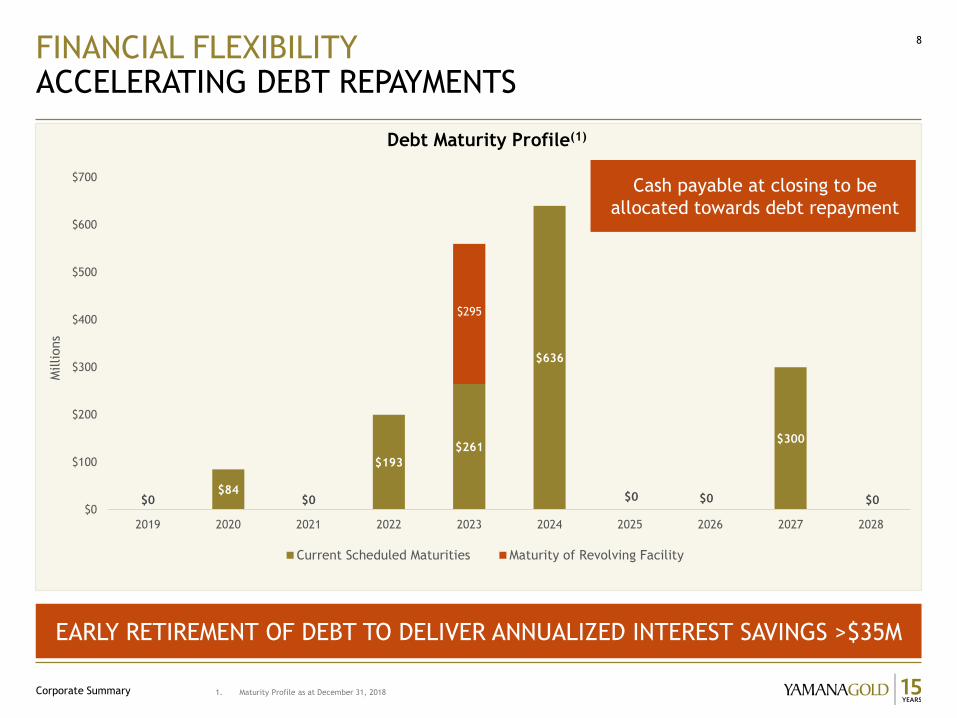
FINANCIAL FLEXIBILITYACCELERATING DEBT REPAYMENTS
Corporate Summary
8
1. Maturity Profile as at December 31, 2018
$0$84
$0
$193
$261
$636
$0 $0
$300
$0
$295
$0
$100
$200
$300
$400
$500
$600
$700
2019 2020 2021 2022 2023 2024 2025 2026 2027 2028
Millions
Current Scheduled Maturities Maturity of Revolving Facility
EARLY RETIREMENT OF DEBT TO DELIVER ANNUALIZED INTEREST SAVINGS >$35M
Debt Maturity Profile(1)
Cash payable at closing to be
allocated towards debt repayment

Immediate doubling of the annual dividend to $0.04/share from the current $0.02/share, subject to completion of the Sale Transaction.
Current dividend of $0.02/share yields 0.8%.
Pro forma dividend of $0.04/share to yield 1.6%.
Progressive dividend increases being evaluated as debt repaid from cash flow and through asset monetizations.
9
FINANCIAL FLEXIBILITYENHANCED SHAREHOLDER RETURNS THROUGH DIVIDEND
Corporate Summary
Dividend Yield % vs Peers(1)
1. Source: FactSet as of April 12, 2019
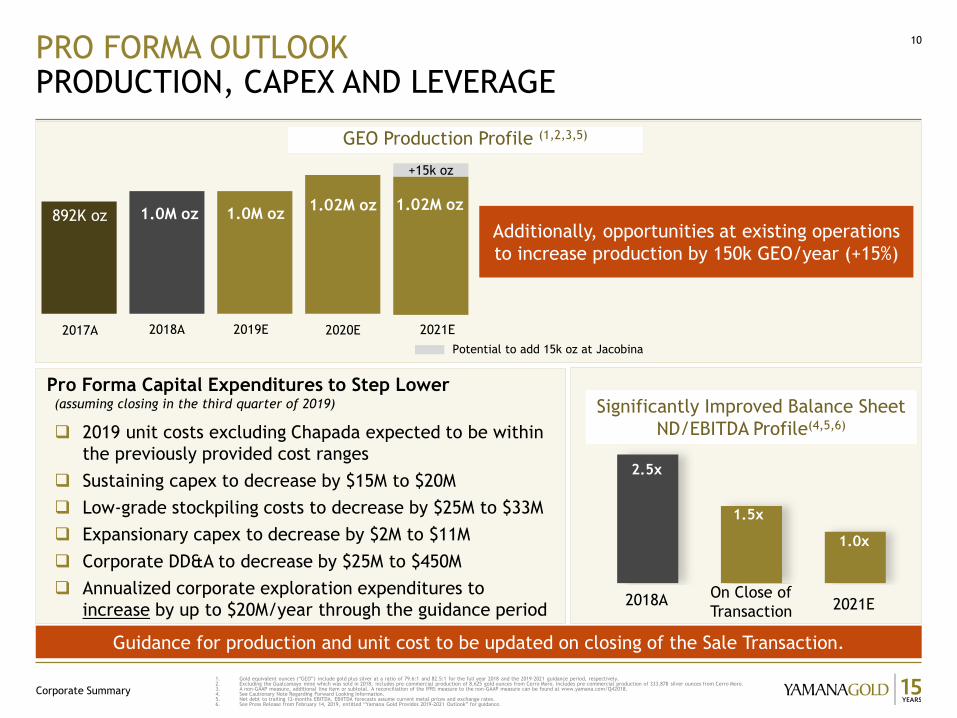
PRO FORMA OUTLOOKPRODUCTION, CAPEX AND LEVERAGE
10
1. Gold equivalent ounces (“GEO”) include gold plus silver at a ratio of 79.6:1 and 82.5:1 for the full year 2018 and the 2019-2021 guidance period, respectively.2. Excluding the Gualcamayo mine which was sold in 2018, includes pre-commercial production of 8,625 gold ounces from Cerro Moro. Includes pre-commercial production of 333,878 silver ounces from Cerro Moro. 3. A non-GAAP measure, additional line item or subtotal. A reconciliation of the IFRS measure to the non-GAAP measure can be found at www.yamana.com/Q42018.4. See Cautionary Note Regarding Forward Looking Information.5. Net debt to trailing 12-months EBITDA. EBIITDA forecasts assume current metal prices and exchange rates. 6. See Press Release from February 14, 2019, entitled “Yamana Gold Provides 2019-2021 Outlook” for guidance.
2017A 2018A 2019E 2020E
892K oz 1.0M oz 1.0M oz1.02M oz
GEO Production Profile (1,2,3,5)
Corporate Summary
Significantly Improved Balance Sheet
ND/EBITDA Profile(4,5,6)
2021E
1.02M oz
Additionally, opportunities at existing operations
to increase production by 150k GEO/year (+15%)
1.0x
1.5x
2.5x
2018AOn Close of
Transaction 2021E
Pro Forma Capital Expenditures to Step Lower(assuming closing in the third quarter of 2019)
2019 unit costs excluding Chapada expected to be within
the previously provided cost ranges
Sustaining capex to decrease by $15M to $20M
Low-grade stockpiling costs to decrease by $25M to $33M
Expansionary capex to decrease by $2M to $11M
Corporate DD&A to decrease by $25M to $450M
Annualized corporate exploration expenditures to
increase by up to $20M/year through the guidance period
Guidance for production and unit cost to be updated on closing of the Sale Transaction.
+15k oz
Potential to add 15k oz at Jacobina
11
1. See Cautionary Note Regarding Forward-Looking Information.
2. Copper equivalent metal includes copper with gold, molybdenum, and silver converted to copper-equivalent metal based on the following metal
price assumptions: US$6,614/tonne for copper, US$1,250/oz for gold, US$24,250/tonne for molybdenum, and US$18/oz for silver.
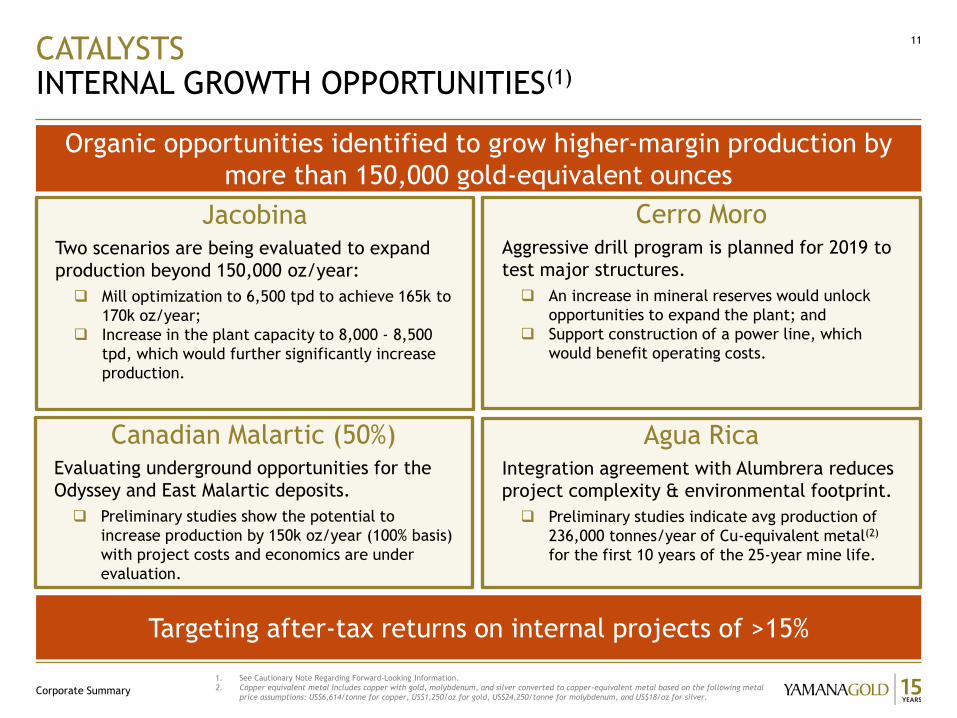
CATALYSTSINTERNAL GROWTH OPPORTUNITIES(1)
Corporate Summary
Targeting after-tax returns on internal projects of >15%
JacobinaTwo scenarios are being evaluated to expand
production beyond 150,000 oz/year:
Mill optimization to 6,500 tpd to achieve 165k to
170k oz/year;
Increase in the plant capacity to 8,000 - 8,500
tpd, which would further significantly increase
production.
Agua RicaIntegration agreement with Alumbrera reduces
project complexity & environmental footprint.
Preliminary studies indicate avg production of
236,000 tonnes/year of Cu-equivalent metal(2)
for the first 10 years of the 25-year mine life.
Canadian Malartic (50%)Evaluating underground opportunities for the
Odyssey and East Malartic deposits.
Preliminary studies show the potential to
increase production by 150k oz/year (100% basis)
with project costs and economics are under
evaluation.
Cerro MoroAggressive drill program is planned for 2019 to
test major structures.
An increase in mineral reserves would unlock
opportunities to expand the plant; and
Support construction of a power line, which
would benefit operating costs.
Organic opportunities identified to grow higher-margin production by
more than 150,000 gold-equivalent ounces

LONG MINE LIFE REMAINS AT CURRENT ASSETS(4)
EXPECTED UPSIDE FROM INCREASED EXPLORATION SPENDING
Corporate Summary
12
1. Gold equivalent ounces (“GEO”) includes gold plus silver at a ratio of 82.5:1. 2. Mineral resources that are not mineral reserves do not have demonstrated economic viability.3. As of December 31, 2018, further details including tonnes, grade and assumptions are presented in the Company’s press release issued on February 14, 2019. Please refer to
the mineral reserves and mineral resources estimates commencing on slide 16.4. See Cautionary Note Regarding Forward Looking Information
(1)
2018 Year End Mineral Reserves and Mineral Resources(3) and 2019 Production Guidance
(2)
(2)

QUALITY INTERMEDIATE WITH A RE-RATING OPPORTUNITY
13
2019 – 2021 FCF(2)/MARKET CAPITALIZATION(1)
EV/2019 EBITDA(1)
7.0x
11.4x
Yamana Gold Agnico Eagle
19%
13%
Yamana Gold Agnico Eagle
Discounted Valuation
Greater Free Cash Flow Generation for Marketcap
33% of Production and Costs from Canadian Malartic
33%
68%
Canadian Malartic Contribution From Other Assets
2019 Pro forma Production
1. Based on company estimates and FactSet market data as of April 22, 2019.2. A non-GAAP measure, additional line item or subtotal. A reconciliation of the IFRS measure to the non-GAAP measure can be found at
www.yamana.com/Q42018.3. See Cautionary Note Regarding Forward Looking Information
Corporate Summary

This page is meant to have a large photo behind the text box (which has a darkened tinted fill).
Make the photo the size of the grey area and then send to back.
Do not cover the white area at the bottom unless you don’t want to see those elements on the page.
“A dominant intermediate sized company with a portfolio
of high quality assets providing stable and increasing cash
flows, optionality, growth and prospects for additional
monetizations. With an America’s focus, we operate in the
best mining jurisdictions in the world.”
14
Corporate Summary

This page is meant to have a large photo behind the content.
Make the photo the size of the grey area and then send to back.
Do not cover the white area at the bottom unless you don’t want to see those elements on the page.
15
Investor Relations
200 Bay Street, Suite 2200
Toronto, Ontario
M5J 2J3
416-815-0220/1-888-809-0925
www.yamana.com
Corporate Summary

MINERAL RESERVES AND MINERAL RESOURCES ESTIMATESSUMMARY(1)
Corporate Summary
16
1. As of December 31, 2018.
Tonnes (000s) Grade (g/t) Contained oz. (000s)
Gold 865,653 0.45 12,496
Silver 11,736 174.5 65,828
Tonnes (000s) Grade (%) Contained lbs (M)
Copper 673,357 0.25 3,784
Tonnes (000s) Grade (g/t) Contained oz. (000s)
Gold 771,033 0.64 15,941
Silver 13,807 84.1 37,317
Tonnes (000s) Grade (%) Contained lbs (M)
Copper 431,522 0.22 2,090
Tonnes (000s) Grade (g/t) Contained oz. (000s)
Gold 333,516 0.95 10,162
Silver 25,770 64.4 53,377
Tonnes (000s) Grade (%) Contained lbs (M)
Copper 156,928 0.23 785
Measured and Indicated Mineral Resources
Inferred Mineral Resources
Proven and Probable Mineral Reserves

PROVEN AND PROBABLE MINERAL RESERVESAS OF DECEMBER 31, 2018
Corporate Summary
17
Tonnes Grade Contained Tonnes Grade Contained Tonnes Grade Contained
Gold (000's) (g/t) oz. (000's) (000's) (g/t) oz. (000's) (000's) (g/t) oz. (000's)
Alumbrera (12.5%) 8,435 0.39 106 294 0.37 4 8,728 0.39 109
Canadian Malartic (50%) 23,029 0.89 658 55,799 1.18 2,122 78,829 1.10 2,780
Cerro Moro 43 10.57 15 1,766 11.64 661 1,809 11.61 675
Chapada Zones 388,701 0.17 2,103 275,928 0.16 1,381 664,629 0.16 3,484
Suruca Zones 11,454 0.42 153 53,741 0.53 908 65,195 0.51 1,062
Total Chapada 400,155 0.18 2,256 329,669 0.22 2,289 729,824 0.19 4,546
El Peñón Ore 693 5.11 114 3,738 5.38 646 4,431 5.33 760
El Peñón Stockpiles 17 2.41 1 1,029 1.18 39 1,047 1.20 40
Total El Peñón 710 5.04 115 4,768 4.47 685 5,478 4.55 800
Jacobina 18,565 2.32 1,385 9,290 2.39 714 27,855 2.34 2,099
Jeronimo (57%) 6,350 3.91 798 2,331 3.79 284 8,681 3.88 1,082
Minera Florida Ore 690 3.61 80 2,512 3.54 286 3,202 3.56 366
Minera Florida Tailings 0 0.00 0 1,248 0.94 38 1,248 0.94 38
Total Minera Florida 690 3.61 80 3,760 2.68 324 4,449 2.82 404
Total Gold Mineral Reserves 457,977 0.37 5,413 407,677 0.54 7,083 865,653 0.45 12,496
Agua Rica 384,871 0.25 3,080 524,055 0.21 3,479 908,926 0.22 6,559
Tonnes Grade Contained Tonnes Grade Contained Tonnes Grade Contained
Silver (000's) (g/t) oz. (000's) (000's) (g/t) oz. (000's) (000's) (g/t) oz. (000's)
Cerro Moro 43 620.70 857 1,766 653.3 37,102 1,809 652.6 37,959
El Peñón Ore 693 166.1 3,700 3,738 171.7 20,630 4,431 170.8 24,330
El Peñón Stockpiles 17 107.2 60 1,029 15.2 502 1,046 16.7 562
Total El Peñón 710 164.7 3,760 4,768 137.9 21,133 5,478 141.3 24,893
Minera Florida Ore 690 28.1 623 2,512 21.9 1,770 3,202 23.2 2,393
Minera Florida Tailings 0 0.0 0 1,248 14.6 584 1,248 14.6 584
Total Minera Florida 690 28.1 623 3,760 19.5 2,353 4,449 20.8 2,976
Total Silver Mineral Reserves 1,443 112.9 5,240 10,294 183.1 60,588 11,736 174.5 65,828Agua Rica 384,871 3.7 46,176 524,055 3.3 56,070 908,926 3.5 102,246
Tonnes Grade Contained Tonnes Grade Contained Tonnes Grade Contained
Copper (000's) (%) lbs (mm) (000's) (%) lbs (mm) (000's) (%) lbs (mm)
Alumbrera (12.5%) 8,435 0.40 74 294 0.39 3 8,728 0.40 77
Chapada Zones 388,701 0.25 2,138 275,928 0.26 1,568 664,629 0.25 3,707
Suruca Zones 0 0.00 0 0 0.00 0 0 0.00 0
Total Chapada 388,701 0.25 2,138 275,928 0.26 1,568 664,629 0.25 3,707
Total Copper Mineral Reserves 397,136 0.25 2,212 276,222 0.26 1,571 673,357 0.25 3,784Agua Rica 384,871 0.56 4,779 524,055 0.43 5,011 908,926 0.49 9,790
Tonnes Grade Contained Tonnes Grade Contained Tonnes Grade Contained
Zinc (000's) (%) lbs (mm) (000's) (%) lbs (mm) (000's) (%) lbs (mm)
Minera Florida Ore 690 1.53 23 2,512 1.13 62 3,202 1.21 85Minera Florida Tailings 0 0.00 0 1,248 0.58 16 1,248 0.58 16
Total Zinc Mineral Reserves 690 1.53 23 3,760 0.94 78 4,449 1.04 102
Tonnes Grade Contained Tonnes Grade Contained Tonnes Grade Contained
Molybdenum (000's) (%) lbs (mm) (000's) (%) lbs (mm) (000's) (%) lbs (mm)
Alumbrera (12.5%) 8,435 0.013 2.45 294 0.014 0.09 8,728 0.013 2.54
Total Moly Mineral Reserves 8,435 0.013 2.45 294 0.014 0.09 8,728 0.013 2.54
Agua Rica 384,871 0.033 279 524,055 0.030 350 908,926 0.031 629
Proven Mineral Reserves Probable Mineral Reserves Total Proven & Probable

MEASURED, INDICATED AND INFERRED MINERAL RESOURCESAS OF DECEMBER 31, 2018
Corporate Summary
18
Tonnes Grade Contained Tonnes Grade Contained Tonnes Grade Contained Tonnes Grade Contained
Gold (000's) (g/t) oz. (000's) (000's) (g/t) oz. (000's) (000's) (g/t) oz. (000's) (000's) (g/t) oz. (000's)
Alumbrera (12.5%) 6,792 0.39 85 1,917 0.54 33 8,709 0.42 118 848 0.46 13
Arco Sul - - - 0 0.00 0 - - - 5,000 4.02 646
Canadian Malartic (50%) 1,885 1.36 83 13,615 1.80 786 15,500 1.74 869 36,210 1.99 2,319
Cerro Moro 18 10.83 6 1,224 5.14 202 1,241 5.22 208 1,706 3.84 211
Chapada Zones 58,885 0.12 222 363,929 0.14 1,676 422,814 0.14 1,898 156,081 0.08 422
Suruca Zones 1,284 0.39 16 81,039 0.54 1,416 82,323 0.54 1,432 12,565 0.48 194
Total Chapada 60,169 0.12 238 444,968 0.22 3,092 505,137 0.21 3,330 168,646 0.11 616
El Peñón Mine 232 8.02 60 1,579 5.88 298 1,811 6.15 358 2,953 7.25 689
El Peñón Tailings 0 0.00 0 0 0.00 0 0 0.00 0 13,767 0.55 245
El Peñón Stockpiles 0 0.00 0 1,019 1.13 37 1,019 1.13 37 0 0.00 0
El Peñón Total 232 8.04 60 2,598 4.02 336 2,830 4.35 396 16,719 1.74 933
Jacobina 24,999 2.48 1,994 15,711 2.45 1,238 40,710 2.47 3,232 12,145 2.58 1,008
Jeronimo (57%) 772 3.77 94 385 3.69 46 1,157 3.74 139 1,118 4.49 161
La Pepa 15,750 0.61 308 133,682 0.57 2,452 149,432 0.57 2,760 37,900 0.50 620
Lavra Velha 0 0.00 0 0 0.00 0 0 0.00 0 3,934 4.29 543
Minera Florida 1,207 5.87 228 3,829 4.79 590 5,036 5.05 817 6,445 5.01 1,038
Monument Bay 0 0.00 0 36,581 1.52 1,787 36,581 1.52 1,787 41,946 1.32 1,781
Suyai 0 0.00 0 4,700 15.00 2,286 4,700 15.00 2,286 900 9.90 274
Total Gold Mineral Resources 111,823 0.86 3,095 659,210 0.61 12,849 771,033 0.64 15,941 333,516 0.95 10,162
Agua Rica 27,081 0.14 120 173,917 0.14 776 200,998 0.14 896 642,110 0.12 2,444
Tonnes Grade Contained Tonnes Grade Contained Tonnes Grade Contained Tonnes Grade ContainedSilver (000's) (g/t) oz. (000's) (000's) (g/t) oz. (000's) (000's) (g/t) oz. (000's) (000's) (g/t) oz. (000's)
Cerro Moro 18 1252.97 707 1,224 381.2 14,997 1,241 393.5 15,704 1,706 257.8 14,139
El Peñón Mine 232 194.6 1,450 1,579 207.1 10,512 1,811 205.4 11,962 2,953 254.8 24,190
El Peñón Tailings 0 0.0 0 0 0.0 0 0 0.0 0 13,767 18.9 8,380
El Peñón Stockpiles - 0.0 - 1,019 28.8 942 1,019 28.8 942 0 0.0 0
El Peñón Total 232 194.6 1,450 2,598 137.1 11,454 2,830 141.8 12,904 16,719 60.6 32,570
Minera Florida 1,207 41.0 1,592 3,829 29.2 3,594 5,036 32.0 5,186 6,445 29.4 6,093
Suyai 0 0.0 0 4,700 23.0 3,523 4,700 23.0 3,523 900 21.0 575
Total Silver Mineral Resources 1,457 80.1 3,749 12,351 84.5 33,568 13,807 84.1 37,317 25,770 64.4 53,377
Agua Rica 27,081 2.4 2,042 173,917 2.9 16,158 200,998 2.8 18,200 642,110 2.3 48,124
Tonnes Grade Contained Tonnes Grade Contained Tonnes Grade Contained Tonnes Grade Contained
Copper (000's) (%) lbs (mm) (000's) (%) lbs (mm) (000's) (%) lbs (mm) (000's) (%) lbs (mm)
Alumbrera (12.5%) 6,792 0.37 55 1,917 0.24 10 8,709 0.34 65 848 0.21 4
Chapada Zones 58,885 0.20 261 363,929 0.22 1,765 422,814 0.22 2,025 156,081 0.23 781
Suruca Zones 0 0.00 0 0 0.00 0 0 0.00 0 0 0.00 0
Total Chapada 58,885 0.20 261 363,929 0.22 1,765 422,814 0.22 2,025 156,081 0.23 781
Total Copper Mineral Resources 65,676 0.22 316 365,846 0.22 1,775 431,522 0.22 2,090 156,928 0.23 785Agua Rica 27,081 0.45 266 173,917 0.38 1,447 200,998 0.39 1,714 642,110 0.34 4,853
Tonnes Grade Contained Tonnes Grade Contained Tonnes Grade Contained Tonnes Grade Contained
Zinc (000's) (%) lbs (mm) (000's) (%) lbs (mm) (000's) (%) lbs (mm) (000's) (%) lbs (mm)
Minera Florida 1,207 2.22 62 3,829 1.63 138 5,036 1.77 197 6,445 1.32 187
Total Zinc Mineral Resources 1,207 2.22 62 3,829 1.63 138 5,036 1.77 197 6,445 1.32 187
Tonnes Grade Contained Tonnes Grade Contained Tonnes Grade Contained Tonnes Grade Contained
Molybdenum (000's) (%) lbs (mm) (000's) (%) lbs (mm) (000's) (%) lbs (mm) (000's) (%) lbs (mm)
Alumbrera (12.5%) 6,192 0.014 1.94 462 0.013 0.13 6,654 0.014 2.07 85 0.014 0.03
Total Moly Mineral Resources 6,192 0.014 1.94 462 0.013 0.13 6,654 0.014 2.07 85 0.014 0.03
Agua Rica 27,081 0.049 29 173,917 0.037 142 200,998 0.039 172 642,110 0.034 480
Inferred Mineral ResourcesMeasured Mineral Resources Indicated Mineral Resources Total Measured & Indicated

Corporate Summary
19
1. As of December 31, 2018.
Yamana Gold Inc. Mineral Reserve and Mineral Resource Reporting Notes:
1. Metal Price, Cut-off Grade, Metallurgical Recovery
Mine Mineral Reserves Mineral Resources
Alumbrera Projects
(12.5%)
Alumbrera DepositPrice assumption: $1,250 gold, $2.91
copper.
Price assumption: $1,250 gold, $2.95
copper.
Underground cut-off at 0.5% copper
equivalent.
Underground cut-off at 0.43% copper
equivalent.
Metallurgical recoveries average 87.85% for
copper and 72.31% for gold.
Bajo El Durazno
DepositN/A
Price assumption: $1,250 gold, $2.95
copper.
0.74 g/t Aueq cutoff within underground
economic envelope.
Arco Sul N/A Price assumption: $1,500 gold.
2.5 g/t Au cutoff.
Canadian Malartic
(50%)Price assumption: $1,200 gold. Price assumption: $1,200 gold.
Open pit cut-off grades range from 0.374 to
0.384 g/t Au.
Cut-off grades range from 0.37 g/t Au
inside pit to 1.0 g/t Au outside or below
pit.
Metallurgical recoveries for gold range
from 87% to 96.7% depending on zone.
Underground Cut-off grade at Odyssey is
1.15 g/t Au (stope optimized) and at East
Malartic Underground is 1.25 g/t Au (stope
optimized).
Cerro MoroPrice assumption: $1,250 gold and $18.00
silver.
Price assumption: $1,600 gold and $24.00
silver.
Open pit cut-off at 3.27 g/t gold and
Underground cut-off at 5.71 g/t gold.3.0 g/t Aueq cut-off.
Metallurgical recoveries average 95% for
gold and 93% for silver.
Chapada
Chapada ZonePrice assumption: $1,250 gold, $3.00
copper.
Price assumption: $1,600 gold , $4.00
copper.
Open pit cut-off at $4.06/t (Main Pit,
Corpo Sul, Cava Norte and Sucupira).
Open pit cut-off at $4.06/t (Chapada pits
and Suruca SW).
Metallurgical recoveries at Chapada are
dependent on zone and average 83.11% for
copper and 56.94% for gold.
Metallurgical recoveries at Chapada are
dependent on zone and average 83.11% for
copper and 56.94% for gold.
Suruca Zone Price assumption: $1,300 gold. Price assumption: $1,600 gold.
Cut-off grade 0.19 g/t gold for Suruca
oxide.
Cut-off grade 0.16 g/t gold for Suruca
oxide.
Cut-off grade 0.3 g/t gold for Suruca
sulfide.
Cut-off grade 0.23 g/t gold for Suruca
sulphide.
Metallurgical recoveries for Suruca oxide
average 85% for gold.
Metallurgical recoveries for Suruca oxide
average 85% for gold.
Metallurgical recoveries for Suruca
sulphide average 88% for gold.
Metallurgical recoveries for Suruca
sulphide average 88% for gold.
El PeñónPrice Assumption:$1,250 gold, $18.00
silver.
Price Assumption:$1,600 gold, $24.00
silver.
Open Pit cut-off at 1.75 g/t gold
equivalent.
Underground cut-off at 2.78 g/t gold
equivalent except for Pampa Agusta Victoria
(2.88 g/t), Chiquilla Chica (2.87 g/t),
Laguna (2.85 g/t ).
Underground cut-off ranging from 3.57 g/t
gold equivelent to 3.70 g/t gold
equevalent.
and Fortuna-Dominador zones (2.84 g/t).
Mill recoveries of 95% and 86.5% used for
Mineral Resource Estimation.
Low grade stockpiles cut-off 0.95 g/t gold
equivalent.
Mineral Resources contained in tailings and
stockpiles reported at cut-offs of 05.0 g/t
and 0.79 g/t gold equivalent respectively.
Metallurgical recoveries for open pit ores
range from 89.0% to 95.6% for gold and
from 80.7% to 97.7% for silver.
Metallurgical recoveries range from 87.2%
to 99.0% for gold and from 59.8% to 92.6%
for silver.
Metallurgical recoveries for underground
ores range from 87.2% to 99.0% for gold
and from 59.8% to 92.6% for silver.
Metallurgical recoveries for tailings
estimated to be 60% for gold and 30% for
silver.
Metallurgical recoveries for low grade
stockpiles are 95.2% for gold and83.0%
for silver.
Metallurgical recoveries forstockpiles
estimated to be 88.0% for gold and 80.8%
for silver.
Jacobina Price assumptions: $1,250 gold. Price assumptions: $1500 gold.
Underground cut-off grade is 1.20 g/t gold.Underground cut-off grade is 1.0 g/t gold
with a minimum mining width of 1.5 meters.
Metallurigical recovery is 96%. Metallurigical recovery is 96%.
Jeronimo (57%) Price Assumption:$900 gold.
Cut-off grade at 2.0 g/t gold. Cut-off grade at 2.0 g/t gold.
Metallurgical recovery for gold is 86%.
La Pepa N/A Price Assumption: $780 gold.
cut-off grade at 0.30 g/t gold.
Lavra Velha N/A Price assumption: $1,300 gold and $3.50
copper.cut-off grade at 0.2g/t gold and 0.1%
copper.
Minera Florida Price assumption: $1,250/oz gold,
$18.00/oz silver and $1.25/lb zinc.
Price assumption: $1,250/oz gold,
$18.00/oz silver and $1.25/lb zinc.
Underground cut-offs for Las Petaguas Zone
USD90.75/t and for the Core Mine Zones
USD94.79/t.
Underground cut-off grade is 2.50 g/t
gold.
Metallurgical recoveries are 90.16% for
gold, 52.31% for silver and 68.80% for
zinc.
Metallurgical recoveries are 90.16% for
gold, 52.31% for silver and 68.80% for
zinc.
Monument Bay N/A Price Assumption: $1,200 gold.
Cut-off grades are 0.4 g/t gold and 0.7
g/t gold for the open pits and 4.0 g/t gold
for underground.
Suyai N/A 5.0 g/t Au cut-off inside mineralized
wireframe modeling.
Agua Rica Price assumption: $1,000/oz gold, $2.25/lb
copper, $17.00/oz silver and $12.00/lb
molybdenum.
Cut-off grade at 0.2% Copper.
Metallurgical recoveries are 84.9% for
copper, 52.7% for gold, 67.6% for silver,
65.9% for zinc and 68.0% for molybdenum.
Canadian MalarticSylvie Lampron, Canadian Malartic
Corporation
Pascal Lehouiller, P. Geo, OGQ, Canadian
Malartic Corporation
Chapada Luiz Pignatari, EDEM Engenharia Felipe Machado de Araújo, Yamana Gold Inc.
El Peñón Sergio Castro, Yamana Gold Inc. Jorge Camacho, Yamana Gold Inc.
2. All Mineral Reserves and Mineral Resources have been calculated in accordance with the standards of the
Canadian Institute of Mining, Metallurgy and Petroleum and NI 43-101, other than the estimates for the
Alumbrera mine which have been calculated in accordance with the JORC Code which is accepted under NI 43-101.
Property Qualified Persons for Mineral Reserves Qualified Persons for Mineral Resources
5. Mineral Reserves and Mineral Resources are reported as of December 31, 2018.
3. All Mineral Resources are reported exclusive of Mineral Reserves.
4. Mineral Resources which are not Mineral Reserves do not have demonstrated economic viability.
6. For the qualified persons responsible for the Mineral Reserve and Mineral Resource estimates for Yamana's
material properties, see the qualified persons list below.