Embed Size (px)
Citation preview
HAL Id: hal-01278585https://hal.archives-ouvertes.fr/hal-01278585
Submitted on 24 Feb 2016
HAL is a multi-disciplinary open accessarchive for the deposit and dissemination of sci-entific research documents, whether they are pub-lished or not. The documents may come fromteaching and research institutions in France orabroad, or from public or private research centers.
L’archive ouverte pluridisciplinaire HAL, estdestinée au dépôt et à la diffusion de documentsscientifiques de niveau recherche, publiés ou non,émanant des établissements d’enseignement et derecherche français ou étrangers, des laboratoirespublics ou privés.
CSR related management practices and FirmPerformance: An Empirical Analysis of theQuantity-Quality Trade-off on French Data
Patricia Crifo, Marc-Arthur Diaye, Sanja Pekovic
To cite this version:Patricia Crifo, Marc-Arthur Diaye, Sanja Pekovic. CSR related management practices and FirmPerformance: An Empirical Analysis of the Quantity-Quality Trade-off on French Data. InternationalJournal of Production Economics, 2016, 171 (3), pp.405-416. <10.1016/j.ijpe.2014.12.019>. <hal-01278585>

Montréal
Juillet 2014
© 2014 Patricia Crifo, Marc-Arthur Diaye, Sanja Pekovic. Tous droits réservés. All rights reserved.
Reproduction partielle permise avec citation du document source, incluant la notice ©.
Short sections may be quoted without explicit permission, if full credit, including © notice, is given to the source.
Série Scientifique
Scientific Series
2014s-34
CSR related management practices and Firm
Performance: An Empirical Analysis of the
Quantity-Quality Trade-off on French Data
Patricia Crifo, Marc-Arthur Diaye, Sanja Pekovic

CIRANO
Le CIRANO est un organisme sans but lucratif constitué en vertu de la Loi des compagnies du Québec. Le financement de
son infrastructure et de ses activités de recherche provient des cotisations de ses organisations-membres, d’une subvention
d’infrastructure du Ministère de l'Enseignement supérieur, de la Recherche, de la Science et de la Technologie, de même que
des subventions et mandats obtenus par ses équipes de recherche.
CIRANO is a private non-profit organization incorporated under the Québec Companies Act. Its infrastructure and research
activities are funded through fees paid by member organizations, an infrastructure grant from the Ministère de
l'Enseignement supérieur, de la Recherche, de la Science et de la Technologie, and grants and research mandates obtained
by its research teams.
Les partenaires du CIRANO
Partenaire majeur
Ministère de l'Enseignement supérieur, de la Recherche, de la Science et de la Technologie
Partenaires corporatifs
Autorité des marchés financiers
Banque de développement du Canada
Banque du Canada
Banque Laurentienne du Canada
Banque Nationale du Canada
Bell Canada
BMO Groupe financier
Caisse de dépôt et placement du Québec
Fédération des caisses Desjardins du Québec
Financière Sun Life, Québec
Gaz Métro
Hydro-Québec
Industrie Canada
Intact
Investissements PSP
Ministère des Finances et de l’Économie
Power Corporation du Canada
Rio Tinto Alcan
Ville de Montréal
Partenaires universitaires
École Polytechnique de Montréal
École de technologie supérieure (ÉTS)
HEC Montréal
Institut national de la recherche scientifique (INRS)
McGill University
Université Concordia
Université de Montréal
Université de Sherbrooke
Université du Québec
Université du Québec à Montréal
Université Laval
Le CIRANO collabore avec de nombreux centres et chaires de recherche universitaires dont on peut consulter la liste sur son
site web.
ISSN 2292-0838 (en ligne)
Les cahiers de la série scientifique (CS) visent à rendre accessibles des résultats de recherche effectuée au CIRANO afin
de susciter échanges et commentaires. Ces cahiers sont écrits dans le style des publications scientifiques. Les idées et les
opinions émises sont sous l’unique responsabilité des auteurs et ne représentent pas nécessairement les positions du
CIRANO ou de ses partenaires.
This paper presents research carried out at CIRANO and aims at encouraging discussion and comment. The observations
and viewpoints expressed are the sole responsibility of the authors. They do not necessarily represent positions of
CIRANO or its partners.
Partenaire financier

CSR related management practices and Firm
Performance: An Empirical Analysis of the Quantity-
Quality Trade-off on French Data *
Patricia Crifo †, Marc-Arthur Diaye
‡, Sanja Pekovic
§
Résumé/abstract
This paper analyzes how different combinations of Corporate Social Responsibility (CSR) dimensions
affect corporate economic performance. We use various dimensions of CSR to examine whether firms
rely on different combinations of CSR, in terms of quality versus quantity of CSR practices. Our
empirical analysis based on an original database including 10,293 French firms shows that different
CSR dimensions in isolation impact positively firms’ profits but their effect in term on intensity varies
among CSR dimensions. Moreover, the findings on the qualitative CSR measure, based on interaction
between its dimensions, show that the substitutability of these dimensions is highly significant for firm
performance. However, in terms of the intensity, those interactions produce differential effects.
Mots-clés/Key words: corporate social responsibility, firm performance, substitutability,
complementarity, trade-off, simultaneous equations models.
* Acknowledgements: Support of the Chair for Sustainable Finance and Responsible Investment (Toulouse-IDEI
and Ecole Polytechnique) is gratefully acknowledged by Patricia Crifo. Marc-Arthur Diaye and Sanja Pekovic
gratefully acknowledge the support from the AFNOR “Performance des Organisations” endowment in
collaboration with the University Paris-Dauphine Foundation. Marc-Arthur Diaye acknowledges the support of
the Rennes Metropole “Allocation d’Installation Scientifique” and the Commissariat General à la Stratégie et à la
Prospective. The authors are also grateful to Marcus Wagner, Mareva Sabatier and the seminar participants at the
University of Wuerzburg, the University of Annecy and the ESG Management School, for useful comments and
suggestions. † University of Paris West, EcolePolytechnique (Palaiseau, France) and CIRANO (Montreal, Canada).
[email protected] ‡ University Evry Val d’Essonne (EPEE). [email protected].
§ University of Paris-Dauphine (DRM-DMSP-CNRS UMR 7088). [email protected].

2
INTRODUCTION
In all OECD countries, firms are making a lot of effort to be, or at least to appear, socially
responsible. In 2005, for instance, 52% of the top 100 corporations in the 16 most
industrialized countries published reports on their corporate and socially responsible
activities. In fact, since the late 1990s, many industrialized countries have adopted laws
requiring firms (listed and/or non listed) to publish reports detailing their exposure to
environmental, social and governance risks and how they address these risks.1
Nevertheless, Corporate Social Responsibility (CSR) means socially and environmentally
friendly actions not only required by law, but going beyond compliance, privately providing
public goods or voluntarily internalizing externalities. According to the European
Commission (2007), being socially responsible in fact means that, beyond legal requirements,
firms accept to bear the cost of more ethical behavior by voluntarily committing, for instance,
to improving employment conditions, banning child labor and not working with countries that
do not respect human rights, protecting the environment and investing in equipment to reduce
their carbon footprint, developing partnerships with NGOs, providing funds to charity, etc.
CSR strategies would in fact allow firms to maximize value and to minimize risk in the long
run, to respond to increased competitive pressure and market differentiation, and such
strategies would more generally take into account the growing demands of their stakeholders
(customers, consumers, employees, investors). But do firms actually benefit from CSR
strategies? Can it be profitable to invest in responsible practices beyond legal obligations? In
1Laws “New economic regulation” (2001) and “Grenelle II” (2010) in France, “Sarbanes-Oxley” (2002) and
Greenhouse gas reporting rule (2010) in the US, “Social responsibility for large businesses” (2008) in Denmark,
“Sustainability reporting” (2013) in Norway, “Companies Act” (2006) and “Carbon reduction commitment”
(2010) in the UK, “Sustainable economy” (2011) in Spain etc.
3
other words, what are the links between CSR and corporate economic performance? In turn,
what is the value of CSR strategies, in particular with respect to social, environmental or
market behavior?
The impact of Corporate Social Responsibility on corporate economic performance has
received considerable attention in the literature over the past three decades (see e.g. Margolis
et al., 2009 for comprehensive reviews). However, even if several studies using meta-analyses
(Margolis et al., 2009; Margolis and Walsh, 2003; Orlitzky et al., 2003) conclude that the
relationship between CSR and firms is non-negative, there is no unanimity so far. Social
responsibility rather seems to have an ambiguous and complex impact on firm performance
though no true causality has been proved yet. While some research argues that investment in
social responsibility raises a firm’s costs, which makes it less competitive (Friedman, 1970;
Brummer, 1991; McWilliams and Siegel, 1997), other research has suggested that by
investing in social performance, a firm can achieve competitive advantage by attracting
resources and quality employees more easily, differentiating its products and services,
reducing its exposure to risk, etc. (Cochran and Wood, 1984; Turban and Greening, 1996;
Waddock and Graves, 1997; McWilliams and Siegel, 2001; Godfrey, 2004).
According to Cavaco and Crifo (2013) one reason for this absence of consensus lies in the
possibility of a quantity-quality trade-off between the various dimensions of corporate
responsibility, where quantity refers to the effect of the CSR dimensions in isolation and taken
together and quality corresponds to interactions between various CSR dimensions. A firm’s
CSR policy is multi-dimensional and includes environmental, social and business behavior
factors. Consequently, using a single item as a proxy for generic CSR could cause
fundamental uncertainty about the relationship between CSR and firm performance (e.g.
Surroca, Tribò and Waddock, 2010). In this sense, Mackey, Mackey and Barney (2007),
4
Brammer and Milligton (2008) and Barcos et al. (2013) suggest that some forms of socially
responsible behavior are positively associated with firm performance while other are not.
Barnett and Solomon (2006) show that CSR investments vary by the intensity of a firm’s
social screening and also in the types of social screens that a firm employs. Hence, there is a
need to break down the CSR among the different dimensions in order to study its possible
differential impact on a firm performance (Barcos et al., 2013). Moreover, how those various
dimensions interact as inputs of firm performance is important. In a context of limited
resources, firms may well face a quantity (specific practices or number of practices employed)
or quality (interactions among practices employed) trade-off effect, suggesting a complex and
ambiguous impact of various CSR combinations on business performance. Thus, we test
whether such a quantity-quality trade-off emerges using data on French firms from the
Organizational Change and Computerization survey (COI, 2006).
To measure CSR, existing studies often focus on CSR scores or ratings provided by extra-
financial rating agencies like KLD in the US or Vigeo in Europe. This study uses secondary
data on CSR performance. “Secondary data is useful not only to find the information to solve
our research problem, but also better understand and explain our research problem” (Ghauri
and Gronhaug, 2005). Actually, the interest of the COI survey is that it provides quantitative
metrics of CSR related management practices rather than extra-financial evaluation. As
emphasized by Chatterji, Levine and Toffel (2009), extra-financial ratings are rarely evaluated
and have been criticized for their own lack of transparency. Therefore, our measures of CSR
related management practices offer a different but complementary approach to such social and
environmental ratings as they rely on actual practices implemented by the firms, rather than
evaluations (scores or ratings) based on past and/or expected future CSR behaviors. The
limitation of our variables is that we do not cover CSR management practices related to
human rights, community involvement or corporate governance. In this sense, our research is

5
more focused on stakeholder oriented CSR practices, notably towards employees, or
customers and suppliers (Barcos et al., 2013. Yet, our database relies on a representative
sample of more than 10,000 French firms, whereas extra-financial agencies cover only several
hundred (multinational) firms.
Our results indicate that CSR management related practices in isolation impact positively on
corporate performance measured by a firm’s profit, while an aggregate CSR indicator
(measuring a purely quantitative strategy) is positively associated with firm profit only when
having at least two dimensions. Moreover, the qualitative CSR measure based on interaction
among its dimensions shows that the substitutability of these dimensions is highly significant
for firm performance. It is worth noting that different isolation forms and interactions of CSR
dimensions produce different effects on firm performance in terms of intensity.
We believe that these results contribute to the CSR literature in several ways. First, rather than
simply investigating the impact of one CSR dimension on firm performance, we analyze how
different combinations of CSR dimensions affect firm performance measured by profit.
Second, we use data on a representative sample of French firms, which permits us to construct
two types of variables from the aforementioned questions. Additionally, employing this data
allows us to control for a very detailed set of firm characteristics and features in order to
properly isolate the effect on firm performance of the quantity-quality trade-off between CSR
dimensions, to address the reverse-causality issues and to properly correct for the endogeneity
of CSR variables. Finally, using a French database is appealing since empirical studies on
CSR and firm business performance refer mainly to experience in US firms.
This paper is organized as follows. Section 2 reviews the core of our analysis while section 3
builds testable hypotheses. Section 4 presents the data and method. Section 5 presents our
empirical results and discusses the findings, and section 6 concludes the paper.
6
HYPOTHESES
It is becoming conventional wisdom today to define corporate social responsibility through
the lenses of three main dimensions: environmental, social and governance (the so-called ESG
factors). In turn, and drawing on previous research (e.g. Waddock and Graves, 1997; Cavaco
and Crifo, 2013; Barcos et al., 2013), we define CSR relying on three main categories:
environmental performance, human resource related practices, and relationships with
customers & suppliers.
Isolated and Aggregated Effect of CSR Dimensions on Firm Performance
Previous studies underline the differential effects of CSR dimensions on firm performance
(e.g. Brammer and Pavelin, 2006; Barcos et al., 2013). Therefore, it is likely that the impact
of CSR on firm performance is contingent upon which dimension of social responsiveness is
taken into consideration. Furthermore, the issue of whether each of our three dimensions of
CSR (environmental performance, human resources performance, and relationships with
customers & suppliers) is related to firm performance is far from resolved. For instance,
several studies find a positive relationship between environmental practices or performance
and economic performance (see e.g. Delmas and Pekovic, 2013; Lo et al., 2012), but other
results appear to be negative or non-significant (Barla, 2007; Filbeck and Gorman, 2004). The
same types of results may be found for human resource measures. Improving human resource
practices may appear to affect performance positively (Huselid, 1994) or negatively
(Gimenez, Sierra and Rodon, 2012). For the customer & supplier dimension, many scholars
note its importance for firms and an increasing number of recent studies are now examining
whether investment in customer and supplier policies makes business sense. Results appear
mixed as well (Zhu and Nakata, 2007; Yeng, 2008; Lin et al., 2005; Reitzig and Wagner,
7
2010). For instance, Yeung (2008) concludes that strategic supply management leads to
improved on-time shipments and reduced operational costs, and leads to customer satisfaction
and improved business performance. On the other side, investment in better relations with
suppliers may create for a firm the opportunity costs of non-learning, which could negatively
affect its performance (Reitzig and Wagner, 2010). Inherently a multi-dimension construct,
there is no reason to believe that one dimension (say the customer & supplier dimension)
affects firm performance in the same direction as another one (say environmental). In fact,
different costs and revenues characterize management practices, affecting firm performance
differently.
Thus, the first step in order to understand better the relationship between CSR and firm
performance is to open the black box by examining how CSR dimensions in isolation and in
aggregation influence firm performance. Although the literature argues that the relationship
between different dimensions of CSR and firm performance is not straightforward, extensive
research conducted over the past 30 years is in line with studies that tend to show a positive
relationship, or at least not a negative one, between CSR dimensions and financial
performance (Margolis et al., 2009; Margolis and Walsh, 2003; Orlitzky et al., 2003).
Therefore we formulate the following hypothesis:
Hypothesis 1A: Isolated CSR dimensions exert a positive impact on firm performance.
Even if creating an aggregated measure of CSR hides the individual effects of each CSR
dimension, using an aggregated construct of CSR may facilitate inter-firm comparison on the
level of CSR established inside firms. However, previous research using aggregated CSR
constructs presents inconsistency in findings concerning the relationship between CSR and
firm performance (e.g. Waddock and Graves, 1997; Surroca et al., 2010). Moreover, given the
8
importance of each dimension of CSR for firm performance, we expect that overall the firm’s
tendency to demonstrate its social responsibility is positively associated with the firm’s
performance, and propose the following hypothesis:
Hypothesis 1B: Aggregate measure of CSR exerts a positive impact on firm performance.
The Complementarity or Substitutability Effect of CSR Dimensions
The contradictory results or the absence of consensus concerning the relationship between
CSR and firm performance may be explained by the role of interactions among the various
components of CSR. Taking into account the interaction among various CSR dimensions
reveals that complex mechanisms are at work in terms of responsible management practices,
with combinations exhibiting both complementarity and substitutability (see Cavaco and
Crifo, 2013). It is important to point out that the definitions of complementarity and
substitutability that we use are borrowed from Athey and Stern (1998), and they are actually
close to the notions of supermodularity and submodularity in game theory. The definitions of
complementarity and substitutability by Athey and Stern (1998) might seem counterintuitive
with respect to conventional wisdom (at least concerning complementarity between goods)
which associates complementarity with positive correlation and substitutability with negative
correlation. Following Athey and Stern (1998), two CSR practices can both be positively
correlated and substitutable. More precisely, having more than one CSR practice creates a
complementary effect if the magnitude of the performance effect of these management
practices altogether is strictly larger than the sum of the marginal effects from adopting only
one practice (Ichniowski et al., 1997). In this sense, complementarity indicates that firms are
likely to combine a set of practices since the benefits of such a complete pattern of practices
are superior to the sum of the individual benefits (Whittington et al., 1999). A reason could be
9
the existence of a synergistic effect of bundling practices together. What type of CSR
practices can we expect to be complementary ? The Stakeholder theory of the firm argues that
managing relationships between primary stakeholders (suppliers of capital, labor and other
resources, customers and suppliers) can result in much more than just their continued
participation in the firm, and yield long term competitive advantage (Hillman and Keim,
2001). Hence, we may expect complementarities between CSR related management practices
towards primary stakeholders like employees, customers and suppliers.
A substitutability effect between CSR practices means exactly the opposite here. One can
explain substitutability by the fact that although CSR dimensions have the same final
objective, individually they act differently. For instance, one firm can have great relations
with its customers but also has a reputation for polluting the environment. The good relations
with customers could not compensate for the environmental degradation. In this sense, Berens
et al. (2007), examining the effect on product preferences, find that a poor corporate ability
could not be compensated by good CSR. Moreover, based on decision-making theory, it is
argued that in forming a general evaluation, negative attributes tend to outweigh positive
attributes (e.g. Baumeister et al., 2001). Thus, we may argue that existing CSR dimensions
inside a firm cannot compensate for missing CSR dimensions. Additionally, according to
decision-making theory (see the so-called Choquet integral, Grabisch 1997), when two
dimensions share some similar “substantial” attributes, then the interaction between these
dimensions leads to substitutability. For instance, green and customer & supplier dimensions
share some similar “substantial” attributes in the sense that it is difficult to implement a green
dimension within a firm without implementing some attributes of the customer & supplier
dimension (Lehtonen, 2004; OCDE, 20062). Indeed, environmental practices have become
critical to a firm’s relationships with different stakeholder groups such as customers and
2http://www.oecd.org/environment/36958774.pdf
10
suppliers (Barnett and Salomon, 2006; Grolleau, Mzoughi and Pekovic, 2007). As a
consequence, when implementing both dimensions, the effect on the firm’s performance will
be equal to the sum of the effect of the green dimension and the effect of the attributes of the
customer & supplier dimension that are not shared by the green dimension. On the contrary, if
two dimensions do not share similar “substantial” attributes, then the interaction between
these dimensions leads to complementarity or additivity. Finally we can use also the
stakeholder theory of the firm in order to predict the complementarity or substitutability of
our three CSR dimensions. According to this theory, using corporate resources to pursue
issues that are not directly related to the relationship with primary stakeholders may not lead
to sustained competitive advantage (Hillman and Keim, 2001). Here, this would mean that
there should exist some trade-offs (substitutability) between primary and non-primary
stakeholders (Cavaco and Crifo, 2013), that is between CSR practices towards employees, and
customers and suppliers on the one hand; and towards the environment on the other hand. In
fact, though the environment may be quoted as a stakeholder, it is often difficult to identify a
direct spokesperson and therefore to embed it into the firm’s primary stakeholder category.
To conclude we expect a complementarity effect between human resources and customer &
supplier dimensions3; and substitutability effects between green and human resources
dimensions; green and customer & supplier dimensions.
We formulate the following hypothesis:
Hypothesis 2: The interaction among different CSR dimensions generates:
3Even though one could argue that a firm’s customer and supplier orientation strategy is based on some social
attributes, we consider that they are not strong enough to produce the substitutability effect between social and
customer & supplier dimensions. For instance, as argued by Ferrell (2004), in a highly competitive market, a
firm could both have anti-social behavior and be strongly customer oriented.
11
♦substitutability effects between green and HR; green and customer & supplier; green, HR,
customer & supplier;
♦complementarity effects between HR and customer & supplier.
DATA AND METHOD
Data
The data is extracted from the French Organizational Changes and Computerization (COI)
2006 survey.4The COI survey is a matched employer-employee dataset on organizational
change and computerization. Researchers and statisticians from the National Institute for
Statistics and Economic Studies (INSEE), the Ministry of Labor, and the Center for Labor
Studies (CEE) created this survey. The survey contains about 13,790 private sector firms with
at least 10 employees each. It is a representative population of French firms from all business
sectors except agriculture, forestry and fishing. Each firm filled in a self-administered
questionnaire concerning the utilization of information technologies and work organizational
practices in 2006, and changes that had occurred in those areas since 2003. Firms were also
interviewed on the economic goals driving the decision to implement organizational changes
and the economic context in which those decisions were made.
In order to obtain information on export volumes and profitability, the COI survey was
merged with another database called the Annual Business Survey (EAE, 2003 and 2006).5 We
use two editions of the EAE survey from 2003 (to obtain information on exports volumes and
4More details about the design and scope of this survey are available on www.enquetecoi.net: Survey COI-TIC
2006-INSEE-CEE/Treatments CEE.
5More details about the design and scope of this survey are available on
http://www.insee.fr/en/methodes/default.asp?page=definitions/enquete-annuelle-entreprises.htm
12
sales) and from 2006 (to obtain information on profit). As a result, our sample includes
10,293 firms.
Dependent and Main Independent Variables
We use as dependent variable firm’s profit per employee. Existing studies often rely on
accounting measures of financial performance (e.g. return on asset, return on equity, return on
capital employed, return on sales) or market-based measures of financial performance (e.g.
Tobin’s q), mainly because of data availability. Nevertheless, a few papers rely on firm
profitability indicators. For instance, Brammer and Pavelin (2006) use the ratio of pre-tax
profits to total assets and Fernandez-Kranz and Santalo (2010) use average profits (in dollars)
to control for firm profitability in their empirical estimations.
Our analysis provides a different but complementary approach to papers focusing on
accounting or market measures. In fact, accounting measures are backward looking and
capture past financial performance, but are subject to bias from managerial manipulation and
differences in accounting procedures. Market measures are forward looking and are less
dependent on accounting procedures but only represent the investor's evaluation of the ability
of a firm to generate future economic earnings. Basically, profitability indicators (like profit
margins or ratio) are usually considered as reflecting productivity whereas economic
profitability would be captured by accounting measures, and market value would be captured
by market-based measures.
Concerning the main independent variables, the COI survey allows reliance on direct
indicators of CSR related management practices grouped under three dimensions. More
precisely, like Barcos et al. (2013) we use three CSR dimensions: green practices, human
resources practices, and business behavior towards customers and suppliers. This approach is
consistent with existing studies, which measure CSR with extra-financial ratings either
13
through scores (e.g. continuous variable over the 0-100 interval) or through relative rankings,
represented by a dummy variable that takes the value of 1 (respectively 0) if the firm is ranked
above (respectively below) the sectoral average on the corresponding CSR dimension (see
Cavaco and Crifo, 2013).
Our approach offers a perspective on CSR related management practices different to studies
based on extra-financial scores or ratings provided by agencies such as KLD in the US or
Vigeo in Europe. As emphasized in Chatterji, Levine and Toffel (2009), extra-financial rating
examines firms’ environmental and social management activities and past performance, as
well as future outlook. Such ratings aim to provide socially responsible investors with
accurate information that makes transparent the extent to which firms’ behaviors are socially
responsible. They usually rely on a variety of areas of corporate social responsibility. For
instance, the European extra-financial agency Vigeo produces scores and ratings relying on
six CSR dimensions: environment, human rights, human resources, governance, business
behaviors towards customers and suppliers, and societal commitment towards local
communities. Similarly, the American extra-financial agency KLD produces “strengths” and
“concerns” relying on seven CSR dimensions: community, corporate governance, diversity,
employee relations, environment, human rights, and product and business behaviors. For each
dimension, there is a subset of criteria describing how the firm manages a particular aspect of
the CSR dimension. However, several studies have criticized the measures used in the KLD
database (e.g. Chen and Delmas, 2011).
Here, our variables may seem less complete than those based on extra-financial scores. Our
approach does not include the human rights, governance and societal commitment dimensions
simply because we do not have such information in our database. We are mainly oriented
towards stakeholder associated CSR practices (Barcos et al., 2013). Furthermore, the
advantages of the COI survey are to allow 1) the measuring of CSR directly through a CSR
14
performance measure, 2) a CSR performance measure for 10,293 firms which are
representative of French firms. As a consequence, we expect more precise estimates.
Note in addition that our four CSR related dimensions give a precise content to the
conventional definition of CSR by the European Commission as “a concept whereby
companies integrate social and environmental concerns in their business operations and in
their interaction with their stakeholders by voluntarily taking on commitments which go
beyond common regulatory and conventional requirements” (European Commission 2001).
We have matched the COI survey with the Vigeo dataset and it appears that 21 firms are in
both datasets. Within these 21 firms, we checked for the link between our CSR construction
and the Vigeo ratings. We found that our CSR construction includes a part of the information
conveyed by the Vigeo ratings.
Our CSR related dimensions are defined as follows.
Green. We use in the survey the variable denoted Green, which is a binary variable, coded 1
if the firm was registered according to one of the following standards i.e., ISO 14001
standard, organic labeling, fair trade, etc., in 2003.
Human Resources (HR). We construct a human resources indicator which presents the sum of
the following six components: (1) it is very important or important for the firm to improve
employee relations/ skills and keep its employees; (2) the firm had central databases for
human resources, training in 2003; (3) the firm had had internal and (4) external departments
focused on human resources, training since 2003; (5) the firm used the internet for employees'
learning or training in 2003. Moreover, in order to test our hypothesis concerning the
complementarity and trade-off effects between CSR dimensions, we must harmonize the
values of each CSR dimension. We solve this problem by converting the HR dimension into a
binary variable that takes the value of 1 if the HR component is equal or superior to 2.11 (the
mean of the sum of the previously mentioned components).

15
Customer & Supplier. We construct a customer & supplier indicator as the sum of eleven
following items: (1) the firm used labeling tools for goods and services in 2003; (2) the firm
was engaged in the delivery or supply of goods or services to a fixed deadline in 2003; (3) the
firm had a contact or call center for customers in 2003; (4) the firm had adopted integrated IT-
CRM in 2003; (5) the main customer demanded that the firm comply with a quality standard
or quality control procedure in 2003; (6) the firm used tools to study customer expectations,
behavior or satisfaction in 2003; (7) the firm had had internal departments focused on
improving safety and environmental issues since 2003; (8) the firm had signed contracts or
was engaged with some suppliers in long term relationships in 2003; (9) on the firm’s
demand, the main supplier complied with a quality standard or quality control procedure in
2003; (10) the main supplier had an IT system (for orders, invoices, etc.) linked to that of the
firm’s in 2003; (11) the firm was registered according to the ISO 9000 standard (quality
management).
For the Customer & Supplier dimension, we calculate the mean of the sum of these eleven
components and create a binary variable that takes the value of 1 if the customer and supplier
component is equal or superior to 4.03 (the mean value of the sum).
From these three binary CSR dimensions, we constructed two types of variables:
CSR. In order to test the effect of aggregate measure of Corporate Social Responsibility on
firm performance we create the variable CSR, which sums up the three (binary) dimensions:
(1) green; (2) HR; (3) customer & supplier. From this CSR variable which varies from 0 to 3,
we create three binary variables:
• CSR_1_0 = 1 if the firm had invested in only one CSR dimension; and = 0 if the firm
had not invested in any CSR dimensions;
16
• CSR_2_0 = 1 if the firm had invested in two CSR dimensions; and = 0 if the firm had
not invested in any CSR dimensions;
• CSR_3_0 = 1 if the firm had invested in three CSR dimensions; and = 0 if the firm had
not invested in any CSR dimensions;
Interaction. To investigate the effect of complementarity and synergies between CSR
dimensions, we create seven variables, namely:
• Interaction1_0 = 1 if the firm had invested only in green practices; and = 0 if the firm
had not invested in any CSR dimensions;
• Interaction2_0 = 1 if the firm had invested only in HR practices; and = 0 if the firm
had not invested in any CSR dimensions;
• Interaction3_0 = 1 if the firm had invested only in customer & supplier dimensions;
and = 0 if the firm had not invested in any CSR dimensions;
• Interaction4_0 = 1 if the firm had invested in both green and HR dimensions; and = 0
if the firm had not invested in any CSR dimensions;
• Interaction5_0 = 1 if the firm had invested in both green and customer & supplier
dimensions; and = 0 if the firm had not invested in any CSR dimensions;
• Interaction6_0 = 1 if the firm had invested in both HR and customer & supplier
dimensions; and = 0 if the firm had not invested in any CSR dimensions;
• Interaction7_0 = 1 if the firm had invested in all practices; and = 0 if the firm did had
not invested in any CSR dimensions.
Controls
In order to control for firm-level heterogeneity, our analysis includes variables representing
firm characteristics and features based on previous studies, specifically those relating to
17
Corporate Social Responsibility and firm performance (e.g. Capon et al., 1990; Waddock and
Graves, 1997; Russo and Fouts, 1997; McWilliams and Siegel, 2000; Brammer and Milligton,
2008).
Size. In general, a positive relationship between Corporate Social Responsibility and size is
found (e.g. Waddock and Graves, 1997; McWilliams and Siegel, 2000; Brammer and
Milligton, 2008). Substantial research has also demonstrated that firm size significantly
influences firm performance (e.g. Waddock and Graves, 1997), although the direction of its
effect is not consistent (Russo and Fouts, 1997). So we introduce firm size, which is measured
by a continuous variable representing the number of employees within the firm.
Holding. Being part of a holding company could play a considerable role in a firm’s decision
to invest in Corporate Social Responsibility since those firms might have more financial
resources available to them for investment in new practices (Pekovic, 2010). Concerning the
relation between holding and firm performance, it is argued that being part of a holding
company could improve firm performance through economies of scope (Delmas and Pekovic,
2013). Hence, we include a dummy variable that takes a value of 1 when the firm belonged to
a holding company in 2003.
Market Uncertainty. A firm that is socially responsible may be able to increase interpersonal
trust between and among internal and external stakeholders, build social capital, lower
transaction costs, and, therefore ultimately reduce uncertainty (Orlitzky and Benjamin, 2001).
Miller and Bromiley (1990) argue that uncertainty negatively influences firm performance.
Therefore, we include a binary variable representing whether the firm had been affected
strongly or very strongly by market uncertainty since 2003.
Market Conditions. Market expansion is expected to have positive influence on a firm’s
probability of investing in Corporate Social Responsibility practices (Russo and Fouts, 1997).
Drawing on Capon, Farley and Hoenig (1990), we may suppose that market growth positively
18
influences firm performance. In order to control for market conditions effects we use three
binary variables indicating different market conditions since 2003: down market, steady
market and growing market.
Export. Previous empirical studies have confirmed that export activities positively influence a
firm’s probability of investing in Corporate Social Responsibility practices (Grolleau et al.,
2007; Delmas and Montiel, 2009; Pekovic, 2010). Export activities lead to firm performance
improvements that have been identified as “learning by exporting” (Bernard et al., 2003). We
use a continuous variable representing the firm’s volume of exports divided by the firm’s
sales in 2003.
R&D. McWilliams and Siegel (2000) argue that R&D and CSR are positively correlated,
since many aspects of CSR create either product innovation or process innovation, or both. A
large amount of literature links investment in R&D to improvements in long-term economic
performance (Griliches, 1979; Capon et al., 1990). In this study, R&D is based on two
variables that indicate if a firm collaborated on its R&D activities in 2003 with private firms
or laboratories, or with universities, the national center for research (CNRS), other public
research organizations.
Advertising Intensity. A firm’s CSR orientation might not be evident to the buyer directly, so
advertising plays an important role in raising the awareness of those individuals who are
interested in buying goods with CSR attributes (McWilliams and Siegel, 2000, 2001;
Brammer and Pavelin, 2006; Brammer and Milligton, 2008). Capon et al. (1990), Russo and
Fouts (1997) and McWilliams and Siegel (2000) consider advertising intensity as an
important determinant of firm performance. To control for this effect, we create a variable
denoted Advertising Intensity, which is based on two variables that indicate whether the firm
has in 2003 a tracking or reporting system running at least quarterly to follow financial
profitability or to plan activities.
19
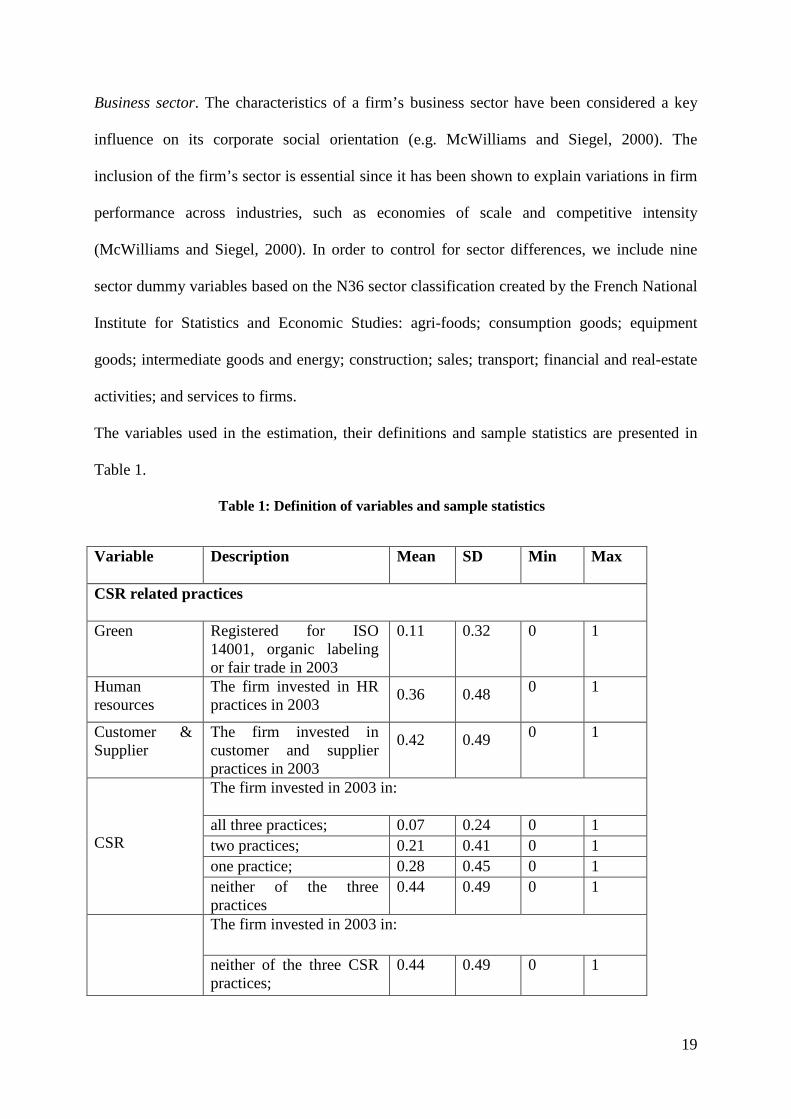
Business sector. The characteristics of a firm’s business sector have been considered a key
influence on its corporate social orientation (e.g. McWilliams and Siegel, 2000). The
inclusion of the firm’s sector is essential since it has been shown to explain variations in firm
performance across industries, such as economies of scale and competitive intensity
(McWilliams and Siegel, 2000). In order to control for sector differences, we include nine
sector dummy variables based on the N36 sector classification created by the French National
Institute for Statistics and Economic Studies: agri-foods; consumption goods; equipment
goods; intermediate goods and energy; construction; sales; transport; financial and real-estate
activities; and services to firms.
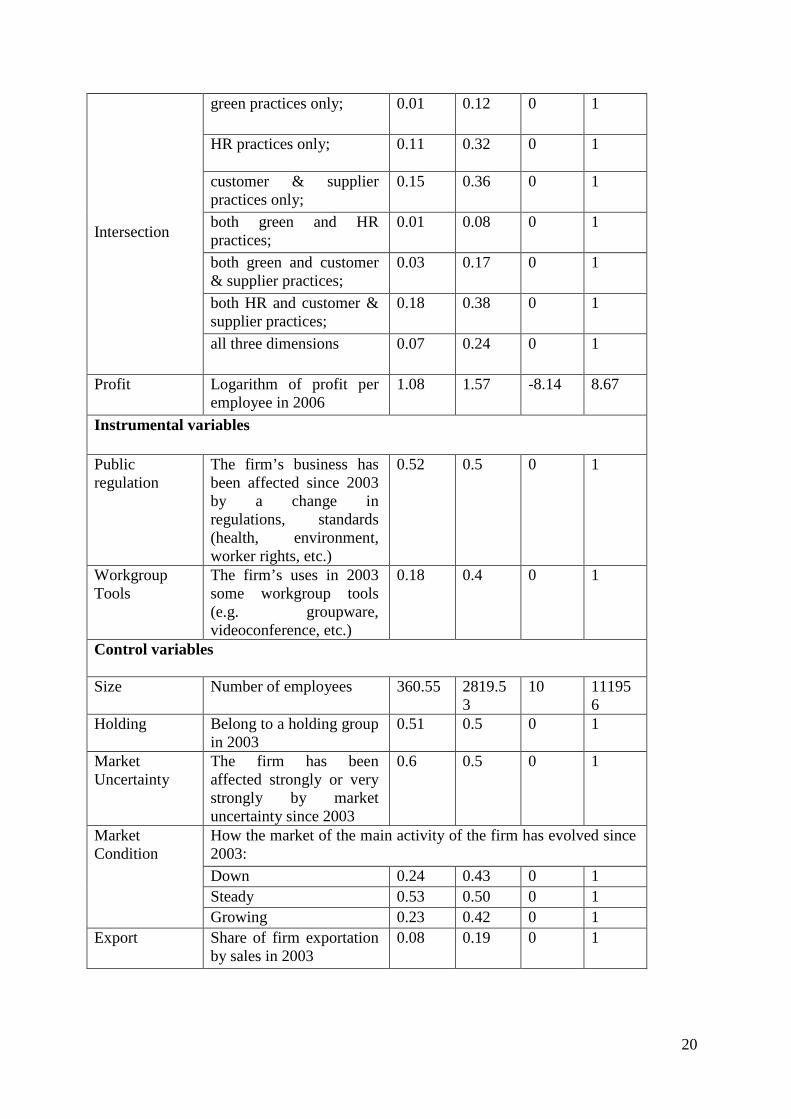
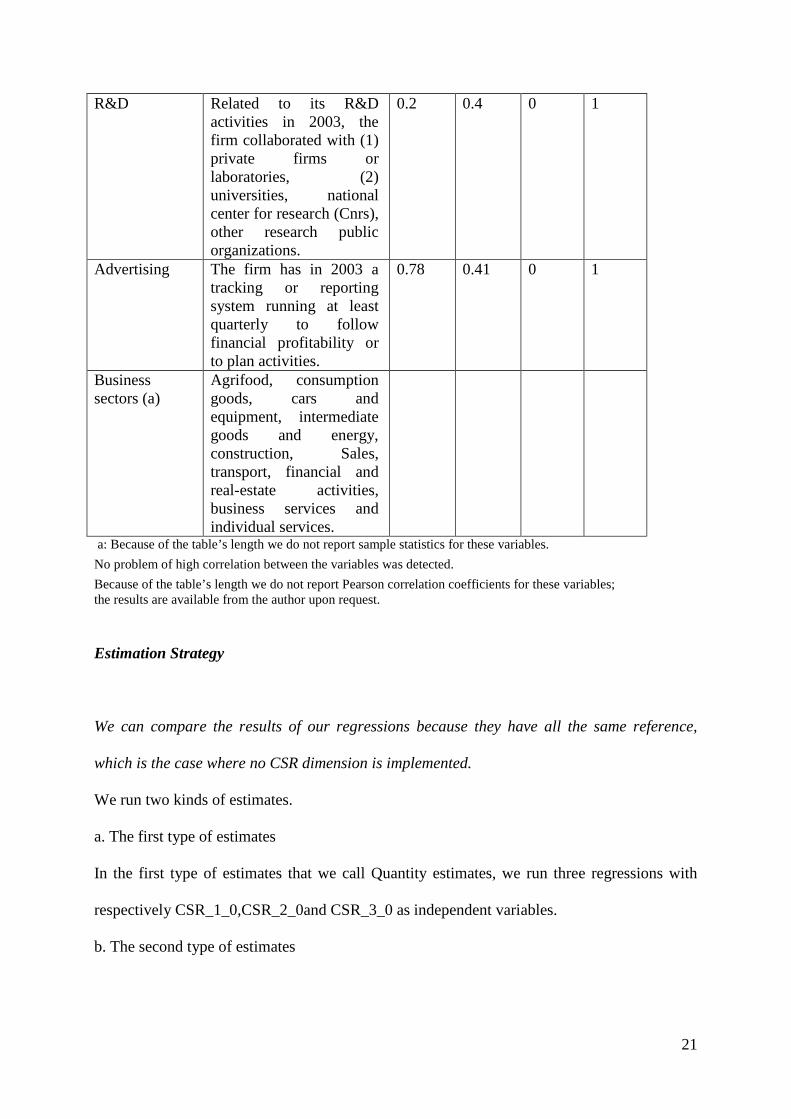
The variables used in the estimation, their definitions and sample statistics are presented in
Table 1.
Table 1: Definition of variables and sample statistics
Variable Description Mean SD Min Max
CSR related practices Green Registered for ISO
14001, organic labeling or fair trade in 2003
0.11 0.32 0 1
Human resources
The firm invested in HR practices in 2003
0.36 0.48 0 1
Customer & Supplier
The firm invested in customer and supplier practices in 2003
0.42 0.49 0 1
CSR
The firm invested in 2003 in: all three practices; 0.07 0.24 0 1 two practices; 0.21 0.41 0 1 one practice; 0.28 0.45 0 1 neither of the three practices
0.44 0.49 0 1
The firm invested in 2003 in:
neither of the three CSR practices;
0.44 0.49 0 1
20
Intersection
green practices only; 0.01 0.12 0 1
HR practices only;
0.11 0.32 0 1
customer & supplier practices only;
0.15 0.36 0 1
both green and HR practices;
0.01 0.08 0 1
both green and customer & supplier practices;
0.03 0.17 0 1
both HR and customer & supplier practices;
0.18 0.38 0 1
all three dimensions 0.07 0.24 0 1
Profit Logarithm of profit per employee in 2006
1.08 1.57 -8.14 8.67
Instrumental variables
Public regulation
The firm’s business has been affected since 2003 by a change in regulations, standards (health, environment, worker rights, etc.)
0.52 0.5 0 1
Workgroup Tools
The firm’s uses in 2003 some workgroup tools (e.g. groupware, videoconference, etc.)
0.18 0.4 0 1
Control variables Size Number of employees 360.55 2819.5
3 10 11195
6 Holding Belong to a holding group
in 2003 0.51 0.5 0 1
Market Uncertainty
The firm has been affected strongly or very strongly by market uncertainty since 2003
0.6 0.5 0 1
Market Condition
How the market of the main activity of the firm has evolved since 2003: Down 0.24 0.43 0 1 Steady 0.53 0.50 0 1 Growing 0.23 0.42 0 1
Export Share of firm exportation by sales in 2003
0.08 0.19 0 1
21
R&D Related to its R&D activities in 2003, the firm collaborated with (1) private firms or laboratories, (2) universities, national center for research (Cnrs), other research public organizations.
0.2 0.4 0 1
Advertising The firm has in 2003 a tracking or reporting system running at least quarterly to follow financial profitability or to plan activities.
0.78 0.41 0 1
Business sectors (a)
Agrifood, consumption goods, cars and equipment, intermediate goods and energy, construction, Sales, transport, financial and real-estate activities, business services and individual services.
a: Because of the table’s length we do not report sample statistics for these variables.
No problem of high correlation between the variables was detected.
Because of the table’s length we do not report Pearson correlation coefficients for these variables; the results are available from the author upon request.
Estimation Strategy
We can compare the results of our regressions because they have all the same reference,
which is the case where no CSR dimension is implemented.
We run two kinds of estimates.
a. The first type of estimates
In the first type of estimates that we call Quantity estimates, we run three regressions with
respectively CSR_1_0,CSR_2_0and CSR_3_0 as independent variables.
b. The second type of estimates
22
In the second type of estimates that we call Quality estimates, we run seven regressions with
respectively Intercation_1_0 to Interaction_7_0 as independent variables.
Tackling the endogeneity issue
It should be noted that the same factors (e.g. size, business sector, firm’s strategy, etc.) may
have an impact on firm performance and the firm’s likelihood of investing in Corporate Social
Responsibility, environmental standards, HR practices, and customer & supplier practices.
Thus, in order to correct for possible endogeneity, we rely on the Simultaneous Equations
Model (SEM), which considers environmental standards, HR practices, and customer &
supplier practices, aggregation and interactions of CSR dimensions as endogenous variables.6
This model relies on a simultaneous estimation approach in which the factors that determine
CSR dimensions, aggregation and its interactions (a) are estimated simultaneously with those
defining the firm’s profit (b). The two equations are jointly estimated using maximum
likelihood.
In the following SEM, * *1 2and Y Y are latent variables that respectively, influence the
probability of firms investing in different combinations of CSR dimensions and improving
their profitability:
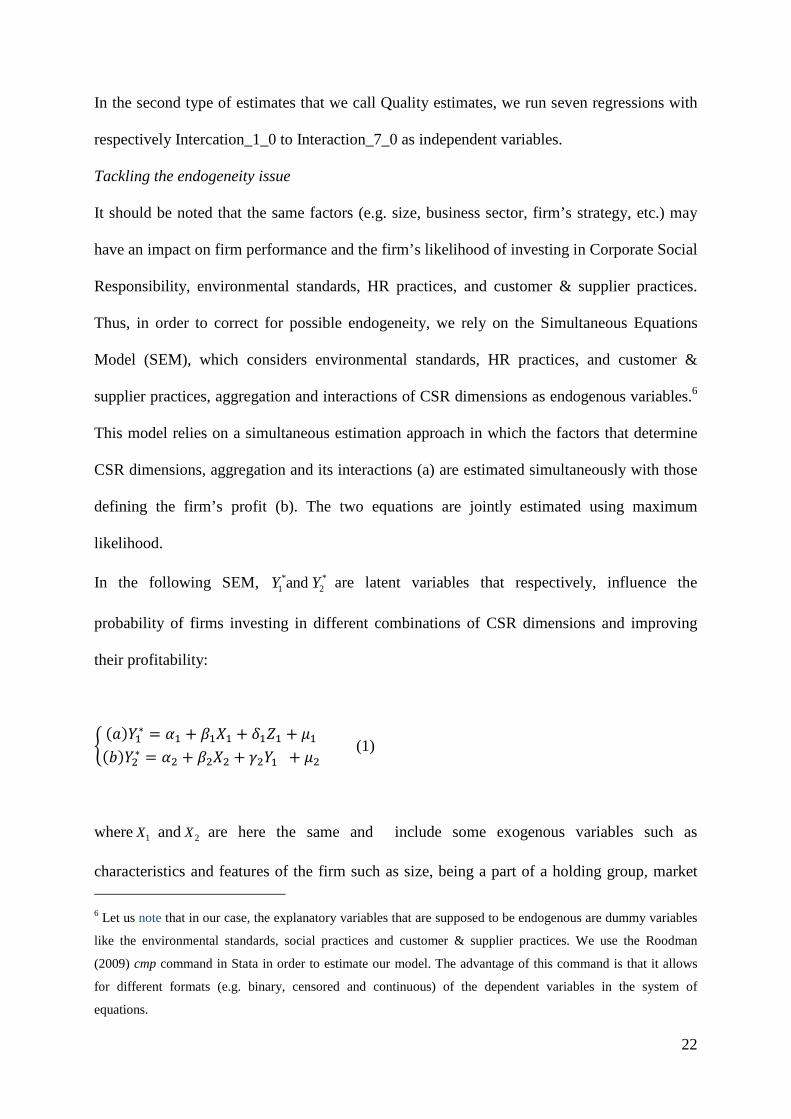
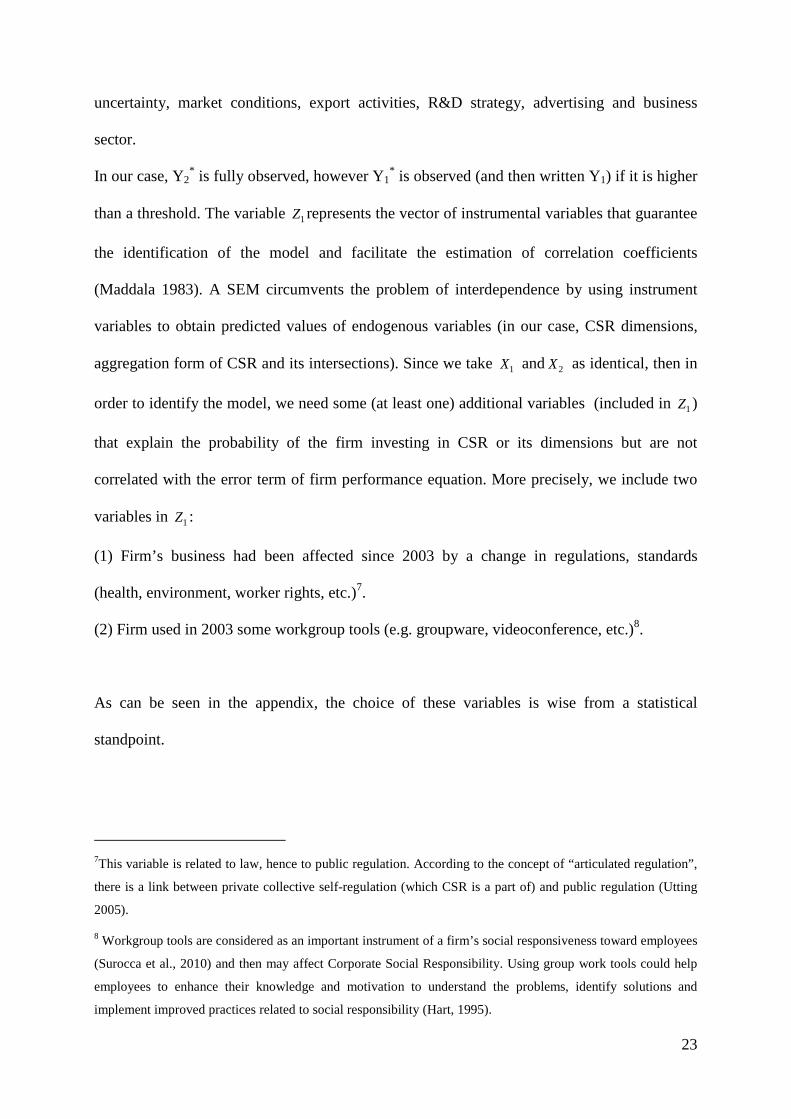
� �����∗ = � + ���� + ��� + �������∗ = � + ���� + ���� + �� (1)
where 1 X and 2 X are here the same and include some exogenous variables such as
characteristics and features of the firm such as size, being a part of a holding group, market 6 Let us note that in our case, the explanatory variables that are supposed to be endogenous are dummy variables
like the environmental standards, social practices and customer & supplier practices. We use the Roodman
(2009) cmp command in Stata in order to estimate our model. The advantage of this command is that it allows
for different formats (e.g. binary, censored and continuous) of the dependent variables in the system of
equations.
23
uncertainty, market conditions, export activities, R&D strategy, advertising and business
sector.
In our case, Y2* is fully observed, however Y1
* is observed (and then written Y1) if it is higher
than a threshold. The variable 1Z represents the vector of instrumental variables that guarantee
the identification of the model and facilitate the estimation of correlation coefficients
(Maddala 1983). A SEM circumvents the problem of interdependence by using instrument
variables to obtain predicted values of endogenous variables (in our case, CSR dimensions,
aggregation form of CSR and its intersections). Since we take 1 X and 2 X as identical, then in
order to identify the model, we need some (at least one) additional variables (included in 1Z )
that explain the probability of the firm investing in CSR or its dimensions but are not
correlated with the error term of firm performance equation. More precisely, we include two
variables in 1Z :
(1) Firm’s business had been affected since 2003 by a change in regulations, standards
(health, environment, worker rights, etc.)7.
(2) Firm used in 2003 some workgroup tools (e.g. groupware, videoconference, etc.)8.
As can be seen in the appendix, the choice of these variables is wise from a statistical
standpoint.
7This variable is related to law, hence to public regulation. According to the concept of “articulated regulation”,
there is a link between private collective self-regulation (which CSR is a part of) and public regulation (Utting
2005).
8 Workgroup tools are considered as an important instrument of a firm’s social responsiveness toward employees
(Surocca et al., 2010) and then may affect Corporate Social Responsibility. Using group work tools could help
employees to enhance their knowledge and motivation to understand the problems, identify solutions and
implement improved practices related to social responsibility (Hart, 1995).
24
Finally to address reverse-causality issues, given that strong profitability will allow a firm to
invest time and effort in CSR and its dimensions, we model lagged effects by estimating the
impact of investment in CSR in 2003 on profit in 2006.
How to check the hypotheses 1A, 1B and 2?
- In order to test the Hypothesis 1A (i.e. isolated CSR dimensions exert a positive impact on
firm performance), we take as the reference the case where no CSR dimension is implemented
and we look at the effect of (1) green practices only, (2) HR practices only, and (3) customer
& supplier only, on firm’s profit.
- In order to test the Hypothesis 1B (i.e. aggregate measure of CSR exerts a positive impact on
firm performance), we take as the reference the case where no CSR dimension is implemented
and we look at the effect on a firm’s profit of (1) having one CSR dimension, (2) having two
CSR dimensions, (3) having all three CSR dimensions.
- In order to test the Hypothesis 2 concerning complementarity and substitutability in the
sense of Athey and Stern 19989, we look at the coefficients associated with the interaction
variables when examining their impact on profit. For instance, Interaction5_0 presents the
interaction between green and customer & supplier practices. Let α5 be the associated
coefficient. If α5 > α1 + α3, where α1 and α3 are respectively the coefficient associated with
Interaction1_0 (having only green practices) and Interaction3_0 (having only customer &
supplier practices), then we conclude that there is a complementarity between the green and
the customer & supplier dimensions of CSR. Otherwise there is a substitutability.
We choose to work on sub-samples having the same reference instead of working on the
whole sample, because in the first case, Y1 , the dependent variable in the equation (a) of
9We use the definition by Athey and Stern (1998), when the choice is binary and the interaction effects are fixed
across firms.

25
model (1) is binomial (making it easier to estimate model (1) by maximum likelihood) while
in the second case it is multinomial.
EMPIRICAL RESULTS AND DISCUSSION
The main results of the SEM estimations are summarized in Tables 2 and 3. Note that the full
results (Appendix 1) also provide information about the determinants of CSR dimensions and
firm profitability. Even though we will not discuss these results, we may conclude that they
generally confirm the findings of previous studies (e.g. Capon et al., 1990; Waddock and
Graves, 1997; Russo and Fouts, 1997; McWilliams and Siegel, 2000; Brammer and Milligton,
2008).
Table 2: Qualitative estimations
Type of Interaction Sign Coefficient One dimension
Green practices only + 0.53*** HR practices only + 0.52*** Customer & Supplier practices only + 0.30*
Two dimensions Green and HR practices + 0.59* Green and Customer & Supplier practices + 0.51*** HR and Customer & Supplier practices + 0.25**
Three dimensions Green, HR, and Customer & Supplier practices + 0.43*** The reference is the case where no dimension is implemented. (*), (**), (***) indicate parameter significance at the 10, 5 and 1 per cent level, respectively. (ns) indicates Non Significant.
Table 3: Quantitative estimations
Number of Dimensions Sign Coeffcient 1 CSR dimension ns 0.45 2 CSR dimensions + 0.26*** 3 CSR dimensions + 0.43*** The reference is the case where no dimension is implemented. (*), (**), (***) indicate parameter significance at the 10, 5 and 1 per cent level, respectively. (ns) indicates Non Significant.
26
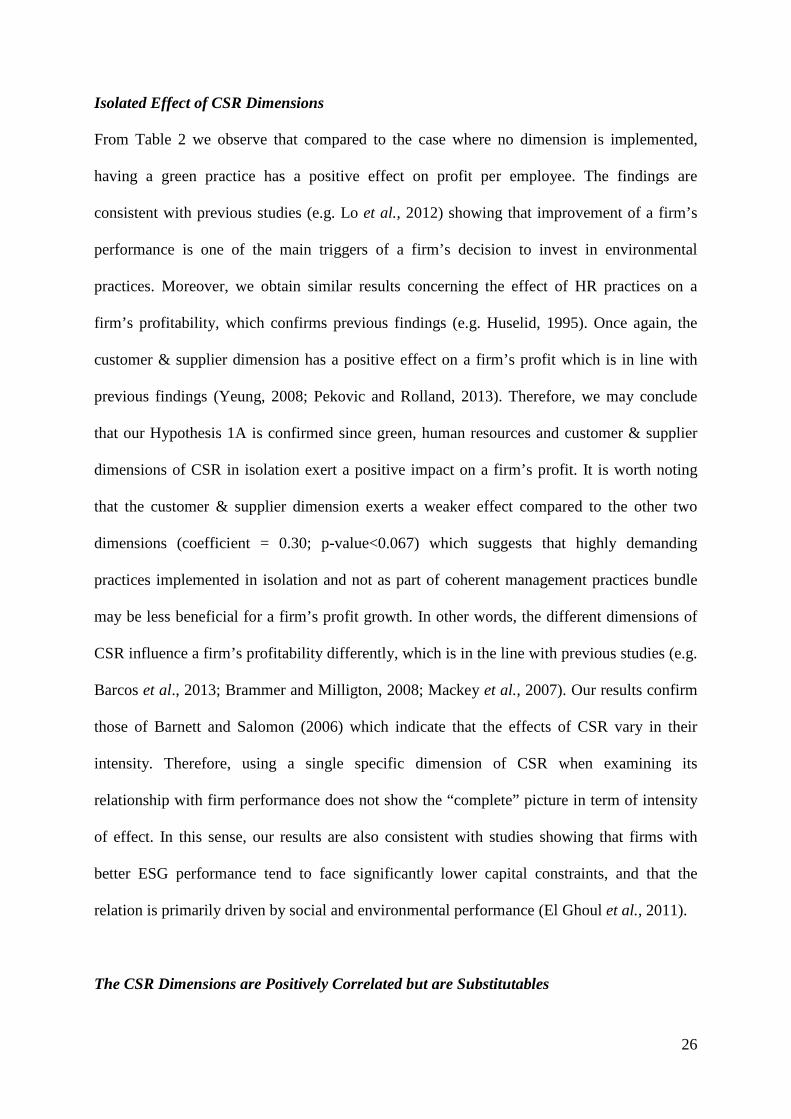
Isolated Effect of CSR Dimensions
From Table 2 we observe that compared to the case where no dimension is implemented,
having a green practice has a positive effect on profit per employee. The findings are
consistent with previous studies (e.g. Lo et al., 2012) showing that improvement of a firm’s
performance is one of the main triggers of a firm’s decision to invest in environmental
practices. Moreover, we obtain similar results concerning the effect of HR practices on a
firm’s profitability, which confirms previous findings (e.g. Huselid, 1995). Once again, the
customer & supplier dimension has a positive effect on a firm’s profit which is in line with
previous findings (Yeung, 2008; Pekovic and Rolland, 2013). Therefore, we may conclude
that our Hypothesis 1A is confirmed since green, human resources and customer & supplier
dimensions of CSR in isolation exert a positive impact on a firm’s profit. It is worth noting
that the customer & supplier dimension exerts a weaker effect compared to the other two
dimensions (coefficient = 0.30; p-value<0.067) which suggests that highly demanding
practices implemented in isolation and not as part of coherent management practices bundle
may be less beneficial for a firm’s profit growth. In other words, the different dimensions of
CSR influence a firm’s profitability differently, which is in the line with previous studies (e.g.
Barcos et al., 2013; Brammer and Milligton, 2008; Mackey et al., 2007). Our results confirm
those of Barnett and Salomon (2006) which indicate that the effects of CSR vary in their
intensity. Therefore, using a single specific dimension of CSR when examining its
relationship with firm performance does not show the “complete” picture in term of intensity
of effect. In this sense, our results are also consistent with studies showing that firms with
better ESG performance tend to face significantly lower capital constraints, and that the
relation is primarily driven by social and environmental performance (El Ghoul et al., 2011).
The CSR Dimensions are Positively Correlated but are Substitutables

27
Let us turn now to the interaction between each CSR dimension. One can note that all
interactions are positive (Table 2). However, their levels of intensity vary according to the
type of interaction considered. A positive interaction between some dimensions does not
necessarily lead to a complementarity or substitutability between these dimensions. More
precisely, when testing for complementarity and substitutability effects, we observe that all
dimensions are substitutes to each other. Let take the example of green and customer &
supplier dimensions. They are substitutes (in the sense of Athey and Stern 1998) because the
coefficient associated with the pattern “green and customer & supplier practices” is 0.51,
which is weaker than the sum of their isolated effects, which is 0.83 (the coefficient
associated with the pattern “green practices only” is 0.53 and the coefficient associated with
the pattern “customer & supplier practices only” is 0.30). Therefore, we confirm Hypothesis 2
on substitutable CSR dimensions. However, there is one point of divergence. Hypothesis 2
predicts also the complementarity effect between HR and customer & supplier dimensions,
while the empirical results indicate a substitution effect. Thus, we may conclude that the HR
dimension shares some common characteristics with the customer & supplier dimension,
which induces substitution between those dimensions rather than complementarity. The
Stakeholder theory is only partially supported here, in the sense that the primary stakeholders
are substitutes (employees, customers & suppliers). The environment appears as a non-
primary stakeholder relatively substitutable to primary stakeholders from a CSR perspective,
with a similar kind of result that was found in Cavaco and Crifo (2013).
The Implementation of CSR Practices: a Path-dependent Process
Let us now analyze the magnitudinal effect for moving from one configuration of
dimension(s) to another. We ask whether a firm starting with a certain configuration can
perform better (in terms of profit) by adding or removing some dimension(s). Only one
28
configuration fulfills this requirement: green and HR. The interpretation is that when a firm
starts with this configuration then it is better not to move to another configuration. In all other
configurations, firms can always improve their profits either by adding or removing some
dimensions. So from the point of view of their effects on firm performance, the green and HR
can be considered as “optimal”. Two remarks can be made from these results. Firstly, they
show that substitutability does not necessarily lead to overall inefficiency. In our cases, the
green and HR dimensions are clearly substitutes. Secondly, our results suggest that the
implementation of CSR dimensions by firms is a path-dependent process. That is, the CSR
configuration that is in place within firms is the result of their successive past choices of CSR
dimensions, in particular at the starting point. In other words, most firms seem to use an
adaptative implementation process instead of a purely rational calculus of the best
configurations. Indeed, the “optimal” solution is not implemented by all firms.
Aggregated Effect of CSR Dimensions and the Quality-Quantity Trade-off
From Table 3, we observe that our aggregate measure of CSR, which counts quantitatively the
number of practices adopted in terms of environmental, human resources, and customers &
suppliers practices, affects positively and significantly firm performance when a firm
implements at least two dimensions of CSR. The estimates clearly show that the more the
dimensions are used by firms, the higher the effects on their economic performance. This
suggests that a purely quantitative strategy consisting of accumulating CSR dimensions works
and that Hypothesis 1B, indicating that an aggregate measure of CSR is positively associated
with firm performance, is fulfilled. However the comparison of the coefficients in Table 2 and
Table 3 suggests that a quantitative strategy is less efficient than a qualitative one. For
instance over the seven possible qualitative policies, four provide better results than the best
quantitative policy. The choice of interaction of CSR dimensions matter for a firm’s profit. In
29
this sense, firms that want to achieve business performance improvement through investment
in CSR dimensions need to achieve a best “fit” between the types of CSR dimensions that
they implement (e.g. Brammer and Pavelin, 2006). Additionally, as suggested by Mackey et
al. (2007), Brammer and Milligton (2008) and Barcoset al. (2013), our findings confirm that
at least some (specific) forms of CSR (in our case, for instance green and customer &
supplier) improve firm performance more than others (in our case, for instance HR and
customer & supplier). To conclude, the profitability of CSR investments in French firms
seems to rely on a specific qualitative mix of different CSR dimensions rather than a pure
quantitative approach accumulating practices without designing a consistent set of
interactions among them.
CONCLUSION
To date, the extensive and growing theoretical and empirical research has identified no clear
pattern in the relationship between CSR and firm performance (Brummer, 1991; McWilliams
and Siegel, 1997; Waddock and Graves, 1997; McWilliams and Siegel, 2001). Generally, the
literature argues that one of the main reasons for this absence of consensus is associated with
measurement problems (e.g. Surocca et al., 2010). Given this concern, we perform, using
secondary data, a quantity-quality trade-off analysis between the various dimensions of
Corporate Social Responsibility in order to provide a richer conceptualization and
understanding concerning the relationship between CSR and firm performance. Hence, using
secondary data brings another dimension in the CSR research field and may allow for a wider
generalization of conclusions. For this purpose, we first examine the impact of stakeholders
CSR components separately (environmental performance, HR performance, customer &
supplier performance), which permits to us to understand how CSR measures in isolation
30
impact on a firm’s profitability. Even though our findings indicate that different dimensions
of CSR have significant and positive effects on firm performance, the intensity of such effects
is not the same across different dimensions. Second, we create an aggregate measure of the
CSR indicator based on our three CSR dimensions. We observe that the aggregate measure of
CSR positively and significantly affects firm performance. Third, we study how the
interactions between different CSR dimensions affect corporate performance. We show that
all forms of CSR are associated with a positive significant coefficient. When testing for
complementarity or substitutability of the dimensions, we observe only substitutability. In
sum, while our findings are consistent with those supporting a positive relationship between
CSR and firm profitability (e.g. Cochran and Wood, 1984; Turban and Greening; 1996;
Waddock and Graves, 1997; McWilliams and Siegel, 2001; Godfrey, 2004), additional
analysis confirms McWilliams and Siegel’s argument (2000) indicating that their relationship
is very complex. Our findings suggest two sources of complexity: (1) the CSR and firm
performance relationship is not homogeneous in terms of intensity when examining different
dimensions of CSR; (2) the interaction among different CSR dimensions produces different
effects on firm performance, but only in terms of effect intensity.
Our findings have important implications for policy-makers. They suggest that managers need
to be careful in choosing appropriate CSR tasks since those dimensions need to be compatible
with each other and with a firm’s overall strategy. Therefore, the question for managers is not
simply whether to invest in social responsibility; it is rather what form of social responsibility
is suitable for a specific firm’s strategy. Additionally, the results suggest that different forms
of firm social orientation are not only beneficial for social improvements, but could be
considered as a tool for firm performance improvement.
This study has limitations that could be addressed in future work. First, our approach relies on
the nature of the data available to measure each dimension. For instance, the environmental
31
component is captured through one variable only (unlike the HR or the customer & supplier
components), and the governance dimension is not measured due to the lack of information.
Second, we work on a sample of French firms, which suggests that the ability to generalize
the results is limited since there are important international institutional differences in the
implementation of socially responsible practices. Third, future research could test the effect of
CSR practices on employee outcomes given that the literature covering this issue is quite
limited for the moment. Only anecdotal evidences exists which supports the argument of
greater employee loyalty and productivity at environmentally or socially-responsible firms.
Finally, recent research suggests that the debate concerning CSR and firm performance should
be taken further by including additional intermediate variables that can improve our
understanding of the processes through which CSR influences firm outcomes (e.g. Delmas
and Pekovic, 2013; Gallear, Ghobadian, Chen, 2012; Surroca et al., 2010). For instance,
Surocca et al. (2010) propose a model in which firm-based intangible resources, including
innovation, human resources, reputation, and organizational culture, are mediator variables
between CSR and firm performance. Therefore, future research should examine indirect
mechanisms through which CSR influences firm performance.
REFERENCES
Athey S., Stern S. 1998. An Empirical Framework for Testing Theories About
Complementarity in Organizational Design. NBER Working Paper, 6600.
Barla P. 2007.ISO 14001 certification and environmental performance in Quebec’s pulp and
paper industry. Journal of Environmental Economics and Management53(3): 291-306.
32
Barnett M.L., Salomon R.M. 2006. Beyond Dichotomy: The Curvilinear Relationship
between Social Responsibility and Financial Performance. Strategic Management
Journal27(11): 1101-1122.
Barcos L., Barroso A.,Surroca J.,Tribo J. 2013. Corporate social responsibility and inventory
policy. International Journal of Production Economics143: 580–588
Baumeister R.F., Bratslavsky, E. Finkenauer C., Vohs K.D. 2001. Bad is stronger than good.
Review of General Psychology 5: 323-370.
Berens G., Riel, C.B.M., Rekom J. 2007. The CSR-quality trade-off: when can corporate
social responsibility and corporate ability compensate each other? Journal of Business
Ethics74: 233–252.
Bernard B.A., Eaton J., Jensen B., Kortum S. 2003. Plants and productivity in international
trade. Econometrica 93 (4): 1268-1290.
Brammer S.J., Pavelin S. 2006. Corporate Reputation and Social Performance: The
Importance of Fit. Journal of Management Studies 43(3): 435-455.
Brammer S., Millington A. 2008. Does it pay to be different? An analysis of the relationship
between corporate social and financial performance. Strategic Management Journal 29 (12):
1325-1343.
Brummer J.J. 1991. Corporate Responsibility and Legitimacy: An Interdisciplinary Analysis.
New York, Greenwood Press.
Capon N., Farley J.U., Hoenig S. 1990. Determinants of financial performance: A meta-
analysis. Management Science 36: 1143-1159.
Cavaco S., Crifo P. 2013. The CSR-performance missing link: complementarity between
environmental, social and business behaviors criteria? Working Paper EcolePolytechnique n°
2013-07.
33
Chatterji A., Levine, D., Toffel, M. 2009. How Well Do Social Ratings Actually Measure
Corporate Social Responsibility? Journal of Economics & Management Strategy 18 (1): 125-
169.
Chen C-M., Delmas M. 2011.Measuring Corporate Social Responsibility: An Efficiency
Perspective. Production and Operations Management20(6): 789-804.
Cochran P.L., Wood R.A. 1984. Corporate social responsibility and financial performance.
The Academy of Management Journal 27(1): 42-56.
Delmas M., Pekovic S. 2013. Environmental Standards and Labor Productivity:
Understanding the Mechanisms that Sustain Sustainability, Journal Of Organizational
Behavior, 34 (2): 230–252.
Delmas M., Montiel I. 2009.Greening the Supply Chain: When is Customer Pressure
Effective? Journal of Economics and Management Strategy 18 (1): 171-201.
El Ghoul S., Guedamin O., Kwok C.C., Mishra D.R. 2011. Does corporate social
responsibility affect the cost of capital ? Journal of Banking and Finance 35 (9): 2388-2406.
European Commission 2001. Promoting a European Framework for Corporate Social
Responsibility. Commission Green paper COM (2001) 366 Final.
Fernandez-Kranz D., Santalo J. 2010. When Necessity Becomes a Virtue: The Effect of
Product Market Competition on Corporate Social Responsibility, Journal of Economics &
Management Strategy 19(2): 453–487.
Ferrell O. 2004. Business ethics and customer stakeholders. Academy of Management
Executive 18 (2): 126-129.
Filbeck G., Gorman R.F. 2004. The Relationship Between the Environmental and Financial
Performance of Public Utilities. Environmental and Resource Economics 29: 137-157.
Friedman M. 1970. The social responsibility of business is to increase its profits. New York
Times Magazine, 13 September: 122–126.
34
Gallear D., Ghobadian A., Chen W. 2012. Corporate responsibility, supply chain partnership
and performance: An empirical examination. International Journal of Production Economics
140: 83–91.
Ghauri P., Gronhaug K. 2005. Research Methods in business Studies, 3ed. PrenticeHall.
Giménez C., Sierra V., Rodon, J. 2012. Sustainable operations: Their impact on the triple
bottom line. International Journal of Production Economics, 140 (1): 149-159.
Godfrey P.C. 2004. The relationship between corporate philanthropy and shareholder wealth:
A risk management perspective. Academy of Management Review 30: 777–798.
Grabisch M. 1997. k-order additive discrete fuzzy measures and their representation. Fuzzy
Sets and Systems 92: 167-189.
Gray W., Shadbegian R. 2003. Plant vintage, technology, and environmental regulation.
Journal of Environmental Economics and Management 46: 384-402.
Griliches Z. 1979. Issues in Assessing the Contribution of Research and Development to
Productivity Growth. The Bell Journal of Economies10(1): 92-116.
Grolleau G., Mzoughi N., Pekovic S. 2007. Chemical Firms’ Registration for the Responsible
Care Program and the ISO 14001 Standard: A Comparative Approach. Economics Bulletin
12: 1-13.
Hillman A., Keim G. 2001. Shareholder value, stakeholder management, and social issues:
what’s the bottom line? Strategic Management Journal, 22: 125-139.
Hart S.L. 1995. A natural resource-based view of the firm. Academy of Management Review
20(4): 986-1014.
Hull C.E., Rothenberg S. 2008. Firm performance: the interactions of corporate social
performance with innovation and industry differentiation. Strategic Management Journal 29:
781-789.
35
Huselid M. 1995. The Impact of Human Resource Management Practices on Turnover,
Productivity, and Corporate Financial Performance, Academy of Management Journal, 38:
635-672.
Ichniowski C., Shaw K., Prennushi G. 1997. The Effects of Human Resource Management on
Productivity. American Economic Review87: 291-31.
Lehtonen M. 2004. The environmental-social interface of sustainable development:
capabilities, social capital, institutions. Ecological Economics 49 (2): 199-214.
Lin C., Chow W., Madu C.N., Kuei, C.H. and Yu P.P., 2005. A structural equation model of
supply chain quality management and organizational performance. International Journal of
Production Economics, 96 (3): 355-365.
Lo C.K.Y., Yeung A.C.L., Cheng T.C.E. 2012. The impact of environmental management
systems on financial performance in fashion and textiles industries. International Journal of
Production Economics, 135 (2): 561-567.
Mackey A., Mackey T.B., Barney J.B. 2007. Corporate social responsibility and firm
performance: Investor preferences and corporate strategies. Academy of Management Review
32: 817–835.
Maddala G.S. 1983. Limited-Dependent and Qualitative Variables in Econometrics.
Cambridge University Press.
Margolis J., Elfenbein H., Walsh J. 2009. Does it pay to be good? A meta-analysis and
direction of research on the relationship between corporate social and financial performance.
Harvard University Working Paper.
Margolis J., Walsh J. 2003. Misery loves companies: rethinking social initiatives by business,
Administrative Science Quarterly 48: 268–305.
McWilliams A., Siegel D. 1997. Event Studies in Management Research: Theoretical and
Empirical issues. Academy of Management Journal 40 (3): 626-657.

36
McWilliams A., Siegel D. 2000. Corporate social responsibility and financial performance:
correlation or misspecification? Strategic Management Journal 21 (5): 603-609.
McWilliams A., Siegel D. 2001. Corporate social responsibility: a theory of the firm
Perspective. The Academy of Management Review 26 (1): 117-127.
McWilliams A., Siegel D.S., Wright, P.M. 2006. Corporate Social Responsibility: Strategic
Implications. Journal of Management Studies 43 (1): 1–18.
Milgrom P., Roberts J. 1990. The Economics of Modern Manufacturing: Technology,
Strategy, and Organization. American Economic Review 80: 511-528.
Miller D.K, Bromiley P. 1990. Strategic Risk and Corporate Performance: An Analysis of
Alternative Risk Measures. The Academy of Management Journal 33 (4): 756-779.Orlitzky,
M., Schmidt, F., Rynes, S. 2003. Corporate social and financial performance: a meta-analysis,
Organization Studies 24 (3): 403–441.
Orlitzky M., Benjamin J.D. 2001. Corporate social performance and firm risk: A meta-
analytic review. Business and Society 40 (4): 369-396.
Pekovic S. 2010. The Determinants of ISO 9000 Certification: A Comparison of the
Manufacturing and Service Sectors. Journal of Economic Issues 44 (4): 895-914.
Pekovic S., Rolland S. 2012. L'impact de l'orientation client sur la performance des
entreprises françaises: étude empirique des effets directs et modérateurs. Recherche et
Applications en Marketing 27(4): 11-28
Reitzig M.G., Wagner S. 2010. The hidden costs of outsourcing: Evidence from patent data.
Strategic Management Journal 31 (11): 1183-1201.
Robbins D.K., Pearce J.A. 1992. Turnaround: Retrenchment and recovery. Strategic
Management Journal 13: 287-309.
Roodman D. 2009. Estimating fully observed recursive mixed-process models with cmp.
Center for Global Development Working Paper 168.
37
Russo M.V., Fouts P.A. 1997. A Resource Based Perspective on Corporate Environmental
Performance and Profitability. Academy of Management Journal 40 (3): 534-559.
Surroca J., Tribò J.A., Waddock S. 2010. Corporate Responsibility and Financial
Performance: the Role of Intangible Resources. Strategic Management Journal 31 (5): 463-
490.
Turban D.B., Greening D.W. 1997. Corporate social performance and organizational
attractiveness to prospective employees. The Academy of Management Journal 40 (3): 658-
672.
Utting P. 2005. Rethinking Business Regulation: From Self-Regulation to Social Control.
Paper no. 15, Technology, Business and Society Programme, UN Research Institute for Social
Development.
Waddock S.A., Graves S.B. 1997. The corporate social performance-financial performance
link. Strategic Management Journal 18 (4): 303-310.
Whittington R., Pettigrew A., Peck S., Fenton E. and Canyon M. 1999. Change and
Complementarities in the New Competitive Landscape: A European Panel Study, 1992-1996.
Organization Science 10: 583-600.
Wright M.P., Kehoe, R.R. 2008. Human resource practices and organizational commitment:
A deeper examination, Asia Pacific Journal of Human Resources 46 (1): 6–20.
Yeung A.C.L. 2008. Strategic supply management, quality initiatives, and organizational
performance. Journal of Operations Management 26: 490-502.
Zhu Z., Nakata C. 2007. Reexamining the link between customer orientation and business
performance: The role of information systems. Journal of Marketing Theory & Practice 15
(3): 187-203.

Appendix 1
Table B: Simultaneous Equations Model estimates of the relation between interaction of CSR dimensions and profit
Variables
Green only Profit HR only Profit C&S only Profit Green and HR
Profit Green and C&S
Profit HR and C&S
Profit All dimensions
Profit
Interactions of CSR dimensions
0.53*** (0.24)
0.52*** (0.15)
0.30* (0.16)
0.59* (0.32)
0.51*** (0.19)
0.25*** (0.10)
0.43*** (0.11)
Hard law 0.13* 0.15*** 0.11*** 0.25*** 0.10 0.21*** 0.29*** (0.07) (0.04) (0.04) (0.11) (0.06) (0.04) (0.07) Group tool 0.18 0.44*** 0.37*** 0.55*** 0.68*** 0.76*** 1.02*** (0.14) (0.07) (0.07) (0.15) (0.09) (0.06) (0.08) Size 0.00*** -0.00*** 0.00*** -0.00** 0.00*** -0.00*** 0.00*** -0.00** 0.00*** -0.00*** 0.00*** -0.00*** 0.00*** 0.00 (0.00) (0.00) (0.00) (0.00) (0.00) (0.00) (0.00) (0.00) (0.00) (0.00) (0.00) (0.00) (0.00) (0.00) Holding 0.04 0.37*** 0.25*** 0.33*** 0.39*** 0.36*** 0.17 0.37*** 0.31*** 0.35*** 0.64*** 0.32*** 0.55*** 0.34*** (0.08) (0.05) (0.04) (0.05) (0.04) (0.05) (0.10) (0.05) (0.07) (0.05) (0.04) (0.05) (0.07) (0.05) Uncertainty 0.10 -0.18*** 0.02 -0.18*** 0.05 -0.21*** 0.06 -0.19*** -0.04 -0.18*** 0.17*** -0.17*** 0.04 -0.16*** (0.08) (0.04) (0.04) (0.04) (0.04) (0.04) (0.11) (0.04) (0.07) (0.04) (0.04) (0.04) (0.07) (0.04) Market down -0.01 -0.26*** -0.05 -0.29*** -0.01 -0.24*** 0.04 -0.24*** -0.04 -0.24*** -0.05 -0.18*** -0.10 -0.25*** (0.09) (0.05) (0.05) (0.05) (0.05) (0.05) (0.13) (0.05) (0.08) (0.05) (0.05) (0.05) (0.08) (0.05) Growing Market -0.02 0.17*** 0.16*** 0.15*** 0.20*** 0.16*** 0.19 0.14** -0.12 0.14*** 0.13** 0.21*** 0.08 0.16*** (0.10) (0.05) (0.05) (0.05) (0.05) (0.05) (0.13) (0.06) (0.09) (0.05) (0.05) (0.05) (0.08) (0.05) Export 0.26 0.96*** 0.202 1.07*** 0.17 0.94*** 0.67*** 1.02*** 0.22 0.94*** 0.18 1.06*** 0.41*** 0.94*** (0.23) (0.17) (0.13) (0.15) (0.12) (0.14) (0.25) (0.17) (0.16) (0.15) (0.12) (0.12) (0.15) (0.14) R&D 0.07 0.12 0.27*** 0.09 0.49*** 0.20*** 0.23 0.08 0.62*** 0.07 0.63*** 0.25*** 0.88*** 0.14** (0.12) (0.08) (0.06) (0.07) (0.05) (0.07) (0.15) (0.08) (0.08) (0.08) (0.05) (0.06) (0.07) (0.07) Advertising 0.14* 0.17*** 0.36*** 0.14*** 0.46*** 0.14*** 0.57*** 0.15*** 0.249*** 0.14*** 0.87*** 0.14*** 0.72*** 0.13*** (0.08) (0.04) (0.05) (0.04) (0.05) (0.04) (0.17) (0.04) (0.08) (0.04) (0.06) (0.04) (0.10) (0.04) -0.25 -0.19 0.03 -0.16 -0.50*** -0.06 -0.75* -0.23* -0.77*** -0.21* -0.55*** -0.10 -0.68*** -0.14 Consumption goods (0.21) (0.12) (.11) (0.11) (0.10) (0.11) (0.38) (0.13) (0.20) (0.12) (0.11) (0.10) (0.17) (0.11) Equipment goods -0.83** -0.20* 0.06 -0.20*** 0.10 -0.20*** -0.15 -0.25** 0.06 -0.21*** -0.08 -0.18** -0.30*** -0.25*** (0.37) (0.12) (0.12) (0.11) (0.09) (0.09) (0.23) (0.12) (0.13) (0.11) (0.10) (0.09) (0.13) (0.10) Sales 0.11 0.07 0.11 0.12 -0.37*** 0.13* 0.14 0.06 -0.33*** 0.07 -0.23*** 0.12* -0.31*** 0.09 (0.13) (0.08) (0.08) (0.07) (0.07) (0.07) (0.18) (0.08) (0.10) (0.08) (0.07) (0.06) (0.09) (0.07) Construction -0.02 -0.43*** -0.07 -0.41*** -0.05 -0.42*** -0.22 -0.44*** -0.32** -0.43*** -0.24*** -0.34*** -0.34*** -0.41*** (0.16) (0.08) (0.10) (0.08) (0.08) (0.07) (0.25) (0.08) (0.13) (0.08) (0.09) (0.07) (0.12) (0.08) Finance and real estate -0.13 0.03* 0.36*** 0.20* -0.59*** 0.16* -0.34 0.04 -0.65*** 0.05 -0.42*** 0.28*** -0.92 *** 0.08
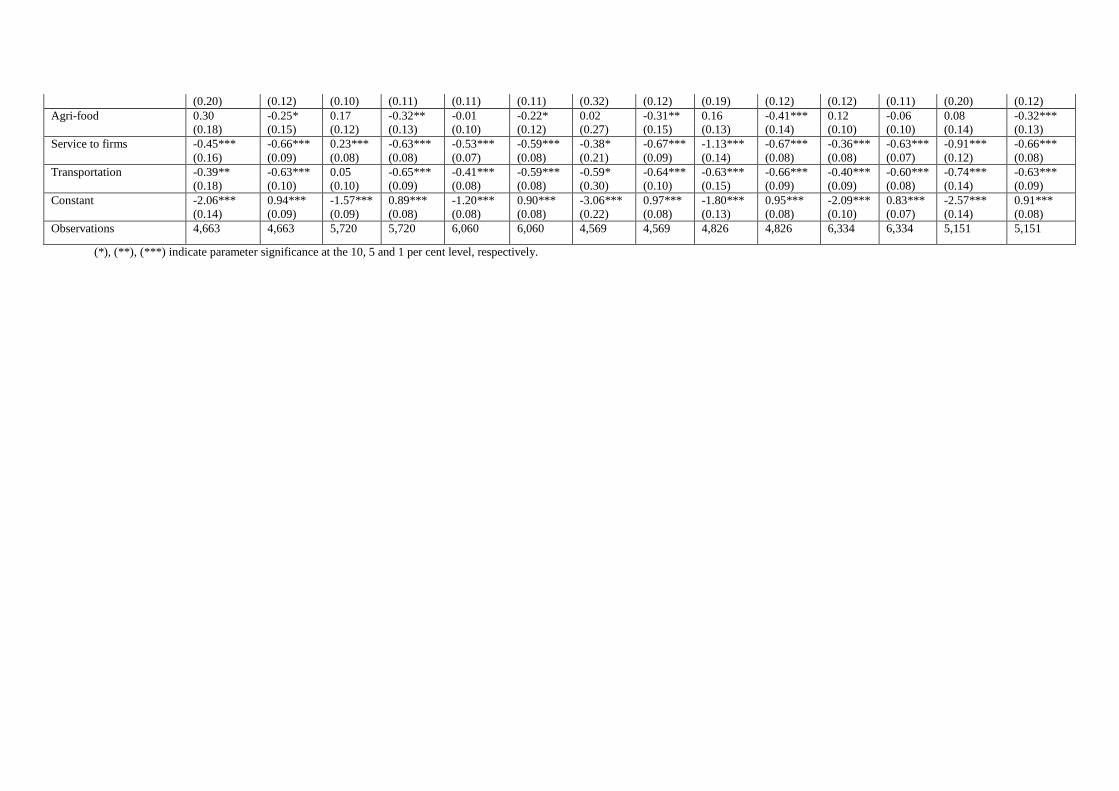
(0.20) (0.12) (0.10) (0.11) (0.11) (0.11) (0.32) (0.12) (0.19) (0.12) (0.12) (0.11) (0.20) (0.12) Agri-food 0.30 -0.25* 0.17 -0.32** -0.01 -0.22* 0.02 -0.31** 0.16 -0.41*** 0.12 -0.06 0.08 -0.32*** (0.18) (0.15) (0.12) (0.13) (0.10) (0.12) (0.27) (0.15) (0.13) (0.14) (0.10) (0.10) (0.14) (0.13) Service to firms -0.45*** -0.66*** 0.23*** -0.63*** -0.53*** -0.59*** -0.38* -0.67*** -1.13*** -0.67*** -0.36*** -0.63*** -0.91*** -0.66*** (0.16) (0.09) (0.08) (0.08) (0.07) (0.08) (0.21) (0.09) (0.14) (0.08) (0.08) (0.07) (0.12) (0.08) Transportation -0.39** -0.63*** 0.05 -0.65*** -0.41*** -0.59*** -0.59* -0.64*** -0.63*** -0.66*** -0.40*** -0.60*** -0.74*** -0.63*** (0.18) (0.10) (0.10) (0.09) (0.08) (0.08) (0.30) (0.10) (0.15) (0.09) (0.09) (0.08) (0.14) (0.09) Constant -2.06***
(0.14) 0.94*** (0.09)
-1.57*** (0.09)
0.89*** (0.08)
-1.20*** (0.08)
0.90*** (0.08)
-3.06*** (0.22)
0.97*** (0.08)
-1.80*** (0.13)
0.95*** (0.08)
-2.09*** (0.10)
0.83*** (0.07)
-2.57*** (0.14)
0.91*** (0.08)
Observations 4,663 4,663 5,720 5,720 6,060 6,060 4,569 4,569 4,826 4,826 6,334 6,334 5,151 5,151
(*), (**), (***) indicate parameter significance at the 10, 5 and 1 per cent level, respectively.
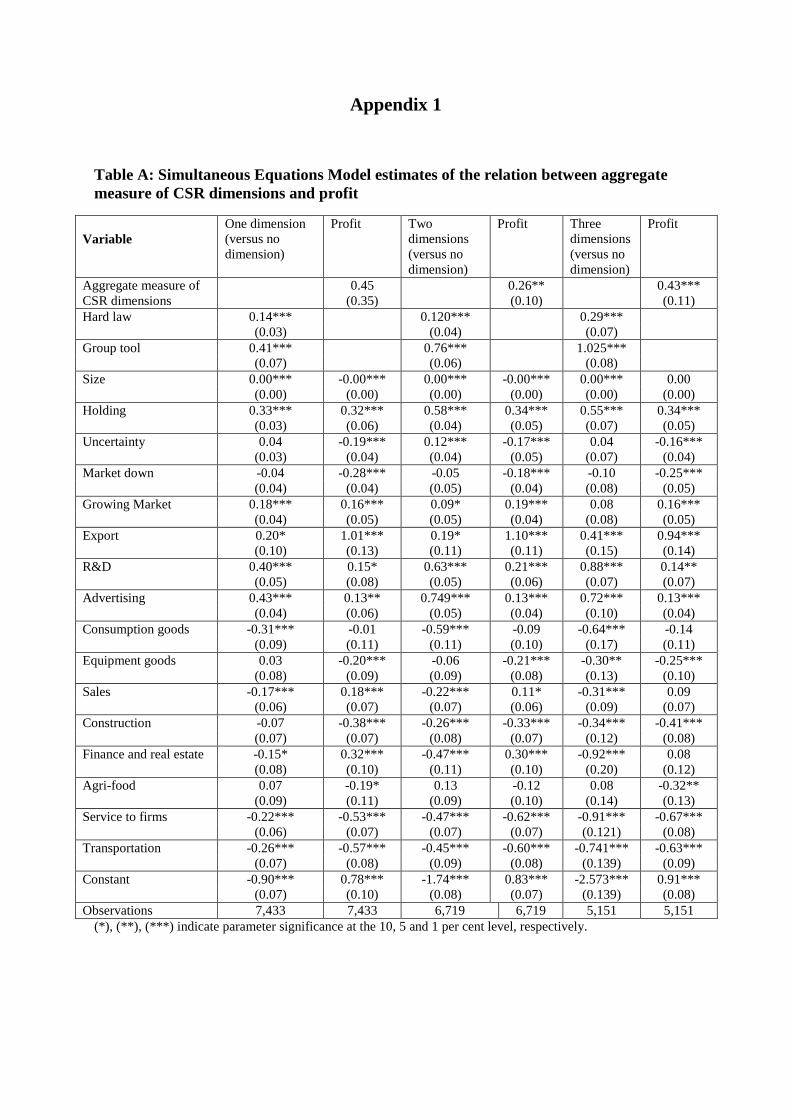
Appendix 1
Table A: Simultaneous Equations Model estimates of the relation between aggregate measure of CSR dimensions and profit
Variable
One dimension (versus no dimension)
Profit Two dimensions (versus no dimension)
Profit Three dimensions (versus no dimension)
Profit
Aggregate measure of CSR dimensions
0.45 (0.35)
0.26** (0.10)
0.43*** (0.11)
Hard law 0.14*** 0.120*** 0.29*** (0.03) (0.04) (0.07) Group tool 0.41*** 0.76*** 1.025*** (0.07) (0.06) (0.08) Size 0.00*** -0.00*** 0.00*** -0.00*** 0.00*** 0.00 (0.00) (0.00) (0.00) (0.00) (0.00) (0.00) Holding 0.33*** 0.32*** 0.58*** 0.34*** 0.55*** 0.34*** (0.03) (0.06) (0.04) (0.05) (0.07) (0.05) Uncertainty 0.04 -0.19*** 0.12*** -0.17*** 0.04 -0.16*** (0.03) (0.04) (0.04) (0.05) (0.07) (0.04) Market down -0.04 -0.28*** -0.05 -0.18*** -0.10 -0.25*** (0.04) (0.04) (0.05) (0.04) (0.08) (0.05) Growing Market 0.18*** 0.16*** 0.09* 0.19*** 0.08 0.16*** (0.04) (0.05) (0.05) (0.04) (0.08) (0.05) Export 0.20* 1.01*** 0.19* 1.10*** 0.41*** 0.94*** (0.10) (0.13) (0.11) (0.11) (0.15) (0.14) R&D 0.40*** 0.15* 0.63*** 0.21*** 0.88*** 0.14** (0.05) (0.08) (0.05) (0.06) (0.07) (0.07) Advertising 0.43*** 0.13** 0.749*** 0.13*** 0.72*** 0.13*** (0.04) (0.06) (0.05) (0.04) (0.10) (0.04) Consumption goods -0.31*** -0.01 -0.59*** -0.09 -0.64*** -0.14 (0.09) (0.11) (0.11) (0.10) (0.17) (0.11) Equipment goods 0.03 -0.20*** -0.06 -0.21*** -0.30** -0.25*** (0.08) (0.09) (0.09) (0.08) (0.13) (0.10) Sales -0.17*** 0.18*** -0.22*** 0.11* -0.31*** 0.09 (0.06) (0.07) (0.07) (0.06) (0.09) (0.07) Construction -0.07 -0.38*** -0.26*** -0.33*** -0.34*** -0.41*** (0.07) (0.07) (0.08) (0.07) (0.12) (0.08) Finance and real estate -0.15* 0.32*** -0.47*** 0.30*** -0.92*** 0.08 (0.08) (0.10) (0.11) (0.10) (0.20) (0.12) Agri-food 0.07 -0.19* 0.13 -0.12 0.08 -0.32** (0.09) (0.11) (0.09) (0.10) (0.14) (0.13) Service to firms -0.22*** -0.53*** -0.47*** -0.62*** -0.91*** -0.67*** (0.06) (0.07) (0.07) (0.07) (0.121) (0.08) Transportation -0.26*** -0.57*** -0.45*** -0.60*** -0.741*** -0.63*** (0.07) (0.08) (0.09) (0.08) (0.139) (0.09) Constant -0.90*** 0.78*** -1.74*** 0.83*** -2.573*** 0.91*** (0.07) (0.10) (0.08) (0.07) (0.139) (0.08) Observations 7,433 7,433 6,719 6,719 5,151 5,151
(*), (**), (***) indicate parameter significance at the 10, 5 and 1 per cent level, respectively.


![2011 Investissements en Exploration-production Et en Raffinage[1]](https://img.pdfslide.us/doc/110x75/577d20d91a28ab4e1e93e899/2011-investissements-en-exploration-production-et-en-raffinage1.jpg)