Embed Size (px)
Citation preview
Claremont CollegesScholarship @ Claremont
CMC Senior Theses CMC Student Scholarship
2012
Corporate Social Responsibility and FinancialPerformance: Does it Pay to Be Good?Harmony J. PalmerClaremont McKenna College
This Open Access Senior Thesis is brought to you by Scholarship@Claremont. It has been accepted for inclusion in this collection by an authorizedadministrator. For more information, please contact [email protected].
Recommended CitationPalmer, Harmony J., "Corporate Social Responsibility and Financial Performance: Does it Pay to Be Good?" (2012). CMC SeniorTheses. Paper 529.http://scholarship.claremont.edu/cmc_theses/529
CLAREMONT McKENNA COLLEGE
CORPORATE SOCIAL RESPONSIBILITY AND FINANCIAL
PERFORMANCE:
DOES IT PAY TO BE GOOD?
SUBMITTED TO
PROFESSOR MATTHEW MAGILKE
AND
DEAN GREGORY HESS
BY
HARMONY J. PALMER
FOR
SENIOR THESIS
FALL 2012
DECEMBER 3, 2012

Acknowledgements
I have many people to thank for their help with this study. First and foremost, I want to thank my thesis reader, Professor Magilke, for all his help. This study would have be quite difference without his constant guidance and our numerous meetings and e-mail exchanges. Second, I would like to thank Mary Martin, the Reference & Instruction Librarian for Business and Law, at the Claremont Colleges Library. Obtaining the CSR data would not have been possible without her help and the library’s funding. Third, I want to thank the Kravis Leadership Institute for awarding me the Kravis Leadership Institute Leadership Thesis Fellowship to help fund my thesis research. Fourth, I thank Professor Massoud, Professor Orr, and Professor Wallace for providing me with valuable research resources. Fifth, I want to thank Greyson Blue for tutoring me in STATA. Lastly, I want to thank all my friends for their support and company in Poppa Computer Lab, the wonderful school facility where I completed this thesis.
Abstract
The prominence of corporate social responsibility (CSR) initiatives today suggests that the corporate perception of such policies has shifted from an unnecessary addition to a critical business function. Using a reliable source of data on corporate social performance (CSP), this study explores and tests the relationship between CSP and corporate financial performance (CFP). Unlike prior research, this study additionally tests the impact CSP has on sales and gross margin in hopes of providing insight on sales strategies that can be implemented to maximize the impact of the relationship. The dataset includes most of the S&P 500 firms and covers years 2001-2005. The relationships are tested using time-series regressions. Results indicate that CSP and CFP have a significantly positive relationship in both directions, supporting the view that CSR programs have positive impacts on the bottom-line. Results also indicate that increased CSP leads to increases in gross margin, indicating that some customers are willing to pay a premium for the products and/or services of a company with CSR initiatives. Lastly, results also indicate that increases in CSP leads to a decrease in sales, which implies a decrease in customer base because less people are willing to buy the products at premium. Despite the result on sales, I argue in this paper that firms can increase sales by increasing CSR investments—assuming increases in CSR investments leads to higher CSP—as long as the perception of programs transform from socially responsible, philanthropic actions to programs promoting corporate shared value (CSV).
Table of Contents
CHAPTER 1: INTRODUCTION………………………………………………………………..1
1.1 Problem Orientation……………………………………………………………….......1
1.2 Background to the Research Problem………………………………………………..2
1.2.1 Definition of Corporation Social Responsibility...................................................... 3
1.2.2 Recent Trends in Corporate Social Responsibility .................................................. 5
1.2.3 Corporate Social Initiatives ...................................................................................... 9
CHAPTER 2: LITERATURE REVIEW………………………………………………………13
2.1 Negative Association………………………………………………………………….13
2.1.1 Milton Friedman .................................................................................................... 14
2.2 Null Hypothesis……………………………………………………………………….16
2.3 Positive Association……………………………………………………………….…..18
2.3.1 Factors Contributing to a Positive Association ...................................................... 19
CHAPTER 3: HYPOTHESIS…………………………………………………………………..28
CHAPTER 4: METHODOLOGY……………………………………………………………...30
4.1 Data Sources…………………………………………………………………………..30
4.1.1 Measuring Financial Performance ......................................................................... 30
4.1.2 Measuring Corporate Social Performance ............................................................. 31
4.2 Population and Sample……………………………………………………………….32
4.3 Dependent, Independent, and Control Variables…………………………………..33
CHAPTER 5: RESULTS……………………………………………………………………….34
5.1 Replication of Prior Research……………………………………………………….36
5.2 Tests of Hypotheses 1(a) and 1(b)……………………………………………………41
CHAPTER 6: DISCUSSION AND CONCLUSION………………………………………….45
6.1 CSP and Gross Margin……………………………………………………………….45
6.2 CSP and Sales…………………………………………………………………………46
6.3 CSP/Sales Strategies………………………………………………………………….47
6.4 Shifting Perceptions of CSR to Corporate Shared Value………………………….50
6.5 Future Research………………………………………………………………………58
References………………………………………………………………………………………..60
Appendix 1……………………………………………………………………………………..…i
Appendix 2………………………………………………………………………………………..xi
1
CHAPTER 1: INTRODUCTION
1.1 Problem Orientation
“There is one and only one social responsibility of business – to use its resources and
engage in activities designed to increase its profits so long as it stays within the rules of
the game, which is to say, engages in open and free competition without deception or
fraud.”1
Milton Friedman (economist and Nobel Prize laureate)
“A certain amount of corporate philanthropy is simply good business and works for the
long-term benefit of the investors.”2
John Mackey (Chairman and CEO, Whole Foods Market)
In this study, I propose to examine the relation between corporate social
responsibility (CSR) programs and corporate financial performance (CFP). More
specifically, I seek to examine whether the implementation of CSR programs is
associated with increased sales and gross margin in the long-run. In 1970, Milton
Friedman ignited a robust debate with the above quote in the New York Times that is still
being disputed. On the surface of his argument, it appears that Friedman believes
businesses should not adopt corporate social responsibility (CSR) programs because they
are outside the profit-making scope and are unnecessary expenditures. Progressing deeper
into his argument, it is revealed that Friedman supports the integration of CSR programs
into business operations, but only if it positively impacts profitability in the long-run.
John Mackey, like many critics of Friedman, believes Friedman’s view is too focused on
investors and argues that corporations have a social responsibility to its other
1 Milton Friedman, "The Social Responsibility of Business Is to Increase Its Profits." The New York Times, September 13, 1970. 2 “Rethinking the Social Responsibility of Business,” Reason.com, October, 2005, accessed September 19, 2012, http://reason.com/archives/2005/10/01/rethinking-the-social-responsi.
2
stakeholders, even if such responsibility entails a sacrifice in profits. This study serves to
strip off these socialism and capitalism biases on social responsibility to show the
objective, financial impacts of CSR programs.
This study has implications for managers, the beneficiaries of CSR programs
(environment, community, consumers, employees, and stakeholders), and future research.
Over the past ten years, there has been a drastic increase in implementation of CSR
programs from organizations of all sizes. The increase in expenditures to enhance the
social responsibilities of corporations suggests managers find a benefit in CSR
implementation. Hence, this study attempts to provide information on the impact of CSP
on financial performance that managers can use to structure business strategies to
maximize future returns. If managers are interested in investing in social responsibility
initiatives, this study predicts how their organizations will be impacted financially and
describes strategies managers can employ to satisfy their constituents. Future research in
the area of corporate social responsibility may consider how CSR initiatives impact
financial performance across different industries, whether CSR programs add value to
intangible assets such as brand, and how transparency of CSR reporting impacts
stakeholder decisions and, ultimately, financial performance.
1.2 Background to the Research Problem
The need for established social responsibilities and ethical frameworks in business
has become a main priority in our current society. This attitude is supported by the fact
that the number of the most well-known global corporations integrating corporate social
responsibility (CSR) programs into their business operations has never been greater. The
3
prominence of CSR initiatives today hint that executives’ perceptions of such policies
have shifted from an unnecessary addition to a critical business function.
1.2.1 Definition of Corporation Social Responsibility
According to financial theory, there exists one overlying objective of a
corporation: to maximize the value of shareholder’s wealth. This objective is
straightforward and complements the financial interest of shareholders. However,
corporations are impacted by stakeholders other than shareholders, constituents who are
often motivated by non-monetary interests such as the company’s impact on the
community and environment. With so many conflicting interests and goals of
stakeholders, the definition of CSR is not always clear. For the purpose of this study, I
will define CSR as “actions that appear to further some social good, beyond the interest
of the firm and that which is required by law.”3 Understanding this definition requires the
recognition that CSR policies are actions that go beyond obeying the law to positively
impact society (the community, environment, employees, etc.). Hence, a corporation that
improves the well-being of employees by implementing sound whistleblowing
procedures, for example, is not being socially responsible, but rather abiding by the law
(specifically, the Sarbanes-Oxley Act of 2002). corporate social responsibility programs
include actions to improve the environment, community, and lives of all the stakeholders
of an organization.
3 A. Williams and D.S. Siegel, “Corporate social responsibility: a theory of the firm perspective,” Academy
of Management Review 26, no. 1 (2001): 117.
4
To merely state that a corporation is socially responsible and abides in ways to
positively impact society is not sufficient—evidence of concrete CSR strategies is
required. One example of a company that engages in a multidimensional CSR strategy is
McDonald’s, the world’s largest chain of fast food restaurants. Four specific CSR actions
of the company are sustainable supply chain strategies, environmental responsibility,
consumer well-being, and corporate philanthropy. McDonald’s creates a sustainable
supply chain by “purchasing from suppliers that follow practices that ensure the health
and safety of their employees and the welfare and humane treatment of animals.”4 By
doing so, the company chooses suppliers by standards more than what is supplied, but
how the products are supplied. Second, McDonald’s has partnered with the
Environmental Defense Fund (EDF) since 1989 to improve the company’s environmental
footprint. One specific project involved the EDF helping McDonald’s redesign its
packaging, resulting in the elimination of “150,000 tons of packaging waste.”5 Third,
McDonald’s impacts the well-being of their consumers by “listing calorie information on
restaurant and drive-through menus nationwide,”6 even when it is not yet required by the
FDA. Lastly, McDonald’s has been the largest corporate donor to Ronald McDonald
House Charities, a not-for-profit organization that provides housing for families with
critically ill or injured children who must travel to fulfill their medical needs.
McDonald’s raises money for RMHC by donating a portion of its profits, holding annual
4 "Focused on the 3E's: Ethics, Environment, and Economics." Sustainable Supply Chain. McDonald's Corporation. Web. 18 Sept. 2012. <http://www.aboutmcdonalds.com/mcd/sustainability/our_focus_areas/sustainable_supply_ chain.html>. 5 "McDonald's & Environmental Defense Fund Mark 10th Anniversary Of Landmark Alliance." Environmental Defense Fund. Web. 23 Sept. 2012. <http://www.edf.org/news/mcdonalds-environmental-defense-fund-mark-10th-anniversary-landmark-alliance>. 6 "McDonald's to List Calories on Menus." Business. The Wall Street Journal, 12 Sept. 2012. Web. 20 Sept. 2012. <http://online.wsj.com/article/BT-CO-20120912-709401.html>.
5
fundraisers, encouraging employees to volunteer, and donating all of its profits from its
sales of USA Today.7 Together, these four CSR actions affect all of the company’s
stakeholders, either directly or indirectly. Whether such actions are beneficial to the
financial performance of the business—a direct impact to all stakeholders—will be
examined in this study.
1.2.2 Recent Trends in Corporate Social Responsibility
The reputation for ethical practices in the business and accounting professions hit
an all-time low in terms of consumer confidence and trust during the years 2001 and
2002. First, the Enron scandal surfaced in late 2001, resulting in the loss of thousands of
jobs, life savings, and homes in the United States. Then, in 2002, the number of unethical
business practices pinnacled with a soaring 20 cases of corporate malpractice, according
to Forbes.8 The stakeholders of organizations—or any party that can affect or be affected
by the actions of the organization, including customers, employees, suppliers,
government, creditors, community, environment, and investors—responded to these
events by demanding that corporations devote more resources to CSR measures to mend
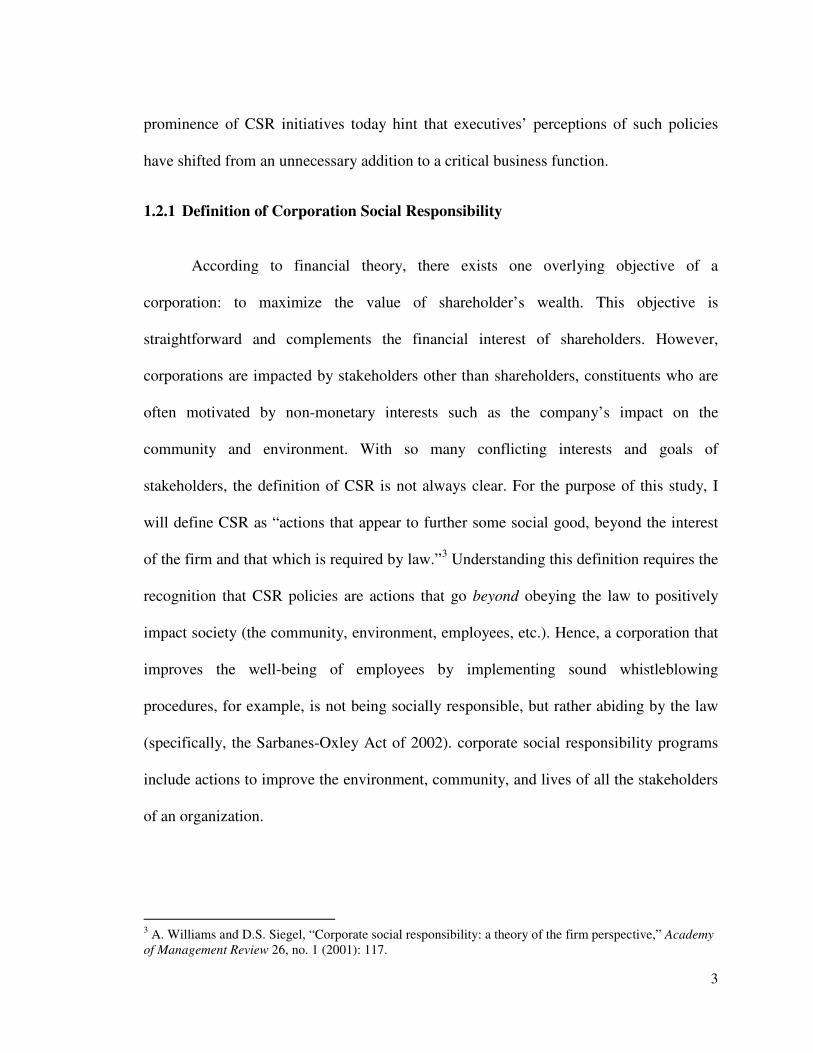
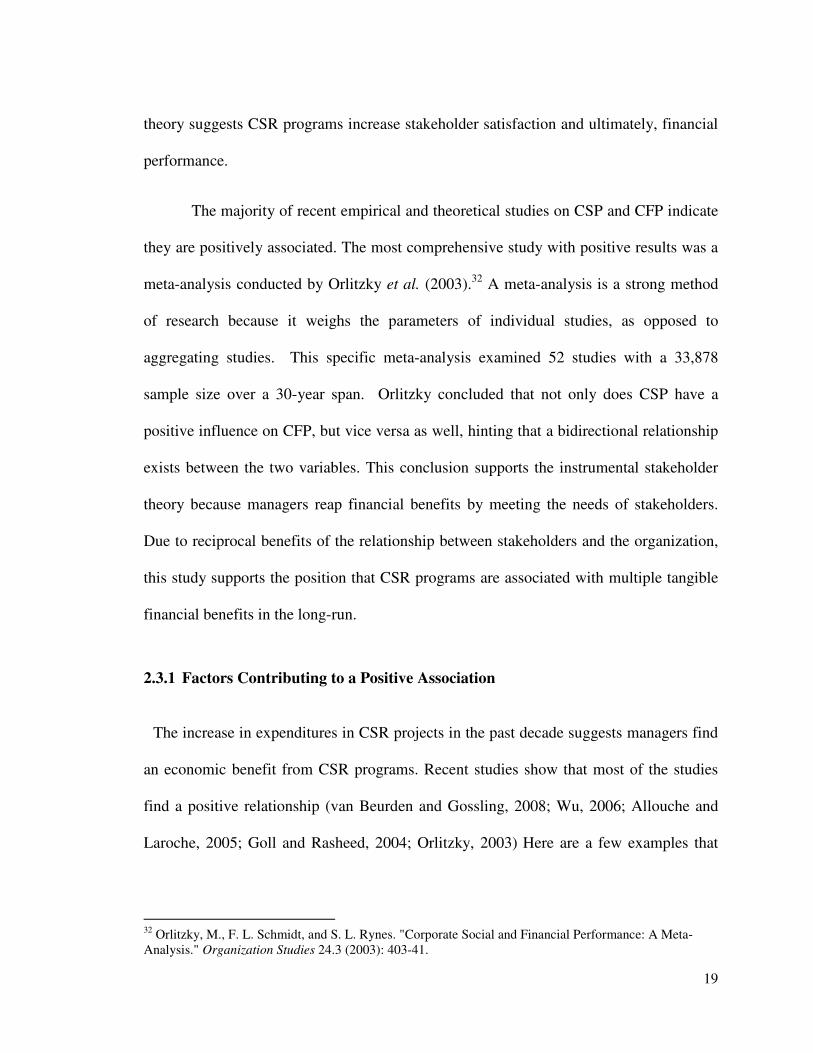
the tarnished reputation of the profession. The increase in this demand was drastic from
March 2001 to July 2002, as seen below in Figure 1 according to a telephone study
completed by Cone Communications that includes the views of 1,040 American adults.9
7 "Ronald McDonald House Charities." McDonald's Relationship. Web. 21 Sept. 2012. <http://rmhc.org/who-we-are/our-relationship-with-mcdonald-s/>. 8 "The Corporate Scandal Sheet." Forbes. Forbes Magazine, Web. 24 Sept. 2012. <http://www.forbes.com/2002/07/25/accountingtracker.html>. 9 2002 Cone Corporate Citizenship Study: The Role of Cause Branding. Cone Communications, 1-7.
6
Figure 1
Note. From 2002 Cone Corporate Citizenship Study: The Role of Cause Branding. Cone Communications,
4.
The demand in the past decade for increased integration of CSR policies in
business has been met with increased corporate giving and increased corporate reporting
on socially responsible projects. According to Giving USA, charitable donations given by
corporations in 2011 amounted to $14.6 billion,10 compared to $9.05 billion in 200111—a
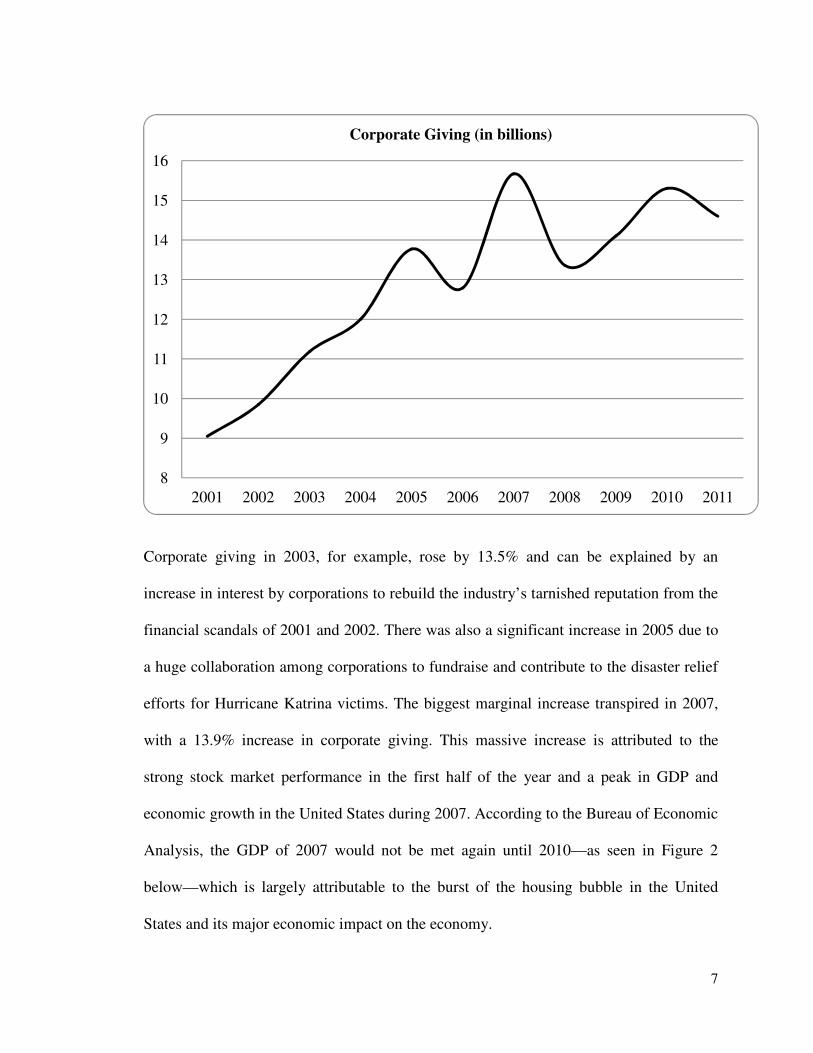
61.3% increase. However, as seen in the graph below, corporate giving in the United
States did not increase steadily over the decade, signifying that certain social and
economic events impacted corporate philanthropy.
10 "Giving USA." Donations Barely Grew at All Last Year, 19 June 2012. Web. 01 Oct. 2012. <http://philanthropy.com/article/Donations-Barely-Grew-at-All/132367/>. 11 "2001 Giving USA Study Released." OMB Watch. 21 June 2002. Web. 26 Sept. 2012. <http://www.ombwatch.org/node/718>.
7
Corporate giving in 2003, for example, rose by 13.5% and can be explained by an
increase in interest by corporations to rebuild the industry’s tarnished reputation from the
financial scandals of 2001 and 2002. There was also a significant increase in 2005 due to
a huge collaboration among corporations to fundraise and contribute to the disaster relief
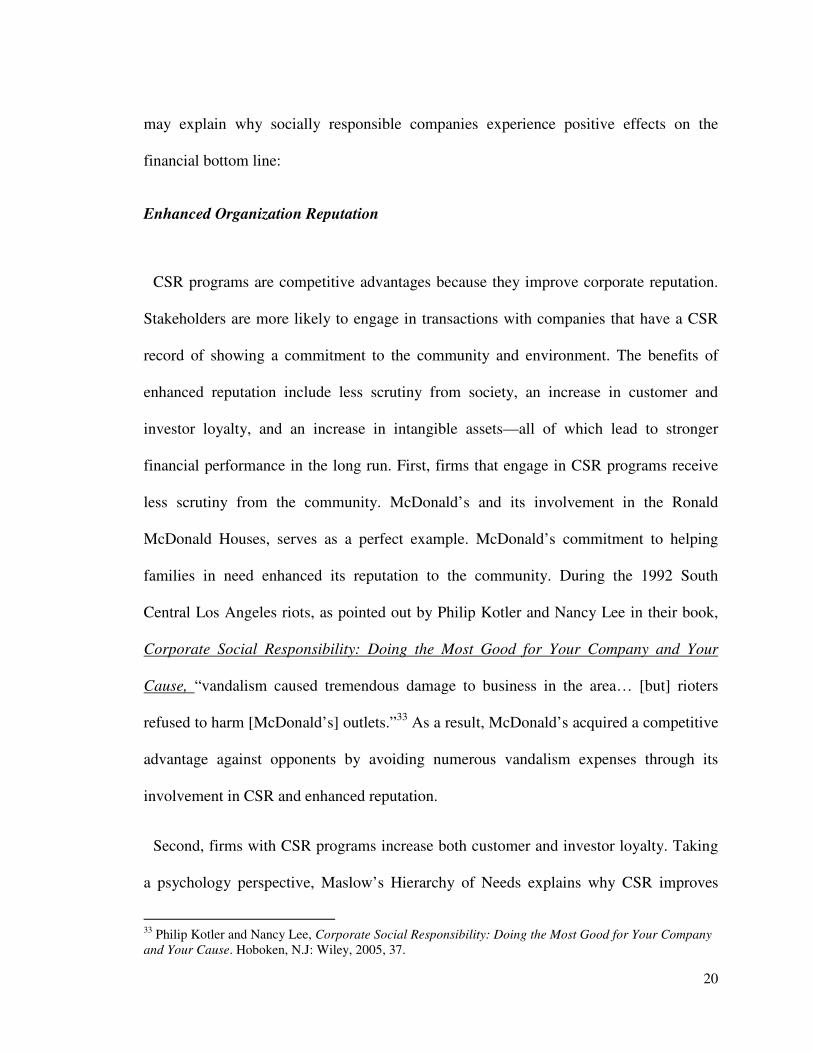
efforts for Hurricane Katrina victims. The biggest marginal increase transpired in 2007,
with a 13.9% increase in corporate giving. This massive increase is attributed to the
strong stock market performance in the first half of the year and a peak in GDP and
economic growth in the United States during 2007. According to the Bureau of Economic
Analysis, the GDP of 2007 would not be met again until 2010—as seen in Figure 2
below—which is largely attributable to the burst of the housing bubble in the United
States and its major economic impact on the economy.
8
9
10
11
12
13
14
15
16
2001 2002 2003 2004 2005 2006 2007 2008 2009 2010 2011
Corporate Giving (in billions)
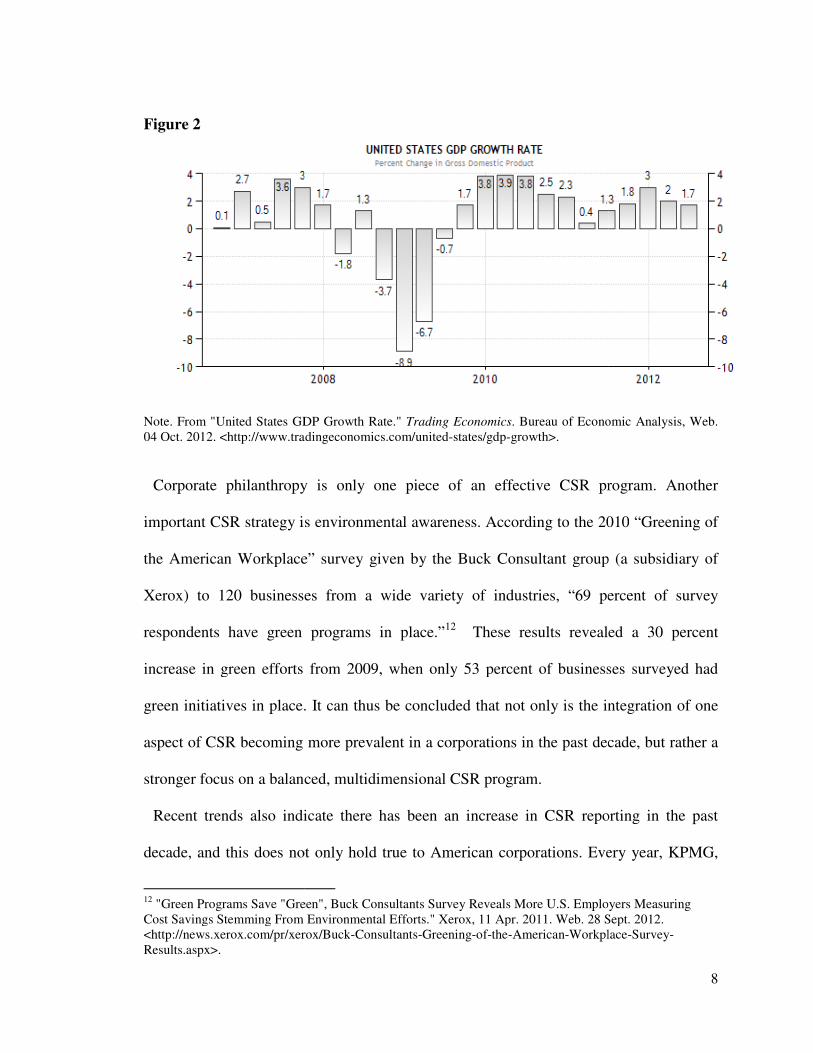
Figure 2
Note. From "United States GDP Growth Rate." 04 Oct. 2012. <http://www.tradingeconomics.com/united
Corporate philanthropy is only one piece of an effective CSR program. Another
important CSR strategy is environmental awareness.
the American Workplace” survey given by the Buck Consultant group (a subsidiary of
Xerox) to 120 businesses
respondents have green programs in place
increase in green efforts from
green initiatives in place.
aspect of CSR becoming more prevalent in a corporations
stronger focus on a balance
Recent trends also indicate there has been
decade, and this does not only hold
12 "Green Programs Save "GreCost Savings Stemming From Environmental Efforts." Xerox, 11 Apr. 2011. Web. 28 Sept. 2012. <http://news.xerox.com/pr/xerox/BuckResults.aspx>.
Note. From "United States GDP Growth Rate." Trading Economics. Bureau of Economic Analysis, Web. 04 Oct. 2012. <http://www.tradingeconomics.com/united-states/gdp-growth>.
Corporate philanthropy is only one piece of an effective CSR program. Another
important CSR strategy is environmental awareness. According to the 2010
American Workplace” survey given by the Buck Consultant group (a subsidiary of
Xerox) to 120 businesses from a wide variety of industries, “69 pe
green programs in place.”12 These results revealed a 30 percent
increase in green efforts from 2009, when only 53 percent of businesses surveyed had
green initiatives in place. It can thus be concluded that not only is the integration of
aspect of CSR becoming more prevalent in a corporations in the past decade, but
balanced, multidimensional CSR program.
Recent trends also indicate there has been an increase in CSR reporting
not only hold true to American corporations. Every year, KPMG,
"Green Programs Save "Green", Buck Consultants Survey Reveals More U.S. Employers Measuring Cost Savings Stemming From Environmental Efforts." Xerox, 11 Apr. 2011. Web. 28 Sept. 2012. <http://news.xerox.com/pr/xerox/Buck-Consultants-Greening-of-the-American-Workplace
8
. Bureau of Economic Analysis, Web.
Corporate philanthropy is only one piece of an effective CSR program. Another
2010 “Greening of
American Workplace” survey given by the Buck Consultant group (a subsidiary of
, “69 percent of survey
revealed a 30 percent
only 53 percent of businesses surveyed had
the integration of one
in the past decade, but rather a
an increase in CSR reporting in the past
Every year, KPMG,
en", Buck Consultants Survey Reveals More U.S. Employers Measuring Cost Savings Stemming From Environmental Efforts." Xerox, 11 Apr. 2011. Web. 28 Sept. 2012.
Workplace-Survey-
9
one of the Big Four accounting firms, publishes “The State of Global Corporate Social
Responsibility Reporting” report, which includes research on the CSR programs of global
organizations. In the 2011 report, the Global Fortune Top 250 companies were reviewed.
The report found that 95% of global companies issue annual CSR reports that summarize
their CSR initiatives.13 In comparison, the 2002 KPMG report disclosed that only “45%
published a separate corporate report on their performance.”14 In sum, the last decade has
realized a 111% increase in CSR reporting to stakeholders. Other avenues for CSR
reporting include corporate webpages, advertising, and separate annual reports on
community giving or green programs. In addition, increased reporting is beginning to be
strengthened by independent third party assurance. PricewaterhouseCoopers works with
Craib Design & Communications to publish an annual “CSR Trends” report, conducting
CSR research on global organizations. In the 2010 report, 423 companies in multiple
countries were reviewed. The report showed that 31% of companies have their annual
CSR reports assured by third parties.15 By doing this, corporations enhance the validity of
their CSR reports to stakeholders. Similar to financial statement audits—which provide
assurance from third parties stating the company’s true actions are reflected in the
financial statements—audits of CSR programs increase the trust and confidence
stakeholders have in the organization.
1.2.3 Corporate Social Initiatives
13 KPMG International Survey of Corporate Responsibility Reporting 2011. Publication. KPMG, 2011. Print. 14 KPMG International Survey of Corporate Sustainability Reporting 2002. Publication. KPMG, 2002. Print. 15 CSR Trends 2010: Stacking Up the Results. Publication. PricewaterhouseCoopers, 2010. Print.
10
A comprehensive, multidimensional CSR program consists of three major categories:
environmental, social, and governance. Within each category are specific CSR initiatives.
The initiatives below are all incorporated into the CSP measurement of the CSR dataset
used for this study provided by MSCI Inc.
Environment
Effective sustainability programs include sustainable products, pollution prevention,
recycling, and clean energy. Sustainability efforts are based on a single principle: to
minimize the environmental footprint of a corporation’s operations and maximize
sustainability. An example of a sustainable environmental CSR initiative is Cisco
Systems’ initiative called “Cleaner Air and Millions in Savings.”16 Cisco designed their
headquarters in San Jose, CA, “to exceed California's state Title 24 energy standards by
15 to 20%.”17 They have done this by investing in energy-efficient lighting, motion
detector lights, and computerized temperature controls. As a result, the company saves
enough energy to power 5,500 homes for a year,18 and has minimized their environmental
footprint. Cisco benefits from reduced operating costs and the environment benefits from
“almost 50 million fewer pounds of carbon dioxide per year and 14,300 fewer pounds of
nitrogen oxide.”19 One criticism of this program is that it is not CSR, but rather a cost
reduction program. However, based on the definition of CSR used in this paper, Cisco’s
program exceeded the environmental laws, and thus the program is justifiable classified
16Philip Kotler and Nancy Lee, Corporate Social Responsibility: Doing the Most Good for Your Company
and Your Cause. Hoboken, N.J: Wiley, 2005, 213. 17 "Case Study: Energy Efficiency in Design and Construction." Cisco. Web. 05 Oct. 2012. <http://www.cisco.com/web/about/ac227/ac228/ac229/about_cisco_corp_citi_case_study.html>. 18 "Case Study: Energy Efficiency in Design and Construction." Cisco. 19 "Case Study: Energy Efficiency in Design and Construction." Cisco.
11
as CSR. Additionally, I argue in the conclusion of this paper that the title “CSR” must be
changed to corporate shared value (CSV) to eliminate such criticisms and strengthen such
programs in the future.
Social
Effective social programs include community, human rights, employee relations,
diversity, and product safety initiatives. Community initiatives can be accomplished
through cause-related marketing and corporate philanthropy. Cause-related marketing is
when a “corporation commits to making a contribution or donating a percentage of
revenues to a specific cause based on product sales,”20 and usually involves a corporation
partnering with a non-profit organization. This initiative has the potential to create a
mutually beneficial relationship between the corporation and non-profit because it
generates additional sales of a product and financial support for the non-profit. An
example of an effective cause-related marketing strategy is Yoplait’s “Save Lids to Save
Lives.”21 In this program, customers must clip and collect pink lids from purchases of
Yoplait yogurt and send them into General Mills. For every lid received, General Mills
will donate 10 cents to Susan G. Komen for the Cure for a certain time period.
Corporate philanthropy is when a corporation makes a direct donation to a charity or
cause. In 2010, the corporation that gave the most was Kroger, the largest grocery store
20 Philip Kotler and Nancy Lee, Corporate Social Responsibility: Doing the Most Good for Your Company
and Your Cause. Hoboken, N.J: Wiley, 2005, 114. 21 "Participating Is Simple." Save Lids to Save Lives. Yoplait, Web. 05 Oct. 2012. <https://savelidstosavelives.com/HowItWorks?Length=0>.
12
chain in America,22 giving $64 million (10% of its profits). Kroger gives millions of
dollars each year to fund K-12 education, hospitals, non-profits, and religious
organizations. Organizations they serve include the Salvation Army, Boys & Girls Clubs,
United Way, and numerous schools.
Other social initiatives include human rights, employee relations, diversity, and product
safety initiatives. Companies with strong human rights initiatives ensure a two-way
communication between employees, customers, and corporate executives exist. In
addition, the companies do not violate such rights as child labor, privacy, and fairness.
Employee relations initiatives include having good union relations, strong health
programs, and strong benefit programs. Diversity initiatives embrace actions to increase
the women and minority populations of the organization, including increasing their
representation on the Board of Directors. Product safety initiatives serve to ensure the
products are safe to use.
Governance
Corporate governance is the “framework of rules and practices by which a board of
directors ensures accountability, fairness, and transparency in a company's relationship
with its stakeholders (financiers, customers, management, employees, government, and
the community).”23 Governance applies to CSR because it is essential that corporations
issue comprehensive, high-quality CSR reports. A corporation’s CSR program cannot
affect financial performance if there is no CSR report or advertisement of the CSR
22 Emerson, Greg. "The 10 Most Charitable Companies in America." Yahoo! Finance. 2 Dec. 2011. Web. 05 Oct. 2012. <http://finance.yahoo.com/news/the-10-most-charitable-companies-in-america.html>. 23 "Corporate Governance." Definition and Meaning. N.p., n.d. Web. 05 Oct. 2012. <http://www.businessdictionary.com/definition/corporate-governance.html>.
13
initiatives in some form because stakeholders are not aware of CSR programs being
implemented. For this reason, proper governance, or transparency and completeness in
CSR reporting, is an integral part of an effective CSR program.
CHAPTER 2: LITERATURE REVIEW
The exponential increase in expenditures to enhance the social responsibilities of
corporations in the past decade suggests managers find an economic benefit from CSR
programs, especially considering the financial objective of a corporation is to maximize
shareholder’s wealth. However, empirical studies of CSP and financial performance
started over three decades ago and the results of these studies have been mixed. There are
three possible results for the relationship between CSP and CFP: negative association, no
association, and positive association. The empirical studies that have the most
comparable methodology for measuring CSP and CFP to this study will be discussed for
each of the three conclusions, as well as the possible reasoning behind each conclusion.
2.1 Negative Association
Lopez et al. (2007) analyzed CSP and financial performance across the years
2002-2004 and found a negative relationship. To measure financial performance, the
study used the accounting measure of profit/loss before taxes. To measure CSP, the study
used the Dow Jones Sustainability Index (DJSI) and the sample consisted of 110
European firms. The study controlled for industry, size, and risk. The theory behind this
14
finding is companies that engage in CSR programs are at a disadvantage because they are
incurring unnecessary and avoidable costs. One limitation of this study is that it only
analyzes the short-run relation between CSP and financial performance, concluding that
“the effect of sustainability practices on performance indicators is negative during the
first years in which they are applied”24 and suggests long-term research must be done to
strengthen such a conclusion. The finding of a negative correlation between CSR and
CFP, though an uncommon finding compared to other similar empirical studies, indicates
that more current research needs to be done on this topic.
2.1.1 Milton Friedman
Similar to the Lopez et al. (2007) study, Milton Friedman—economist and Nobel
Prize laureate—argues that CSR and CFP have a potential negative relationship. In his
1970 article in the New York Times, “The Social Responsibility of Business is to Increase
its Profits,”25 Friedman takes a capitalist position and refutes the popular belief that
businesses have social responsibilities. He argued that a “corporation is an artificial
person” and therefore cannot have real responsibilities. Instead, the corporation’s
executives are the people who hold the responsibilities. They have a “direct [social]
responsibility to [their] employers,” and must conduct the business in a way that
maximizes profits while respecting the law and ethical norms. Corporate executives who
take socially responsible actions with business assets are violating the free enterprise
America is based upon because it is essentially taxation without representation, since it is
24 Lopez, M., Garcia, A., & Rodriguez, L. (2007). Sustainable development and corporate performance: A study based on the Dow Jones Sustainability Index. Journal of Business Ethics,75, 285–300. 25 Friedman, Milton. "The Social Responsibility of Business Is to Increase Its Profits."
15
essentially “spending someone else’s money.” Businesses who decide to engage in
socially responsible actions risk losing the support of stakeholders who enable them to
generate profits, and this cost greatly outweighs any benefit of social contributions. True
social responsibility, Friedman argues, instead lies with the benefactors of the
corporation’s profits—customers, employees, and shareholders—to use their returns (in
the form of dividends, bonuses, etc.) to invest in society. Friedman’s definition of
corporate social responsibility, therefore, is taking an action external to profit
maximization to improve the community and environment. He claims that it is
executive’s sole social responsibility to maximize the firm’s value, which indirectly
enables stakeholders to uphold their social responsibilities by “spending [their] own
money, not someone else’s” to improve the environment and community.
On the surface of his argument, it appears that Friedman believes businesses should
not adopt corporate social responsibility (CSR) programs because they are outside the
profit-making scope. However, this is a misperception. Progressing deeper into his
argument, it is revealed that Friedman supports the integration of CSR programs into
business operations, but does not support businesses labeling them as social responsibility
initiatives. Friedman redefines CSR programs as profit-making programs, because he
believes “social responsibility is frequently a cloak for actions that are justified on other
grounds rather than a reason for those actions.” In other words, he believes true social
responsibility is absolute altruism, or in no way linked to self-interest. In contrast, a
business executive is a reciprocal altruist—one who expects some economic benefit in
return for a socially responsible action—when they engage in CSR programs.
16
The first requirement for Friedman to support a company’s CSR program is re-
titling the programs to acknowledge the expected reciprocity. For example, Friedman
would support a company’s CSR program if the company stated a purpose for engaging
in a program was cost reduction, or even marketing, since it reveals the positive financial
impact the company expects in return for being socially responsible. The second
requirement to receive Friedman’s support of a company’s CSR program is ensuring the
program has a positive impact on financial performance. Friedman states in the article
that CSR programs are only justified if they will increase, rather than sacrifice, firm
value:
“It may well be in the long run interest of a corporation that is a major employer
in a small community to devote resources to providing amenities to that
community or to improving its government. That may make it easier to attract
desirable employees, it may reduce the wage bill or lessen losses from pilferage
and sabotage or have other worthwhile effects. Or it may be that, given the laws
about the deductibility of corporate charitable contributions, the stockholders can
contribute more to charities they favor by having the corporation make the gift
than by doing it themselves, since they can in that way contribute an amount that
would otherwise have been paid as corporate taxes.”26
In comparison with the Lopez et al. (2007) study, Milton Friedman argues that CSP and
CFP have a negative relationship if the second requirement is not met. In contrast,
Friedman would argue that CSR programs have a positive relationship in the long run if
both requirements are met.
2.2 Null Hypothesis
The empirical and theoretical studies to date also propose a second possibility: that
there is simply no relationship between corporate social responsibility and financial
26 Friedman, Milton. "The Social Responsibility of Business Is to Increase Its Profits."
17
performance. The most recent and reliable empirical study finding an uncertain or no
relationship is the 1985 study conducted by Aupperle et al. (1985). The four components
of CSR programs in this study were economic, legal, ethical, and philanthropic
responsibilities. In order to avoid some methodological problems of measuring CSP in
previous studies, they created their own measurement for CSP and, through empirical
testing, concluded their methodology was reliable. Their measure included the surveying
of 241 CEOs. To measure financial performance, they used return on assets (ROA) and
“employed both short-term (one year) and long-term ROA (five years).”27 The study
concluded that there is no statistically significant relationship between social
responsibility and financial performance; “it did not matter whether short-term or long-
term ROA were used, nor did it matter if that indicator were adjusted or unadjusted for
risk.” Not only does this study highlight another possible relationship between CSR and
CFP, but that methodology for measuring CSP can influence the relationship. In order for
the conclusion of such a study to be valid, using a valid and reliable methodology to
measure CSP is crucial.
One question remains: how can no relationship exist between CSP and CFP? A
theoretical study conducted by Ullman (1985) attempts to answer this question. Ullman
conjectured there are so many intervening variables between CSP and CFP that there is
no reason to expect any relationship at all.28 Additionally, Ullman indicated there are
many measurement problems that still exist to measure the intangible impacts of
27 Aupperle, K.E., A.B. Carroll, and J.D. Hatfield: 1985, ‘An empirical examination of the relationship between corporate social responsibility and profitability’, Academy of Management Journal 28: 458. 28 Ullmann, A. 1985, 'Data in search of a theory: A critical examination of the relationships among social performance, social disclosure, and economic performance of US firms', Academy of Management
Review 10 no. 3: 541.
18
corporate social responsibility. Current measurements of CSP involve certain amounts of
judgment since all components of CSR are not as quantitative as dollars spent on CSR
programs, so the validity of such measures may confound CSP and CFP results. The
awareness levels of stakeholders to a corporation’s CSR programs may also contribute
the null hypothesis. If stakeholders are not aware of the CSR programs due to ineffective
marketing, the programs cannot affect their decisions and attitudes toward the
corporation, and thus will not impact financial performance.
2.3 Positive Association
The instrumental stakeholder theory is formed from two theories, and suggests there is a
positive relationship between CSP and CFP.29 First, the instrumental theory is an
economic theory that predicts what results will occur as a result of management
decisions.30 The second theory, the stakeholder theory, is an ethical theory that proposes
managers have a duty to put stakeholders’ needs first in order to increase the value of the
firm. This theory is broader than the shareholder theory, which argues managers only
have a duty to maximize the value of shareholders, as Milton Friedman supports. The
instrumental stakeholder theory, then, asserts that stakeholder satisfaction influences
financial performance (Jones, 1995).31 Furthermore, this theory asserts that corporate
executives can increase the efficiency of their organizations by aligning the business to
meet the desires of stakeholders. Past empirical evidence emphasizes that stakeholders as
a whole find some value in CSR programs. Therefore, the instrumental stakeholder
29 Jones, T.M. (1995). “Instrumental stakeholder theory: a synthesis of ethics and economics.” Academy of
Management Review, 20, 430 30 Jones, T.M. (1995). “Instrumental stakeholder theory: a synthesis of ethics and economics.” 406 31 Jones, T.M. (1995). “Instrumental stakeholder theory: a synthesis of ethics and economics.” 406
19
theory suggests CSR programs increase stakeholder satisfaction and ultimately, financial
performance.
The majority of recent empirical and theoretical studies on CSP and CFP indicate
they are positively associated. The most comprehensive study with positive results was a
meta-analysis conducted by Orlitzky et al. (2003).32 A meta-analysis is a strong method
of research because it weighs the parameters of individual studies, as opposed to
aggregating studies. This specific meta-analysis examined 52 studies with a 33,878
sample size over a 30-year span. Orlitzky concluded that not only does CSP have a
positive influence on CFP, but vice versa as well, hinting that a bidirectional relationship
exists between the two variables. This conclusion supports the instrumental stakeholder
theory because managers reap financial benefits by meeting the needs of stakeholders.
Due to reciprocal benefits of the relationship between stakeholders and the organization,
this study supports the position that CSR programs are associated with multiple tangible
financial benefits in the long-run.
2.3.1 Factors Contributing to a Positive Association
The increase in expenditures in CSR projects in the past decade suggests managers find
an economic benefit from CSR programs. Recent studies show that most of the studies
find a positive relationship (van Beurden and Gossling, 2008; Wu, 2006; Allouche and
Laroche, 2005; Goll and Rasheed, 2004; Orlitzky, 2003) Here are a few examples that
32 Orlitzky, M., F. L. Schmidt, and S. L. Rynes. "Corporate Social and Financial Performance: A Meta-Analysis." Organization Studies 24.3 (2003): 403-41.
20
may explain why socially responsible companies experience positive effects on the
financial bottom line:
Enhanced Organization Reputation
CSR programs are competitive advantages because they improve corporate reputation.
Stakeholders are more likely to engage in transactions with companies that have a CSR
record of showing a commitment to the community and environment. The benefits of
enhanced reputation include less scrutiny from society, an increase in customer and
investor loyalty, and an increase in intangible assets—all of which lead to stronger
financial performance in the long run. First, firms that engage in CSR programs receive
less scrutiny from the community. McDonald’s and its involvement in the Ronald
McDonald Houses, serves as a perfect example. McDonald’s commitment to helping
families in need enhanced its reputation to the community. During the 1992 South
Central Los Angeles riots, as pointed out by Philip Kotler and Nancy Lee in their book,
Corporate Social Responsibility: Doing the Most Good for Your Company and Your
Cause, “vandalism caused tremendous damage to business in the area… [but] rioters
refused to harm [McDonald’s] outlets.”33 As a result, McDonald’s acquired a competitive
advantage against opponents by avoiding numerous vandalism expenses through its
involvement in CSR and enhanced reputation.
Second, firms with CSR programs increase both customer and investor loyalty. Taking
a psychology perspective, Maslow’s Hierarchy of Needs explains why CSR improves
33 Philip Kotler and Nancy Lee, Corporate Social Responsibility: Doing the Most Good for Your Company
and Your Cause. Hoboken, N.J: Wiley, 2005, 37.
21
customer loyalty. Maslow’s needs are frequently portrayed in the shape of a pyramid,
with the most basic needs at the bottom. The first is physiological needs—needs
necessary for survival like food and water. The second is safety needs like personal,
health, and financial safety. The third is the need to belong. This need includes forming
emotionally significant relationships with friends and family. The fourth need is esteem,
which encompasses the need to be respected and valued by others. The last need, self-
actualization, is becoming everything one is capable of becoming.34
CSR programs enable companies to meet their customers’ need beyond
belonging. Customers sacrifice a portion of their net worth to a company when they
engage in a sales transaction. Their sense of belonging to that company thereby inevitably
increases. However, CSR programs also improve the esteem of customers because they
enable customers to feel more valued by society since they are helping improve the
community with their consumer decisions. CSR programs also boost customer’s abilities
to reach self-actualization because they provide convenient ways to contribute and
customers receive personal benefits in return: the benefit of the service or product
received and enhanced self-purpose for making a contribution to the society. Again,
companies with CSR programs gain a competitive advantage because their customer base
becomes more stable. Maslow’s Hierarchy of Needs applies to investors as well because
they are motivated to reach self-actualization and thus are more loyal to companies with
CSR programs. In addition to loyalty, investors are also more likely to invest in
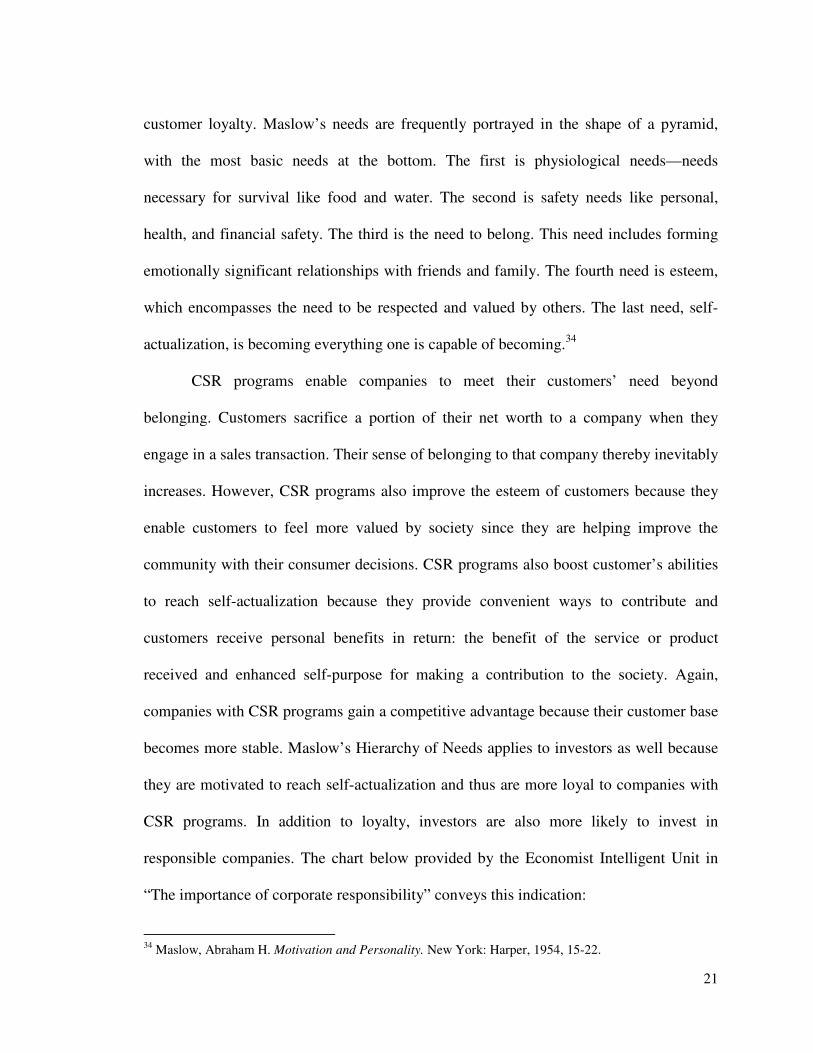
responsible companies. The chart below provided by the Economist Intelligent Unit in
“The importance of corporate responsibility” conveys this indication:
34 Maslow, Abraham H. Motivation and Personality. New York: Harper, 1954, 15-22.
22
Figure 3
Note. From “The importance of corporate responsibility.” Economist Intelligence Unit, 33.
In sum, 85% of the 64 institutional investors surveyed in 2004 considered the company’s
CSR programs to some extent when making an investment decision. Interestingly, 22%
of investors surveyed would still invest in a company if it were performing slightly below
its peers because the company’s commitment to social responsibility.
Lastly, CSR programs can strengthen brand value, an intangible asset on the financial
statements. In 2009, Tiago Melo from the University of Salamanca found that “CSR
impacts positively on brand value.”35 Brand value measurements were extracted from the
“Most Valuable Brands” reports—created by the consultancy firm Interbrand—published
annually by the Financial Times. The KLD Index database was used to measure CSR and
the study controlled for risk, size, and research & development investment. Financial
performance was measured by market value added (MVA). This study incorporated the
35 Tiago Melo. "Effects of Corporate Social Responsibility on Brand Value." Thesis. Universidad De Salamanca, 2009, 22.
23
view that CSR has a stronger impact on intangible assets than financial returns. As
opposed to other similar studies, this study compared CSR to both intangible and tangible
financial performance indicators. It was concluded that brand value had a stronger
positive relationship to CSR than MVA. The study, therefore, concluded that firms
benefit economically from the implementation of CSR programs because they increase
intangible assets on the balance sheet.
Increased Sales
Another potential explanation for a positive associate between CSP and CFP is that
CSR programs are revenue generators36—especially in the long run—either through an
increased customer base or an ability to increase prices. Evidence from the Corporate
Social Responsibility Perceptions Survey in 2010 supports this claim. Conducted by the
research-based consultancy Penn Schoen Berland with brand consulting firm Landor
Associates and strategic communications firm Burson-Marsteller, the 2010 survey was
based on 1,001 online interviews with U.S. consumers. The results indicated that
“American consumers are willing to pay a premium for goods from socially responsible
companies, with 70 percent saying they would pay more for a $100 product from a
company they regard as responsible.”37 More research must be done to determine how
much more they are willing to pay, but these results illuminate that corporations may be
able to benefit from increased revenues with CSR actions. However, a possible limitation
36 Orlitzky, M. (2008). Corporate social performance and financial performance: A research synthesis. In A. Crane, A. McWilliams, D. Matten, J. Moon, & D. S. Siegel (Eds.), The Oxford Handbook of CSR. Oxford, UK: Oxford University Press. 121. 37 Corporate Social Responsibility Branding Survey. Publication. Penn Schoen Berland, 2010.
24
is whether the increase in revenue covers the increase in cost of CSR implementation in
the long-run.
Customer base is also potentially increased with CSP, which generates increases in
sales. In 2010, Cone Communications surveyed 1,057 US consumers and found that
“80% are likely to switch brands, similar in price and quality, to one that supports a
cause.”38 Referring back to Maslow’s Hierarchy of Needs theory, consumers want more
from a corporation than a product; they derive self-concept from their membership in
social groups. What a person chooses to consume affects his/her identity, so consumers
can improve their own identity and reputation by identifying with a corporation’s
commitment to CSR initiatives. By giving consumers more of a reason to identify with a
reputable brand, corporations can benefit with an increase in market share, and ultimately
a boost in sales revenue. However, one limitation is that the implementation of CSR
initiatives may be coupled with increased prices, so customer base can potentially
decrease if less people are willing to buy the products at a premium, despite the added
value of CSR programs.
Increased Ability to Attract Better Employees
Corporations with CSR programs have a competitive advantage because they attract
better employees. There is empirical evidence behind this claim (Backhaus, 2002). The
study explored the relation between CSP and employer attractiveness. Using a quasi-
experimental design, 297 undergraduate business student participants were first asked to
rate companies based on what they already knew about the company. They were then
38 2010 Cone Cause Evolution Study. Cone Communications, 2010.
25
asked to rate the same companies again after learning more about their CSR programs.
Bias was controlled with a test-retest, and gender and student status were also controlled.
Results indicated that that “job seekers consider CSR records important at all stages of
the job search, but most important when determining whether to take a job offer.”39 Thus,
companies with CSR programs attain competitive advantage by receiving the benefit of
attracting a larger pool of employees to select from. Not only do employers benefit from
a larger pool of employees, but CSR programs help improve employee relations once
they sign on the new employees. When employees see that their employer is committed
to human rights and corporate governance issues, or committed to ensuring their
employees work in fair conditions, employee morale increases. This leads to increased
productivity in the long-run, and ultimately to improved financial performance.
Decreased Operating Costs
One argument against CSR programs is it is an increase in cost and thus clashes with
the objective of a business. However, this is a short-term focus, and when implemented
correctly, CSR programs can actually decrease operating costs in the long run. When
combined with the other many bottom-line financial benefits of CSR programs, the effect
seems to be greater than the increase in cost of CSR implementation. One example of a
strong cost-reducing CSR program is a sustainability effort from Herman Miller in 1991.
The company built an $11 million energy-saving and pollution reducing heating and
cooling plant—acting in excess of the current environmental laws— and “saved $750,000
39 Backhaus, K. B., Stone, B. A. and Heiner, K. (2002). Exploring the relationship between corporate social performance and employer attractiveness. Business and Society, 41:3, 292-318.
26
per year in fuel and landfill costs.”40 In the long-run, it would only take 15 years for the
cost of the plant to be covered by the savings in energy costs, with the additional benefits
of improved corporate reputation and environmental condition for building the plant.
Reduced Business Risk
“Reputation is the strongest determinant of any corporation’s sustainability. Stock price
can always come back. Business strategies can always be changed. But when an
organization’s reputation is gravely injured, its recovery is difficult, long-term, and
uncertain. A risk to its reputation is a threat to the survival of the enterprise.”41
– Peter J. Firestein
Peter Firestein acknowledges that the stronger a company’s reputation, the lower
the business risk, and this claim is supported by a meta-analytical study conducted by
Orlitzky and Benjamin in 2001.42 Corporate culture culminates from the actions of top
executives, and reputation is developed through the values of trust, credibility, reliability,
quality, and consistency. If top executives allow unethical or negligent behavior, this will
affect the company’s reputation in the long run. For example, consider a small business
that sells motorcycle parts. The employees of this business all have motorcycles, and it is
a common practice for management to allow certain employees to take parts they need
for their personal motorcycles. A new employee, in response, may feel it is acceptable to
take parts for himself/herself and close friends. The leniency of management, in turn,
created a culture of theft and disrespect for company assets. However, corporate culture
can become rooted in ethical practices when management partakes in CSR strategies.
40 Hartley, Robert F. Management Mistakes and Successes. Hoboken, NJ: Wiley, 2011. 37. 41 Firestein, Peter J. "Building and Protecting Corporate Reputation." Strategy & Leadership 34.4 (2006): 26. 42 Orlitzky, M., & Benjamin, J. D. (2001). Corporate social performance and firm risk: A meta-analytic review.
27
When management creates a culture that emphasizes a strong commitment to
transparency and ethical business practices, the risk of negligent practices are reduced, as
well as risk of lawsuits.
Companies that do not link a comprehensive CSR program with risk management “can
leave a company vulnerable, with no appropriate controls or countermeasures.”43 In 1996,
the reputation of Nike was in question when a New York Times column accused the
company of an unethical profitability strategy: using sweatshops for manufacturing to
reduce operating costs.44 In response, Nike began incorporating spot audits into its
business, hiring accounting firms to give stakeholders assurance that Nike’s global
employees worked in satisfactory labor conditions. However, this proved to be
insufficient when Nike failed some spot audits and labor activists continued striking. In
response, Nike developed a CSR program that incorporated labor issues and the opinions
of stakeholders. The programs focused on the development of labor standards, and
through the “Global Alliance for Workers and Communities, Nike interviewed 9,000
young workers in their Indonesian suppliers about their needs.”45 This example illustrates
not only that CSR programs help improve a company’s reputation, but can also help
reduce business risk. Specifically, the risk of losing stakeholder loyalty for committing
unethical labor practices. However, Nike began to mend their relationship with
stakeholders by integrating their opinions into the new CSR strategies. This example also
43 Beth Kytle and John G. Ruggie, Corporate Responsibility as Risk Management: A Model for
Multinationals, Corporate Social Responsibility Initiative, Kennedy School of Government, March 2005, 14 44 Greenhouse, Steven. "Nike Shoe Plant in Vietnam Is Called Unsafe for Workers." Nike Shoe Plant in
Vietnam Is Called Unsafe for Workers 8 Nov. 1997. 45 Beth Kytle and John G. Ruggie, 14
28
highlights that companies reap the full economic benefits of CSR strategies when the
programs are integrated with core business functions and the interests of stakeholders.
CHAPTER 3: HYPOTHESIS
While there is an abundance of research on CSP and CFP, no study has examined the
most recent years (2001-2005) and looked specifically at CSP’s impact on difference
measures of sales. Based on the analysis for each of the three possible associations in the
Literature Review, there is stronger support for a positive association between CSP and
financial performance. Accordingly, I structure my hypothesis to support a positive
association between CSP and sales measures:
Hypothesis 1(a): Improved CSR performance leads to an increase in sales.
Hypothesis 1(b): Improved CSR performance leads to an increase in gross
margin.
Prior studies suggest that firms reap a financial benefit (specifically, an increase in ROA)
from engaging in CSR programs (Allouche and Laroche, 2005; Goll and Rasheed, 2004;
Orlitzky, 2003). Orlitzky et al (2003) argued that another economic benefit of CSR
programs is an increase in revenue. As discussed in Section 2.3.1, studies have shown
that CSR initiatives lead to an increase in customer base because customers are willing to
switch brands for a company that supports a cause, which translates into increases in
revenue. In addition, customers build self-identity through consumption choices, and will
switch to brands with effective CSR initiatives to enhance their self-identities. Even if
29
companies decide to increase prices of products/services to offset the cost increase of
CSR implementation in the short-run, I propose that the cost of the premium is less than
the added value of the CSR programs to consumers, and thus consumers are still willing
to switch brands and customer base increases. Since I assume in this study that increases
in CSR expenditures leads to increased CSP, I propose that improved CSP leads to
increases in sales (Hypothesis 1a).
Referring back to “Increased Sales” in Section 2.3.1, the Burson-Marsteller study
supported Orlitzky’s notion, finding that “American consumers are willing to pay a
premium for goods from socially responsible companies.”46 A reason behind this finding
is that consumers find a value from the program that makes the cost increase seem trivial.
This fact hints that corporations with effective CSR programs also experience an increase
in gross margin, holding cost of goods constant, and Hypothesis 1(b) is supported by this
claim.
If results indicate that CSP positively impacts sales measures, it must be
investigated why this happens so companies can create sales strategies to maximize the
impact. An increase in sales would suggest that CSR programs help increase customer
base because more customers are willing to switch brands to buy the products or services
of a socially responsible firm. An increase in gross margin, on the other hand, would
indicate that some customers are willing to pay a higher price for the products or services
of companies with effective CSR programs.
46 Corporate Social Responsibility Branding Survey. Publication. Penn Schoen Berland, 2010.
30
CHAPTER 4: METHODOLOGY
4.1 Data Sources
4.1.1 Measuring Financial Performance
Both hypotheses involve analyzing the impact CSP has on two financial variables: sales
and gross margin. I will measure sales two ways: total sales to total assets ratio and total
sales to number of employees ratio. I scale total sales in order to receive a more reliable
conclusion. Second, I measure gross margin as the gross profit to total sales ratio.
However, before I can justifiably test my hypotheses, I replicate my data with the
methodology used by a previous study concerning CSP and financial performance to
ensure CSP has a significant relation with CFP. Most previous literature and empirical
studies use accounting data to measure financial performance, as opposed to market-
based measures (Waddock and Graves, 1997; Simpson and Kohres, 2002). The three
most used measurements for financial performance are return on assets (ROA), return on
sales (ROS), and return on equity (ROE). To parallel the majority of studies, this study
will focus on accounting-based measures of CFP and define financial performance as
return on assets (ROA). Based on a Harvard Business Review article, the best way to
measure company performance is ROA because “ROA explicitly takes into account the
assets used to support business activities. It determines whether the company is able to
generate an adequate return on these assets rather than simply showing robust returns on
sales.”47 Implications for analyzing CFP based on accounting measures include the
47 John Hagel, III, and John Seely Brown. "HBR Blog Network." Harvard Business Review. 4 Mar. 2010. Web. 06 Oct. 2012. <http://blogs.hbr.org/bigshift/2010/03/the-best-way-to-measure-compan.html>.
31
possibility of distortions from inflation (Demsetz and Villalonga, 2001) and bias from
differences in accounting methods across corporations. However, ROA is the accounting
variable least likely to be manipulated (Yoshikawa and Phan, 2003). I will measure ROA
as net income divided by total assets. The source of the financial data is the
COMPUSTAT database.
4.1.2 Measuring Corporate Social Performance
One central explanation for the ambiguity in the relationship between CSP and financial
performance is the problem in measuring CSP. Past studies have used a wide variety of
methods to measure CSP: self-constructed surveys (Aupperle, 1991), The Fortune
reputation survey (Brown and Perry, 1994), the Dow Jones Sustainability Index (Lopez et
al., 2007), CRO’s Best Corporate Citizens (Wallace et al., 2009), and the KLD Index
developed by Kinder, Lydenberg, Domini and Co (Waddock and Graves, 1997; Hull and
Rothensberg, 2008). CSP is very multidimensional because it is comprised of both
internal (governance, employees, etc.) and external (environmental and community
impact) factors that must be considered when measuring CSP. The CSP measurement
that incorporates these measures the best to account for the complexity of CSR initiatives
is the KLD Index, which was changed to the MSCI ESG (Environmental, Social, and
Governance) Index in 2011 after a change of data ownership from KLD to MSCI Inc. For
this reason, this study will use the MSCI Index to measure CSP.
Launched in 1990 and created by the firm Kinder, Lydenberg, and Domini, the
MSCI ESG Index is one of the earliest tools for evaluating CSR performance, as well as
one of the most widely used and accepted CSP measurement. MSCI rates companies on
32
seven attributes—environment, community, human rights, employee relationships,
diversity, product, and governance—through a binary system. If the corporation meets
the criteria, it scores a “1.” Otherwise, it scores a “0.” The sources it uses to assign the
binary codes include corporate data sources (annual reports, CSR reports, 10K forms,
etc.), CSR questionnaires from corporations’ investor relations office, external surveys,
and general press from news sources.48
One common criticism of CSR programs is that companies implement them to
distract stakeholders from their unethical acts. The MSCI Index controls for this criticism
by analyzing both the strengths and concerns of a corporation’s CSR program in each
attribute. The data weighs not only what the company does well in regards to CSR, but
ways it negatively affects each attribute as well. Thus, I determine a company’s total CSP
score for a year by summing all the strengths from the seven attributes and subtracting it
by the sum of all the concerns from the seven attributes.
To avoid negative CSP scores, I scale absolute MSGI scores with 100 as a base.
Any score under 100 means the company has more CSR weaknesses than strengths. Any
scores above 100 means the company’s CSR strengths outweigh its weaknesses.
4.2 Population and Sample
This study covers 333 firms included in the S&P 500 for the years 2001-2005. See
Appendix 1 for the name, ticker, and industry of each of the 333 firms in the sample. I
assume my tests incorporate the long-term benefits of CSR implementation because most
48Waddock, S.A., & Graves, S.B. (1997). The corporate social performance-financial performance link. Strategic Management Journal, 18 (4), 308
33
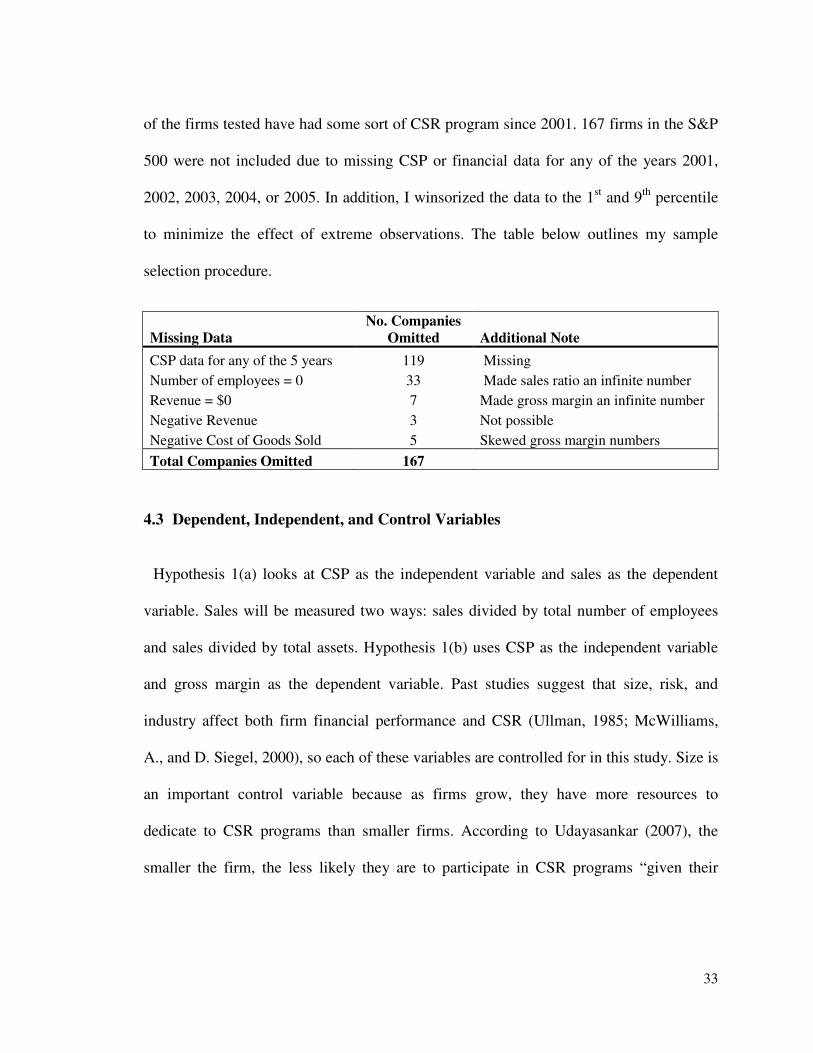
of the firms tested have had some sort of CSR program since 2001. 167 firms in the S&P
500 were not included due to missing CSP or financial data for any of the years 2001,
2002, 2003, 2004, or 2005. In addition, I winsorized the data to the 1st and 9th percentile
to minimize the effect of extreme observations. The table below outlines my sample
selection procedure.
Missing Data
No. Companies
Omitted Additional Note
CSP data for any of the 5 years 119 Missing
Number of employees = 0 33 Made sales ratio an infinite number
Revenue = $0 7 Made gross margin an infinite number
Negative Revenue 3 Not possible
Negative Cost of Goods Sold 5 Skewed gross margin numbers
Total Companies Omitted 167
4.3 Dependent, Independent, and Control Variables
Hypothesis 1(a) looks at CSP as the independent variable and sales as the dependent
variable. Sales will be measured two ways: sales divided by total number of employees
and sales divided by total assets. Hypothesis 1(b) uses CSP as the independent variable
and gross margin as the dependent variable. Past studies suggest that size, risk, and
industry affect both firm financial performance and CSR (Ullman, 1985; McWilliams,
A., and D. Siegel, 2000), so each of these variables are controlled for in this study. Size is
an important control variable because as firms grow, they have more resources to
dedicate to CSR programs than smaller firms. According to Udayasankar (2007), the
smaller the firm, the less likely they are to participate in CSR programs “given their
34
smaller scale of operations, resource access constraints and lower visibility.”49 Thus, I
control for size because I assume that the larger the firm, the more resources it can devote
to CSR initiatives. In addition to better access to resources, larger firms have more
visibility with the public because they have larger advertising and marketing budgets.
Industry also needs to be controlled for given the differences in stakeholder
interest and industry-specified CSR concerns (Waddock and Graves, 1997). As seen in
Table 1 below, there is a variation in average CSP scores, hinting CSR strengths and
concerns differ across industry, and thus must be controlled for to prevent unclear results.
Lastly, the risk tolerance of management needs to be controlled for since it influences
decision making. For this study, company size is measured using total assets, number of
employees, and total sales. Refer to Table 1 to see the range of Standard Industrial
Classification (SIC) codes that make up each industry. Industry is measured through
dummy variables for each industry. Lastly, risk is measured using long-term debt to total
assets ratio.
CHAPTER 5: RESULTS
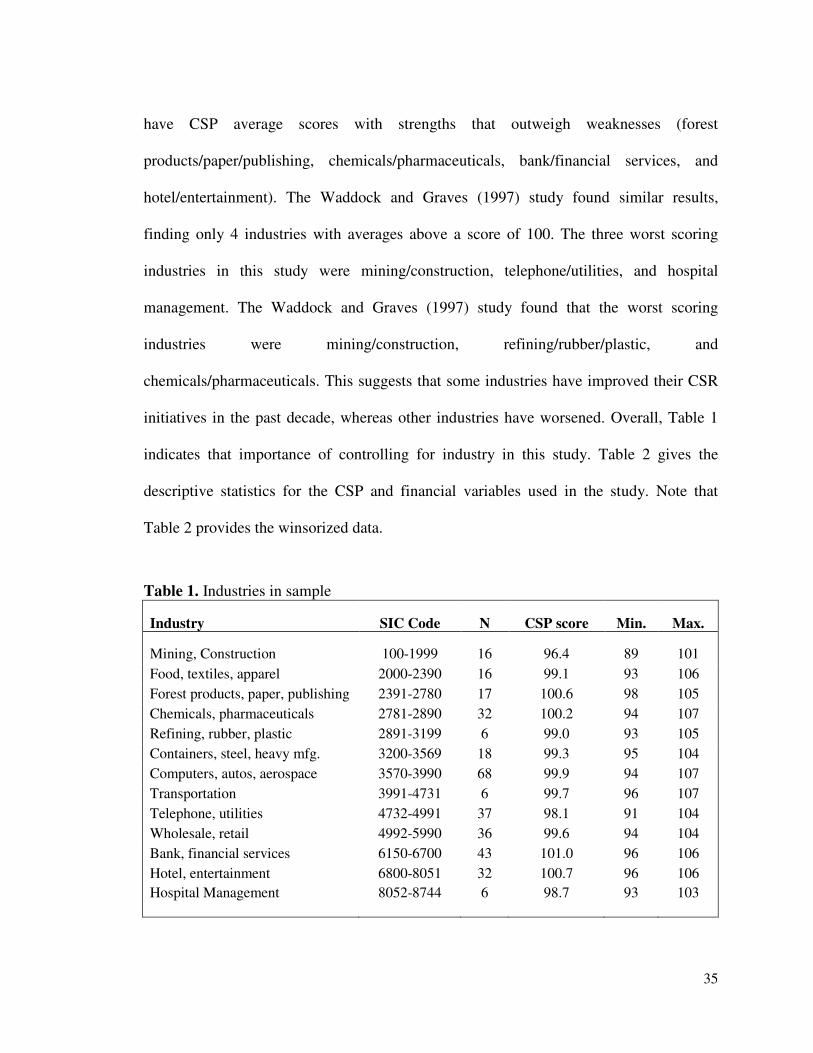
Table 1 provides a listing of all the industries that compose the 333 firms in the
sample, the SIC code range of each industry, and the average CSP score for each
industry. Since CSP scores were scaled with a base of 100, any score below a 100 means
the industry has more CSR weaknesses than strengths. As can be seen in Table 1, CSP
scores differ across industries. It is interesting to note that only 4 out of the 13 industries 49 Udayasankar, Krishna, Corporate Social Responsibility and Firm Size (2007). Journal of Business Ethics, 2007. Available at SSRN: http://ssrn.com/abstract=1262535
35
have CSP average scores with strengths that outweigh weaknesses (forest
products/paper/publishing, chemicals/pharmaceuticals, bank/financial services, and
hotel/entertainment). The Waddock and Graves (1997) study found similar results,
finding only 4 industries with averages above a score of 100. The three worst scoring
industries in this study were mining/construction, telephone/utilities, and hospital
management. The Waddock and Graves (1997) study found that the worst scoring
industries were mining/construction, refining/rubber/plastic, and
chemicals/pharmaceuticals. This suggests that some industries have improved their CSR
initiatives in the past decade, whereas other industries have worsened. Overall, Table 1
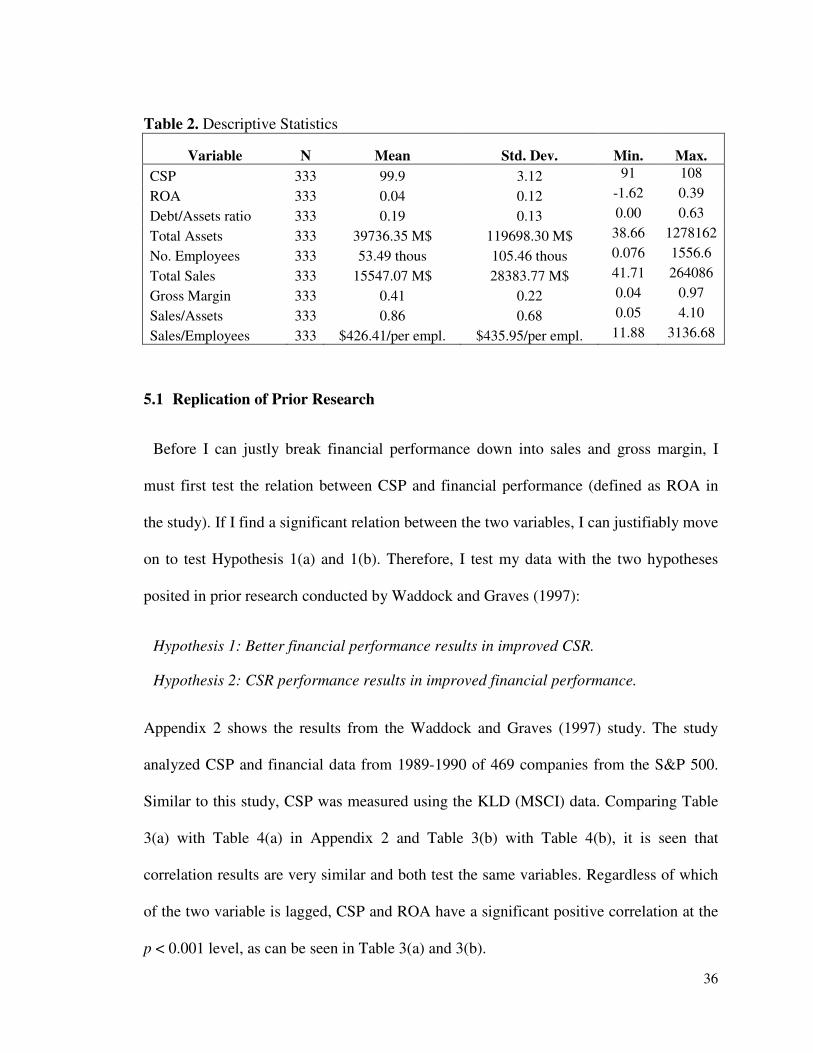
indicates that importance of controlling for industry in this study. Table 2 gives the
descriptive statistics for the CSP and financial variables used in the study. Note that
Table 2 provides the winsorized data.
Table 1. Industries in sample
Industry SIC Code N CSP score Min. Max.
Mining, Construction 100-1999 16 96.4 89 101
Food, textiles, apparel 2000-2390 16 99.1 93 106
Forest products, paper, publishing 2391-2780 17 100.6 98 105
Chemicals, pharmaceuticals 2781-2890 32 100.2 94 107
Refining, rubber, plastic 2891-3199 6 99.0 93 105
Containers, steel, heavy mfg. 3200-3569 18 99.3 95 104
Computers, autos, aerospace 3570-3990 68 99.9 94 107
Transportation 3991-4731 6 99.7 96 107
Telephone, utilities 4732-4991 37 98.1 91 104
Wholesale, retail 4992-5990 36 99.6 94 104
Bank, financial services 6150-6700 43 101.0 96 106
Hotel, entertainment 6800-8051 32 100.7 96 106
Hospital Management 8052-8744 6 98.7 93 103
36
Table 2. Descriptive Statistics
Variable N Mean Std. Dev. Min. Max.
CSP 333 99.9 3.12 91 108
ROA 333 0.04 0.12 -1.62 0.39
Debt/Assets ratio 333 0.19 0.13 0.00 0.63
Total Assets 333 39736.35 M$ 119698.30 M$ 38.66 1278162
No. Employees 333 53.49 thous 105.46 thous 0.076 1556.6
Total Sales 333 15547.07 M$ 28383.77 M$ 41.71 264086
Gross Margin 333 0.41 0.22 0.04 0.97
Sales/Assets 333 0.86 0.68 0.05 4.10
Sales/Employees 333 $426.41/per empl. $435.95/per empl. 11.88 3136.68
5.1 Replication of Prior Research
Before I can justly break financial performance down into sales and gross margin, I
must first test the relation between CSP and financial performance (defined as ROA in
the study). If I find a significant relation between the two variables, I can justifiably move
on to test Hypothesis 1(a) and 1(b). Therefore, I test my data with the two hypotheses
posited in prior research conducted by Waddock and Graves (1997):
Hypothesis 1: Better financial performance results in improved CSR.
Hypothesis 2: CSR performance results in improved financial performance.
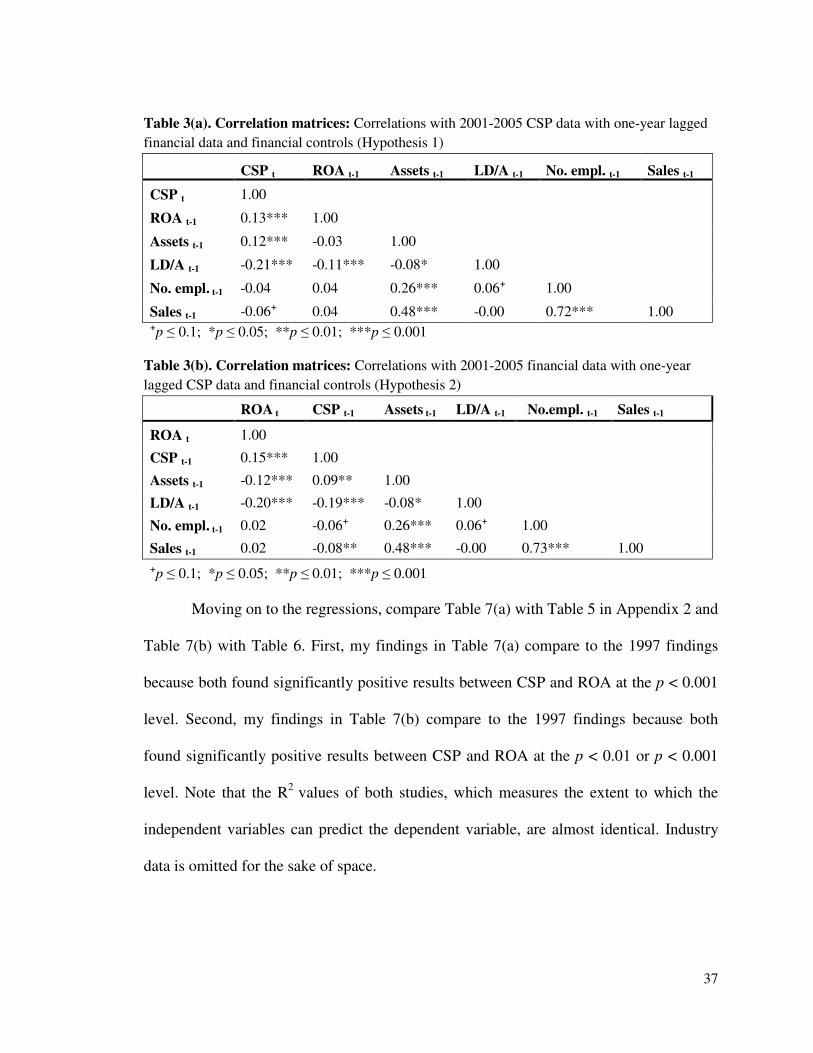
Appendix 2 shows the results from the Waddock and Graves (1997) study. The study
analyzed CSP and financial data from 1989-1990 of 469 companies from the S&P 500.
Similar to this study, CSP was measured using the KLD (MSCI) data. Comparing Table
3(a) with Table 4(a) in Appendix 2 and Table 3(b) with Table 4(b), it is seen that
correlation results are very similar and both test the same variables. Regardless of which
of the two variable is lagged, CSP and ROA have a significant positive correlation at the
p < 0.001 level, as can be seen in Table 3(a) and 3(b).
37
Table 3(a). Correlation matrices: Correlations with 2001-2005 CSP data with one-year lagged
financial data and financial controls (Hypothesis 1)
CSP t ROA t-1 Assets t-1 LD/A t-1 No. empl. t-1 Sales t-1
CSP t 1.00
ROA t-1 0.13*** 1.00
Assets t-1 0.12*** -0.03 1.00
LD/A t-1 -0.21*** -0.11*** -0.08* 1.00
No. empl. t-1 -0.04 0.04 0.26*** 0.06⁺ 1.00
Sales t-1 -0.06⁺ 0.04 0.48*** -0.00 0.72*** 1.00
⁺p ≤ 0.1; *p ≤ 0.05; **p ≤ 0.01; ***p ≤ 0.001
Table 3(b). Correlation matrices: Correlations with 2001-2005 financial data with one-year
lagged CSP data and financial controls (Hypothesis 2)
ROA t CSP t-1 Assets t-1 LD/A t-1 No.empl. t-1 Sales t-1
ROA t 1.00
CSP t-1 0.15*** 1.00
Assets t-1 -0.12*** 0.09** 1.00
LD/A t-1 -0.20*** -0.19*** -0.08* 1.00
No. empl. t-1 0.02 -0.06⁺ 0.26*** 0.06⁺ 1.00
Sales t-1 0.02 -0.08** 0.48*** -0.00 0.73*** 1.00
⁺p ≤ 0.1; *p ≤ 0.05; **p ≤ 0.01; ***p ≤ 0.001
Moving on to the regressions, compare Table 7(a) with Table 5 in Appendix 2 and
Table 7(b) with Table 6. First, my findings in Table 7(a) compare to the 1997 findings
because both found significantly positive results between CSP and ROA at the p < 0.001
level. Second, my findings in Table 7(b) compare to the 1997 findings because both
found significantly positive results between CSP and ROA at the p < 0.01 or p < 0.001
level. Note that the R2 values of both studies, which measures the extent to which the
independent variables can predict the dependent variable, are almost identical. Industry
data is omitted for the sake of space.
38
Table 7 regressions and the Waddock and Graves (1997) study try to assess
whether CSP is linked to financial performance, and in what direction the relationship
exists. Table 7(a) results indicate financial performance has a significant positive
relationship with CSP at the p <0.001 level when CSP is the dependent variable,
illuminating that the more resources a company has, the more effective their CSR
programs become. These results support the first hypothesis of the Waddock and Graves
(1997) study, which posits that better financial performance results in improved CSR
performance. Model 1 shows that the control variables are significantly related, and a one
unit increase in ROA leads to an improvement in CSP by 1.90 base points. These results
also support the slack resources theory, which posits that firms with stronger financial
performance are willing to invest more into CSR strategies.50 This theory helps to explain
the large increase in firm investments in CSR over the past decade because they are
investing their returns into the programs, ultimately illuminating that executives’
perception of such policies has shifted from an unnecessary addition to a critical business
function. These results assume that increased CSR spending leads to an increase in CSR
performance. I will explain later that this is not always the case, however, and I will
explain what companies can do to ensure this assumption holds true in their business
models.
50
Waddock, S.A., & Graves, S.B. (1997). The corporate social performance-financial performance link.
Strategic Management Journal, 18 (4), 306
39
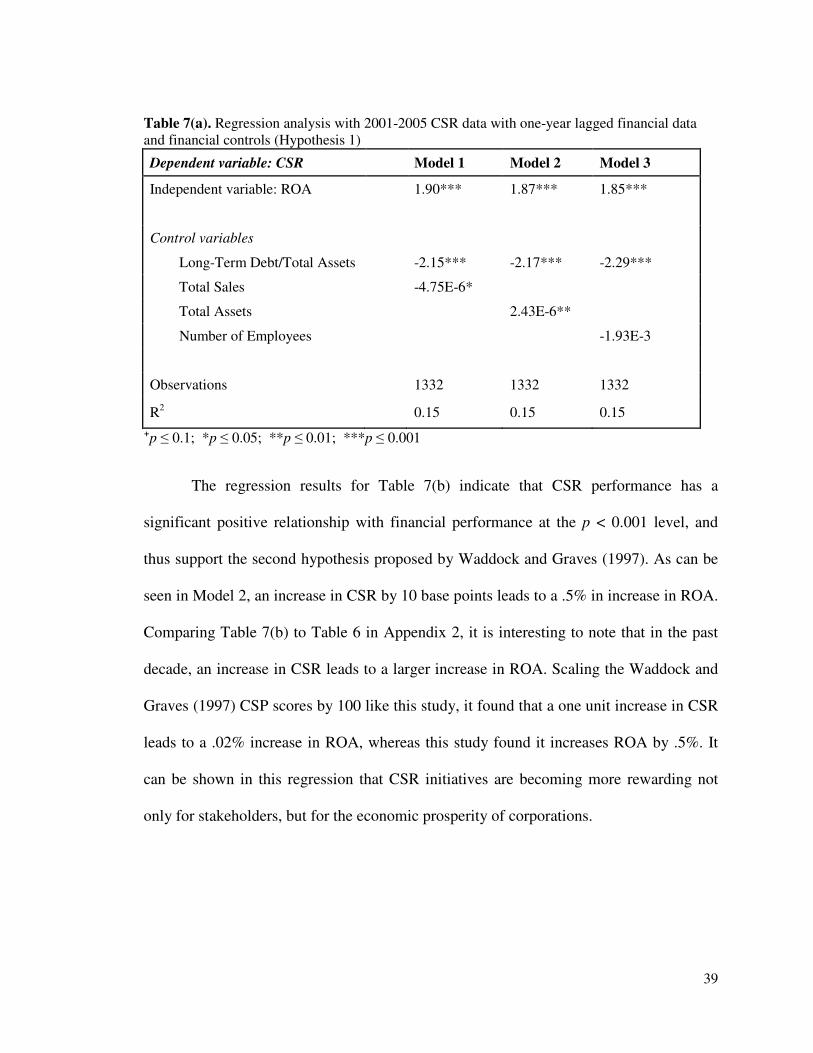
Table 7(a). Regression analysis with 2001-2005 CSR data with one-year lagged financial data and financial controls (Hypothesis 1)
Dependent variable: CSR Model 1 Model 2 Model 3
Independent variable: ROA
1.90*** 1.87*** 1.85***
Control variables
Long-Term Debt/Total Assets
-2.15*** -2.17*** -2.29***
Total Sales
-4.75E-6*
Total Assets
2.43E-6**
Number of Employees
-1.93E-3
Observations
1332 1332 1332
R2 0.15 0.15 0.15
⁺p ≤ 0.1; *p ≤ 0.05; **p ≤ 0.01; ***p ≤ 0.001
The regression results for Table 7(b) indicate that CSR performance has a
significant positive relationship with financial performance at the p < 0.001 level, and
thus support the second hypothesis proposed by Waddock and Graves (1997). As can be
seen in Model 2, an increase in CSR by 10 base points leads to a .5% in increase in ROA.
Comparing Table 7(b) to Table 6 in Appendix 2, it is interesting to note that in the past
decade, an increase in CSR leads to a larger increase in ROA. Scaling the Waddock and
Graves (1997) CSP scores by 100 like this study, it found that a one unit increase in CSR
leads to a .02% increase in ROA, whereas this study found it increases ROA by .5%. It
can be shown in this regression that CSR initiatives are becoming more rewarding not
only for stakeholders, but for the economic prosperity of corporations.
40
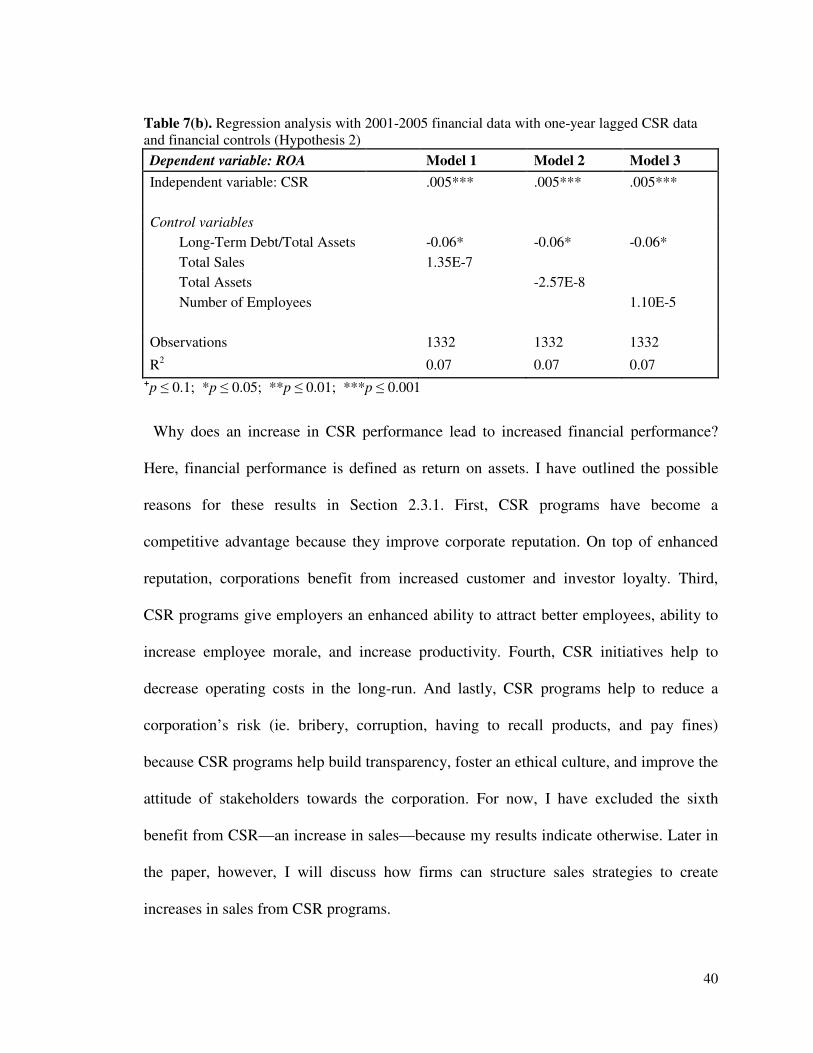
Table 7(b). Regression analysis with 2001-2005 financial data with one-year lagged CSR data and financial controls (Hypothesis 2)
Dependent variable: ROA Model 1 Model 2 Model 3
Independent variable: CSR
.005*** .005*** .005***
Control variables
Long-Term Debt/Total Assets
-0.06* -0.06* -0.06*
Total Sales
1.35E-7
Total Assets
-2.57E-8
Number of Employees
1.10E-5
Observations
1332 1332 1332
R2 0.07 0.07 0.07
⁺p ≤ 0.1; *p ≤ 0.05; **p ≤ 0.01; ***p ≤ 0.001
Why does an increase in CSR performance lead to increased financial performance?
Here, financial performance is defined as return on assets. I have outlined the possible
reasons for these results in Section 2.3.1. First, CSR programs have become a
competitive advantage because they improve corporate reputation. On top of enhanced
reputation, corporations benefit from increased customer and investor loyalty. Third,
CSR programs give employers an enhanced ability to attract better employees, ability to
increase employee morale, and increase productivity. Fourth, CSR initiatives help to
decrease operating costs in the long-run. And lastly, CSR programs help to reduce a
corporation’s risk (ie. bribery, corruption, having to recall products, and pay fines)
because CSR programs help build transparency, foster an ethical culture, and improve the
attitude of stakeholders towards the corporation. For now, I have excluded the sixth
benefit from CSR—an increase in sales—because my results indicate otherwise. Later in
the paper, however, I will discuss how firms can structure sales strategies to create
increases in sales from CSR programs.
41
5.2 Tests of Hypotheses 1(a) and 1(b)
Now that it is shown my research supports the previous finding that CSP and CFP
are positively, correlated, I can test the impact of CSP on CFP by breaking ROA down
into two financial variables: sales and gross margin. I will do this by testing Hypotheses
1(a) and 1(b). Table 8 provides the correlation matrices for the key variables tested in
Hypothesis 1(a) with the one-year lagged CSR data and control variables. Industry data is
omitted for the sake of space. The test measures total sales it two ways: first using the
sales to total assets ratio and second, the sales to total number of employees ratio. The
sales ratios are the dependent variables and CSP is the independent variable. Note first
that CSR performance and sales to assets are negatively correlated at the p < 0.05 level,
while CSR performance and sales to employees are negatively correlated at the p < 0.001
level. However, it is interesting to note that both dependent sales variables are not highly
correlated with CSP.
Table 8 also shows correlations for the key variables tested in Hypothesis 1(b)
with the one-year lagged CSP data and control variables. This test treated gross margin as
the dependent variable and CSP as the independent variable. Note that gross margin and
CSR performance are significantly and positively correlated at the p < 0.001 level and the
correlation is strong. Lastly, note that for both correlation matrices, CSP, sales, and gross
margin have significant correlations with each control variable (with the exception of the
correlation between sales/employees and long-term debt ratio).
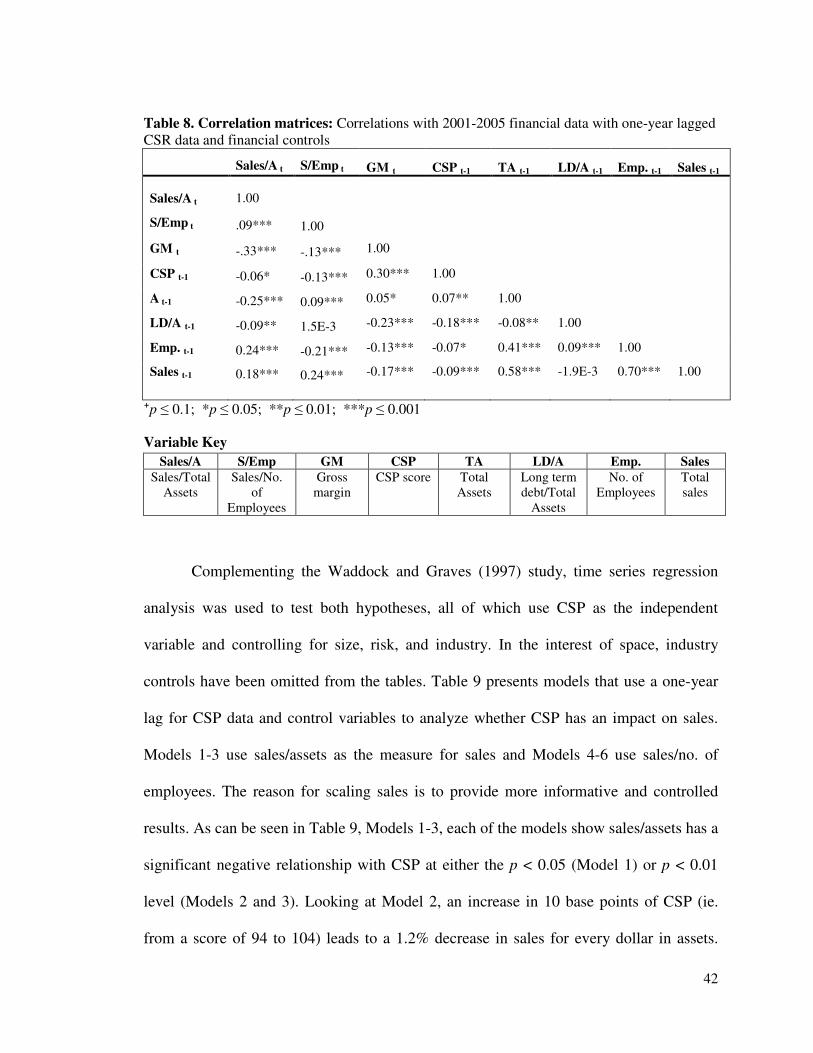
42
Table 8. Correlation matrices: Correlations with 2001-2005 financial data with one-year lagged CSR data and financial controls
Sales/A t S/Emp t GM t CSP t-1 TA t-1 LD/A t-1 Emp. t-1 Sales t-1
Sales/A t 1.00
S/Emp t .09*** 1.00
GM t -.33*** -.13*** 1.00
CSP t-1 -0.06* -0.13*** 0.30*** 1.00
A t-1 -0.25*** 0.09*** 0.05* 0.07** 1.00
LD/A t-1 -0.09** 1.5E-3 -0.23*** -0.18*** -0.08** 1.00
Emp. t-1 0.24*** -0.21*** -0.13*** -0.07* 0.41*** 0.09*** 1.00
Sales t-1 0.18*** 0.24*** -0.17*** -0.09*** 0.58*** -1.9E-3 0.70*** 1.00
⁺p ≤ 0.1; *p ≤ 0.05; **p ≤ 0.01; ***p ≤ 0.001
Variable Key
Sales/A S/Emp GM CSP TA LD/A Emp. Sales
Sales/Total Assets
Sales/No. of
Employees
Gross margin
CSP score Total Assets
Long term debt/Total
Assets
No. of Employees
Total sales
Complementing the Waddock and Graves (1997) study, time series regression
analysis was used to test both hypotheses, all of which use CSP as the independent
variable and controlling for size, risk, and industry. In the interest of space, industry
controls have been omitted from the tables. Table 9 presents models that use a one-year
lag for CSP data and control variables to analyze whether CSP has an impact on sales.
Models 1-3 use sales/assets as the measure for sales and Models 4-6 use sales/no. of
employees. The reason for scaling sales is to provide more informative and controlled
results. As can be seen in Table 9, Models 1-3, each of the models show sales/assets has a
significant negative relationship with CSP at either the p < 0.05 (Model 1) or p < 0.01
level (Models 2 and 3). Looking at Model 2, an increase in 10 base points of CSP (ie.
from a score of 94 to 104) leads to a 1.2% decrease in sales for every dollar in assets.
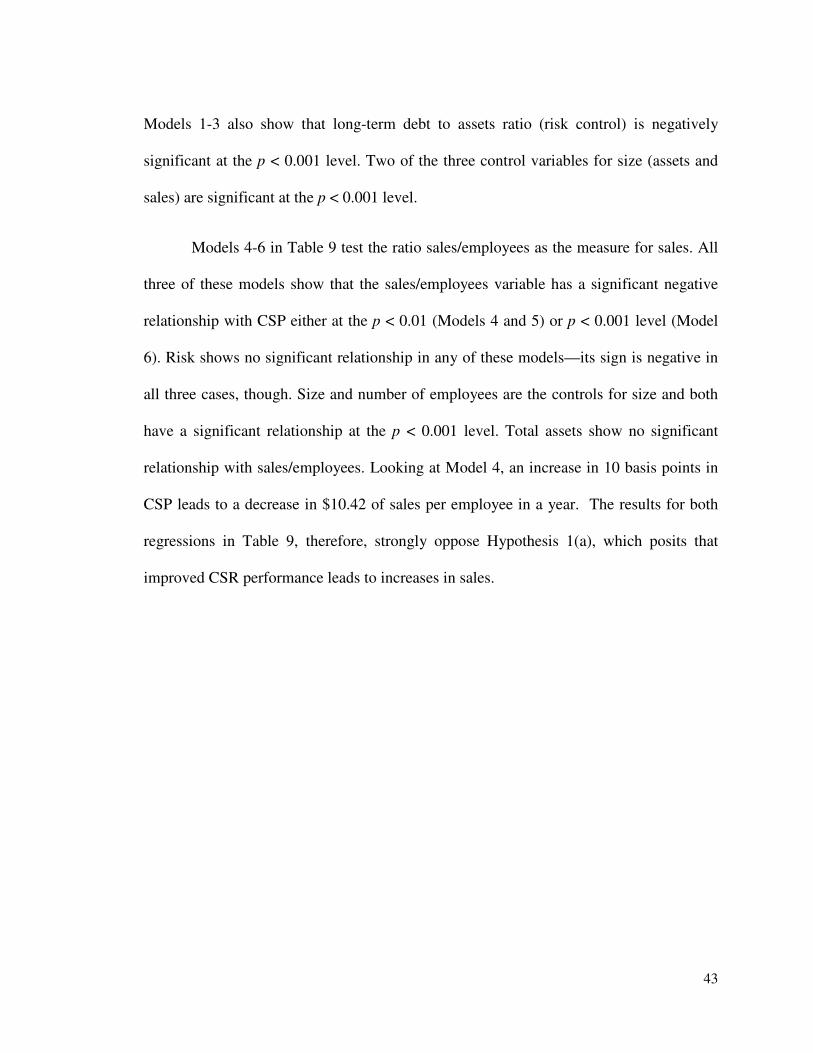
43
Models 1-3 also show that long-term debt to assets ratio (risk control) is negatively
significant at the p < 0.001 level. Two of the three control variables for size (assets and
sales) are significant at the p < 0.001 level.
Models 4-6 in Table 9 test the ratio sales/employees as the measure for sales. All
three of these models show that the sales/employees variable has a significant negative
relationship with CSP either at the p < 0.01 (Models 4 and 5) or p < 0.001 level (Model
6). Risk shows no significant relationship in any of these models—its sign is negative in
all three cases, though. Size and number of employees are the controls for size and both
have a significant relationship at the p < 0.001 level. Total assets show no significant
relationship with sales/employees. Looking at Model 4, an increase in 10 basis points in
CSP leads to a decrease in $10.42 of sales per employee in a year. The results for both
regressions in Table 9, therefore, strongly oppose Hypothesis 1(a), which posits that
improved CSR performance leads to increases in sales.
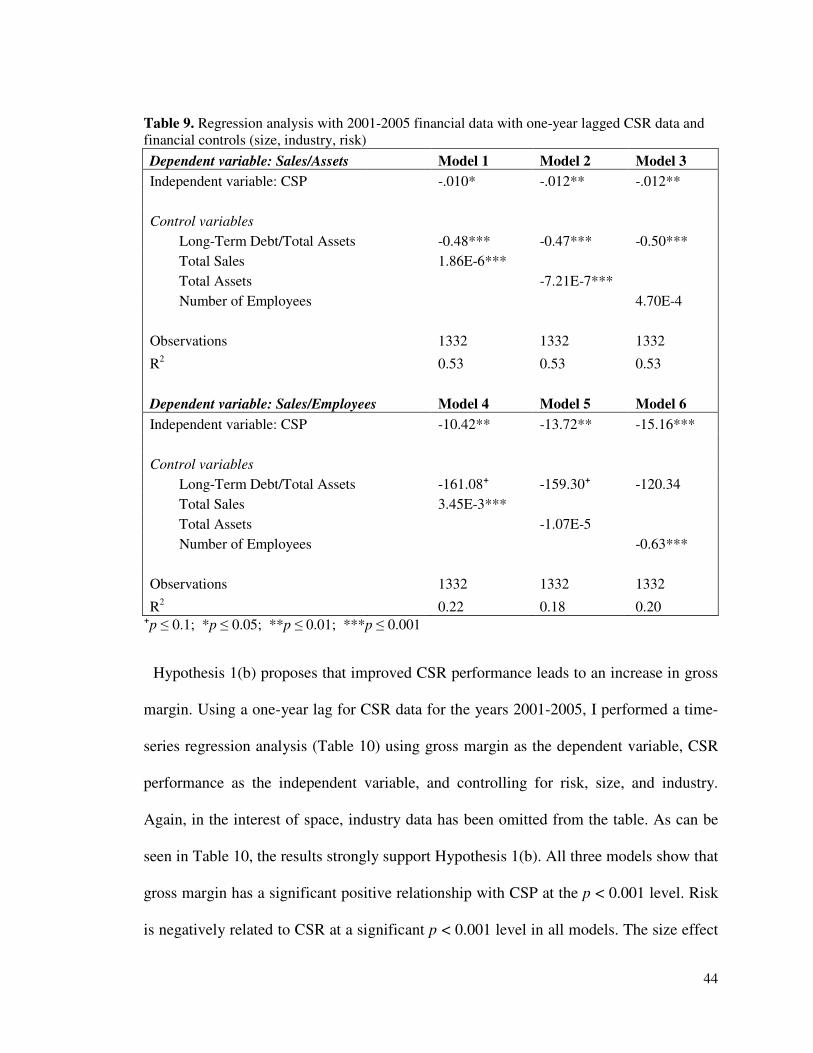
44
Table 9. Regression analysis with 2001-2005 financial data with one-year lagged CSR data and financial controls (size, industry, risk)
Dependent variable: Sales/Assets Model 1 Model 2 Model 3
Independent variable: CSP -.010* -.012** -.012**
Control variables
Long-Term Debt/Total Assets -0.48*** -0.47*** -0.50***
Total Sales 1.86E-6***
Total Assets -7.21E-7***
Number of Employees 4.70E-4
Observations 1332 1332 1332
R2 0.53 0.53 0.53
Dependent variable: Sales/Employees Model 4 Model 5 Model 6
Independent variable: CSP -10.42** -13.72** -15.16***
Control variables
Long-Term Debt/Total Assets -161.08⁺ -159.30⁺ -120.34
Total Sales 3.45E-3***
Total Assets -1.07E-5
Number of Employees -0.63***
Observations 1332 1332 1332
R2 0.22 0.18 0.20
⁺p ≤ 0.1; *p ≤ 0.05; **p ≤ 0.01; ***p ≤ 0.001
Hypothesis 1(b) proposes that improved CSR performance leads to an increase in gross
margin. Using a one-year lag for CSR data for the years 2001-2005, I performed a time-
series regression analysis (Table 10) using gross margin as the dependent variable, CSR
performance as the independent variable, and controlling for risk, size, and industry.
Again, in the interest of space, industry data has been omitted from the table. As can be
seen in Table 10, the results strongly support Hypothesis 1(b). All three models show that
gross margin has a significant positive relationship with CSP at the p < 0.001 level. Risk
is negatively related to CSR at a significant p < 0.001 level in all models. The size effect
45
is significantly negative in Models 1 and 3. Looking at Model 1, an increase of 10 base
points in CSP leads to a 2% increase in gross margin the following year.
Table 10. Regression analysis with 2001-2005 financial data with one-year lagged CSR data and financial controls (size, industry, risk) Dependent variable: Gross
Margin Model 1 Model 2 Model 3
Independent variable: CSR .02*** .02*** .02***
Control variables
Long-Term Debt/Total Assets -0.24*** -0.24*** -0.23***
Total Sales -8.96E-7***
Total Assets 5.06E-8
Number of Employees -1.42E-4*
Observations 1332 1332 1332
R2 0.25 0.24 0.24
⁺p ≤ 0.1; *p ≤ 0.05; **p ≤ 0.01; ***p ≤ 0.001
CHAPTER 6: DISCUSSION AND CONCLUSION
6.1 CSP and Gross Margin
My results support Hypothesis 1(b) that improved CSR performance leads to an
increase in gross margin. This result suggests that some customers are willing to pay a
higher price for the products and/or services of companies with effective CSR programs.
Many firms accompany increases in CSR investments with increases in their price of
products/services. They do this to cover the cost of the expenditures and believe
consumers will find more value in the CSR programs than the addition cost of the
product. So, executives can be comforted by the evidence that some customers will
accept the premium if the firm engages in CSR initiatives. Referring back to Section
2.3.1, the Burson-Marsteller study found that “American consumers are willing to pay a
46
premium for goods from socially responsible companies.”51 This can be explained by
Maslow’s Hierarchy of Needs. CSR improves customer loyalty because their sense of
belonging to a firm strengthens when a customer’s interest in social and environmental
issues is supported and complemented with their consumer decisions. When customer
loyalty strengthens, customers are less likely to switch brands when the product’s price
increases since it is justified by the increase in commitment to the CSR initiatives the
customer supports. An additional reason customers are willing to pay a premium for
goods from socially responsible firms is because their personal reputation is enhanced. A
firm can benefit economically from this reason because the added value of a reputation
boost outweighs the premium. Take Nike’s LIVESTRONG initiative to fund cancer
research by selling the yellow wristbands, for example. Consumers pay for this wristband
because they support cancer research and want other people to know they supported it.
Hence, one’s perception of a person improves when they see the person wearing a Nike
LIVESTRONG band because it means the person makes a positive contribution to the
community. Thus, I propose that the gross margin from the sales of LIVESTRONG
bands would have increased if Nike increased the cost of the bands from $1 to $1.50
because an extra $.50 cost is worth the increase in personal reputation to consumers. Not
only are they buying a product, but a boost in personal reputation.
6.2 CSP and Sales
I find no support for Hypothesis 1(a), indicating that increases in CSR performance lead
to a decrease in sales. Results indicate then that some people are less willing to buy the
51 Corporate Social Responsibility Branding Survey. Publication. Penn Schoen Berland, 2010.
47
product and/or service of companies with higher CSP, and thus firms may experience a
decrease in customer base. As explained before, the implementation of many CSR
programs are accompanied by increased prices of products/services. So, this result
indicates less people are willing to accept the premium, and companies with strengthened
CSP sell fewer products. This suggests some consumers either believe the increase in cost
of the premium outweighs the benefit from the programs, or do not support the CSR
causes. Assuming increases in CSR investments leads to increases in CSP, these results
indicate that increases in CSR investments actually decrease, not increase, sales.
6.3 CSP/Sales Strategies
My results as a whole indicate that some customers are willing to pay a higher price for
the products/services of socially responsible firms, but that fewer customers are willing to
buy the products. Either some consumers don’t accept the premium or do not support the
CSR programs. However, since replication of prior research conveyed that improved CSP
led to improved ROA, and considering ROA can be broken down into sales and gross
margins, it can be concluded that firms still reap a financial benefit from CSR
implementation. Firms can use the evidence from this study to structure their sales
strategies to maximize the benefits of CSR. Here are two specific CSR strategies a
company can utilize to boost sales and gross margin:
Strengthen CSR Reporting
The conclusion that CSR investments lead to increases in gross margin conveys
that customers find additional value in the CSR programs since they accept a price
premium. The added value can include enhanced personal reputation and enhanced sense
48
of belonging to the company and community. Firms, therefore, can maximize the value
consumers find in their CSR programs, and thereby expanding the degree of price
increase, by strengthening the quality and transparency of their annual CSR reports.
Companies should explain to stakeholders in these reports not only what CSR
investments they are making, but why they are making those specific investment
decisions and how it positively affects both the company and society. Right now, the
CSR reports of many firms lack the why and how answers behind their CSR initiatives.
Firms must not only describe the CSR programs, but persuade stakeholders why the
benefits of such investments override the price increases for every stakeholder. This
strategy may increase the capacity of the premium a customer is willing to accept,
thereby maximizing the impact CSR programs has on gross margin. In addition, findings
of this study suggest improved CSP can lead to decreased customer base because less
people are willing to accept the premium. However, CSR reporting can be used to
persuade to consumers why the addition in cost of the product/service, in the long run, is
greatly outweighed by the benefits the programs can produce to both them and society.
Implement Cause Promotions
In Philip Kotler’s book, Corporate Social Responsibility: Doing the Most Good for
Your Company and Your Cause, Kotler highlights five methods for implementing a CSR
program: cause promotions, cause-related marketing, social marketing, philanthropy, and
volunteering.52 I believe corporations can take advantage of one of these methods to help
52 Philip Kotler and Nancy Lee, Corporate Social Responsibility: Doing the Most Good for Your Company
and Your Cause. Hoboken, N.J: Wiley, 2005, 49-206.
49
boost sales and gross margin: cause-related marketing. Cause-related marketing is when a
corporation commits to donating a percentage of revenues to a specific cause based on
the amount of sales generated from the product. Most offers are limited to a certain
product, cause/organization, and time period. In addition, the offers are dependent on
customer participation.
One example of cause-related marketing I discussed earlier is Yoplait’s “Save
Lids to Save Lives” initiative. The major sales advantage of this initiative is that it is easy
for Yoplait to track consumer reactions to the promotion and the precise impact of the
program on sales. Yoplait is able to sell the product at a slight premium by engaging in
the program. However, one major disadvantage of the program is that customers may not
be willing to participate since there is an additional step to buying the product: they must
also mail in the lids for the donation to occur. An example of a cause-related marketing
strategy I believe to be stronger, or more able to maximize the impact the program has on
sales, is the Avon Foundation by Avon, a company that sells beauty related products.
Avon donates a percentage of “pink ribbon” products—like jewelry and handbags that
have pink ribbons (the breast cancer symbol) on them—purchased to the Avon
Foundation and provides funding for breast cancer research. In contrast with the “Save
Lids to Save Lives” program, all customers must do for the donation to take place is
purchase the product.
The benefits of cause-related marketing programs to the corporation include
attracting new customers, building reputation, and increasing product sales. These
programs help firms attract more customers because the products sold attract consumers
50
who support the breast cancer cause. If firms effectively advertise the impact of the
program on society, they may be able to persuade customers to value such an impact
more than the added cost of their product, and thus reap the benefits of sale increases.
The programs can also build reputation, which, as mentioned earlier, is vital for long-
term growth and profitability. Lastly, the programs can lead to increases in sales as long
as the percentage in sales donated is less than the mark up percentage on the product sold.
The Avon Foundation has been selling pink ribbons products since 1993, which hints the
program positively impacts sales for the corporation.
6.4 Shifting Perceptions of CSR to Corporate Shared Value
At first glance, the results of this study may discourage companies that are price
takers—firms that are in highly competitive industries and have little to no pricing power.
My results indicate that companies can benefit from CSR programs because increases in
CSP lead to a higher gross margin, despite the decrease in sales, because higher CSP
enables companies to justifiably increase their prices. However, it seems that price taking
companies cannot reap the benefits of CSR since they have no power to increase their
prices. I want to urge price taking companies not to dismiss CSR initiatives after reading
this study because I will now argue that, despite my results, increased investments in
CSR can increase sales in addition to gross margin. What needs to change in order for
this to happen, however, are executives’ perception of corporate social responsibility to
ensure that increases in CSR investments lead to improved CSP.
The central explanation behind my results that increases in CSP lead to decreases in
sales is that company executives have not adapted their CSR programs to complement the
51
technological changes from the Information Age and the increase in corporate
globalization, and thus are not allocating their CSR investments efficiently. If firms learn
to allocate such resources more efficiently, they can maximize the opportunity to increase
sales if they minimize the price increases that occurred to offset the cost of CSR
implementation. The first CSR initiatives in the United States began during the Industrial
Revolution. Without the internet and modern technology of today, corporations and
communities were strongly connected. Corporations were physically located in the
communities, meaning face-to-face communication was constant and accessible, and thus
corporate relationships with the community were strong. However, “as companies have
become more global, their connections to communities have weakened.”53 Not only has
globalization made it more difficult for stakeholders to trust the decisions of corporations
because direct communication is limited, but it has changed how CSR programs needs to
be implemented and perceived by executives in order to be effective.
Peter Drucker argued that “the purpose of a business is to create a customer.”54 A
customer cannot be created or retained, however, unless the business has a connection
with the community to which the customer belongs. Globalization has enabled
corporations to reach more customers worldwide, although it has caused its relationships
with communities to weaken. I will now argue that integrated CSR programs can not only
help corporations reach even more customers, but also help strengthen firms’
relationships with the communities to foster long-term economic value to both parties,
53 Porter, Michael E. and Jan W. Rivkin (2012). The Looming Challenge to U.S. Competitiveness. Harvard
Business Review, 7. 54 Drucker, Peter. Management: Tasks, Responsibilities, Practices. Harper & Row, Publishers, Inc. 1973,
57.
52
and thus solve the problem globalization has created for companies. I argue that
companies can do this by expanding their view of CSR from doing good to creating
shared value, a view that even Milton Friedman would support. As mentioned earlier in
Section 2.1.1, Friedman supports the integration of CSR programs into business
operations, but does not support businesses labeling them as social responsibility
initiatives. To him, the only responsibility of a business is to create value to shareholders
and ultimately the business. Therefore, I argue first that companies must change the title
of their programs from corporate social responsibility (CSR) to corporate shared value
(CSV). An example of a company who has done so is Nestle, who changed the name of
their programs from CSR report to CSV report in 2008.55 Second, I argue that the change
in title must be coupled with a change in how such programs are implemented.
Michael Porter defines corporate shared value (CSV) as “policies and operating
practices that enhance the competitiveness of a company while simultaneously advancing
the economic and social conditions in the communities in which it operates.”56 Refer
back to Section 1.2.1 when CSR was defined and compare this to the definition of CSV:
CSV expands beyond CSR by incorporating the idea that the company must also focus on
increasing the competitiveness of the firm so it is able to create shared value in the long-
run.
Before I advise how companies can implement CSV programs, I must distinguish
between CSR and CSV. A CSR view is limited by the belief that doing good and
philanthropy is outside of profit maximization and business operations. In contrast, CSV
55 Nestlé Creating Shared Report 2009. 56 Porter, Michael E. and Mark R. Kramer (2011). Creating Shared Value. Harvard Business Review, 6.
53
is an expanded view that perceives social initiatives as a core aspect of the business
model. Michael Porter argues that companies create economic value by creating social
value, not vice versa.57 The example below, as described a 2010 Harvard Business
Review case study, illustrates the narrow focus of CSR and how such a perception can
actually negatively impact the business:
In 2011, DM Bicycle Company experienced a large growth in sales. Instead of
reinstating employee bonuses to reward employees for their hard work which led to the
growth in sales, CEO Gino Duncan decided rather to invest in a CSR program focused on
battling Batten disease due to his daughter's battle with the disease. This new program
would replace the old CSR program, Ride for Life—which I argue is classified as a CSV
program—that sponsored races and all-day biking excursions for the city's school
children. Ride for Life had been very successful and raised the morale of employees and
had created positive public relations for the company.
Gino's decision to replace the old program was a wrong business strategy for two
reasons. First, his decision was unfair to his employees because they didn’t receive the
full compensation they deserved for their hard work.58 This negatively affected employee
morale, loyalty, and employee retention for the company—all of which are essential to
achieve long-term profitability. Second, the new CSR program eroded much of the
benefits that came with the Ride for Life program, including attracting new customers,
building a stronger relationship with the community, and increasing its reputation. The
57 Porter, Michael E. and Mark R. Kramer (2011). Creating Shared Value. Harvard Business Review, 7. 58 Raggio, Randle D. When the CEO’s Personal Crusade Drives Decisions. Case Study. Harvard Business Review, 2010, 1-5.
54
Ride for Life program was an effective CSV program because it enabled DM Bike
Company to advertise their products in the community, while at the same time producing
some benefit to the community, thereby building connections with the community. The
new program did not produce such benefits for the company. In sum, Gino’s narrow view
of CSR solely as an opportunity for his company to support a philanthropic cause
negatively impacted his company’s financial performance. Rather than viewing his
program as a CSR initiative and an opportunity to provide economic value to the firm, his
new program became external to profit maximization.
The second distinction between CSR and CSV is that an argument against CSR is
that such initiatives are created in response to external pressures to fix past negative
social impacts, rather than for the purpose of doing good. However, CSV does not
receive such criticism because it is clear the purpose behind the initiatives extend beyond
merely doing good but also adding shared value to both society and the company
necessary to increase the firm’s competitiveness in the market. Lastly, CSR is limited by
the corporate budget after business operation expenses, whereas CSV is a priority in the
budget.
Now I will begin to explain how a corporation can implement an effective CSV
program. First, a business must collaborate with a social entrepreneurship to create a
hybrid value chain, a partnership that capitalizes on complementary strengths to
maximize value and minimize costs. A social entrepreneurship is commonly part of the
not-for-profit sector and manages a social venture to create a social change. In contrast
with a business, which measures performance based on profitability, a social
55
entrepreneurship measures performance based on the amount of social change from the
venture. The strengths social entrepreneurships bring to the hybrid value chain include a
solid understanding of the needs of its customers, strong relationships with communities,
and provides products at lower costs to the customers in need. The strengths a business
brings to the value chain include economies of scale, expertise in supply chain
management, and ability to finance the hybrid value chain. A key idea in understanding
the hybrid value chain is that it requires that customers pay for a product—as opposed to
providing cash/product donations to customers—in order to maintain financial
sustainability of the business. The value chain enables the product to be sold at an
affordable price to customers, though, so that social change is still attainable. Another
benefit of requiring customers pay to a certain extent is that it prevents consumers from
becoming dependent on the organization’s aid, which causes a decrease in motivation to
enhance their personal economic status because they are expected to provide something
in return for the product. In other words, the value chain provides motivation for
consumers in need to increase their economic status, thereby promoting economic
development that leads to social change.
In order to fully grasp the business model of a hybrid value chain, as well as the benefits
a CSV program provides both society and businesses, I will use the example of the
Grameen-Danone partnership. Grameen Bank, founded in 1983 by Muhammad Yunus, is
a microfinance organization and community development bank. Unlike a conventional
bank, it does not require collateral on a loan and is built on trust and accountability.
Grameen serves the rural poor in Bangladesh and is based on the belief that the skills of
the poor are underutilized, but with a little help from the bank, their skills can be used to
56
develop the local economy. Danone is a French food processing business that produces
dairy and water products.
In 2006, the two entities joined together to form the social business, Grameen Danone
Foods, with the goal of providing nutritious food products to the poor rural children of
Bangladesh and employment opportunities for local people. To do this, Danone built
dairy plants in Bangladesh to product its yogurt product with added vitamins to fill
nutrient deficits of the children, naming it Shokti Doi, or “strength yogurt.” The business
sells the product to the local communities at a price in which the poorest children can
afford it. According to experts, “if a child eats 2 cups of this yogurt per week, and does it
for a year, he/she will regain their full health.”59 Through this business, Grameen-Danone
created jobs for beggars—every day, they go to the factory, get a batch of supplies, and
sell the yogurt in the local village. In addition, Grameen provides beggars with
microloans to start their own businesses in the community. The advantage of having local
beggars sell the yogurt is they are already connected to the community and people are
willing to buy from them since they are no longer begging, or giving nothing in return.
The difference between a business and a social business is that investors do not
receive dividends in the social business, but rather create a social dividend for others.
Their investments produce company profits, but these profits are reinvested to expand the
social business rather than provide returns for investors. The difference between charity
(philanthropy) and a social business is when a dollar is given to a charity, the dollar never
comes back. In contrast, when a dollar is given to a social business, the dollar has an
59 “Grameen Danone: a Social Business,” YouTube video, 4:36, posted by "kubohemian," May 28, 2010. http://www.youtube.com/watch?v=AV4WQV32ijs.
57
endless life “because it recycles. It starts moving back and forth, again and again. So you
touch many more lives and it continues ever and ever.”60
Grameen-Danone Foods is a very effective CSV program for Danone because the
social business adds social value to the community of Bangladesh, which then adds
economic value to Danone. The social business benefits Danone because it has enabled
the company to reach a community and customers that would have otherwise been
inaccessible. And business has accomplished its social objective of providing nutrition to
poor rural children, thereby increasing the children’s ability to provide for their families.
This increase in social value generates economic value to Danone because a healthier
community leads to more productivity and economic development. The community
attributes their prosperity and increased economic status to Danone’s involvement, and
thus becomes very loyal to the business; this ultimately leads to an increase in customer
base and sales for Danone. A second social value added from the social business is an
increase in employment in the rural communities and affordable food. The social
business allows Danone to sell the yogurt at an affordable price—Danone enables the
business to sell the products at lower prices because of its ability of economies of scale
and Grameen helps provide employment to Danone’s manufacturing factories. Danone
benefits from increased sales. In sum, I advise companies to invest in social businesses as
CSV initiatives because it will enable the company to increase profitability and sales in
the long-run since the investments will continue to expand alongside the social business.
When the social business grows, the business grows.
60 “Grameen Danone: a Social Business,” YouTube video, 4:36, posted by "kubohemian," May 28, 2010. http://www.youtube.com/watch?v=AV4WQV32ijs.
58
6.5 Future Research
There is a substantial amount of research that still needs to be done concerning the
link between corporate social responsibility and financial performance. For example, as
more reliable data becomes available on CSR, it may be useful to determine whether or
not the relationships examined in this study hold over time. The years studied (2001-
2005) are pre-recession in the United States, so studying how the recession affected the
impact CSR has on financial performance and whether the relationship is stronger after
the recession would be valuable information. Additionally, it would be worthwhile to
examine lags other than the 1-year lag between each of the five years evaluated in this
study because such evidence would help describe how long it takes, on average, for firms
to reap the full benefits from CSR investments. Moreover, it may be useful to consider
the year in which the CSR programs were implemented when running regressions of CSR
data, since previous research has found that the effect of CSR financial performance is
negative during the first years of implementation.61 This research is supported by the idea
that CSR initiatives require large investments in the short-run, but produce long-term
returns.
Furthermore, the transparency of CSR reporting may be a critical variable because
if stakeholders are not aware of the programs a company is engaged in, their attitudes and
decisions towards a corporation cannot be influenced. I attempted to measure
transparency with MSGI’s dummy variable, but the variation was not high enough for
61 Lopez, M., Garcia, A., & Rodriguez, L. (2007). Sustainable development and corporate performance: A study based on the Dow Jones Sustainability Index. Journal of Business Ethics,75, 285–300.
59
accurate results. Once more reliable data becomes available, controlling for transparency
while assessing the CSR-CFP link might strengthen the study’s results. A third area still
in need of more research is the impact CSR has on financial performance in specific
industries. The stakeholders of different industries desire different things, and it would be
useful for management to learn how they can structure their programs to complement the
interests of their unique stakeholders the best. Lastly, I asserted in Section 2.3.1 that CSR
positively impacts financial performance in the long-run because it helps increase the
value of intangible assets like reputation and brand value. Thus, once more reliable data
to measure such intangible assets becomes available, it may be beneficial to assess how
CSR investments increase the value of the assets and ultimately financial performance.
60
References
Friedman, Milton. "The Social Responsibility of Business Is to Increase Its Profits." The
New York Times, September 13, 1970.
“Rethinking the Social Responsibility of Business,” Reason.com, October, 2005.
Accessed September 19, 2012,
<http://reason.com/archives/2005/10/01/rethinking-the-social-responsi.>
McWilliams, A. and D.S. Siegel. “Corporate social responsibility: a theory of the firm
perspective” Academy of Management Review 26, no. 1 (2001): 117.
"Focused on the 3E's: Ethics, Environment, and Economics." Sustainable Supply Chain.
McDonald's Corporation. Accessed September 18, 2012.
http://www.aboutmcdonalds.com/mcd/sustainability/our_focus_areas/sustainable_
supply_ chain.html>.
"McDonald's & Environmental Defense Fund Mark 10th Anniversary Of Landmark
Alliance." Environmental Defense Fund. Accessed September 23, 2012. <http://www.edf.org/news/mcdonalds-environmental-defense-fund-mark-10th- anniversary-landmark-alliance>.
"McDonald's to List Calories on Menus." Business. The Wall Street Journal, 12 Sept.
2012. Accessed September 22, 2012. <http://online.wsj.com/article/BT-CO-
20120912-709401.html>.
"Ronald McDonald House Charities." McDonald's Relationship. Web. Accessed
September 21, 2012. <http://rmhc.org/who-we-are/our-relationship-with-
mcdonald-s/>.
"The Corporate Scandal Sheet." Forbes. Forbes Magazine, Web. Accessed September 24,
61
2012. <http://www.forbes.com/2002/07/25/accountingtracker.html>.
2002 Cone Corporate Citizenship Study: The Role of Cause Branding. Cone
Communications, 1-7.
"Giving USA." Donations Barely Grew at All Last Year, 19 June 2012. Web. Accessed
October 1, 2012. <http://philanthropy.com/article/Donations-Barely-Grew-at
All/132367/>.
"2001 Giving USA Study Released." OMB Watch. 21 June 2002. Web. Accessed
September 28, 2012. <http://www.ombwatch.org/node/718>.
"United States GDP Growth Rate." Trading Economics. Bureau of Economic Analysis,
Web. Accessed October 4, 2012. <http://www.tradingeconomics.com/united-
states/gdp-growth>.
"Green Programs Save "Green", Buck Consultants Survey Reveals More U.S. Employers
Measuring Cost Savings Stemming From Environmental Efforts." Xerox, 11 Apr.
2011. Web. Accessed September 26, 2012.
<http://news.xerox.com/pr/xerox/Buck-Consultants-Greening-of-the-American-
Workplace-Survey-Results.aspx>.
KPMG International Survey of Corporate Responsibility Reporting 2011. Publication.
KPMG, 2011. Print.
KPMG International Survey of Corporate Sustainability Reporting 2002. Publication.
KPMG, 2002. Print.
CSR Trends 2010: Stacking Up the Results. Publication. PricewaterhouseCoopers, 2010.
Nestlé Creating Shared Report 2009. Print.
Kotler, Philip, and Nancy Lee. Corporate Social Responsibility: Doing the Most Good
62
for Your Company and Your Cause. Hoboken, N.J: Wiley, 2005.
“Case Study: Energy Efficiency in Design and Construction." Cisco. Web. Accessed
October 5, 2012.
<http://www.cisco.com/web/about/ac227/ac228/ac229/about_cisco_corp_citi_cas
e_study.html>.
"Participating Is Simple." Save Lids to Save Lives. Yoplait, Web. 05 Oct. 2012.
<https://savelidstosavelives.com/HowItWorks?Length=0>.
Emerson, Greg. "The 10 Most Charitable Companies in America." Yahoo! Finance. 2
Dec. 2011. Web. Accessed October 5, 2012. <http://finance.yahoo.com/news/the-
10-most-charitable-companies-in-america.html>.
"Corporate Governance." Definition and Meaning. Web. Accessed October 5, 2012.
<http://www.businessdictionary.com/definition/corporate-governance.html>.
Lopez, M., Garcia, A., & Rodriguez, L. “Sustainable development and corporate
performance: A study based on the Dow Jones Sustainability Index.” Journal of
Business Ethics, 75 (2007): 285–300.
Aupperle, K.E., A.B. Carroll, and J.D. Hatfield. “An empirical examination of the
relationship between corporate social responsibility and profitability”, Academy of
Management Journal, 28 (1985): 446—463.
Ullmann, A. 'Data in search of a theory: A critical examination of the relationships
among social performance, social disclosure, and economic performance of US
firms', Academy of ManagementReview, 10 no. 3 (1985): 540-557.
Jones, T.M. “Instrumental stakeholder theory: a synthesis of ethics and economics.”
Academy of Management Review, 20 (1995): 405-432
63
Orlitzky, M., F. L. Schmidt, and S. L. Rynes. "Corporate Social and Financial
Performance: A Meta-Analysis." Organization Studies 24.3 (2003): 403-41.
Maslow, Abraham H. Motivation and Personality. New York: Harper, 1954.
Melo, Tiago. "Effects of Corporate Social Responsibility on Brand Value." Thesis.
Universidad De Salamanca, 2009, 22.
Orlitzky, M. Corporate social performance and financial performance: A research
synthesis. In A. Crane, A. McWilliams, D. Matten, J. Moon, & D. S. Siegel
(Eds.), The Oxford Handbook of CSR. Oxford, UK: Oxford Press 2008.
Corporate Social Responsibility Branding Survey. Publication. Penn Schoen Berland,
2010.
2010 Cone Cause Evolution Study. Cone Communications, 2010.
The importance of corporate responsibility. Publication. The Economist. Economist
Intelligence Unit (2004): 1-33.
Backhaus, K. B., Stone, B. A. and Heiner, K. “Exploring the relationship between
corporate social performance and employer attractiveness.” Business and Society,
41 (2002), no. 3: 292-318.
Hartley, Robert F. Management Mistakes and Successes. Hoboken, NJ: Wiley, 2011.
Firestein, Peter J. "Building and Protecting Corporate Reputation." Strategy &
Leadership, 34.4 (2006): 25-31.
Greenhouse, Steven. "Nike Shoe Plant in Vietnam Is Called Unsafe for Workers." Nike
Shoe Plant in Vietnam Is Called Unsafe for Workers 8 Nov. 1997. The New York
Times.
Beth Kytle and John G. Ruggie, Corporate Responsibility as Risk Management: A Model
64
for Multinationals, Corporate Social Responsibility Initiative, Kennedy School of
Government, March 2005, 1-17.
Udayasankar, Krishna, Corporate Social Responsibility and Firm Size (2007). Journal of
Business Ethics, 2007. Available at SSRN: http://ssrn.com/abstract=1262535
John Hagel, III, and John Seely Brown. "HBR Blog Network." Harvard Business Review.
4 Mar. 2010. Web. Accessed October 6, 2012.
<http://blogs.hbr.org/bigshift/2010/03/the-best-way-to-measure-compan.html>.
Waddock, S.A., & Graves, S.B. “The corporate social performance-financial performance
link.” Strategic Management Journal, 18 (1997), no. 4: 303–19.
van Beurden, P. & Gossling, T. (2008). The worth of values – a literature review on the
relation between corporate social and financial performance. Journal of Business Ethics, 82, 407-424.
Wu, M.-L.: 2006, ‘Corporate Social Performance, Corporate Financial Performance, and
Firm Size: A Meta-Analysis’, Journal of American Academy of Business 8(1),
163–171.
Allouche, J., & Laroche, P. (2005). A meta-analytical investigation of the relationship
between corporate social and financial performance. Revue de Gestion des Res-
sources Humaines, 57, 18-41.
Goll, I. and A. A. Rasheed, (2004), “The Moderating Effect of Environmental
Munificence and Dynamism on the Relationship Between Discretionary Social
Responsibility and Firm Performance, Journal of Business Ethics, 49(1), 41-54.
Simpson, W.G., Kohers, T., 2002. The link between corporate social and financial
65
performance: Evidence from the banking industry. Journal of Business Ethics 35,
97-109.
Demsetz, H. and B. Villalonga, 2001, “Ownership Structure and Corporate
Performance”, Journal of Corporate Finance 7, 209-233.
Yoshikawa, T & Phan, PH 2003, ‘The performance implications of ownership-driven
governance reform’, European Management Journal, no. 21, pp. 698-706.
Martin, John, Petty, William and Wallace, James S., Shareholder Value Maximization –
Is There a Role for Corporate Social Responsibility?. Journal of Applied
Corporate Finance, Vol. 21, Issue 2, pp. 110-118, Spring 2009. Available at
SSRN: http://ssrn.com/abstract=1428135 or http://dx.doi.org/10.1111/j.1745-
6622.2009.00232.x
Hull, C.E. and Rothenberg, S.: 2008, “Firm performance: the interactions of corporate
social performance with innovation and industry differentiation”, Strategic
Management Journal 29, 781-789.
Raggio, Randle D. When the CEO’s Personal Crusade Drives Decisions. Case Study.
Harvard Business Review, 2010, 1-5.
Porter, Michael E. and Jan W. Rivkin (2012). The Looming Challenge to U.S.
Competitiveness. Harvard Business Review, 1-9.
Drucker, Peter. Management: Tasks, Responsibilities, Practices. Harper & Row,
Publishers, Inc. 1973, 57.
Porter, Michael E. and Mark R. Kramer (2011). Creating Shared Value. Harvard
Business Review, 6.
“Grameen Danone: a Social Business,” YouTube video, 4:36, posted by "kubohemian,"
May 28, 2010. http://www.youtube.com/watch?v=AV4WQV32ijs.
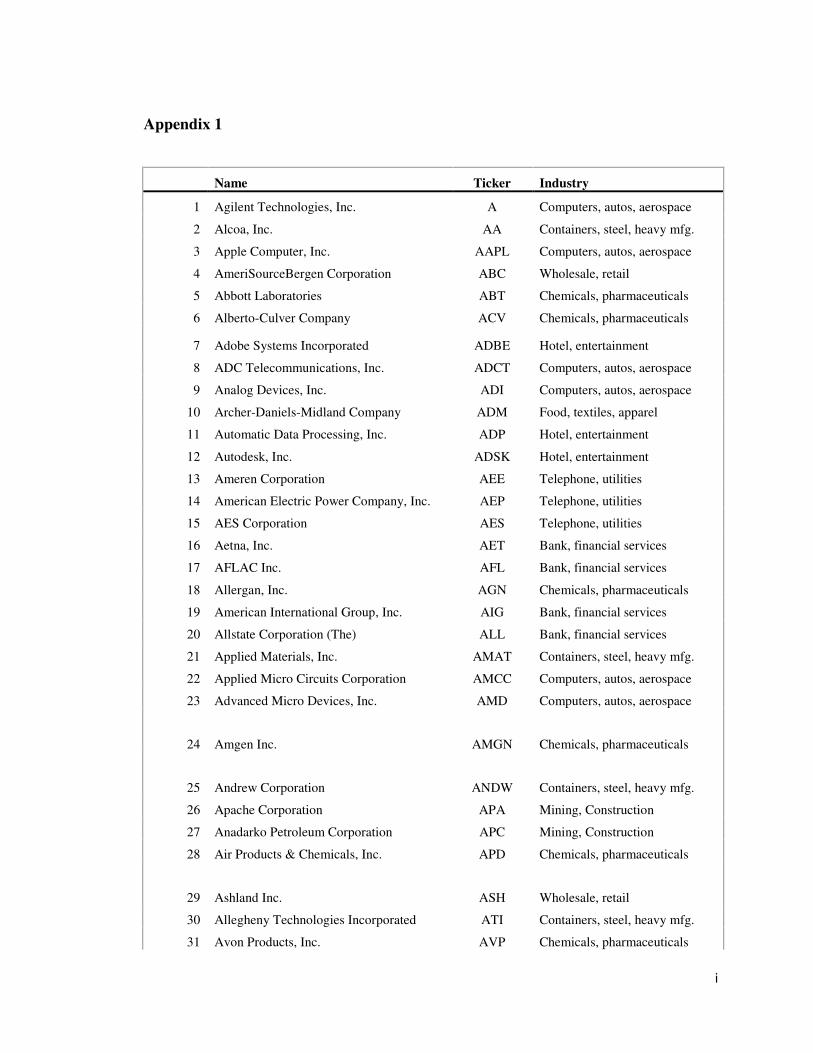
i
Appendix 1
Name Ticker Industry
1 Agilent Technologies, Inc. A Computers, autos, aerospace
2 Alcoa, Inc. AA Containers, steel, heavy mfg.
3 Apple Computer, Inc. AAPL Computers, autos, aerospace
4 AmeriSourceBergen Corporation ABC Wholesale, retail
5 Abbott Laboratories ABT Chemicals, pharmaceuticals
6 Alberto-Culver Company ACV Chemicals, pharmaceuticals
7 Adobe Systems Incorporated ADBE Hotel, entertainment
8 ADC Telecommunications, Inc. ADCT Computers, autos, aerospace
9 Analog Devices, Inc. ADI Computers, autos, aerospace
10 Archer-Daniels-Midland Company ADM Food, textiles, apparel
11 Automatic Data Processing, Inc. ADP Hotel, entertainment
12 Autodesk, Inc. ADSK Hotel, entertainment
13 Ameren Corporation AEE Telephone, utilities
14 American Electric Power Company, Inc. AEP Telephone, utilities
15 AES Corporation AES Telephone, utilities
16 Aetna, Inc. AET Bank, financial services
17 AFLAC Inc. AFL Bank, financial services
18 Allergan, Inc. AGN Chemicals, pharmaceuticals
19 American International Group, Inc. AIG Bank, financial services
20 Allstate Corporation (The) ALL Bank, financial services
21 Applied Materials, Inc. AMAT Containers, steel, heavy mfg.
22 Applied Micro Circuits Corporation AMCC Computers, autos, aerospace
23 Advanced Micro Devices, Inc. AMD Computers, autos, aerospace
24 Amgen Inc. AMGN Chemicals, pharmaceuticals
25 Andrew Corporation ANDW Containers, steel, heavy mfg.
26 Apache Corporation APA Mining, Construction
27 Anadarko Petroleum Corporation APC Mining, Construction
28 Air Products & Chemicals, Inc. APD Chemicals, pharmaceuticals
29 Ashland Inc. ASH Wholesale, retail
30 Allegheny Technologies Incorporated ATI Containers, steel, heavy mfg.
31 Avon Products, Inc. AVP Chemicals, pharmaceuticals
ii
32 Avery Dennison Corporation AVY Forest products, paper, publishing
33 Allied Waste Industries, Inc. AW Telephone, utilities
34 American Express Company AXP Bank, financial services
35 Allegheny Energy, Inc. AYE Telephone, utilities
36 AutoZone, Inc. AZO Wholesale, retail
37 Boeing Company BA Computers, autos, aerospace
38 Bank of America Corporation BAC Bank, financial services
39 Baxter International, Inc. BAX Chemicals, pharmaceuticals
40 Bed Bath & Beyond, Inc. BBBY Wholesale, retail
41 BB&T Corporation BBT Bank, financial services
42 Best Buy Company, Inc. BBY Wholesale, retail
43 Brunswick Corporation BC Containers, steel, heavy mfg.
44 Black & Decker Corporation BDK Containers, steel, heavy mfg.
45 Becton Dickinson and Company BDX Computers, autos, aerospace
46 Franklin Resources, Inc. BEN Bank, financial services
47 Baker Hughes Inc. BHI Containers, steel, heavy mfg.
48 Bank of New York Company, Inc. (The) BK Bank, financial services
49 BellSouth Corporation BLS Telephone, utilities
50 BMC Software, Inc. BMC Hotel, entertainment
51 Bemis Company, Inc. BMS Forest products, paper, publishing
52 Bristol-Myers Squibb Company BMY Chemicals, pharmaceuticals
53 Bausch & Lomb Incorporated BOL Chemicals, pharmaceuticals
54 Boston Scientific Corporation BSX Computers, autos, aerospace
55 Citigroup Inc. C Bank, financial services
56 Computer Associates International, Inc. CA Hotel, entertainment
57 ConAgra Foods, Inc. CAG Food, textiles, apparel
58 Cardinal Health, Inc. CAH Wholesale, retail
59 Caterpillar Inc. CAT Containers, steel, heavy mfg.
60 Chubb Corporation CB Bank, financial services
61 Cooper Industries, Inc. CBE Computers, autos, aerospace
62 Coca-Cola Enterprises Inc. CCE Food, textiles, apparel
63 Carnival Corporation, Inc. CCL Transportation
64 Constellation Energy Group CEG Telephone, utilities
65 Chiron Corporation CHIR Chemicals, pharmaceuticals
66 CIGNA Corporation CI Bank, financial services
iii
67 CIENA Corporation CIEN Computers, autos, aerospace
68 Cincinnati Financial Corporation CINF Bank, financial services
69 Colgate-Palmolive Company CL Chemicals, pharmaceuticals
70 Clorox Company CLX Chemicals, pharmaceuticals
71 Comerica Incorporated CMA Bank, financial services
72 CMS Energy Corporation CMS Telephone, utilities
73 Comverse Technology, Inc. CMVT Hotel, entertainment
74 Conseco, Inc. CNC Bank, financial services
75 Capital One Financial Corporation COF Bank, financial services
76 Costco Wholesale Corporation COST Wholesale, retail
77 Campbell Soup Company CPB Food, textiles, apparel
78 Compuware Corporation CPWR Hotel, entertainment
79 Computer Sciences Corporation CSC Hotel, entertainment
80 Cisco Systems, Inc. CSCO Computers, autos, aerospace
81 CSX Corporation CSX Transportation
82 Cintas Corporation CTAS Food, textiles, apparel
83 Cooper Tire and Rubber Company CTB Refining, rubber, plastic
84 Citrix Systems, Inc. CTXS Hotel, entertainment
85 Convergys Corporation CVG Hotel, entertainment
86 CVS Corporation CVS Wholesale, retail
87 ChevronTexaco Corporation CVX Refining, rubber, plastic
88 Dominion Resources, Inc. D Telephone, utilities
89 DuPont Company DD Chemicals, pharmaceuticals
90 Dillard's, Inc. DDS Wholesale, retail
91 Deere & Company DE Containers, steel, heavy mfg.
92 Dell Computer Corporation DELL Computers, autos, aerospace
93 Dollar General Corporation DG Wholesale, retail
94 Danaher Corporation DHR Computers, autos, aerospace
95 Disney, Walt Company (The) DIS Telephone, utilities
96 Dow Jones & Company DJ Forest products, paper, publishing
97 Dow Chemical Company DOW Chemicals, pharmaceuticals
98 Darden Restaurants, Inc. DRI Wholesale, retail
99 DTE Energy Company DTE Telephone, utilities
100 Duke Energy Corporation DUK Telephone, utilities
101 Devon Energy Corporation DVN Mining, Construction
iv
102 Ecolab Inc. ECL Chemicals, pharmaceuticals
103 Consolidated Edison Inc. ED Telephone, utilities
104 Equifax Inc. EFX Hotel, entertainment
105 Edison International EIX Telephone, utilities
106 EMC Corporation EMC Computers, autos, aerospace
107 Eastman Chemical Company EMN Chemicals, pharmaceuticals
108 Emerson Electric Co. EMR Computers, autos, aerospace
109 EOG Resources, Inc. EOG Mining, Construction
110 Equity Office Properties Trust EOP Hotel, entertainment
111 Eaton Corporation ETN Computers, autos, aerospace
112 Entergy Corp. ETR Telephone, utilities
113 Exelon Corporation EXC Telephone, utilities
114 Ford Motor Company F Computers, autos, aerospace
115 Freeport-McMoRan Copper & Gold Inc. FCX Mining, Construction
116 Family Dollar Stores FDO Wholesale, retail
117 FedEx Corporation FDX Transportation
118 FirstEnergy Corporation FE Telephone, utilities
119 Fiserv, Inc. FISV Hotel, entertainment
120 Fifth Third Bancorp FITB Bank, financial services
121 Fluor Corporation FLR Mining, Construction
122 Forest Laboratories, Inc. FRX Chemicals, pharmaceuticals
123 NICOR Inc. GAS Telephone, utilities
124 Gannett Co., Inc. GCI Forest products, paper, publishing
125 General Dynamics Corporation GD Computers, autos, aerospace
126 Guidant Corporation GDT Computers, autos, aerospace
127 Golden West Financial GDW Bank, financial services
128 General Electric Company GE Hospital Management
129 General Mills Incorporated GIS Food, textiles, apparel
130 Corning Incorporated GLW Computers, autos, aerospace
131 General Motors Corporation GM Computers, autos, aerospace
132 Gap, Inc. (The) GPS Wholesale, retail
133 Goodrich Corporation GR Computers, autos, aerospace
134 Goodyear Tire & Rubber Co. GT Refining, rubber, plastic
135 Gateway, Inc. GTW Computers, autos, aerospace
136 Grainger (W.W.), Inc. GWW Wholesale, retail
137 Halliburton Company HAL Mining, Construction
v
138 Hasbro, Inc. HAS Computers, autos, aerospace
139 Huntington Bancshares, Inc. HBAN Bank, financial services
140 HCA Inc. HCA Hospital Management
141 Manor Care, Inc. HCR Hotel, entertainment
142 Home Depot, Inc. HD Wholesale, retail
143 Hartford Financial Services Group (The) HIG Bank, financial services
144 Hilton Hotels Corporation HLT Hotel, entertainment
145 Health Management Associates, Inc. HMA Hospital Management
146 Heinz (H.J.) Company HNZ Food, textiles, apparel
147 Honeywell International, Inc. HON Computers, autos, aerospace
148 Starwood Hotels and Resorts Worldwide, Inc. HOT Hotel, entertainment
149 Hercules Incorporated HPC Chemicals, pharmaceuticals
150 Block (H&R), Inc. HRB Hotel, entertainment
151 Hershey Foods Corporation HSY Food, textiles, apparel
152 Humana Inc. HUM Bank, financial services
153 International Business Machines Corporation IBM Hotel, entertainment
154 International Game Technology IGT Hotel, entertainment
155 Intel Corporation INTC Computers, autos, aerospace
156 Intuit, Inc. INTU Hotel, entertainment
157 International Paper Company IP Forest products, paper, publishing
158 Interpublic Group of Companies, Inc. IPG Hotel, entertainment
159 Ingersoll-Rand Company IR Containers, steel, heavy mfg.
160 ITT Industries, Inc. ITT Containers, steel, heavy mfg.
161 Jabil Circuit, Inc. JBL Computers, autos, aerospace
162 Johnson Controls, Inc. JCI Forest products, paper, publishing
163 Penney (J.C.) Company, Inc. JCP Wholesale, retail
164 JDS Uniphase Corporation JDSU Computers, autos, aerospace
165 Johnson & Johnson JNJ Chemicals, pharmaceuticals
166 Jones Apparel Group, Inc. JNY Food, textiles, apparel
167 Jefferson-Pilot Corporation JP Bank, financial services
168 Morgan (J.P.) Chase & Company JPM Bank, financial services
169 Nordstrom, Inc. JWN Wholesale, retail
170 Kellogg Company K Food, textiles, apparel
171 KB Home KBH Mining, Construction
172 KeyCorp KEY Bank, financial services
173 King Pharmaceuticals, Inc. KG Chemicals, pharmaceuticals
vi
174 KLA-Tencor Corporation KLAC Computers, autos, aerospace
175 Kimberly-Clark Corporation KMB Forest products, paper, publishing
176 Kerr-McGee Corporation KMG Chemicals, pharmaceuticals
177 Kinder Morgan, Inc. KMI Telephone, utilities
178 Coca-Cola Company KO Food, textiles, apparel
179 Kroger Co. KR Wholesale, retail
180 Knight Ridder KRI Forest products, paper, publishing
181 KeySpan Corporation KSE Telephone, utilities
182 Kohl's Corporation KSS Wholesale, retail
183 Leggett & Platt, Inc. LEG Forest products, paper, publishing
184 Linear Technology Corp. LLTC Computers, autos, aerospace
185 Lilly (Eli) and Company LLY Chemicals, pharmaceuticals
186 Lockheed Martin Corporation LMT Computers, autos, aerospace
187 Lincoln National Corporation LNC Bank, financial services
188 Lowe's Companies, Inc. LOW Wholesale, retail
189 Louisiana-Pacific Corporation LPX Forest products, paper, publishing
190 LSI Logic Corporation LSI Computers, autos, aerospace
191 Limited, Inc. (The) LTD Wholesale, retail
192 Lucent Technologies, Inc. LU Hotel, entertainment
193 Southwest Airlines Co. LUV Transportation
194 Lexmark International, Inc. LXK Computers, autos, aerospace
195 Marriott International, Inc. MAR Hotel, entertainment
196 Masco Corporation MAS Containers, steel, heavy mfg.
197 Mattel, Inc. MAT Computers, autos, aerospace
198 MBIA Inc. MBI Bank, financial services
199 McDonald's Corporation MCD Wholesale, retail
200 McKesson Corporation MCK Wholesale, retail
201 Moody's Corporation MCO Hotel, entertainment
202 Meredith Corporation MDP Forest products, paper, publishing
203 Medtronic, Inc. MDT Computers, autos, aerospace
204 MedImmune, Inc. MEDI Chemicals, pharmaceuticals
205 Metlife, Inc. MET Bank, financial services
206 McGraw-Hill Companies, Inc. MHP Forest products, paper, publishing
207 Millipore Corporation MIL Wholesale, retail
vii
208 Marsh & McLennan Companies, Inc. MMC Bank, financial services
209 Minnesota Mining and Manufacturing Company MMM
Forest products, paper, publishing
210 Philip Morris Companies Inc. MO Food, textiles, apparel
211 Merck & Co., Inc. MRK Chemicals, pharmaceuticals
212 Marathon Oil Corporation MRO Mining, Construction
213 Microsoft Corporation MSFT Hotel, entertainment
214 MGIC Investment Corporation MTG Bank, financial services
215 Micron Technology, Inc. MU Computers, autos, aerospace
216 Maxim Integrated Products, Inc. MXIM Computers, autos, aerospace
217 Navistar International Corporation NAV Computers, autos, aerospace
218 Nabors Industries, Inc. NBR Mining, Construction
219 National City Corporation NCC Bank, financial services
220 NCR Corporation NCR Computers, autos, aerospace
221 Noble Drilling Corporation NE Mining, Construction
222 Newmont Mining Corporation NEM Mining, Construction
223 NiSource, Inc. NI Telephone, utilities
224 NIKE, Inc. NKE Refining, rubber, plastic
225 Northrop Grumman Corporation NOC Computers, autos, aerospace
226 Novell, Inc. NOVL Hotel, entertainment
227 Norfolk Southern Corporation NSC Transportation
228 Network Appliance, Inc. NTAP Computers, autos, aerospace
229 Northern Trust Corporation NTRS Bank, financial services
230 Nucor Corporation NUE Containers, steel, heavy mfg.
231 NVIDIA Corporation NVDA Computers, autos, aerospace
232 Novellus Systems, Inc. NVLS Containers, steel, heavy mfg.
233 Newell Rubbermaid, Inc. NWL Computers, autos, aerospace
234 New York Times Company NYT Forest products, paper, publishing
235 Omnicom Group Inc. OMC Hotel, entertainment
236 Oracle Corporation ORCL Hotel, entertainment
237 Occidental Petroleum Corporation OXY Mining, Construction
238 Paychex, Inc. PAYX Hospital Management
239 Pepsi Bottling Group, Inc. PBG Food, textiles, apparel
240 Pitney Bowes Inc. PBI Computers, autos, aerospace
241 PACCAR, Inc. PCAR Computers, autos, aerospace
242 PG&E Corporation PCG Telephone, utilities
viii
243 Phelps Dodge Corporation PD Containers, steel, heavy mfg.
244 Public Service Enterprise Group, Incorporated PEG Telephone, utilities
245 PepsiCo, Inc. PEP Food, textiles, apparel
246 Pfizer, Inc. PFE Chemicals, pharmaceuticals
247 Procter & Gamble Company PG Chemicals, pharmaceuticals
248 Progress Energy, Inc. PGN Telephone, utilities
249 Progressive Corporation (The) PGR Bank, financial services
250 Parker-Hannifin Corporation PH Containers, steel, heavy mfg.
251 PerkinElmer, Inc. PKI Computers, autos, aerospace
252 PMC-Sierra, Inc. PMCS Computers, autos, aerospace
253 Parametric Technology Corporation PMTC Hotel, entertainment
254 PNC Financial Services Group PNC Bank, financial services
255 Pinnacle West Capital Corporation PNW Telephone, utilities
256 PPG Industries, Inc. PPG Chemicals, pharmaceuticals
257 PP&L Corporation PPL Telephone, utilities
258 Praxair, Inc. PX Chemicals, pharmaceuticals
259 Qwest Communications International, Inc. Q Telephone, utilities
260 Qualcomm Inc. QCOM Computers, autos, aerospace
261 QLogic Corporation QLGC Computers, autos, aerospace
262 Ryder System, Inc. R Hotel, entertainment
263 Rowan Companies, Inc. RDC Mining, Construction
264 Robert Half International, Inc. RHI Hotel, entertainment
265 Transocean Sedco Forex, Inc. RIG Mining, Construction
266 Rohm and Haas Company ROH Chemicals, pharmaceuticals
267 Rockwell International Corporation ROK Computers, autos, aerospace
268 RadioShack Corporation RSH Wholesale, retail
269 Raytheon Company RTN Computers, autos, aerospace
270 Sears, Roebuck and Co. S Telephone, utilities
271 Sanmina-SCI Corporation SANM Computers, autos, aerospace
272 Starbucks Corporation SBUX Wholesale, retail
273 Schering-Plough Corporation SGP Chemicals, pharmaceuticals
274 Sigma-Aldrich Corporation SIAL Chemicals, pharmaceuticals
275 Schlumberger N.V. SLB Mining, Construction
276 USA Education, Inc. SLM Bank, financial services
277 Solectron Corporation SLR Computers, autos, aerospace
ix
278 Synovus Financial Corp. SNV Bank, financial services
279 Southern Company SO Telephone, utilities
280 Sempra Energy SRE Telephone, utilities
281 SunTrust Banks, Inc. STI Bank, financial services
282 St. Jude Medical, Inc. STJ Computers, autos, aerospace
283 State Street Corporation STT Bank, financial services
284 Sunoco, Inc. SUN Refining, rubber, plastic
285 SUPERVALU Inc. SVU Wholesale, retail
286 Stanley Works (The) SWK Containers, steel, heavy mfg.
287 Safeway Inc. SWY Wholesale, retail
288 Stryker Corporation SYK Computers, autos, aerospace
289 SYSCO Corporation SYY Wholesale, retail
290 AT&T Corp. T Telephone, utilities
291 TECO Energy, Inc. TE Telephone, utilities
292 Teradyne, Inc. TER Computers, autos, aerospace
293 Target Corporation TGT Wholesale, retail
294 Tenet Healthcare Corporation THC Hospital Management
295 Tiffany & Company TIF Wholesale, retail
296 Temple-Inland Inc. TIN Forest products, paper, publishing
297 TJX Companies, Inc. TJX Wholesale, retail
298 Tellabs, Inc. TLAB Computers, autos, aerospace
299 Torchmark Corporation TMK Bank, financial services
300 Thermo Electron Corporation TMO Computers, autos, aerospace
301 Tribune Company TRB Forest products, paper, publishing
302 Texas Instruments Incorporated TXN Computers, autos, aerospace
303 Textron Inc. TXT Computers, autos, aerospace
304 Tyco International Ltd. TYC Hospital Management
305 UnitedHealth Group, Inc. UNH Bank, financial services
306 UnumProvident Corp. UNM Bank, financial services
307 Union Pacific Corporation UNP Transportation
308 U.S. Bancorp USB Bank, financial services
309 United Technologies Corporation UTX Computers, autos, aerospace
310 Visteon Corporation VC Computers, autos, aerospace
311 VF Corporation VFC Food, textiles, apparel
312 Verizon Communications VZ Telephone, utilities
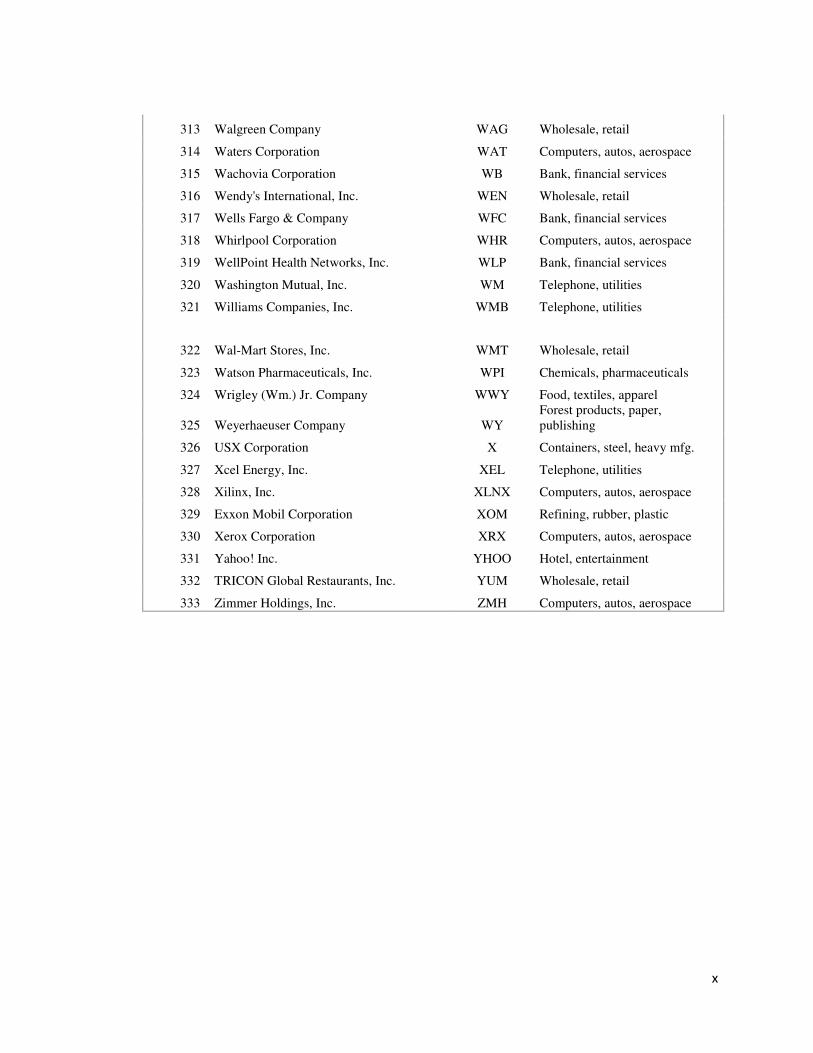
x
313 Walgreen Company WAG Wholesale, retail
314 Waters Corporation WAT Computers, autos, aerospace
315 Wachovia Corporation WB Bank, financial services
316 Wendy's International, Inc. WEN Wholesale, retail
317 Wells Fargo & Company WFC Bank, financial services
318 Whirlpool Corporation WHR Computers, autos, aerospace
319 WellPoint Health Networks, Inc. WLP Bank, financial services
320 Washington Mutual, Inc. WM Telephone, utilities
321 Williams Companies, Inc. WMB Telephone, utilities
322 Wal-Mart Stores, Inc. WMT Wholesale, retail
323 Watson Pharmaceuticals, Inc. WPI Chemicals, pharmaceuticals
324 Wrigley (Wm.) Jr. Company WWY Food, textiles, apparel
325 Weyerhaeuser Company WY Forest products, paper, publishing
326 USX Corporation X Containers, steel, heavy mfg.
327 Xcel Energy, Inc. XEL Telephone, utilities
328 Xilinx, Inc. XLNX Computers, autos, aerospace
329 Exxon Mobil Corporation XOM Refining, rubber, plastic
330 Xerox Corporation XRX Computers, autos, aerospace
331 Yahoo! Inc. YHOO Hotel, entertainment
332 TRICON Global Restaurants, Inc. YUM Wholesale, retail
333 Zimmer Holdings, Inc. ZMH Computers, autos, aerospace
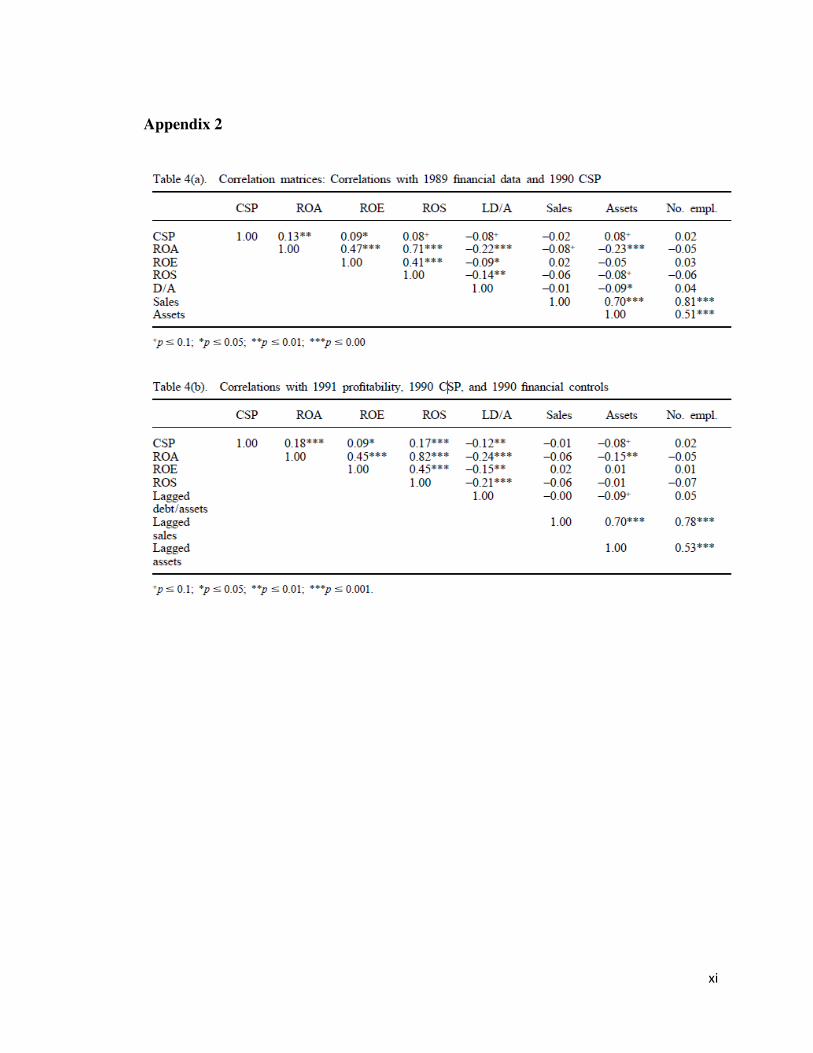
xi
Appendix 2
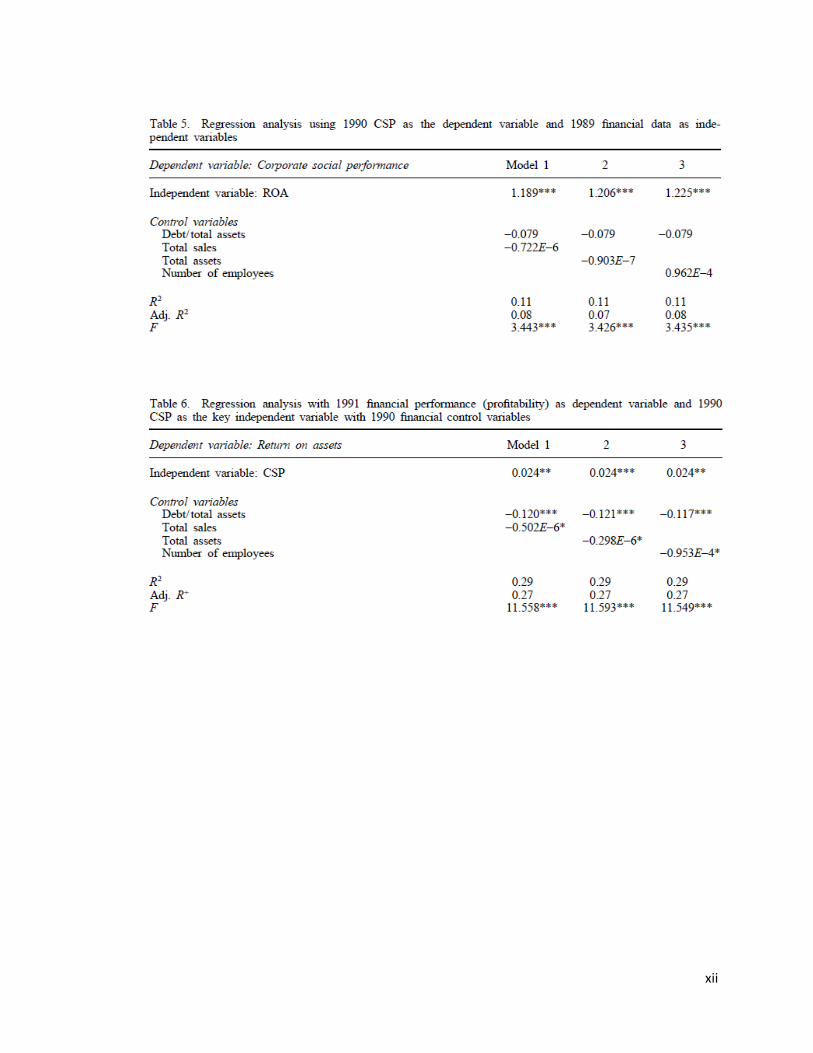
xii