Embed Size (px)
Citation preview

full datareportCORPORATE RESPONSIBILITY2010

All figures in this Report cover the period from 1 April 2009 to 31 March 2010 and our managed property portfolio, unless otherwise stated.
The data and performance targets have been independently assured by Bureau Veritas, so you can be confident that we are reporting accurately – and on those issues most material to our business and our stakeholders.
Our like-for-like portfolio comprises those properties that were in our portfolio for the whole of this year and either last year (annual like-for-like) or 2004/05 (long-term like-for-like).
The Global Reporting Initiative (GRI) Indicator reference number is provided next to relevant figures. NA indicates where data is not applicable. NR indicates where data has not been reported.
full data report
britishland.com/crreport2010
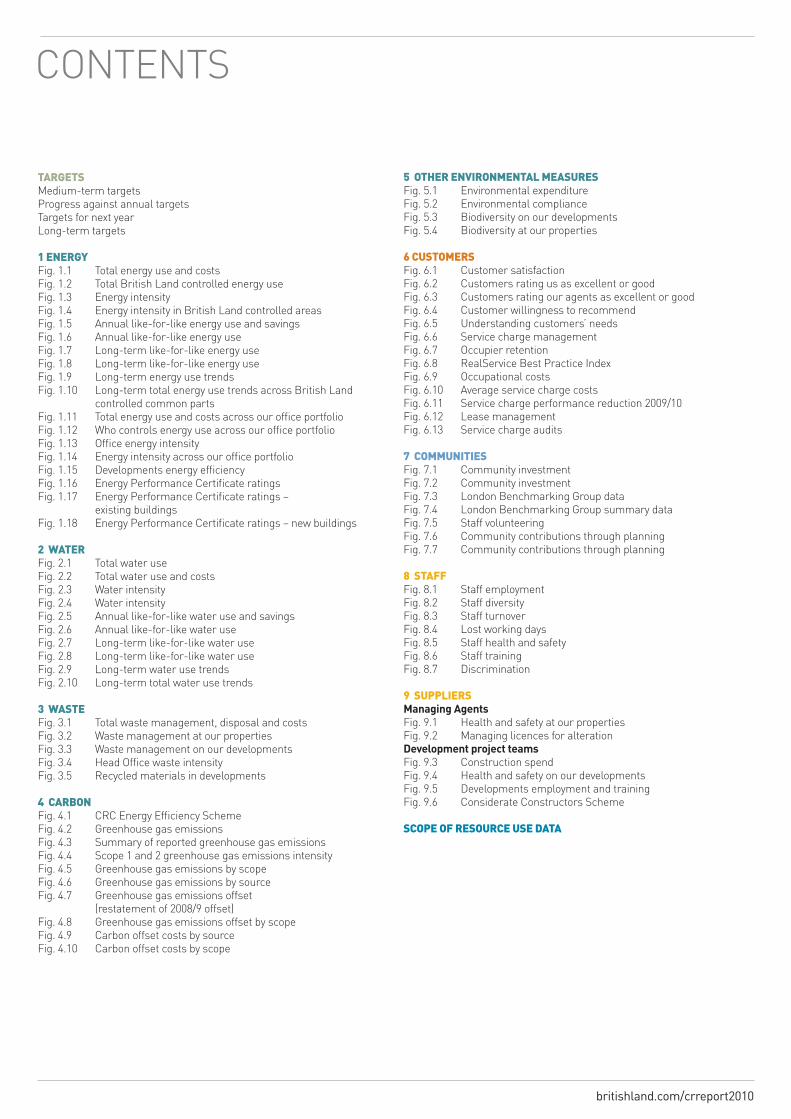
contents
targetsMedium-term targetsprogress against annual targetstargets for next yearlong-term targets
1energy fig. 1.1 total energy use and costs fig. 1.2 total British land controlled energy use fig. 1.3 energy intensity fig. 1.4 energy intensity in British land controlled areas fig. 1.5 annual like-for-like energy use and savings fig. 1.6 annual like-for-like energy use fig. 1.7 long-term like-for-like energy use fig. 1.8 long-term like-for-like energy use fig. 1.9 long-term energy use trends fig. 1.10 long-term total energy use trends across British land controlled common parts fig. 1.11 total energy use and costs across our office portfolio fig. 1.12 Who controls energy use across our office portfolio fig. 1.13 office energy intensity fig. 1.14 energy intensity across our office portfolio fig. 1.15 developments energy efficiency fig. 1.16 energy performance certificate ratings fig. 1.17 energy performance certificate ratings – existing buildings fig. 1.18 energy performance certificate ratings – new buildings
2Water fig. 2.1 total water use fig. 2.2 total water use and costs fig. 2.3 Water intensity fig. 2.4 Water intensity fig. 2.5 annual like-for-like water use and savings fig. 2.6 annual like-for-like water use fig. 2.7 long-term like-for-like water use fig. 2.8 long-term like-for-like water use fig. 2.9 long-term water use trends fig. 2.10 long-term total water use trends
3Waste fig. 3.1 total waste management, disposal and costs fig. 3.2 Waste management at our properties fig. 3.3 Waste management on our developments fig. 3.4 Head office waste intensity fig. 3.5 recycled materials in developments
4Carbonfig. 4.1 crc energy efficiency scheme fig. 4.2 Greenhouse gas emissions fig. 4.3 summary of reported greenhouse gas emissions fig. 4.4 scope 1 and 2 greenhouse gas emissions intensity fig. 4.5 Greenhouse gas emissions by scope fig. 4.6 Greenhouse gas emissions by source fig. 4.7 Greenhouse gas emissions offset (restatement of 2008/9 offset) fig. 4.8 Greenhouse gas emissions offset by scope fig. 4.9 carbon offset costs by source fig. 4.10 carbon offset costs by scope
5otherenvironmentalmeasuresfig. 5.1 environmental expenditure fig. 5.2 environmental compliance fig. 5.3 Biodiversity on our developments fig. 5.4 Biodiversity at our properties
6Customersfig. 6.1 customer satisfaction fig. 6.2 customers rating us as excellent or good fig. 6.3 customers rating our agents as excellent or good fig. 6.4 customer willingness to recommend fig. 6.5 understanding customers’ needs fig. 6.6 service charge management fig. 6.7 occupier retention fig. 6.8 realservice Best practice Index fig. 6.9 occupational costs fig. 6.10 average service charge costs fig. 6.11 service charge performance reduction 2009/10fig. 6.12 lease management fig. 6.13 service charge audits
7Communitiesfig. 7.1 community investment fig. 7.2 community investment fig. 7.3 london Benchmarking Group data fig. 7.4 london Benchmarking Group summary data fig. 7.5 staff volunteering fig. 7.6 community contributions through planning fig. 7.7 community contributions through planning
8staff fig. 8.1 staff employment fig. 8.2 staff diversity fig. 8.3 staff turnover fig. 8.4 lost working days fig. 8.5 staff health and safety fig. 8.6 staff training fig. 8.7 discrimination
9suppliers Managing Agents fig. 9.1 Health and safety at our properties fig. 9.2 Managing licences for alteration Development project teams fig. 9.3 construction spend fig. 9.4 Health and safety on our developments fig. 9.5 developments employment and training fig. 9.6 considerate constructors scheme
sCopeofresourCeusedata
britishland.com/crreport2010

tHIs Year, We Have added even More cHallenGInG tarGets for tHe next feW Years to drIve perforMance furtHer.
all facts and figures in this report cover the period from 1 april 2009 until 31 March 2010. the data and performance targets have been independently assured by Bureau veritas, so you can be confident that we are reporting accurately – and on those issues most material to our business and our stakeholders. for our full corporate responsibility report: britishland.com/crReport2010
MedIuM-terM tarGets
TO REDuCE MANAgED ENERgY uSE BY 20% PER M² FOR EACH PROPERTY TYPE BY 2012, COMPARED TO 2009 Energy intensity per m² (kWh) 2009 2010 2012 target
NATuRAl ResOuRces HIGHlIGHTs
12%
BreeaM
11,000
13%
23%
LESS ENERgY uSE across our like-for-like managed portfolio, saving 11.1 million kWh and £700,000 for us and our occupiers.
ExCELLENT ratings for all of our new office developments.
TONNES OF wASTE RECYCLED or re-used at our properties and developments, equivalent to £445,000 in landfill taxes.
LESS wATER uSE across our like-for-like managed portfolio, saving 54.7 million litres of water and £70,000 for us and our occupiers.
RECYCLED CONTENT across our new developments by value.
171.2 (15% reduction)200.8
22.1 (17% reduction)
9.5 (12% reduction)
British land controlled energy use across our entire managed portfolio, comprising small power and lighting, as well as heating and cooling from the central plant.
offices
shopping centres
retail parks
continental europe
TO ACHIEVE PLANNINg CONSENT FOR A zERO CARBON COMMERCIAL BuILDINg BY 2015 More carbon efficient design than current standards (%) 2009 2010
current standards are Building regulations part l2a 2006.
across our developments on average
27% 25%
26.5
48.854.8 (12% increase)
10.9
TO SEND zERO MANAgED wASTE TO LANDFILL FROM ALL OuR PROPERTIES AND DEVELOPMENTS BY 2012 waste diverted from landfill (%) 2009 2010
83% 86%
86% 93%
We more than doubled the number of properties managing and reporting waste, as well as increasing the proportion of waste recycled. the reduction in waste diverted from landfill was largely due to lower incineration rates, particularly at new properties. We did not undertake any demolition projects; this affected the proportion of development waste diverted from landfill as the demolition phase typically offers the biggest opportunities for re-use. We will continue working with our development and management teams to divert waste from landfill. 2009 figures for properties and developments were restated to reflect improvements in data accuracy.
at our properties
on our developments
Water use across British land’s office portfolio and the common parts of British land’s retail portfolio. Water intensity increased at our shopping centres due to the inclusion of new properties that do not benefit from the rainwater harvesting and borehole water systems present at some of our existing properties. We will focus on reducing water use at these new properties.
TO REDuCE MANAgED wATER uSE BY 20% PER M² FOR EACH PROPERTY TYPE BY 2015, COMPARED TO 2009 water use per m² (cubic metres) 2009 2010 2015 target
retail parks
shopping centres
offices
continental europe
0.830.83 (no change)
0.050.09 (80% increase)
0.370.23 (38% reduction)
0.88 (19% reduction)1.09
britishland.com/crreport2010
tarGets 01

MedIuM-terM tarGets
cOMMuNITIes
sTAff ANd supplIeRs
360º 2,944
COMMuNITY INVESTMENT across our portfolio through cash contributions, in-kind donations and time spent supporting community projects.
FuNDRAISINg thanks to the efforts and generosity of our staff, suppliers, occupiers and shoppers.
YOuNg PEOPLE participated in projects we supported, including a cricket league, chess tournaments and creative projects.
LORD MAYOR’S DRAgON AwARDS 2009 for British land and Broadgate estates.
FEEDBACk process established for all our Head office staff.
PROMPT PAYMENT – we signed up to the Government’s new prompt payment code.
TRAININg HOuRS for Broadgate estates staff,equivalent to 18 hours per person.
ALL gOLD AwARDS or better for service charge management at our properties audited by the property Managers association.
TO SET A 2015 TARgET FOR LOCAL SATISFACTION wITH BRITISH LAND AS A DEVELOPER.
next year, we will establish a methodology to measure local satisfaction with British land as a developer.
TO SET A 2015 TARgET FOR STAFF SATISFACTION wITH BRITISH LAND AS AN EMPLOYER.
next year, we will carry out a survey to measure staff satisfaction.
Based on independent surveys carried out with 50 occupiers in 2009 and 54 occupiers in 2007.
cusTOMeRs
TO ACHIEVE 80% CuSTOMER SATISFACTION wITH uS AND OuR MANAgINg AgENTS BY 2013
uk customers rating as good or excellent (%) 2007 2009
LANDLORD OF THE YEAR 2009 and Best service charge provider, as voted by uK retailers.
TOP quARTILE for customer service in the realservice Best practice Index 2009.
SAVINgS for occupiers on service charges, with average savings of 7% per m².
RESOuRCE REDuCTION PARTNERSHIPS with 30% of occupiers across our multi-let managed offices.
£3.5m
£717,000
£490,000
70,000
82%
73%
HIGHlIGHTs
HIGHlIGHTs
HIGHlIGHTs
43%
40%
our managing agents
British land
britishland.com/crreport2010
tarGets 02
for our progress against the long-term targets we set in 2007, visit tarGets paGe 08

Target
Identify initiatives in building-specific environmental plans and reduce energy use by 5% on an annual like-for-like basis across our managed portfolio.
30% of all occupiers in multi-let office buildings to sign up to carbon reduction Memorandum of understanding or equivalent document.
review longer-term targets to verify whether these remain achievable. set out actions required to achieve the revised longer-term targets.
raise awareness of energy initiatives with retailers and identify target retailers to increase engagement.
offset carbon emissions within the British land direct carbon footprint using appropriately certified scheme.
Target
recycle 50% of managed retail waste across our retail portfolio.
dispose of no more than 20% of managed retail waste to landfill across our retail portfolio.
recycle 60% of waste across our managed office portfolio.
dispose zero waste to landfill across our managed office portfolio.
recycle 90% of fit-out waste for common parts fit-out projects (covered by construction, design and Management regulations) across our entire portfolio.
50% of office fit-out projects (covered by construction, design and Management regulations) undertaken by occupiers to adopt the British land fit-out Waste Guidelines.
all developments to divert a minimum of 95% of demolition and strip-out material waste from landfill, and a minimum of 85% of construction waste.
Work with our construction supply chain to achieve zero demolition waste to landfill by 2010. develop absolute waste reduction targets for future development projects. Work with our construction supply chain to reduce overall waste generated on development sites.
Progress statement
We reduced like-for-like energy use by 12% across our managed portfolio.
30% of occupiers in our multi-let office buildings signed up to carbon reduction agreements.
We reviewed our longer-term targets and set eight new medium-term targets to drive performance.
We held a sustainability workshop with retailers through the property Managers association. next year, our property management teams will work with individual retailers across our portfolio.
We offset 20,769 tonnes of carbon emissions through the first climate project, verified under the voluntary carbon standard.
Progress statement
We recycled 39% of managed retail waste.
We diverted 74% of managed retail waste from landfill.
We recycled 50% of managed office waste.
We diverted 99.5% of managed office waste from landfill.
We recycled 97% of fit-out waste for major fit-out projects in common parts.
all five major office fit-out projects undertaken by occupiers adopted our fit-out Waste Guidelines.
We diverted 86% of construction waste from landfill. there were no demolition projects.
We worked with our development supply chain to review ways to achieve zero demolition waste to landfill and to reduce overall waste. there is more work to be done to establish robust waste reduction targets.
Progress
progress statements were provided by external consultants arup and all 32 performance-based targets were independently reviewed by Bureau veritas.
ENERgY uSE
wASTE MANAgEMENT
proGress aGaInst annual tarGets
tarGets 03
britishland.com/crreport2010
100%
100%
100%
50%
79%
77%
84%
99.5%
100%
100%
100%
67%
100%

100%
10%
100%
76%
100%
30%
100%
n/a
84%
92%
n/a
100%
100%
Target
Identify initiatives in building-specific environmental plans and reduce total water consumption by 2% on an annual like-for-like basis within our managed portfolio.
Measure the proportion of water consumed from non-mains sources and set a target for the future.
15% of managed assets in the portfolio to have Biodiversity action plans.
25% of managed assets in the portfolio to have Green travel plans.
all developments with a construction cost of over £5 million to result in a net improvement in site biodiversity.
establish intensity targets for water use to benchmark performance by sector against industry standards.
Target
all new office developments to achieve a BreeaM excellent rating. all office refurbishments with a construction cost over £3 million to achieve a minimum BreeaM very Good rating. new retail construction with a construction cost over £3 million to support the use of BreeaM retail in areas we can control.
all new residential developments gaining planning permission after 2009 to achieve a minimum code for sustainable Homes level four.
all new office developments to be constructed to a standard at least 10% better than the relevant part l2a Building regulations. all office refurbishments to achieve an energy performance certificate (epc) rating of no more than 60.
at least 25% of total material by value in new buildings to contain re-used and recycled content.
all london office developments to score an average of 36 under the considerate constructors scheme (ccs).
Measure the carbon footprint of our on-site development activity and report on our findings.
report on partnering with our contractors to address the management of environmental impacts arising from the supply chain for our developments.
Progress statement
We reduced like-for-like water use by 13% across our managed portfolio.
We identified that 12% of our properties sourced non-mains water, primarily from rainwater harvesting or a borehole. We are installing meters so that we can achieve our aim of monitoring usage and setting targets for the proportion of water from non-mains sources.
31% of our managed assets were covered by Biodiversity action plans.
19% of our managed assets were covered by Green travel plans.
two of our completed major developments achieved an improvement in site biodiversity, with the remaining four all designed to do so.
We are reviewing cIrIa guidance to set intensity targets for water use by property type.
Progress statement
all of our new office developments achieved BreeaM excellent ratings, or are designed to do so. our two planned major office refurbishments are targeting excellent ratings. our one new major retail development is also targeting BreeaM excellent.
our target to achieve code for sustainable Homes level four was not applicable as no new residential developments commenced design this year or gained planning consent after 2009.
our developments are designed to be 27% more energy efficient on average than current regulations, with our new office developments 30% more energy efficient. two of our three refurbishments are designed to achieve energy performance certificate ratings better than 60.
23% of materials in our new developments by value comprised recycled content.
none of our london office developments undertook ccs audits and so our target ccs score was not applicable.
We measured the carbon footprint of our on-site development activity at ropemaker place.
We partnered with Bovis lend lease to review the environmental impacts arising from our development supply chain.
Progress
wATER uSE, BIODIVERSITY AND TRAVEL
SuSTAINABLE DEVELOPMENT
proGress aGaInst annual tarGets
tarGets 04
britishland.com/crreport2010

Target
achieve 80% average occupier satisfaction on post occupancy surveys.
achieve 85% recommendation rating from occupiers on post occupancy surveys.
exceed satisfaction ratings for lease flexibility and lease assignments in the 2009 occupier satisfaction Index (osI).
achieve 55% occupier retention across our entire portfolio where the occupier had an unfettered option to renew.
Target
assets with a staff presence (at least 30% full-time equivalent) to implement an employment and training initiative for the local community.
Head office to donate more than £350,000 to support good community causes.
all assets with a staff presence (at least 30% full-time equivalent) to engage in local fundraising initiatives raising more than £10,000.
undertake pre-application stakeholder consultation on all new developments.
establish more systematic recording and reporting for new developments on who has been engaged with, how, and the outcomes of that engagement.
Progress statement
91% average occupier satisfaction on post occupancy surveys at 201 Bishopsgate and the Broadgate tower.
100% recommendation rating from occupiers on post occupancy surveys at 201 Bishopsgate and the Broadgate tower.
75% occupier satisfaction ratings for lease flexibility and 57% for lease assignments, significantly exceeding industry averages of 38% and 25% respectively.
We maintained our high occupancy rates, with 43% retention of occupiers reaching break clauses.
Progress statement
71% of major staffed assets implemented an employment and training initiative for the local community.
Head office made cash contributions of £506,000 to support good community causes.
57% of major staffed assets engaged in local fundraising initiatives raising more than £10,000.
pre-application stakeholder consultation undertaken on all four new developments.
sustainability Brief template updated to include more systematic recording and reporting on stakeholder engagement.
Progress
Progress
CuSTOMERS
COMMuNITY
proGress aGaInst annual tarGets
tarGets 05
britishland.com/crreport2010
100%
100%
100%
77%
100%
71%
57%
100%
100%

Target
reduce 2009/10 service charge costs by 5% per m² across the entire portfolio, compared to 2008/09.
achieve 95% compliance of the service charge code. compliance defined by the realservice industry benchmark.
all property Managers association (pMa) service charge audits to achieve Gold.
achieve 90% ‘green’ status on health and safety for the managed portfolio.
reportable accident frequency rate not to exceed 0.25 and lost-day accident frequency rate not to exceed 0.20.
all managing agents to comply with the British land service charge procurement policy.
Target
25% of all Head office staff to participate in community volunteering.
reduce annual electricity consumption at Head office per full-time equivalent by 5%, compared to 2008/09.
reduce waste generated at Head office per full-time equivalent by 5%, compared to 2008/09.
recycle 65% of managed waste at our Head office and send zero waste to landfill.
reduce annual staff london taxi travel by 5%, measured as a proportion of total london travel compared to 2008/09.
Implement staff corporate responsibility engagement and communication plan.
Progress statement
service charge costs reduced by 7% per m² on average across our entire portfolio.
98% compliance with the service charge code, as defined by the realservice industry benchmark.
all seven property Managers association service charge audits achieved Gold or better, with Broughton shopping park achieving the uK’s first platinum award.
98% of properties achieved our health and safety management standards.
reportable accident frequency rate of 0.26 per 100,000 hours worked on our development sites, better than 0.30 last year but not meeting our 0.25 target. lost-day accident frequency rate of 0.47.
We believe that our agents complied with our service charge procurement policy but did not formally measure this. We will address this going forward.
Progress statement
27% of all Head office staff participated in community volunteering.
11% reduction in Head office electricity use per person.
no reduction in Head office waste per person. We will increase our focus on waste reduction.
75% of Head office waste recycled. 98% diverted from landfill.
staff london taxi travel increased to 16% of all business trips from 15%. We will look at further ways to address this.
established staff environmental Working Group and quarterly corporate responsibility updates.
Progress
Progress
SuPPLIERS
STAFF
proGress aGaInst annual tarGets
tarGets 06
britishland.com/crreport2010
100%
100%
100%
100%
48%
0%
100%
100%
0%
0%
99%
100%

tarGets for next Year
tarGets 07
britishland.com/crreport2010
TRAVEL
• provide guidance to staff and suppliers on appropriate modes of business travel.
CuSTOMERS
• 90% of uK customers to rate us as an owner as good or excellent.
• 60% of uK customers to rate our managing agents as good or excellent.
• 70% of all customers surveyed to rate our understanding of their needs as good or excellent.
COMMuNITIES
• Make cash contributions of £650,000 to support good community causes.
• all office estates and retail properties with on-site management to engage in at least two community initiatives.
• all properties to support local fundraising, with each shopping centre raising more than £50,000 and all office estates and shopping parks with on-site management raising over £20,000 each.
• evaluate stakeholder and community satisfaction with at least 50% of our significant development activity.
STAFF
• undertake an independent staff survey and publish the results.
• 25% of all Head office staff to participate in community volunteering.
• reduce Head office electricity use by 5% per person (full-time equivalent).
• reduce Head office managed waste by 5% per person (full-time equivalent).
• recycle 75% of Head office managed waste.
SuPPLIERS
• achieve 100% compliance on the service charge code, as defined by the realservice benchmark.
• all property Managers association retail service charge audits to achieve Gold or better, with each managing agent achieving at least one platinum.
• participate in the corporate Health and safety performance Index.
• reportable accident rate on our development sites not to exceed 0.25 per 100,000 hours worked, and lost-day accident rate not to exceed 0.20.
ENERgY uSE
• reduce British land controlled energy intensity per m² by 5% for each property type.
• reduce total building energy intensity per m² by 3% across our office portfolio.
• pilot a system to collect energy data from occupiers where we do not provide the supply.
• provide occupiers with detailed energy statements for their buildings, where data is available.
wASTE MANAgEMENT
• recycle 55% of managed waste.
• divert 90% of managed waste from landfill.
• divert 97% of demolition and strip-out waste from landfill.
• divert 90% of construction and fit-out waste from landfill.
• ask all occupiers to apply our guidelines to their fit-out projects, targeting 50% acceptance.
• 25% of materials by value in new buildings to comprise recycled content.
wATER
• reduce total mains water use by 2% per m².
SuSTAINABLE DEVELOPMENT
• all major office developments and refurbishments to achieve BreeaM excellent ratings.
• all major retail developments to support BreeaM very Good ratings in areas we control.
• all residential developments to achieve code for sustainable Homes level four or ecohomes excellent ratings.
• apply our sustainability Brief, or an equivalent, to developments conducted through joint ventures or partnerships, and all developments with a construction cost over £500,000.
• update the sustainability Brief for developments.
BIODIVERSITY
• Invest £30,000 in initiatives to improve biodiversity.
• all major developments to result in a net improvement in site biodiversity.

lonG-terM tarGets
ENERgY uSE
Reduce energy use at our like-for-like properties by 20% by 2012, compared to 2004/05.
We reduced like-for-like energy use by 17% across our managed portfolio, compared to 2004/05. this comprised 46% of total British land controlled energy use.
wATER uSE
Reduce water use at our like-for-like portfolio by 20% by 2015, compared to 2004/05.
We reduced like-for-like water use by 14% across our managed portfolio, compared to 2004/05. this comprised 35% of our total water use this year.
BIODIVERSITY
Implement biodiversity action plans, where possible, for all current properties by 2012.
31% of our managed assets were covered by Biodiversity action plans this year.
CARBON
Become carbon neutral across landlord controlled areas of our portfolio from 2008/09.
for the second year, our carbon neutral commitment covered energy use across the common parts of our entire multi-let managed portfolio.
britishland.com/crreport2010
IN 2007, we seT A seRIes Of lONG-TeRM TARGeTs ON A NuMBeR Of key Issues. THese HAVe BeeN supeRseded By THe cHAlleNGING MedIuM-TeRM TARGeTs we seT THIs yeAR TO dRIVe peRfORMANce fuRTHeR. HOweVeR, IN THe INTeResTs Of TRANspAReNcy we cONTINue TO RepORT AGAINsT THese ORIGINAl TARGeTs.
tarGets 08

Energy use (kwh)
1 enerGY
fIG. 1.1 totalenergyuseandCosts GRI: eN3, eN4, eN6
2009/10 2008/09 2009/10 2008/09
Electricity gas Other Total Electricity gas Other Total energy energy
British Land controlled energy use across our multi-let managed portfolio
offices 68,775,483 20,895,317 na 89,670,800 53,961,132 22,038,146 na 75,999,278 £6,491,216 £5,876,529
shopping centres 15,149,077 2,086,957 na 17,236,034 16,517,558 2,910,178 na 19,427,736 £1,378,618 £1,687,959
retail parks 5,406,872 26,656 na 5,433,528 8,976,613 151,534 na 9,128,147 £477,429 £876,008
continental europe 15,033,126 7 315,112 15,348,245 5,675,301 1,295,553 339,348 7,310,202 £1,592,777 £832,646
sub-total 104,364,558 23,008,937 315,112 127,688,607 85,130,604 26,395,411 339,348 111,865,363 9,940,040 9,273,142
Additional energy use
occupied controlled energy
use in our offices 97,853,970 na na 97,853,970 76,327,311 na na 76,327,311 £8,630,720 £7,411,382
energy use in areas occupied
by Broadgate estates in buildings
not owned by British land 50,400 4,000 na 54,400 nr nr nr nr £4,527 nr
fuel use in British land
owned vehicles na na 407,914 407,914 na na na nr nr nr
energy use on British land
development sites 801,553 na 175,647 977,200 nr nr nr nr £70,697 nr
sub-total 98,705,923 4,000 583,561 99,293,484 76,327,311 na na 76,327,311 £8,705,944 £7,411,382
Total energy use
TOTAL 203,070,481 23,012,937 898,673 226,982,091 161,457,915 26,395,411 339,348 188,192,674 £18,645,984 £16,684,524
DATA NOTESour portfolio changes significantly over time, with properties bought and sold relatively frequently. our total energy use is affected by these changes, as well as by our energy efficiency initiatives. We also continue to improve the accuracy and comprehensiveness of data gathering, which means that we are often capturing more data.
electricity, gas and other energy use across our multi-let managed portfolio and developments. British land controlled energy use comprises small power and lighting in common parts across our entire portfolio. In our offices, it also comprises central heating and cooling plant (Hvac) and small power and lighting in areas occupied by British land or our wholly-owned subsidiary, Broadgate estates. energy use for 2008/09 was restated, following a thorough review of data for accuracy, as well as the addition of previously unreported historic energy use for British land controlled central plant, and occupier controlled energy use in our offices. fuel use for vehicles was converted from litres to kWh using carbon trust recommended factors of 10.96 for diesel, 6.98 for lpG and 9.61 for petrol. other energy use for British land development sites consists of oil and diesel fuel use in generators. fuel use for generators on development sites was converted to kWh using the carbon trust recommended factor of 10.96 (www.carbontrust.co.uk). occupier controlled energy use is only provided across our offices as we do not currently gather this data across our retail portfolio, although we hope to work with targeted retailers to start recording this going forward.
this year 105 properties with a common parts floor area of 1,935,789m2 were in the managed portfolio: 22 offices, 63 retail parks, 8 shopping centres and 12 continental european properties. each property used different energy sources, with 96 properties reporting electricity data, 29 reporting gas data and 2 reporting other energy use data (geothermal and oil). 91 properties reported energy data in 2008/9 (with a common parts floor area of 2,011,999m2): 21 offices, 56 retail parks, 4 shopping centres and 10 continental european properties. each property reported different energy sources, with 91 properties reporting electricity data, 28 properties reporting gas data and 2 reporting other energy use (geothermal and oil).
collection of development sites energy data requires improvement, although we increased the number of projects reporting data. five development projects reported data in 2009/10 compared to one in 2008/09. one significant project did not report in 2009/10. due to the overall weakness of the data and variation in energy use among different types of construction sites, no calculation of pro-rata has been undertaken to account for this unreported project.
energy costs calculated using ‘decc and national stats publication: Quarterly energy prices March 2010’. electricity: 2009: £0.0882/kWh, 2008: £0.0971/kWh. Gas: 2009: £0.02035/kWh, 2008: £0.0289/kWh. for continental europe – cost information provided by assets. Where no cost information provided, a €/kWh was used based on information provided in the eu europe’s energy portal www.energy.eu/#prices. 2009 prices were applied to both years. electricity price applied to continental europe geothermal energy use as no data available. exchange rate of 0.89 £:€ applied (average rate for 2009).
enerGY 01
britishland.com/crreport2010
Estimated energy costs (£)

1 enerGY
fIG. 1.2 totalbritishlandControlledenergyuse
fIG. 1.4 energyintensityinbritishlandControlledareasGRI: eN26
140,000,00
120,000,00
100,000,00
80,000,00
60,000,00
40,000,00
20,000,00
0
kWh
continental
retail
shopping
office2008/09 2009/10
2008/09
2009/10
fIG. 1.3 energyintensityGRI: eN26
Energy intensity per m² (kwh) 2009/10 2008/09 % change
offices 171.17 200.79 15% reduction
shopping centres 22.07 26.50 17% reduction
retail parks 9.54 10.86 12% reduction
continental europe 54.79 48.75 12% increase
DATA NOTESWe focus on energy intensity because this removes the impact of changes in our portfolio, as we buy and sell properties, and the effect of increases in the number of properties reporting data, as we improve data collection across our portfolio.
properties that were sold or purchased during the year were excluded from the intensity calculations for that year. 83 properties with a combined floor area of 2,029,530m² reported energy use per m² in 2009/10, out of a total of 105 properties with a combined floor area of 2,192,499m². these comprised 19 offices, 48 retail parks, 4 shopping centres and 12 continental european properties. 75 properties reported energy use per m² in 2008/09 out of 91 properties. these comprised 14 offices, 48 retail parks, 3 shopping centres and 10 continental european properties.
floor areas were only included for properties that provided energy use data. floor areas for shopping centres and retail parks were calculated based on the number of car park spaces (this is based on an assumption of an average car park size of 4.60m x 2.45m = 11.27m2) and the addition of 20% to that floor area to account for other areas such as management offices and covered walk way areas, to reflect the amount of common space that British land manages, for example lighting car parks. floor areas for office properties were restated to improve their accuracy based on a review of floor plans, with net lettable areas subtracted from gross internal areas to calculate common parts floor areas.
British land controlled energy use comprises small power and lighting in common parts across our entire portfolio. In our offices, it also comprises controlled energy use for total building central heating and cooling plant (Hvac). offices energy intensity per m² was calculated using offices gross internal areas. common parts energy intensity per m² for the other portfolio types was calculated using the common parts floor area for that portfolio type.
British Land controlled areas
250
200
150
100
50
0Offices Shopping
centresRetail Continental
Europe
DATA NOTESBritish land controlled energy intensity per m² comprises common parts across all property types, as well as central heating and cooling in offices.
kWh per m2
enerGY 02
britishland.com/crreport2010

1 enerGY
fIG. 1.5 annuallike-for-likeenergyuseandsavings GRI: eN26
2009/10 2008/09 2009/10
British Land controlled Electricity gas Other Total % change Electriciy gas Other Total energy energy between energy energy 2008/09 to 2009/10
offices 41,963,123 17,302,251 na 59,265,374 10% reduction 45,456,339 20,055,102 na 65,511,441 £364,122
common parts 14,961,429 na na 14,961,429 3% reduction 15,454,993 na na 15,454,993 £43,532
central heating and cooling 25,637,312 17,302,251 na 42,939,563 11% reduction 28,366,680 20,055,102 na 48,421,782 £296,751
areas occupied by
British land/ Broadgate 1,364,382 na na 1,364,382 17% reduction 1,634,666 na na 1,634,666 £23,839
estates
shopping centres 13,011,859 1,885,357 na 14,897,216 22% reduction 16,110,226 2,906,604 na 19,016,830 £294,058
retail parks 4,562,037 26,656 na 4,588,693 13% reduction 5,238,763 35,986 na 5,274,749 £59,877
continental europe 5,164,231 nr 315,112 5,479,343 2% reduction 5,229,303 nr 338,158 5,567,461 na
Total 64,701,250 19,214,264 315,112 84,230,626 12% reduction 72,034,631 22,997,692 338,158 95,370,481 £718,057
DATA NOTESour annual like-for-like portfolio comprises those properties that were in our portfolio for the whole of last year and this year. 70 like-for-like properties reported energy use data in 2009/10, from 105 total properties: 16 offices, 44 retail parks, 3 shopping centres and 7 continental european properties. these comprised 66% of total British land controlled energy use this year. Gas data for continental europe was excluded due to concerns over the accuracy of the data.
energy cost savings were estimated based on the financial savings of any decrease in kWh between reporting years, using prices stated in ‘Quarterly energy prices March 2010’ by the department of energy and climate change (March 2010). In the uK, these were based on £0.0882 per kWh for electricity and £0.02035 per kWh for gas. In continental europe, these were based on cost information provided by assets where available and otherwise on prices stated in europe’s energy portal www.energy.eu/#prices. continental europe data was not reported in 2008/9 and therefore an energy saving comparison has not been calculated. electricity rates per kWh were applied to geothermal energy (used at one property in continental europe) as cost data was not available. an exchange rate of 0.89 £:€ was applied, based on the average 2009 rate published by www.x-rates.com.
fIG. 1.6 annuallike-for-likeenergyuse GRI: eN26
continental
retail
shopping
office2008/09 2009/10
100,000,000
90,000,000
80,000,000
70,000,000
60,000,000
50,000,000
40,000,000
30,000,000
20,000,000
10,000,000
0
kWh
enerGY 03
britishland.com/crreport2010
Energy use (kWh) Estimated energy savings (£)

fIG. 1.9 long-termenergyusetrends GRI: eN5, eN7
Total energy use (kwh)
British Land controlled common parts 2009/10 2008/09 2007/08 2006/07 2005/06 2004/05
offices 28,505,327 21,813,317 15,630,266 16,918,926 18,353,065 22,098,460
shopping centres 17,236,034 19,427,736 17,504,817 24,472,760 25,943,503 23,492,979
retail parks 5,433,528 9,128,148 8,303,531 3,207,721 2,562,858 1,496,083
continental europe 15,348,245 7,310,202 nr nr nr nr
residential na na na na 123,516 227,326
Total 66,523,134 57,679,403 41,438,615 44,599,407 46,982,942 47,314,848
DATA NOTESour portfolio changes significantly over time, with properties bought and sold relatively frequently. our total energy use is affected by these changes, as well as by our energy efficiency initiatives. We are also capturing more data as we continue to improve the accuracy and comprehensiveness of data gathering.
96 properties reported energy use in 2009/10: 22 offices, 56 retails parks, 6 shopping centres and 12 continental european properties. 91 properties reported energy use in 2008/09; 57 properties reported in 2007/08; 55 properties in 2006/07, 82 properties in 2005/06 and 85 in 2004/05
offices common parts gas data was derived as 10% of total building gas (where common parts gas is appropriate) for consistency with methodology used in previous years, affecting the figures above compared to our total annual performance.
1 enerGY
fIG. 1.7 long-termlike-for-likeenergyuse GRI: eN5, eN7, eN26
British Land controlled Energy use (kwh)common parts
2009/10 2004/05
Electricity gas Total % change Electricity gas Total
offices 11,911,932 1,401,965 13,313,897 11% reduction 13,480,171 1,498,281 14,978,452
shopping centres 12,840,731 1,779,828 14,620,559 24% reduction 16,707,572 2,622,638 19,330,210
retail parks 1,264,444 1,320 1,265,764 29% increase 976,355 4,257 980,612
Total 26,017,107 3,183,113 29,200,220 17% reduction 31,164,098 4,125,176 35,289,274
DATA NOTESour long-term like-for-like portfolio comprises those properties that were in our portfolio for the whole of 2004/05 and 2009/10. 22 like-for-like properties reported energy use data in 2009/10, from 105 total properties: 7 offices, 13 retail parks, 2 shopping centres, and 0 continental european properties. this comprised 46% of total British land controlled energy use. the only energy types that were reported by like-for-like properties in 2004/05 and 2008/09 were electricity and gas. common parts gas data was derived as 10% of total building gas for consistency with methodology used in previous years
fIG. 1.8 long-termlike-for-likeenergyuse GRI: eN5, eN7, eN26
retail
shopping
office2004/05 2009/10
40,000,000
35,000,000
30,000,000
25,000,000
20,000,000
15,000,000
10,000,000
5,000,000
0
kWh
enerGY 04
britishland.com/crreport2010

1 enerGY
fIG. 1.10 long-termtotalenergyusetrendsaCrossbritishlandControlledCommonparts
residential
continental
retail
shopping
office04/05 05/06 06/07 07/08 08/09 09/10
70,000,000
60,000,000
50,000,000
40,000,000
30,000,000
20,000,000
10,000,000
0
fIG. 1.11 totalenergyuseandCostsaCrossouroffiCeportfolio 2009/10 2008/09 2009/10 2008/09
Electricity gas Total Electricity gas Total
British land controlled 26,451,898 na 26,451,898 19,570,974 na 19,570,974 £2,333,057 £1,900,342common parts
British land controlled 40,959,203 20,895,317 61,854,520 32,755,492 22,038,146 54,793,638 £4,037,821 £3,817,461central heating and cooling
British land controlled 1,364,382 na 1,364,382 1,634,666 na 1,634,666 £120,338 £158,726areas occupied by British land/Broadgate estates
occupier controlled 97,853,970 na 97,853,970 76,327,311 na 76,327,311 £8,630,720 £7,411,382occupied demises
Total 166,629,453 20,895,317 187,524,770 130,288,443 22,038,146 152,326,589 £15,121,936 £13,287,910
DATA NOTES22 offices reported energy use data in 2009/10.22 offices reported electricity data in 2009/10.18 offices reported gas data in 2009/10.
In the uK, energy costs were calculated based on energy use using prices stated in ‘Quarterly energy prices March 2010’ by the department of energy and climate change (March 2010). 2009/10 energy costs were based on £0.0882 per kWh for electricity and £0.02035 per kWh for gas. 2008/09 energy costs were based on £0.0971 per kWh for electricity and £0.0289 per kWh for gas.
energy use for 2008/09 was restated, following a thorough review of data for accuracy, as well as the addition of historic energy use for British land controlled central heating and cooling, and for occupier controlled demises.
kWh
enerGY 05
britishland.com/crreport2010
Estimated energy savings (£)Energy use (kwh)

1 enerGY
fIG. 1.12 WhoControlsenergyuseaCrossouroffiCeportfolio
British land: lighting and small power in common parts
British land: central plant heating, ventilation and air-conditioning (electricity and gas)
British land: lighting and small power in areas occupied by British land or Broadgate estates
occupiers: lighting and small power in occupied areas
2009/10 14%
13%
33%
36%
1%
1%
52%
50%2008/09
0 20 40 60 80 100 120 140 160 180 Million kWhs
fIG. 1.13 offiCeenergyintensity GRI: eN26
2009/10 2008/09 % change 2009/10 2008/09 % changeBritish land controlled: common parts 149.30 141.23 6% increase na na naBritish land controlled: central heating and cooling 127.87 155.69 18% reduction na na naBritish land controlled: areas occupied by British land 209.30 231.27 9% reduction 4,233 4,765 11% reductionoccupier controlled: occupied demises 285.34 324.93 12% reduction nr nr nrtotal building intensity 377.20 427.10 12% reduction 12,752 nr n/a
DATA NOTES We focus on energy intensity because this neutralises the impact of changes in our portfolio, as we buy and sell properties, and the effect of increases in the number of properties reporting data, as we improve data comprehensiveness across our portfolio. It also allows us to establish energy benchmarks for offices so that we can compare the performance of individual properties to the relevant benchmarks, identifying opportunities for improvement and learning from examples of good practice.
this energy use data comprises electricity, gas, oil and any other energy use across our multi-let managed asset office portfolio. the floor area data comprises floor areas of properties reporting energy use in our multi-let managed asset office portfolio.
Where a property has not reported a resource use type, the corresponding floor area was removed from the floor area total used to calculate energy intensity per m² for that property type. properties that were sold or purchased within each reporting year were excluded from the intensity calculations for that year. 19 offices reported m2 energy use in 2009/10.
kWh/m2 figures for ‘British land controlled: areas occupied by British land’ covers electricity use for small power and lighting and a proportion of central heating and cooling.
floor areas for offices were reviewed this year, with gross internal areas and net lettable areas derived from building surveys; floor areas for common parts were then calculated by subtracting net lettable areas from gross internal areas. • offices central heating and cooling energy intensity per m² was calculated using offices gross internal areas• common parts energy intensity per m² for was calculated using the common parts floor area • offices occupied areas energy intensity per m² was calculated using net lettable areas.• total office energy intensity per m² was calculated using total building energy use and gross internal areas.
full time equivalents for ‘British land controlled: areas occupied by British land’ are staff and contractors employed at Head office at year end (184). total building intensity is based on the number of occupier full time equivalents at year end.
Energy intensity per full-time equivalent (kwh)Energy intensity per m² (kwh)
enerGY 06
britishland.com/crreport2010

1 enerGY
fIG. 1.14 energyintensityaCrossouroffiCeportfolio
British Land controlled:
common parts
British Land controlled:
central heating and cooling
British Land controlled:
areas occupied by British Land
Occupier controlled:occupied demises
Total building intensity
450
400
350
300
250
200
150
100
50
0
kWh/m2
2009/10
2008/09
fIG. 1.15 developmentsenergyeffiCienCy
Percent better than Part L 2006 Building Regulations 2009/10 2008/09
201 Bishopsgate na 24.34
4 Broadgate refurbishment 36.00 na
6 Broadgate refurbishment 31.00 na
the Broadgate tower na 18.60
10 triton street, regent’s place 32.39 19.53
20 triton street, ’s place 31.32 26.12
north east Quadrant, regent’s place – Main 25.52 25.00
north east Quadrant, regent’s place – Henry street 30.21 30.00
north east Quadrant, regent’s place – residential 21.17 21.00
one osnaburgh street, regent’s place – residential 14.23 14.23
colmore row na nr
Whitely village redevelopment, fareham nr na
21-25 st James street – residential 22.00 na
the leadenhall Building na 37.55
ropemaker place 32.70 32.70
Kingston centre, Milton Keynes – four units 16.20 na
lower don valley nr nr
Average 26.61 24.91
DATA NOTESuK office and retail development projects active this year which require a part l asessment; 2008/09 includes projects inactive during 2009/10. ratings may change as projects progress and more accurate assessments of energy efficiency are made.
enerGY 07
britishland.com/crreport2010

1 enerGY
fIG. 1.16 ENERgY PERFORMANCE CERTIFICATE RATINgS
Energy Performance Certificates (rating)
a B c d e f G
Offices
england – existing buildings 0 0 5 9 5 1 0
england – new buildings 0 3 2 0 0 0 0
scotland – existing buildings 0 0 0 0 0 0 0
scotland – new buildings 0 0 0 0 0 0 0
total 0 3 7 9 5 1 0
(12%) (28%) (36%) (20%) (4%)
Retail
england – existing buildings 0 25 56 27 19 6 6
england – new buildings 0 0 2 0 0 0 0
scotland – existing buildings 0 0 0 1 0 4 5
scotland – new buildings 0 0 0 0 0 0 0
total 0 25 58 28 19 10 11
(17%) (38%) (19%) (13%) (7%) (7%)
DATA NOTESall properties owned or sold within the year holding energy performance certificate ratings. existing buildings are those in British land’s portfolio (including buildings not managed by British land). new buildings are buildings completed within the financial year 2008/09 or 2009/10. retail properties comprise both shopping centres and retail parks. scotland and england are listed separately as each country calculates ratings differently. no certificates held for continental europe properties during the reporting period.
70
60
50
40
30
20
10
0
number of certificates
a B c d e f G
england
scotland
25
61
36
1
24
74 6 5
fIG. 1.17 ENERgY PERFORMANCE CERTIFICATE RATINgS – ExISTINg BuILDINgS
britishland.com/crreport2010
enerGY 08

1 enerGY
70
60
50
40
30
20
10
0
number of certificates
a B c d e f Gengland
3 4
fIG. 1.18 ENERgY PERFORMANCE CERTIFICATE RATINgS – NEw BuILDINgS
britishland.com/crreport2010
enerGY 09

2 Water
fIG. 2.1 totalWateruseandCosts GRI: eN8
2009/10 2008/09 2009/10 2008/09OfficesBritish land and occupier controlled total building 404,914 349,394 £515,456 £444,779Shopping centresBritish land controlled common parts 63,151 43,635 £80,391 £55,548Retail parksBritish land controlled common parts 57,670 72,256 £73,414 £91,982Continental EuropeBritish land controlled common parts 207,659 79,512 £224,112 £101,218
Total 733,394 544,797 £893,372 £693,526
DATA NOTESWater use data comprises mains water used within our multi-let managed asset portfolio. accurate data for non-mains water was not available and so was not reported, although we are working to gather this data for next year.
We have been working hard to report and reduce water use across the common parts of our portfolio. In some instances common parts water use is not separately metered, in these circumstances managing agents estimate common parts usage by calculating tenant use and removing this from total usage. during the course of next year, we will continue to review the accuracy and metering of our common parts water use.
our portfolio changes significantly over time, with properties bought and sold relatively frequently. our total water use is affected by these changes, as well as by our water efficiency initiatives. We also continue to improve the accuracy and comprehensiveness of data gathering, which means that we are often capturing more data.
47 properties reported water use data in 2009/10, out of a total of 105 properties: 22 offices, 12 retail parks, 5 shopping centres and 8 continental european properties. 41 properties reported water use data in 2008/09: 20 offices, 8 retail parks, 3 shopping centres and 10 continental european properties.
water use (cubic metres)
Estimated water costs (£)
fIG. 2.2 totalWateruse GRI: eN8
continental europe - common parts
retail parks - common parts
shopping centres - common parts
offices - total building2008/09 2009/10
800,000
700,000
600,000
500,000
400,000
300,000
200,000
100,000
0
cubic metres
britishland.com/crreport2010
Water 01

2 Water
fIG. 2.3 Waterintensity
2009/10 2008/09 % change 2009/10 2008/09Offices 0.83 0.83 no change 27.54 nr British land and occupier controlled total buildingShopping centres 0.09 0.05 80% increase na naBritish land controlled common partsRetail parks 0.23 0.37 38% reduction na naBritish land controlled common partsContinental Europe 0.88 1.09 19% reduction na naBritish land controlled common parts
DATA NOTES Water use data comprises mains water used within our multi-let managed asset portfolio. accurate data for non-mains water was not available and so was not reported, although we are working to gather this data for next year.
We focus on water intensity because this neutralises the impact of changes in our portfolio, as we buy and sell properties, and the effect of increases in the number of properties reporting data, as we improve data comprehensiveness across our portfolio.
properties that were sold or purchased during the year were excluded from the intensity calculations for that year. 37 properties with a combined floor area of 1,635,980m² reported water intensity in 2009/10 out of a total of 105 properties with a combined floor area of 2,192,499m². these comprised 17 offices, 10 retail parks, 4 shopping centres and 6 continental european properties. 28 properties reported water intensity in 2008/09: 14 offices, 8 retail parks, 2 shopping centres and 4 continental european properties.
floor areas were only included for properties that provided water use data. floor areas for shopping centres and retail parks were based on the number of car park spaces, to reflect the common parts that British land manages, for instance watering landscaping. floor areas for office properties were restated, with net lettable areas subtracted from gross internal areas to calculate common parts floor areas.
Water intensity per m² for offices was calculated using total building water use and gross internal areas. common parts water intensity per m² for each portfolio type was calculated using the common parts floor area for that portfolio type. total water intensity per m² was calculated using total building water use for offices and common parts water use for shopping centres, retail parks and continental european properties, divided by gross internal floor areas for offices and common parts floor areas for shopping centres, retail parks and continental european properties.
Water intensity per full-time equivalent is only applicable to offices, as occupier data is available as well as common parts data, and also because water use in our offices is directly affected by the number of full-time equivalents, whereas it is not in our retail portfolio.
water intensity per full-time equivalent (cubic metres)
water intensity per m² (cubic metres)
fIG. 2.4 Waterintensity
Offices Shopping centres
Retail parks
ContinentalEurope
Average across the portfolio
2008/09
2009/10
1.2
1
0.8
0.6
0.4
0.2
0
cubic metres per m2
britishland.com/crreport2010
Water 02

2 Water
fIG. 2.5 annuallike-for-likeWateruseandsavingsGRI: eN26
2009/10 2008/09 2009/10OfficesBritish land and occupier controlled total building 253,245 265,890 5% reduction £16,097Shopping centresBritish land controlled common parts 30,424 37,119 18% reduction £8,523Retail parksBritish land controlled common parts 56,851 72,256 21% reduction £19,611Continental EuropeBritish land controlled common parts 23,209 43,177 46% reduction £25,419Total 363,729 418,442 13% reduction £69,650
DATA NOTES Water use data comprises mains water used within our multi-let managed asset portfolio. accurate data for non-mains water was not available and so was not reported, although we are working to gather this data for next year.
We have been working hard to report and reduce water use across the common parts of our portfolio. In some instances common parts water use is not separately metered, in these circumstances managing agents estimate common parts usage by calculating tenant use and removing this from total usage. during the course of next year, we will continue to review the accuracy and metering of our common parts water use. our annual like-for-like portfolio comprises those properties that were in our portfolio for the whole of last year and this year. 29 like-for-like properties reported water use in 2009/10, from a total of 105 properties: 15 offices, 8 retail parks, 2 shopping centres and 4 continental european properties. these comprised 50% of our total water use this year.
In the uK, water costs were calculated at £1.273 per cubic metre. this was based on average standard volumetric charges for large and intermediate user tariffs, published by ofwat (www.ofwat.gov.uk). In continental europe, water costs were based on cost information provided by assets where available and otherwise on the uK rate. an exchange rate of 0.89:1 £:€ was applied. Water savings were calculated on the volume of water saved multiplied by the water cost factor for 2009.
the water reduction for continental europe will be reviewed as part of a broader resource use data review during 2010; this follows on from a similar data review for the uK portfolio undertaken during 2009.
Estimated water savings (£)% changewater use (cubic metres)
fIG. 2.6 annuallike-for-likeWateruseGRI: eN26
continental europe
retail parks
shopping centres
offices
cubic metres
450,000
400,000
350,000
300,000
250,000
200,000
150,000
100,000
02008/09 2009/10
britishland.com/crreport2010
Water 03

2 Water
fIG. 2.7 long-termlike-for-likeWateruseGRI: eN26
2009/10 2004/05 2009/10Offices British land and occupier controlled total building 221,010 232,826 5% reduction £15,042Shopping centresBritish land controlled common parts 30,424 60,571 50% reduction £38,377Retail parksBritish land controlled common parts 2,692 3,029 11% reduction £429Total 254,126 296,426 14% reduction £53,848
DATA NOTES Water use data comprises mains water used within our multi-let managed asset portfolio. accurate data for non-mains water was not available and so was not reported, although we are working to gather this data for next year.
We have been working hard to report and reduce water use across the common parts of our portfolio. In some instances common parts water use is not separately metered, in these circumstances managing agents estimate common parts usage by calculating tenant use and removing this from total usage. during the course of next year, we will continue to review the accuracy and metering of our common parts water use.
our long-term like-for-like portfolio comprises those properties that were in our portfolio for the whole of 2004/05 and 2009/10. 10 like-for-like properties reported water use in 2009/10, from a total of 105 properties: 7 offices, 2 shopping centres, 1 retail park and 0 continental european properties. these comprised 35% of our total water use this year. Water costs were calculated at £1.273 per cubic metre for both years.
water savings (£)% changewater use (cubic metres)
fIG. 2.8 long-termlike-for-likeWateruseGRI: eN26
retail parks
shopping centres
offices
cubic metres
2004/05 2009/10
300,000
250,000
200,000
150,000
100,000
50,000
0
britishland.com/crreport2010
Water 04

2 Water
fIG. 2.9 long-termWaterusetrends 2009/10 2008/09 2007/08 2006/07 2005/06 2004/05OfficesBritish land and occupier controlled total building 404,914 349,394 238,475 255,466 259,730 300,296Shopping centresBritish land controlled common parts 63,151 43,635 63,613 73,402 143,594 183,978Retail parksBritish land controlled common parts 57,670 72,256 66,249 20,363 13,629 10,819Continental EuropeBritish land controlled common parts 207,659 79,512 nr nr nr nrResidentialBritish land controlled common parts na na na na 973 950Total 733,394 544,797 368,337 349,231 417,926 496,043
DATA NOTES Water use data comprises mains water used within our multi-let managed asset portfolio. accurate data for non-mains water was not available and so was not reported, although we are working to gather this data for next year.
our portfolio changes significantly over time, with properties bought and sold relatively frequently. our total water use is affected by these changes, as well as by our water efficiency initiatives. We are also capturing more data as we continue to improve the accuracy and comprehensiveness of data gathering.
47 properties reported water use in 2009/10: 22 offices, 12 retail parks, 5 shopping centres and 8 continental european properties. 41 properties reported water use in 2008/09; 21 properties reported in 2007/08; 25 properties in 2006/07, 30 properties in 2005/06 and 30 in 2004/05.
Total water use (cubic metres)
fIG. 2.10 long-termtotalWaterusetrends
residential
continental europe
retail
shopping centres
office
cubic metres
04/05 05/06 06/07 07/08 08/09 09/10
800,000
700,000
600,000
500,000
400,000
300,000
200,000
100,000
0
britishland.com/crreport2010
Water 05

3 Waste
fIG. 3.2 WastemanagementatourpropertiesGRI: eN22, eN26
landfilled
Incinerated
recycled
tonnes
2008/09 2009/10
fIG. 3.1 totalWastemanagement,disposalandCostsGRI: eN22, eN26
2009/10 2008/09 2009/10 2008/09 2009/10 Landfilled Incinerated Recycled Total Landfilled Incinerated Recycled Total or re-used or re-usedAt our properties offices 23 2,218 2,260 4,501 152 1,656 1,363 3,171 £920 £4,864 £90,400shopping centres 508 3,041 2,725 6,274 170 2,436 1,682 4,288 £20,320 £5,440 £109,000retail parks 1,757 60 774 2,591 984 57 570 1,611 £70,280 £31,488 £30,960Sub total 2,288 5,319 5,759 13,366 1,306 4,149 3,615 9,070 £91,520 £41,792 £230,360 (17%) (40%) (43%) (14%) (46%) (40%) On our developmentsdemolition na na na na 1,893 na 35,774 37,667 na £60,576 naconstruction 834 na 5,184 6,018 1,039 na 4,719 5,758 £33,360 £33,248 £207,360fit-outs 6 na 180 186 nr na nr na £240 nr £7,200Sub total 840 NA 5,364 6,204 2,932 NA 40,493 43,425 £33,600 £93,824 £214,560 (14%) (86%) (7%) (93%)Total 3,128 5,319 11,123 19,570 4,238 4,149 44,108 52,495 £125,120 £135,616 £444,920 (16%) (27%) (57%) (8%) (8%) (84%)
DATA NOTES Includes managed waste across our multi-let managed portfolio and developments. composting comprised 2% of recycled or re-used waste managed at our properties this year, and 0% last year. 89% of incineration was with energy recovery this year, and 98% last year
67 properties reported waste data in 2009/10: 20 offices, 41 retail parks, 6 shopping centres and 0 continental european properties. following a thorough review of data, one property that was sold in 2008/09 was removed from 2008/09 results due to low-confidence in data accuracy.
10 development projects and 1 fit-out project reported waste in 2009/10, compared to 4 development projects in 2008/09. 7 small construction projects with a combined value of less than £3.3m did not report this year. demolition waste figures were restated to account for data improvements for one demolition project. there were no demolition projects during 2009/10
landfill tax costs were based on £40 per tonne for 2009/10.
Managed waste (tonnes) Landfill tax costs (£) Landfill tax costs saved
through recycling and
re-use (£)
14,000
12,000
10,000
8,000
6,000
4,000
2,000
0
14%
17%
46%
40%
40%
43%
britishland.com/crreport2010
Waste 01

3 Waste
fIG. 3.3 WastemanagementonourdevelopmentsGRI: eN22, eN26
landfilled
recycled or re-used
tonnes
2008/09 2009/10
45,000
40,000
35,000
30,000
25,000
20,000
15,000
10,000
5,000
0
7%
14%
93%
86%
fIG. 3.5 reCyCledmaterialsindevelopmentsGRI: eN2
2009/10 2008/09 201 Bishopsgate na nrthe Broadgate tower na nr10 triton street, regent’s place 24.6 24.620 triton street, regent’s place 24.6 24.6north east Quadrant, regent’s place – Main 22.0 22.0north east Quadrant, regent’s place – Henry street 22.0 22.0north east Quadrant, regent’s place – residential 22.0 22.0one osnaburgh street, regent’s place – residential 23.1 23.1colmore row nr nr21-25 James street – residential 14.0 nrleadenhall Building na nrropemaker place 24.4 24.4Kingston centre, Milton Keynes – four units 21.0 nrriver don district nr nraverage for all development projects 22 23.5
DATA NOTES as calculated by the Wrap designing out Waste or net Waste toolkits. at a project level, recycled content is calculated as a proportion of the total value of materials used, by summing the total cost of each material multiplied by the proportion of recycled content by mass. 23% recycled content across our major developments in the summary report is based on total value.
Materials with recycled content (%)
fIG. 3.4 headoffiCeWasteintensity 2009/10 2008/09Head Office 145 150
DATA NOTES all waste generated in British land occupied space at our Head office. full-time equivalent refers to British land Head office staff including contractors. for 2008/09, waste data was only available for the whole building (York House) and not per occupier. data is based on the assumption that British land generated the same proportion of all York House waste in 2008/09, as it did in 2009/10.
waste generated per full-time equivalent (kilograms)
britishland.com/crreport2010
Waste 02

4 carBon
fIG. 4.1 CrCenergyeffiCienCysCheme 2010 – 2015excellent performer: net positive undiscounted cash position as of october 2015 £5.5mpoor performer: net negative undiscounted cash position as of october 2015 (£6.2m)undiscounted value at stake over a five year period from 2010 – 2015 £11.7m
DATA NOTES the crc-energy efficiency scheme is a uK-based cap and trade scheme. costs are based on assumed league table positions going forward. the value at stake is the difference between top performance and bottom performance. under this scheme British land is responsible for all supply where we, or one of our subsidiaries, are the counterparty to the energy supply contract.
It is assumed that good performance implies year-on-year emission reductions of 5% and that poor performance implies year-on-year emission growth of 5%. a £30 allowance per tonne has been used for the non-fixed price phase.
Indicative Cost Exposure (£)
britishland.com/crreport2010
carBon 01

fIG. 4.2 greenhousegasemissionsGrI: en16, en17, en19, en29
2009/10 2008/09 Scope 1 Scope 2 Scope 3 Total Scope 1 Scope 2 Scope 3 TotalEnergy use offices – British land controlled areas occupied by British land or Broadgate estates 30 742 na 772 45 890 na 935offices – British land controlled common parts 378 14,395 na 14,773 413 10,650 na 11,063offices – British land controlled central heating and cooling na na 25,725 25,725 na na 21,422 21,422offices – occupier controlled occupied demises na na 53,250 53,250 na na 41,536 41,536offices – non-British land offices areas occupied by Broadgate estates 1 27 na 28 nr nr na 0shopping centres – British land controlled common parts 384 8,244 na 8,628 535 8,989 na 9,524retail parks – British land controlled common parts 5 2,942 na 2,947 28 4,885 na 4,913continental europe – British land controlled common parts na 6,765 na 6,765 259 2,649 na 2,908Refrigerant loss air conditioning in offices, shopping centres and retail parks 2,870 na na 2,870 63 na na 63Travel fuel use in vehicles owned by British land or Broadgate estates 99 na na 99 66 na na 66British land Head office business travel na na 51 51 na na nr nrwater use offices, shopping centres and retail parks na na 202 202 na na 150 150Developments embodied carbon footprint, transport to site na na 4,505 4,505 na na 8,405 8,405embodied carbon footprint, materials na na 38,489 38,489 na na 71,805 71,805carbon footprint site activities, including waste na na 2,257 2,257 na na 4,211 4,211Overview total energy use 798 33,115 78,975 112,888 1,280 28,063 62,958 92,301total refrigerant loss 2,870 na na 2,870 63 na na 63total travel 99 na 51 150 66 na na 66total water use na na 202 202 na na 150 150total developments na na 45,251 45,251 na na 84,421 84,421Total 3,767 33,115 124,479 161,361 1,409 28,063 147,529 177,001
DATA NOTES electricity, gas, oil and other energy used across our multi-let managed portfolio, converted to tonnes of carbon dioxide equivalent (includes GHGs methane (cH4) and nitrous oxide (n20)). energy use for central heating and cooling is categorised as scope 3 emissions; whilst for management purposes we treat this energy as British land controlled we do not have full authority over the energy or associated emissions as demand is controlled by occupiers. 10% of gas use for central heating and cooling is attributed to scope 1 as it is used in controlled common parts where we deem British land has full authority over operations. during 2010/11 we will review our current categorisation of these emissions using our reference, the GHG protocol.
energy used in premises occupied by Broadgate estates but not owned by British land was estimated and included.British land business travel at head office included.emissions associated with managed water use included.energy used during development projects included, including the transport of materials to site, materials and site activities.
emissions from energy use for 2008/09 were restated, following a thorough review of data for accuracy.developments site energy excludes one significant project that was not able to report.
all emissions factors sourced from the defra/decc’s Guidelines GHG conversion factor’s for company reporting september 2009 (unless otherwise stated). all emissions factors expressed in co2e – carbon dioxide equivalents – to account for emissions from non-co2 greenhouse gases, methane and nitrous oxide.
Scope 1– Gas: 0.18396 Gross cv (calorific value) basis used. emission factor for continental europe properties sourced from GHG protocol.– oil: 0.26643. emission factor for continental europe properties sourced from GHG protocol.– refrigerants: data for refrigerants based on volumes of refrigerants required to ‘top up’ air conditioning systems at each asset. GWp applied for refrigerant type from defra/ decc guide. refrigerant information not available for continental europe properties.– fuel consumption information collected for assets with company owned vehicles. vehicle emissions based on defra standard road transport fuel conversion factors.Scope 2– electricity: 0.54418 applied to both reporting years. continental europe properties applied country specific factors supplied in defra/decc Guidelines.– other energy use: use of geothermal energy reported in Italy. Italian electricity emission factor applied and accounted for under scope 2.Scope 3 – Gas, oil, electricity as per scope 1 and 2.– Water: 0.276. applied to uK and continental europe properties.– British land Head office business travel calculated as pro-rata of 2 week business travel diary. – developments embodied and site activities carbon footprint calculated as a pro-rata of a deloitte study of ropemaker as built carbon footprint. – energy use and associated carbon emissions for all resource types for the 2008/09 reporting year was restated. We went through a process of reviewing data for accuracy and to record historic energy use for central plant and occupier controlled demises.– emissions have been reported for 2008/09 reporting year based on historic data that became available during 2009/10.
gross emissions (tonnes of carbon dioxide equivalent)
4 carBon
britishland.com/crreport2010
carBon 02

fIG. 4.3 summaryofreportedgreenhousegasemissionsGrI: en16, en17, en18, en26, en29
Scope 1– energy use – offices – British land controlled areas occupied by British land or Broadgate estates– energy use – offices, shopping centres, retail parks, continental europe – British land controlled common parts 3,767 1,409* 167%*– energy use – offices – non-British land office areas occupied by Broadgate estates– refrigerant loss – air conditioning in offices, shopping centres and retail parks – fuel use in vehicles owned by British land or Broadgate estates Scope 2– energy use – offices – British land controlled areas occupied by British land or Broadgate estates electricity use– energy – offices, shopping centres, retail parks, continental europe – British land controlled common parts electricity use 33,115 28,063* 11%*– energy use – offices – non-British land office areas occupied by Broadgate estates electricity use
portion of the above from a climate change levy exempt source^– British land controlled common parts electricity use (15,470) (17,033) (-9%)– British land controlled areas occupied by British land or Broadgate estates (525) (881) (-40%) Scope 3– energy use – offices – British land controlled central heating and cooling – British land Head office business travel– developments transport to site, materials, site activities including waste 124,479 147,529 -15%ø
– offices, shopping centres, retail parks, continental europe – water use– offices – occupier controlled occupied demises – electricity use Total gross emissions (tCO2e/year) 161,361 177,001 -9%Purchased Carbon Offsetsscope 1– energy use – offices – British land controlled areas occupied by British land or Broadgate estates– energy use – offices, shopping centres, retail parks, continental europe – British land controlled common parts – refrigerant loss – air conditioning in offices, shopping centres and retail parks – fuel use in vehicles owned by British land or Broadgate estates (20,769) (11,557*) (80%*)scope 2– energy use – offices – British land controlled areas occupied by British land or Broadgate estates electricity use– energy – offices, shopping centres, retail parks, continental europe – British land controlled common parts electricity usescope 3British land Head office business travel Total net emissions (tCO2e/year) 147,749 173,494 -15%
DATA NOTES as per figure 4.2.*2008/09 scope 1 and 2 footprint does not include emissions related to energy from ‘offices – non-British land office areas occupied by Broadgate estates’; these were not reported in that year.ø2008/09 scope 3 footprint does not include British land Head office business travel emissions; these were not reported in that year.^British land reports emissions from climate change levy exempt electricity tariffs using the same factor as national Grid electricity. We do not offset these emissions.
2009/10(tonnes of
carbon dioxide equivalent)
2008/09(tonnes of
carbon dioxide equivalent)
Change between
2009/10 and 2008/9 (%)
4 carBon
britishland.com/crreport2010
carBon 03

fIG. 4.4 sCope1and2greenhousegasemissionsintensityGrI: en16, en17, en26
financial: tonnes of carbon dioxide equivalent per £m of gross rental and related income 89 53activity related: tonnes of carbon dioxide equivalent per m2 common parts floor area 0.018 0.015
DATA NOTES as per figure 4.2 and 4.3.reported as requested by the carbon disclosure project.turnover reported in annual report & accounts 2010: £394m for 2009/10, and £554m for 2008/09.common parts floor area from the managed portfolio; was 1,935,789m2 in 2009/10 and 2,011,999m2 in 2008/09.during 2010/11 we will review our intensity metrics in terms of their appropriateness and effectiveness in managing performance.
4 carBon
2009/10(tonnes of
carbon dioxide equivalent)
2008/09(tonnes of
carbon dioxide equivalent)
fIG. 4.5 greenhousegasemissionsbysCopeGRI: eN16, eN17, eN26
fIG. 4.6 greenhousegasemissionsbysourCeGRI: eN16, eN17, eN26
scope 3
scope 2
scope 1
travel
Water use
refrigerant loss
developments
energy use
tonnes of carbon dioxide equivalent
tonnes of carbon dioxide equivalent
2009/10
2009/10
2008/09
2008/09
180,000
160,000
140,000
120,000
100,000
80,000
60,000
40,000
20,000
0
180,000
160,000
140,000
120,000
100,000
80,000
60,000
40,000
20,000
0
77%
28%
2%
21%
70%
2%
16%
52%
83%
48%
1%
britishland.com/crreport2010
carBon 04

fIG. 4.7 greenhousegasemissionsoffset(restatementof2008/09offset)
2009/10 2008/09 2009/10 2008/09 Scope 1 2 3 Total 1 2 3 Total 1 2 3 Total 1 2 3 Totalenergy use in offices – British land controlled areas occupied by British 30 217 na 247 45 9 na 54 £147 £1,062 na £1,209 £220 £44 na £264land or Broadgate estates
energy use in offices – British land controlled 378 4,918 na 5,296 413 226 na 639 £1,850 £24,074 na £25,924 £2,022 £1,106 na £3,128common parts
energy use in shopping centres – British land 384 2,251 na 2,635 535 2,379 na 2,914 £1,880 £11,019 na £12,899 £2,619 £11,645 na £14,264controlled common parts
energy use in retail parks – British land controlled 5 2,942 na 2,947 28 4,885 na 4,913 £24 £14,401 na £14,425 £137 £23,912 na £24,049common parts
energy use in continental europe – British land na 6,765 na 6,765 259 2,649 na 2,908 £0 £33,115 na £33,115 £1,268 £12,967 na £14,235controlled common parts
energy use in non-British land offices areas 1 27 na 28 nr nr na na £5 £132 na £137 na na na £0occupied by Broadgate estates
fuel use in vehicles owned by British land or Broadgate 99 na na 99 66 na na 66 £480 na na £480 £323 na na £323estates
refrigerant loss from air conditioning in offices, 2,870 na na 2,870 63 na na 63 £14,049 na na £14,049 £308 na na £308shopping centres and retail parks
British land Head office na na 51 51 na na nr 0 na na £249 £249 na na nr £0business travel
Total 3,767 17,120 51 20,938 1,409 10,148 NR 11,557 £18,435 £83,803 £249 £102,487 £6,897 £49,674 NR £56,571
DATA NOTES as per figure 4.2. above except as follows:
scope 1 emissions from gas use for British land controlled common parts calculated based on 10% of total building gas use.scope 2 emissions from electricity use exclude climate change levy exempt electricity. for 2009/10 this was 29,391,561 kWh (15,994 tonnes of carbon). for 2008/09 this was 32,921,052 kWh (17,915 tonnes of carbon).the following emission sources are not offset: scopes 3 emissions from energy use in British land controlled central plant (heating and cooling), energy use in occupiers’ controlled own demises, managed water use and developments.
offsets were procured for 20,769 tonnes c02e: 20,938 tonnes from this year minus 169 tonnes over-purchased last year. the actual offset cost was therefore £101,664.offset calculations: €5.50 per tonne of c02e. an exchange rate of 0.89:1 £:€ was applied. therefore 1 tonne c02e = £4.895. final invoice cost may vary due to fluctuations in euro exchange rate.
4 carBon
gross emissions offset(tonnes of carbon dioxide equivalent)
Carbon offset costs (£)
britishland.com/crreport2010
carBon 05

fIG. 4.8 greenhousegasemissionsoffsetbysCope
Scope 1energy use – offices – British land controlled areas occupied by British land or Broadgate estates 30 45energy use – offices – non-British land offices areas occupied by Broadgate estates 1 nrenergy use – offices, shopping centres, retail parks, continental europe – British land controlled common parts 767 1,235refrigerant loss – air conditioning in offices, shopping centres and retail parks 2,870 63fuel use in vehicles owned by British land or Broadgate estates 99 66 Scope 2energy use – offices – British land controlled areas occupied by British land or Broadgate estates electricity use 217 9energy use – offices – non-British land offices areas occupied by Broadgate estates electricity use 27 nrenergy – offices, shopping centres, retail parks, continental europe – British land controlled common parts electricity use 16,876 10,139Scope 3British land Head office business travel 51 nr Total emissions to be offset 20,938 11,557Excessive offsets purchased 2008/09 (following restatement of 2008/09 emissions, an excess of 169tco2e were purchased in 2008/09 and have been subtracted from this year’s offset purchase.) (169) naTotal purchased offsets (tCO2e/year) 20,769 11,557Balance of offset carbon footprint (tCO2e/year) 0 0
4 carBon
2009/10 (tonnes of carbon
dioxide equivalent)
2008/09 (tonnes of carbon
dioxide equivalent)
fIG. 4.9 CarbonoffsetCostsbysourCe
Business travel
fuel use in company owned vehicles
refrigerant loss
energy use2009/10 2008/09
£100,000
£80,000
£60,000
£40,000
£20,000
£0
13.7%
0.2%
0.6%
0.5%
0.5%
85.6%
98.9%
48%
DATA NOTES as per figure 4.4.
britishland.com/crreport2010
carBon 06

fIG. 4.10 CarbonoffsetCostsbysCope
scope 3
scope 2
scope 12009/10 2008/09
£100,000
£80,000
£60,000
£40,000
£20,000
£0
81.8%
0.2%
18%
98.9%
48%
4 carBon
88%
12%
britishland.com/crreport2010
carBon 07

5 otHer envIronMental Measures
fIG. 5.1 environmentalexpenditureGRI: eN28, eN30
2009/10 2008/09Insurance costs for environmental liability £81,150 nr landfill disposal costs £125,120 £168,608 carbon emission offset certificates £101,664 £56,571environmental non-compliance costs £0 £0external consultant fees £583,475 £238,400 external certification of Iso:14001 £6,931 £6,709 Total £898,340 £470,288
DATA NOTES Insurance costs for environmental liability cover premium costs related to an environmental Impairment liability policy. costs are inclusive of premium tax and consultant fees. external consultant fees relate to environmental and energy management consultancy in 2009/10. figures exclude vat. restated carbon emissions for 2008/09 mean that 197 additional tonnes were offset last year. these were subtracted from this year’s offset certificate purchase of €114,229.50. an exchange rate of 0.89:1 £:€ was applied.
fIG. 5.2 environmentalComplianCeGRI: eN28
2009/10 2008/09 2009/10 2008/09Managed portfolio 0 0 £0 £0development projects 0 0 £0 £0
DATA NOTES uK managed portfolio tracked by insurers.uK development projects tracked through Iso:14001 system, with two live projects during 2009/10 and eight during 2008/09.
fIG. 5.3 biodiversityonourdevelopments 2009/10 (number or %) 2008/09 (number or %)new Biodiversity action plan habitats created (number) 4 2Biodiversity action plan habitats lost (number) 0 0species trans-located (number) 0 0percentage of potential BreeaM ecology credits achieved 53% 67%
DATA NOTES *uK only, development projects with a construction cost over £5 million which completed in that financial year. 1 project included in 2008/09 and 2 in 2009/10. BreeaM based on awarded certificate reports.
fIG. 5.4 biodiversityatourproperties 2009/10 2008/09Biodiversity Management plan specific to property 30% 34%Generic Biodiversity Management plan 1% 0%
DATA NOTES uK properties only. 57 properties out of 86 were covered by property-specific plans: 14 out of 20 offices, 8 out of 58 retail parks and 5 out of 8 shopping centres. 1 shopping centre was covered by a generic plan. sold properties were not included in calculation of percentages.
Environmental protection expenditures (£)
Environmental non-compliance events
(number)
Environmental non-compliance costs
(£)
Proportion of properties covered (%)
britishland.com/crreport2010
otHer envIronMental Measures 01

6 custoMers
fIG. 6.1 CustomersatisfaCtionGRI: pR5
2009/10 2008/09 2006/07 2005/06 2009/10 2008/09 2006/07 2005/06uK offices 91% 85% 75% 40% no survey 53% 62% 35%uK retail no survey 80% 71% no survey 37% 16% uk average NA 82% 73% 40% NA 43% 40% 35%
DATA NOTES 2009/10 uK results were based on 12 respondents to post-occupancy surveys at 201 Bishopsgate and the Broadgate tower. the Broadgate tower survey is not yet complete. findings to date are only interim whilst new occupiers take occupation and will be completed before the end of this next financial year. 2008/09 results were based on 50 independent telephone interviews with occupiers in early 2009. 2006/07 results based on 54 independent telephone interviews in early 2007. 2005/06 results based on 41 independent telephone interviews in late 2005. In 2010, we carried out our first independent customer survey in continental europe and are reviewing results. our next independent customer survey in the uK will be in 2010/11.
In 2005, the survey results were reported at a total portfolio level, rather than office and retail portfolios. prior to 2009 excellent and good were reported as very satisfied and satisfied respectively. retail comprises shopping centres and retail parks.
Rating British Land as an owner as excellent or good (%)
Rating our managing agents as excellent or good (%)
fIG. 6.2 CustomersratingusasexCellentorgoodGRI: pR5
fIG. 6.3 CustomersratingouragentsasexCellentorgoodGRI: pR5
2008/09
2006/07
2005/06uk retail uk offices
90%
80%
70%
60%
50%
40%
30%
20%
10%
0%
48%
40% 40%
71%75%
80%85%
2008/09
2006/07
2005/06uk retail uk offices
90%
80%
70%
60%
50%
40%
30%
20%
10%
0%
48%
35% 35%
16%
62%
37%
53%
customers rating us as excellent or good
customers rating our agents as excellent or good
britishland.com/crreport2010
custoMers 01
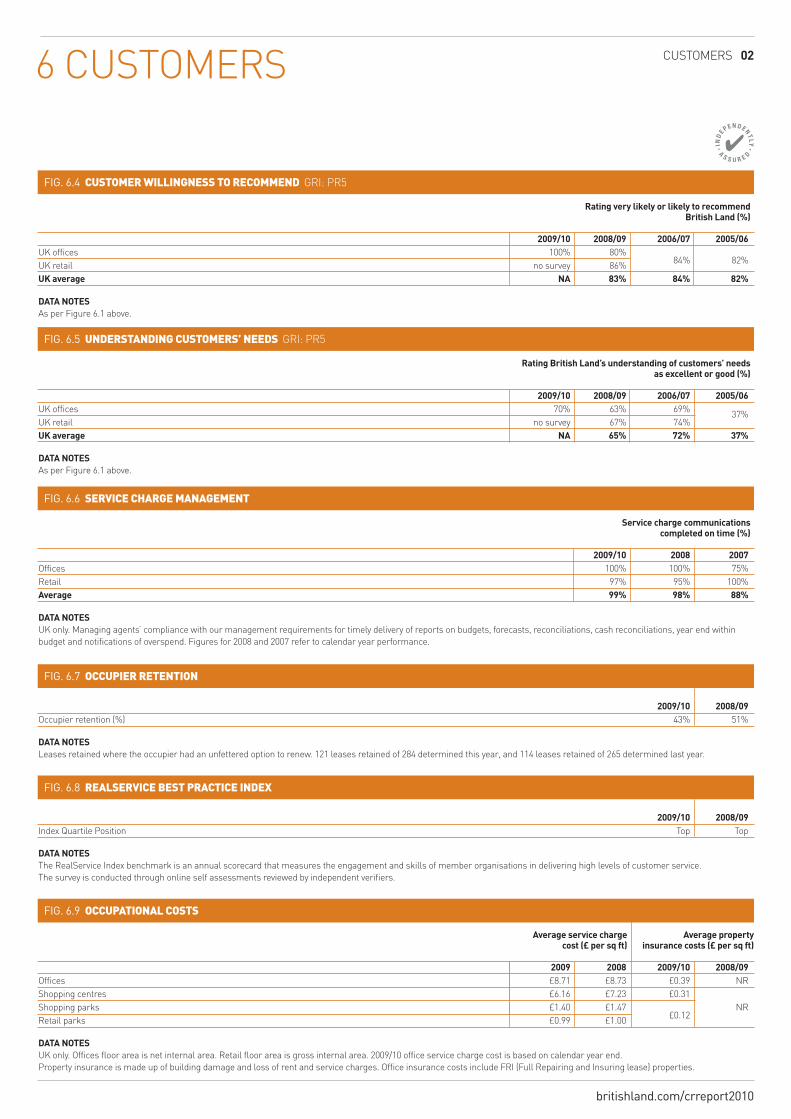
6 custoMers
fIG. 6.4 CustomerWillingnesstoreCommendGrI: pr5
2009/10 2008/09 2006/07 2005/06uK offices 100% 80%
84% 82%uK retail no survey 86% uk average NA 83% 84% 82%
DATA NOTES as per figure 6.1 above.
Rating very likely or likely to recommend British Land (%)
fIG. 6.5 understandingCustomers’needsGrI: pr5
2009/10 2008/09 2006/07 2005/06uK offices 70% 63% 69% 37%uK retail no survey 67% 74% uk average NA 65% 72% 37%
DATA NOTES as per figure 6.1 above.
Rating British Land’s understanding of customers’ needs as excellent or good (%)
fIG. 6.6 serviCeChargemanagement
2009/10 2008 2007offices 100% 100% 75%retail 97% 95% 100%Average 99% 98% 88%
DATA NOTES uK only. Managing agents’ compliance with our management requirements for timely delivery of reports on budgets, forecasts, reconciliations, cash reconciliations, year end within budget and notifications of overspend. figures for 2008 and 2007 refer to calendar year performance.
Service charge communications completed on time (%)
fIG. 6.7 oCCupierretention 2009/10 2008/09occupier retention (%) 43% 51%
DATA NOTES leases retained where the occupier had an unfettered option to renew. 121 leases retained of 284 determined this year, and 114 leases retained of 265 determined last year.
fIG. 6.8 realserviCebestpraCtiCeindex
2009/10 2008/09Index Quartile position top top
DATA NOTES the realservice Index benchmark is an annual scorecard that measures the engagement and skills of member organisations in delivering high levels of customer service. the survey is conducted through online self assessments reviewed by independent verifiers.
fIG. 6.9 oCCupationalCosts
2009 2008 2009/10 2008/09offices £8.71 £8.73 £0.39 nrshopping centres £6.16 £7.23 £0.31
nrshopping parks £1.40 £1.47 £0.12
retail parks £0.99 £1.00
DATA NOTES uK only. offices floor area is net internal area. retail floor area is gross internal area. 2009/10 office service charge cost is based on calendar year end. property insurance is made up of building damage and loss of rent and service charges. office insurance costs include frI (full repairing and Insuring lease) properties.
Average service charge cost (£ per sq ft)
Average property insurance costs (£ per sq ft)
britishland.com/crreport2010
custoMers 02

6 custoMers
fIG. 6.10 averageserviCeChargeCosts
fIG. 6.11 serviCeChargereduCtionperformanCe2009/10
Office portfolioBroadgate offices 1,600,473 £15,175,857 £14,638,982 4% £536,875other london offices 595,113 £5,245,419 £5,143,429 2% £101,990Sub total offices 2,195,586 £20,421,276 £19,782,411 3% £638,865Retail portfolioBulky goods retail parks 490,732 £336,861 £325,245 3% £11,616retail parks 4,179,447 £4,194,710 £4,137,126 1% £57,584shopping parks 4,344,107 £6,403,793 £6,079,253 5% £324,540shopping centres 2,334,120 £16,879,999 £14,369,093 15% £2,510,906Sub total retail 11,348,406 £27,815,363 £24,910,171 10% £2,904,646Total 13,543,992 £48,236,639 £44,693,128 7% £3,543,511
DATA NOTES 2009/10 actual figures are subject to final financial audit. these figures have been updated since publication of our corporate responsibility summary report, which was based on forecast figures for 2009/10 (as final data was not available at time of publication).
Floor area (square feet)
2008/09 actual 2009/10 actual % decrease between 2008/09 and 2009/10
Savings between2008/09 and 2009/10
Sector
britishland.com/crreport2010
custoMers 03
DATA NOTES 2009/10 actual figures are subject to final financial audit.
Sector 2008/09 (£ per sq ft) 2009/10 (£ per sq ft) Saving between 2008/09 and 2009/10
Office portfolioBroadgate offices £9.48 £9.15 £0.34other london offices £8.81 £8.64 £0.17Sub-total offices £9.30 £9.01 £0.29Retail portfolioBulky goods retail parks £0.69 £0.66 £0.02retail parks £1.00 £0.99 £0.01shopping parks £1.47 £1.40 £0.07shopping centres £7.23 £6.16 £1.08Sub-total retail £2.45 £2.20 £0.26Total £3.56 £3.30 £0.26

6 custoMers custoMers 04
britishland.com/crreport2010
fIG. 6.12 leasemanagement
2009/10 2008/09 2009/10 2008/09 2009/10 2008/09offices no survey 100% 75% 50% 57% 71%retail no survey 96% no survey 28% no survey 50%Average No survey 98% (OSI 40%) NA 39% (OSI 38%) NA 61%
DATA NOTES as per figure 6.1 above.osI is the uK occupier satisfaction rating Index, an annual index and opinion survey to measure satisfaction amongst customers of the uK commercial property industry. osI does not distinguish between property types. osI lease code compliance for 2009 is the 2009 Index reported ‘% satisfied’ results. osI lease flexibility for 2009 is the 2009 Index reported ‘flexibility of leases (length and break options) results.
Customers rating British Land as Lease Code compliant (% of ‘yes’ responses,
osI equivalent rating)
Customers rating lease flexibility as excellent or good (% total responses,
osI equivalent rating)
Customers rating lease flexibility as excellent or good (% total responses,
osI equivalent rating)
fIG. 6.13 serviCeChargeaudits
2009/10 2008/09platinum audits 1 naGold audits 6 6silver audits 0 2Bronze audits or below 0 0total Gold and platinum audits 7 6 (100%) (75%)
DATA NOTES Independent service charge code audits carried out by the property Managers association. the platinum rating was introduced in 2009/10.
Properties audited (number)

£800,000
£700,000
£600,000
£500,000
£400,000
£300,000
£200,000
£100,000
£0
7 coMMunItIes
fIG. 7.1 CommunityinvestmentGRI: ec1
2009/10 2008/09Community investment cash donations £ 505,975 £ 548,785 staff time £ 40,941 £ 37,136 supplier time £ 87,975 £ 134,281 In-kind e.g. use of space £ 81,983 £ 72,295 Total investment £ 716,874 £ 792,497 Additional community support fundraising across our portfolio £ 491,522 £ 208,474 occupier funding £ 37,288 £ 194,431 external funding for local training £ 617,003 £ 281,292 other external funding £ 13,930 £ 29,503 Total community support £ 1,159,743 £ 713,700
DATA NOTES uK only. this data excludes mandatory contributions relating to planning. staff time relates to staff employed directly or contractually at British land’s Head office. staff and supplier time covers time spent on voluntary activities during paid working hours only. In-kind contributions are based on cost rather than commercial value, calculated according to london Benchmarking Group guidelines. fundraising includes Head office staff payroll giving of £10,164 but excludes British land match giving. external funding for local training excludes community training for those already in employment. the reduction in cash donations is largely due to our sustainability exhibition not running this year, following an investment of £58,562 last year. community investment 2008/09 figures were restated to reflect improvements in data comprehensiveness.
fIG. 7.2 CommunityinvestmentGRI: ec1
In-kind
supplier time
staff time
cash donations2008/09
9%
17%
5%
69%
2009/10
11%
12%
6%
71%
britishland.com/crreport2010
coMMunItIes 01

7 coMMunItIes
fIG. 7.3 londonbenChmarkinggroupdata*GRI: ec1
2009/10 2008/09 2009/10 2008/09cash investment £505,975 £548,785 £1,159,743 £713,700staff time investment £40,941 £37,136 £87,975 £134,281In-kind investment £81,983 £72,295 na naTotal investment £628,900 £658,215 £1,247,718 £847,980 DATA NOTES uK only. this data excludes mandatory contributions relating to planning. staff time (direct and leveraged) covers time spent on voluntary activities during paid working hours only. direct staff time relates to staff employed directly or contractually at British land’s Head office. In-kind contributions are based on cost rather than commercial value, calculated according to london Benchmarking Group guidelines. Management costs excluded. community investment 2008/09 figures were restated to reflect improvements in data comprehensiveness. *the london Benchmarking Group is a membership organisation which provides a comprehensive and consistent set of measures to calculate community investment www.lbg-online.net.
fIG. 7.4 londonbenChmarkinggroupsummarydataGRI: ec1
2009/10 2008/09total investment (direct and leveraged) 1,876,618 1,506,195
DATA NOTES sum of figures provided in fig. 7.4. above.
fIG. 7.5 staffvolunteeringGRI: ec1
2009/10 2008/09Head office 27% 24%
DATA NOTES covers time spent on voluntary activities during working hours only. full-time equivalents in 2009/10 comprise staff employed directly or contractually by British land at our Head office: 50 out of 184 full-time equivalents. full-time equivalents in 2008/09 comprise staff employed directly by British land at our Head office, (excluding contractors): 37 out of 153 full-time equivalents.
fIG. 7.6 CommunityContributionsthroughplanning
2009/10 2008/09 affordable housing £6,250,533 £9,940,439public space and environment £1,838,446 £8,102,669accessibility and transport £341,625 £3,847,087social welfare and community facilities £2,710,546 £793,191community consultation £33,894 £350,000expenses £48,239 £29,000Total contributions £11,223,283 £23,062,386
DATA NOTES uK only. expenditure on community activity or improvements agreed through the planning process. this excludes ‘voluntary’ community investment as reported in figure 7.1. contributions decreased in 2009/10 due to a reduction in development activity, with much associated investment for active projects taking place in previous years. data covers approximately 90% of uK.
Direct community investment(£)
Leveraged community investment(£)
Total investment (£)
Proportion of staff who volunteered (%)
Contributions through planning (£)
britishland.com/crreport2010
coMMunItIes 02

7 coMMunItIes
£25,000,00
£20,000,00
£15,000,00
£10,000,00
£5,000,00
£0
fIG. 7.7 CommunityContributionsthroughplanning
expenses
community consultation
social welfare and community facilities
accessibility and transport
public space and environment
affordable housing2008/09 2009/10
11%
48%
britishland.com/crreport2010
coMMunItIes 03

8 staff
fIG. 8.1 staffemployment GRI: lA1, lA12
2009/10 2008/09 2009/10 2008/09 2009/10 2008/09British land 158 152 100% nr 15% 9%Broadgate estates 160 130 94% nr 10% 3%Total or Average 318 283 97% NR 12.5% 6%
DATA NOTES employees are full-time equivalents. British land employees are uK Head office staff only (excluding contractors); our team of 15 people in continental europe is not directly employed and most British land properties are managed by third party agents rather than by direct employees. all British land Head office employees, excluding those on probation, have participated in 360 degree feedback, with most having completed formal appraisals with their line managers during the year. Broadgate estates reported performance and career development review figure excludes directors and staff who have been employed for less than a year. these employees have had set performance objectives.
fIG. 8.2 staffdiversityGRI: lA13
2009/10 2008/09 2009/10 2008/09 2009/10 2008/09 Male Female Male Female Male Female Male Female 19-25 26-46 47-60 61+ 19-25 26-46 47-60 61+British land 54% 46% 52% 48% 75% 25% 76% 24% 4% 77% 19% 1% nr nr nr nrBroadgate estates 51% 49% 58% 42% 51% 49% 60% 40% 6% 73% 16% 4% 8% 76% 15% 1%Average 53% 48% 55% 45% 63% 37% 68% 32% 5% 75% 18% 3% 8% 76% 15% 1%
DATA NOTES employees are full-time equivalents as at 31 March 2010 (British land 166, Broadgate estates 173). numbers may not sum to 100% due to consistent rounding. employees by age figures include employees and management.
Employees receiving regular performance and career development reviews (%)
Management by gender(%)
Average number of employees (number)
Employees by gender(%)
Employees employed under flexible working arrangements (%)
Employees by age(%)
fIG. 8.3 staffturnoverGRI: lA2
2009/10 2008/09 2009/10 2008/09 2009/10 2008/09 Male Female Male Female 19-25 26-46 47-60 61+ 19-25 26-46 47-60 61+British land 15 28 9 6 14 14 2 11 2 0 2 19 3 4 (9%) (18%) (10%) (8%) (18%) (19%) (33%) (9%) (6%) (29%) (17%) (10%) (400%)Broadgate estates 21 46 10 11 18 28 3 14 3 1 2 40 4 0 (12%) (27%) (10%) (15%) (38%) (62%) (27%) (11%) (11%) (14%) (8.5%) (83%) (8.5%) Average 18 37 9.5 9.5 16 21 2.5 12.5 4.5 0.5 2 29.5 3.5 2 (11%) (22.5%) (11%) (9%) (28%) (40%) (30%) (10%) (8.5%) (7%) (19%) (50%) (9%) (201%)
DATA NOTES employees are full-time equivalents as at 31 March 2010 (British land 166, Broadgate estates 173). staff turnover includes redundancies and retirement. turnover rate is calculated as the number of leavers divided by the number of full-time equivalents as at 31 March 2010 for 2009/10 or as at 31 March 2009 for 2008/09.
Employees leaving by gender (number and %)
Employees leaving(number and % of total staff)
Employees leaving by age (number and %)
fIG. 8.4 lostWorkingdaysGRI: lA7
2009/10 2008/09 2009/10 2008/09British land 587 nr 1.4% 1.5%Broadgate estates 780 767 1.8% 1.7%Total or average % 1,342 767 1.6% 1.6%
DATA NOTES
employees are full-time equivalents as stated in ‘staff employment’. number of working days calculated as 260. British land reports prior to this year only show lost day rates not numbers.
working days lost through sickness (number)
Proportion of all working days lost through sickness (%)
britishland.com/crreport2010
staff 01
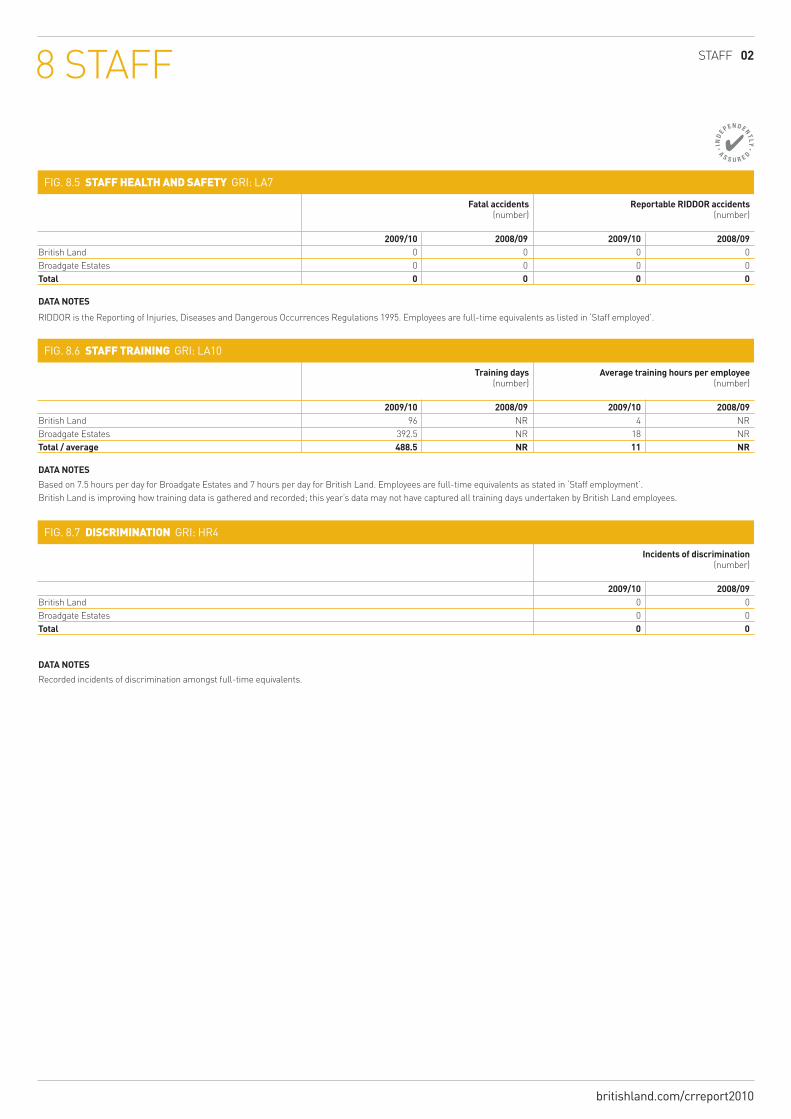
8 staff
fIG. 8.5 staffhealthandsafetyGRI: lA7
2009/10 2008/09 2009/10 2008/09British land 0 0 0 0Broadgate estates 0 0 0 0Total 0 0 0 0
DATA NOTES
rIddor is the reporting of Injuries, diseases and dangerous occurrences regulations 1995. employees are full-time equivalents as listed in ‘staff employed’.
fIG. 8.6 stafftrainingGRI: lA10
2009/10 2008/09 2009/10 2008/09British land 96 nr 4 nrBroadgate estates 392.5 nr 18 nrTotal / average 488.5 NR 11 NR
DATA NOTES
Based on 7.5 hours per day for Broadgate estates and 7 hours per day for British land. employees are full-time equivalents as stated in ‘staff employment’. British land is improving how training data is gathered and recorded; this year’s data may not have captured all training days undertaken by British land employees.
fIG. 8.7 disCriminationGRI: HR4
2009/10 2008/09British land 0 0Broadgate estates 0 0Total 0 0
DATA NOTES
recorded incidents of discrimination amongst full-time equivalents.
Fatal accidents(number)
Training days(number)
Reportable RIDDOR accidents(number)
Average training hours per employee(number)
Incidents of discrimination(number)
britishland.com/crreport2010
staff 02

9 supplIers
ManaGInG aGents
developMent proJect teaMs
fIG. 9.1 healthandsafetyatourproperties
2009/10 2008/09 2009/10 2008/09 2009/10 2008/09offices 98% 96% 0 0 12 12retail 98% 96% 0 0 40 25Total/Average 98% 96% 0 0 52 37
DATA NOTES uK properties only. our health and safety standards require the completion of actions arising from independent annual risk assessments and ongoing responsibilities on a timely basis. rIddor is the reporting of Injuries, diseases and dangerous occurrences regulations 1995. during the financial year we have transferred from connaught to ark Workplace risk. the transition was completed on 1st april 2010 and will result in improvements in the metrics we use to monitor our management effectiveness in relation to health and safety.
fIG. 9.2 managingliCensesforalteration
2009/10 2008 2009/10 2008 2009/10 2008offices 92% 94% 93% 97% 0% nr (1.0) (2.0) (2.5) (1.7) (76.6) retail 100% 99% 100% 99% 50% nr (1.7) (1.6) (2.4) (3.3) (42.4)Average 96% 96.5% 96.5% 98% 25% NR (1.4) (1.8) (2.5) (2.5) (59.5) DATA NOTES uK managing agents only. figures for 2008 refer to calendar year performance. reporting changed from calendar year to financial year from 2008/9 to 2009/10 in response to management alignment of reporting to report financial year wherever possible.
fIG. 9.3 ConstruCtionspend
2009/10 2008/09 construction spend (£) £169,130,000 £310,380,000
DATA NOTES uK projects with a construction cost over £300,000. construction spend comprises fees paid to on-site contractors and trades for site activities, labour and materials. It excludes design fees, financing costs and other holding costs. estimated figures with 80% accuracy. projects across more than one year were evenly divided between years. allowance was made for retail development spend in 2008/09, based on 2009/10 spend.
fIG. 9.4 healthandsafetyonourdevelopments 2009/10 (number) 2008/09 (number)
Lost-day accident rate (number of incidents per 100,000 hours worked) 0.47 0.16Reportable accident rate (number of incidents per 100,000 hours worked) 0.26 0.30Total job-related fatal accidents (number) 0 0Total job-related lost-day or reportable non-fatal accidents (number) 14 14Total health and safety incidents of non-compliance (number) 0 0
DATA NOTES uK only. covers all projects reporting health and safety statistics, approximately 95% of construction spend in both years. 2008/09 data excludes retail projects, which were not reported. reportable accident frequency rates calculated as total reportable accidents multiplied by 100,000 and then divided by total hours worked. lost day accident rate calculated as total lost-day accidents multiplied by 100,000 and then divided by total hours worked. Incidents of non-compliance refer to Health and safety executive Improvement or prohibition notices served.
construction health and safety performance is susceptible to the type of construction work undertaken. this year, our projects were primarily smaller sites, ‘ends’ of projects which are less structured and more prone to accidents. the decrease in the number of man hours worked also affected the ratios.
Properties achieving our health and safety management standards (%)
Agents requesting full information from occupiers within five working days
(% and average number of days)
Fatal accidents at our managed properties (number)
Agents issuing letter licences or instructing solicitors within five working days
(% and average number of days)
Reportable non-fatal lost day or RIDDOR accidents at our managed properties (number)
Solicitors engrossing deed for licence for alteration within 20 working days
(% and average number of days)
britishland.com/crreport2010
supplIers 01

9 supplIers
fIG. 9.5 developmentsemploymentandtraining 2009/10 (number) 2008/09 (number)
Average personnel on site during the year (estimated number) 750 1,200Total person hours worked on site (number) 1,933,162 3,646,026Training scheme workers (number) 4 nrApprenticeship workers (number) 2 nr
DATA NOTES uK only. 2008/09 data excludes retail projects, which were not reported. average personnel on site based on monthly reports of average personnel on site.the number fluctuates significantly throughout the year. data for training scheme and apprenticeship workers relates to one project where British land sponsored the apprenticeship and training scheme; it excludes other initiatives undertaken by our contractors.
fIG. 9.6 ConsiderateConstruCtorssCheme 2009/10 2008/09
Average score (out of 40) 31.5 36
DATA NOTES uK only. the reduction in our considerate constructors scheme (ccs) average score is largely due to this year’s projects being primarily smaller sites where there was less direct contact with neighbours, combined with less construction activity and fewer ccs audits. this year’s score is comprised of Broadgate estates’ refurbishment of its central management office at regent’s place and a retail development. no london office developments undertook considerate constructors scheme audits.
britishland.com/crreport2010
supplIers 02
scope of resource use data
this year, we were responsible for resource use in the common parts of 93 uK and 12 continental european portfolio multi-let properties, compared to 92 uK properties and 13 continental european properties in 2008/9.
90% of our managed properties in the uK reported energy use data in 2009/10 (84 out of 93 properties), as well as 100% in continental europe (12 out of 12 properties). this compares to 88% of managed properties in the uK in 2008/09 (81 out of 92 properties) and 85% of managed properties in continental europe (11 out of 13 properties) reporting energy use data.
uK properties with a total common floor area of 1,406,675m² reported data in 2009/10, compared to 1,339,692m² in 2008/09. continental european properties with a total common floor area of 280,123m² also reported data, compared to 149,954m2 reporting last year. We have been through a process of reviewing our floor area data this year and have revised data and restated historic floor areas. the increase in floor area is due to changes in our portfolio. for consistency, the common floor areas for retail parks were calculated on the basis of the number of car park spaces in both reporting years.67 uK properties reported waste management data in 2009/10, compared to 24 properties in 2008/09. retail parks that only managed common waste, such as litter collection, and not occupier waste, did not report data this year, as data was not available from contractors.
this year, we have expanded the scope our energy reporting to differentiate between the different parts of properties where we have control. In our office portfolio we report British land controlled common parts energy use, British land controlled central plant (heating and cooling), energy use in British land controlled and occupied Head office and Broadgate estates occupied demises along with occupier controlled own demises. this enables us to form a picture of the energy consumption and characteristics of entire buildings, helping us to target energy saving action and engage in a more meaningful way with occupiers. In our retail, shopping centre and continental europe portfolios we are currently reporting the energy use in areas that we control – the common parts.
Year-on-year comparisons of our performance are not straightforward because of variations in the portfolio of properties owned and managed. reported resource use can therefore be affected by transactions as well as by changes in use. to meaningfully review performance we compare the performance of properties managed this year to their performance in our baseline year of 2004/05 and to last year, 2008/09. We refer to these as our ‘like-for-like’ properties. this year, there were 22 2004/05 like-for-like properties and 70 2008/09 like-for-like properties.
the type of resource use reported varied, reflecting the variety of services provided in those common parts.
– 84 uK and 12 continental european properties reported electricity data– 28 uK and 1 continental european properties reported gas data– 39 uK and 8 continental european properties reported water data – 67 uK and 0 continental european properties reported waste data– 0 uK and 0 continental european property reported oil data – 0 uK and 1 continental european property reported geothermal heat data.
during the 2009/10 reporting period: – 11 managed properties reported resource use data for the first time– 6 managed properties that reported resource use were sold– 5 new properties that reported energy and water use joined the managed portfolio. these comprised newly purchased properties and
development projects achieving practical completion– 43 properties reported waste data for the first time (including those
new properties listed above).
britishland.com/crreport2010

wANT TO kNOw MORE?If you would like to know more about our approach to corporate responsibility or let us know your views, please email us at [email protected]
Or write to:Justin snoxallHead of the Business GroupBritish landyork House45 seymour streetlondon w1H 7lX
t. +44 (0) 20 7486 4466f. +44 (0) 20 7467 2869
britishland.com/crReport2010Independent assurance of performance data by Bureau Veritas.