Embed Size (px)
Citation preview
Applied Mathematical Sciences, Vol. 8, 2014, no. 26, 1271 - 1288 HIKARI Ltd, www.m-hikari.com
http://dx.doi.org/10.12988/ams.2014.4113
Corporate Profitability Analysis:
A Novel Application for Paraconsistent Logic
Rodrigo P. Dill
Department of Business Federal University of South Frontier
Newton da Costa Jr.∗
Department of Economics
Federal University of Santa Catarina Florianopolis SC 88049-970, Brazil
André A. P. Santos
Department of Economics
Federal University of Santa Catarina Florianopolis SC 88049-970, Brazil
Copyright © 2014 Rodrigo Dill, Newton da Costa Jr., and André Santos. This is an open access article distributed under the Creative Commons Attribution License, which permits unrestricted use, distribution, and reproduction in any medium, provided the original work is properly cited.
Abstract This study explores the application of paraconsistent annotated evidential logic for analyzing the profitability of companies. We implemented a model that allocated degrees of favorable and contrary evidence to selected profitability ratios, defined using data from sixty-seven food industry companies. The degrees of favorable and contrary evidence assigned to each profitability index were based on which decile they were in. This model was implemented as a dedicated software program that calculates degrees of favorable and contrary evidence for the full set of indices and then provides an overall assessment of evidence in favor of or contradicting each company’s profitability. The results produced by the model ∗ Corresponding author

1272 Rodrigo Dill, Newton da Costa Jr., and André Santos were tested for agreement with assessments made by financial analysts from a Brazilian regional development bank, the Banco de Desenvolvimento do Extremo Sul, BRDE, working from the same data. We found that the results of the model based on paraconsistent logic were similar to the opinions of the specialist financial analysts, indicating that this approach could be a promising tool for verifying analysts’ reports and for supporting decision making. Keywords: Profitability indices; Paraconsistent logic; Valuation 1 Introduction A large range of analytical instruments are available to those who wish to evaluate the financial and economic aspects of companies’ financial statements. These analytical tools range from traditional financial indices, whether calculated in isolation or as part of integrated models, as is the case with the DuPont formula, to systems with well-founded conceptual bases, such as the Fleuriet model [15]. There are also more sophisticated models based on quantitative methods such as discriminant analysis [2], and other highly complex systems developed from artificial neural networks [28], [3], [18]. However, the great majority of studies (whether quantitative or non-quantitative) that have investigated the financial and economic aspects of companies are based on classical logic in which the elements that make up the factors of analysis are evaluated in a binary manner. With this type of logic, a statement is either true or it is false and there is no provision for any state other than true or false. However, in certain circumstances, statements that involve only true or false do not make sense and so non-classical logics were developed in search of more satisfactory answers to problems related to situations that are not covered by classical logic. Paraconsistent annotated evidential logic Eτ is a form of non-classical logic that was introduced by [10] to deal with non-trivial contradictions in order to provide a more appropriate method for analysis of inconsistent information. Since methods based on non-classical logics have received little attention within the fields of finance and accounting, it was considered that application of the resources of paraconsistent annotated evidential logic Eτ to analysis of the profitability of companies would be a worthwhile endeavor. The objectives that this study was designed to achieve were therefore as follows: 1) to propose a conceptual model for the analysis of firm profitability that employs the assumptions of paraconsistent annotated evidential logic Eτ; 2) to develop a dedicated software program to implement the proposed model; and 3) to analyze the model’s performance with reference to the expert judgment of specialists.
Corporate profitability analysis 1273 2 Theoretical Framework 2.1 Analysis of financial statements Financial statements have become a tool of fundamental importance for analysis of company performance over time. According to [7] “Public companies have a variety of stakeholders, such as shareholders, bondholders, bankers, suppliers, employees, and management. All these stakeholders need to monitor the firm and to ensure that their interests are being served.” Palepu et al. [22] have stressed how “managers use financial statements to monitor their own company’s performance, to help understand the policies of a competitor, or to check on the health of a customer.” However, as [7] point out, “there is a danger of being overwhelmed by the sheer volume of data. That is why managers use a few salient ratios to summarize the firm’s leverage, liquidity, efficiency, profitability, and market valuation.” These indices are calculated to help with evaluating financial statements and, therefore, to help understand a firm’s financial position. Furthermore, although the limitations of figures generated from financial reports are well-known, the investigative and predictive powers of these analyses have been studied and (sometimes) confirmed in the literature. There are hundreds of possible different indices, since the number of combinations of all the possible items on financial statements is almost limitless and is further compounded by the possibility of factoring in descriptors of business activities (such as number of employees, volume of units sold, market share, etc.). As a result, indices are often classified in categories that reflect a particular aspect of a firm’s financial performance. Stolowy and Lebas [27] state that the most common categories are: a) evaluation of short term liquidity and solvency; b) evaluation of long term solvency and financial leverage; c) evaluation of profitability and generation of profitability and d) measures of shareholder returns. The indices chosen for this study reflect the dimension of business results, which is basically made up of indices of profitability. The justification for this choice lies in the fact that analyses of financial statements normally include indices of profitability and they can be used to serve the interests of investors, creditors and management and are also used by researchers, analysts and financial consultants. 2.2 Indices of profitability The value of a firm is, in part, determined by its profitability and growth, which in turn are influenced by its market and by the strategies it adopts. While analyzing profitability cannot provide all of the answers, it serves as an assessment of the effectiveness of a firm’s policies [23]. It could be said that indices of profitability measure the results of business decisions and policies. In other words, profitability
1274 Rodrigo Dill, Newton da Costa Jr., and André Santos is, possibly, the best indicator of whether a company will survive and be successful. These quotients can also be defined as indices that show a firm’s degree of business success.
Higher profitability indices reflect a greater rate of return for owners and increased growth for the enterprise. They are designed to show the combined effects of a company’s returns against sales, assets, net equity or share price, for example. Taken together, these measures provide a basis for evaluating a company’s profits in relation to a given sales volume or a given quantity of assets, in relation to investments or in relation to the share price.
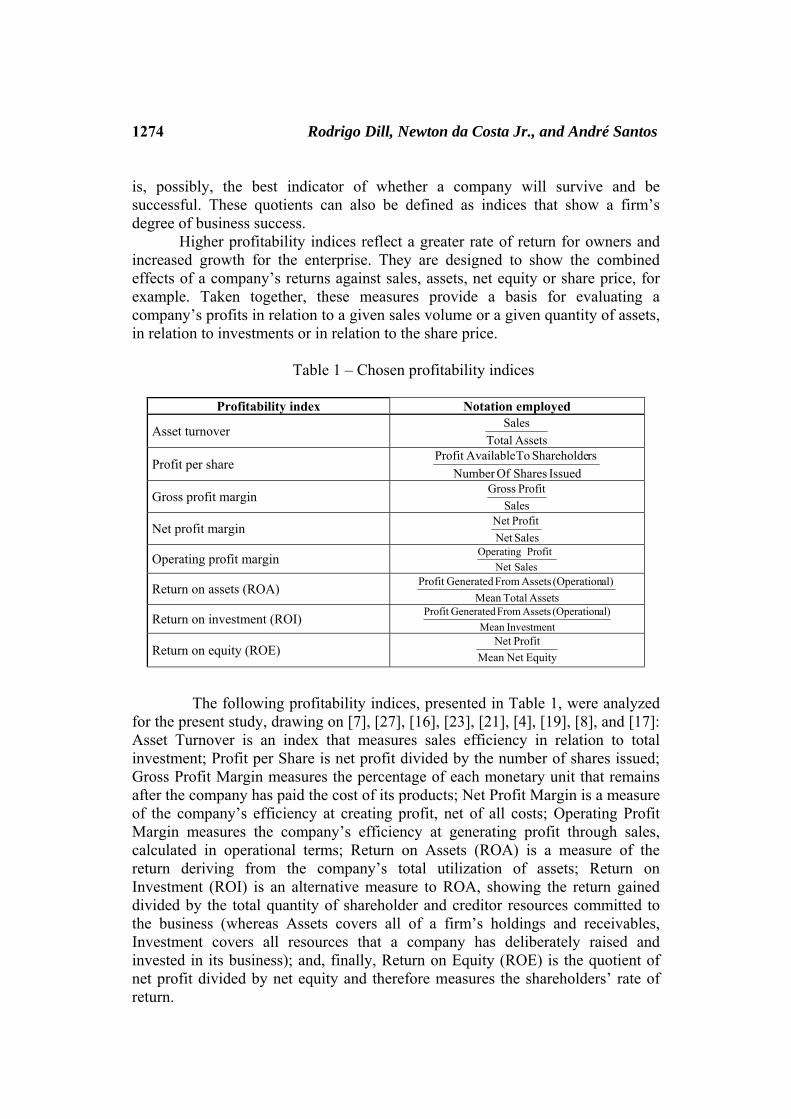
Table 1 – Chosen profitability indices
Profitability index Notation employed
Asset turnover AssetsTotal
Sales
Profit per share IssuedSharesOfNumber
rsShareholde To AvailableProfit
Gross profit margin Sales
Profit Gross
Net profit margin SalesNet ProfitNet
Operating profit margin SalesNet
Profit Operating
Return on assets (ROA) AssetsTotalMean
al)(Operation Assets From GeneratedProfit
Return on investment (ROI) InvestmentMean
al)(Operation Assets From GeneratedProfit
Return on equity (ROE) EquityNet Mean ProfitNet
The following profitability indices, presented in Table 1, were analyzed for the present study, drawing on [7], [27], [16], [23], [21], [4], [19], [8], and [17]: Asset Turnover is an index that measures sales efficiency in relation to total investment; Profit per Share is net profit divided by the number of shares issued; Gross Profit Margin measures the percentage of each monetary unit that remains after the company has paid the cost of its products; Net Profit Margin is a measure of the company’s efficiency at creating profit, net of all costs; Operating Profit Margin measures the company’s efficiency at generating profit through sales, calculated in operational terms; Return on Assets (ROA) is a measure of the return deriving from the company’s total utilization of assets; Return on Investment (ROI) is an alternative measure to ROA, showing the return gained divided by the total quantity of shareholder and creditor resources committed to the business (whereas Assets covers all of a firm’s holdings and receivables, Investment covers all resources that a company has deliberately raised and invested in its business); and, finally, Return on Equity (ROE) is the quotient of net profit divided by net equity and therefore measures the shareholders’ rate of return.
Corporate profitability analysis 1275 2.3 Paraconsistent annotated evidential logic Eτ
There is every indication that classical logic originated with Aristotle. Classical logic is a binary system, since a statement may be true or false, but may not be partially true and partially false at the same time. When this stricture is combined with the law of non-contradiction, by which a statement cannot be both true and false at the same time, all possible situations can be described by the laws of classical logic, providing the basis for Western thinking on logic. Within classical logic any theory that is inconsistent is also trivial and vice versa. There is not, therefore, any means of separating inconsistent and trivial theories.
While classical logic can describe all possible situations, it demands simplifications, since in the real world, not all situations can be classified simply as true or false true. When it becomes necessary to describe something with precision, it is difficult to define the limits that allow positive or negative statements with respect to the qualities of things. It is almost always the case that the limits between "false" and "true" are indefinite, uncertain, ambiguous and even contradictory.
Many different logics have been developed to complement classical logic (classical epistemic logic, classical modal logic, classical inductive logic, etc.) and logics have also been developed that disregard some of the fundamental principles of classical logic (paracomplete logics, paraconsistent logics, non-alethic logics, inductive paraconsistent logics, etc.).
The pioneers of paraconsistent logic were the Polish logician J. Łukasiewicz and the Russian philosopher N. A. Vasil’év, who, around 1910, simultaneously and independently raised the possibility of a logic other than classical logic, one which would, for example, restrict the principle of non-contradiction. Vasil’év went as far as to describe such a logic, which he called imaginary logic, but at the time neither had arrived at the wider view of non-classical logics that exists today. In 1948, the Polish logician S. Jàskowski drew on discussive logic to conceive of a propositional paraconsistent calculus that he called propositional discussive calculus. Independently and at the same time, the Brazilian logician Newton C. A. da Costa developed (and continues to develop) several paraconsistent systems including all of the usual logical levels: propositional calculus, predicate calculi, predicate calculi with equality, description calculi and higher-order logics [1]. Da Costa’s results have contributed to paraconsistent logic’s ongoing transformation into a progressive and promising area of research. In recent years, several studies have been published describing the application of paraconsistent annotated evidential logic Eτ to a diverse range of areas, such as, for example, frame-based knowledge management [5], construction and implementation of electronic circuits [13], decision-making for evaluation of the plans for a new factory [9], intelligent control systems for autonomous mobile robots [29], treatment of inconsistencies in case-based reasoning systems [14], quality assessment of a web commerce site [6], digital signal processing [20], support for medical decision-making [25], [26], analysis of structural reliability in rock
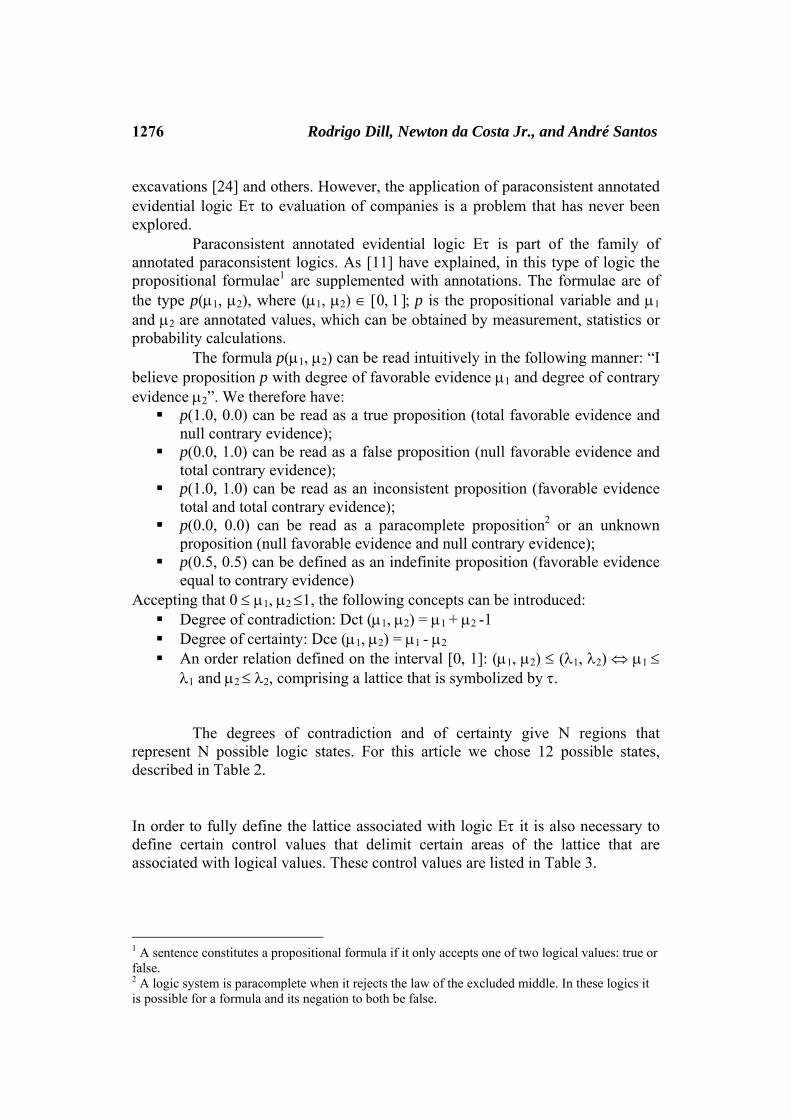
1276 Rodrigo Dill, Newton da Costa Jr., and André Santos excavations [24] and others. However, the application of paraconsistent annotated evidential logic Eτ to evaluation of companies is a problem that has never been explored. Paraconsistent annotated evidential logic Eτ is part of the family of annotated paraconsistent logics. As [11] have explained, in this type of logic the propositional formulae1 are supplemented with annotations. The formulae are of the type p(μ1, μ2), where (μ1, μ2) ∈ [0, 1]; p is the propositional variable and μ1 and μ2 are annotated values, which can be obtained by measurement, statistics or probability calculations. The formula p(μ1, μ2) can be read intuitively in the following manner: “I believe proposition p with degree of favorable evidence μ1 and degree of contrary evidence μ2”. We therefore have:
p(1.0, 0.0) can be read as a true proposition (total favorable evidence and null contrary evidence);
p(0.0, 1.0) can be read as a false proposition (null favorable evidence and total contrary evidence);
p(1.0, 1.0) can be read as an inconsistent proposition (favorable evidence total and total contrary evidence);
p(0.0, 0.0) can be read as a paracomplete proposition2 or an unknown proposition (null favorable evidence and null contrary evidence);
p(0.5, 0.5) can be defined as an indefinite proposition (favorable evidence equal to contrary evidence)
Accepting that 0 ≤ μ1, μ2 ≤1, the following concepts can be introduced: Degree of contradiction: Dct (μ1, μ2) = μ1 + μ2 -1 Degree of certainty: Dce (μ1, μ2) = μ1 - μ2 An order relation defined on the interval [0, 1]: (μ1, μ2) ≤ (λ1, λ2) ⇔ μ1 ≤
λ1 and μ2 ≤ λ2, comprising a lattice that is symbolized by τ. The degrees of contradiction and of certainty give N regions that represent N possible logic states. For this article we chose 12 possible states, described in Table 2.
In order to fully define the lattice associated with logic Eτ it is also necessary to define certain control values that delimit certain areas of the lattice that are associated with logical values. These control values are listed in Table 3.
1 A sentence constitutes a propositional formula if it only accepts one of two logical values: true or false. 2 A logic system is paracomplete when it rejects the law of the excluded middle. In these logics it is possible for a formula and its negation to both be false.
Corporate profitability analysis 1277
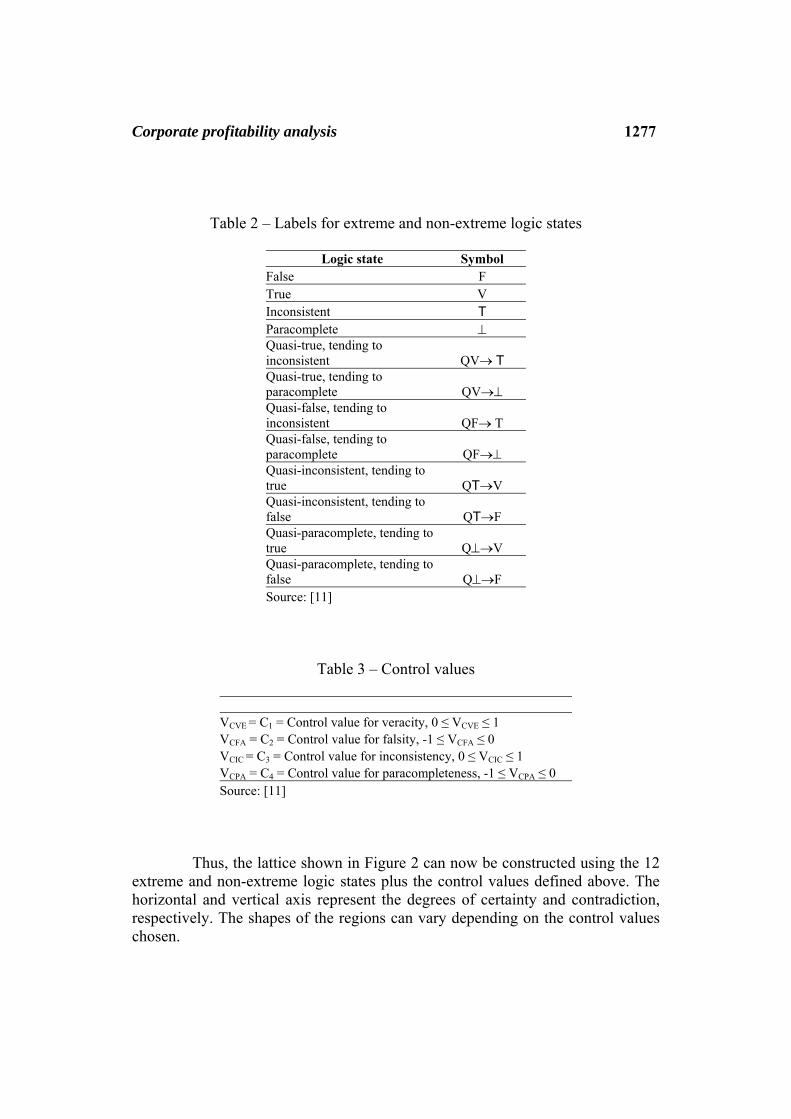
Table 2 – Labels for extreme and non-extreme logic states
Logic state Symbol False F True V Inconsistent ΤParacomplete ⊥Quasi-true, tending to inconsistent QV→ Τ Quasi-true, tending to paracomplete QV→⊥ Quasi-false, tending to inconsistent QF→ Τ Quasi-false, tending to paracomplete QF→⊥ Quasi-inconsistent, tending to true QΤ→V Quasi-inconsistent, tending to false QΤ→F Quasi-paracomplete, tending to true Q⊥→V Quasi-paracomplete, tending to false Q⊥→F Source: [11]
Table 3 – Control values
VCVE = C1 = Control value for veracity, 0 ≤ VCVE ≤ 1 VCFA = C2 = Control value for falsity, -1 ≤ VCFA ≤ 0 VCIC = C3 = Control value for inconsistency, 0 ≤ VCIC ≤ 1VCPA = C4 = Control value for paracompleteness, -1 ≤ VCPA ≤ 0 Source: [11]
Thus, the lattice shown in Figure 2 can now be constructed using the 12 extreme and non-extreme logic states plus the control values defined above. The horizontal and vertical axis represent the degrees of certainty and contradiction, respectively. The shapes of the regions can vary depending on the control values chosen.

1278 Rodrigo Dill, Newton da Costa Jr., and André Santos
Figure 2 – Lattice for 12 logic states (four extreme values and eight non-extreme
values).
3 Methodology The first step in applying logic Eτ to the analysis of corporate profitability was to determine the importance of each profitability index in the opinion of financial analysts (specialists). This was achieved by sending a research instrument via e-mail to the financial analysts at the Florianópolis office of the Banco Regional de Desenvolvimento do Extremo Sul – BRDE.3 The instrument listed the profitability indices chosen for this study and twenty specialists replied.
The analysts’ profiles were analyzed to verify that their backgrounds were appropriate for the study. Eighty-percent of the interviewees had a degree in Management, Accounting or Economics, 45% had completed a masters or doctorate and 45% had more than ten years’ experience in financial analysis. The interviewees indicated on a scale from 1 to 5, ranging from “unimportant” to “very important”, their opinion of the importance of each index for measuring the profitability of companies in the food industry. The food industry was chosen for this study intentionally.
3 BRDE is a bank that was established to fund development in the Brazil’s three southernmost states (Paraná, Santa Catarina and Rio Grande do Sul).
Corporate profitability analysis 1279
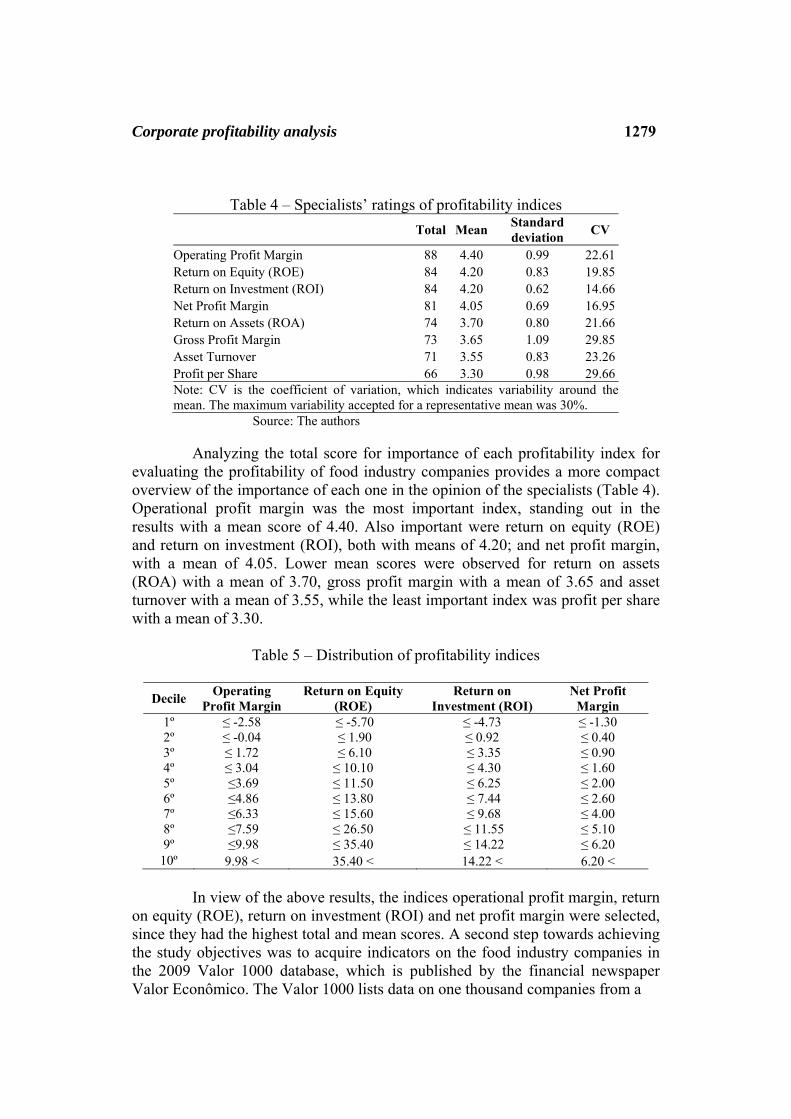
Table 4 – Specialists’ ratings of profitability indices Total Mean Standard
deviation CV
Operating Profit Margin 88 4.40 0.99 22.61 Return on Equity (ROE) 84 4.20 0.83 19.85 Return on Investment (ROI) 84 4.20 0.62 14.66 Net Profit Margin 81 4.05 0.69 16.95 Return on Assets (ROA) 74 3.70 0.80 21.66 Gross Profit Margin 73 3.65 1.09 29.85 Asset Turnover 71 3.55 0.83 23.26 Profit per Share 66 3.30 0.98 29.66 Note: CV is the coefficient of variation, which indicates variability around the mean. The maximum variability accepted for a representative mean was 30%.
Source: The authors Analyzing the total score for importance of each profitability index for evaluating the profitability of food industry companies provides a more compact overview of the importance of each one in the opinion of the specialists (Table 4). Operational profit margin was the most important index, standing out in the results with a mean score of 4.40. Also important were return on equity (ROE) and return on investment (ROI), both with means of 4.20; and net profit margin, with a mean of 4.05. Lower mean scores were observed for return on assets (ROA) with a mean of 3.70, gross profit margin with a mean of 3.65 and asset turnover with a mean of 3.55, while the least important index was profit per share with a mean of 3.30.
Table 5 – Distribution of profitability indices
Decile Operating Profit Margin
Return on Equity (ROE)
Return on Investment (ROI)
Net Profit Margin
1º ≤ -2.58 ≤ -5.70 ≤ -4.73 ≤ -1.30 2º ≤ -0.04 ≤ 1.90 ≤ 0.92 ≤ 0.40 3º ≤ 1.72 ≤ 6.10 ≤ 3.35 ≤ 0.90 4º ≤ 3.04 ≤ 10.10 ≤ 4.30 ≤ 1.60 5º ≤3.69 ≤ 11.50 ≤ 6.25 ≤ 2.00 6º ≤4.86 ≤ 13.80 ≤ 7.44 ≤ 2.60 7º ≤6.33 ≤ 15.60 ≤ 9.68 ≤ 4.00 8º ≤7.59 ≤ 26.50 ≤ 11.55 ≤ 5.10 9º ≤9.98 ≤ 35.40 ≤ 14.22 ≤ 6.20
10º 9.98 < 35.40 < 14.22 < 6.20 < In view of the above results, the indices operational profit margin, return on equity (ROE), return on investment (ROI) and net profit margin were selected, since they had the highest total and mean scores. A second step towards achieving the study objectives was to acquire indicators on the food industry companies in the 2009 Valor 1000 database, which is published by the financial newspaper Valor Econômico. The Valor 1000 lists data on one thousand companies from a
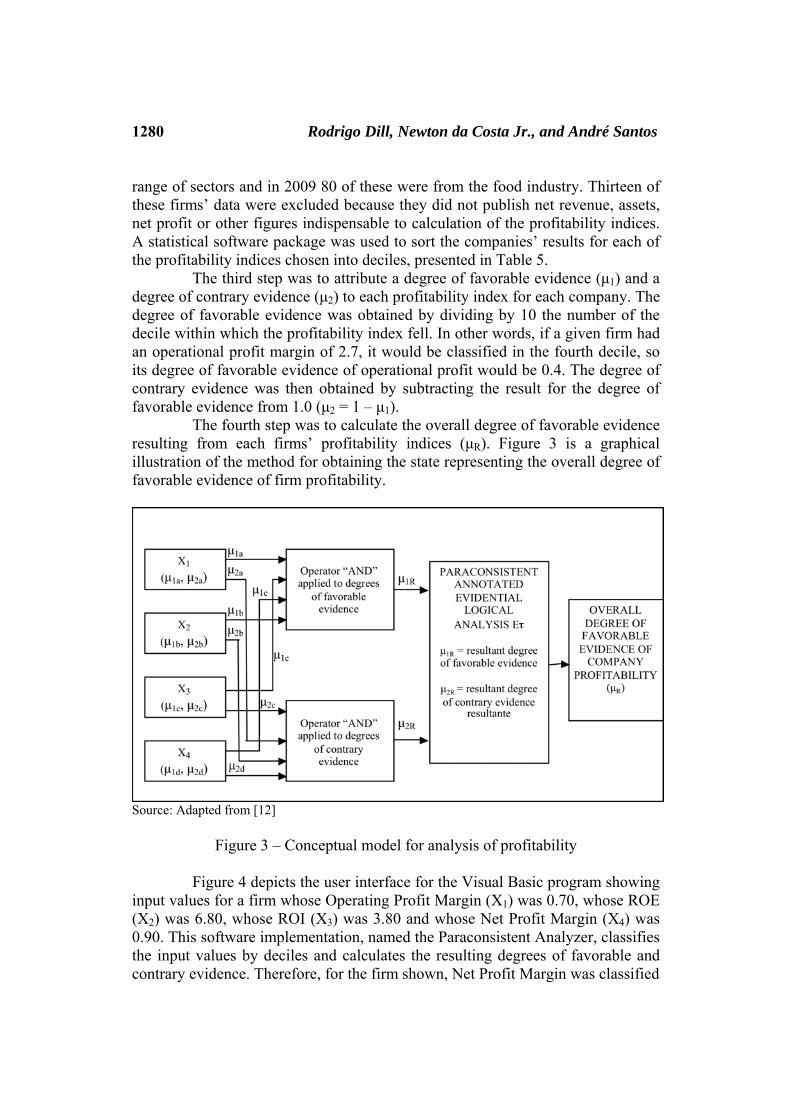
1280 Rodrigo Dill, Newton da Costa Jr., and André Santos range of sectors and in 2009 80 of these were from the food industry. Thirteen of these firms’ data were excluded because they did not publish net revenue, assets, net profit or other figures indispensable to calculation of the profitability indices. A statistical software package was used to sort the companies’ results for each of the profitability indices chosen into deciles, presented in Table 5. The third step was to attribute a degree of favorable evidence (μ1) and a degree of contrary evidence (μ2) to each profitability index for each company. The degree of favorable evidence was obtained by dividing by 10 the number of the decile within which the profitability index fell. In other words, if a given firm had an operational profit margin of 2.7, it would be classified in the fourth decile, so its degree of favorable evidence of operational profit would be 0.4. The degree of contrary evidence was then obtained by subtracting the result for the degree of favorable evidence from 1.0 (μ2 = 1 – μ1). The fourth step was to calculate the overall degree of favorable evidence resulting from each firms’ profitability indices (μR). Figure 3 is a graphical illustration of the method for obtaining the state representing the overall degree of favorable evidence of firm profitability.
Source: Adapted from [12]
Figure 3 – Conceptual model for analysis of profitability
Figure 4 depicts the user interface for the Visual Basic program showing input values for a firm whose Operating Profit Margin (X1) was 0.70, whose ROE (X2) was 6.80, whose ROI (X3) was 3.80 and whose Net Profit Margin (X4) was 0.90. This software implementation, named the Paraconsistent Analyzer, classifies the input values by deciles and calculates the resulting degrees of favorable and contrary evidence. Therefore, for the firm shown, Net Profit Margin was classified
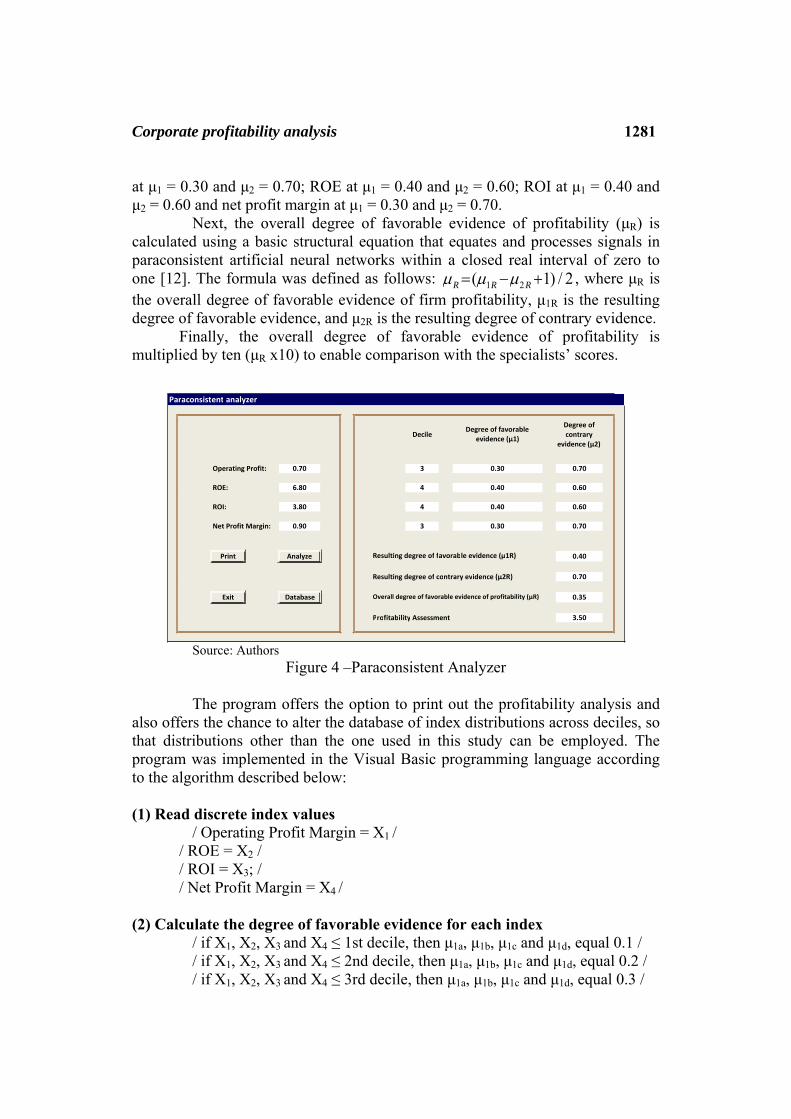
Corporate profitability analysis 1281 at μ1 = 0.30 and μ2 = 0.70; ROE at μ1 = 0.40 and μ2 = 0.60; ROI at μ1 = 0.40 and μ2 = 0.60 and net profit margin at μ1 = 0.30 and μ2 = 0.70. Next, the overall degree of favorable evidence of profitability (μR) is calculated using a basic structural equation that equates and processes signals in paraconsistent artificial neural networks within a closed real interval of zero to one [12]. The formula was defined as follows: μR =(μ1R −μ2 R +1) / 2 , where μR is the overall degree of favorable evidence of firm profitability, μ1R is the resulting degree of favorable evidence, and μ2R is the resulting degree of contrary evidence.
Finally, the overall degree of favorable evidence of profitability is multiplied by ten (μR x10) to enable comparison with the specialists’ scores.
DecileDegree of favorable
evidence (µ1)
Degree of contrary
evidence (µ2)
Operating Profit: 0.70 3 0.30 0.70
ROE: 6.80 4 0.40 0.60
ROI: 3.80 4 0.40 0.60
Net Profit Margin: 0.90 3 0.30 0.70
Print Analyze 0.40
0.70
Exit Database 0.35
3.50
Paraconsistent analyzer
Resulting degree of favorable evidence (µ1R)
Resulting degree of contrary evidence (µ2R)
Overall degree of favorable evidence of profitability (µR)
Profitability Assessment
Source: Authors
Figure 4 –Paraconsistent Analyzer The program offers the option to print out the profitability analysis and also offers the chance to alter the database of index distributions across deciles, so that distributions other than the one used in this study can be employed. The program was implemented in the Visual Basic programming language according to the algorithm described below: (1) Read discrete index values / Operating Profit Margin = X1 /
/ ROE = X2 / / ROI = X3; / / Net Profit Margin = X4 /
(2) Calculate the degree of favorable evidence for each index / if X1, X2, X3 and X4 ≤ 1st decile, then μ1a, μ1b, μ1c and μ1d, equal 0.1 / / if X1, X2, X3 and X4 ≤ 2nd decile, then μ1a, μ1b, μ1c and μ1d, equal 0.2 / / if X1, X2, X3 and X4 ≤ 3rd decile, then μ1a, μ1b, μ1c and μ1d, equal 0.3 /
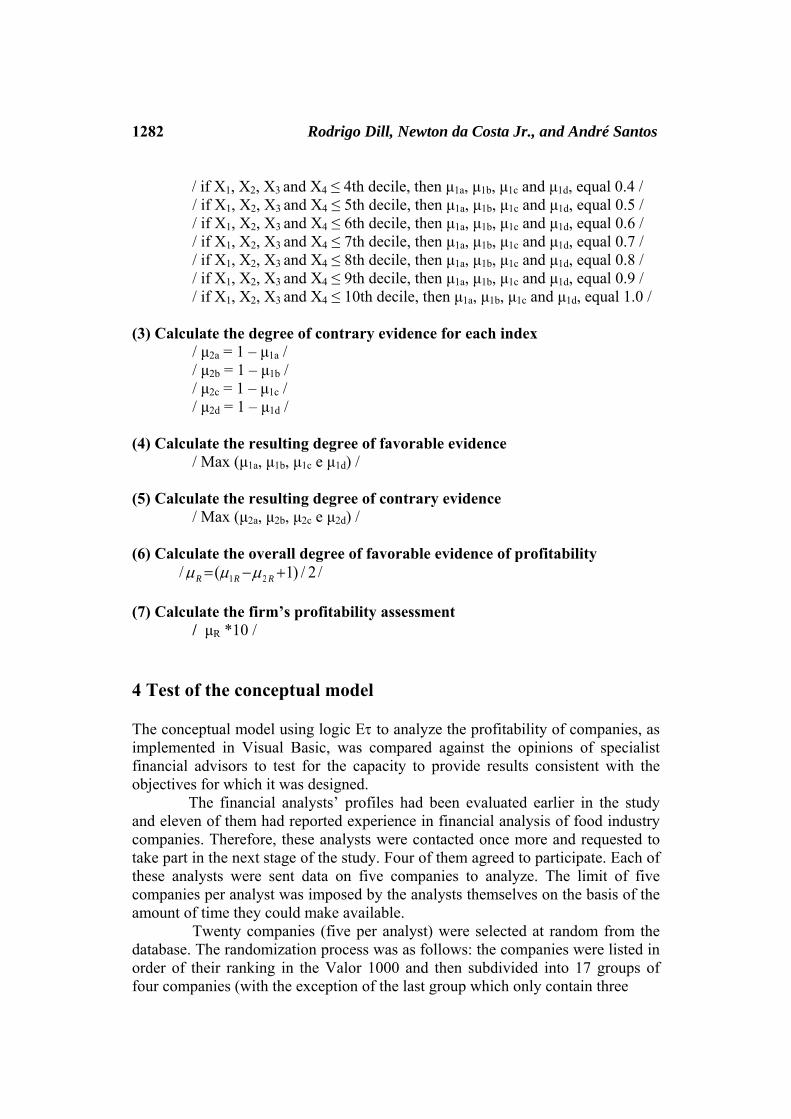
1282 Rodrigo Dill, Newton da Costa Jr., and André Santos / if X1, X2, X3 and X4 ≤ 4th decile, then μ1a, μ1b, μ1c and μ1d, equal 0.4 / / if X1, X2, X3 and X4 ≤ 5th decile, then μ1a, μ1b, μ1c and μ1d, equal 0.5 / / if X1, X2, X3 and X4 ≤ 6th decile, then μ1a, μ1b, μ1c and μ1d, equal 0.6 / / if X1, X2, X3 and X4 ≤ 7th decile, then μ1a, μ1b, μ1c and μ1d, equal 0.7 / / if X1, X2, X3 and X4 ≤ 8th decile, then μ1a, μ1b, μ1c and μ1d, equal 0.8 / / if X1, X2, X3 and X4 ≤ 9th decile, then μ1a, μ1b, μ1c and μ1d, equal 0.9 / / if X1, X2, X3 and X4 ≤ 10th decile, then μ1a, μ1b, μ1c and μ1d, equal 1.0 / (3) Calculate the degree of contrary evidence for each index / μ2a = 1 – μ1a / / μ2b = 1 – μ1b / / μ2c = 1 – μ1c / / μ2d = 1 – μ1d / (4) Calculate the resulting degree of favorable evidence / Max (μ1a, μ1b, μ1c e μ1d) / (5) Calculate the resulting degree of contrary evidence / Max (μ2a, μ2b, μ2c e μ2d) / (6) Calculate the overall degree of favorable evidence of profitability
/ μR =(μ1R −μ2 R +1) / 2 / (7) Calculate the firm’s profitability assessment / μR *10 / 4 Test of the conceptual model The conceptual model using logic Eτ to analyze the profitability of companies, as implemented in Visual Basic, was compared against the opinions of specialist financial advisors to test for the capacity to provide results consistent with the objectives for which it was designed.
The financial analysts’ profiles had been evaluated earlier in the study and eleven of them had reported experience in financial analysis of food industry companies. Therefore, these analysts were contacted once more and requested to take part in the next stage of the study. Four of them agreed to participate. Each of these analysts were sent data on five companies to analyze. The limit of five companies per analyst was imposed by the analysts themselves on the basis of the amount of time they could make available. Twenty companies (five per analyst) were selected at random from the database. The randomization process was as follows: the companies were listed in order of their ranking in the Valor 1000 and then subdivided into 17 groups of four companies (with the exception of the last group which only contain three
Corporate profitability analysis 1283 firms). The companies in each group were numbered from one to four and then a number between one and four was drawn at random, selecting companies with that number. At the end of this process 17 companies had been chosen and three remained to reach the total of 20. One more number was drawn at random and the first three companies with that number were selected. The 20 companies were then classified in alphabetical order and the first five were allocated to the first analyst, companies six to 10 were allocated to the second, and so on.
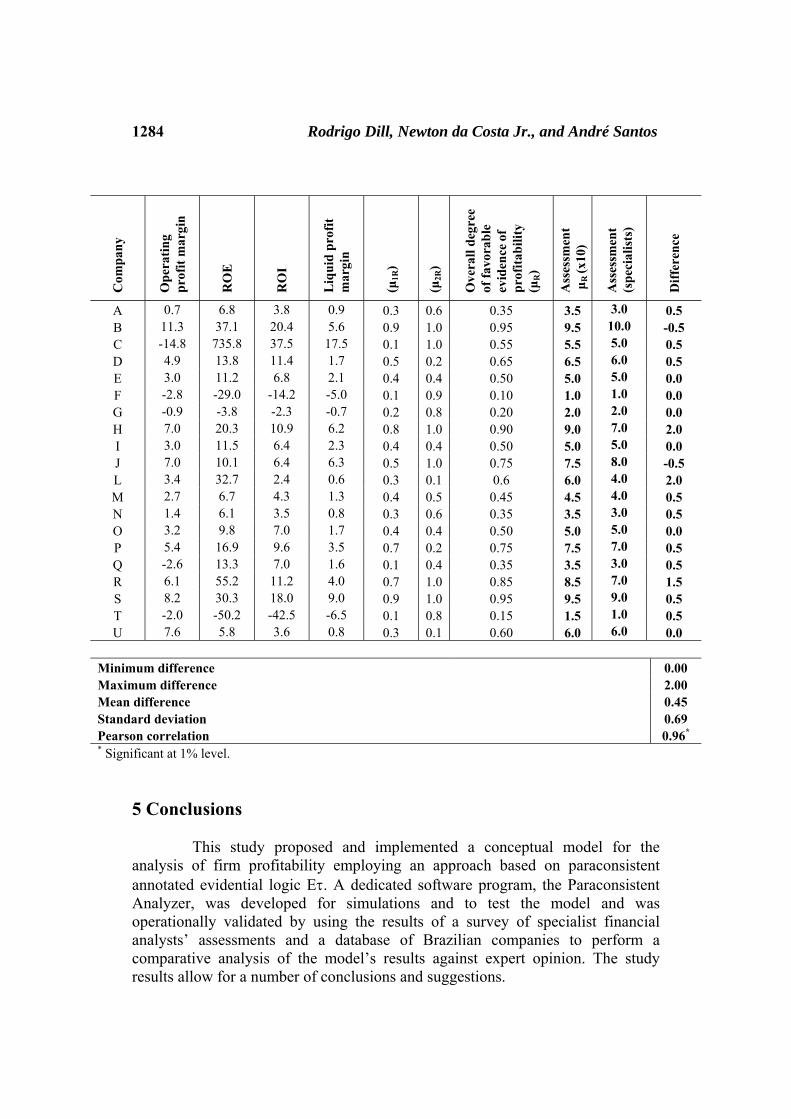
Profitability indices for these 20 companies were extracted from the database and a research instrument was constructed on which the analysts would score the profitability of each company from zero to 10. The companies' names were excluded from the research instrument since this information could have influenced the specialists' analyses. Table 5 lists the 20 companies chosen, the profitability indices for each one, the resulting degrees of favorable evidence (μ1R), the resulting degrees of contrary evidence (μ2R), the overall degree of favorable evidence of each firm’s profitability (μR), the overall degree of favorable evidence of each firm’s profitability multiplied by ten (μR x10) to enable comparison with the specialists’ score, the specialists’ scores for the firms’ profitability and, in the final column, the difference between the model’s and the specialists’ profitability assessments. Table 5 lists the indicators of profitability for each of the twenty companies analyzed and the resulting degrees of favorable and contrary evidence calculated using the methodology described in Section 3. Additionally, the same table lists the overall profitability assessment for each firm according to the paraconsistent logic conceptual model and the specialists’ assessments of their profitability. The final column shows the differences between the results of the model and the specialists’ scores.
It will immediately be observed that for six firms (E, F, G, I, O and U), which is 30% of the sample, the proposed model and the specialists attributed identical scores. The maximum error of the system was two points (firm L) and the mean difference was 0.45 points with a standard deviation of 0.69 points. The correlation between the specialists’ assessments and the model was 0.96, significant at 1%. It is therefore concluded that there is a high degree of similarity between the specialists’ profitability assessments and the evaluations provided by this implementation of the paraconsistent logic conceptual model. The results shown in Table 5 suggest that evaluating the profitability of companies using the concepts underlying annotated paraconsistent logic provides very similar results to requesting assessments from specialists. In view of this, this approach could be useful as a validation techniques for technical reports and as a decision-making support tool.
Table 5 – Comparison between specialist analysts’ evaluations of firms’
profitability and the results of a conceptual model based on paraconsistent logic
1284 Rodrigo Dill, Newton da Costa Jr., and André Santos
Com
pany
Ope
ratin
g pr
ofit
mar
gin
RO
E
RO
I
Liq
uid
prof
it m
argi
n
(μ1R
)
(μ2R
)
Ove
rall
degr
ee
of fa
vora
ble
evid
ence
of
prof
itabi
lity
(μR)
Ass
essm
ent
μR
(x10
)
Ass
essm
ent
(spe
cial
ists
)
Diff
eren
ce
A 0.7 6.8 3.8 0.9 0.3 0.6 0.35 3.5 3.0 0.5 B 11.3 37.1 20.4 5.6 0.9 1.0 0.95 9.5 10.0 -0.5 C -14.8 735.8 37.5 17.5 0.1 1.0 0.55 5.5 5.0 0.5 D 4.9 13.8 11.4 1.7 0.5 0.2 0.65 6.5 6.0 0.5 E 3.0 11.2 6.8 2.1 0.4 0.4 0.50 5.0 5.0 0.0 F -2.8 -29.0 -14.2 -5.0 0.1 0.9 0.10 1.0 1.0 0.0 G -0.9 -3.8 -2.3 -0.7 0.2 0.8 0.20 2.0 2.0 0.0 H 7.0 20.3 10.9 6.2 0.8 1.0 0.90 9.0 7.0 2.0 I 3.0 11.5 6.4 2.3 0.4 0.4 0.50 5.0 5.0 0.0 J 7.0 10.1 6.4 6.3 0.5 1.0 0.75 7.5 8.0 -0.5 L 3.4 32.7 2.4 0.6 0.3 0.1 0.6 6.0 4.0 2.0 M 2.7 6.7 4.3 1.3 0.4 0.5 0.45 4.5 4.0 0.5 N 1.4 6.1 3.5 0.8 0.3 0.6 0.35 3.5 3.0 0.5 O 3.2 9.8 7.0 1.7 0.4 0.4 0.50 5.0 5.0 0.0 P 5.4 16.9 9.6 3.5 0.7 0.2 0.75 7.5 7.0 0.5 Q -2.6 13.3 7.0 1.6 0.1 0.4 0.35 3.5 3.0 0.5 R 6.1 55.2 11.2 4.0 0.7 1.0 0.85 8.5 7.0 1.5 S 8.2 30.3 18.0 9.0 0.9 1.0 0.95 9.5 9.0 0.5 T -2.0 -50.2 -42.5 -6.5 0.1 0.8 0.15 1.5 1.0 0.5 U 7.6 5.8 3.6 0.8 0.3 0.1 0.60 6.0 6.0 0.0
Minimum difference 0.00 Maximum difference 2.00 Mean difference 0.45 Standard deviation 0.69 Pearson correlation 0.96* * Significant at 1% level.
5 Conclusions This study proposed and implemented a conceptual model for the analysis of firm profitability employing an approach based on paraconsistent annotated evidential logic Eτ. A dedicated software program, the Paraconsistent Analyzer, was developed for simulations and to test the model and was operationally validated by using the results of a survey of specialist financial analysts’ assessments and a database of Brazilian companies to perform a comparative analysis of the model’s results against expert opinion. The study results allow for a number of conclusions and suggestions.
Corporate profitability analysis 1285 With regard to the operational aspects of the system, it was observed that the software program is easy to use and the visual layout of the graphical user interface facilitates understanding of the process and of the results produced. The group of indices for corporate profitability analysis considered most important by the specialists surveyed here only coincide with a list of profitability indices employed by Iudícibus (1998), whereas other authors diverge on the inclusion/exclusion of at least one profitability index. Both the authors consulted and the specialists studied highlight return on equity as an important index of profitability. However, the specialists considered operational profit margin to be the most important index, whereas many authors do not even consider this to be an index of profitability. This disagreement may be the result of having restricted the study to data on food industry companies. The specialists were asked to indicate the indices they considered most important for analyzing profitability of food industry companies, whereas the authors consulted tend to propose a set of generic indicators for analysis of companies in all industries. The evidence provided by the tests supports acceptance of the proposed model and indicates that the model based on logic Eτ is capable of dealing with the ambiguous and uncertain aspects that are inherent to analyzing corporate profitability. It can also be concluded that the model based on logic Eτ offers solutions for problems related to financial analysis of companies by means of more appropriate analysis techniques, particularly when data are uncertain or contradictory, since such data can still be treated in a non-trivial manner. The conceptual model was found to be fully operational and, therefore, applicable to analysis of company profitability. Potential applications for expanded and improved versions of this model (and of other quantitative methods) include flagging up involuntary analyst bias when measuring company profitability or even for detecting fraud. It is hoped that this study can contribute to financial analysis of companies and, more specifically, to analysis of company profitability, to the extent that it has shown the viability of practical application of a model designed to measure elements that are typical of the applied social sciences. Naturally, the innovative nature of the study, both in terms of its approach and the model produced, means that contributions are needed from researchers in other disciplines in order to improve and expand the opportunities for application. References
[1] J.M. Abe, Fundamentos da lógica anotada. PhD dissertation. Departamento de Filosofia da Faculdade de Filosofia, Ciências e Letras da Universidade de São Paulo, São Paulo, 1992.
[2] E. Altman, Financial ratios, discriminant analysis and the prediction of corporate bankruptcy. Journal of Finance, v. 23(1968), 189-209.
1286 Rodrigo Dill, Newton da Costa Jr., and André Santos
[3] E. Altman, G. Marco and F. Varetto, Corporate distress diagnosis: comparisons using linear discriminant analysis and neural networks (the Italian experience). Journal of Banking and Finance, v. 18 (1994), 505-529.
[4] A. Assaf Neto, Finanças corporativas e valor. São Paulo: Atlas, 2003.
[5] B.C. Avila, Uma abordagem paraconsistente baseada em lógica evidencial para tratar exceções em sistemas de frames com múltipla herança. PhD dissertation. Departamento de Engenharia de Computação e Sistemas Digitais. São Paulo: Escola Politécnica da Universidade de São Paulo, 1996.
[6] C.A.F. Bispo and D. Gibertoni, Uma avaliação paraconsistente da qualidade de um sítio de comércio eletrônico. In: Actas, Conferência IADIS Ibero-Americana www/Internet 2005. Lisboa - Portugal, International Association for Development of the Information Society - IADIS, 2005.
[7] R.A. Brealey, S. C. Myers and F. Allen, Principles of Corporate Finance. 8th ed. New York: McGraw-Hill, 2006.
[8] E.F. Brigham, J.F. Houston, Fundamentos da moderna administração financeira. Rio de Janeiro: Campus, 1999.
[9] F.R. Carvalho, I. Brunstein and J.M. Abe, Um estudo de tomada de decisão baseado em lógica paraconsistente anotada: avaliação do projeto de uma fábrica. Revista Pesquisa e Desenvolvimento em Engenharia de Produção, v. 1 (2003), 47-62.
[10] N.C.A. da Costa, V.S. Subrahmanian and C. Vago, The paraconsistent logics P-Tau, Mathematical Logic Quarterly, v. 37 (1991), 39-148.
[11] N.C.A. da Costa, J.M. Abe, A.C. Murolo, J.I. Da Silva Filho and C.F.S. Leite, Lógica paraconsistente aplicada. São Paulo : Atlas, 1999.
[12] J.I. da Silva Filho and J.M. Abe, Fundamentos das redes neurais artificiais paraconsistentes. São Paulo : Editora Arte & Ciência, 1999.
[13] J.I. da Silva Filho, Métodos de aplicações da lógica paraconsistente anotada de anotação com dois valores-LPA2v com construção de algoritmo e implementação de circuitos eletrônicos. PhD dissertation. Escola Politécnica da Universidade de São Paulo. Departamento de Engenharia de Computação e Sistemas Digitais. São Paulo, 1999.
[14] V.L.M. Falquete, Utilização de lógica paraconsistente para tratamento de inconsistências em sistemas de raciocínio baseado em casos. PhD dissertation. Programa de Pós-Graduação em Informática Aplicada. Curitiba: Pontifícia Universidade do Paraná, 2004.
Corporate profitability analysis 1287
[15] M. Fleuriet, R. Kehdy and G. Blanc, A dinâmica financeira das empresas brasileiras (The financial dynamics of Brazilian firms), Belo Horizonte, Fundação Dom Cabral, 1978.
[16] L.J. Gitman, Principles of Managerial Finance, Addison Wesley: New York, 2002.
[17] S. Iudícibus, Análise de balanços. Análise da liquidez e do endividamento; Análise do giro, rentabilidade e alavancagem financeira. São Paulo: Atlas, 1998.
[18] H. Jo and I. Han, Bankruptcy prediction using case-based reasoning, neural networks, and discriminant analysis. Expert Systems with Applications, v. 13 (1997), 97-108.
[19] J.C. Marion, Análise das demonstrações contábeis. Contabilidade Empresarial. 2a ed. São Paulo: Atlas, 2002.
[20] P.H.F. Masotti, Metodologia de monitoração e diagnóstico automatizado de rolamentos utilizando lógica paraconsistente, transformada de wavelet e processamento de sinais digitais. PhD dissertation. Instituto de Pesquisas Energéticas e Nucleares. São Paulo: Universidade de São Paulo, 2006.
[21] D.C. Matarazzo, Análise financeira de balanços. 6a ed. São Paulo: Atlas, 2003.
[22] K.G. Palepu, P.G. Healy and V.L. Bernard, Business analysis and valuation: using financial statements. 3. ed. Ohio: South-Western College Publishing, 2004.
[23] S.H. Penman, Financial statement analysis and security valuation. 2. ed. Boston: Irwin Mcgraw Hill, 2004.
[24] E.C. Sansone, L.C. Rusilo and L.A.A. Da Silva, Metodologia para análise da confiabilidade estrutural de escavações em rocha. Revista Escola de Minas, v. 62 (2009), 107-113.
[25] P.R.S. Souza, Métodos de apoio a decisão médica para análise em diabetes Mellitus gestacional utilizando a probabilidade pragmática na lógica paraconsistente anotada de dois valores para melhor precisão de resposta. PhD dissertation. Departamento de Engenharia de Telecomunicações e Controle. São Paulo: Escola Politécnica da Universidade de São Paulo, 2009.
[26] P.R.S. Souza, Uma análise em possíveis casos de patologias médicas utilizando a curva ROC em lógica paraconsistente anotada para apoio a decisão médica em busca de melhor precisão de resposta na web. In: Décimo Quarto Congresso Internacional ABED de Educação a Distancia. Santos, 2008.
1288 Rodrigo Dill, Newton da Costa Jr., and André Santos
[27] H. Stolowy and M.J. Lebas, Financial accounting and reporting: A
global perspective. 2. ed. London: Thomson, 2006.
[28] K.Y. Tam and M. Kiang, Managerial applications of neural networks: the case of bank failure predictions. Management Science, v.38 (1992), 926-947.
[29] C.R. Torres, Sistema inteligente paraconsistente para controle de robôs móveis autônomos. Dissertação de Mestrado. Programa de Pós-Graduação em Engenharia Elétrica. Itajubá: Universidade Federal de Itajubá, 2004.
Received: January 9, 2014