Embed Size (px)
Citation preview

Corporate PresentationDundee Capital Markets
Gold Rush Road Show
January 2011
www.dundeeprecious.com
TSX - DPM
FORWARD-LOOKING STATEMENTS
This presentation contains “forward-looking information” or "forward-looking statements" that involve a number of risks and
uncertainties. Forward-looking information and forward-looking statements include, but are not limited to, statements with respect to
the future prices of gold and other metals, the estimation of mineral reserves and resources, the realization of mineral estimates, the
timing and amount of estimated future production, costs of production, capital expenditures, costs and timing of the development of
new deposits, success of exploration activities, permitting time lines, currency fluctuations, requirements for additional capital,
government regulation of mining operations, environmental risks, unanticipated reclamation expenses, title disputes or claims,
limitations on insurance coverage and timing and possible outcome of pending litigation. Often, but not always, forward-looking
statements can be identified by the use of words such as “plans”, “expects”, or “does not expect”, “is expected”, “budget”, “scheduled”,
“estimates”, “forecasts”, “intends”, “anticipates”, or “does not anticipate”, or “believes”, or variations of such words and phrases or state
that certain actions, events or results “may”, “could”, “would”, “might” or “will” be taken, occur or be achieved. Forward-looking
statements are based on the opinions and estimates of management as of the date such statements are made, and they involve
known and unknown risks, uncertainties and other factors which may cause the actual results, performance or achievements of the
Company to be materially different from any other future results, performance or achievements expressed or implied by the forward-
looking statements. Such factors include, among others: the actual results of current exploration activities; actual results of current
reclamation activities; conclusions of economic evaluations; changes in project parameters as plans continue to be refined; future
prices of gold; possible variations in ore grade or recovery rates; failure of plant, equipment or processes to operate as anticipated;
accidents, labour disputes and other risks of the mining industry; delays in obtaining governmental approvals or financing or in the
completion of development or construction activities, fluctuations in metal prices, as well as those risk factors discussed or referred to
in this news release under and in the Company‟s annual information form under the heading "Risk Factors" and other documents filed
from time to time with the securities regulatory authorities in all provinces and territories of Canada and available at
www.sedar.com. Although the Company has attempted to identify important factors that could cause actual actions, events or results
to differ materially from those described in forward-looking statements, there may be other factors that cause actions, events or results
not to be anticipated, estimated or intended. There can be no assurance that forward-looking statements will prove to be accurate, as
actual results and future events could differ materially from those anticipated in such statements. Accordingly, readers are cautioned
not to place undue reliance on forward-looking statements.
2
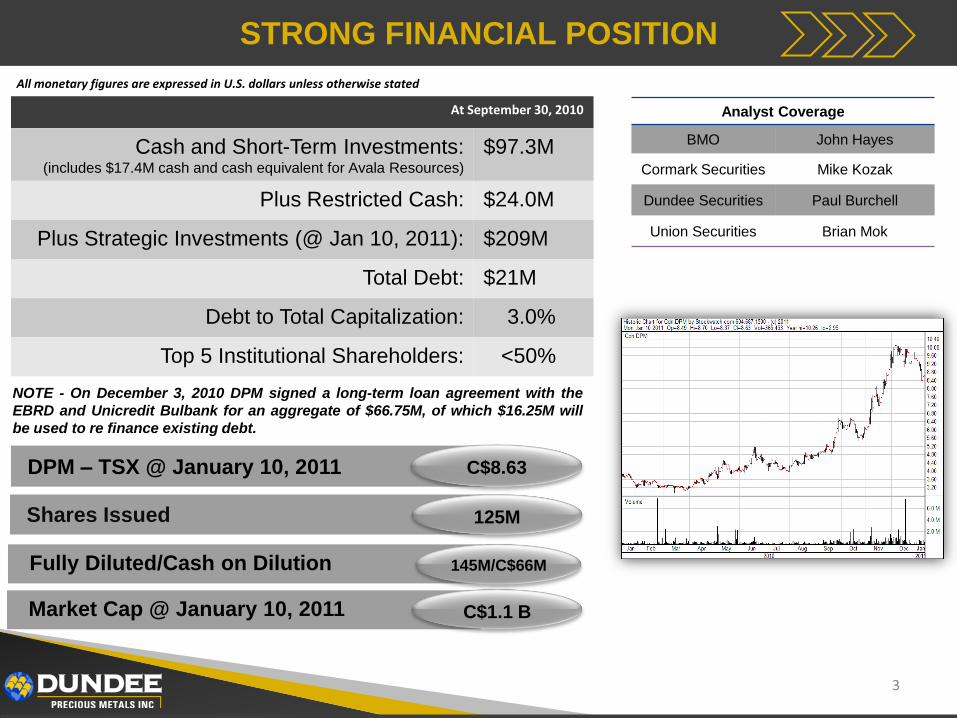
STRONG FINANCIAL POSITION
At September 30, 2010
Cash and Short-Term Investments:(includes $17.4M cash and cash equivalent for Avala Resources)
$97.3M
Plus Restricted Cash: $24.0M
Plus Strategic Investments (@ Jan 10, 2011): $209M
Total Debt: $21M
Debt to Total Capitalization: 3.0%
Top 5 Institutional Shareholders: <50%
C$8.63
125M
Market Cap @ January 10, 2011 C$1.1 B
DPM – TSX @ January 10, 2011
Shares Issued
Analyst Coverage
BMO John Hayes
Cormark Securities Mike Kozak
Dundee Securities Paul Burchell
Union Securities Brian Mok
Fully Diluted/Cash on Dilution 145M/C$66M
3
All monetary figures are expressed in U.S. dollars unless otherwise stated
NOTE - On December 3, 2010 DPM signed a long-term loan agreement with the
EBRD and Unicredit Bulbank for an aggregate of $66.75M, of which $16.25M will
be used to re finance existing debt.
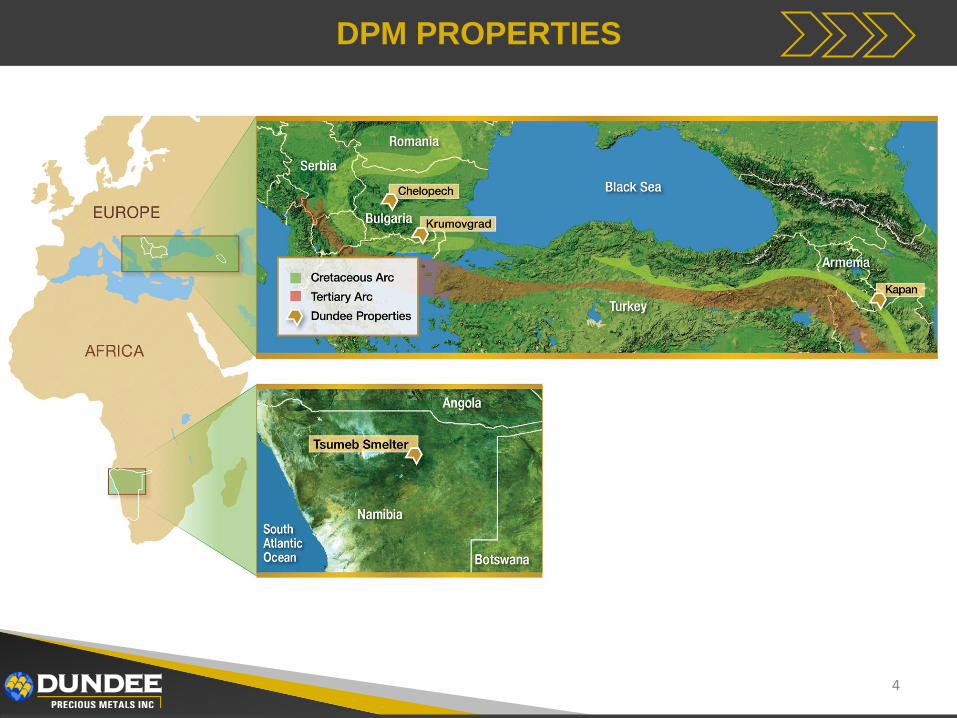
DPM PROPERTIES
4
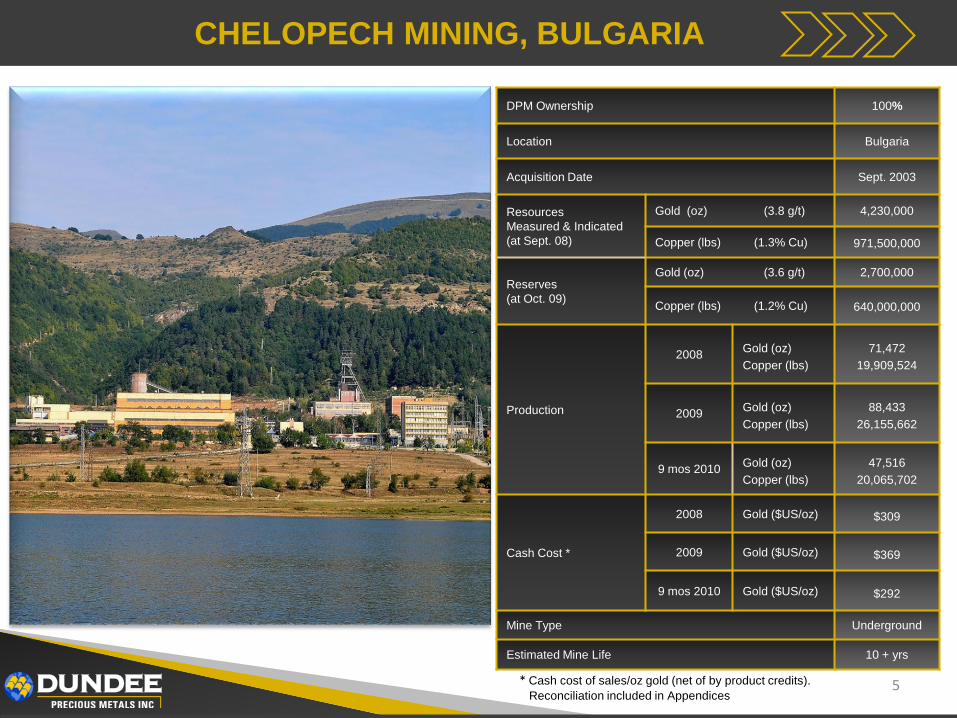
CHELOPECH MINING, BULGARIA
DPM Ownership 100%
Location Bulgaria
Acquisition Date Sept. 2003
Resources
Measured & Indicated
(at Sept. 08)
Gold (oz) (3.8 g/t) 4,230,000
Copper (lbs) (1.3% Cu) 971,500,000
Reserves
(at Oct. 09)
Gold (oz) (3.6 g/t) 2,700,000
Copper (lbs) (1.2% Cu) 640,000,000
Production
2008Gold (oz)
Copper (lbs)
71,472
19,909,524
2009Gold (oz)
Copper (lbs)
88,433
26,155,662
9 mos 2010Gold (oz)
Copper (lbs)
47,516
20,065,702
Cash Cost *
2008 Gold ($US/oz) $309
2009 Gold ($US/oz) $369
9 mos 2010 Gold ($US/oz) $292
Mine Type Underground
Estimated Mine Life 10 + yrs
* Cash cost of sales/oz gold (net of by product credits).
Reconciliation included in Appendices5
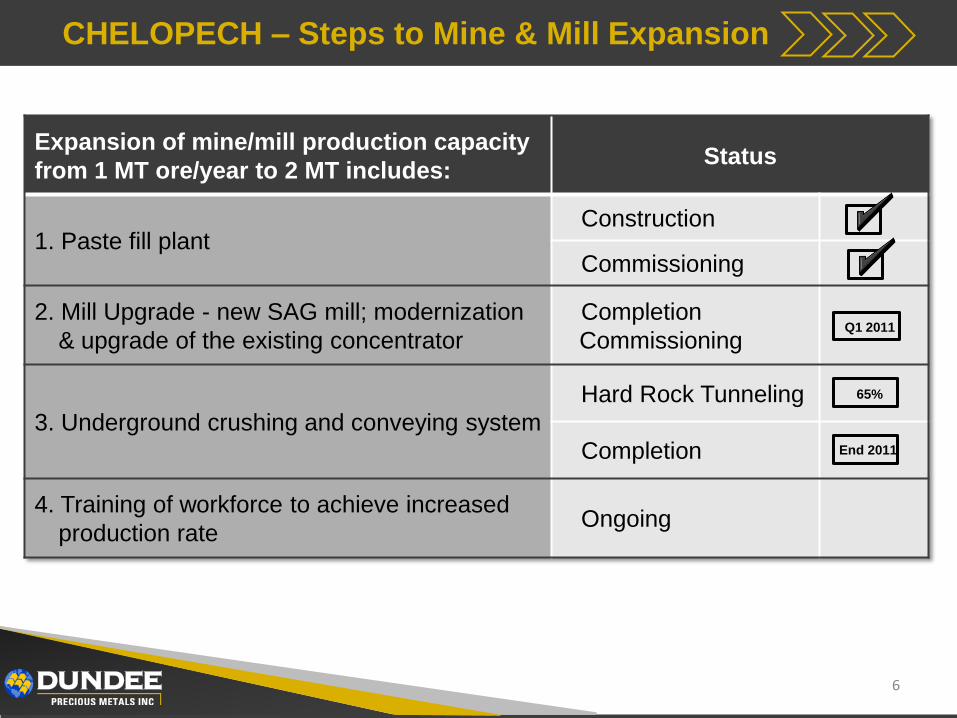
CHELOPECH – Steps to Mine & Mill Expansion
6
Expansion of mine/mill production capacity
from 1 MT ore/year to 2 MT includes:Status
1. Paste fill plantConstruction
Commissioning
2. Mill Upgrade - new SAG mill; modernization
& upgrade of the existing concentrator
Completion
Commissioning
3. Underground crushing and conveying system
Hard Rock Tunneling
Completion
4. Training of workforce to achieve increased
production rateOngoing
65%
End 2011
Q1 2011
CHELOPECH – Construction Momentum
7
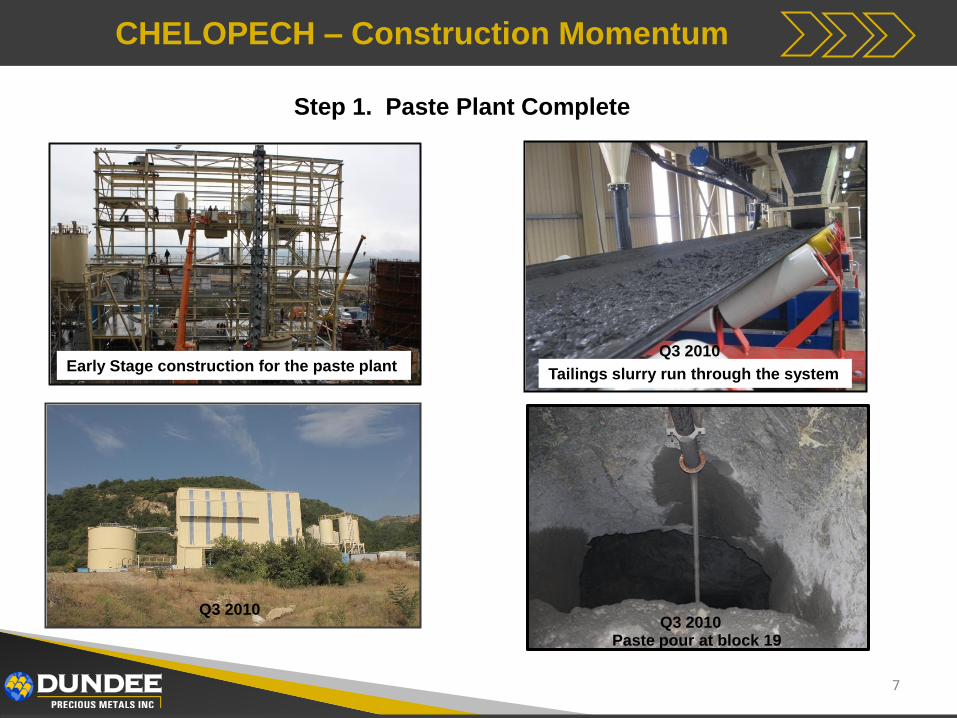
Early Stage construction for the paste plant
Step 1. Paste Plant Complete
Q2 2010
Q3 2010
Paste pour at block 19
Tailings slurry run through the system
Q3 2010
Q3 2010
CHELOPECH – Construction Momentum
8
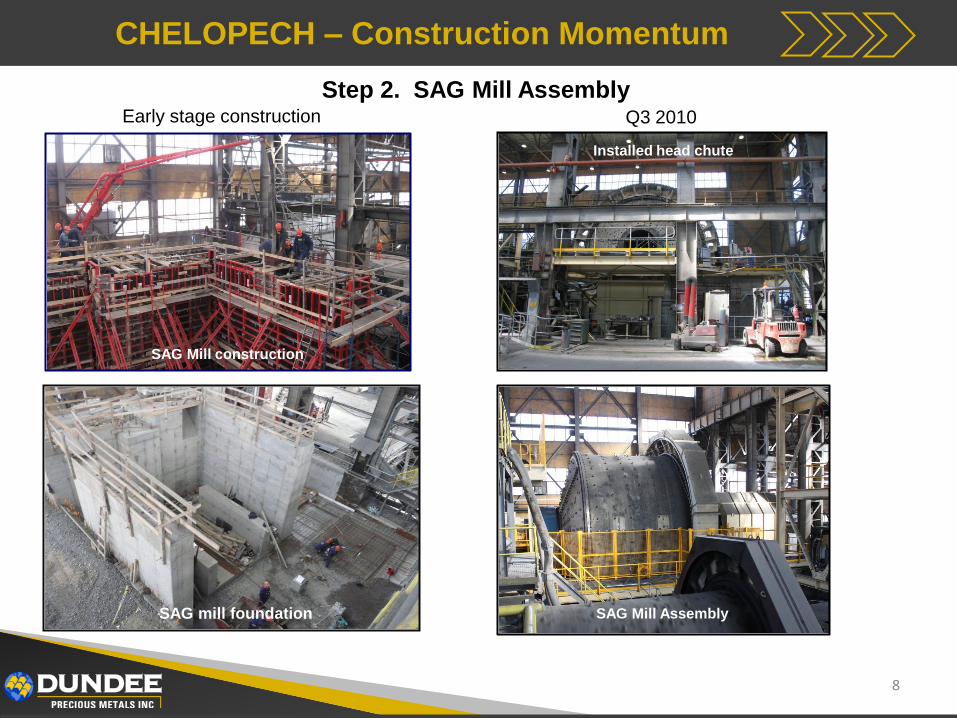
SAG Mill construction
SAG mill foundation
Step 2. SAG Mill AssemblyEarly stage construction Q3 2010
SAG Mill in progress
Installed head chute
SAG Mill Assembly
CHELOPECH – Construction Momentum
9
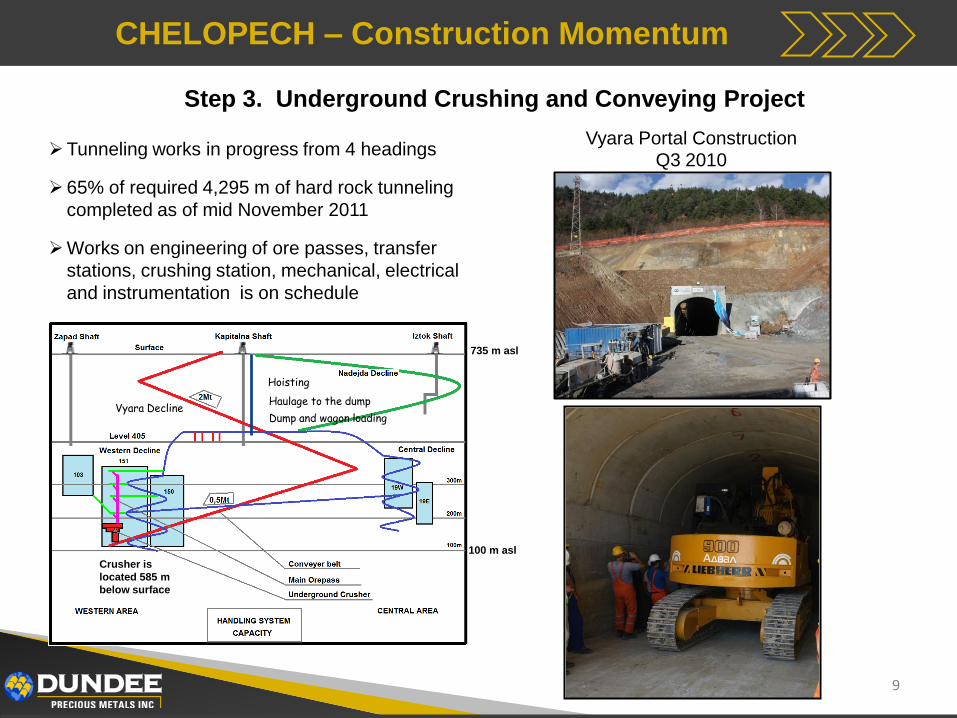
Step 3. Underground Crushing and Conveying Project
Vyara Portal Construction Q3 2010
Tunneling works in progress from 4 headings
65% of required 4,295 m of hard rock tunneling
completed as of mid November 2011
Works on engineering of ore passes, transfer
stations, crushing station, mechanical, electrical
and instrumentation is on schedule
Haulage to the dump
Hoisting
Dump and wagon loadingVyara Decline
735 m asl
100 m asl
Crusher is
located 585 m
below surface
CHELOPECH – Mine/Mill Expansion Cost Benefits
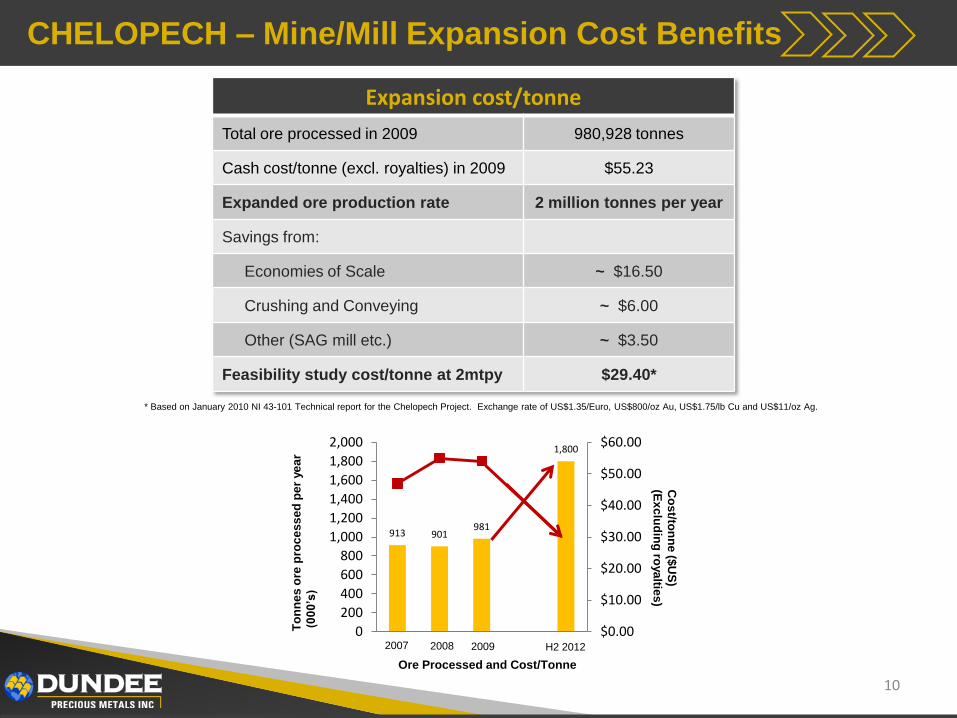
Expansion cost/tonne
Total ore processed in 2009 980,928 tonnes
Cash cost/tonne (excl. royalties) in 2009 $55.23
Expanded ore production rate 2 million tonnes per year
Savings from:
Economies of Scale ~ $16.50
Crushing and Conveying ~ $6.00
Other (SAG mill etc.) ~ $3.50
Feasibility study cost/tonne at 2mtpy $29.40*
10
* Based on January 2010 NI 43-101 Technical report for the Chelopech Project. Exchange rate of US$1.35/Euro, US$800/oz Au, US$1.75/lb Cu and US$11/oz Ag.
913 901981
1,800
$0.00
$10.00
$20.00
$30.00
$40.00
$50.00
$60.00
0
200
400
600
800
1,000
1,200
1,400
1,600
1,800
2,000
2007 2008 2009 H2 2012
To
nn
es
ore
pro
ce
ss
ed
pe
r ye
ar
(000’s)
Ore Processed and Cost/Tonne
Co
st/to
nn
e($
US
)
(Ex
clu
din
g ro
ya
lties
)
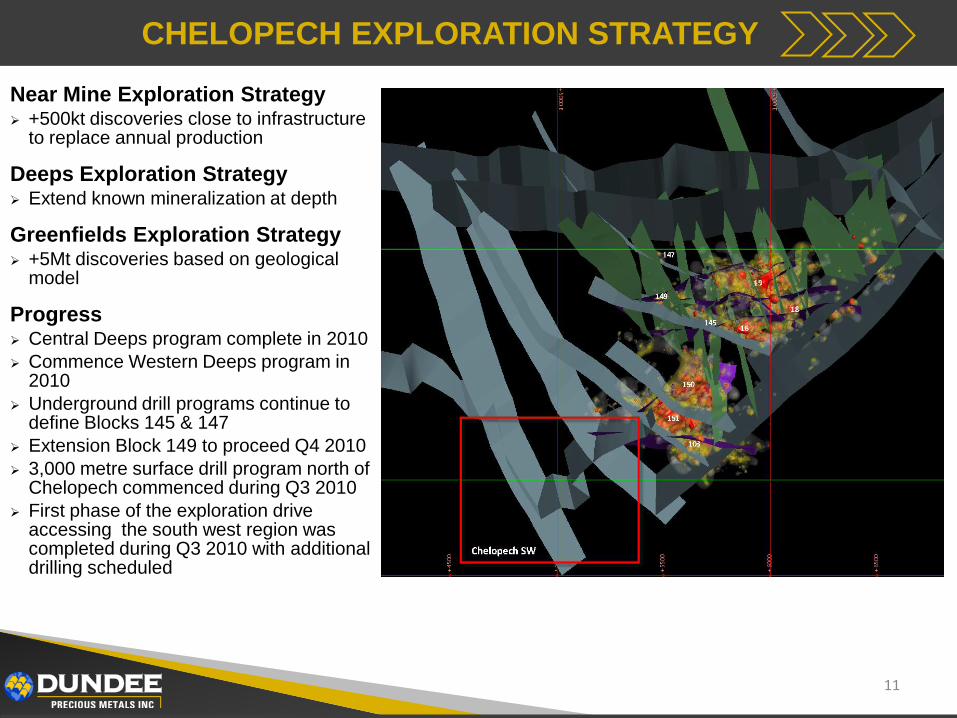
CHELOPECH EXPLORATION STRATEGY
Near Mine Exploration Strategy +500kt discoveries close to infrastructure
to replace annual production
Deeps Exploration Strategy Extend known mineralization at depth
Greenfields Exploration Strategy +5Mt discoveries based on geological
model
Progress Central Deeps program complete in 2010
Commence Western Deeps program in 2010
Underground drill programs continue to define Blocks 145 & 147
Extension Block 149 to proceed Q4 2010
3,000 metre surface drill program north of Chelopech commenced during Q3 2010
First phase of the exploration drive accessing the south west region was completed during Q3 2010 with additional drilling scheduled
11
Sever fan
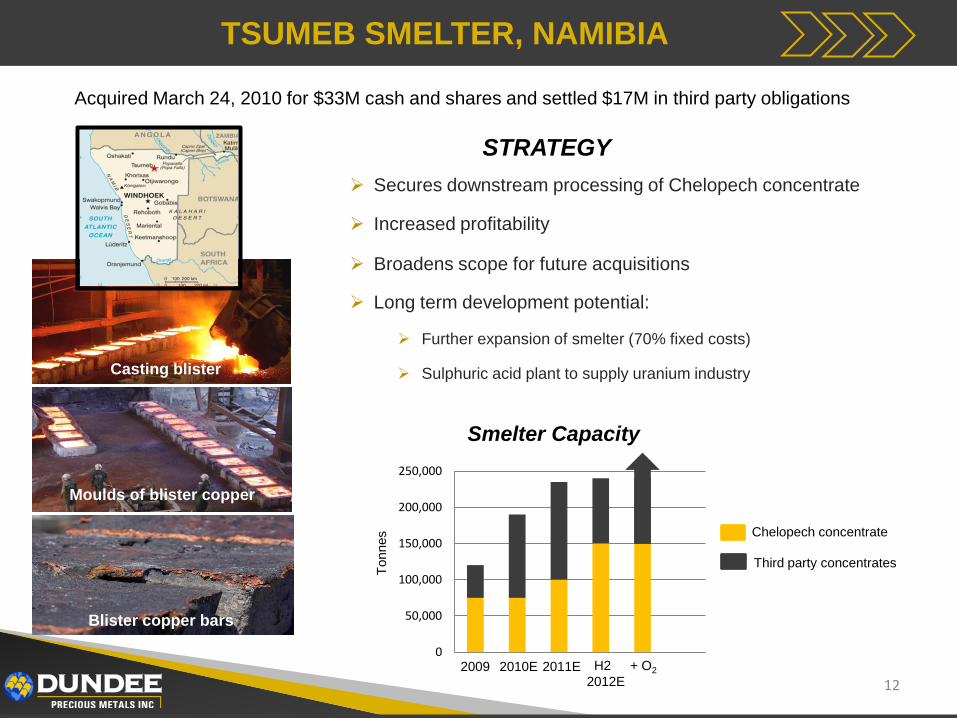
TSUMEB SMELTER, NAMIBIA
Smelter Capacity
12
Acquired March 24, 2010 for $33M cash and shares and settled $17M in third party obligations
0
50,000
100,000
150,000
200,000
250,000
2009 2011E2010E
Secures downstream processing of Chelopech concentrate
Increased profitability
Broadens scope for future acquisitions
Long term development potential:
Further expansion of smelter (70% fixed costs)
Sulphuric acid plant to supply uranium industry
STRATEGY
H2
2012E
+ O2
Chelopech concentrate
Third party concentrates
Tonnes
Blister copper bars
Moulds of blister copper
Casting blister
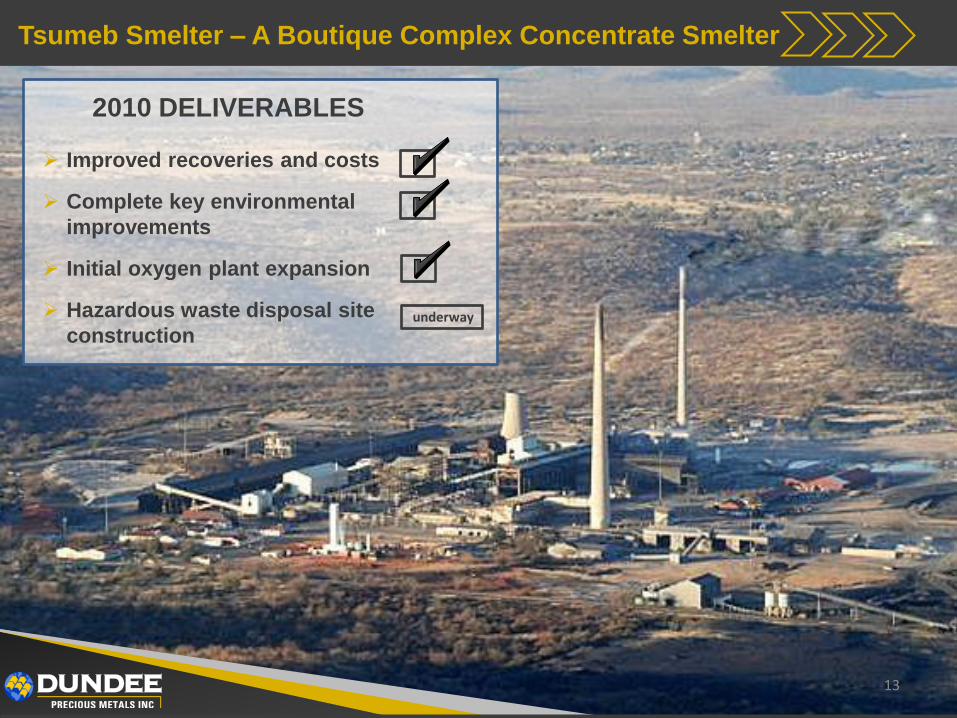
Tsumeb Smelter – A Boutique Complex Concentrate Smelter
13
Improved recoveries and costs
Complete key environmental
improvements
Initial oxygen plant expansion
Hazardous waste disposal site
construction
2010 DELIVERABLES
underway
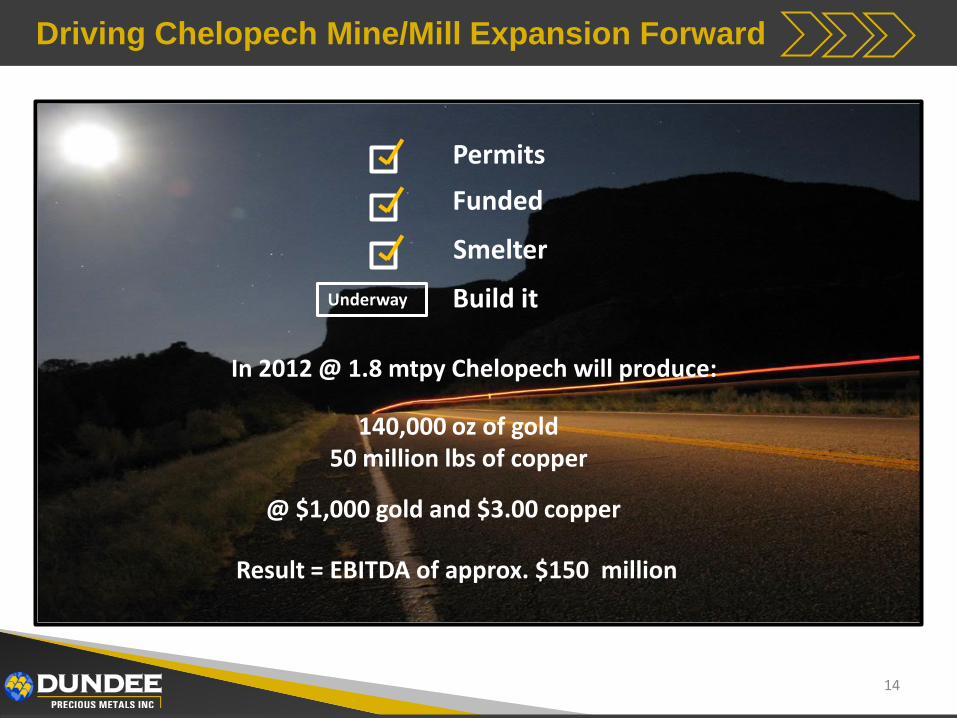
Driving Chelopech Mine/Mill Expansion Forward
In 2012 @ 1.8 mtpy Chelopech will produce:
140,000 oz of gold50 million lbs of copper
@ $1,000 gold and $3.00 copper
Result = EBITDA of approx. $150 million
Permits
Funded
Smelter
Build itUnderway
14
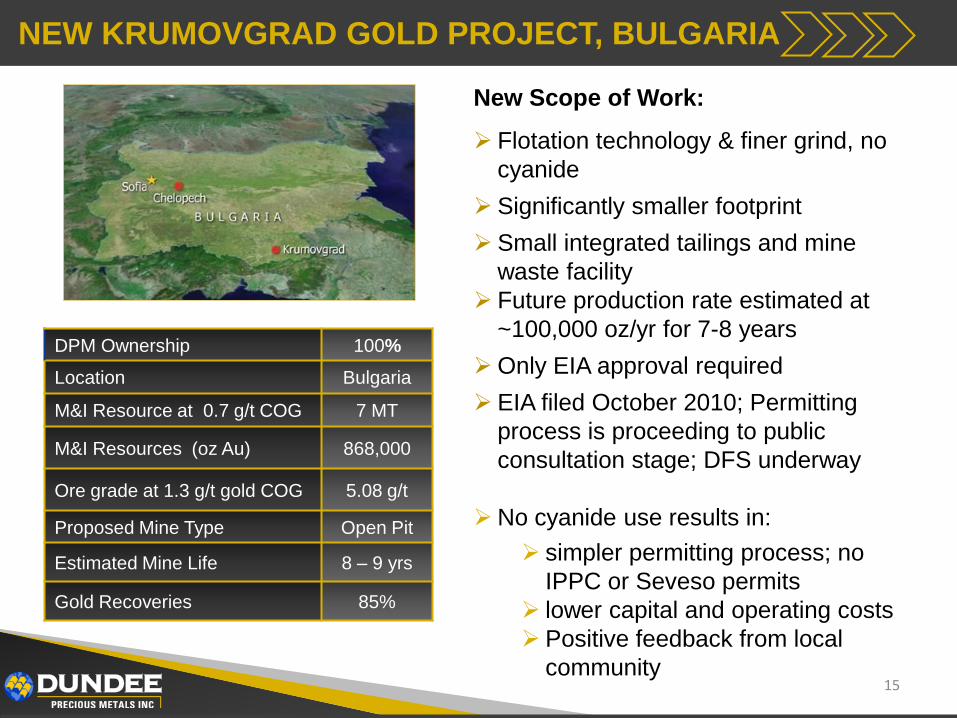
NEW KRUMOVGRAD GOLD PROJECT, BULGARIA
DPM Ownership 100%
Location Bulgaria
M&I Resource at 0.7 g/t COG 7 MT
M&I Resources (oz Au) 868,000
Ore grade at 1.3 g/t gold COG 5.08 g/t
Proposed Mine Type Open Pit
Estimated Mine Life 8 – 9 yrs
Gold Recoveries 85%
Flotation technology & finer grind, no
cyanide
Significantly smaller footprint
Small integrated tailings and mine
waste facility
Future production rate estimated at
~100,000 oz/yr for 7-8 years
Only EIA approval required
EIA filed October 2010; Permitting
process is proceeding to public
consultation stage; DFS underway
No cyanide use results in:
simpler permitting process; no
IPPC or Seveso permits
lower capital and operating costs
Positive feedback from local
community15
New Scope of Work:
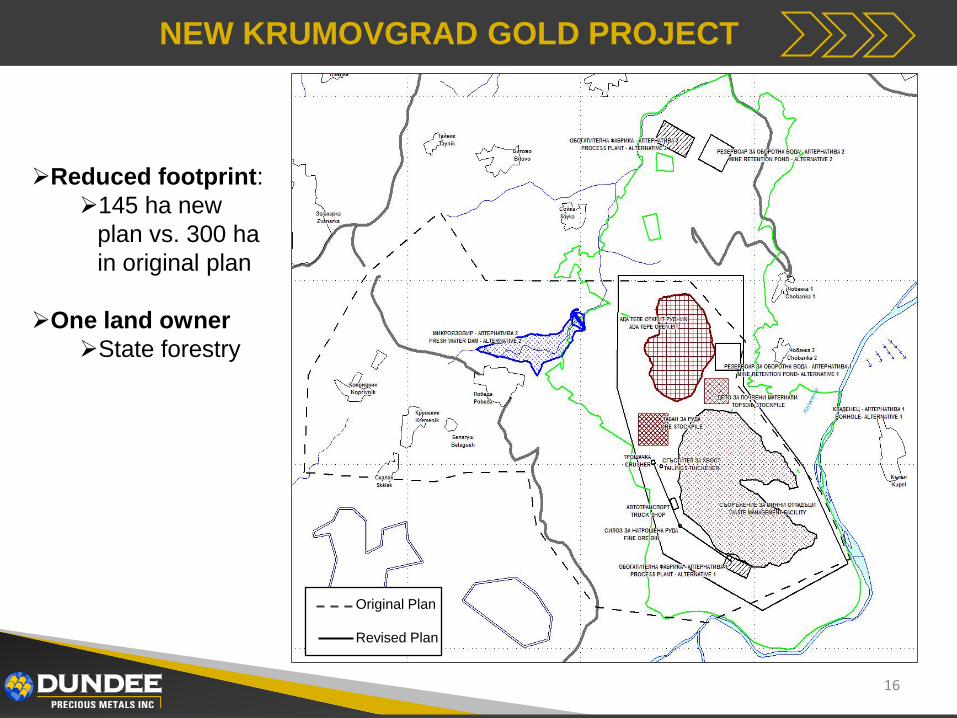
NEW KRUMOVGRAD GOLD PROJECT
Original Plan
Revised Plan
16
Reduced footprint:
145 ha new
plan vs. 300 ha
in original plan
One land owner
State forestry
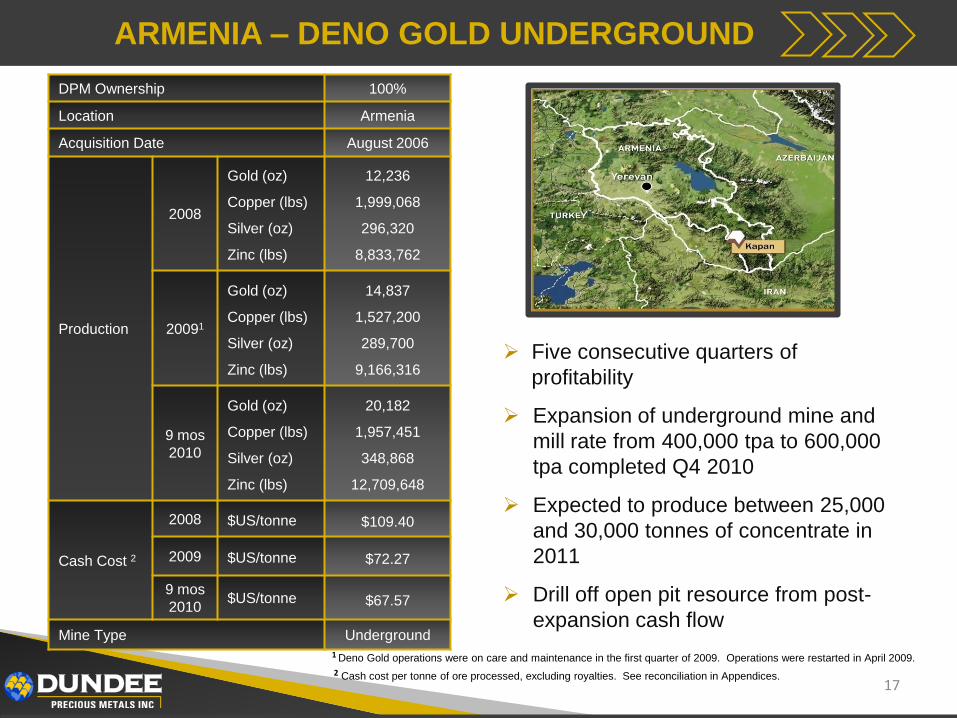
ARMENIA – DENO GOLD UNDERGROUND
Five consecutive quarters of
profitability
Expansion of underground mine and
mill rate from 400,000 tpa to 600,000
tpa completed Q4 2010
Expected to produce between 25,000
and 30,000 tonnes of concentrate in
2011
Drill off open pit resource from post-
expansion cash flow
DPM Ownership 100%
Location Armenia
Acquisition Date August 2006
Production
2008
Gold (oz)
Copper (lbs)
Silver (oz)
Zinc (lbs)
12,236
1,999,068
296,320
8,833,762
20091
Gold (oz)
Copper (lbs)
Silver (oz)
Zinc (lbs)
14,837
1,527,200
289,700
9,166,316
9 mos
2010
Gold (oz)
Copper (lbs)
Silver (oz)
Zinc (lbs)
20,182
1,957,451
348,868
12,709,648
Cash Cost 2
2008 $US/tonne $109.40
2009 $US/tonne $72.27
9 mos
2010$US/tonne $67.57
Mine Type Underground
2 Cash cost per tonne of ore processed, excluding royalties. See reconciliation in Appendices.17
1 Deno Gold operations were on care and maintenance in the first quarter of 2009. Operations were restarted in April 2009.
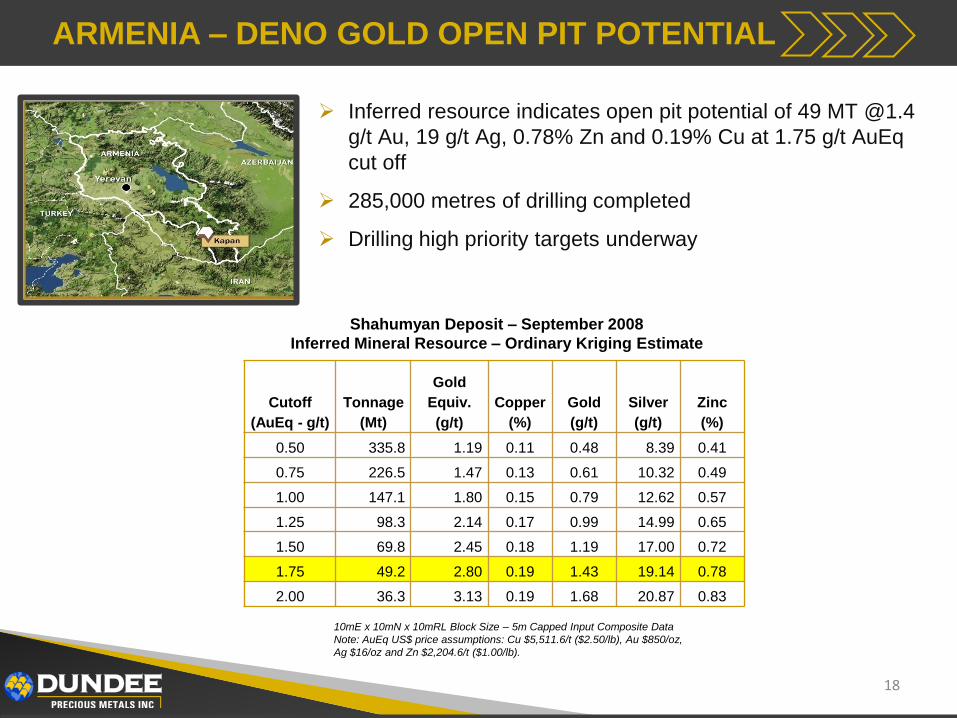
ARMENIA – DENO GOLD OPEN PIT POTENTIAL
Inferred resource indicates open pit potential of 49 MT @1.4
g/t Au, 19 g/t Ag, 0.78% Zn and 0.19% Cu at 1.75 g/t AuEq
cut off
285,000 metres of drilling completed
Drilling high priority targets underway
18
Cutoff
(AuEq - g/t)
Tonnage
(Mt)
Gold
Equiv.
(g/t)
Copper
(%)
Gold
(g/t)
Silver
(g/t)
Zinc
(%)
0.50 335.8 1.19 0.11 0.48 8.39 0.41
0.75 226.5 1.47 0.13 0.61 10.32 0.49
1.00 147.1 1.80 0.15 0.79 12.62 0.57
1.25 98.3 2.14 0.17 0.99 14.99 0.65
1.50 69.8 2.45 0.18 1.19 17.00 0.72
1.75 49.2 2.80 0.19 1.43 19.14 0.78
2.00 36.3 3.13 0.19 1.68 20.87 0.83
Shahumyan Deposit – September 2008
Inferred Mineral Resource – Ordinary Kriging Estimate
10mE x 10mN x 10mRL Block Size – 5m Capped Input Composite Data
Note: AuEq US$ price assumptions: Cu $5,511.6/t ($2.50/lb), Au $850/oz,
Ag $16/oz and Zn $2,204.6/t ($1.00/lb).
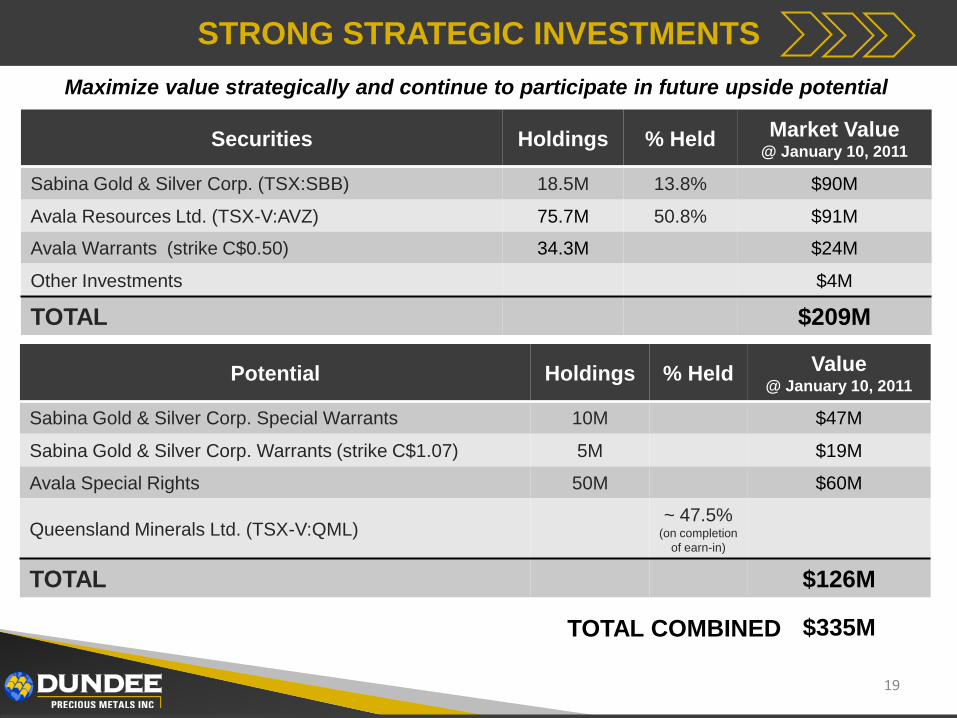
STRONG STRATEGIC INVESTMENTS
Securities Holdings % Held Market Value @ January 10, 2011
Sabina Gold & Silver Corp. (TSX:SBB) 18.5M 13.8% $90M
Avala Resources Ltd. (TSX-V:AVZ) 75.7M 50.8% $91M
Avala Warrants (strike C$0.50) 34.3M $24M
Other Investments $4M
TOTAL $209M
Maximize value strategically and continue to participate in future upside potential
19
Potential Holdings % Held Value @ January 10, 2011
Sabina Gold & Silver Corp. Special Warrants 10M $47M
Sabina Gold & Silver Corp. Warrants (strike C$1.07) 5M $19M
Avala Special Rights 50M $60M
Queensland Minerals Ltd. (TSX-V:QML)~ 47.5%
(on completion
of earn-in)
TOTAL $126M
TOTAL COMBINED $335M
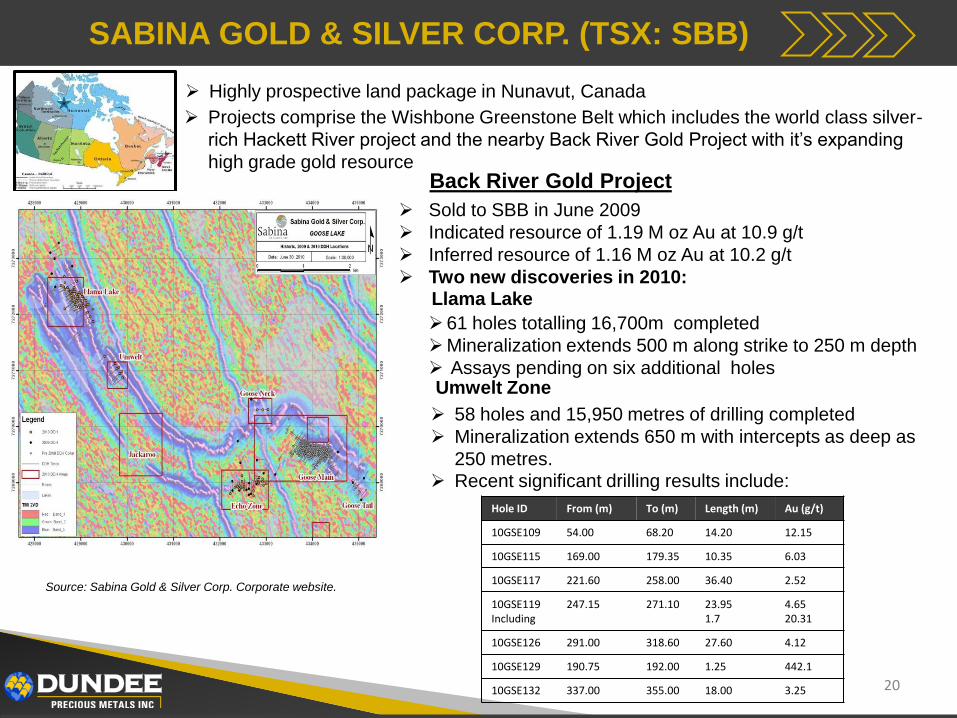
SABINA GOLD & SILVER CORP. (TSX: SBB)
20
Source: Sabina Gold & Silver Corp. Corporate website.
Highly prospective land package in Nunavut, Canada
Projects comprise the Wishbone Greenstone Belt which includes the world class silver-
rich Hackett River project and the nearby Back River Gold Project with it‟s expanding
high grade gold resource
Sold to SBB in June 2009
Indicated resource of 1.19 M oz Au at 10.9 g/t
Inferred resource of 1.16 M oz Au at 10.2 g/t
Two new discoveries in 2010:
Back River Gold Project
61 holes totalling 16,700m completed
Mineralization extends 500 m along strike to 250 m depth
Assays pending on six additional holes
58 holes and 15,950 metres of drilling completed
Mineralization extends 650 m with intercepts as deep as
250 metres. Recent significant drilling results include:
Llama Lake
Umwelt Zone
Hole ID From (m) To (m) Length (m) Au (g/t)
10GSE109 54.00 68.20 14.20 12.15
10GSE115 169.00 179.35 10.35 6.03
10GSE117 221.60 258.00 36.40 2.52
10GSE119Including
247.15 271.10 23.951.7
4.6520.31
10GSE126 291.00 318.60 27.60 4.12
10GSE129 190.75 192.00 1.25 442.1
10GSE132 337.00 355.00 18.00 3.25
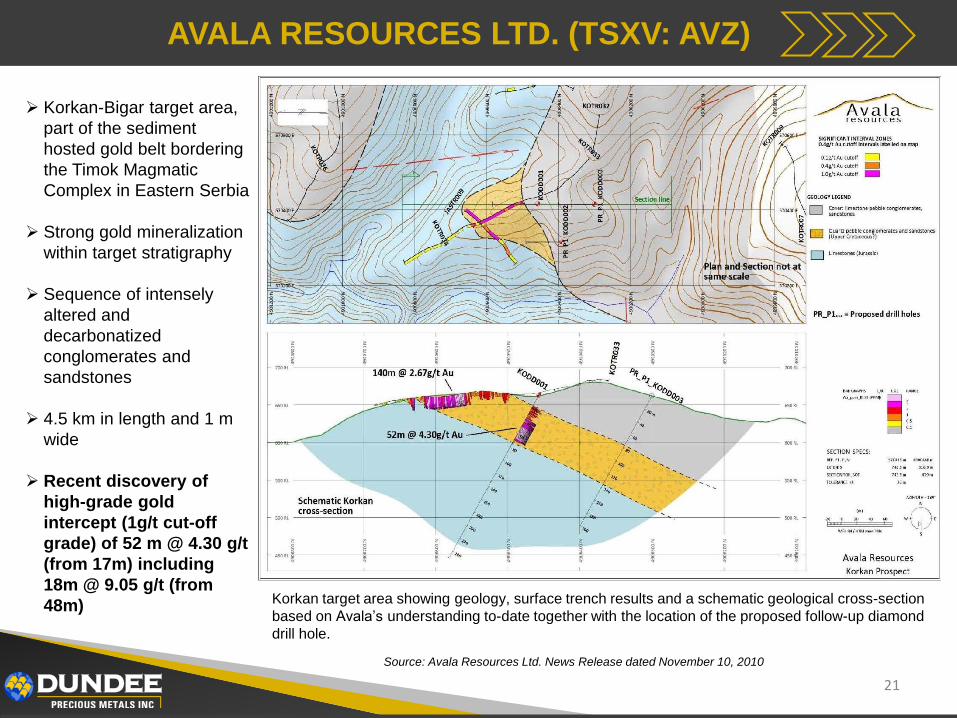
AVALA RESOURCES LTD. (TSXV: AVZ)
21
Korkan target area showing geology, surface trench results and a schematic geological cross-section
based on Avala‟s understanding to-date together with the location of the proposed follow-up diamond
drill hole.
Korkan-Bigar target area,
part of the sediment
hosted gold belt bordering
the Timok Magmatic
Complex in Eastern Serbia
Strong gold mineralization
within target stratigraphy
Sequence of intensely
altered and
decarbonatized
conglomerates and
sandstones
4.5 km in length and 1 m
wide
Recent discovery of
high-grade gold
intercept (1g/t cut-off
grade) of 52 m @ 4.30 g/t
(from 17m) including
18m @ 9.05 g/t (from
48m)
Source: Avala Resources Ltd. News Release dated November 10, 2010
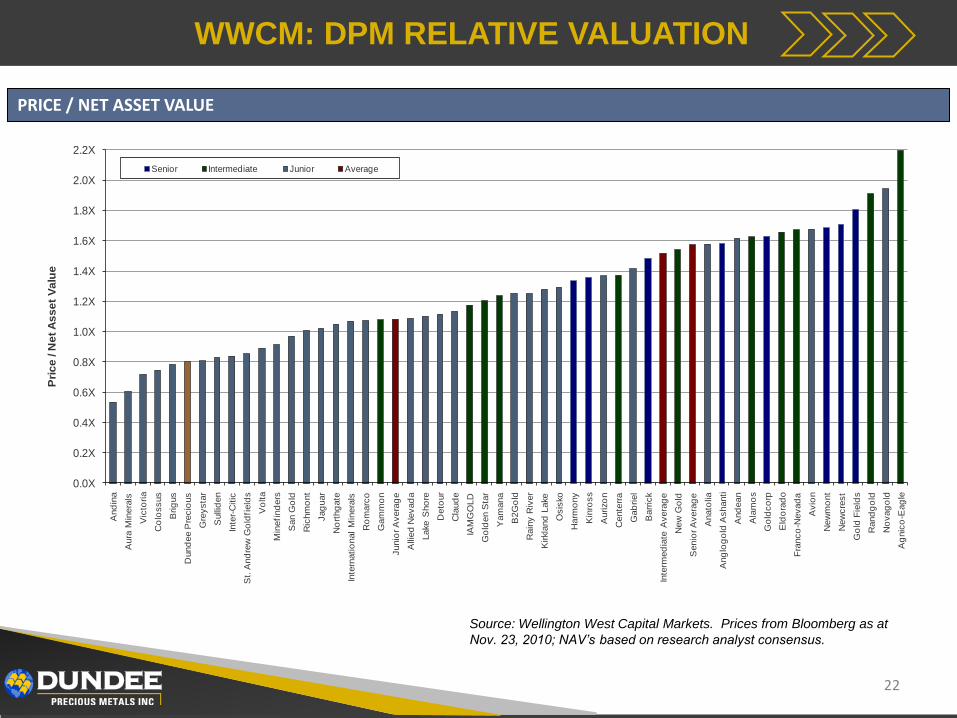
WWCM: DPM RELATIVE VALUATION
22
Source: Wellington West Capital Markets. Prices from Bloomberg as at
Nov. 23, 2010; NAV’s based on research analyst consensus.
PRICE / NET ASSET VALUE
0.0X
0.2X
0.4X
0.6X
0.8X
1.0X
1.2X
1.4X
1.6X
1.8X
2.0X
2.2X
And
ina
Aura
Min
era
ls
Vic
toria
Co
lossus
Brig
us
Dund
ee P
recio
us
Gre
ysta
r
Sullid
en
Inte
r-C
itic
St.
And
rew
Go
ldfi
eld
s
Vo
lta
Min
efi
nd
ers
San G
old
Ric
hm
ont
Jag
uar
No
rthg
ate
Inte
rnatio
nal
Min
era
ls
Ro
marc
o
Gam
mo
n
Junio
r A
vera
ge
Allie
d N
evad
a
Lake S
ho
re
Deto
ur
Cla
ud
e
IAM
GO
LD
Go
lden S
tar
Yam
ana
B2G
old
Rain
y R
iver
Kirkla
nd
Lake
Osis
ko
Harm
ony
Kin
ross
Aurizo
n
Cente
rra
Gab
riel
Barr
ick
Inte
rmed
iate
Avera
ge
New
Go
ld
Senio
r A
vera
ge
Anato
lia
Ang
log
old
Ashanti
And
ean
Ala
mo
s
Go
ldco
rp
Eld
ora
do
Fra
nco
-Nevad
a
Avio
n
New
mo
nt
New
cre
st
Go
ld F
ield
s
Rand
go
ld
No
vag
old
Ag
nic
o-E
ag
le
Pri
ce
/ N
et
As
se
t V
alu
e
Senior Intermediate Junior Average
INVEST IN DPM
Strong Balance Sheet
Valuable Assets
Robust Growth
Committed Management Team
Highly Undervalued
23
APPENDICES
ADDITIONAL INFORMATION
24
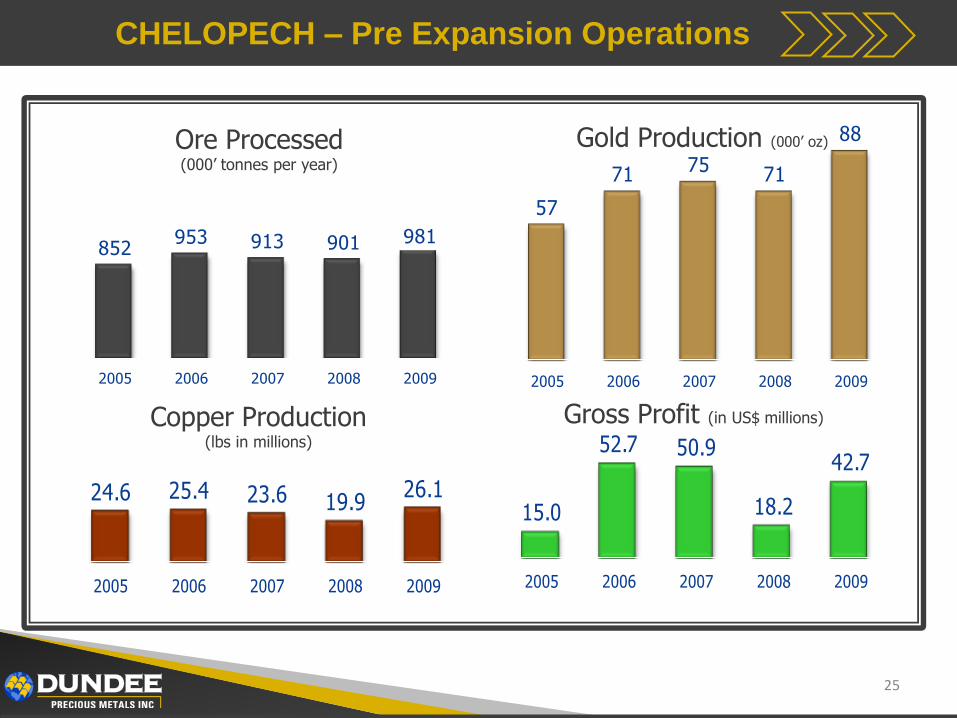
CHELOPECH – Pre Expansion Operations
25
852953 913 901 981
2005 2006 2007 2008 2009
57
71 75 71
88
2005 2006 2007 2008 2009
24.6 25.4 23.6 19.926.1
2005 2006 2007 2008 2009
Ore Processed(000’ tonnes per year)
Gold Production (000’ oz)
15.0
52.7 50.9
18.2
42.7
2005 2006 2007 2008 2009
Gross Profit (in US$ millions)Copper Production(lbs in millions)
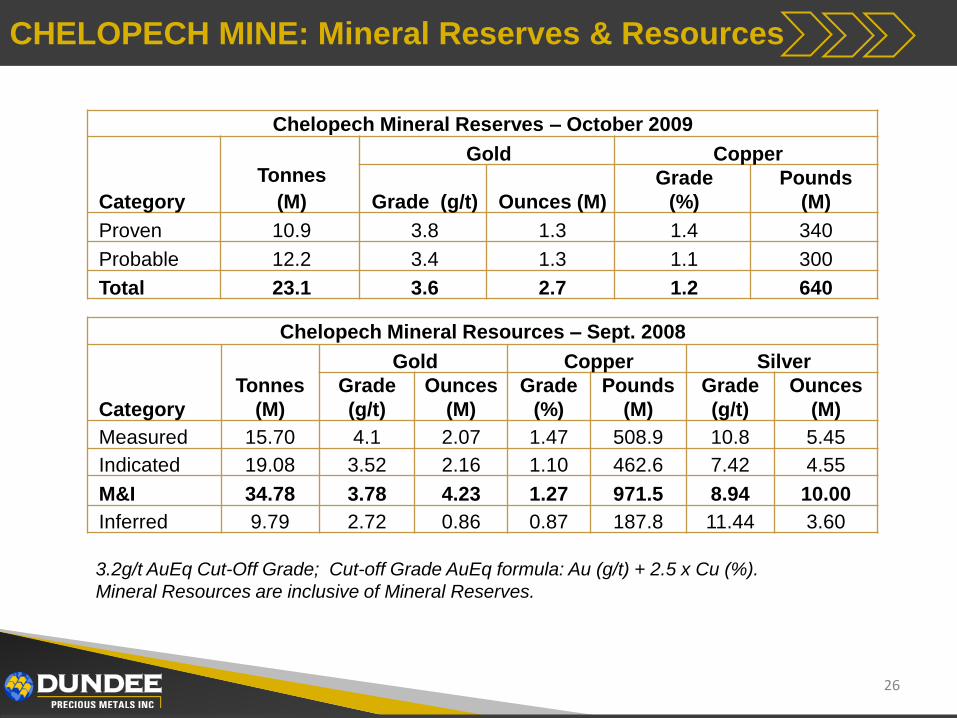
CHELOPECH MINE: Mineral Reserves & Resources
Chelopech Mineral Reserves – October 2009
Category
Tonnes
(M)
Gold Copper
Grade (g/t) Ounces (M)
Grade
(%)
Pounds
(M)
Proven 10.9 3.8 1.3 1.4 340
Probable 12.2 3.4 1.3 1.1 300
Total 23.1 3.6 2.7 1.2 640
Chelopech Mineral Resources – Sept. 2008
Category
Tonnes
(M)
Gold Copper Silver
Grade
(g/t)
Ounces
(M)
Grade
(%)
Pounds
(M)
Grade
(g/t)
Ounces
(M)
Measured 15.70 4.1 2.07 1.47 508.9 10.8 5.45
Indicated 19.08 3.52 2.16 1.10 462.6 7.42 4.55
M&I 34.78 3.78 4.23 1.27 971.5 8.94 10.00
Inferred 9.79 2.72 0.86 0.87 187.8 11.44 3.60
3.2g/t AuEq Cut-Off Grade; Cut-off Grade AuEq formula: Au (g/t) + 2.5 x Cu (%).
Mineral Resources are inclusive of Mineral Reserves.
26
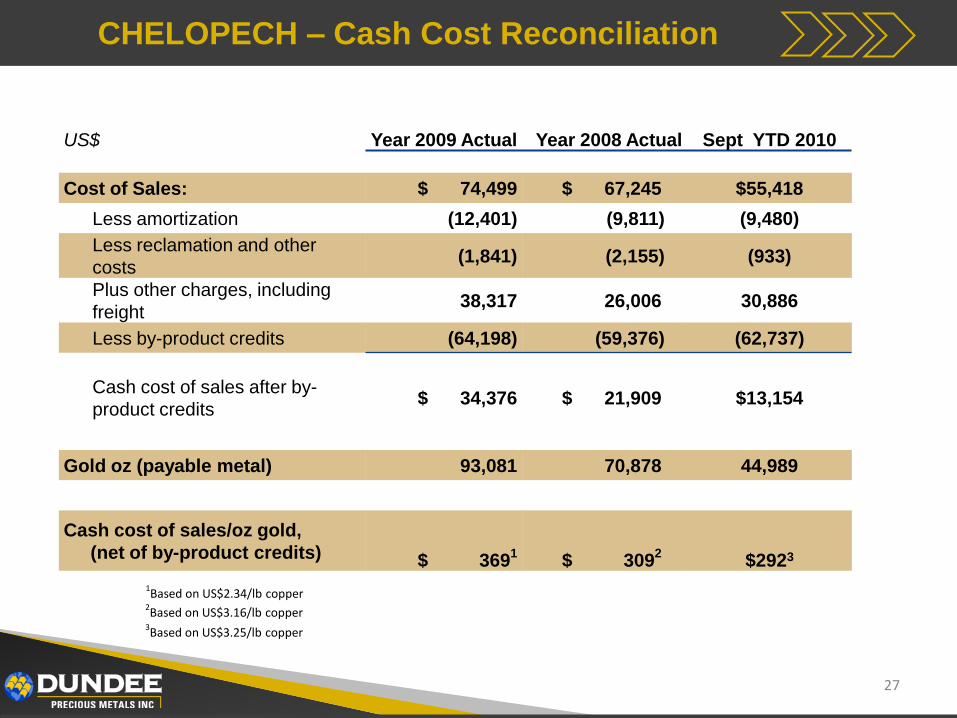
CHELOPECH – Cash Cost Reconciliation
US$ Year 2009 Actual Year 2008 Actual Sept YTD 2010
Cost of Sales: $ 74,499 $ 67,245 $55,418
Less amortization (12,401) (9,811) (9,480)
Less reclamation and other
costs(1,841) (2,155) (933)
Plus other charges, including
freight38,317 26,006 30,886
Less by-product credits (64,198) (59,376) (62,737)
Cash cost of sales after by-
product credits$ 34,376 $ 21,909 $13,154
Gold oz (payable metal) 93,081 70,878 44,989
Cash cost of sales/oz gold,
(net of by-product credits) $ 3691
$ 3092
$2923
1Based on US$2.34/lb copper
2Based on US$3.16/lb copper
27
3Based on US$3.25/lb copper
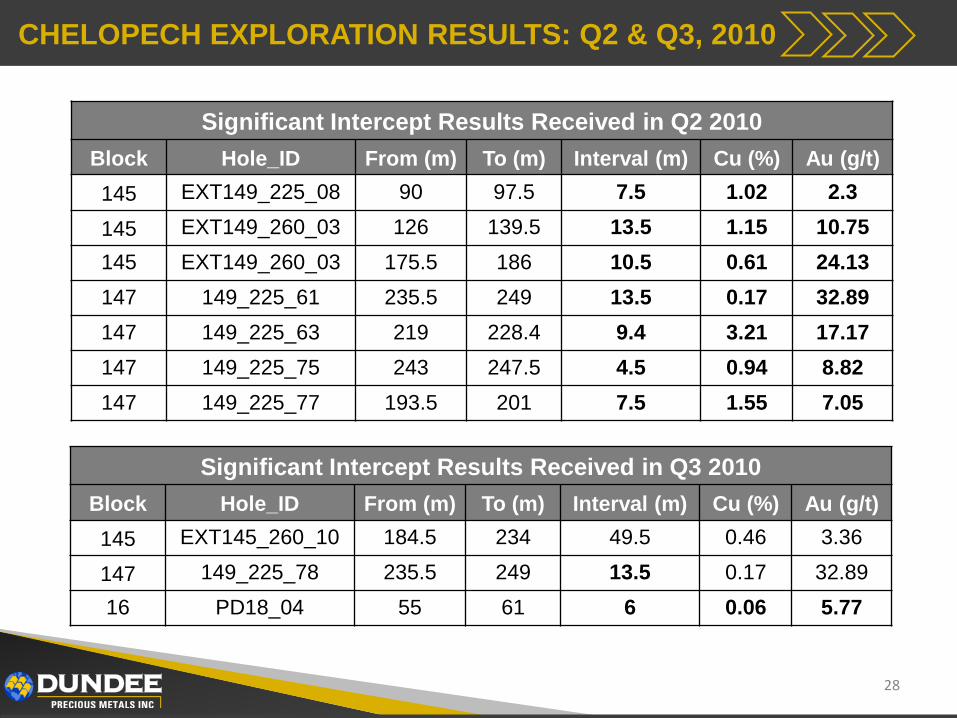
CHELOPECH EXPLORATION RESULTS: Q2 & Q3, 2010
Significant Intercept Results Received in Q3 2010
Block Hole_ID From (m) To (m) Interval (m) Cu (%) Au (g/t)
145 EXT145_260_10 184.5 234 49.5 0.46 3.36
147 149_225_78 235.5 249 13.5 0.17 32.89
16 PD18_04 55 61 6 0.06 5.77
28
Significant Intercept Results Received in Q2 2010
Block Hole_ID From (m) To (m) Interval (m) Cu (%) Au (g/t)
145 EXT149_225_08 90 97.5 7.5 1.02 2.3
145 EXT149_260_03 126 139.5 13.5 1.15 10.75
145 EXT149_260_03 175.5 186 10.5 0.61 24.13
147 149_225_61 235.5 249 13.5 0.17 32.89
147 149_225_63 219 228.4 9.4 3.21 17.17
147 149_225_75 243 247.5 4.5 0.94 8.82
147 149_225_77 193.5 201 7.5 1.55 7.05
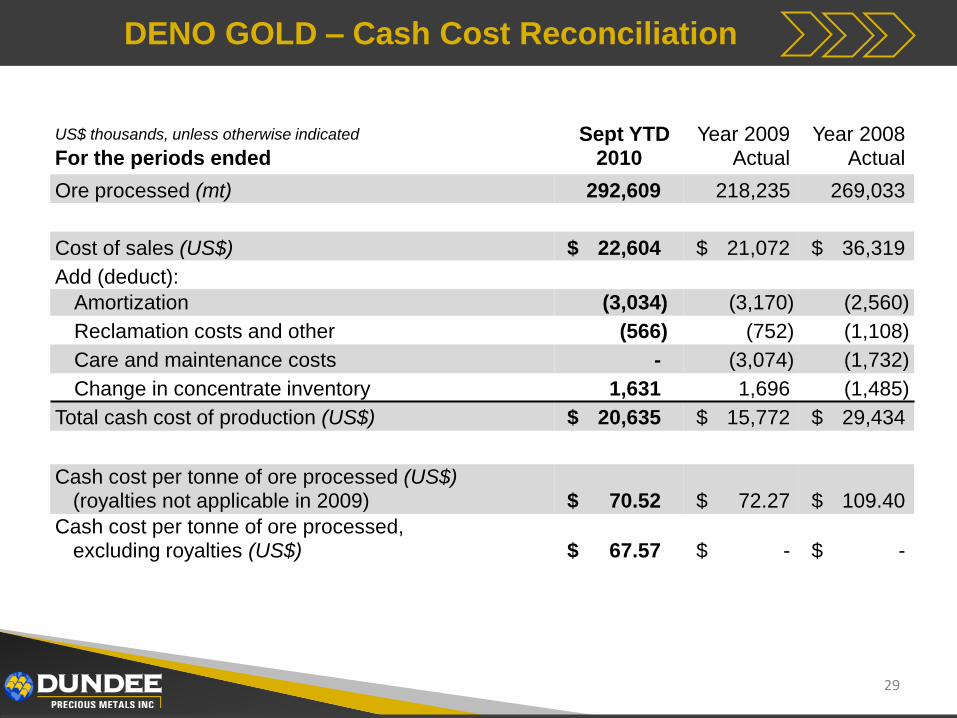
DENO GOLD – Cash Cost Reconciliation
29
US$ thousands, unless otherwise indicated
For the periods endedSept YTD
2010Year 2009
ActualYear 2008
Actual
Ore processed (mt) 292,609 218,235 269,033
Cost of sales (US$) $ 22,604 $ 21,072 $ 36,319
Add (deduct):
Amortization (3,034) (3,170) (2,560)
Reclamation costs and other (566) (752) (1,108)
Care and maintenance costs - (3,074) (1,732)
Change in concentrate inventory 1,631 1,696 (1,485)
Total cash cost of production (US$) $ 20,635 $ 15,772 $ 29,434
Cash cost per tonne of ore processed (US$)(royalties not applicable in 2009) $ 70.52 $ 72.27 $ 109.40
Cash cost per tonne of ore processed, excluding royalties (US$) $ 67.57 $ - $ -
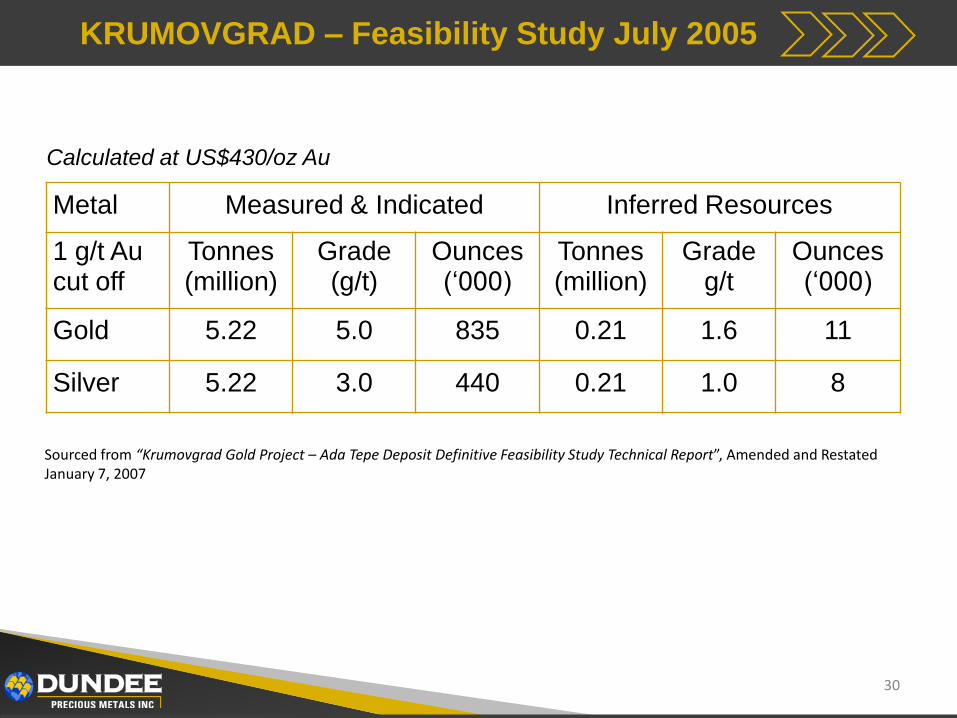
KRUMOVGRAD – Feasibility Study July 2005
Calculated at US$430/oz Au
Metal Measured & Indicated Inferred Resources
1 g/t Aucut off
Tonnes(million)
Grade(g/t)
Ounces(„000)
Tonnes(million)
Gradeg/t
Ounces(„000)
Gold 5.22 5.0 835 0.21 1.6 11
Silver 5.22 3.0 440 0.21 1.0 8
30
Sourced from “Krumovgrad Gold Project – Ada Tepe Deposit Definitive Feasibility Study Technical Report”, Amended and Restated January 7, 2007