Embed Size (px)
Citation preview

Corporate Presentation1Q18 Results

Sergio MalacridaCFO Votorantim S.A.

Osvaldo Ayres CFO Votorantim Cimentos

90% OF ANNUAL POWER CONSUMPTION TO BE GENERATED BY WIND
FARM
OPERATIONAL RESULTS
LIABILITY MANAGEMENT
ARGENTINA EXPANSION
WIND FARM MOROCCO
JUNTOS SOMOS +
1Q18 Highlights
ADJ. EBITDA 1Q18R$235 MILLION
+ 28%
GROSS DEBT REDUCTION AND
LOWER COSTS
STARTUP OF OLAVARRIA EXPANSION
4
PARTNERSHIP WITH
GERDAU AND TIGRE

Net Revenues(1) Adjusted EBITDA
2,205175
(16)
78 14 2,456
183 235 53
(38)
30 7
+13% -4% +20% +15% 84% N.A. 32% 46%
Margin % 8 101Q17 1Q18
1Q18 Consolidated Result
R$ million
Volume (Mt)
(1) VCBR numbers include eliminations
6.7 7.0
1Q17 1Q18
+28%+5% +11%
5
1Q18
1Q17
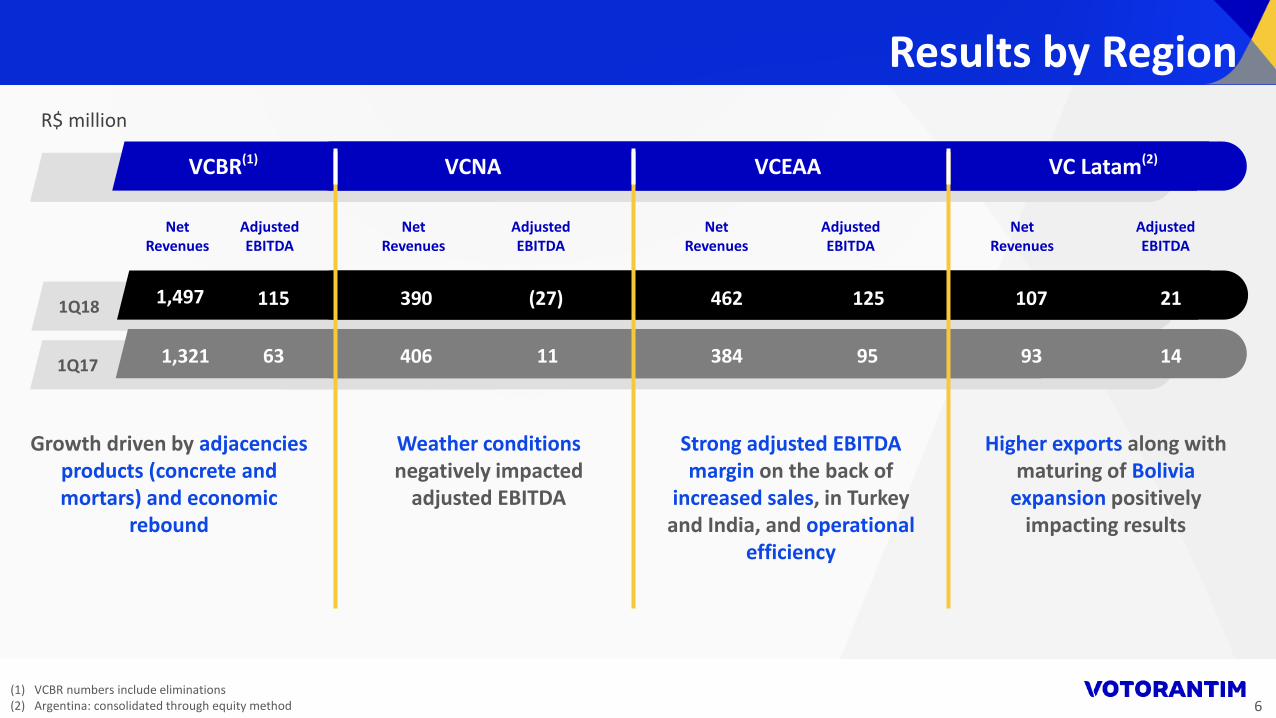
Growth driven by adjacencies products (concrete and mortars) and economic
rebound
Weather conditions negatively impacted
adjusted EBITDA
Strong adjusted EBITDA margin on the back of
increased sales, in Turkey and India, and operational
efficiency
Higher exports along with maturing of Bolivia
expansion positively impacting results
VCBR(1) VCNA VC Latam(2)VCEAA
Net Revenues
1,321
1,497
AdjustedEBITDA
63
115
Net Revenues
406
390
AdjustedEBITDA
11
(27)
Net Revenues
384
462
AdjustedEBITDA
95
125
Net Revenues
93
107
AdjustedEBITDA
14
21
Results by Region
R$ million
(1) VCBR numbers include eliminations(2) Argentina: consolidated through equity method 6

235
(741) (45)(184) (735)
83
(198) (49) (18) (918)
(1)
Capex 35% decrease YoYMoving towards the end of investment
cycle.
Working capitalHighly impacted by businesses seasonality,
specially at VCNA
Cash GenerationR$ million
(1) Others: items that do not represent changes in cash
150 133
13651
1Q17 1Q18
Expansion Non expansion
285
184
Capex
-35%
Financial resultsReduced financial expenses due to gross
debt reduction along with lower costs and interest rates in Brazil
Free Cash Flow 1Q18
7
AdjustedEBITDA
Workingcapital/Others
Incometaxes
Capex CFOInvestments/Divestments
Financialresult
Derivativeslinked to debtprepayment
FX effecton cash
FCF

4.97x
5.76x 5.71x6.10x
5.12x
11.8 12.5 12.3 12.0
9.010.0
4Q16 1Q17 2Q17 3Q17 4Q17 1Q18
Despite higher LTM adjusted EBITDA, leverage negatively impacted by businesses seasonality in
1Q18
Ongoing Liability ManagementR$950 million gross debt reduction in 1Q18 Pro Forma(4) combined with financial expenses reduction
and extended amortization schedule
Net Debt(1)(2)
R$ billion
Liquidity Position and Debt Amortization Profile
(1) Net debt includes MTM from 4131 loans (2) 2017 ratios of 1Q, 2Q and 3Q restated considering assets sales (Florida and China)(3) VCSA revolving credit facility of US$700 million due in 2020. In addition, does not consider VCNA revolving facility of US$230 million due in 2020(4) Considers R$350 million of Debentures and R$113 million of BNDES prepaid under subsequent events(5) Considers ~R$450 million ongoing debt prepayment allocated on current liabilities 8
Debt Amortization Schedule (Pro Forma)(4)
Revolving Credit Facilities(3) Cash BRL (19%) Foreign Currencies (81%)
5.53x Average debt maturity: ~10.6 yearsCash position covers ~ 3.1 years of debt amortization
2.6
2.3
2018 2019 2020 2021 2022 2023 2024 2025 2026 2027 ... 2041
0.40.6
1.2
1.6 1.6
0.60.1
1.7
0.0
3.8
1.1
(5)
Net Debt / Adjusted EBITDA
Luciano Alves CFO CBA

61 77
23
22
1Q17 1Q18
220
104
140
314
107
171
US Midwest Japan Europe
Upstream
19% total sales volume increase. Focus on sales profitability in strategic
markets.
US tariffs led to uncertainties regarding global commercial trade flow and increased volatility on LME prices and US Midwest premium.
Market Fundamentals
Dowstream
5,815 7,005R$/ton
US$/ton
+19%
+20%
Market and Sales
Aluminum Sales Volume (ktons)
(1) Average of the daily settlement prices, as traded on the London Metal Exchange (LME)(2) US Midwest premium – Platts / Japan Premium – Platts / European Rotterdam Aluminum Ingot Premium Duty Paid – Harbor Aluminum
+17%
1,850
2,159
1Q17 1Q18
84
100
LME Price(1) Regional Ingot Premiums (US$/ton)(2)
1Q17 1Q18
+42%
+3%
+22%
10

Results benefited by higher all-in aluminum prices, improved operational efficiency, sales profitability and accruals reversal.1Q17 energy results negatively affected by the return of energy auctioned in 2014.
Adjusted EBITDA
Energy
Aluminum
Nickel
+11%+66%
Operational Results
Net Revenues(1)
(1) Considers participation in BAESA and ENERCAN.
Margin(%) 18 25
1Q17 1Q18
R$ million
754 913
331
274 3
16 1,0881,203
1Q17 1Q18
CBA Consolidated(1) Aluminum
11
60
92
125 (37)240
1Q17 Aluminum Energy Nickel 1Q18
139
231
1Q17 1Q18
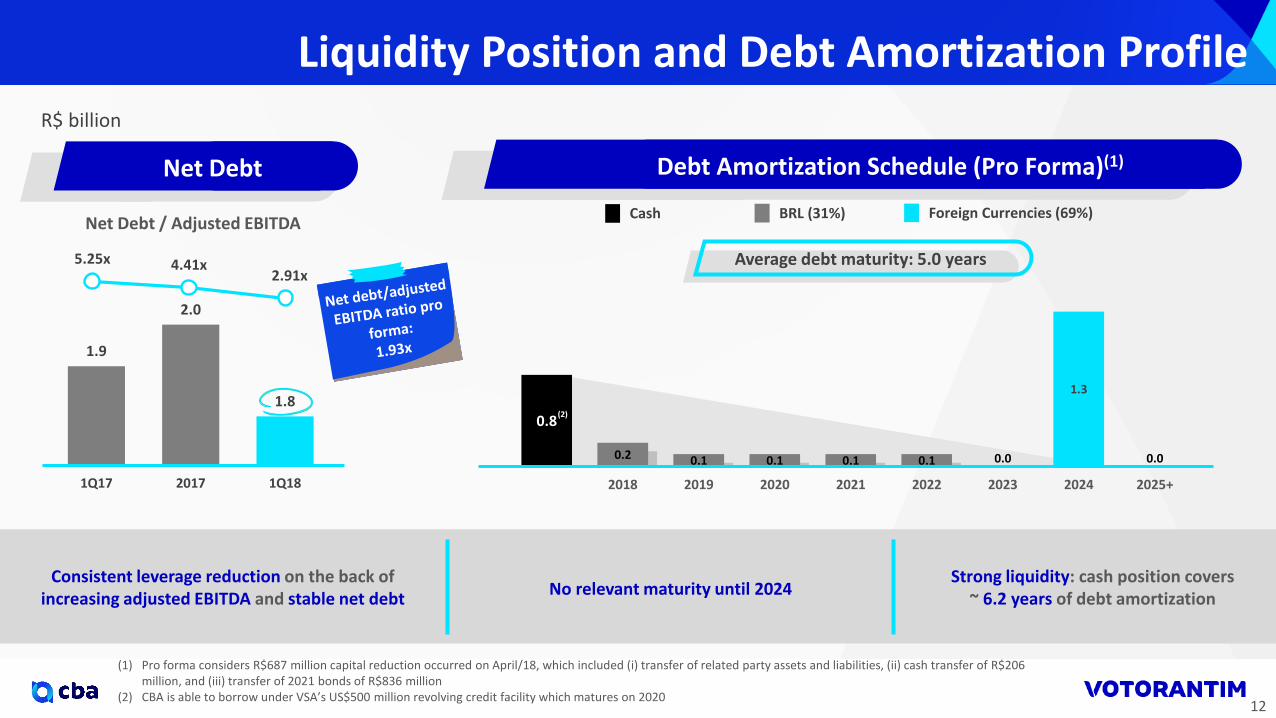
1.9
2.0
1.8
1Q17 2017 1Q18
5.25x 4.41x2.91x
Debt Amortization Schedule (Pro Forma)(1)
No relevant maturity until 2024Consistent leverage reduction on the back of
increasing adjusted EBITDA and stable net debtStrong liquidity: cash position covers
~ 6.2 years of debt amortization
Net Debt
R$ billion
Liquidity Position and Debt Amortization Profile
Cash BRL (31%) Foreign Currencies (69%)
(1) Pro forma considers R$687 million capital reduction occurred on April/18, which included (i) transfer of related party assets and liabilities, (ii) cash transfer of R$206 million, and (iii) transfer of 2021 bonds of R$836 million
(2) CBA is able to borrow under VSA’s US$500 million revolving credit facility which matures on 2020
Net Debt / Adjusted EBITDA
12
Average debt maturity: 5.0 years
0.8
0.2 0.1 0.1 0.1 0.1 0.0 0.0
1.3
2018 2019 2020 2021 2022 2023 2024 2025+
(2)

Raul Cadena CFO Votorantim Energia

Operational Performance and Sales
Power Generation
103
1Q17 1Q18
Sales Volume (MWavg)
49
60
106
1Q17 1Q18
Generation
Installed capacity [MW]
Assured energy
206
Capacity factor 24%
Energy Trading
Sales Volume (MWavg)
156
196
1Q17 1Q18
Spot Price(2) (R$/MWh)
(1) Average contract price(2) Average energy price in the Southeast and Midwest regions in Brazil (PLD), according to CCEE
754 700
1Q17 1Q18
1,9801,845
VotorantimCompanies
Market
+26%
244
1Q17 1Q18
Price(1) (R$/MWh)Generation (MWavg)
-7%
14
Energy trading – sales volume impacted by decrease insales to industrial customers and distribution companies
Generation – low energy generation below assured energydue to weak wind season during 1Q18
Expected generation
38%
62%
38%
62%1,226 1,145

(1) Includes eliminations, holding and service results.(2) Adjusted EBITDA excluding the non-cash effect of mark-to-market of energy contracts.
Energy Results
Net Revenues Adjusted EBITDA ex-MtM(2)
(50)
31
26
1 8
40
26
(18)
1 49
R$ million
Energy trading – operational results decreased due tolower sales volume and adjusted EBITDA reflects
the non-cash effect of mark-to-market
Generation – Ventos do Piauí I fully operationalbrings additional results to net revenues and adjusted EBITDA
+22%
87057 21
(37)
910
1Q17 Geração Comercialização Outros 1Q18
1Q17 Energytrading
Generation Others(1)
+5%
1Q18
Adjusted EBITDA
1Q17 Energytrading
Generation Others(1) 1Q18 1Q17 Energytrading
Generation Others(1) 1Q18
15

Sergio MalacridaCFO Votorantim S.A.

34%
30%
17%
13%
6%
5,662 251 555 115 40 53 109 6,785
1Q17 VotorantimCimentos
Nexa CBA VotoratimEnergia
LongSteel
Others 1Q18
Evolution by Business
Votorantim Cimentos
Nexa
CBA
LongSteel
Votorantim Energia
Breakdown by Business
+20%
(1) Includes Argentina and Colombia(2) Holding, eliminations and others
Consolidated Net Revenues
R$ million
(1) (2)
17

20%
54%
21%
4%1%
Higher sales volume of cement operations Higher metal prices in LME
+87%
Votorantim Cimentos
Nexa
CBA
LongSteel
Consolidated Adjusted EBITDA
R$ million
Evolution by Business Breakdown by Business
VotorantimEnergia
(1) (2)
(1) Includes Argentina and Colombia(2) Holding, eliminations and others
Margin % 11 171Q17 1Q18
18
609 52
193
180 58 1 47 1,140
1Q17 VotorantimCimentos
Nexa CBA VotorantimEnergia
LongSteel
Others 1Q18
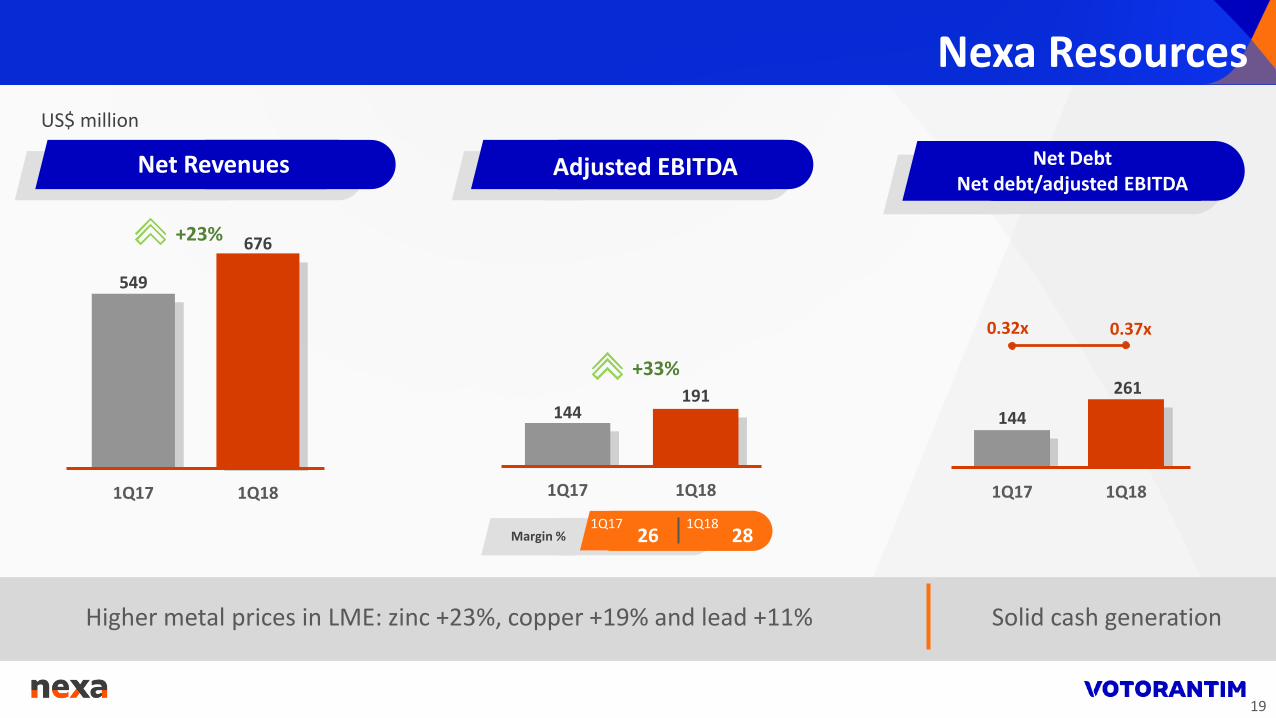
Adjusted EBITDA Net DebtNet debt/adjusted EBITDA
+23%
+33%
Nexa Resources
Net Revenues
Solid cash generationHigher metal prices in LME: zinc +23%, copper +19% and lead +11%
US$ million
Margin % 26 281Q17 1Q18
19
0.32x 0.37x
144
261
1Q17 1Q18
144191
1Q17 1Q18
549
676
1Q17 1Q18

Colombia: market recovery resulting in higher pricesArgentina: higher sales volume and prices, driven by the continuous recovery in the economic scenario
Long Steel – Argentina and Colombia
Net RevenuesVolume (kton) Adjusted EBITDA
Margin % 12 111Q17 1Q18
R$ million
20
+15%
+2%
446
(5)
45
1Q17 Argentina Colombia 1Q18
363 3122 416
1Q17 Argentina Colombia 1Q18
160 155
1Q17 1Q18
-3%

+183%
+101%
(1) Calculation excludes pulp sales from agreement with Klabin
Other Investee Companies
Margin (1) 37 55% %
Adjusted EBITDA(R$ million)
Net Debt (R$ million)Net Debt/Adj. EBITDA
(US$ million) Adjusted EBITDA
(US$ million)
Net DebtNet Debt/Adj. EBITDA
(US$ million)Net Income(R$ million)
ConsolidatedDelinquency
Margin 19 11% %
21
-40%
4.5%3.9%
Mar/17 Mar/18
127
255
1Q17 1Q18
70
42
1Q17 1Q18
3.79x
2.02x
11,36612,774
1Q17 1Q18
644
1,824
1Q17 1Q18
1.63x 2.08x
208
614
Mar/17 Mar/18

(546)
532
251 89
(159) (17)
150
1Q17Operating
results
Result fromequity
investmentsFinancialresults
Income taxand others
Discontinuedoperations 1Q18
Operating results positively impacted mainly by improved metals prices
Better results from Fibria and Banco Votorantim
Consolidated Net Income
R$ million
22

35%
65%
35%
23%
41%
-39%570
345
1Q17 1Q18VotorantimCimentos
Nexa
VotorantimEnergia
Expansion Non Expansion
1Q18 Investments
BreakdownCapex Expansion Capex
R$ million
23
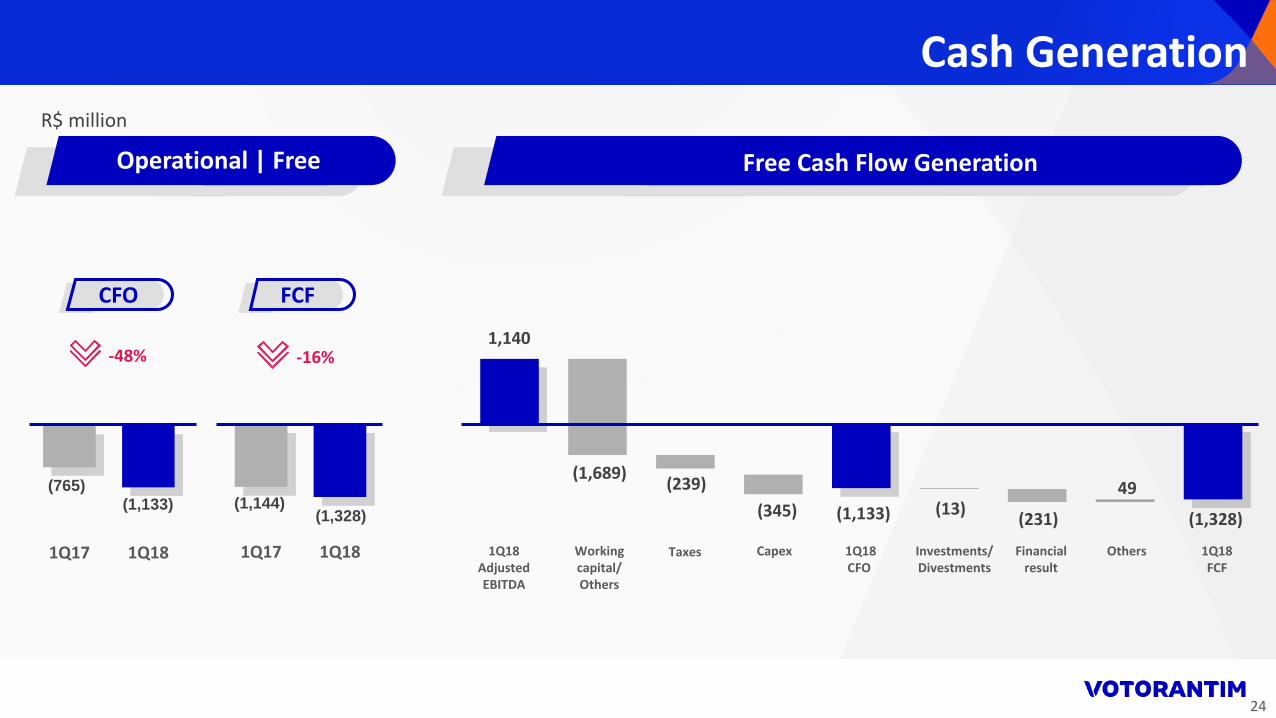
-16%
Free Cash Flow Generation
Cash Generation
Operational | Free
CFO FCF
R$ million
24
-48%
1Q18AdjustedEBITDA
Workingcapital/ Others
Taxes Capex 1Q18CFO
Investments/ Divestments
Financialresult
Others 1Q18FCF
(765)(1,133)
(1,328)(1,144)
1,140
(1,689)(239)
(345) (1,133) (13)(231)
49
(1,328)
1Q17 1Q181Q17 1Q18

56%27%
13%
4%24.6 (1.4) (0.3) 0.3 0.2 23.5
Dec 31, 2017 Borrowings/Amortizations
Interestpayment
Interestaccrual
FX/Others
Mar 31, 2018
Debt by Currency
USD
EUR
BRL
Others3.31 3.32
FX
(1)
Gross Debt
Consolidated Gross Debt
(1) 4131 bilateral loan considered as BRL due to the cross-currency swap
R$ billion
25

2018 2019 2020 2021 2022 2023 2024 2025 2026 2027+ ... 2041
3.89x 3.89x 3.85x
2.60x 2.58x
Liquidity Position and Debt Amortization Profile
Net Debt Debt Amortization Schedule (Pro Forma)(1)
(2) (2)
Net Debt / Adjusted EBITDA
(1) Pro forma includes early debt payments executed by Votorantim Cimentos in April 2018(2) Restated value(3) Considers ~R$450 million ongoing debt prepayment allocated on current liabilities.
R$ billion
4.0
9.3
1.61.4
3.11.9
3.02.4
0.1 0.1
4.0 4.1
1.3
Average debt maturity: 8.1 years
Revolving Credit Facilities BRL (27%) Foreign currencies (73%)Cash
26
15.8 16.0 15.9
12.413.6
1Q17 2Q17 3Q17 4Q17 1Q18(3)

Patient capital allocation
Focus on modernization and sustaining investments
Closing Remarks
Usual prudence in conducting the businesses
27
Leverage reduction