Embed Size (px)
Citation preview

Growing Global
………………………………………………………………………………………………………………………………………………………………………………….. Innovation Quality
Corporate Presentation Invest Malaysia 2016
Growing Global
………………………………………………………………………………………………………………………………………………………………………………….. Innovation Quality
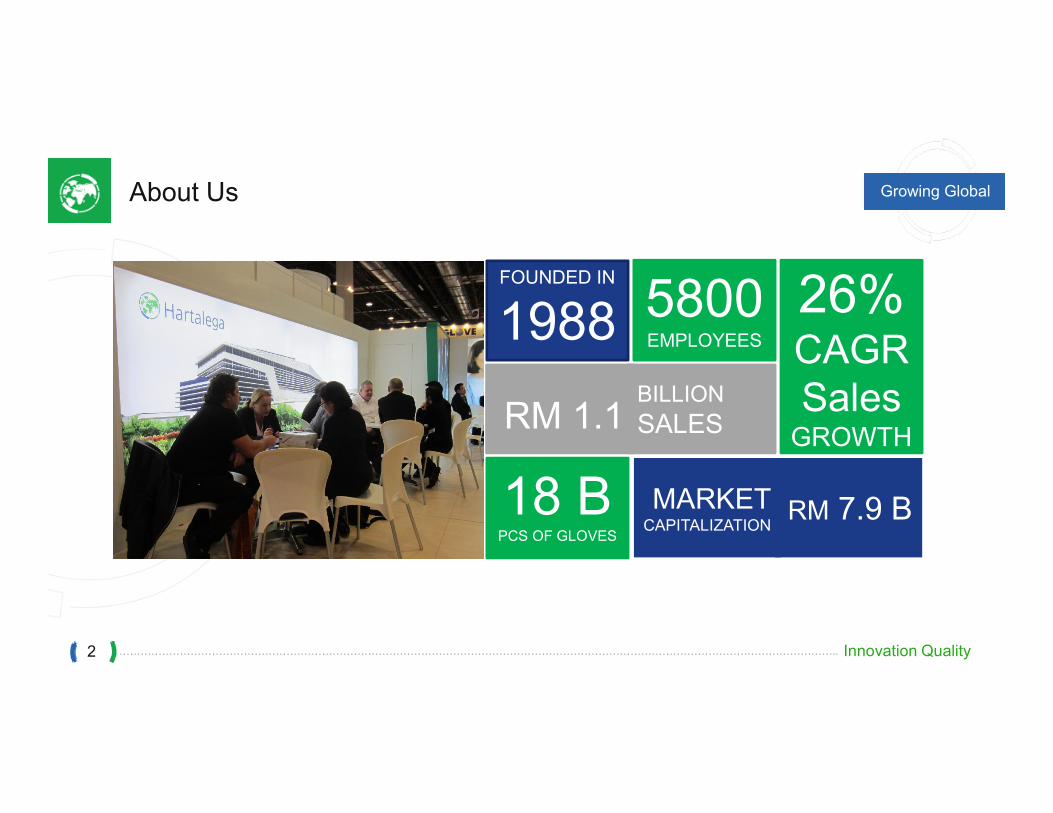
About Us
FOUNDED IN
1988 5800EMPLOYEES
RM 1.1
26% CAGRSales
GROWTH
BILLION
SALES
18 BPCS OF GLOVES
MARKETCAPITALIZATION
RM 7.9 B
2

Growing Global
……………………………………………………………………………………………………………………………………………………………………………….. Innovation Quality3
Market Reachand Overseas Operations
Five overseas offices
• Australia (1996)
• USA (2003)
• China (2012)
• India (2013) – Mumbai &
Chennai
Export to over 40 countries
94% OEM:6% OBM
99% export:1% local

Growing Global
………………………………………………………………………………………………………………………………………………………………………………….. Innovation Quality
USA, 47%
EU, 30%
APAC, 14%
Others, 9%
Healthcare, 76%
Laboratory, 17%
Food, 5%Industrial,
2%
Our Markets
Products are sold to quality demanding markets such as USA, Japan and Germany
93% of sales to healthcare and lab industries where demand remains robust
4

Growing Global
………………………………………………………………………………………………………………………………………………………………………………….. Innovation Quality
Sales Revenue & Profit
110 160 240 282
443 572
735 921
1,032 1,107 1,145
1,464a
FY05 FY06 FY07 FY08 FY09 FY10 FY11 FY12 FY13 FY14 FY15FY16a
Revenue (RM mil)
13 19 37 40
85
146
190 201 234 234 210
260a
FY05 FY07 FY09 FY11 FY13 FY15
Profit After Tax (RM mil)
CAGR for revenue from FY2005 to FY2015 of 26%
CAGR for PAT from FY2005 to FY2015 of 32%
Net margin improved from 12% in FY2005 to 21% in FY2014 but declined to 18.3% for FY15
Sales and PAT for FY2015 of RM1145 mil and RM210 mil respectively
FY15 earnings lower than FY14 due to NGC high start up cost
FY16 annualized should see 20-30% improvement over FY15
5

Growing Global
………………………………………………………………………………………………………………………………………………………………………………….. Innovation Quality
All first mover production technology are in-house developed and proprietary to Hartalega
Highly automated production lines –
industry’s first automated glove
stripping machine
(in operation since year 1994)
Industry’s first on-line stacking
glove line
Industry’s first double former
production line
Competitive Advantage: Process Innovation
6

Growing Global
………………………………………………………………………………………………………………………………………………………………………………….. Innovation Quality
Competitive Advantage – Product Innovation
Polymer coated glove - 1993 Lightweight nitrile glove - 2005 COATS oatmeal coated glove - 2014
7

Growing Global
………………………………………………………………………………………………………………………………………………………………………………….. Innovation Quality
Global Recognition - Awards
2013 & 20142010, 2011, 2012 &
20132013, 2014 & 2015
2010, 2012, 2014 & 2015
HR Asia Best
Employers to
Work for in Asia
Forbes Asia 200
Best Under a
Billion
The Edge Billion
Ringgit Club –
Most Profitable
Company in
Industrial Products
Segment
Asiamoney - Best
Managed Company
in Malaysia &
Corporate
Governance award
2015
M100 – Malaysia‘s
100 Leading
Graduate
Employers Award:
winner in chemical
& heavy industries
category
8

Growing Global
………………………………………………………………………………………………………………………………………………………………………………….. Innovation Quality
Global Recognition - admission to MSCI Malaysia Index
Hartalega inducted into MSCI
Global Indices – the MSCI is best
known for Indices outside USA
Provides greater visibility to foreign
funds and global recognition
The only rubber glove manufacturer
listed in the Index
9

Growing Global
………………………………………………………………………………………………………………………………………………………………………………….. Innovation Quality
Global Recognition – admission to FTSE 4Good Bursa Malaysia Index
Hartalega – inducted into FTSE
4Good Bursa Malaysia Index based
on ESG criteria (Environment,
Social Responsibility & Corporate
Governance)
One of only 4 manufacturers and
the only rubber glove manufacturer
listed in the Index
Testimony to our focus beyond
profits
10

Growing Global
Market Outlook

Growing Global
………………………………………………………………………………………………………………………………………………………………………………….. Innovation Quality
Intensified competition
Market Outlook
World demand for rubber gloves grow at an average of 8% per annum
Malaysia is the largest supplier of rubber gloves to the world – 62% market share
Demand of glove is inelastic
Nitrile is the preferred choice in developed markets
Industry view that market demand could grow to 400 billion over the next decade before reaching maturity
6884 92 94 102110
122124140
150148160
171180194
210227
245
200
1
200
2
200
3
200
4
200
5
200
6
200
7
200
8
200
9
201
0
201
1
201
2
201
3
201
4
201
5
201
6
201
7
201
8
World’s Import of Exam Glove (billion pieces)
MARGMA forecast (billion pieces)
(source MARGMA)
12

Growing Global
………………………………………………………………………………………………………………………………………………………………………………….. Innovation Quality
Malaysia Rubber Glove Exportdominates at over 60% global share
Export Quantity grew at CAGRaverage growth rate of 12.6% in thelast seven years
2015 saw 115.8 billion pieces &RM11.8 billion revenues - asignificant 18% growth over 2014
Expect positive trend to continue dueto organic global healthcare growth
Untapped markets in emergingnations with low per capitaconsumption of rubber glove
Market Outlook
5.9 7.3 8.5 9.4 9.7 10.4 10.4 11.8
50.4
65.374 70.7
81.488.5
98.1
115.8
0
20
40
60
80
100
120
140
2008 2009 2010 2011 2012 2013 2014 2015
Malaysian Rubber Glove Export Trend (2008-2015)
Malaysian glove export (RM bil) Malaysian glove export (bil pcs)
13

Growing Global
………………………………………………………………………………………………………………………………………………………………………………….. Innovation Quality
NR50%
NBR, 50%
Market Outlook – Nitrile Wave Continues
NR,54%
NBR, 46%
NR,49%
NBR, 51%
NR,42%
NBR, 58%
Year 2012 Year 2013 Year 2014 Year 2015
Malaysia’s Export of Rubber Gloves
Share of nitrile gloves of Malaysia’s total glove export increased from just 46% to 58% in 4 years
14

Growing Global
………………………………………………………………………………………………………………………………………………………………………………….. Innovation Quality
NR, 24%
NBR, 76%
Market Outlook – Nitrile Wave Continues
NR, 26%
NBR, 74%
NR, 22%
NBR, 78%
NR,20%
NBR, 80%
Year 2012 Year 2013 Year 2014 Year 2015
Malaysia’s Export of Rubber Gloves to USA
Share of nitrile gloves of Malaysia’s total glove export increased from just 74% to 80% in 4 years
15

Growing Global
………………………………………………………………………………………………………………………………………………………………………………….. Innovation Quality
NR, 46%NBR,
54%
Market Outlook – Nitrile Wave Continues
NR,52%
NBR, 48%
NR,43%NBR,
57%
NR, 35%
NBR, 65%
Year 2012 Year 2013 Year 2014 Year 2015
Malaysia’s Export of Rubber Gloves to EU
Share of nitrile gloves of Malaysia’s total glove export increased from just 48% to over 65% in 4 years
16
Growing Global
………………………………………………………………………………………………………………………………………………………………………………….. Innovation Quality
Intensified competition
Market outlook – Nitrile Wave Continues
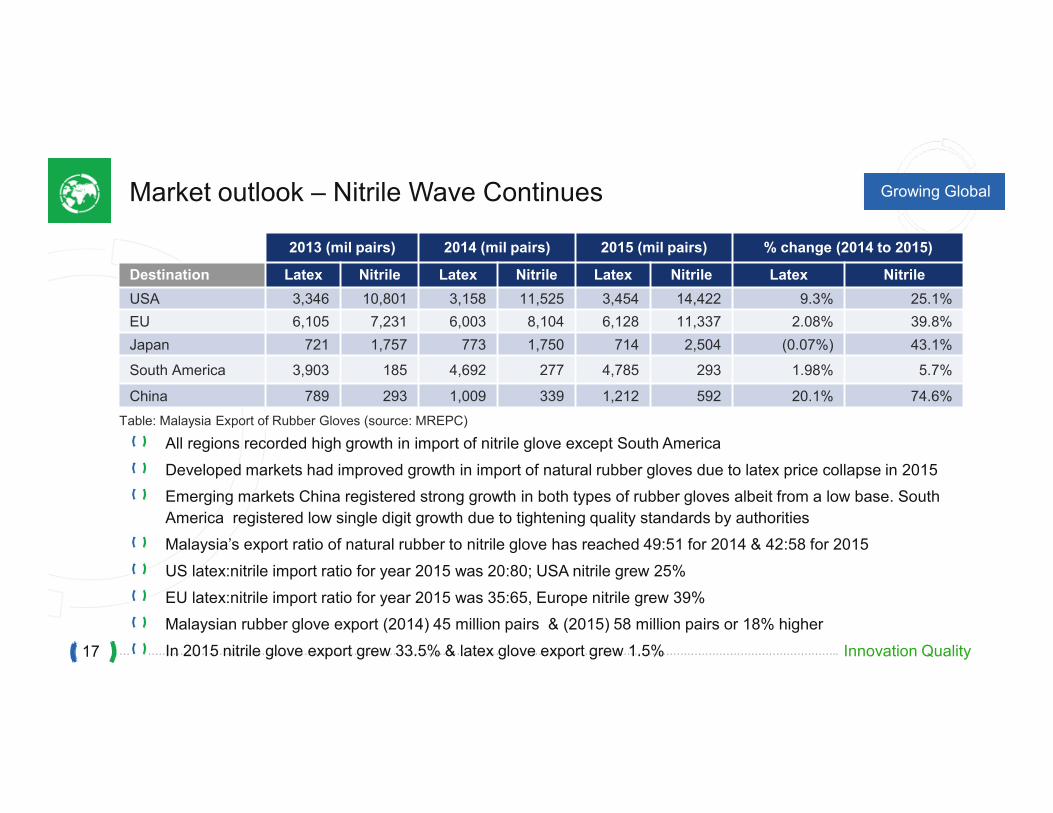
All regions recorded high growth in import of nitrile glove except South America
Developed markets had improved growth in import of natural rubber gloves due to latex price collapse in 2015
Emerging markets China registered strong growth in both types of rubber gloves albeit from a low base. South
America registered low single digit growth due to tightening quality standards by authorities
Malaysia’s export ratio of natural rubber to nitrile glove has reached 49:51 for 2014 & 42:58 for 2015
US latex:nitrile import ratio for year 2015 was 20:80; USA nitrile grew 25%
EU latex:nitrile import ratio for year 2015 was 35:65, Europe nitrile grew 39%
Malaysian rubber glove export (2014) 45 million pairs & (2015) 58 million pairs or 18% higher
In 2015 nitrile glove export grew 33.5% & latex glove export grew 1.5%
2013 (mil pairs) 2014 (mil pairs) 2015 (mil pairs) % change (2014 to 2015)
Destination Latex Nitrile Latex Nitrile Latex Nitrile Latex Nitrile
USA 3,346 10,801 3,158 11,525 3,454 14,422 9.3% 25.1%
EU 6,105 7,231 6,003 8,104 6,128 11,337 2.08% 39.8%
Japan 721 1,757 773 1,750 714 2,504 (0.07%) 43.1%
South America 3,903 185 4,692 277 4,785 293 1.98% 5.7%
China 789 293 1,009 339 1,212 592 20.1% 74.6%
Table: Malaysia Export of Rubber Gloves (source: MREPC)
17
Growing Global
………………………………………………………………………………………………………………………………………………………………………………….. Innovation Quality
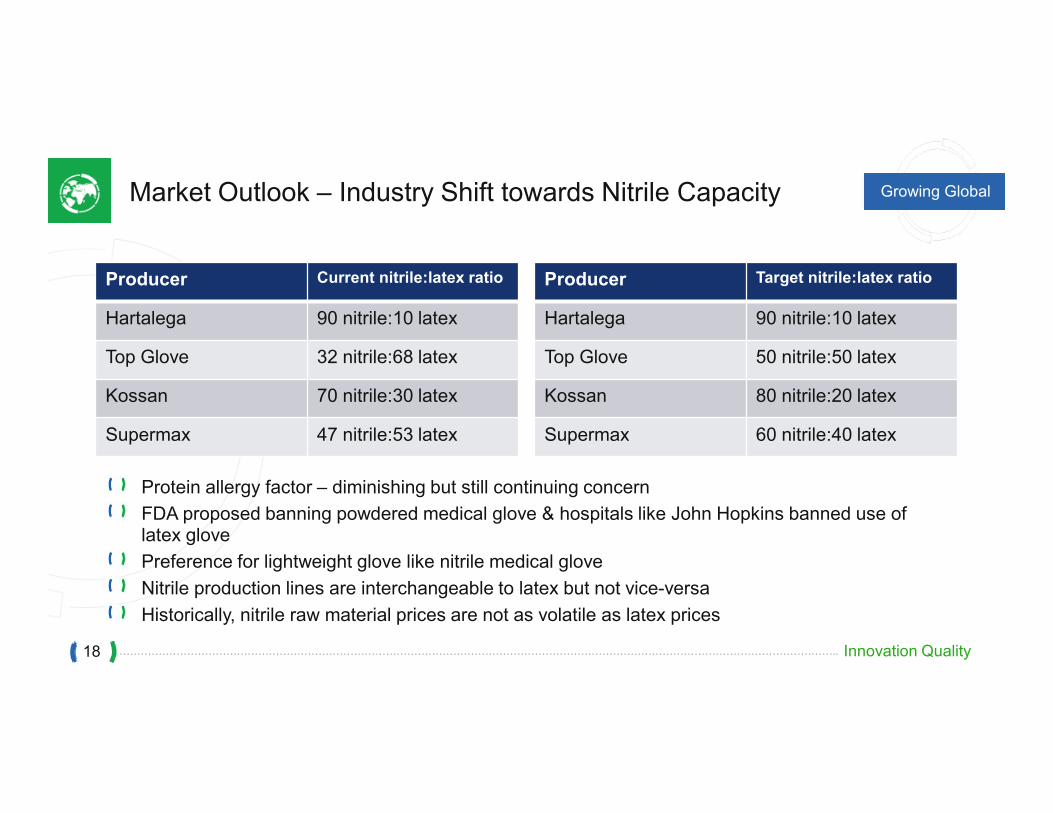
Market Outlook – Industry Shift towards Nitrile Capacity
Producer Current nitrile:latex ratio
Hartalega 90 nitrile:10 latex
Top Glove 32 nitrile:68 latex
Kossan 70 nitrile:30 latex
Supermax 47 nitrile:53 latex
Producer Target nitrile:latex ratio
Hartalega 90 nitrile:10 latex
Top Glove 50 nitrile:50 latex
Kossan 80 nitrile:20 latex
Supermax 60 nitrile:40 latex
Protein allergy factor – diminishing but still continuing concern
FDA proposed banning powdered medical glove & hospitals like John Hopkins banned use of latex glove
Preference for lightweight glove like nitrile medical glove
Nitrile production lines are interchangeable to latex but not vice-versa
Historically, nitrile raw material prices are not as volatile as latex prices
18

Growing Global
………………………………………………………………………………………………………………………………………………………………………………….. Innovation Quality
Market Outlook
Glove Market Catalyst Drivers

Growing Global
………………………………………………………………………………………………………………………………………………………………………………….. Innovation Quality
Buyers in USA started to switch even though nitrile gloves were 15% more expensive than natural rubber
Price of NBR glove isabout the same as NRglove
Nitrile material price is adjusted to similar conversion ratio to natural rubber
Market Outlook – Raw Material price trend
Nitrile & latex price are closely correlated as both are close substitute products for tyre industry
Demand for nitrile gloves continues to grow despite higher nitrile raw material prices compared to latex
Prices of both raw materials have fallen sharply since mid-2015 due to oversupply concerns
-
2.00
4.00
6.00
8.00
10.00
12.00
No
v-07
Feb
-08
Ma
y-0
8
Aug-0
8
No
v-08
Feb
-09
Ma
y-0
9
Aug-0
9
No
v-09
Feb
-10
Ma
y-1
0
Aug-1
0
No
v-10
Feb
-11
Ma
y-1
1
Aug-1
1
No
v-11
Feb
-12
Ma
y-1
2
Aug-1
2
No
v-12
Feb
-13
Ma
y-1
3
Aug-1
3
No
v-13
Feb
-14
Ma
y-1
4
Aug-1
4
No
v-14
Feb
-15
Ma
y-1
5
Aug-1
5
No
v-15
Feb
-16
Nitrile (RM) Latex (RM)
20

Growing Global
………………………………………………………………………………………………………………………………………………………………………………….. Innovation Quality
Market Outlook – Raw Material Trend
1.0%
14.1%
3.7%
6.3%5.0% 3.0%
-16.8%
49.3%
35.2%
3.8%
5.1%
14.9%
7.9%
-18.2%
-30.0%
-20.0%
-10.0%
0.0%
10.0%
20.0%
30.0%
40.0%
50.0%
60.0%
2009 2010 2011 2012 2013 2014 To end-Oct 2015
Global China(source: Bloomberg)
Global & China vehicle trends
Tyres and vehicle rubber parts take up almost 80% of rubber consumption
Vehicle sales trend especially in China, world’s largest vehicle manufacturer, reached a peak in 2013 & has been in gradual decline since
Global vehicle sales has also declined from 2014 onwards
Vehicle sales decline trend is the main reason for nitrile & natural rubber price decline21

Growing Global
………………………………………………………………………………………………………………………………………………………………………………….. Innovation Quality
World Butadiene Supply & Demand (million metric ton)
8.50
9.00
9.50
10.00
10.50
11.00
11.50
2010 2011 2012 2013 2014 2015
Production Demand(source IHS)
Market Outlook – Raw Material Trend
Industry capacity ramping 2010-2014 especially in Asia during high butadiene price period resulted in oversupply since 2013
Oversupply may persist due to China economic slowdown and slower uptake of butadiene, the feedstock for nitrile
22
Growing Global
………………………………………………………………………………………………………………………………………………………………………………….. Innovation Quality
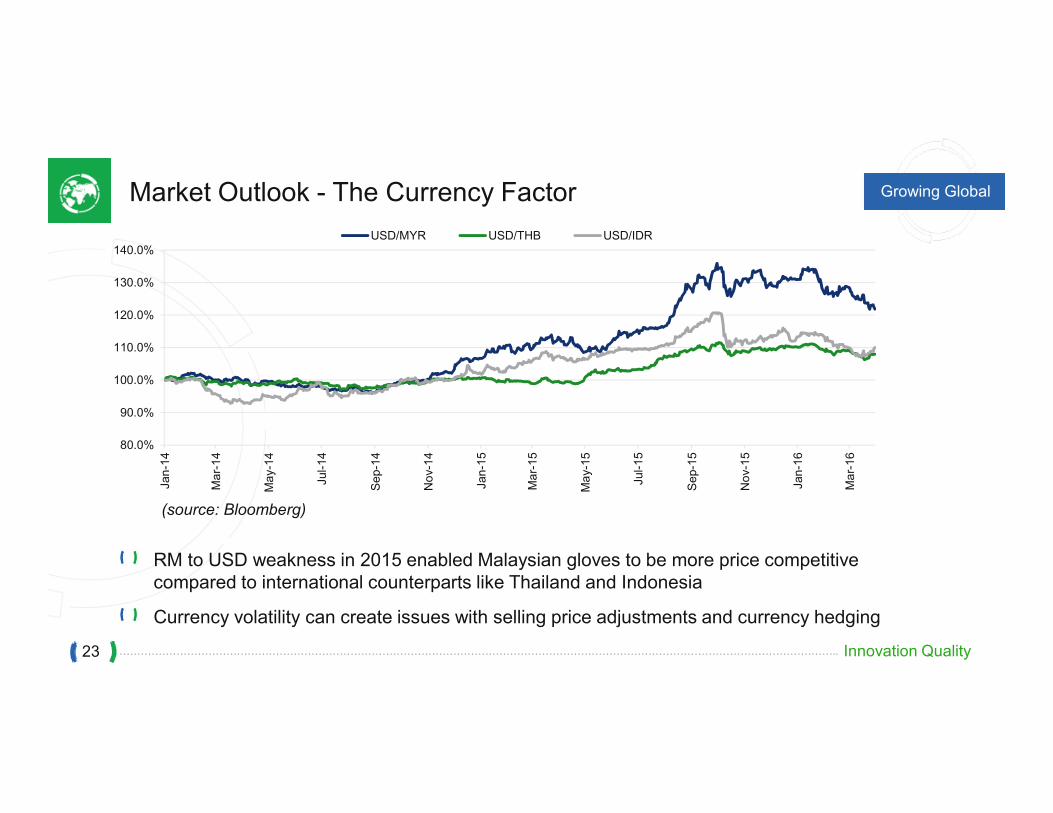
Market Outlook - The Currency Factor
80.0%
90.0%
100.0%
110.0%
120.0%
130.0%
140.0%
Jan
-14
Ma
r-1
4
Ma
y-1
4
Jul-
14
Se
p-1
4
No
v-1
4
Jan
-15
Ma
r-1
5
Ma
y-1
5
Jul-
15
Se
p-1
5
No
v-1
5
Jan
-16
Ma
r-1
6
USD/MYR USD/THB USD/IDR
(source: Bloomberg)
RM to USD weakness in 2015 enabled Malaysian gloves to be more price competitive compared to international counterparts like Thailand and Indonesia
Currency volatility can create issues with selling price adjustments and currency hedging
23

Growing Global
………………………………………………………………………………………………………………………………………………………………………………….. Innovation Quality
Market Outlook – International Competition
65%
24%
9%
2%
64%
23%
11%
2%
73%
14%10%
3%
0%
10%
20%
30%
40%
50%
60%
70%
80%
Malaysia Thailand China Indonesia
USA - Top 4 suppliers of synthetic rubber glove: 2013-2015 (Quantity)
2013 2014 2015
(source: MREPC)
USA is the biggest market for rubber glove demand taking up almost 35% of global market share
Malaysia grew market share in USA due to aggressive expansion plans while international competitors grew at gradual pace or declined
The biggest competition remains local
Malaysia is capturing market share at others’ expense due to its glove quality and competitive pricing
24
Growing Global
………………………………………………………………………………………………………………………………………………………………………………….. Innovation Quality
10 11 12 15 20 2530 30 32 35 38 4211 12 13
1819
2014 14 14
1519
20
16 23 2731
3132
8190
98
115126
139
101110
123
138156
175160171
181194
210227
2012 2013 2014 2015 2016e 2017e
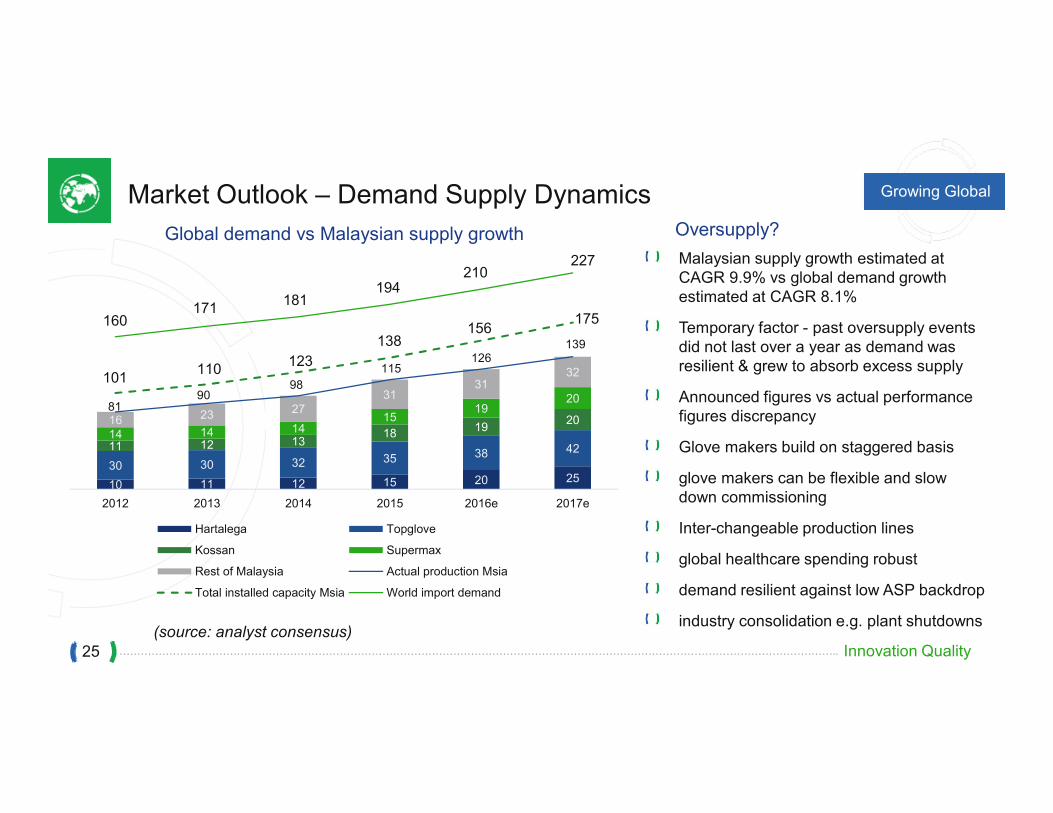
Global demand vs Malaysian supply growth
Hartalega Topglove
Kossan Supermax
Rest of Malaysia Actual production Msia
Total installed capacity Msia World import demand
Malaysian supply growth estimated at CAGR 9.9% vs global demand growth estimated at CAGR 8.1%
Temporary factor - past oversupply events did not last over a year as demand was resilient & grew to absorb excess supply
Announced figures vs actual performance figures discrepancy
Glove makers build on staggered basis
glove makers can be flexible and slow down commissioning
Inter-changeable production lines
global healthcare spending robust
demand resilient against low ASP backdrop
industry consolidation e.g. plant shutdowns
Market Outlook – Demand Supply Dynamics
(source: analyst consensus)
Oversupply?
25

Growing Global
………………………………………………………………………………………………………………………………………………………………………………….. Innovation Quality
Market Outlook – Industry Margins “converging”?
0.0
5.0
10.0
15.0
20.0
25.0
30.0
35.0
40.0
FY08 FY09 FY10 FY11 FY12 FY13 FY14 FY15 FY16a
EBITDA margin trend comparison between Hartalega & other listed glove companies
Hartalega Industry (other listed glove companies)
Industry margins improved mainly due to adding automation & cost management
Situational margin gains from favourable raw material & currency trends
26

Growing Global
………………………………………………………………………………………………………………………………………………………………………………….. Innovation Quality
OUR STRATEGIC RESPONSE
27

Growing Global
………………………………………………………………………………………………………………………………………………………………………………….. Innovation Quality
Hartalega NGC – Our Flagship Project
An Entry Point Project (EPP) under the ETP
RM2.2 billion investment
112 acres site at Sepang
High technology and integrated
Conducive work environment
6 high tech manufacturing plants
72 efficient production lines
R&D & training centre
Sports and recreation complex
Employees’ accommodation
28

Growing Global
………………………………………………………………………………………………………………………………………………………………………………….. Innovation Quality
Intensified competition
Hartalega Available Capacity Projection
Average per annum CAGR capacity growth of 15% for the next 5 years (FY16-FY20)
First production line at NGC started production in January 2015
Subsequent production capacity will come on-stream progressively
12,025 13,488 18,426
20,887 24,017 24,429 26,722
0
10,000
20,000
30,000
40,000
FY14 FY15 FY16 FY17 FY18 FY19 FY20
Projected output (mil pcs)
29

Growing Global
………………………………………………………………………………………………………………………………………………………………………………….. Innovation Quality
Hartalega NGC Timeline
Phase PlantCapacity
(gloves pa)No of Lines
No of Lines commissioned
Commissioning Timeline
Phase 1Plant 1
Plant 2
4.7 bn
4.7 bn
12
12
12
12
Jan 15-Mar 16
Jan 15-Mar 16
Phase 2Plant 3
Plant 4
4.7 bn
4.7bn
12
12
3Q2016-3Q2017
3Q2016-3Q2017
Phase 3Plant 5
Plant 6
4.7bn
4.7bn
12
12
2019-2020
2019-2020
Total 6 Plants 28.2 bn 72 24 2020
30

Growing Global
………………………………………………………………………………………………………………………………………………………………………………….. Innovation Quality
Engineering Strategy - Reduction in Workers per Output
*unit measurement used is worker per million pieces of gloves produced per month
33% jump in productivity at NGC compared to Hartalega’s existing set-up
Sets a new benchmark for the sector
Further automation and lean manufacturing practices will improve productivity at NGC by another 23%
Hartalega NGC
Hartalega’s existing set-up 3.9
2.6
Hartalega NGC with further automation and lean manufacturing practices
2.0
31
Growing Global
………………………………………………………………………………………………………………………………………………………………………………….. Innovation Quality
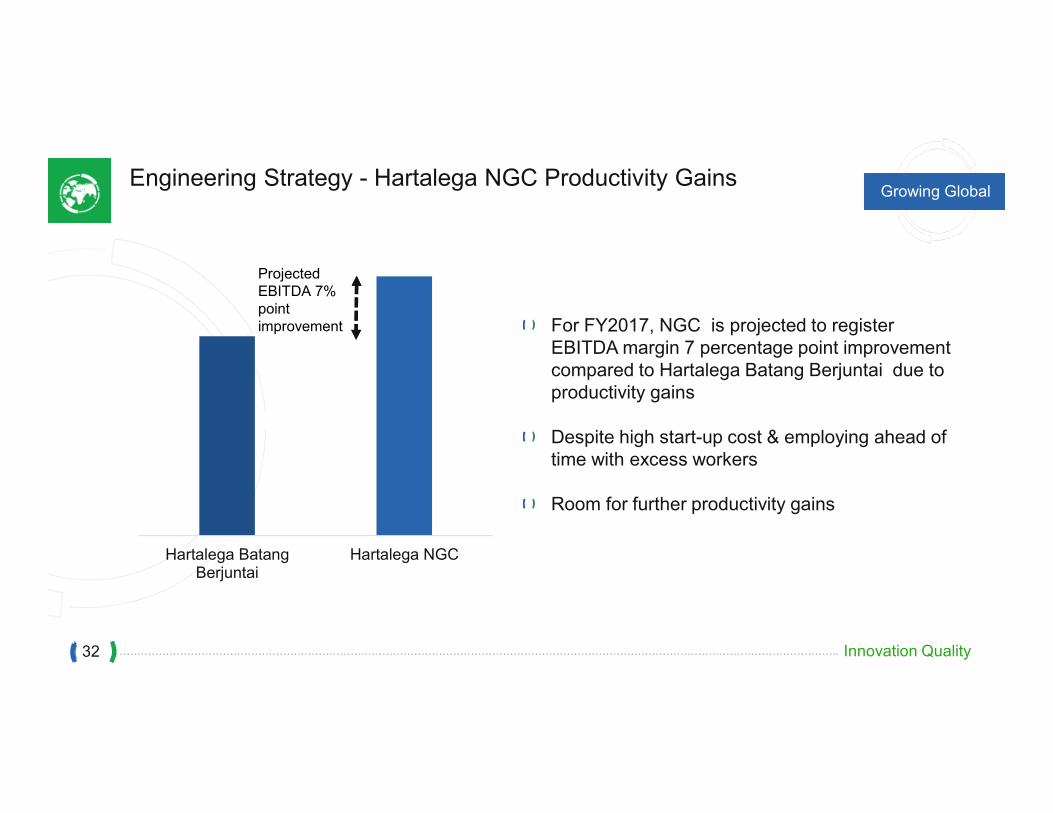
Engineering Strategy - Hartalega NGC Productivity Gains
Hartalega BatangBerjuntai
Hartalega NGC
Projected EBITDA 7% point improvement For FY2017, NGC is projected to register
EBITDA margin 7 percentage point improvement compared to Hartalega Batang Berjuntai due to productivity gains
Despite high start-up cost & employing ahead of time with excess workers
Room for further productivity gains
32

Growing Global
………………………………………………………………………………………………………………………………………………………………………………….. Innovation Quality
Engineering Strategy – Integrating Manufacturing Processes
Integration of business processes
Integration of both locations BB & NGC
Adoption of best practices across two locations
Continuous development in product & process
innovation
Proprietary automation in production line & business
processes
Cost management
ERP & supply chain management
Widen product range
33

Growing Global
………………………………………………………………………………………………………………………………………………………………………………….. Innovation Quality
Engineering Strategy – Proprietary Innovation
Two inventive automation technologies
Three new inventive gloves
R&D in progress
reduction in manual labour
Innovative and differentiated products that are less susceptible to price competition
Expected results
34

Growing Global
………………………………………………………………………………………………………………………………………………………………………………….. Innovation Quality
Sales Strategy – OBM Sales Potential in emerging markets
Sales in China grew by an average of 2.5 times over
the past 3 years (FY14-FY16)
Expect further significant sales in China
Per capita consumption of gloves is still low in China,
about 5.3 pieces per capita compared to USA’s 166
pieces and Europe’s 100 pieces per capita
959,516
4,783,371 6,343,441
11,169,413
16,000,000
FY12 FY13 FY14 FY15 FY16e
782,089 1,347,839
1,685,928
6,700,000
FY13 FY14 FY15 FY16e
Sales in India grew by an average of almost 5 times over
the past 3 years (FY14-FY16)
India has great potential – opened 2 offices in Mumbai &
Chennai
Per capita consumption of gloves is still low in India, about
4 pieces per capita even lower than China’s 5.3 per capita
35

Growing Global
………………………………………………………………………………………………………………………………………………………………………………….. Innovation Quality
Intensified competition
Sales Strategy - Own Brand Product Potential in China & India
Asia’s per capita consumption of gloves is significantly lower than US and EU
China & India’s ongoing healthcare reforms are expected to drive up glove demand substantially
If China’s per capita glove consumption equaled that of EU, demand would be 135 billion pieces per
annum, almost equivalent to two-thirds of the current global consumption
4.8
4
5.3
100
166
0 20 40 60 80 100 120 140 160 180
Asia
India
China
EU
USA
per capita glove usage (pcs) (source:MREPC)
36

Growing Global
………………………………………………………………………………………………………………………………………………………………………………….. Innovation Quality
Sales Strategy - China & India Healthcare Budget Growth
0.0
50.0
100.0
150.0
200.0
250.0
300.0
350.0
400.0
200
1
200
2
200
3
200
4
200
5
200
6
200
7
200
8
200
9
201
0
201
1
201
2
201
3
(US$ per Capita)
Total Healthcare Expenditure
Public Healthcare Expenditure
Private Healthcare Expenditure
0.0
10.0
20.0
30.0
40.0
50.0
60.0
70.0
200
1
200
2
200
3
200
4
200
5
200
6
200
7
200
8
200
9
201
0
201
1
201
2
201
3
(US$ per Capita)
Total Healthcare Expenditure
Public Healthcare Expenditure
Private Healthcare Expenditure
China India
(source: IHH Healthcare)
China, India & other emerging markets continue to increase healthcare expenditure
Rubber gloves, albeit a small segment of hospital budgets, are beneficiary of positive global healthcare trends
Glove companies are proxy to healthcare sector as 90% of their gloves are sold to that growth sector
37

Growing Global
………………………………………………………………………………………………………………………………………………………………………………….. Innovation Quality
Sales Strategy: OEM Sales Potential in developed markets
20% 23% 22%
57% 59%55%
80% 77% 78%
43% 41%45%
0%
10%
20%
30%
40%
50%
60%
70%
80%
90%
USA Germany Japan France Italy Spain
Latex Gloves Nitrile Gloves
(source: MREPC)
Developed markets continue to exhibit growth with pockets of potential
Sales strategy to widen geographic outreach to more countries
Sales strategy to widen customer base38

Growing Global
………………………………………………………………………………………………………………………………………………………………………………….. Innovation Quality
Do You Have Any Question?
39