Embed Size (px)
Citation preview
Corporate Presentation
2
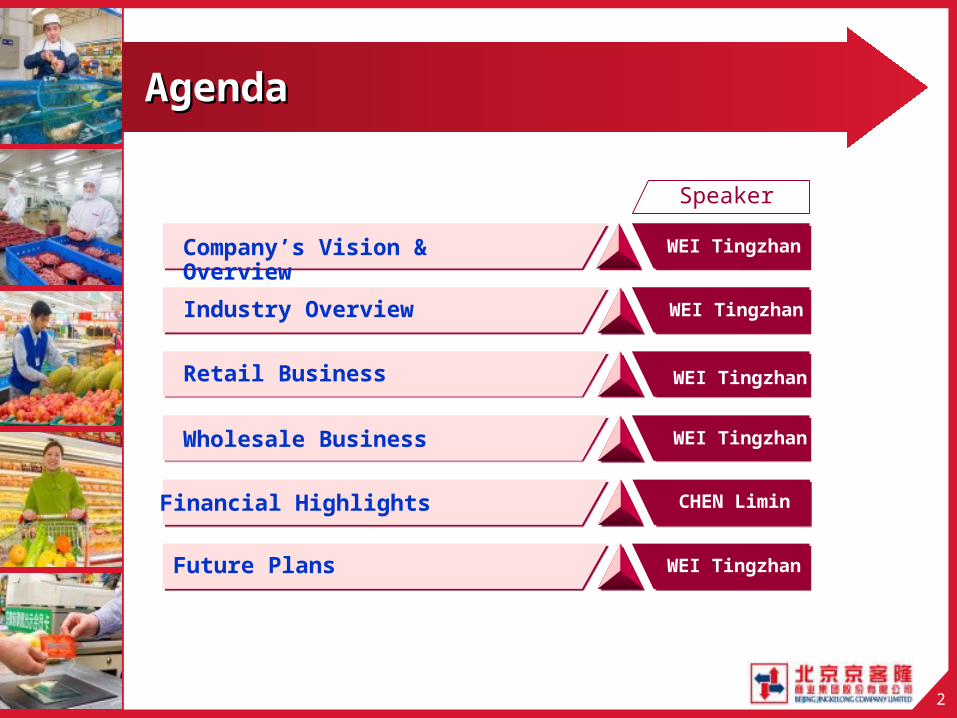
AgendAgendaa
Speaker
Company’s Vision & Overview
WEI Tingzhan
Future Plans WEI Tingzhan
CHEN LiminFinancial Highlights
Retail Business
Wholesale Business
Industry Overview WEI Tingzhan
WEI Tingzhan
WEI Tingzhan
3
WEI TingzhanWEI TingzhanChairmanChairman
Section 1: Section 1: Company’s Vision & Company’s Vision & OverviewOverview
4
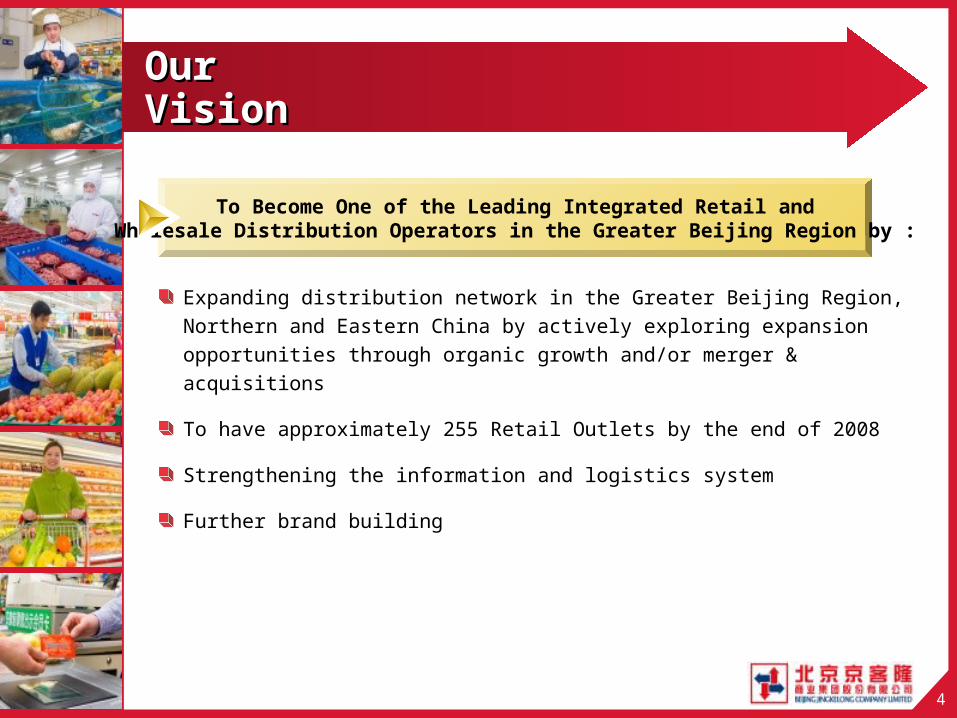
Our Our VisionVision
Expanding distribution network in the Greater Beijing Region, Northern and Eastern China by actively exploring expansion opportunities through organic growth and/or merger & acquisitions
To have approximately 255 Retail Outlets by the end of 2008
Strengthening the information and logistics system
Further brand building
To Become One of the Leading Integrated Retail andWholesale Distribution Operators in the Greater Beijing Region by :
5
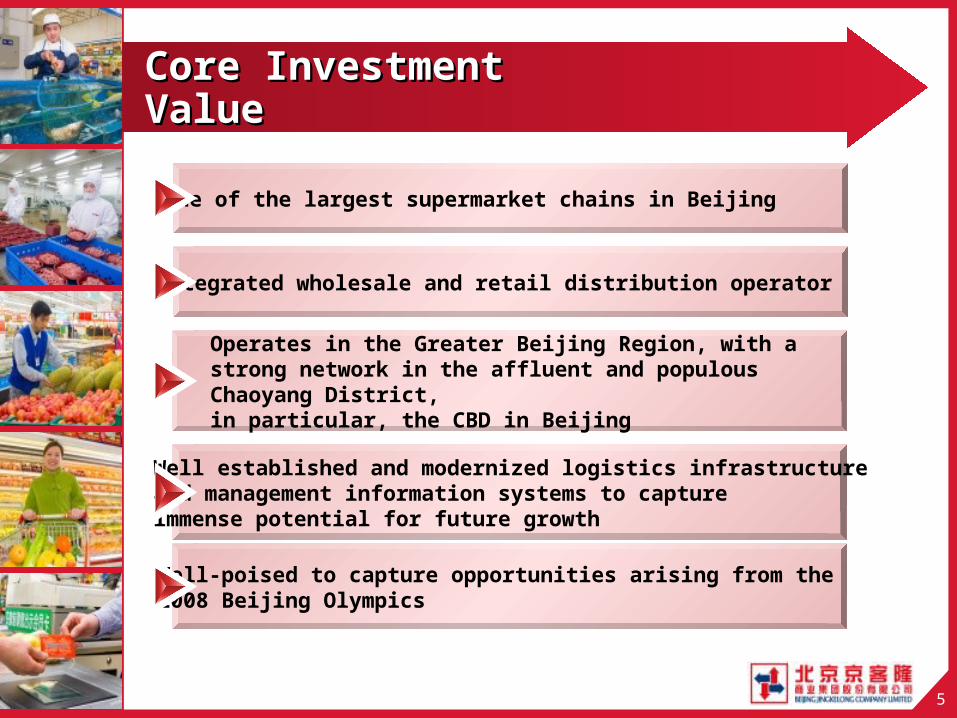
Core Investment Core Investment ValueValue
One of the largest supermarket chains in Beijing
Integrated wholesale and retail distribution operator
Operates in the Greater Beijing Region, with a strong network in the affluent and populous Chaoyang District,in particular, the CBD in Beijing
Well established and modernized logistics infrastructureand management information systems to capture immense potential for future growth
Well-poised to capture opportunities arising from the2008 Beijing Olympics
6
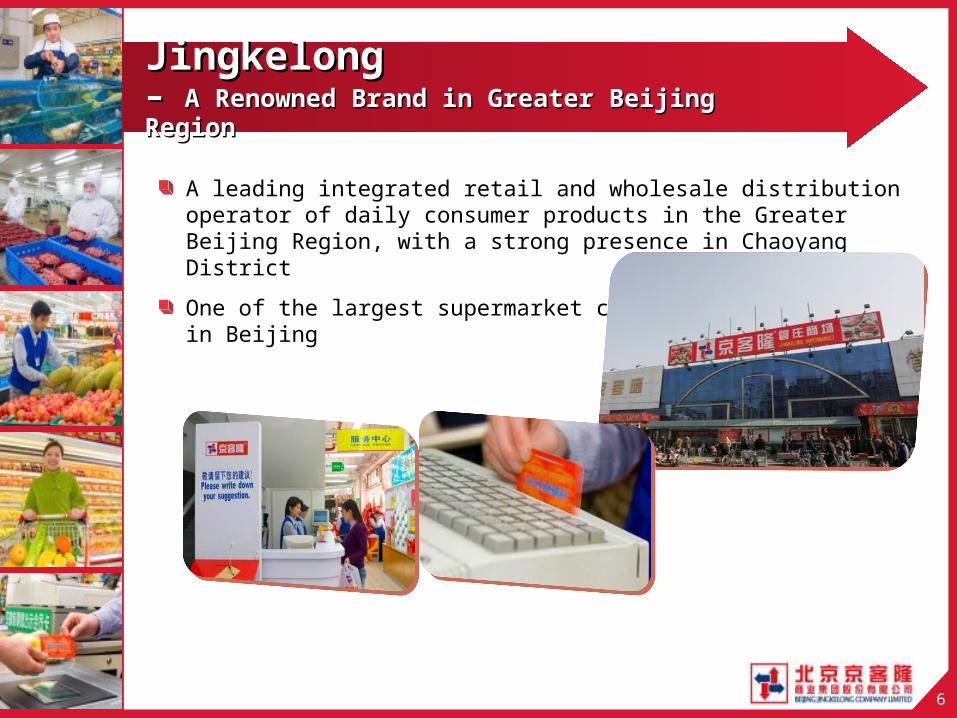
JingkelongJingkelong– – A Renowned Brand in Greater Beijing A Renowned Brand in Greater Beijing RegionRegion
A leading integrated retail and wholesale distribution operator of daily consumer products in the Greater Beijing Region, with a strong presence in Chaoyang District
One of the largest supermarket chainsin Beijing
7
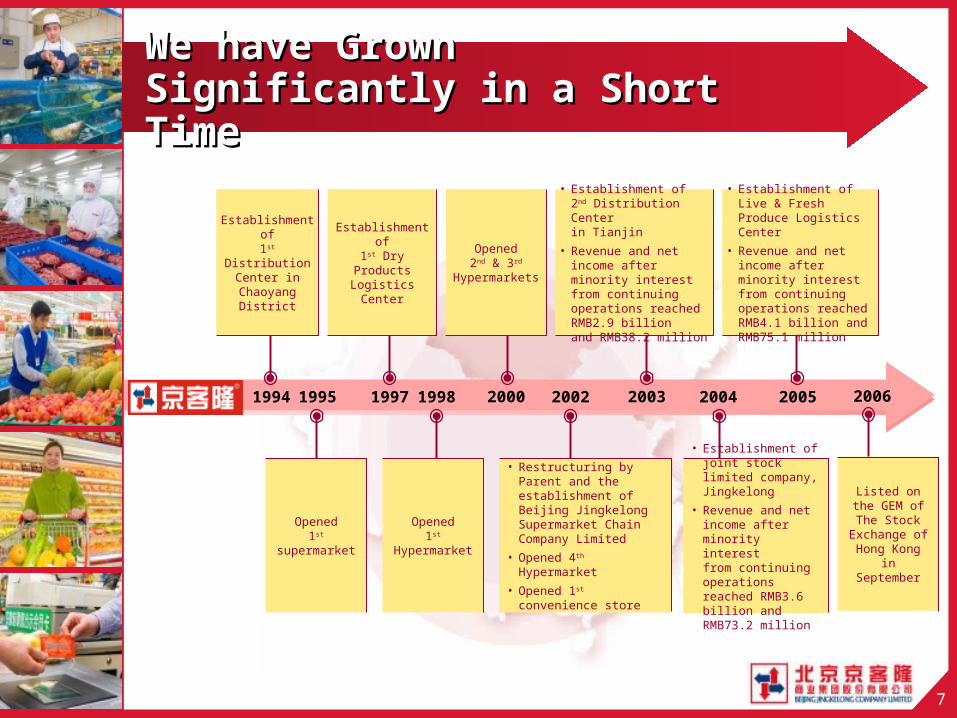
We have Grown We have Grown Significantly in a Short Significantly in a Short TimeTime
19941995 2002 2005
Establishment of
1st Distribution Center inChaoyang
District
19971998 2003 20042000
Establishment of1st Dry Products Logistics Center
Opened2nd & 3rd
Hypermarkets
• Establishment of 2nd Distribution Centerin Tianjin
• Revenue and net income after minority interestfrom continuing operations reached RMB2.9 billionand RMB38.2 million
• Establishment of Live & Fresh Produce Logistics Center
• Revenue and net income after minority interest from continuing operations reached RMB4.1 billion and RMB75.1 million
• Establishment of joint stock limited company, Jingkelong
• Revenue and net income after minority interestfrom continuing operations reached RMB3.6 billion and RMB73.2 million
• Restructuring by Parent and the establishment of Beijing Jingkelong Supermarket Chain Company Limited
• Opened 4th
Hypermarket
• Opened 1st convenience store
Opened1st
Hypermarket
Opened1st
supermarket
2006
Listed on the GEM of The
Stock Exchange of Hong Kong in September
8
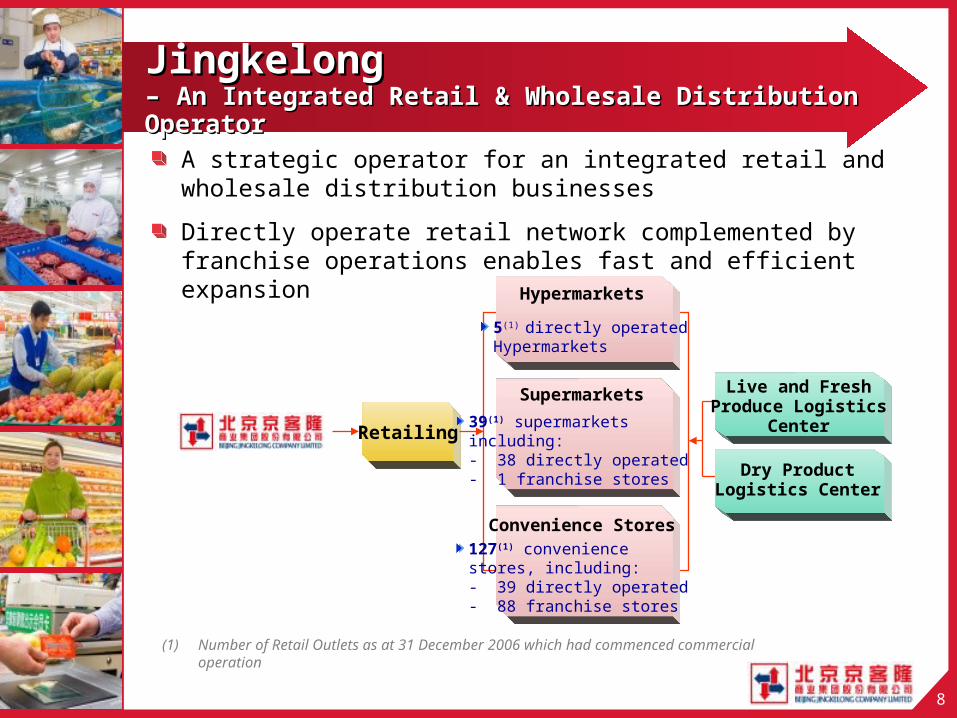
A strategic operator for an integrated retail and wholesale distribution businesses
Directly operate retail network complemented by franchise operations enables fast and efficient expansion
JingkelongJingkelong– – An Integrated Retail & Wholesale Distribution An Integrated Retail & Wholesale Distribution OperatorOperator
Retailing
Hypermarkets
5(1) directly operatedHypermarkets
Supermarkets
39(1) supermarketsincluding:- 38 directly operated- 1 franchise stores
Convenience Stores127(1) convenience stores, including:- 39 directly operated- 88 franchise stores
Dry ProductLogistics Center
Live and FreshProduce Logistics
Center
(1) Number of Retail Outlets as at 31 December 2006 which had commenced commercial operation
9
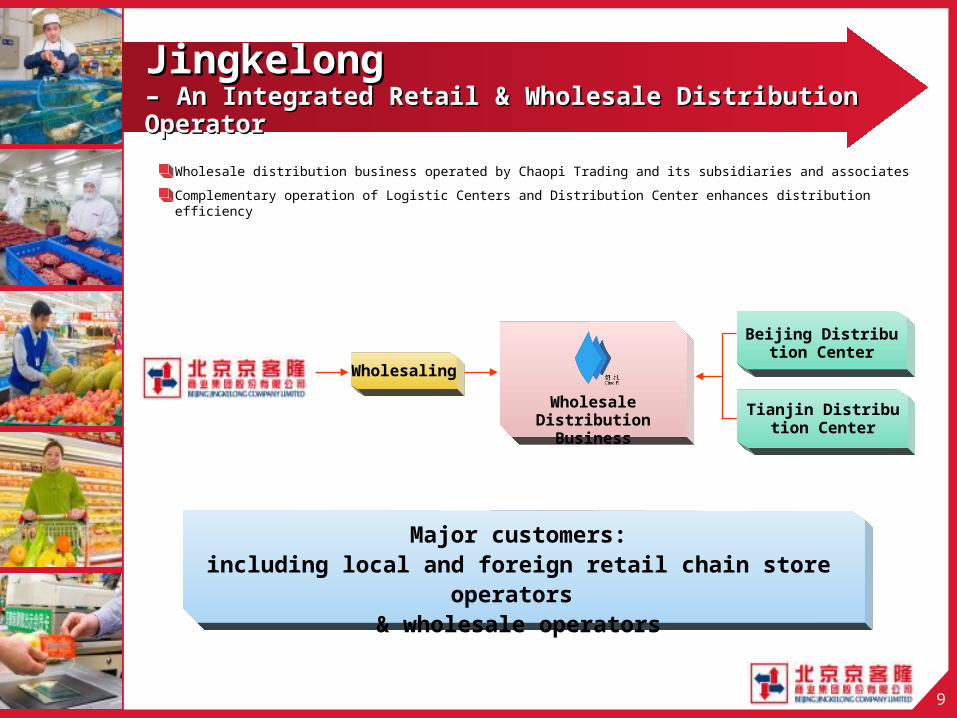
Wholesale distribution business operated by Chaopi Trading and its subsidiaries and associates
Complementary operation of Logistic Centers and Distribution Center enhances distribution efficiency
Wholesaling
Major customers:including local and foreign retail chain store
operators & wholesale operators
Wholesale Distribution
Business
Tianjin Distribution Center
Beijing Distribution Center
JingkelongJingkelong– – An Integrated Retail & Wholesale Distribution An Integrated Retail & Wholesale Distribution OperatorOperator
10
Our Key Our Key StrengthsStrengths
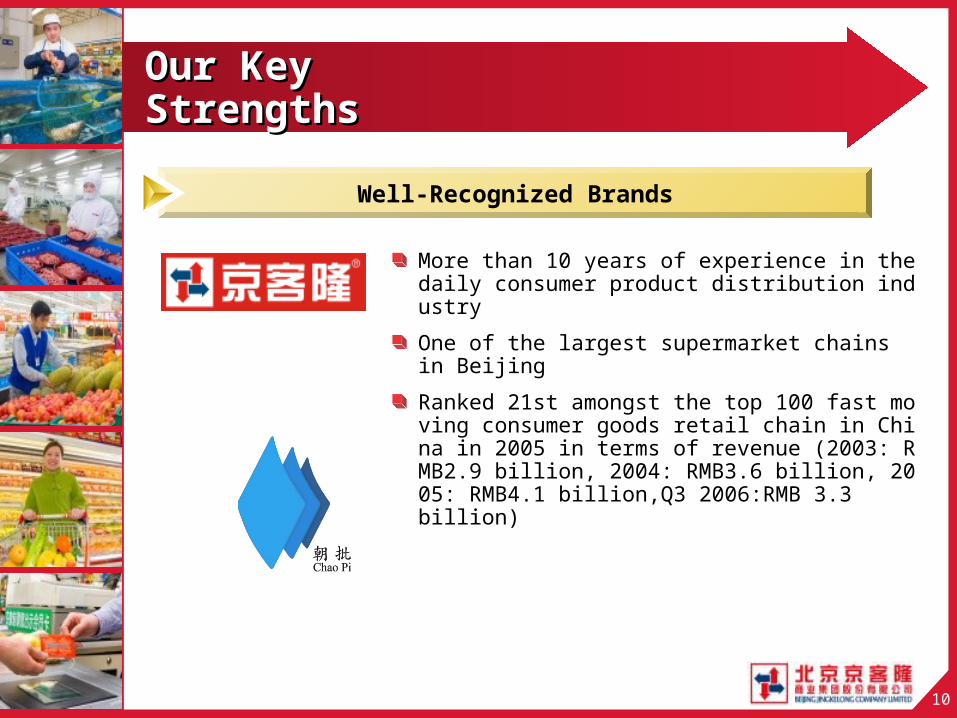
More than 10 years of experience in the daily consumer product distribution industryOne of the largest supermarket chainsin BeijingRanked 21st amongst the top 100 fast moving consumer goods retail chain in China in 2005 in terms of revenue (2003: RMB2.9 billion, 2004: RMB3.6 billion, 2005: RMB4.1 billion,Q3 2006:RMB 3.3 billion)
Well-Recognized Brands
11
Our Key Our Key StrengthsStrengths
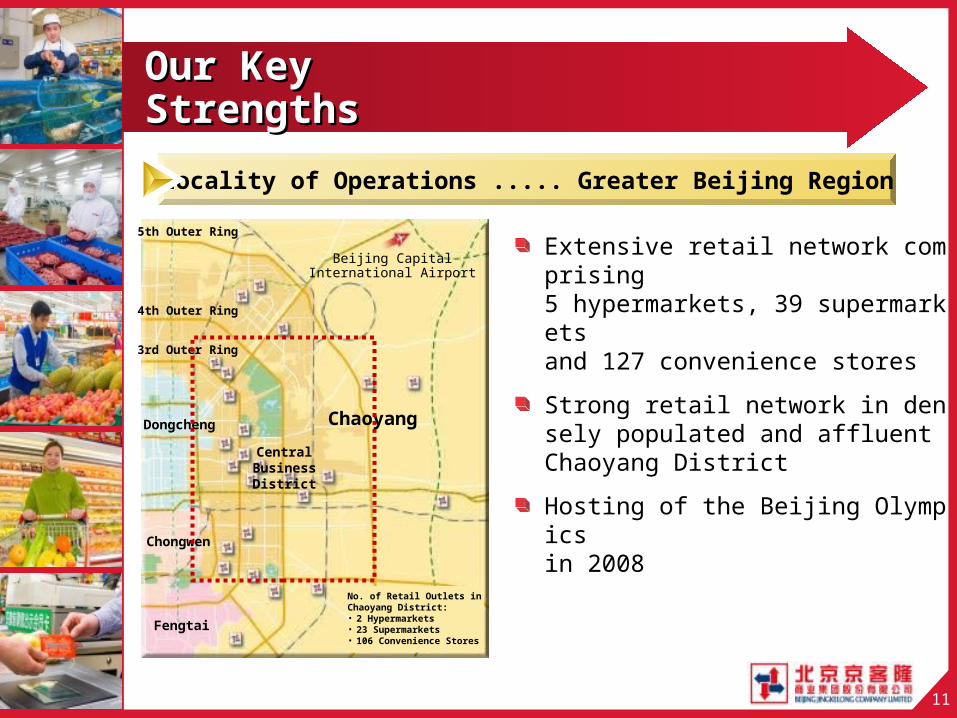
Extensive retail network comprising5 hypermarkets, 39 supermarketsand 127 convenience stores
Strong retail network in densely populated and affluent Chaoyang District
Hosting of the Beijing Olympicsin 2008
Locality of Operations ..... Greater Beijing Region
ChaoyangDongcheng
Fengtai
Chongwen
3rd Outer Ring
4th Outer Ring
5th Outer Ring
Beijing CapitalInternational Airport
Central Business District
No. of Retail Outlets in Chaoyang District:• 2 Hypermarkets• 23 Supermarkets• 106 Convenience Stores
12
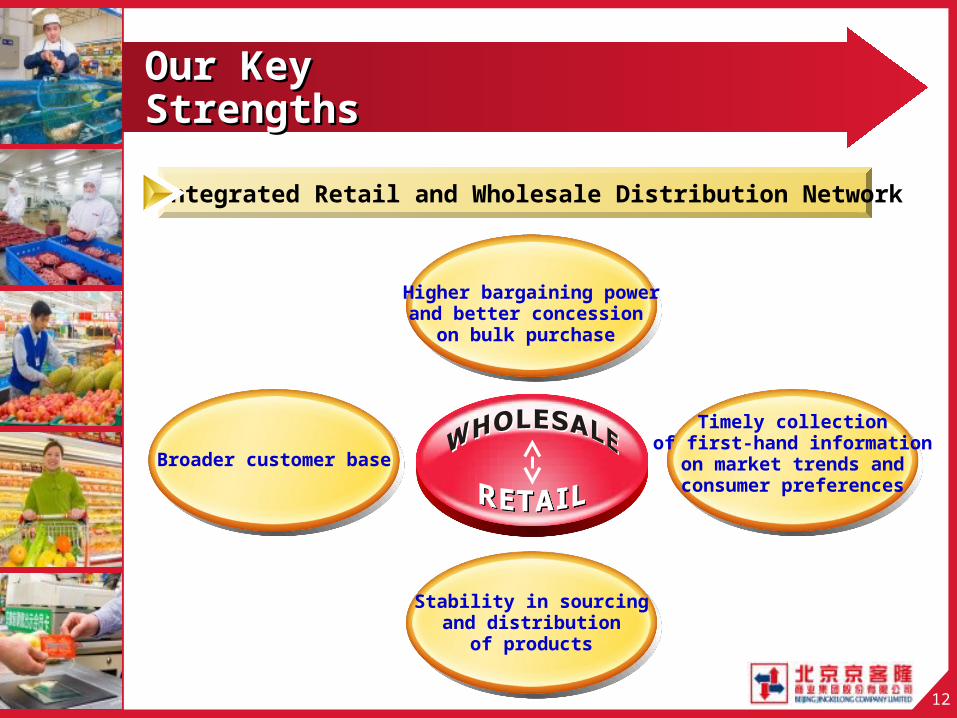
Integrated Retail and Wholesale Distribution Network
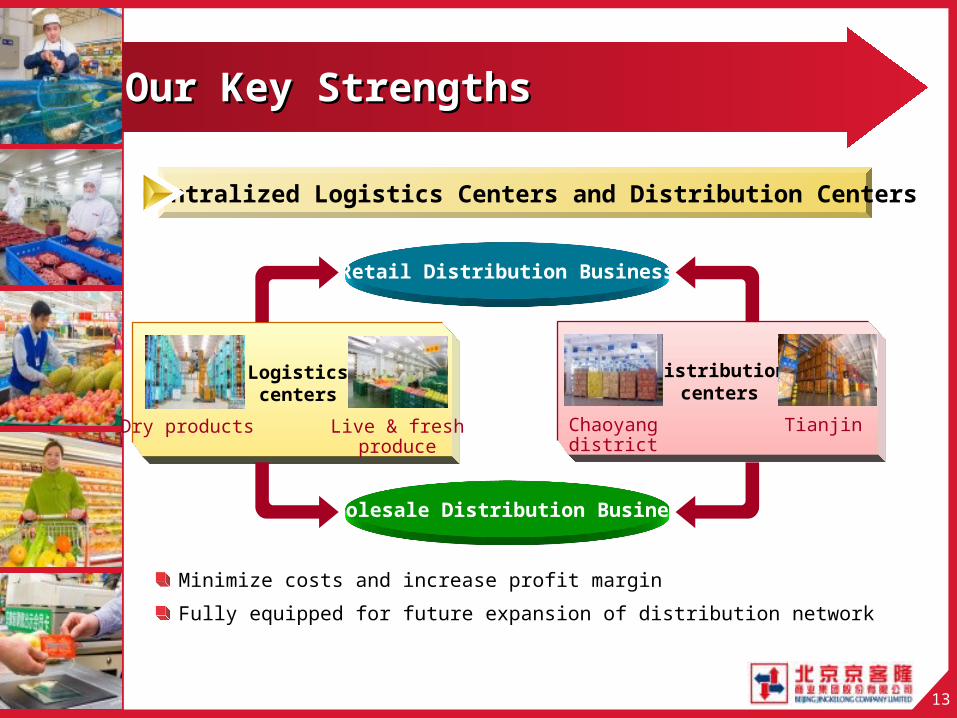
Our Key Our Key StrengthsStrengths
Timely collectionof first-hand information
on market trends andconsumer preferences
Broader customer base
Higher bargaining powerand better concession
on bulk purchase
Stability in sourcingand distribution
of products
13
Minimize costs and increase profit margin
Fully equipped for future expansion of distribution network
Our Key StrengthsOur Key Strengths
Centralized Logistics Centers and Distribution Centers
Chaoyangdistrict
Distributioncenters
Retail Distribution Business
Wholesale Distribution Business
TianjinDry products
Logisticscenters
Live & freshproduce
14
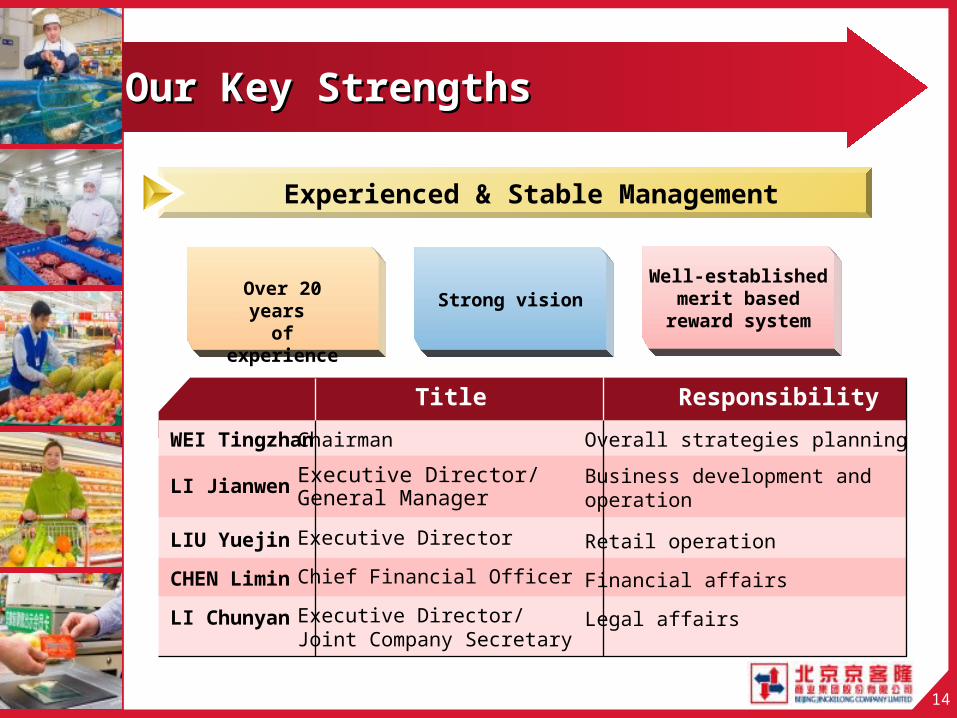
Title Responsibility
WEI Tingzhan
LI Jianwen
LIU Yuejin
CHEN Limin
LI Chunyan
Chairman
Executive Director/General Manager
Executive Director
Chief Financial Officer
Executive Director/Joint Company Secretary
Overall strategies planning
Business development andoperation
Retail operation
Financial affairs
Legal affairs
Our Key StrengthsOur Key Strengths
Experienced & Stable Management
Well-established merit based
reward system
Over 20 years
of experience
Strong vision
15
Strong Financial Strong Financial PositionPosition
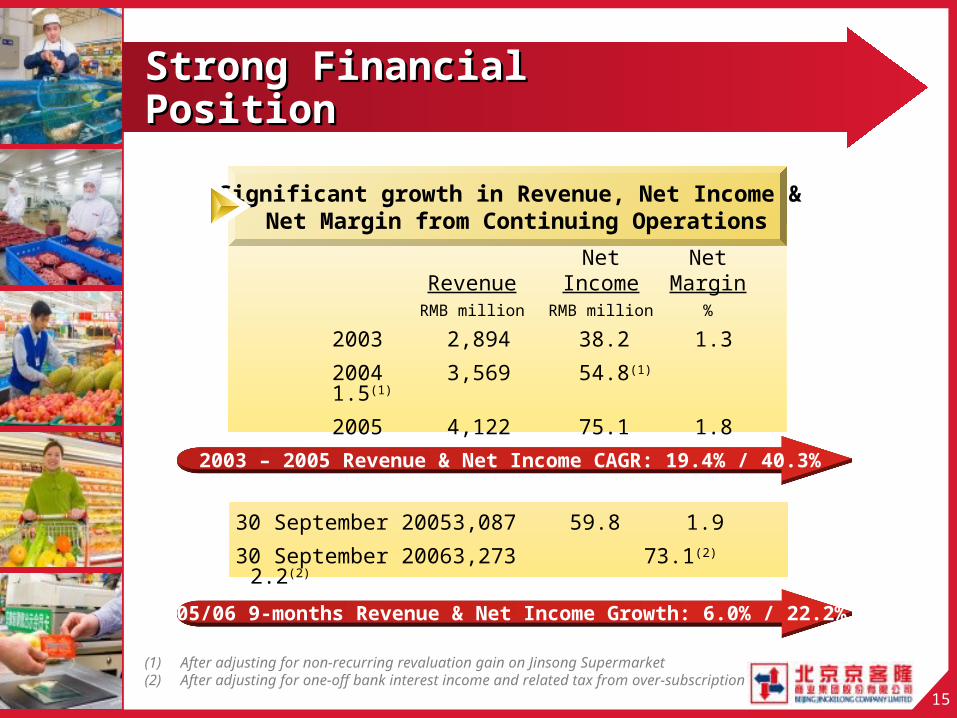
(1) After adjusting for non-recurring revaluation gain on Jinsong Supermarket(2) After adjusting for one-off bank interest income and related tax from over-subscription
Significant growth in Revenue, Net Income & Net Margin from Continuing Operations
Net NetRevenue Income MarginRMB million RMB million %
2003 2,894 38.2 1.3
2004 3,569 54.8(1) 1.5(1)
2005 4,122 75.1 1.8
2003 – 2005 Revenue & Net Income CAGR: 19.4% / 40.3%
05/06 9-months Revenue & Net Income Growth: 6.0% / 22.2%
30 September 2005 3,087 59.8 1.930 September 2006 3,273 73.1(2) 2.2(2)
16
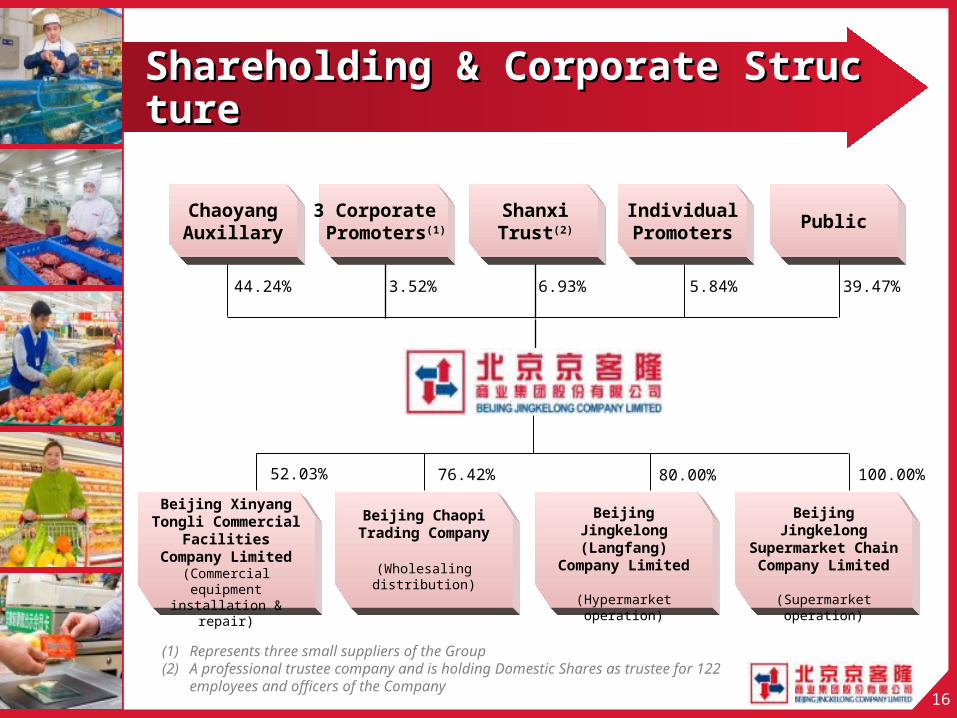
Shareholding Shareholding & Corporate & Corporate StructurStructure e
44.24% 3.52% 5.84% 39.47%
ChaoyangAuxillary
3 Corporate Promoters(1) Public
Beijing Xinyang Tongli Commercial
Facilities Company Limited
(Commercial equipment installation
& repair)
Beijing Chaopi Trading Company
(Wholesaling distribution)
Beijing Jingkelong (Langfang)
Company Limited
(Hypermarket operation)
52.03% 76.42% 80.00%
Individual Promoters
Beijing Jingkelong Supermarket
Chain Company Limited
(Supermarket operation)
100.00%
6.93%
Shanxi Trust(2)
(1) Represents three small suppliers of the Group(2) A professional trustee company and is holding Domestic Shares as trustee for
122 employees and officers of the Company
17
Section 2: Section 2: Industry OverviewIndustry Overview
18
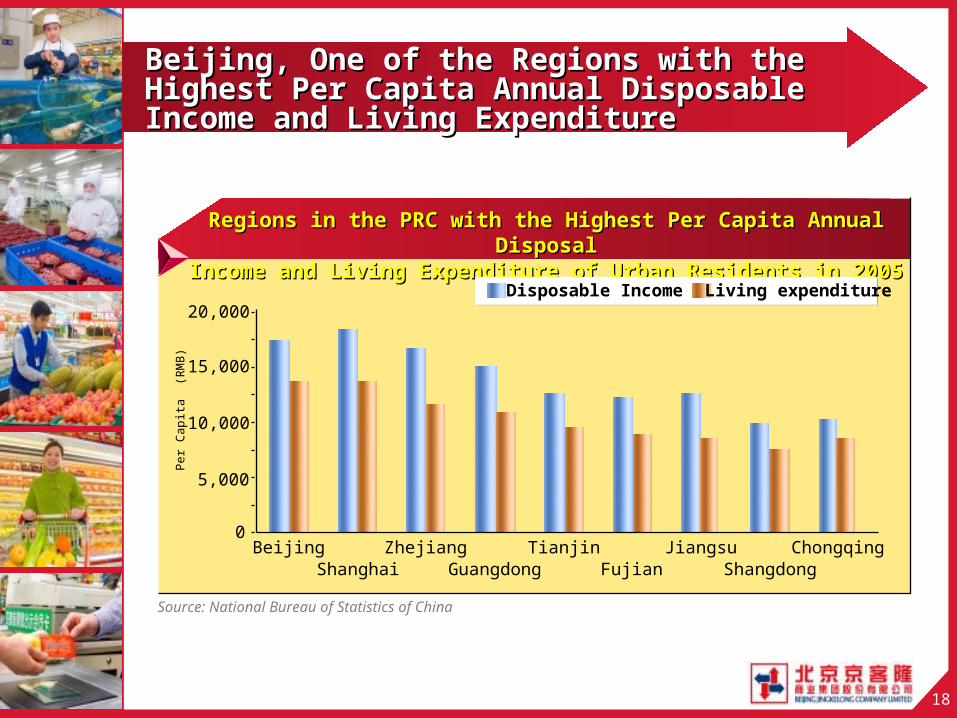
Regions in the PRC with the Highest Per Capita Annual Regions in the PRC with the Highest Per Capita Annual DisposalDisposal
Income and Living Expenditure of Urban Residents in 2005Income and Living Expenditure of Urban Residents in 2005
Beijing, One of the Regions with the Beijing, One of the Regions with the Highest Per Capita Annual Disposable Highest Per Capita Annual Disposable Income and Living ExpenditureIncome and Living Expenditure
Source: National Bureau of Statistics of China
Disposable Income Living expenditure
0
5,000
10,000
15,000
20,000
Beijing Zhejiang Tianjin Jiangsu ChongqingShanghai Guangdong Fujian Shangdong
Per
Cap
ita
(RM
B)
19
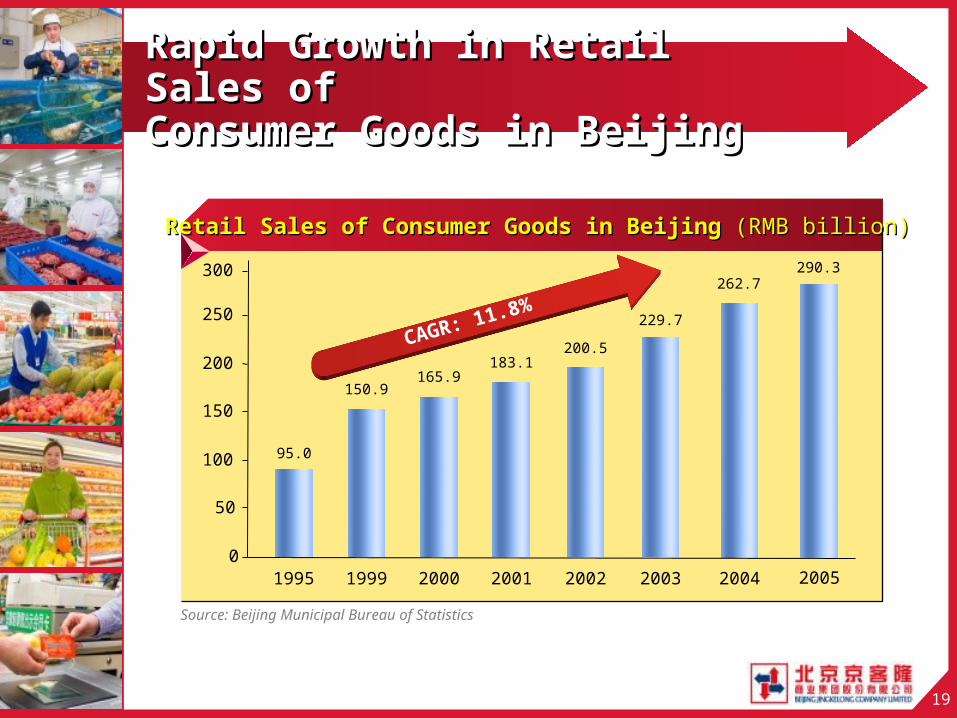
Source: Beijing Municipal Bureau of Statistics
Rapid Growth in Retail Rapid Growth in Retail Sales ofSales ofConsumer Goods in BeijingConsumer Goods in Beijing
Retail Sales of Consumer Goods in Beijing Retail Sales of Consumer Goods in Beijing (RMB billion)(RMB billion)
95.0
150.9165.9
183.1200.5
229.7
262.7
0
50
100
150
200
250
1995 1999 2000 2001 2002 2003 2004
CAGR: 11.8%
290.3
2005
300
20
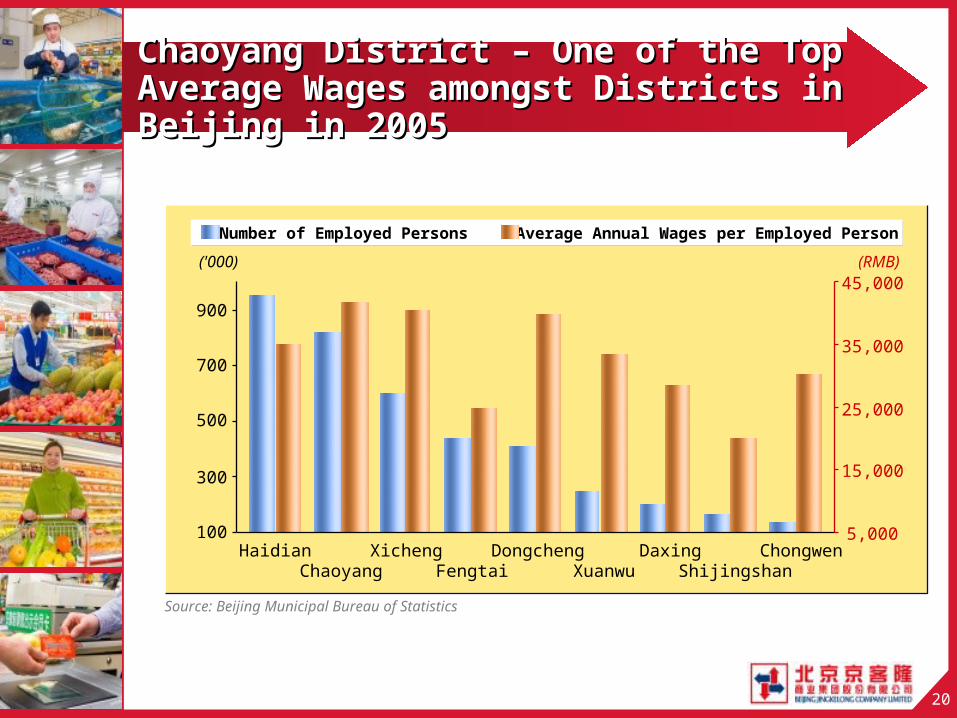
Chaoyang District – One of the Top Chaoyang District – One of the Top Average Wages amongst Districts in Average Wages amongst Districts in Beijing in 2005Beijing in 2005
Source: Beijing Municipal Bureau of Statistics
Number of Employed Persons Average Annual Wages per Employed Person
Chaoyang Fengtai Xuanwu ShijingshanHaidian Xicheng Dongcheng Daxing Chongwen
100
300
500
700
900
5,000
15,000
25,000
35,000
45,000('000) (RMB)
21
Section 3: Section 3: Retail Retail BusinessBusiness
22
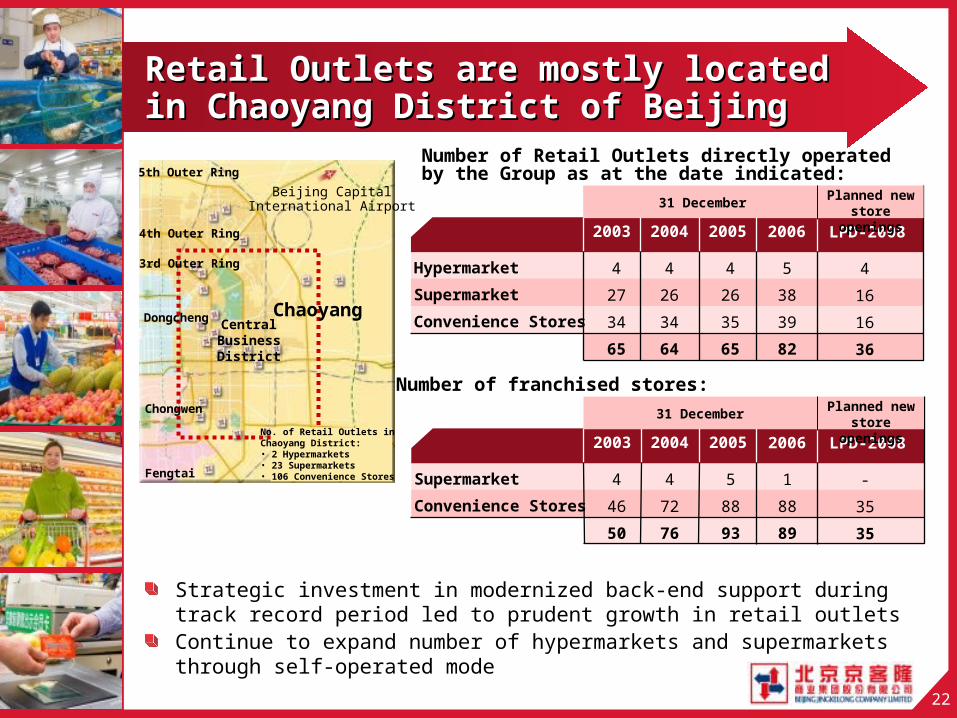
Strategic investment in modernized back-end support during track record period led to prudent growth in retail outletsContinue to expand number of hypermarkets and supermarkets through self-operated mode
Retail Outlets are mostly locatedRetail Outlets are mostly locatedin Chaoyang District of Beijingin Chaoyang District of Beijing
Number of Retail Outlets directly operated by the Group as at the date indicated:
Number of franchised stores:
Fengtai
4th Outer Ring
5th Outer Ring
Beijing CapitalInternational Airport
Central Business District
Chongwen
Dongcheng
3rd Outer Ring
Chaoyang
No. of Retail Outlets in Chaoyang District:• 2 Hypermarkets• 23 Supermarkets• 106 Convenience Stores
2003 20052004
Hypermarket
Supermarket
Convenience Stores
4273465
4
26
3565
4263464
2006
5
38
39
82
31 December
LPD-2008
4
1616
36
Planned new store
openings
2003 20052004
Supermarket
Convenience Stores
4
46
50
5
88
93
4
72
76
2006
1
88
89
31 December
LPD-2008
-
35
35
Planned new store
openings
23
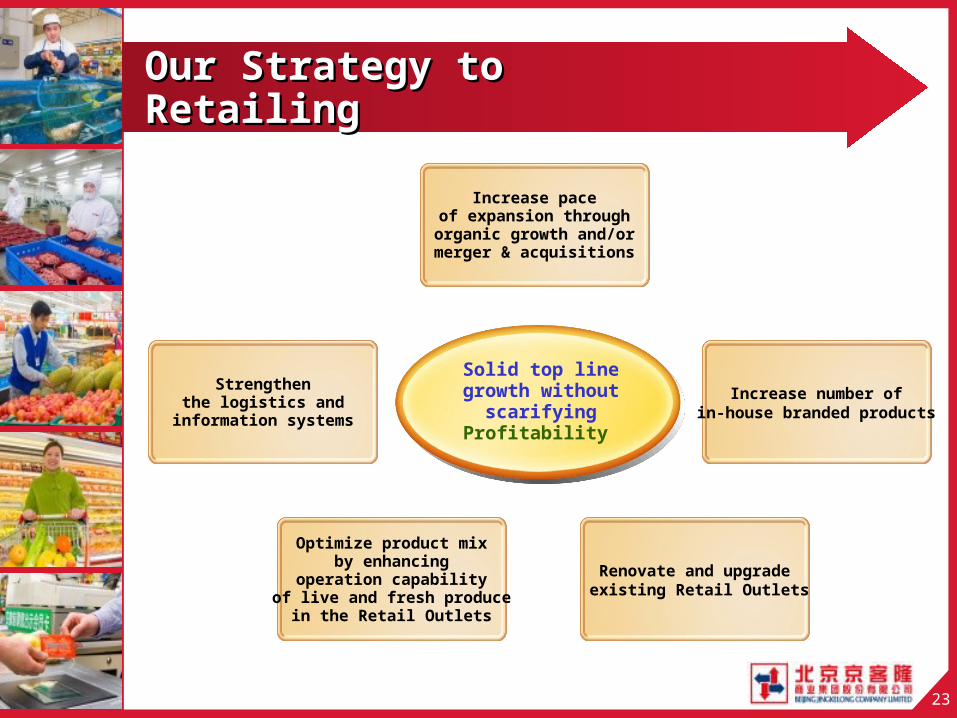
Optimize product mixby enhancing
operation capability of live and fresh produce
in the Retail Outlets
Increase number ofin-house branded products
Our Strategy to Our Strategy to RetailingRetailing
Solid top line growth without
scarifying Profitability
Increase paceof expansion throughorganic growth and/ormerger & acquisitions
Renovate and upgrade existing Retail Outlets
Strengthenthe logistics and
information systems
24
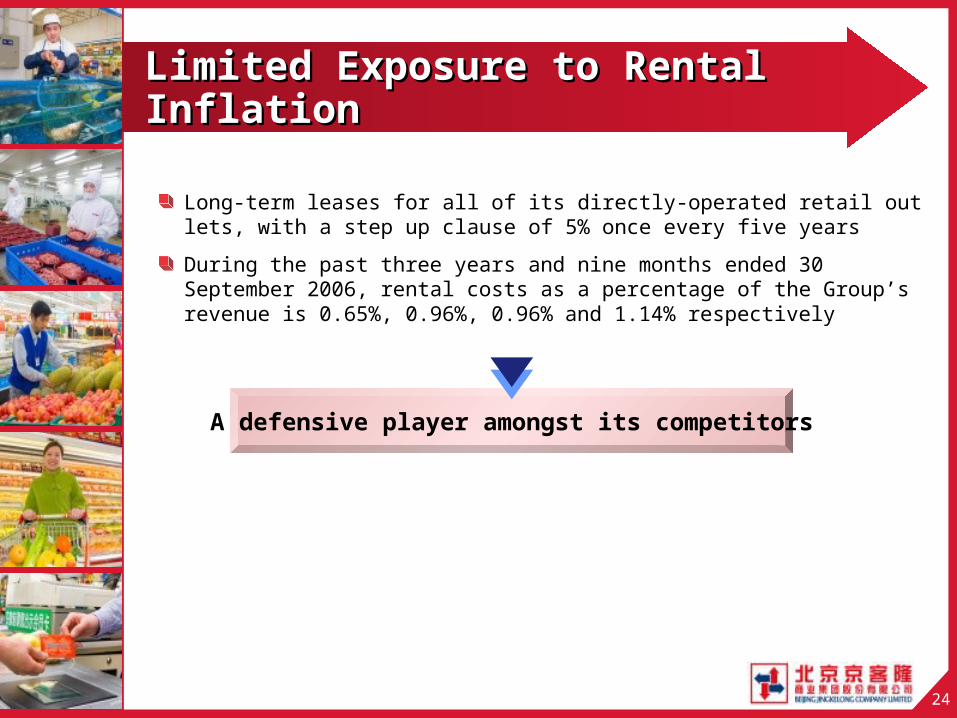
Limited Exposure to Rental Limited Exposure to Rental InflationInflation
Long-term leases for all of its directly-operated retail outlets, with a step up clause of 5% once every five years
During the past three years and nine months ended 30 September 2006, rental costs as a percentage of the Group’s revenue is 0.65%, 0.96%, 0.96% and 1.14% respectively
A defensive player amongst its competitors
25
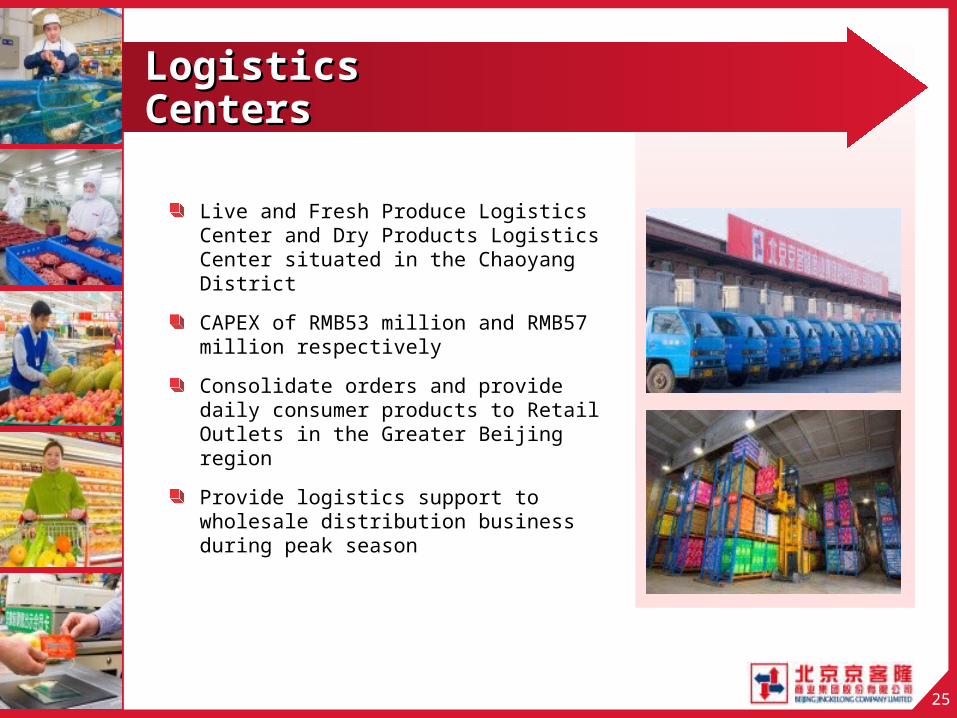
Live and Fresh Produce Logistics Center and Dry Products Logistics Center situated in the Chaoyang District
CAPEX of RMB53 million and RMB57 million respectively
Consolidate orders and provide daily consumer products to Retail Outlets in the Greater Beijing region
Provide logistics support to wholesale distribution business during peak season
Logistics Logistics CentersCenters
26
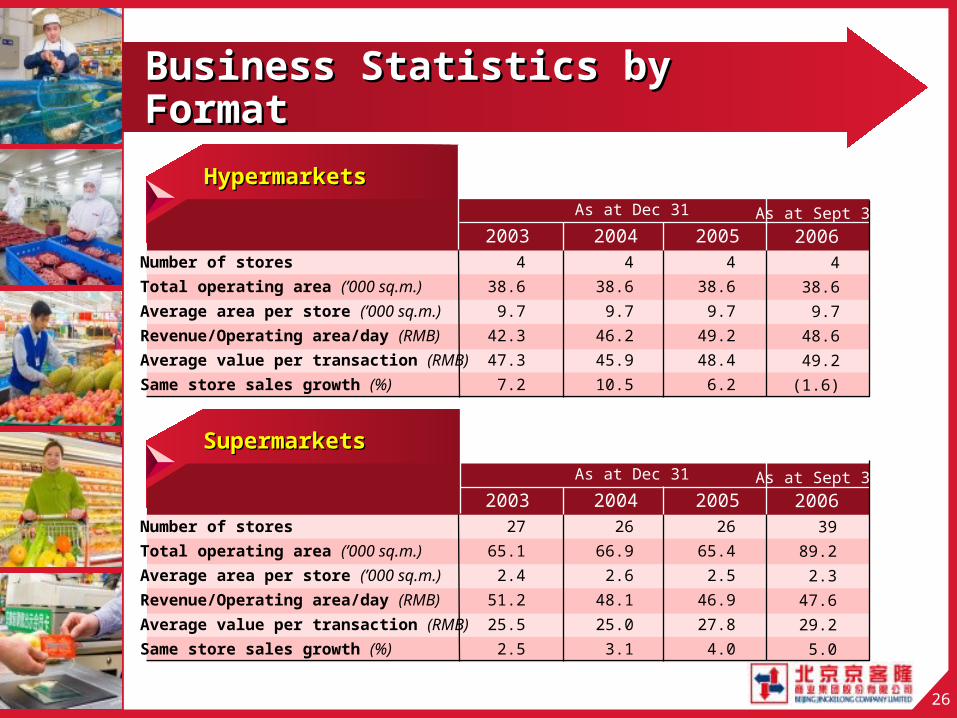
Business Statistics by Business Statistics by FormatFormat
2003 2004 2005
As at Dec 31
HypermarketsHypermarkets
438.69.7
42.347.3
7.2
438.69.7
46.245.910.5
438.6
9.7
49.248.4
6.2
Number of stores
Total operating area (’000 sq.m.)
Average area per store (’000 sq.m.)
Revenue/Operating area/day (RMB)
Average value per transaction (RMB)
Same store sales growth (%)
20064
38.6
9.7
48.6
49.2
(1.6)
As at Sept 30
2003 2004 2005
As at Dec 31
SupermarketsSupermarkets
2765.12.4
51.225.5
2.5
26
66.92.6
48.1
25.03.1
26
65.4
2.5
46.9
27.84.0
Number of stores
Total operating area (’000 sq.m.)
Average area per store (’000 sq.m.)
Revenue/Operating area/day (RMB)
Average value per transaction (RMB)
Same store sales growth (%)
200639
89.2
2.3
47.6
29.2
5.0
As at Sept 30
27
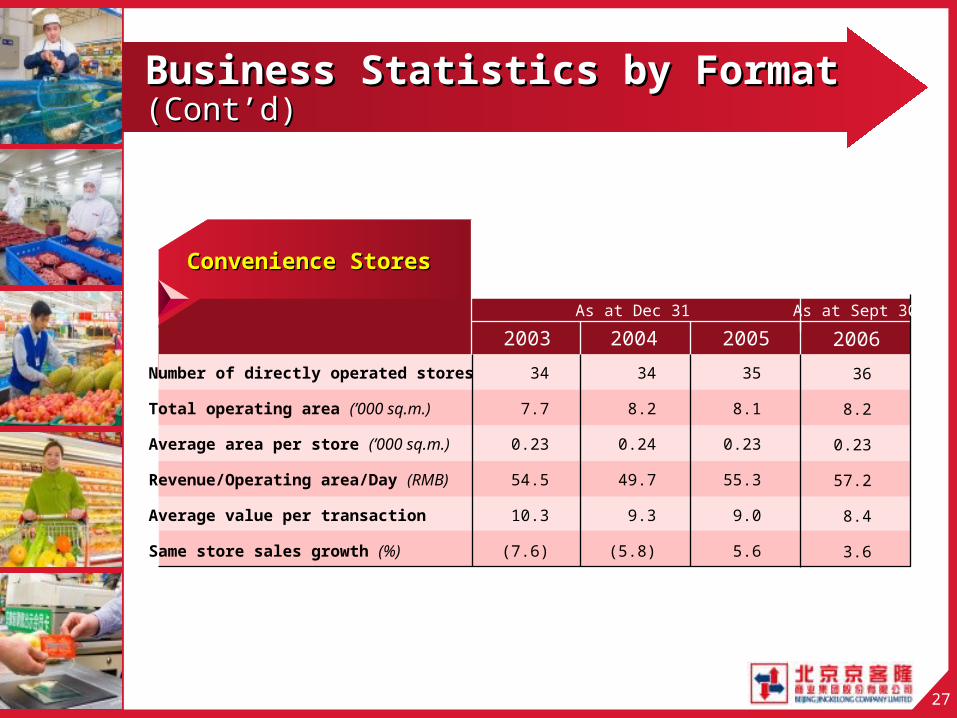
Business Statistics by Format Business Statistics by Format (Cont’d)(Cont’d)
2003 2004 2005
As at Dec 31
Convenience Stores Convenience Stores
Number of directly operated stores
Total operating area (’000 sq.m.)
Average area per store (’000 sq.m.)
Revenue/Operating area/Day (RMB)
Average value per transaction
Same store sales growth (%)
34
7.7
0.23
54.5
10.3
(7.6)
34
8.2
0.24
49.7
9.3
(5.8)
35
8.1
0.23
55.3
9.0
5.6
2006
36
8.2
0.23
57.2
8.4
3.6
As at Sept 30
28
Section 4: Section 4: Wholesale Wholesale BusinessBusiness
29
Close relationship with suppliers and customers build over 20 years of operating history
Huge market potential brought forth by rapid growth of retail industry
With long history in wholesale sector, the Group is prepared for future competition from foreign competitors
Control supply chains to prevent revenue leakage and strengthen customer loyalty
Logics Behind Going into Logics Behind Going into WholesalingWholesaling
30
Our Strategy to Our Strategy to WholesalingWholesaling
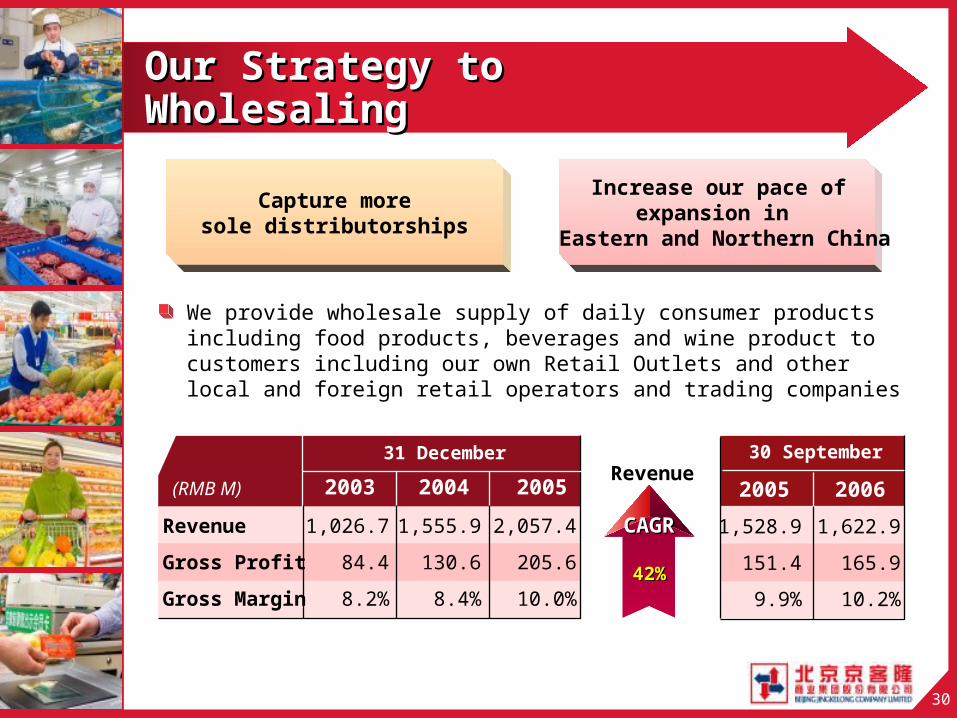
We provide wholesale supply of daily consumer products including food products, beverages and wine product to customers including our own Retail Outlets and other local and foreign retail operators and trading companies
2003 2005(RMB M) 2004
Revenue
Gross Profit
Gross Margin
1,026.7
84.4
8.2%
2,057.4
205.6
10.0%
1,555.9
130.6
8.4%
Capture moresole distributorships
Increase our pace ofexpansion in
Eastern and Northern China
Revenue
CAGRCAGR
42%42%
20062005
1,622.9
165.9
10.2%
1,528.9
151.4
9.9%
31 December 30 September
31
Distribution Distribution CentersCenters
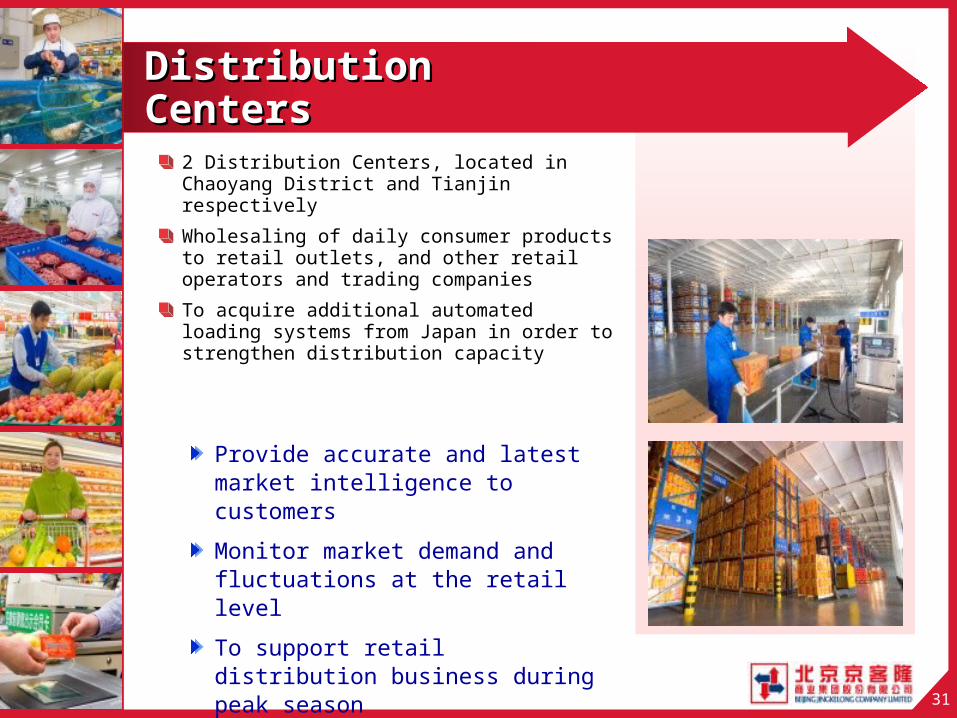
Provide accurate and latest market intelligence to customers
Monitor market demand and fluctuations at the retail level
To support retail distribution business during peak season
2 Distribution Centers, located in Chaoyang District and Tianjin respectively
Wholesaling of daily consumer products to retail outlets, and other retail operators and trading companies
To acquire additional automated loading systems from Japan in order to strengthen distribution capacity
32
Section 5: Section 5: Financial Financial HighlightsHighlights
CHEN LiminCHEN LiminChief Financial OfficerChief Financial Officer
33
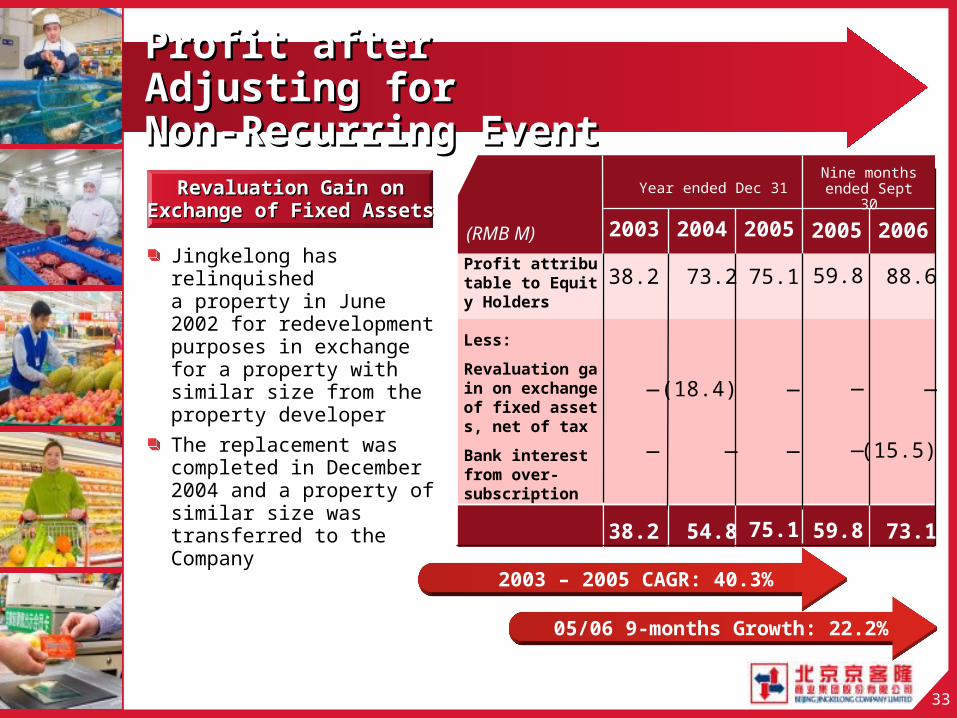
Profit after Adjusting Profit after Adjusting forforNon-Recurring EventNon-Recurring Event
2003 2004
Year ended Dec 31
2005(RMB M)
Profit attributable to Equity Holders
Less:
Revaluation gain on exchangeof fixed assets, net of tax
Bank interest from over-subscription
38.2
—
—
38.2
73.2
(18.4)
—
54.8
75.1
—
—
75.1
2003 – 2005 CAGR: 40.3%
Jingkelong has relinquisheda property in June 2002 for redevelopment purposes in exchange for a property with similar size from the property developer
The replacement was completed in December 2004 and a property of similar size was transferred to the Company
Revaluation Gain onRevaluation Gain onExchange of Fixed AssetsExchange of Fixed Assets
2006
88.6
—
(15.5)
73.1
Nine months ended Sept
30
59.8
—
—
59.8
2005
05/06 9-months Growth: 22.2%
34
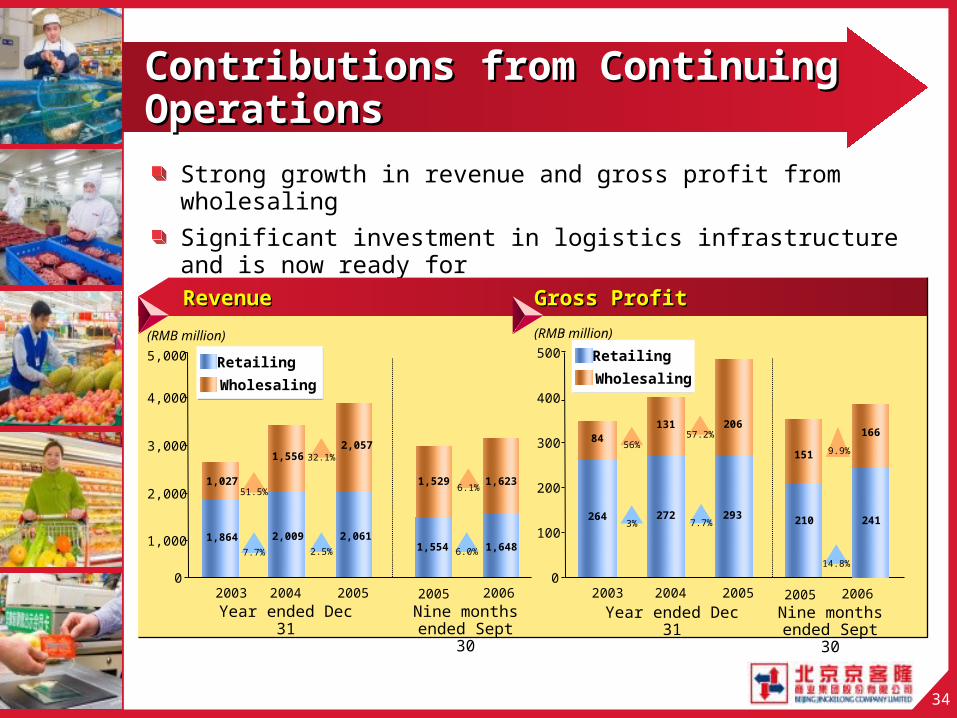
Contributions from Continuing Contributions from Continuing OperationsOperations
Strong growth in revenue and gross profit from wholesaling
Significant investment in logistics infrastructure and is now ready forrapid expansion for retail and wholesale businessesRevenueRevenue Gross ProfitGross Profit
Year ended Dec 31
(RMB million) (RMB million)
1,864 2,009
1,027
1,556
0
1,000
2,000
3,000
4,000
2003 2004 2005
264 272
84131
0
100
200
300
400
500
2003 2004 2005
5,000
2,061
2,057
293
206
Retailing
WholesalingRetailing
Wholesaling
2005 2006Nine months
ended Sept 30Year ended Dec
31
2005 2006Nine months
ended Sept 30
51.5%
7.7%
32.1%
2.5%
56%
3%
57.2%
7.7%
1,554
1,529
1,648
1,6236.1%
6.0%
210
151
241
166
14.8%
9.9%
35
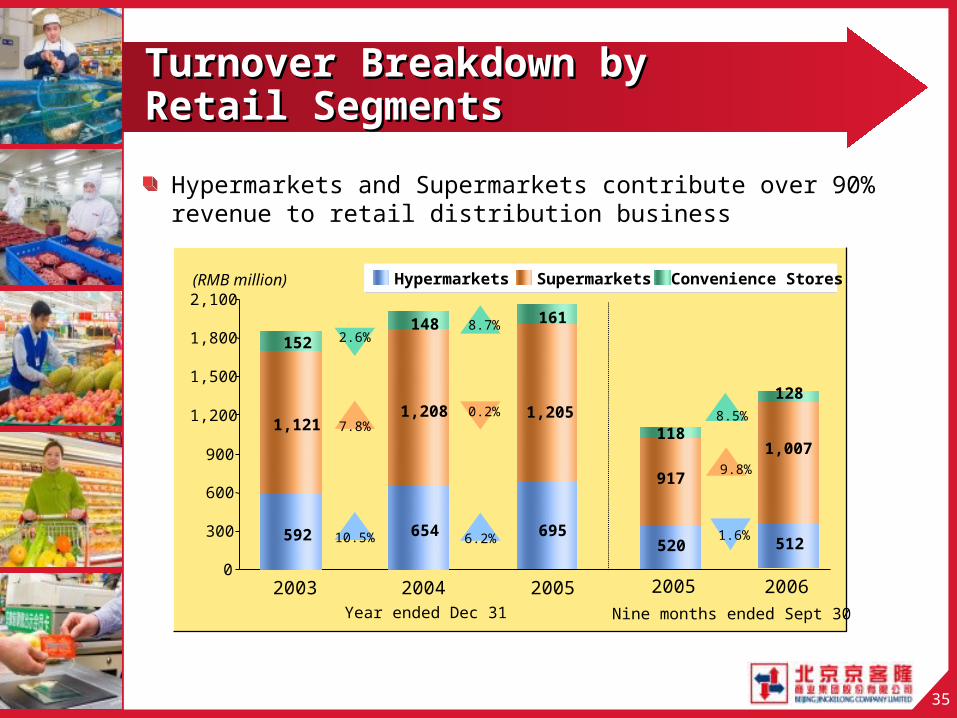
(RMB million)
Year ended Dec 31
Hypermarkets Convenience Stores
7.8%
10.5%
Supermarkets
2.6%
592 654
1,1211,208
152148
0
300
600
900
1,200
1,500
1,800
2,100
2003 2004 2005
695
1,205
161
6.2%
0.2%
8.7%
1.6%
Turnover Breakdown by Turnover Breakdown by Retail SegmentsRetail Segments
Hypermarkets and Supermarkets contribute over 90% revenue to retail distribution business
Nine months ended Sept 302005 2006
512
1,007
128
520
917
118
9.8%
8.5%
592 654
1,1211,208
152148
695
1,205
161
36
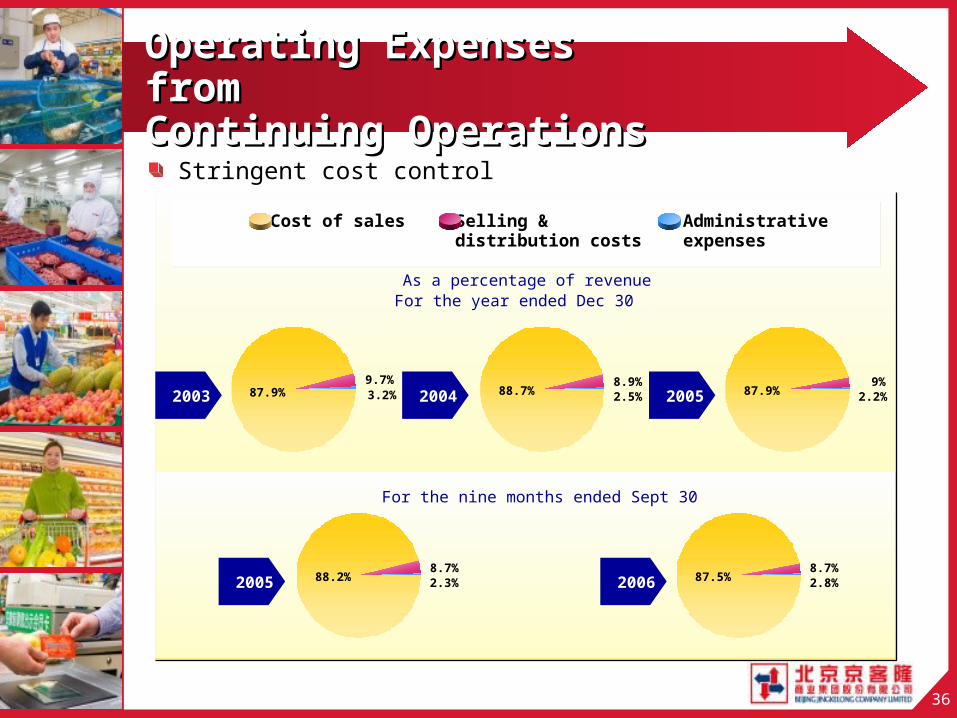
Operating Expenses Operating Expenses fromfromContinuing Continuing OperationsOperations
For the year ended Dec 30
2004
Cost of sales Selling &distribution costs
Administrativeexpenses
20052003
Stringent cost control
87.9%9.7%3.2% 88.7%
8.9%2.5% 87.9%
9%2.2%
As a percentage of revenue
2005 200688.2%8.7%2.3% 87.5%
8.7%2.8%
For the nine months ended Sept 30
37
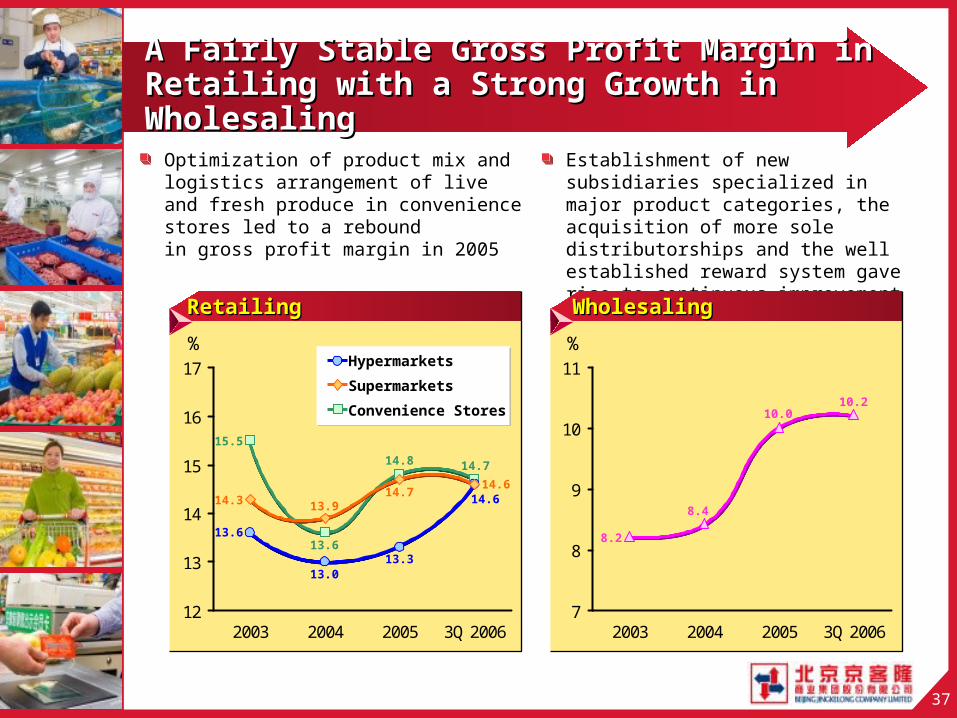
A Fairly Stable Gross Profit Margin inA Fairly Stable Gross Profit Margin inRetailing with a Strong Growth in Retailing with a Strong Growth in WholesalingWholesaling
Optimization of product mix and logistics arrangement of live and fresh produce in convenience stores led to a reboundin gross profit margin in 2005
Establishment of new subsidiaries specialized in major product categories, the acquisition of more sole distributorships and the well established reward system gave rise to continuous improvement in gross profit marginWholesalingWholesalingRetailingRetailing
12
13
14
15
16
17
2003 2004 2005 3Q 2006
Hypermarkets
Supermarkets
Convenience Stores
7
8
9
10
11
2003 2004 2005 3Q 2006
14.614.6
14.7
13.3
13.6
13.0
14.3 13.914.7
15.5
13.6
14.8
10.210.0
8.2
8.4
% %
38
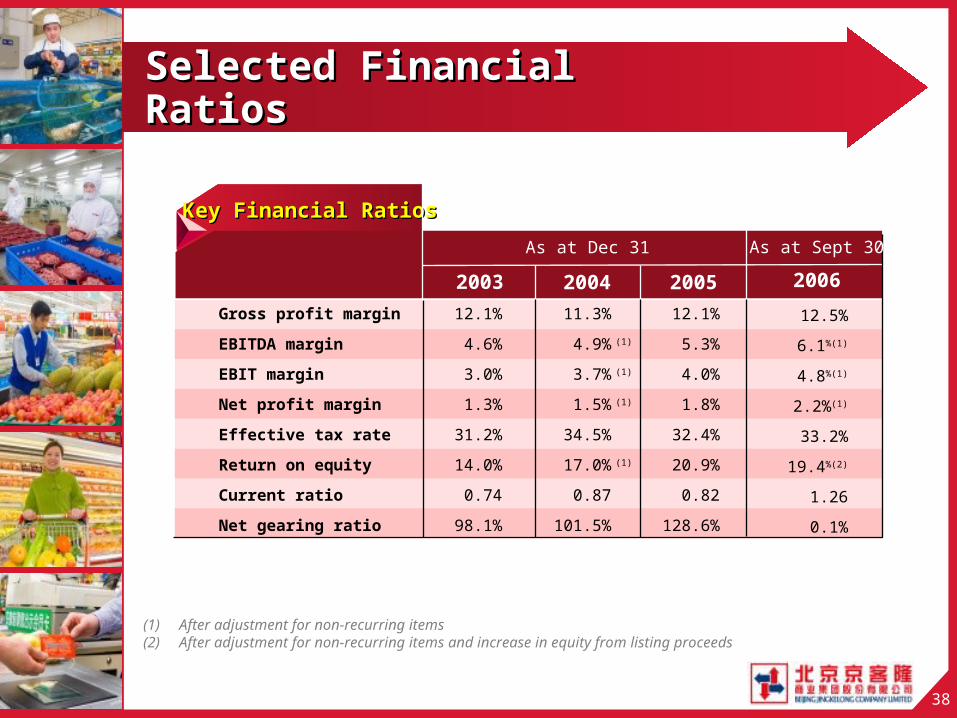
Selected Financial Selected Financial RatiosRatios
(1) After adjustment for non-recurring items(2) After adjustment for non-recurring items and increase in equity from listing
proceeds
Gross profit margin
EBITDA margin
EBIT margin
Net profit margin
Effective tax rate
Return on equity
Current ratio
Net gearing ratio
2003
Key Financial RatiosKey Financial Ratios
2004
As at Dec 31
12.1%
5.3%
4.0%
1.8%
32.4%
20.9%
0.82
128.6%
11.3%
4.9% (1)
3.7% (1)
1.5% (1)
34.5%
17.0% (1)
0.87
101.5%
12.1%
4.6%
3.0%
1.3%
31.2%
14.0%
0.74
98.1%
20062005
12.5%
6.1%(1)
4.8%(1)
2.2%(1)
33.2%
19.4%(2)
1.26
0.1%
As at Sept 30
39
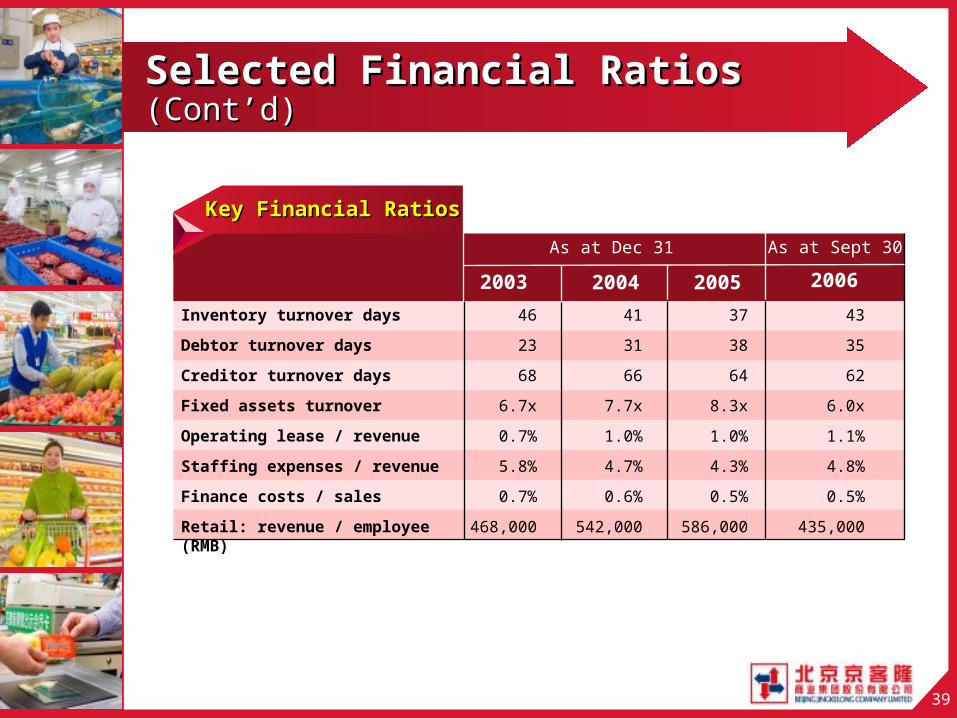
Selected Financial Ratios Selected Financial Ratios (Cont’d)(Cont’d)
Inventory turnover days
Debtor turnover days
Creditor turnover days
Fixed assets turnover
Operating lease / revenue
Staffing expenses / revenue
Finance costs / sales
Retail: revenue / employee (RMB)
Key Financial RatiosKey Financial Ratios
2003 2004
As at Dec 31
20062005
As at Sept 30
46
23
68
6.7x
0.7%
5.8%
0.7%
468,000
41
31
66
7.7x
1.0%
4.7%
0.6%
542,000
37
38
64
8.3x
1.0%
4.3%
0.5%
586,000
43
35
62
6.0x
1.1%
4.8%
0.5%
435,000
40
Section 6: Section 6: Future PlansFuture Plans
WEI TingzhanWEI Tingzhan
41
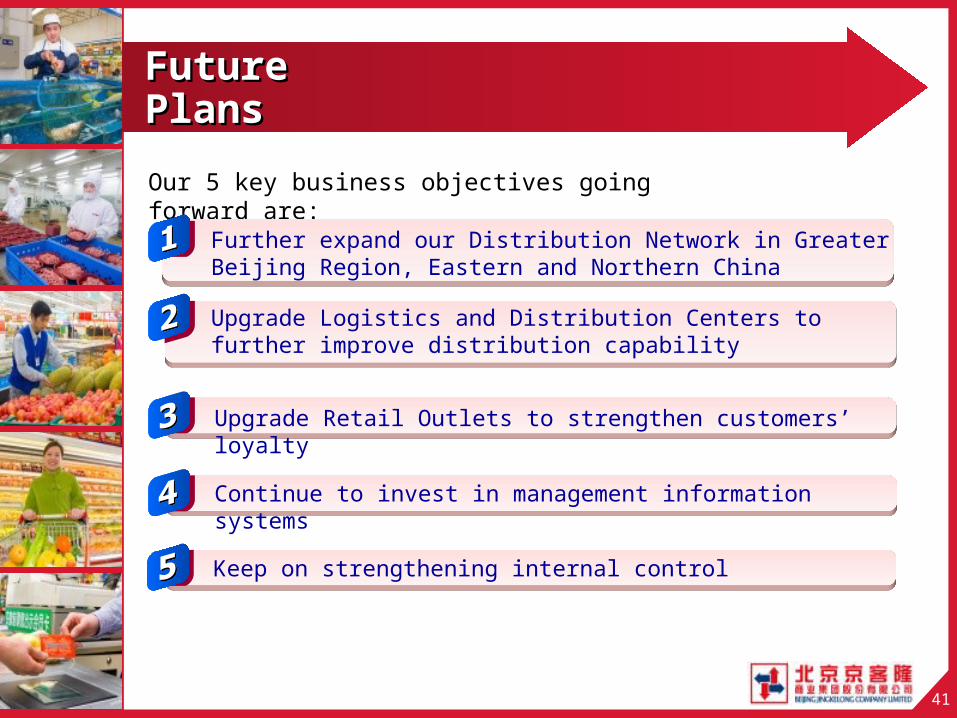
Future Future PlansPlans
Our 5 key business objectives going forward are:
Further expand our Distribution Network in Greater Beijing Region, Eastern and Northern China
Upgrade Logistics and Distribution Centers to further improve distribution capability
Upgrade Retail Outlets to strengthen customers’ loyalty
Keep on strengthening internal control
Continue to invest in management information systems