Embed Size (px)
Citation preview
South Gippsland Water Corporate Plan
2014/15 to 2018/19
1
CORPORATE PLAN
2014/15 to 2018/19
South Gippsland Water Corporate Plan
2014/15 to 2018/19
2
1. Introduction South Gippsland Water has prepared this five year Corporate Plan for 2014/15 to 2018/19 in compliance with Section 247 and 248 of the Water Act 1989. 2014/15 is the second year of South Gippsland Water’s five year Water Plan (2013/14 to 2017/18). In January 2014, the Minister for Water announced the Fairer Water Bills initiative, a major efficiency program to drive down household water bills. Along with other Victorian water businesses, South Gippsland Water participated in this significant program and together with the Independent Reviewer, Professor Graeme Samuel AC, Deloitte Consultants and the Office of Living Victoria (OLV) identified and agreed a number of efficiency initiatives. These initiatives, the lower operational and capital expenditure and the resultant lower household water bills have been embedded into this Corporate Plan from 1 July 2014. A number of whole-of-sector efficiencies will be further developed through the next phase of the Fairer Water Bills initiative and South Gippsland Water will work with the OLV on detailed implementation of these over coming months. These anticipated savings have also been passed on to customers in lower tariffs from 1st July 2014. The Poowong, Loch and Nyora Sewerage Scheme is a major capital expenditure project for the Corporation. Estimated in the draft Water Plan at nearly $30M, the project was nominated by the Minister for Water under the Country Towns Sewerage Scheme to address the public health and amenity needs of the community. During 2013/2014 South Gippsland Water completed a review of the project including;
• Opportunities to be leveraged with neighbouring South East Water, • Alternate scheme options, • Other technology solutions, and; • To what extent development capacity was built in.
The outcomes of the review have resulted in a collaborative project with South East Water where an innovative pressure sewer collection system will be constructed under a joint agreement between the two organisations. In addition, wastewater will be transferred under agreement to South East Water’s Lang Lang Treatment Plant for treatment and reuse, negating the need for South Gippsland Water to construct a new treatment facility. An analysis of allotment size within the townships resulted in a tiered structure encompassing two distinct service areas. Much of the area originally identified to be sewered remains included in the scheme, an $800 Mandatory Service Area of smaller central allotments and a $5,000 Voluntary Service Area for larger allotments with the capacity to treat and retain effluent on site. An innovative pressure sewer collection system is to be installed for all three townships. In addition, a Pilot Project “Liveable Small Towns” has been developed incorporating Whole of Water Cycle Management principles and local solutions for water management to be delivered simultaneously with the construction of the Poowong, Loch and Nyora Sewerage Scheme. The entire project will be delivered for less than $20M, a significant saving against the initial estimates of $30M for a traditional modified gravity scheme.
South Gippsland Water Corporate Plan
2014/15 to 2018/19
3
Over the last few years South Gippsland Water completed, and consulted with the community and other stakeholders with respect to its 50 year Water Supply Demand Strategy. The strategy documented potential water use and options for securing the region’s water supplies, for the next 50 years. The Water Supply Demand Strategy included an analysis focusing on networking the corporation’s Northern and Southern systems. The Northern Towns business case analysis documented the cost of augmenting and maintaining multiple existing surface water systems and meeting emerging water quality standards, against utilising South Gippsland Water’s largest reservoir, Lance Creek, as a primary water supply and the Melbourne Supply System as backup. The analysis recommended utilising the 82km pipeline constructed by the State Government connecting to the Melbourne Supply System as well as South Gippsland Water’s existing connection to that system. In the short to medium term the Melbourne Supply System would only be used as a back up to the Lance Creek Reservoir supply. This would secure the townships of Inverloch, Wonthaggi, Cape Paterson, Poowong, Loch, Nyora & Korumburra against drought as well as mitigate the risk of local water quality issues such as blue green algae outbreaks. The strategy encompasses the interconnection of the Southern and Northern towns to provide a single efficient system which would avoid costly numerous individual upgrades to small treatment plants and systems with unreliable yields due to small storages. The certainty of supply would enable levels of regional growth which would otherwise not have been possible. During 2013/14, South Gippsland Water submitted a Business Case for $21.4 M of government support to implement the project, however, funds were not allocated via the 2014/15 State Government budget. As such, South Gippsland Water will revise options, if possible, for more incremental expenditure to meet the demands of residential and business customers, including major customers, Murray Goulburn and Burra Foods. This revised planning has commenced and will be reflected in the 2015/16 Corporate Plan. In the short term, South Gippsland Water faces the significant challenge of ensuring water availability to its Northern Towns (in particular Korumburra) in the context of major customer expansion, population growth and potential climatic volatility. As immediate actions for this Corporate Plan, South Gippsland Water will need to renegotiate its Bulk Entitlement from the Tarwin River, and utilise a temporary pump station and a network of aged wastewater pipeline and pump infrastructure to augment supply to Korumburra during late summer and autumn. This plan incorporates the Corporation’s key goals, objectives, strategies and performance targets in order to meet regulatory compliance and deliver quality water and wastewater services to its customers. It ensures the day to day needs of customers and stakeholders are met, and sets out the medium and long term strategies and actions to ensure the sustainable management of the regions key resources.
South Gippsland Water Corporate Plan
2014/15 to 2018/19
4
Major capital expenditure over the planning period focuses on:
• Implementation of the Liveable Small Towns pilot project encompassing (in conjunction with South East Water) construction of a pressure reticulation sewerage scheme for the towns of Poowong, Loch, and Nyora, with embedded Whole of Water Cycle Management initiatives.
• Completion of construction of a pressure reticulation sewer system as part of the Alberton Sewerage Scheme.
• Further improvement works at water treatment plants and watermains replacement and renewals to increase water supply quality and resilience through all systems.
• Sewer system upgrades throughout the region’s townships, including Wonthaggi, Inverloch, Foster, Korumburra and Leongatha.
• Sludge management projects at Wonthaggi and Inverloch including the use of new technology to allow an efficient ongoing program of sludge handling.
• Investment in appropriate new technologies to improve service performance outcomes and operational efficiency.
• Providing outcomes for the environment via improved water and wastewater service network reliability through priority identified and categorised renewal works.
Major Initiatives South Gippsland Water, in dealing with ongoing challenges and emerging issues, has set out major initiatives that will be implemented over this Corporate Plan period. The decline in, and variability of inflows, together with forecast population increases has resulted in South Gippsland Water considering a number of actions in its 50 year Water Supply Demand Strategy. These have included:
• Whole of Water Cycle Management analysis for Korumburra and Poowong, Loch, Nyora
• Interconnecting existing water systems and connecting to the Melbourne Supply System;
• Increasing the amount of water that can be accessed by the urban supply system;
The prime objective is to improve resilience of systems to ensure that a timely balance between supply and future short and long term demand can be met. Water initiatives will focus on:
• Implementing a cost effective sustainable Water Supply Demand Strategy which will ensure future demand will be met taking into consideration regional growth and the impacts of climate change/variability.
• Securing and developing reliable new water sources while continuing to
develop Whole of Water Cycle Management initiatives and further demand management.
South Gippsland Water Corporate Plan
2014/15 to 2018/19
5
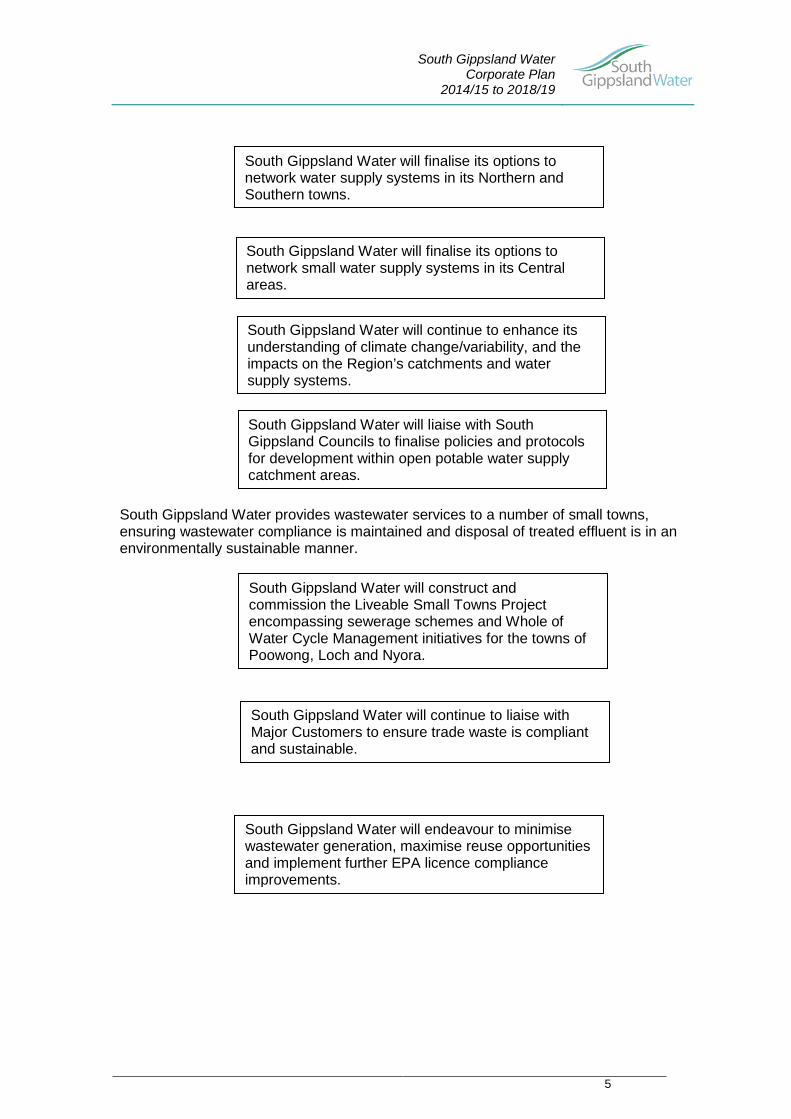
South Gippsland Water provides wastewater services to a number of small towns, ensuring wastewater compliance is maintained and disposal of treated effluent is in an environmentally sustainable manner.
South Gippsland Water will continue to enhance its understanding of climate change/variability, and the impacts on the Region’s catchments and water supply systems.
South Gippsland Water will continue to liaise with Major Customers to ensure trade waste is compliant and sustainable.
South Gippsland Water will finalise its options to network water supply systems in its Northern and Southern towns.
South Gippsland Water will construct and commission the Liveable Small Towns Project encompassing sewerage schemes and Whole of Water Cycle Management initiatives for the towns of Poowong, Loch and Nyora.
South Gippsland Water will finalise its options to network small water supply systems in its Central areas.
South Gippsland Water will endeavour to minimise wastewater generation, maximise reuse opportunities and implement further EPA licence compliance improvements.
South Gippsland Water will liaise with South Gippsland Councils to finalise policies and protocols for development within open potable water supply catchment areas.
South Gippsland Water Corporate Plan
2014/15 to 2018/19
6
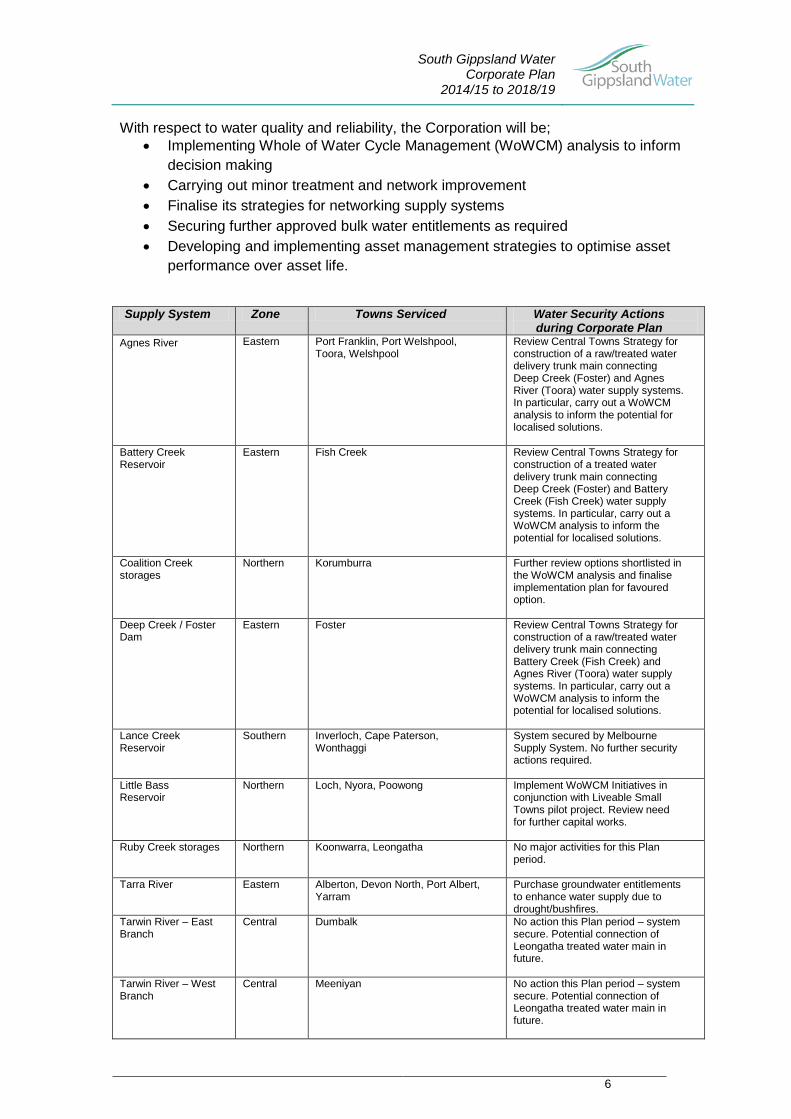
With respect to water quality and reliability, the Corporation will be; • Implementing Whole of Water Cycle Management (WoWCM) analysis to inform
decision making • Carrying out minor treatment and network improvement • Finalise its strategies for networking supply systems • Securing further approved bulk water entitlements as required • Developing and implementing asset management strategies to optimise asset
performance over asset life.
Supply System Zone Towns Serviced Water Security Actions
during Corporate Plan Agnes River Eastern Port Franklin, Port Welshpool,
Toora, Welshpool Review Central Towns Strategy for construction of a raw/treated water delivery trunk main connecting Deep Creek (Foster) and Agnes River (Toora) water supply systems. In particular, carry out a WoWCM analysis to inform the potential for localised solutions.
Battery Creek Reservoir
Eastern Fish Creek Review Central Towns Strategy for construction of a treated water delivery trunk main connecting Deep Creek (Foster) and Battery Creek (Fish Creek) water supply systems. In particular, carry out a WoWCM analysis to inform the potential for localised solutions.
Coalition Creek storages
Northern Korumburra Further review options shortlisted in the WoWCM analysis and finalise implementation plan for favoured option.
Deep Creek / Foster Dam
Eastern Foster Review Central Towns Strategy for construction of a raw/treated water delivery trunk main connecting Battery Creek (Fish Creek) and Agnes River (Toora) water supply systems. In particular, carry out a WoWCM analysis to inform the potential for localised solutions.
Lance Creek Reservoir
Southern Inverloch, Cape Paterson, Wonthaggi
System secured by Melbourne Supply System. No further security actions required.
Little Bass Reservoir
Northern Loch, Nyora, Poowong Implement WoWCM Initiatives in conjunction with Liveable Small Towns pilot project. Review need for further capital works.
Ruby Creek storages Northern Koonwarra, Leongatha No major activities for this Plan period.
Tarra River Eastern Alberton, Devon North, Port Albert, Yarram
Purchase groundwater entitlements to enhance water supply due to drought/bushfires.
Tarwin River – East Branch
Central Dumbalk No action this Plan period – system secure. Potential connection of Leongatha treated water main in future.
Tarwin River – West Branch
Central Meeniyan No action this Plan period – system secure. Potential connection of Leongatha treated water main in future.
South Gippsland Water Corporate Plan
2014/15 to 2018/19
7
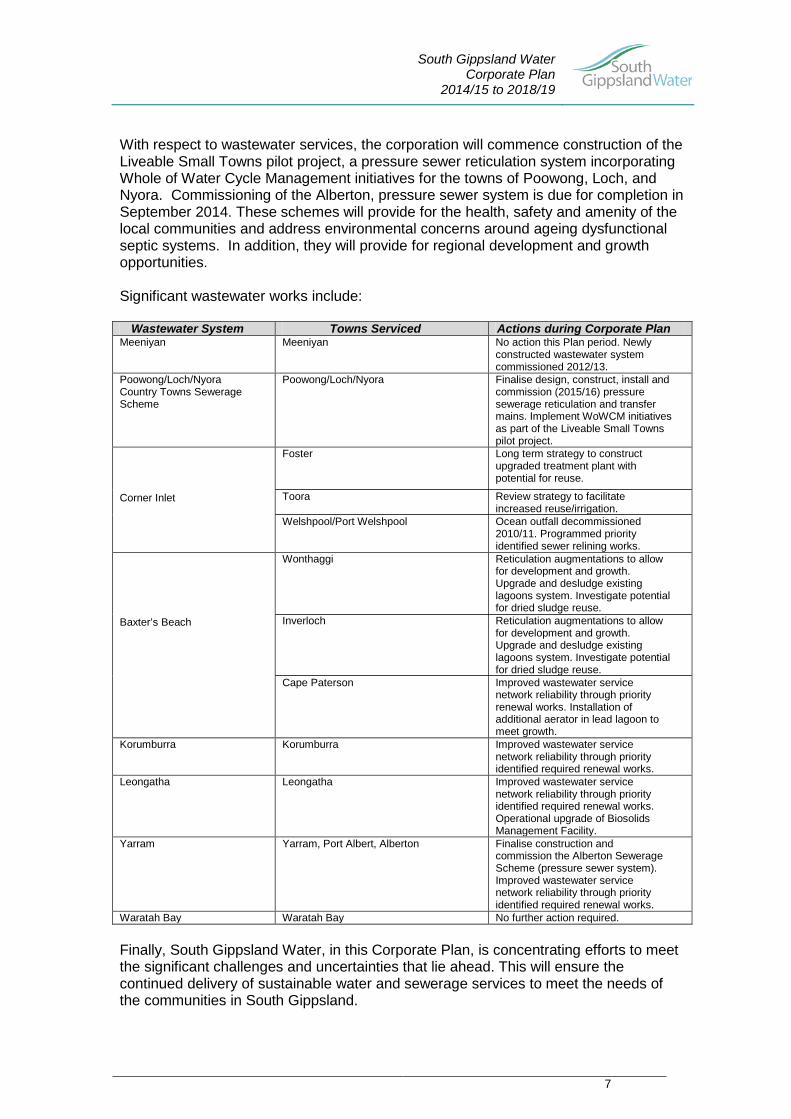
With respect to wastewater services, the corporation will commence construction of the Liveable Small Towns pilot project, a pressure sewer reticulation system incorporating Whole of Water Cycle Management initiatives for the towns of Poowong, Loch, and Nyora. Commissioning of the Alberton, pressure sewer system is due for completion in September 2014. These schemes will provide for the health, safety and amenity of the local communities and address environmental concerns around ageing dysfunctional septic systems. In addition, they will provide for regional development and growth opportunities. Significant wastewater works include:
Wastewater System Towns Serviced Actions during Corporate Plan Meeniyan Meeniyan No action this Plan period. Newly
constructed wastewater system commissioned 2012/13.
Poowong/Loch/Nyora Country Towns Sewerage Scheme
Poowong/Loch/Nyora Finalise design, construct, install and commission (2015/16) pressure sewerage reticulation and transfer mains. Implement WoWCM initiatives as part of the Liveable Small Towns pilot project.
Foster Long term strategy to construct upgraded treatment plant with potential for reuse.
Corner Inlet Toora Review strategy to facilitate increased reuse/irrigation.
Welshpool/Port Welshpool Ocean outfall decommissioned 2010/11. Programmed priority identified sewer relining works.
Wonthaggi Reticulation augmentations to allow for development and growth. Upgrade and desludge existing lagoons system. Investigate potential for dried sludge reuse.
Baxter’s Beach Inverloch Reticulation augmentations to allow for development and growth. Upgrade and desludge existing lagoons system. Investigate potential for dried sludge reuse.
Cape Paterson Improved wastewater service network reliability through priority renewal works. Installation of additional aerator in lead lagoon to meet growth.
Korumburra Korumburra Improved wastewater service network reliability through priority identified required renewal works.
Leongatha Leongatha Improved wastewater service network reliability through priority identified required renewal works. Operational upgrade of Biosolids Management Facility.
Yarram Yarram, Port Albert, Alberton Finalise construction and commission the Alberton Sewerage Scheme (pressure sewer system). Improved wastewater service network reliability through priority identified required renewal works.
Waratah Bay Waratah Bay No further action required. Finally, South Gippsland Water, in this Corporate Plan, is concentrating efforts to meet the significant challenges and uncertainties that lie ahead. This will ensure the continued delivery of sustainable water and sewerage services to meet the needs of the communities in South Gippsland.
South Gippsland Water Corporate Plan
2014/15 to 2018/19
8
2. South Gippsland Water South Gippsland is located around 2 hours drive from the south eastern suburbs of Melbourne, and is well known for its coastal resorts and National Parks such as Wilson’s Promontory and Tarra Bulga. The Corporation is acutely aware that the region’s “natural capital” has a high public profile. South Gippsland is predominantly an agricultural area, with the main emphasis on dairy farming. The region seeks to maximise its strength as a leading Victorian dairy farming and dairy products producer with two major dairy companies located in the area. Tourism is also an industry of significant importance to the region. The Corporation demonstrates its commitment to the stewardship of the region’s “natural capital” through initiatives based on continuous improvement at all our operational facilities, together with programs aimed at raising community awareness. South Gippsland Water supports and participates in local activities with a wide range of community groups involved in broader environmental programs that address the interconnection of all of the elements of the region’s ecosystems. South Gippsland Water is fully aware that the services it provides are essential to the economic survival, development and well-being of the region. Accordingly, South Gippsland Water takes into account and collaborate with the programs and activities of other regional agencies in developing its strategies and plans, in so doing, contributing to an integrated regional approach to natural resource management. The demographics of the region are also undergoing change due to the demand for coastal residential real estate. Wonthaggi, Inverloch, Cape Paterson and Waratah Bay are examples with strong residential real estate prices and the influx of a new socio-economic segment of customers to the region. The Corporation produces potable drinking water product from its water treatment plants. It also produces treated waste streams from its sewerage treatment plants. These processes are undertaken while meeting stringent environmental demands and satisfying customer expectations at a cost that is sustainable and a price to consumers that is ratified by the economic regulator. All this is achieved with a team that is small by industry standards.
2.1 Services Provided by South Gippsland Water South Gippsland Water employs a multi skilled workforce that covers the disciplines of planning, administration, finance, customer services, engineering, operations, maintenance, and construction management. Most engineering design is outsourced. The Corporation has a skills-based, seven member Board, appointed by the Minister for Water. The Corporation is managed by an executive team, led by the Managing Director, who also is a Board member. South Gippsland Water provides the full range of water supply functions, including water harvesting and storage, water treatment, urban water supply, as well as wastewater collection, treatment, disposal and reuse, and major trade waste services. During 2013/14, a total of 106 ML of recycled water was used mainly for pasture irrigation. A small percentage of this total was provided for watering sporting grounds (5 ML). Strategic emphasis on environmentally beneficial re-use is expected to result in an increase in the re-use of treated wastewater over the medium to long term.
South Gippsland Water Corporate Plan
2014/15 to 2018/19
9
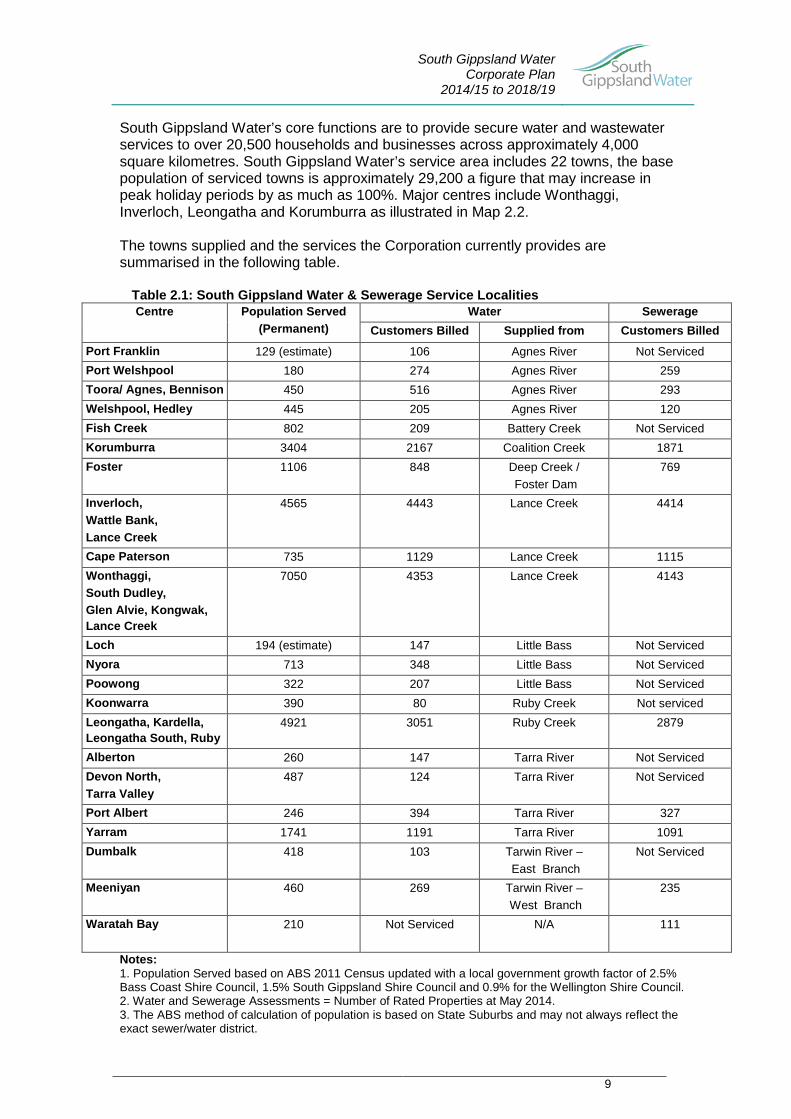
South Gippsland Water’s core functions are to provide secure water and wastewater services to over 20,500 households and businesses across approximately 4,000 square kilometres. South Gippsland Water’s service area includes 22 towns, the base population of serviced towns is approximately 29,200 a figure that may increase in peak holiday periods by as much as 100%. Major centres include Wonthaggi, Inverloch, Leongatha and Korumburra as illustrated in Map 2.2. The towns supplied and the services the Corporation currently provides are summarised in the following table.
Table 2.1: South Gippsland Water & Sewerage Service Localities Centre Population Served
(Permanent) Water Sewerage
Customers Billed Supplied from Customers Billed Port Franklin 129 (estimate) 106 Agnes River Not Serviced Port Welshpool 180 274 Agnes River 259 Toora/ Agnes, Bennison 450 516 Agnes River 293 Welshpool, Hedley 445 205 Agnes River 120 Fish Creek 802 209 Battery Creek Not Serviced Korumburra 3404 2167 Coalition Creek 1871 Foster 1106 848 Deep Creek /
Foster Dam 769
Inverloch, Wattle Bank, Lance Creek
4565 4443 Lance Creek 4414
Cape Paterson 735 1129 Lance Creek 1115 Wonthaggi, South Dudley, Glen Alvie, Kongwak, Lance Creek
7050 4353 Lance Creek 4143
Loch 194 (estimate) 147 Little Bass Not Serviced Nyora 713 348 Little Bass Not Serviced Poowong 322 207 Little Bass Not Serviced Koonwarra 390 80 Ruby Creek Not serviced Leongatha, Kardella, Leongatha South, Ruby
4921 3051 Ruby Creek 2879
Alberton 260 147 Tarra River Not Serviced Devon North, Tarra Valley
487 124 Tarra River Not Serviced
Port Albert 246 394 Tarra River 327 Yarram 1741 1191 Tarra River 1091 Dumbalk 418 103 Tarwin River –
East Branch Not Serviced
Meeniyan 460 269 Tarwin River – West Branch
235
Waratah Bay
210 Not Serviced N/A 111
Notes: 1. Population Served based on ABS 2011 Census updated with a local government growth factor of 2.5% Bass Coast Shire Council, 1.5% South Gippsland Shire Council and 0.9% for the Wellington Shire Council. 2. Water and Sewerage Assessments = Number of Rated Properties at May 2014. 3. The ABS method of calculation of population is based on State Suburbs and may not always reflect the exact sewer/water district.
South Gippsland Water Corporate Plan
2014/15 to 2018/19
10
2.2 South Gippsland Water Infrastructure South Gippsland Water has significant headworks assets with 13 reservoirs and 18 service storages. The quality of raw water varies significantly across South Gippsland Water’s region leading to specific water quality control challenges. South Gippsland Water’s total operation comprises:
A headworks function comprising:
• Water catchments with a total area of 1,234 square kilometres • 13 reservoirs and 18 service storages
A Water Services Function comprising:
• 10 separate water supply systems • 10 water treatment plants • 698km of water mains • 15 water pump stations • servicing over 20,500 assessments over 21 towns with around 4,800
ML annual volume of metered water
A Sewerage Services Function comprising:
• 11 conventional wastewater collection systems • 1 vacuum wastewater system • 10 sewerage treatment plants • 1 dedicated saline tradewaste system • 426 km of wastewater mains • 71 wastewater pump stations • 4 marine environment outfalls • 2 inland water discharge points • servicing over 17,600 wastewater assessments (including trade waste)
over 12 towns collecting and treating around 4,300ML of wastewater.
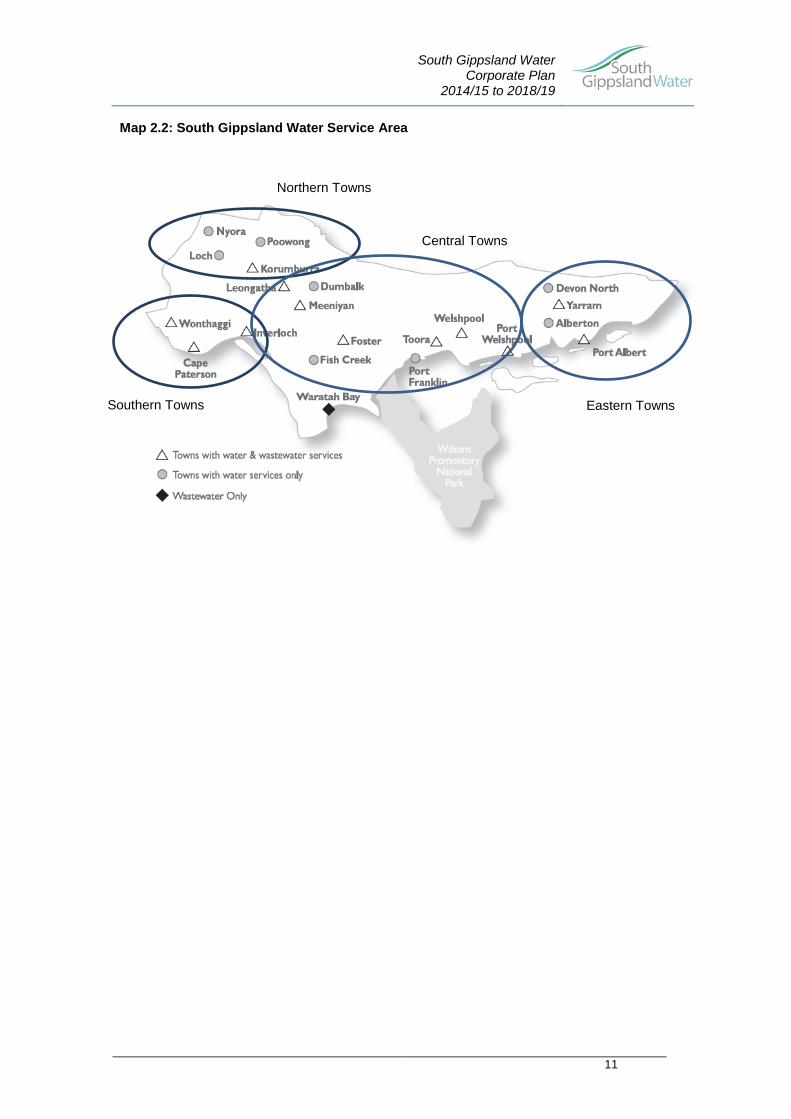
South Gippsland Water’s service area (shown in Map 2.2 below) extends from Wonthaggi and Nyora in the west to Yarram in the east, and from the coastal centres facing Bass Strait in the south through to the Strzelecki Ranges in the north. The western boundary adjoins Westernport Water, the northern boundaries adjoin South East Water and Gippsland Water.
South Gippsland Water Corporate Plan
2014/15 to 2018/19
11
Map 2.2: South Gippsland Water Service Area
Northern Towns
Southern Towns
Central Towns
Eastern Towns
South Gippsland Water Corporate Plan
2014/15 to 2018/19
12
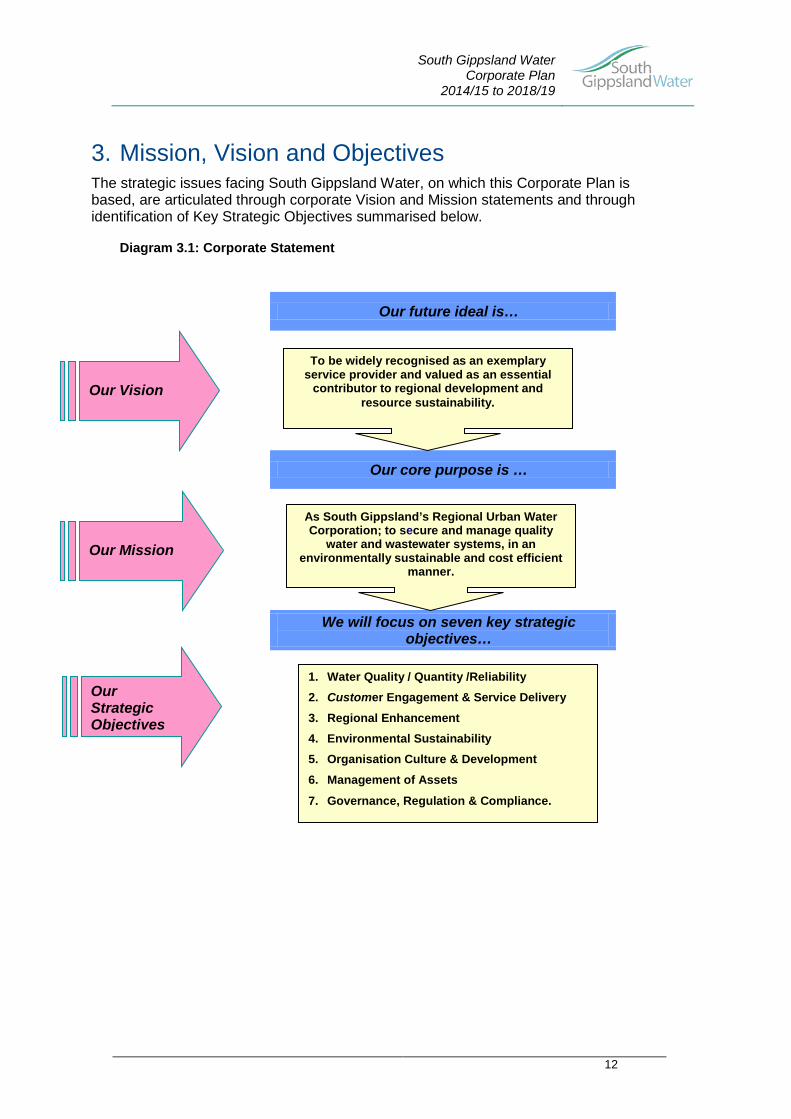
3. Mission, Vision and Objectives The strategic issues facing South Gippsland Water, on which this Corporate Plan is based, are articulated through corporate Vision and Mission statements and through identification of Key Strategic Objectives summarised below.
Diagram 3.1: Corporate Statement
Our future ideal is…
Our core purpose is …
We will focus on seven key strategic objectives…
Our Vision
To be widely recognised as an exemplary service provider and valued as an essential
contributor to regional development and resource sustainability.
Our Mission
As South Gippsland’s Regional Urban Water Corporation; to secure and manage quality
water and wastewater systems, in an environmentally sustainable and cost efficient
manner.
Our Strategic Objectives
1. Water Quality / Quantity /Reliability 2. Customer Engagement & Service Delivery 3. Regional Enhancement 4. Environmental Sustainability 5. Organisation Culture & Development 6. Management of Assets
7. Governance, Regulation & Compliance.
South Gippsland Water Corporate Plan
2014/15 to 2018/19
13
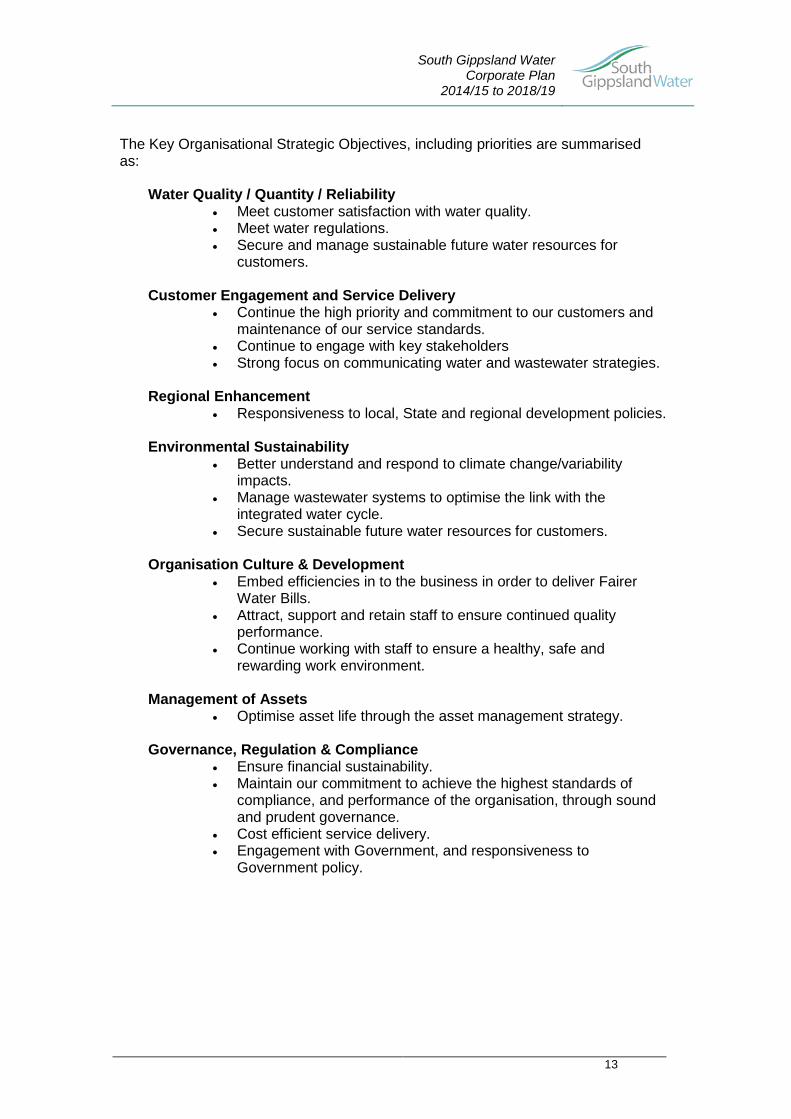
The Key Organisational Strategic Objectives, including priorities are summarised as:
Water Quality / Quantity / Reliability • Meet customer satisfaction with water quality. • Meet water regulations. • Secure and manage sustainable future water resources for
customers.
Customer Engagement and Service Delivery • Continue the high priority and commitment to our customers and
maintenance of our service standards. • Continue to engage with key stakeholders • Strong focus on communicating water and wastewater strategies.
Regional Enhancement
• Responsiveness to local, State and regional development policies.
Environmental Sustainability • Better understand and respond to climate change/variability
impacts. • Manage wastewater systems to optimise the link with the
integrated water cycle. • Secure sustainable future water resources for customers.
Organisation Culture & Development
• Embed efficiencies in to the business in order to deliver Fairer Water Bills.
• Attract, support and retain staff to ensure continued quality performance.
• Continue working with staff to ensure a healthy, safe and rewarding work environment.
Management of Assets • Optimise asset life through the asset management strategy.
Governance, Regulation & Compliance
• Ensure financial sustainability. • Maintain our commitment to achieve the highest standards of
compliance, and performance of the organisation, through sound and prudent governance.
• Cost efficient service delivery. • Engagement with Government, and responsiveness to
Government policy.
South Gippsland Water Corporate Plan
2014/15 to 2018/19
14
4. Key Assumptions Made in Preparing the Corporate Plan
4.1 Climate conditions / yields assumed for the Corporate Plan
South Gippsland, similar to many other parts of south-east Australia, has over the last fifteen years experienced one of the worst prolonged droughts on record with extreme dry conditions recorded. While more recent climate conditions have approximated long term average rainfall, the drought experience is maintained in the corporations risk profile and future planning. In its Water Supply Demand Strategy, South Gippsland Water has planned its demand reduction and supply enhancement measures on the assumption of medium climate change conditions over the next 50 years, based on CSIRO’s climate change projections. This Corporate Plan has been predicated on the assumption that the variability of flows in South Gippsland catchments over recent years will continue. As such, it uses a conservative view of average inflows as the basis for water supply availability and includes a variety of measures to access and develop a diversity of water sources. In the short term, South Gippsland Water faces the significant challenge of ensuring water availability to its Northern Towns in the context of major customer expansion, population growth and potential climatic volatility. As suchSouth Gippsland Water will rely on a combination of water sources, including surface and ground water. This means utilising a temporary pump station and a network of aged pipeline and pump infrastructure to augment the supply to Korumburra (an at risk system due to recent significant major customer water usage) during late summer and autumn. It is planned that some 4,555 ML’s will be delivered to customers during 2014/15 and while no restrictions are planned the reality is that Korumburra experienced Stage Two restrictions (2012/13) and significant temporary augmentation in 2013/14, following a prolonged dry period from December 2013.
4.2 Revenue Revenue included in the Corporate Plan is based on the prices approved in the Essential Services Commission (ESC) Final determination, adjusted for “Fairer Water Bills” required level of savings which were provided to the Corporation by the Minister for Water on 9th May 2014. These expected savings include $4.6 M in Operational expenditure and $4.2 M in Capital Expenditure over the period 2014/15 to 2017/18. The savings result from targeted efficiencies identified by the Corporation, and stretch targets and co-ordinated procurement initiatives yet to be scoped. Tariffs from 1st July 2014 see a decrease of between 8% - 11% in nominal terms against the currently approved ESC price path, the results of which is reflected in the Financials of Section 9 of this plan. Future increases will be pegged to the inflation rate.
South Gippsland Water Corporate Plan
2014/15 to 2018/19
15
4.3 Customer Growth – Estimated Demand Forecast
The Victoria In Future 2012 forecasts and the Corporation’s own historical data have been utilised to provide growth forecasts for new customers. Estimates of water demand take into account changes to customer behaviour due to a number of reasons, including awareness on climate change/variability, implementation of permanent water savings rules, water savings education and programs, etc. The 2011 Census of Population and Housing assessed the population of towns in various regional areas of Victoria. None of the regional areas satisfactorily maps to the area served by South Gippsland Water. As such, South Gippsland Water has utilised the disaggregated Regional Local Government Areas (LGA) statistical information, although even this data presents problems with respect to direct representation of South Gippsland Water’s services towns. South Gippsland Water’s three relevant Local Government Areas are Bass Coast, South Gippsland and Wellington. Utilisation of data as representative of our area is problematic as:
• A substantial part of the Bass Coast LGA encompasses Phillip Island which is not part of our serviced region; and
• The towns in our region represented by Wellington are insignificant in size, i.e. Yarram, Port Albert, etc. Wellington is dominated by the major centre of Sale.
However, the South Gippsland LGA covers the major centres of Leongatha and Korumburra and provides a good nexus to growth in these towns. While population growth is useful, the change in households is the key indicator as it provides a more meaningful figure with respect to estimating new connections and future capital requirements. Over 2012/13 and 2013/14 the actual customer growth (water and wastewater) averaged only 0.8% per annum around half that expected. This slower growth has a compounding unfavourable revenue impact on the Water Plan forecasts and has been reflected in the Corporate Plan estimates.
South Gippsland Water Corporate Plan
2014/15 to 2018/19
16
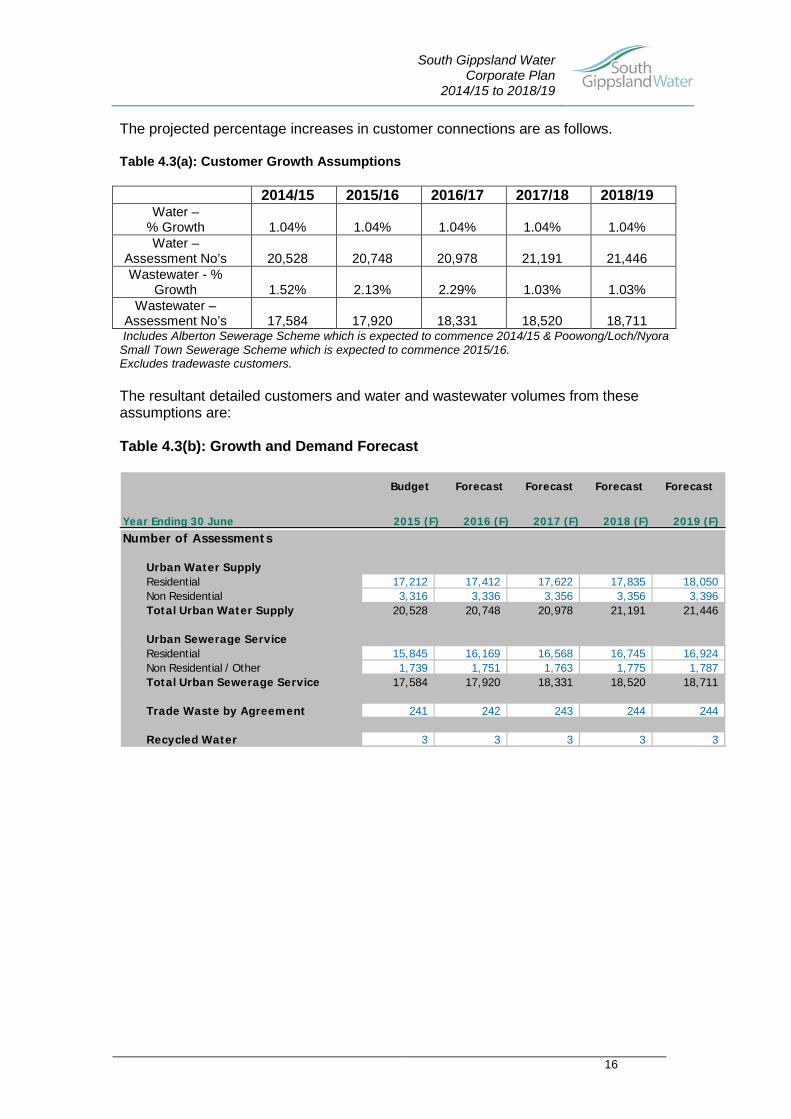
The projected percentage increases in customer connections are as follows. Table 4.3(a): Customer Growth Assumptions
2014/15 2015/16 2016/17 2017/18 2018/19 Water –
% Growth
1.04%
1.04%
1.04%
1.04%
1.04% Water –
Assessment No’s
20,528
20,748
20,978
21,191
21,446 Wastewater - %
Growth
1.52%
2.13%
2.29%
1.03%
1.03% Wastewater –
Assessment No’s
17,584
17,920
18,331
18,520
18,711 Includes Alberton Sewerage Scheme which is expected to commence 2014/15 & Poowong/Loch/Nyora Small Town Sewerage Scheme which is expected to commence 2015/16. Excludes tradewaste customers. The resultant detailed customers and water and wastewater volumes from these assumptions are: Table 4.3(b): Growth and Demand Forecast
Budget Forecast Forecast Forecast Forecast
Year Ending 30 June 2015 (F) 2016 (F) 2017 (F) 2018 (F) 2019 (F) Number of Assessments
Urban Water SupplyResidential 17,212 17,412 17,622 17,835 18,050Non Residential 3,316 3,336 3,356 3,356 3,396Total Urban Water Supply 20,528 20,748 20,978 21,191 21,446
Urban Sewerage ServiceResidential 15,845 16,169 16,568 16,745 16,924Non Residential / Other 1,739 1,751 1,763 1,775 1,787Total Urban Sewerage Service 17,584 17,920 18,331 18,520 18,711
Trade Waste by Agreement 241 242 243 244 244
Recycled Water 3 3 3 3 3
South Gippsland Water Corporate Plan
2014/15 to 2018/19
17
4.4 Environmental Contribution The Corporation is required to collect an environmental contribution through fees levied on customer water and wastewater accounts. The contribution was an initiative of the Victorian Government’s White Paper ‘Securing Our Water Future Together’. The Corporate Plan includes the collection of revenue and the payment of an Environmental Contribution of $1,101,000 per annum for the first 4 years, increasing to $1,422,000 in 2018/19.
4.5 Government Contributions It has been assumed that the Corporation will not receive any Government contributions over the plan period. The business case for the Northern Towns Connection Project was submitted in 2013/14 and no funds were allocated in the 2014/15 state budget. As a result South Gippsland Water has removed all Northern Towns Connection Project capital works from this Corporate Plan and has included a $100,000 per annum additional operating cost to allow supplementary supply for the Korumburra water supply to continue until a more permanent solution can be developed.
4.6 Forecast Inflation Rates An inflation rate of 2.93% has been used for 2014/15 and 2.75% pa for the remaining years of the plan.
4.7 Wage Increases The wages calculation has been determined from the Corporation’s Enterprise Agreement 2012 which was approved by Fair Work Commission on the 21st August 2013. This allows for increases of 3.25% in 2014/15 and 3.5% in 2015/16. The remaining years are assumed to be 2.75% (the inflation rate) in accordance with current government policy.
4.8 Interest on Investment
Interest used to calculate investment revenue has been estimated at 4%.
4.9 Borrowings The Corporate Plan assumes that borrowings will be required to provide for capital expenditure projects. The interest rate also incorporates the Financial Accommodation Levy (FAL) of 1.7% and is estimated at 6.5% of future loan funds. Borrowings predicted for the Corporate Plan period will peak in 2014/15 at $56.4M and overall Corporation loans will reduce to $47.9M by June 2019.
4.10 Dividend Calculation No dividend payments have been forecast during the period of the Corporate Plan.
4.11 Taxation Payments
No taxation payments have been forecast during the period of the Corporate Plan.
South Gippsland Water Corporate Plan
2014/15 to 2018/19
18
5. Outcomes for 2013/14
5.1 Introduction As a part of the Corporate Planning process, South Gippsland Water reviews its progress in achieving its previous Corporate Plan objectives and outcomes and these are summarised below.
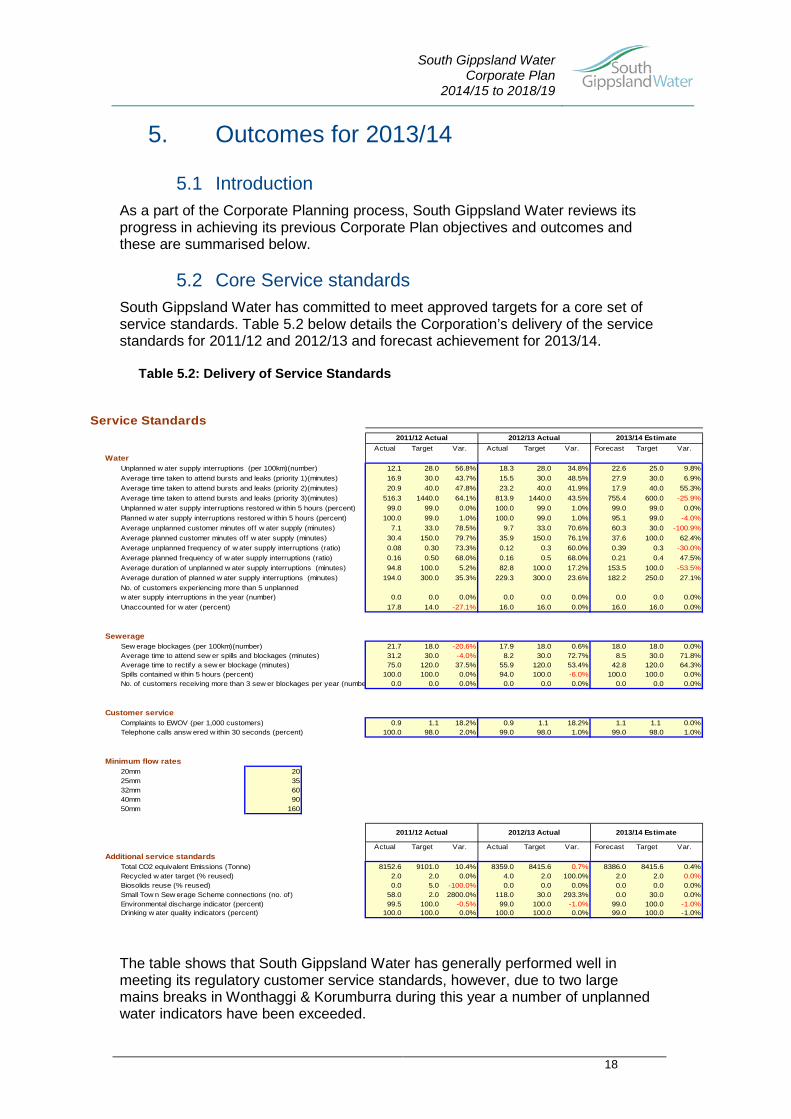
5.2 Core Service standards South Gippsland Water has committed to meet approved targets for a core set of service standards. Table 5.2 below details the Corporation’s delivery of the service standards for 2011/12 and 2012/13 and forecast achievement for 2013/14.
Table 5.2: Delivery of Service Standards
The table shows that South Gippsland Water has generally performed well in meeting its regulatory customer service standards, however, due to two large mains breaks in Wonthaggi & Korumburra during this year a number of unplanned water indicators have been exceeded.
Service Standards
Actual Target Var. Actual Target Var. Forecast Target Var.Water
Unplanned w ater supply interruptions (per 100km)(number) 12.1 28.0 56.8% 18.3 28.0 34.8% 22.6 25.0 9.8%Average time taken to attend bursts and leaks (priority 1)(minutes) 16.9 30.0 43.7% 15.5 30.0 48.5% 27.9 30.0 6.9%Average time taken to attend bursts and leaks (priority 2)(minutes) 20.9 40.0 47.8% 23.2 40.0 41.9% 17.9 40.0 55.3%Average time taken to attend bursts and leaks (priority 3)(minutes) 516.3 1440.0 64.1% 813.9 1440.0 43.5% 755.4 600.0 -25.9%Unplanned w ater supply interruptions restored w ithin 5 hours (percent) 99.0 99.0 0.0% 100.0 99.0 1.0% 99.0 99.0 0.0%Planned w ater supply interruptions restored w ithin 5 hours (percent) 100.0 99.0 1.0% 100.0 99.0 1.0% 95.1 99.0 -4.0%Average unplanned customer minutes off w ater supply (minutes) 7.1 33.0 78.5% 9.7 33.0 70.6% 60.3 30.0 -100.9%Average planned customer minutes off w ater supply (minutes) 30.4 150.0 79.7% 35.9 150.0 76.1% 37.6 100.0 62.4%Average unplanned frequency of w ater supply interruptions (ratio) 0.08 0.30 73.3% 0.12 0.3 60.0% 0.39 0.3 -30.0%Average planned frequency of w ater supply interruptions (ratio) 0.16 0.50 68.0% 0.16 0.5 68.0% 0.21 0.4 47.5%Average duration of unplanned w ater supply interruptions (minutes) 94.8 100.0 5.2% 82.8 100.0 17.2% 153.5 100.0 -53.5%Average duration of planned w ater supply interruptions (minutes) 194.0 300.0 35.3% 229.3 300.0 23.6% 182.2 250.0 27.1%
0.0 0.0 0.0% 0.0 0.0 0.0% 0.0 0.0 0.0%Unaccounted for w ater (percent) 17.8 14.0 -27.1% 16.0 16.0 0.0% 16.0 16.0 0.0%
SewerageSew erage blockages (per 100km)(number) 21.7 18.0 -20.6% 17.9 18.0 0.6% 18.0 18.0 0.0%Average time to attend sew er spills and blockages (minutes) 31.2 30.0 -4.0% 8.2 30.0 72.7% 8.5 30.0 71.8%Average time to rectify a sew er blockage (minutes) 75.0 120.0 37.5% 55.9 120.0 53.4% 42.8 120.0 64.3%Spills contained w ithin 5 hours (percent) 100.0 100.0 0.0% 94.0 100.0 -6.0% 100.0 100.0 0.0%No. of customers receiving more than 3 sew er blockages per year (numbe 0.0 0.0 0.0% 0.0 0.0 0.0% 0.0 0.0 0.0%
Customer serviceComplaints to EWOV (per 1,000 customers) 0.9 1.1 18.2% 0.9 1.1 18.2% 1.1 1.1 0.0%Telephone calls answ ered w ithin 30 seconds (percent) 100.0 98.0 2.0% 99.0 98.0 1.0% 99.0 98.0 1.0%
Minimum flow rates20mm 2025mm 3532mm 6040mm 9050mm 160
Actual Target Var. Actual Target Var. Forecast Target Var.Additional service standards
8152.6 9101.0 10.4% 8359.0 8415.6 0.7% 8386.0 8415.6 0.4%2.0 2.0 0.0% 4.0 2.0 100.0% 2.0 2.0 0.0%0.0 5.0 -100.0% 0.0 0.0 0.0% 0.0 0.0 0.0%
58.0 2.0 2800.0% 118.0 30.0 293.3% 0.0 30.0 0.0%99.5 100.0 -0.5% 99.0 100.0 -1.0% 99.0 100.0 -1.0%
100.0 100.0 0.0% 100.0 100.0 0.0% 99.0 100.0 -1.0%
2013/14 Estimate
2013/14 Estimate
2011/12 Actual 2012/13 Actual
2011/12 Actual 2012/13 Actual
No. of customers experiencing more than 5 unplanned w ater supply interruptions in the year (number)
Total CO2 equivalent Emissions (Tonne)Recycled w ater target (% reused)Biosolids reuse (% reused)Small Tow n Sew erage Scheme connections (no. of)Environmental discharge indicator (percent)Drinking w ater quality indicators (percent)
South Gippsland Water Corporate Plan
2014/15 to 2018/19
19
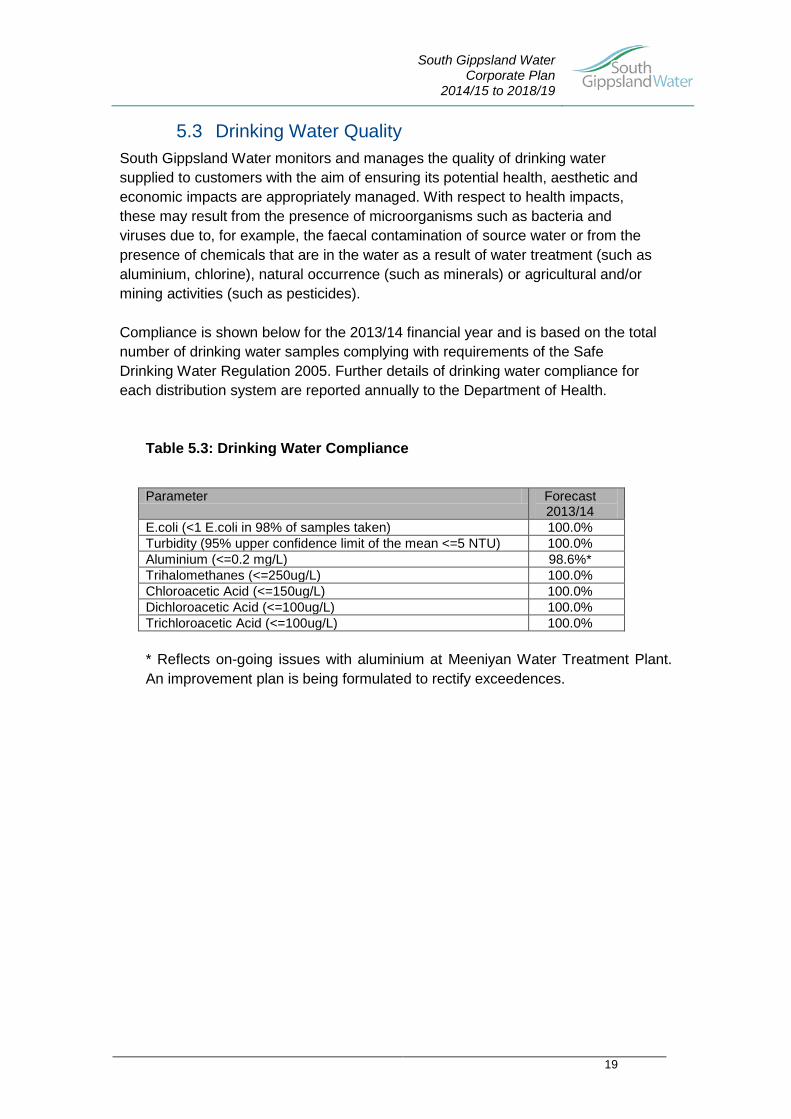
5.3 Drinking Water Quality South Gippsland Water monitors and manages the quality of drinking water supplied to customers with the aim of ensuring its potential health, aesthetic and economic impacts are appropriately managed. With respect to health impacts, these may result from the presence of microorganisms such as bacteria and viruses due to, for example, the faecal contamination of source water or from the presence of chemicals that are in the water as a result of water treatment (such as aluminium, chlorine), natural occurrence (such as minerals) or agricultural and/or mining activities (such as pesticides). Compliance is shown below for the 2013/14 financial year and is based on the total number of drinking water samples complying with requirements of the Safe Drinking Water Regulation 2005. Further details of drinking water compliance for each distribution system are reported annually to the Department of Health.
Table 5.3: Drinking Water Compliance
Parameter Forecast
2013/14 E.coli (<1 E.coli in 98% of samples taken) 100.0% Turbidity (95% upper confidence limit of the mean <=5 NTU) 100.0% Aluminium (<=0.2 mg/L) 98.6%* Trihalomethanes (<=250ug/L) 100.0% Chloroacetic Acid (<=150ug/L) 100.0% Dichloroacetic Acid (<=100ug/L) 100.0% Trichloroacetic Acid (<=100ug/L) 100.0% * Reflects on-going issues with aluminium at Meeniyan Water Treatment Plant. An improvement plan is being formulated to rectify exceedences.
South Gippsland Water Corporate Plan
2014/15 to 2018/19
20
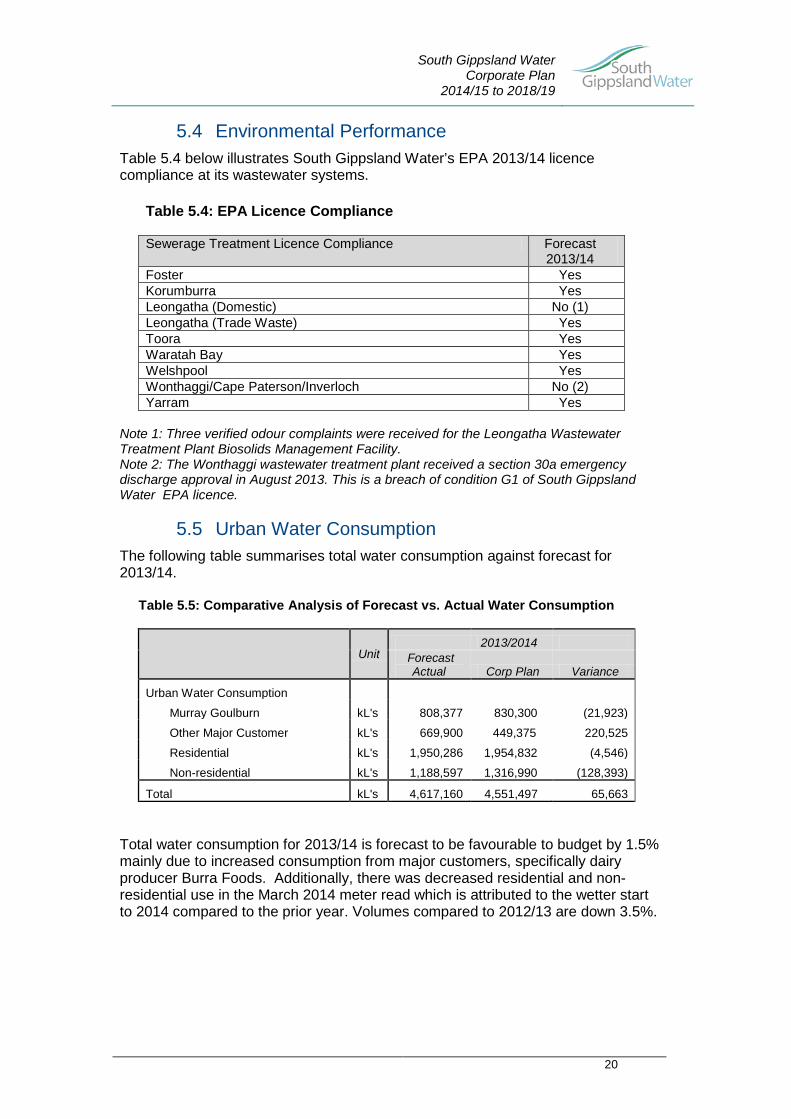
5.4 Environmental Performance Table 5.4 below illustrates South Gippsland Water’s EPA 2013/14 licence compliance at its wastewater systems.
Table 5.4: EPA Licence Compliance
Sewerage Treatment Licence Compliance Forecast 2013/14
Foster Yes Korumburra Yes Leongatha (Domestic) No (1) Leongatha (Trade Waste) Yes Toora Yes Waratah Bay Yes Welshpool Yes Wonthaggi/Cape Paterson/Inverloch No (2) Yarram Yes
Note 1: Three verified odour complaints were received for the Leongatha Wastewater Treatment Plant Biosolids Management Facility. Note 2: The Wonthaggi wastewater treatment plant received a section 30a emergency discharge approval in August 2013. This is a breach of condition G1 of South Gippsland Water EPA licence.
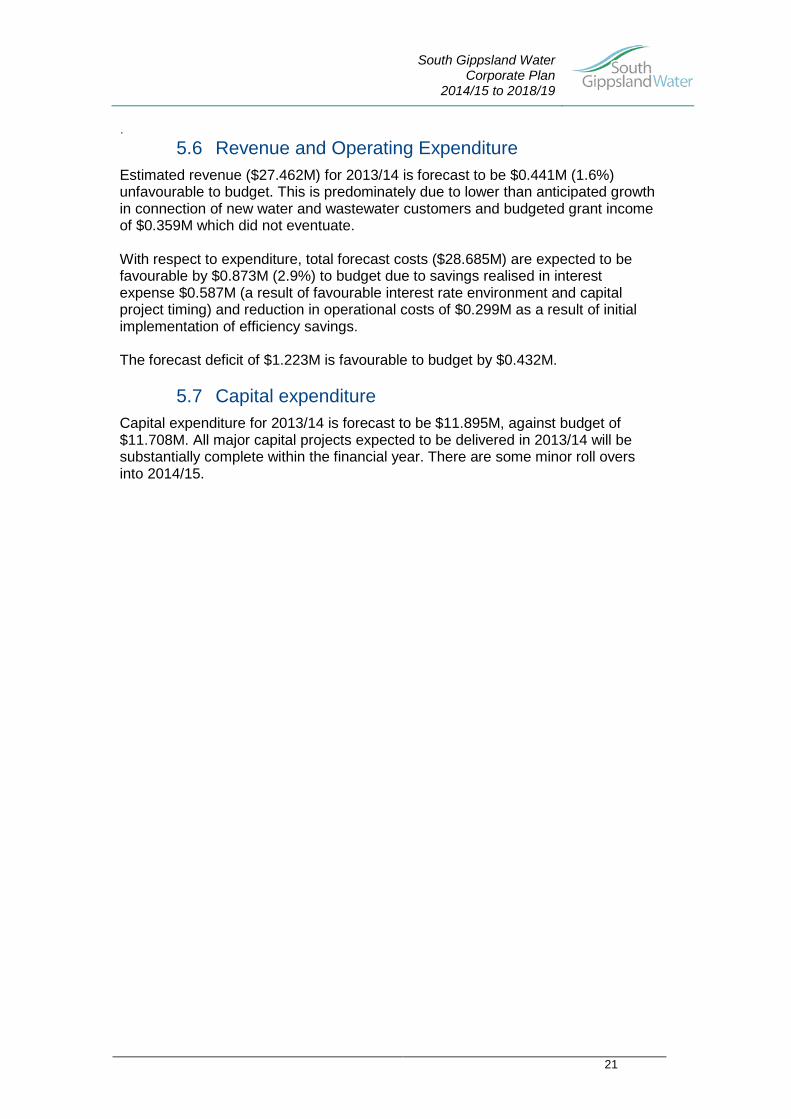
5.5 Urban Water Consumption The following table summarises total water consumption against forecast for 2013/14.
Table 5.5: Comparative Analysis of Forecast vs. Actual Water Consumption
Unit 2013/2014
Forecast Actual Corp Plan Variance
Urban Water Consumption Murray Goulburn kL's 808,377 830,300 (21,923)
Other Major Customer kL's 669,900 449,375 220,525
Residential kL's 1,950,286 1,954,832 (4,546)
Non-residential kL's 1,188,597 1,316,990 (128,393)
Total kL's 4,617,160 4,551,497 65,663 Total water consumption for 2013/14 is forecast to be favourable to budget by 1.5% mainly due to increased consumption from major customers, specifically dairy producer Burra Foods. Additionally, there was decreased residential and non-residential use in the March 2014 meter read which is attributed to the wetter start to 2014 compared to the prior year. Volumes compared to 2012/13 are down 3.5%.
South Gippsland Water Corporate Plan
2014/15 to 2018/19
21
. 5.6 Revenue and Operating Expenditure
Estimated revenue ($27.462M) for 2013/14 is forecast to be $0.441M (1.6%) unfavourable to budget. This is predominately due to lower than anticipated growth in connection of new water and wastewater customers and budgeted grant income of $0.359M which did not eventuate. With respect to expenditure, total forecast costs ($28.685M) are expected to be favourable by $0.873M (2.9%) to budget due to savings realised in interest expense $0.587M (a result of favourable interest rate environment and capital project timing) and reduction in operational costs of $0.299M as a result of initial implementation of efficiency savings. The forecast deficit of $1.223M is favourable to budget by $0.432M.
5.7 Capital expenditure Capital expenditure for 2013/14 is forecast to be $11.895M, against budget of $11.708M. All major capital projects expected to be delivered in 2013/14 will be substantially complete within the financial year. There are some minor roll overs into 2014/15.
South Gippsland Water Corporate Plan
2014/15 to 2018/19
22
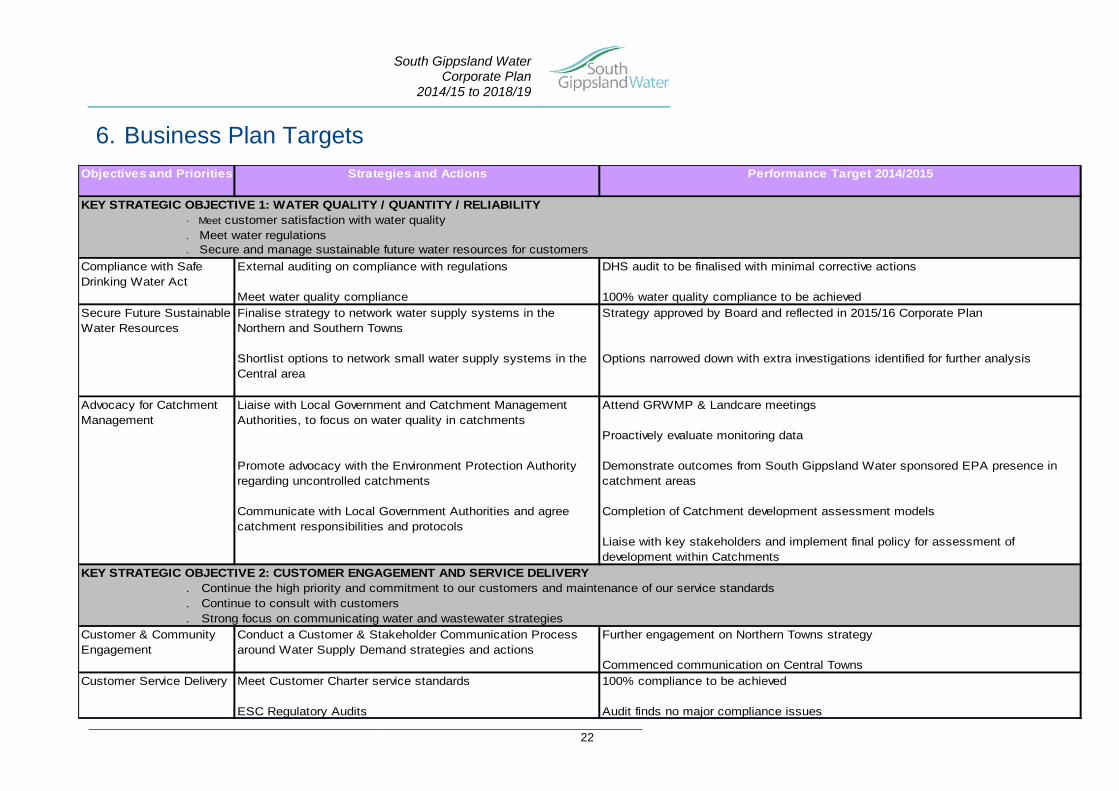
6. Business Plan Targets Objectives and Priorities Strategies and Actions Performance Target 2014/2015
· Meet customer satisfaction with water quality. Meet water regulations. Secure and manage sustainable future water resources for customers
External auditing on compliance with regulations DHS audit to be finalised with minimal corrective actions
Meet water quality compliance 100% water quality compliance to be achievedFinalise strategy to network water supply systems in the Northern and Southern Towns
Strategy approved by Board and reflected in 2015/16 Corporate Plan
Shortlist options to network small water supply systems in the Central area
Options narrowed down with extra investigations identified for further analysis
Liaise with Local Government and Catchment Management Authorities, to focus on water quality in catchments
Attend GRWMP & Landcare meetings
Proactively evaluate monitoring data
Promote advocacy with the Environment Protection Authority regarding uncontrolled catchments
Demonstrate outcomes from South Gippsland Water sponsored EPA presence in catchment areas
Communicate with Local Government Authorities and agree catchment responsibilities and protocols
Completion of Catchment development assessment models
Liaise with key stakeholders and implement final policy for assessment of development within Catchments
. Continue the high priority and commitment to our customers and maintenance of our service standards
. Continue to consult with customers
. Strong focus on communicating water and wastewater strategiesConduct a Customer & Stakeholder Communication Process around Water Supply Demand strategies and actions
Further engagement on Northern Towns strategy
Commenced communication on Central Towns Meet Customer Charter service standards 100% compliance to be achieved
ESC Regulatory Audits Audit finds no major compliance issues
Customer & Community Engagement
Compliance with Safe Drinking Water Act
Secure Future Sustainable Water Resources
KEY STRATEGIC OBJECTIVE 1: WATER QUALITY / QUANTITY / RELIABILITY
Customer Service Delivery
Advocacy for Catchment Management
KEY STRATEGIC OBJECTIVE 2: CUSTOMER ENGAGEMENT AND SERVICE DELIVERY
South Gippsland Water Corporate Plan
2014/15 to 2018/19
23
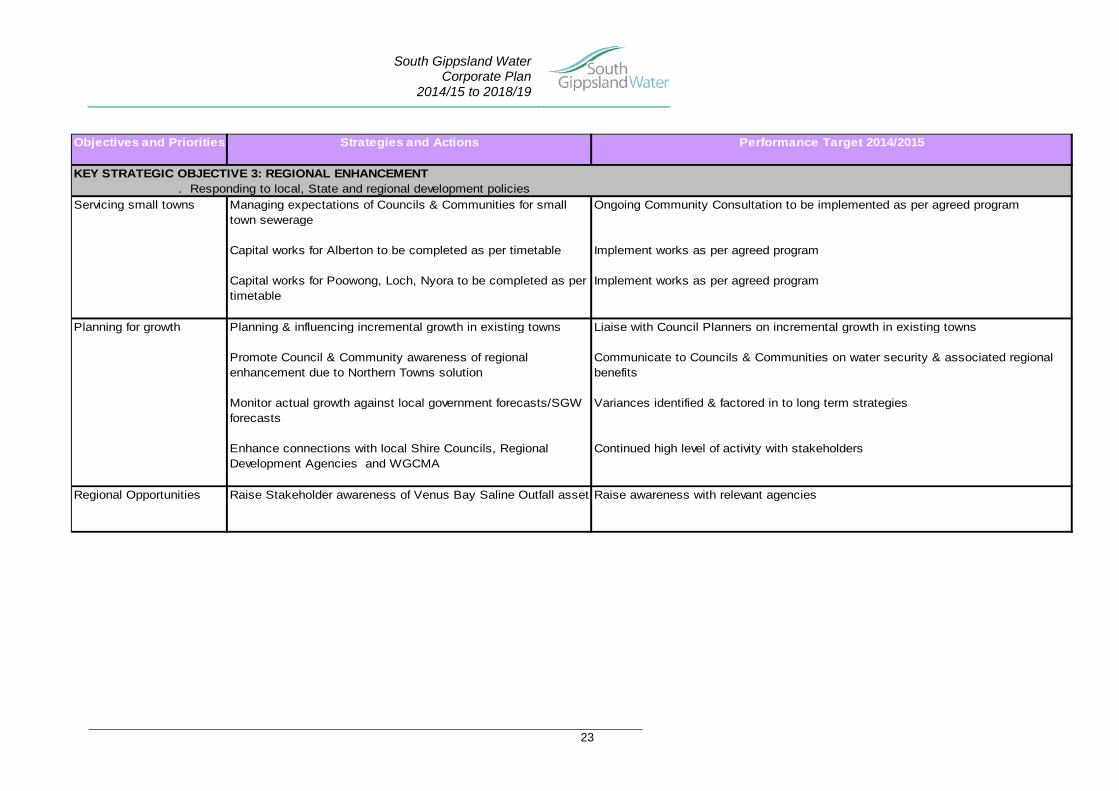
Objectives and Priorities Strategies and Actions Performance Target 2014/2015
. Responding to local, State and regional development policies Managing expectations of Councils & Communities for small town sewerage
Ongoing Community Consultation to be implemented as per agreed program
Capital works for Alberton to be completed as per timetable Implement works as per agreed program
Capital works for Poowong, Loch, Nyora to be completed as per timetable
Implement works as per agreed program
Planning & influencing incremental growth in existing towns Liaise with Council Planners on incremental growth in existing towns
Promote Council & Community awareness of regional enhancement due to Northern Towns solution
Communicate to Councils & Communities on water security & associated regional benefits
Monitor actual growth against local government forecasts/SGW forecasts
Variances identified & factored in to long term strategies
Enhance connections with local Shire Councils, Regional Development Agencies and WGCMA
Continued high level of activity with stakeholders
Raise Stakeholder awareness of Venus Bay Saline Outfall asset Raise awareness with relevant agencies
Servicing small towns
KEY STRATEGIC OBJECTIVE 3: REGIONAL ENHANCEMENT
Planning for growth
Regional Opportunities
South Gippsland Water Corporate Plan
2014/15 to 2018/19
24
Objectives and Priorities Strategies and Actions Performance Target 2014/2015
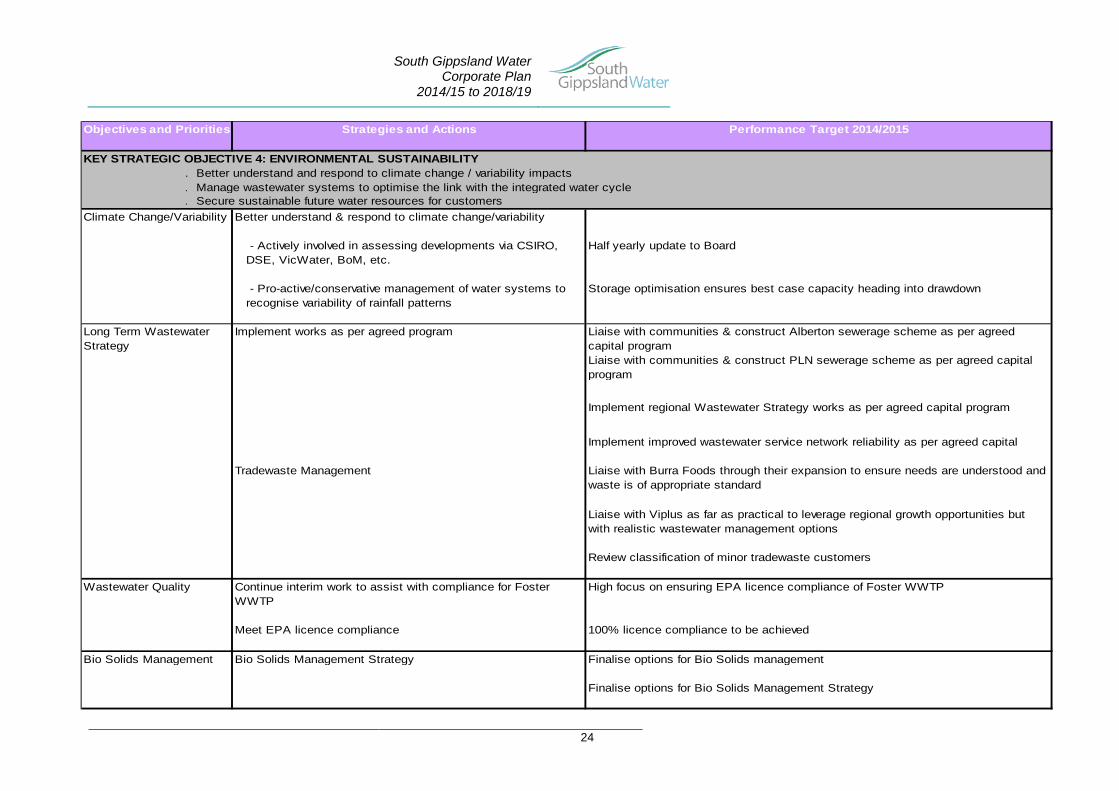
. Better understand and respond to climate change / variability impacts
. Manage wastewater systems to optimise the link with the integrated water cycle
. Secure sustainable future water resources for customersBetter understand & respond to climate change/variability
- Actively involved in assessing developments via CSIRO, DSE, VicWater, BoM, etc.
Half yearly update to Board
- Pro-active/conservative management of water systems to recognise variability of rainfall patterns
Storage optimisation ensures best case capacity heading into drawdown
Implement works as per agreed program Liaise with communities & construct Alberton sewerage scheme as per agreed capital programLiaise with communities & construct PLN sewerage scheme as per agreed capital program
Implement regional Wastewater Strategy works as per agreed capital program
Implement improved wastewater service network reliability as per agreed capital
Tradewaste Management Liaise with Burra Foods through their expansion to ensure needs are understood and waste is of appropriate standard
Liaise with Viplus as far as practical to leverage regional growth opportunities but with realistic wastewater management options
Review classification of minor tradewaste customers
Continue interim work to assist with compliance for Foster WWTP
High focus on ensuring EPA licence compliance of Foster WWTP
Meet EPA licence compliance 100% licence compliance to be achieved
Bio Solids Management Bio Solids Management Strategy Finalise options for Bio Solids management
Finalise options for Bio Solids Management Strategy
Climate Change/Variability
Wastewater Quality
KEY STRATEGIC OBJECTIVE 4: ENVIRONMENTAL SUSTAINABILITY
Long Term Wastewater Strategy
South Gippsland Water Corporate Plan
2014/15 to 2018/19
25
Objectives and Priorities Strategies and Actions Performance Target 2014/2015
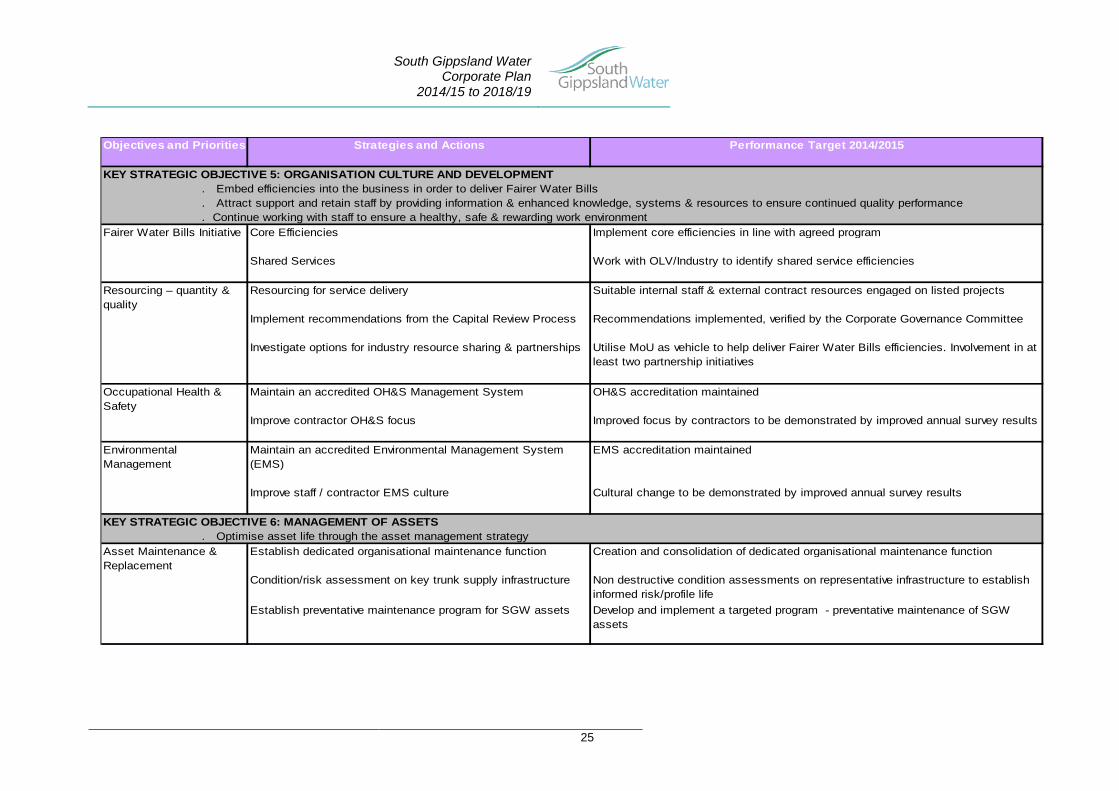
. Embed efficiencies into the business in order to deliver Fairer Water Bills
. Attract support and retain staff by providing information & enhanced knowledge, systems & resources to ensure continued quality performance
. Continue working with staff to ensure a healthy, safe & rewarding work environmentFairer Water Bills Initiative Core Efficiencies Implement core efficiencies in line with agreed program
Shared Services Work with OLV/Industry to identify shared service efficiencies
Resourcing for service delivery Suitable internal staff & external contract resources engaged on listed projects
Implement recommendations from the Capital Review Process Recommendations implemented, verified by the Corporate Governance Committee
Investigate options for industry resource sharing & partnerships Utilise MoU as vehicle to help deliver Fairer Water Bills efficiencies. Involvement in at least two partnership initiatives
Maintain an accredited OH&S Management System OH&S accreditation maintained
Improve contractor OH&S focus Improved focus by contractors to be demonstrated by improved annual survey results
Maintain an accredited Environmental Management System (EMS)
EMS accreditation maintained
Improve staff / contractor EMS culture Cultural change to be demonstrated by improved annual survey results
. Optimise asset life through the asset management strategyEstablish dedicated organisational maintenance function Creation and consolidation of dedicated organisational maintenance function
Condition/risk assessment on key trunk supply infrastructure Non destructive condition assessments on representative infrastructure to establish informed risk/profile life
Establish preventative maintenance program for SGW assets Develop and implement a targeted program - preventative maintenance of SGW assets
Environmental Management
KEY STRATEGIC OBJECTIVE 6: MANAGEMENT OF ASSETS
Resourcing – quantity & quality
KEY STRATEGIC OBJECTIVE 5: ORGANISATION CULTURE AND DEVELOPMENT
Occupational Health & Safety
Asset Maintenance & Replacement
South Gippsland Water Corporate Plan
2014/15 to 2018/19
26
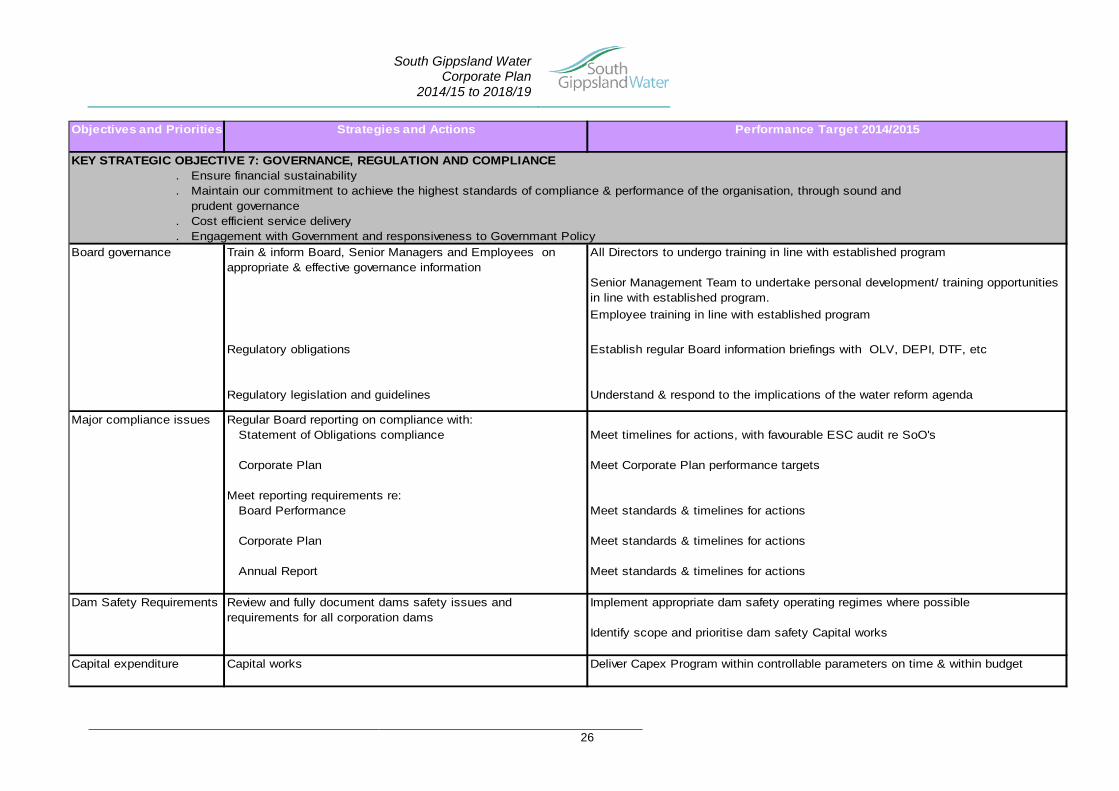
Objectives and Priorities Strategies and Actions Performance Target 2014/2015
. Ensure financial sustainability
. Maintain our commitment to achieve the highest standards of compliance & performance of the organisation, through sound and prudent governance. Cost efficient service delivery. Engagement with Government and responsiveness to Governmant Policy
Train & inform Board, Senior Managers and Employees on appropriate & effective governance information
All Directors to undergo training in line with established program
Senior Management Team to undertake personal development/ training opportunities in line with established program. Employee training in line with established program
Regulatory obligations Establish regular Board information briefings with OLV, DEPI, DTF, etc
Regulatory legislation and guidelines Understand & respond to the implications of the water reform agenda
Regular Board reporting on compliance with:Statement of Obligations compliance Meet timelines for actions, with favourable ESC audit re SoO's
Corporate Plan Meet Corporate Plan performance targets
Meet reporting requirements re:Board Performance Meet standards & timelines for actions
Corporate Plan Meet standards & timelines for actions
Annual Report Meet standards & timelines for actions
Dam Safety Requirements Review and fully document dams safety issues and requirements for all corporation dams
Implement appropriate dam safety operating regimes where possible
Identify scope and prioritise dam safety Capital works
Capital works Deliver Capex Program within controllable parameters on time & within budgetCapital expenditure
Board governance
Major compliance issues
KEY STRATEGIC OBJECTIVE 7: GOVERNANCE, REGULATION AND COMPLIANCE
South Gippsland Water Corporate Plan
2014/15 to 2018/19
27
7. Material Changes from Previous Corporate Plan Material changes from the 2013/14 to 2017/18 Corporate Plan include:
• A Review of the Poowong/Loch/Nyora small towns sewerage scheme has occurred and a pressure sewer system with treatment at South East Water’s Lang Lang plant the preferred delivery method. $30M was included in the draft Water Plan 3 and this program can now be delivered for less than $20M in conjunction with South East Water. The scheme is now planned for completion in 2015/16, previously planned for 2017/18.
• Funding for the Northern Towns project of $21.4M was not allocated in the state budget 2014/15. This program and associated capital has been removed from the Corporate Plan. An additional $100,000 per annum operating cost has been added to ensure supplementary supply to Korumburra occurs each year to meet current demands.
• Fairer Water Bills initiative has been introduced by the Government. The
savings for Operational Expenditure are $4.6M and for Capital Expenditure $4.2M over the next four years. This has resulted in an average bill saving of $48 per customer being implemented from 1 July 2014.
• $10.0M will now be borrowed in 2014/15 due to the advanced delivery of the Poowong/Loch/Nyora scheme.
• An increase and acceleration of proposed peak debt levels from $55.7M to $56.4M as a result of the timing of the delivery of Poowong/Loch/Nyora sewerage scheme. Peak debt levels are now in 2014/15 & 2015/16 with reductions in debt occurring in years 2016/17 and beyond.
• Tariffs from 1st July 2014 see a decrease of between 8% - 11% in nominal
terms against the currently approved ESC price path, the results of which is reflected in the Financials of Section 9 of this plan. Future increases will be pegged to the inflation rate.
• Alberton Sewerage scheme has been delayed by three months and all connections will now occur in 2014/15 rather than 2013/14.
• Growth in assessment numbers has been reduced downwards from 1.4%
per annum to 1.04% per annum based on recent growth experienced in the region. The Impact is a $1.149M reduction in revenue over the 5 years.
• No other material changes.
South Gippsland Water Corporate Plan
2014/15 to 2018/19
28
8. Major Risks 8.1 Implementing a Solution for Northern Towns
The Corporation’s Water Supply Demand Strategy and associated options analysis recognised the Melbourne supply system connection as an obvious future water supply option. It also identified the preferred option for the region is the utilisation of the Lance Creek Reservoir in conjunction with Melbourne supply system to supply both the Corporation’s Southern and Northern systems. This recommendation was on the basis of the long term cost, efficiency and security of supply over the 50 year period of the Water Supply Demand Strategy. The strategy requires a major injection of capital funds to provide internal transfer mains to connect the Lance Creek Reservoir to the various Northern systems. South Gippsland Water submitted a Business Case for $21.4 M of government support to implement the project. However, funds were not allocated via the 2014/15 State Government budget. As such, South Gippsland Water will revise options, if possible, for more incremental expenditure to meet the demands of residential and business customers, including major customers, Murray Goulburn and Burra Foods. This revised planning has commenced and will be reflected in the 2015/16 Corporate Plan. Implementing a cost effective sustainable Water Supply Demand Strategy for South Gippsland Water’s Northern Towns will ensure future demand will be met taking into consideration regional growth and the impacts of climate change variability.
8.2 Interim Security of Supply (Transition to Melbourne Supply System)
In addition to identifying and implementing a long term solution for its Northern Towns, South Gippsland Water will need to ensure that existing short term measures are maintained / put in place until the permanent long term augmentations are completed and commissioned. The challenge is to ensure water availability to the Northern Towns (in particular Korumburra) in the context of major customer expansion, population growth and potential climatic variability. It will be critical that the range of infrastructure utilised in 2006/07, 2007/08, 2012/13 and again in 2013/14 to supplement the Coalition Creek and Ruby Creek supply systems, remains available and operational. As immediate actions for this Corporate Plan South Gippsland Water will need to renegotiate its Bulk Water Entitlement from the Tarwin River, and utilise a temporary pump station and a network of aged wastewater pipeline and pump infrastructure to annually augment supply to Korumburra during late summer and autumn. While this will provide a short term solution, there are significant risks relating to performance of the temporary/aged infrastructure, climatic variability, and demand for water (residential growth and major customer demand).
South Gippsland Water Corporate Plan
2014/15 to 2018/19
29
8.3 Uncertainty about climate and developing appropriate responses
In response to the uncertainty of climate change/variability, South Gippsland Water reviewed its Water Supply Demand Strategy as a part of its input into the Gippsland Region Sustainable Water Strategy. It contains a detailed analysis of demand and supply options, across the region including growth, demand reduction initiatives, water delivery efficiency and augmentation options for the next 50 years. South Gippsland Water will endeavour to better understand and monitor the possible impacts of climate change/variability via active involvement in assessing climate developments together with expert and other bodies, i.e. CSIRO, DSE, VicWater, etc. This understanding will help the Corporation finalise its revised planning for its Northern and Central towns and assist in proactively managing water storages for the benefit of customers.
8.4 Reduced revenue due to water restrictions and changes in consumption, and lower customer growth
Recent years have seen no significant “bounce back” in water consumption since the 2006/07 drought. Water reduction strategies such as water efficient shower heads, rebates for water efficient appliances and water tanks have lead to decreased demand and lower revenue over and above expectations. Additionally, engagement with major customers to reduce water consumption has seen significant reductions. South Gippsland Water has forecast generally conservative demand estimates in its planning processes, increasing from 110KL to 115KL average consumption. The current draft pricing determination reflects these ongoing demand estimates. Over 2012/13 and 2013/14 the actual customer growth (water and wastewater) has averaged only 0.8% per annum, around half that expected. The slower growth has a compounding unfavourably revenue impact. South Gippsland Water will need to monitor the impacts of potential revenue shortfalls. South Gippsland Water has factored these demand issues into this Corporate Plan thereby lowering the risk of unexpected revenue shortfalls.
South Gippsland Water Corporate Plan
2014/15 to 2018/19
30
8.5 Attracting / retaining / resourcing the organisation in the long
term The remote location of the Corporation presents issues with respect to attracting and retaining skilled staff. South Gippsland Water has developed succession planning, staff development and reward models, and recruitment strategies in response. Further, the Corporation has continued implementing a Consulting Engineering Services Model with consulting engineering company, KBR in order to provide long term security of engineering expertise, including project management. Past major infrastructure construction has had an impact on internal and external resources at all levels within the organisation and the 2014/15 state government budget has forecast a number of new major infrastructure projects. South Gippsland Water continues to utilise its current strategies to sustain its employment requirements. This strategy includes reviewing structures across the organisation in line with implementing the efficiencies of the Fairer Water Bills initiative as well as benchmarking remuneration to ensure competitiveness in the current employment market environment.
8.6 Uncertainty of demand for water from major customers Murray Goulburn and Burra Foods are significant consumers of water resources in the Leongatha and Korumburra water supply systems. Production variations together with a possible return to dryer climatic conditions present real security of supply risks to the water supply systems. Murray Goulburn previously announced major capital investment into water saving technologies with bold predictions on water reduction, however, commodity market conditions have impacted on its ability to deliver the later stages of its envisaged savings. Announcements by Murray Goulburn indicate major capital works are being undertaken which may result in significant product mix variation. While higher water consumption would test the reliability of Leongatha’s water supply system, plant rationalisation or further demand reductions could result in a significant financial impact to the Corporation. Burra Foods invested significantly in plant augmentations in 2011 and again in 2014 as it pursues revenue opportunities in various overseas markets. These recent investments have resulted in significant demand for water in a system that is already committed on an annual basis. South Gippsland Water has developed summer/autumn harvesting options in terms of addressing potential demand in 2014/15 and for the immediate short term. The finalisation of options for long term supply is a major task for this Corporate Plan. In addition, South Gippsland Water is looking to implement water supply contracts with these customers in order to understand and implement appropriate investment to meet their supply needs.
South Gippsland Water Corporate Plan
2014/15 to 2018/19
31
8.7 Failure to deliver capital program / projects on time / on budget South Gippsland Water is focussed on delivering its capital works program in an efficient and timely manner. Possible impacts of not delivering an efficient capital works program include regulatory non-compliance, customer dissatisfaction with service delivery, cost blowouts, an inappropriate pricing path, etc. The Corporation has implemented many of the recommendations of its Capital Works Process review. Among other initiatives, South Gippsland Water has set up a Capital Works Board Committee to more closely monitor strategic capital planning and delivery including adoption of leading practice asset and project management.
8.8 Asset Renewals Funding South Gippsland Water’s Asset Management System has identified that its medium term renewals program is likely to need significant capital injection as a significant number of assets are nearing end of life. South Gippsland Water will concentrate efforts for more fully documenting the renewal profile during 2014/15 and utilise the enhanced asset information to assist in developing the 2015/16 Corporate Plan and Water Plan 4.
8.9 Delivery of Efficiency Targets and Savings South Gippsland Water has committed to achieving the core targets, and the stretch and coordinated procurement targets and these efficiencies are reflected in the pricing and financials of the 2014/15 Corporate Plan. There is a risk that these savings are not fully achieved. The impact would be higher accounting losses and increased borrowings as the reduction in prices and impact on revenue has already been committed.
South Gippsland Water Corporate Plan
2014/15 to 2018/19
32
9. Financial Details 9.1 Water Sector Efficiency Initiatives
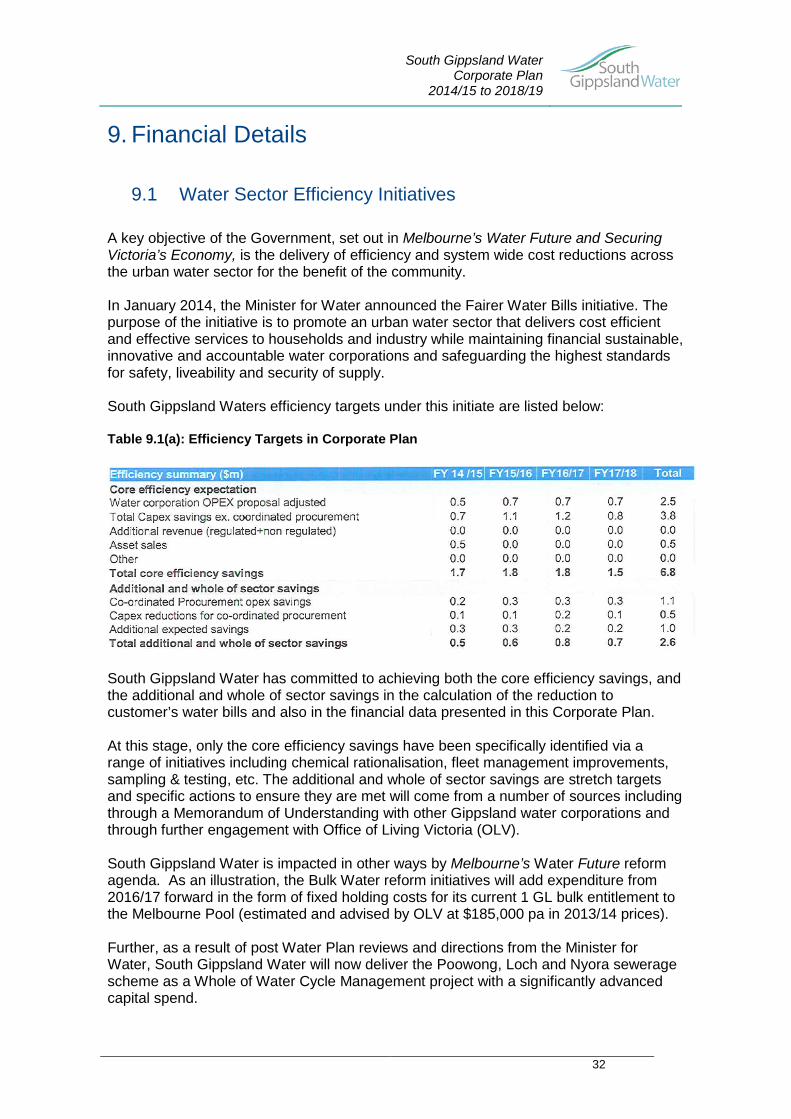
A key objective of the Government, set out in Melbourne’s Water Future and Securing Victoria’s Economy, is the delivery of efficiency and system wide cost reductions across the urban water sector for the benefit of the community. In January 2014, the Minister for Water announced the Fairer Water Bills initiative. The purpose of the initiative is to promote an urban water sector that delivers cost efficient and effective services to households and industry while maintaining financial sustainable, innovative and accountable water corporations and safeguarding the highest standards for safety, liveability and security of supply. South Gippsland Waters efficiency targets under this initiate are listed below: Table 9.1(a): Efficiency Targets in Corporate Plan
South Gippsland Water has committed to achieving both the core efficiency savings, and the additional and whole of sector savings in the calculation of the reduction to customer’s water bills and also in the financial data presented in this Corporate Plan. At this stage, only the core efficiency savings have been specifically identified via a range of initiatives including chemical rationalisation, fleet management improvements, sampling & testing, etc. The additional and whole of sector savings are stretch targets and specific actions to ensure they are met will come from a number of sources including through a Memorandum of Understanding with other Gippsland water corporations and through further engagement with Office of Living Victoria (OLV). South Gippsland Water is impacted in other ways by Melbourne’s Water Future reform agenda. As an illustration, the Bulk Water reform initiatives will add expenditure from 2016/17 forward in the form of fixed holding costs for its current 1 GL bulk entitlement to the Melbourne Pool (estimated and advised by OLV at $185,000 pa in 2013/14 prices). Further, as a result of post Water Plan reviews and directions from the Minister for Water, South Gippsland Water will now deliver the Poowong, Loch and Nyora sewerage scheme as a Whole of Water Cycle Management project with a significantly advanced capital spend.
South Gippsland Water Corporate Plan
2014/15 to 2018/19
33
South Gippsland Water has used the Essential Services Commission pricing model to determine the impacts of the efficiency savings on its revenue base adjusted for the increased bulk water costs and the advancement of the Poowong, Loch, Nyora Sewerage scheme. South Gippsland Water has a diverse customer base including residential, non-residential, community and major customers. General observations regarding the components of revenue are:
• Volumetric water revenue comprises around 35% of total water and wastewater revenue
• Residential volumetric revenue comprises 39% of total volumetric revenue • Residential service charge revenue comprises 89% of total service charge
revenue, excluding major and minor trade waste and cistern customers
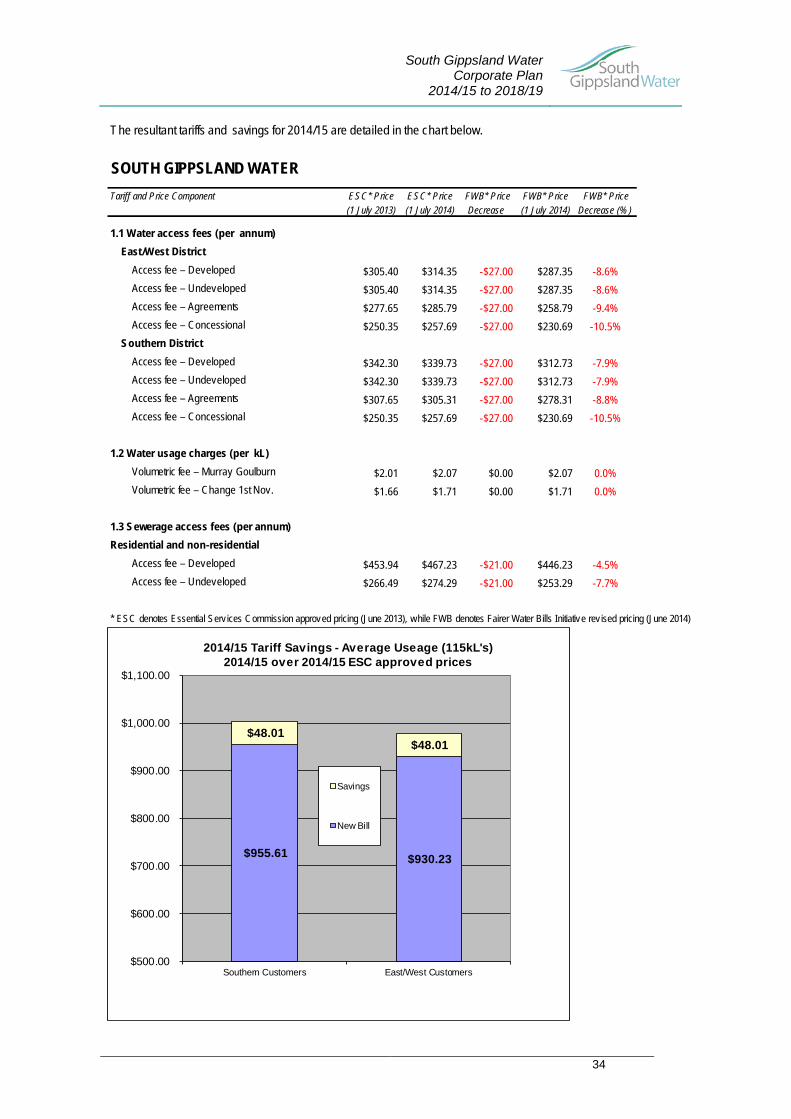
Considering the extent of savings, the customer demographics and South Gippsland Water’s plan to harmonise service charge tariffs, the Corporation has chosen to apply the benefits to all water and wastewater service charges (excluding major and minor trade waste and cistern customers). This provides a high level of benefit (around 89%) to residential customers without the need to create further differential services charges. South Gippsland Water will continue to harmonise its two water district service charges over the next two years that is from 1 July 2016. This means customers of both districts will receive the same $48 reduction in service charges from 1 July 2014. Those customers in the Southern district will continue to receive service charge reductions in 2015/16 and 2016/17 as the rebalancing is phased in. This approach allows South Gippsland Water to provide the greatest savings to households as envisaged by the Fairer Water Bills Initiative.
South Gippsland Water Corporate Plan
2014/15 to 2018/19
34
The resultant tariffs and savings for 2014/15 are detailed in the chart below.
SOUTH GIPPSLAND WATERTariff and Price Component ESC* Price ESC* Price FWB* Price FWB* Price FWB* Price
(1 July 2013) (1 July 2014) Decrease (1 July 2014) Decrease (%)
1.1 Water access fees (per annum) East/West District
Access fee – Developed $305.40 $314.35 -$27.00 $287.35 -8.6%Access fee – Undeveloped $305.40 $314.35 -$27.00 $287.35 -8.6%Access fee – Agreements $277.65 $285.79 -$27.00 $258.79 -9.4%Access fee – Concessional $250.35 $257.69 -$27.00 $230.69 -10.5%
Southern DistrictAccess fee – Developed $342.30 $339.73 -$27.00 $312.73 -7.9%Access fee – Undeveloped $342.30 $339.73 -$27.00 $312.73 -7.9%Access fee – Agreements $307.65 $305.31 -$27.00 $278.31 -8.8%Access fee – Concessional $250.35 $257.69 -$27.00 $230.69 -10.5%
1.2 Water usage charges (per kL)Volumetric fee – Murray Goulburn $2.01 $2.07 $0.00 $2.07 0.0%Volumetric fee – Change 1st Nov. $1.66 $1.71 $0.00 $1.71 0.0%
1.3 Sewerage access fees (per annum)Residential and non-residential
Access fee – Developed $453.94 $467.23 -$21.00 $446.23 -4.5%Access fee – Undeveloped $266.49 $274.29 -$21.00 $253.29 -7.7%
* ESC denotes Essential Serv ices Commission approved pricing (June 2013), while FWB denotes Fairer Water Bills Initiative rev ised pricing (June 2014)
$955.61 $930.23
$48.01 $48.01
$500.00
$600.00
$700.00
$800.00
$900.00
$1,000.00
$1,100.00
Southern Customers East/West Customers
2014/15 Tariff Savings - Average Useage (115kL's)2014/15 over 2014/15 ESC approved prices
Savings
New Bill
South Gippsland Water Corporate Plan
2014/15 to 2018/19
35
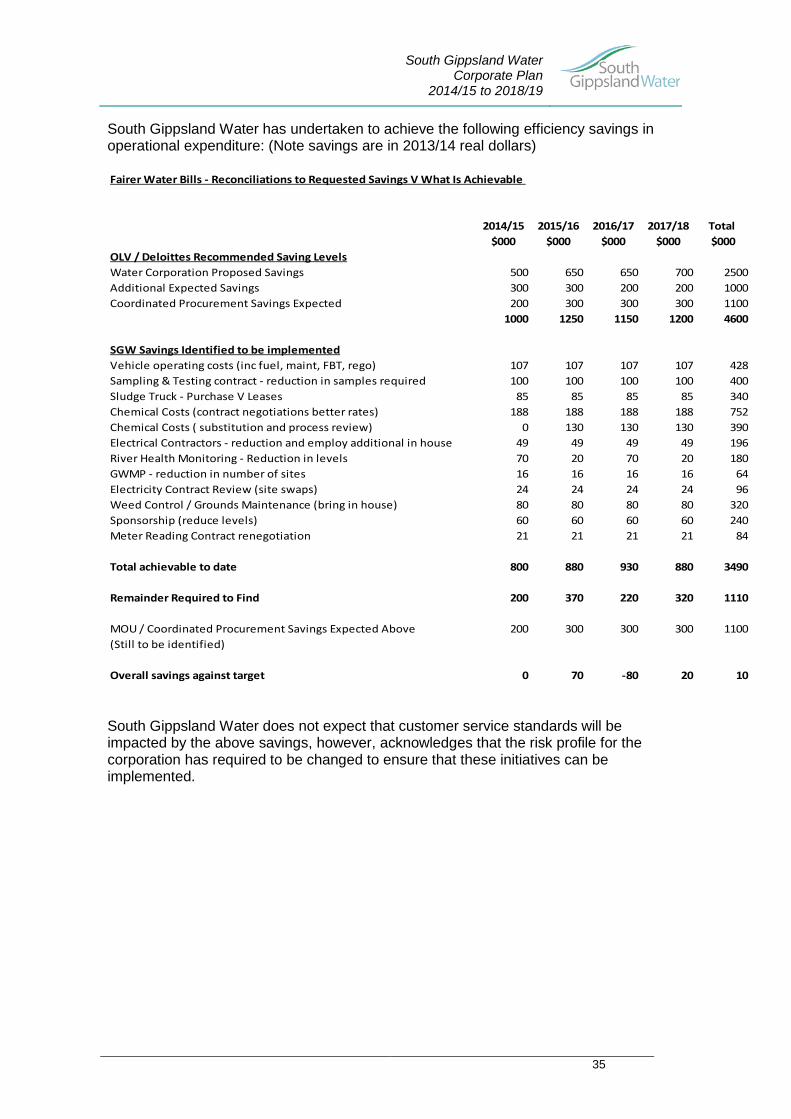
South Gippsland Water has undertaken to achieve the following efficiency savings in operational expenditure: (Note savings are in 2013/14 real dollars) Fairer Water Bills - Reconciliations to Requested Savings V What Is Achievable
2014/15 2015/16 2016/17 2017/18 Total $000 $000 $000 $000 $000
OLV / Deloittes Recommended Saving LevelsWater Corporation Proposed Savings 500 650 650 700 2500Additional Expected Savings 300 300 200 200 1000Coordinated Procurement Savings Expected 200 300 300 300 1100
1000 1250 1150 1200 4600
SGW Savings Identified to be implementedVehicle operating costs (inc fuel, maint, FBT, rego) 107 107 107 107 428Sampling & Testing contract - reduction in samples required 100 100 100 100 400Sludge Truck - Purchase V Leases 85 85 85 85 340Chemical Costs (contract negotiations better rates) 188 188 188 188 752Chemical Costs ( substitution and process review) 0 130 130 130 390Electrical Contractors - reduction and employ additional in house 49 49 49 49 196River Health Monitoring - Reduction in levels 70 20 70 20 180GWMP - reduction in number of sites 16 16 16 16 64Electricity Contract Review (site swaps) 24 24 24 24 96Weed Control / Grounds Maintenance (bring in house) 80 80 80 80 320Sponsorship (reduce levels) 60 60 60 60 240Meter Reading Contract renegotiation 21 21 21 21 84
Total achievable to date 800 880 930 880 3490
Remainder Required to Find 200 370 220 320 1110
MOU / Coordinated Procurement Savings Expected Above 200 300 300 300 1100(Still to be identified)
Overall savings against target 0 70 -80 20 10 South Gippsland Water does not expect that customer service standards will be impacted by the above savings, however, acknowledges that the risk profile for the corporation has required to be changed to ensure that these initiatives can be implemented.
South Gippsland Water Corporate Plan
2014/15 to 2018/19
36
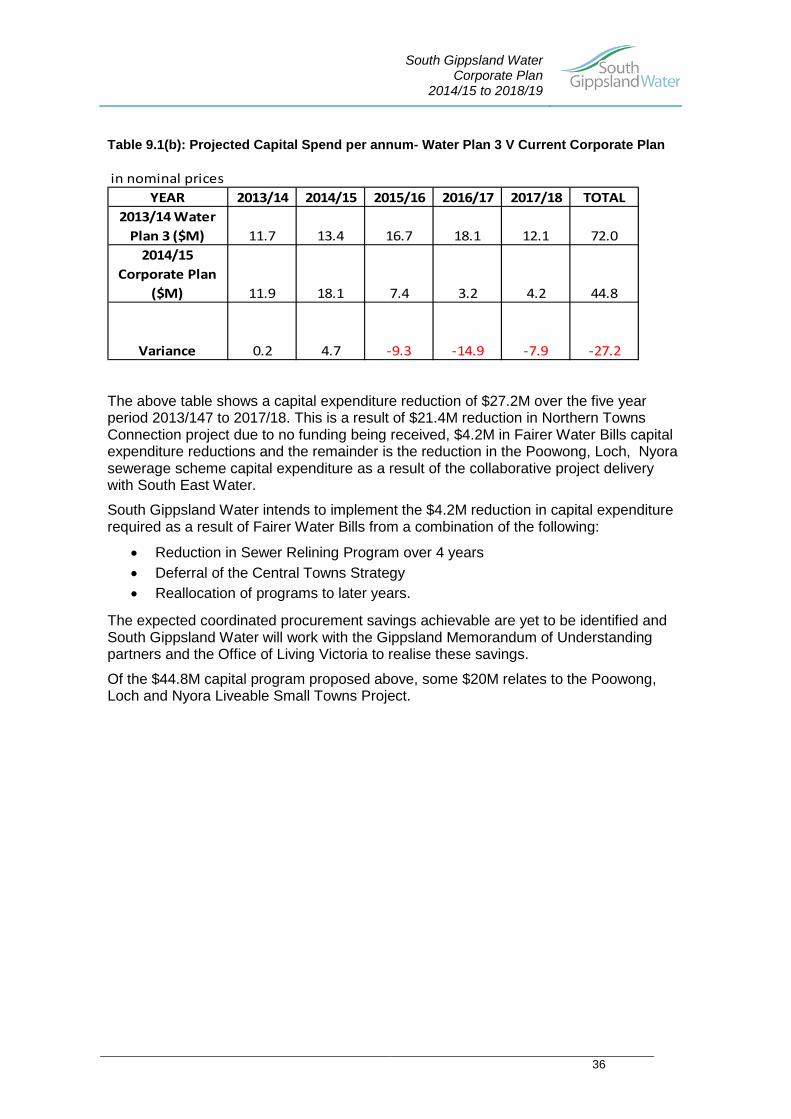
Table 9.1(b): Projected Capital Spend per annum- Water Plan 3 V Current Corporate Plan in nominal prices
YEAR 2013/14 2014/15 2015/16 2016/17 2017/18 TOTAL2013/14 Water
Plan 3 ($M) 11.7 13.4 16.7 18.1 12.1 72.02014/15
Corporate Plan ($M) 11.9 18.1 7.4 3.2 4.2 44.8
Variance 0.2 4.7 -9.3 -14.9 -7.9 -27.2
The above table shows a capital expenditure reduction of $27.2M over the five year period 2013/147 to 2017/18. This is a result of $21.4M reduction in Northern Towns Connection project due to no funding being received, $4.2M in Fairer Water Bills capital expenditure reductions and the remainder is the reduction in the Poowong, Loch, Nyora sewerage scheme capital expenditure as a result of the collaborative project delivery with South East Water.
South Gippsland Water intends to implement the $4.2M reduction in capital expenditure required as a result of Fairer Water Bills from a combination of the following:
• Reduction in Sewer Relining Program over 4 years • Deferral of the Central Towns Strategy • Reallocation of programs to later years.
The expected coordinated procurement savings achievable are yet to be identified and South Gippsland Water will work with the Gippsland Memorandum of Understanding partners and the Office of Living Victoria to realise these savings.
Of the $44.8M capital program proposed above, some $20M relates to the Poowong, Loch and Nyora Liveable Small Towns Project.
South Gippsland Water Corporate Plan
2014/15 to 2018/19
37
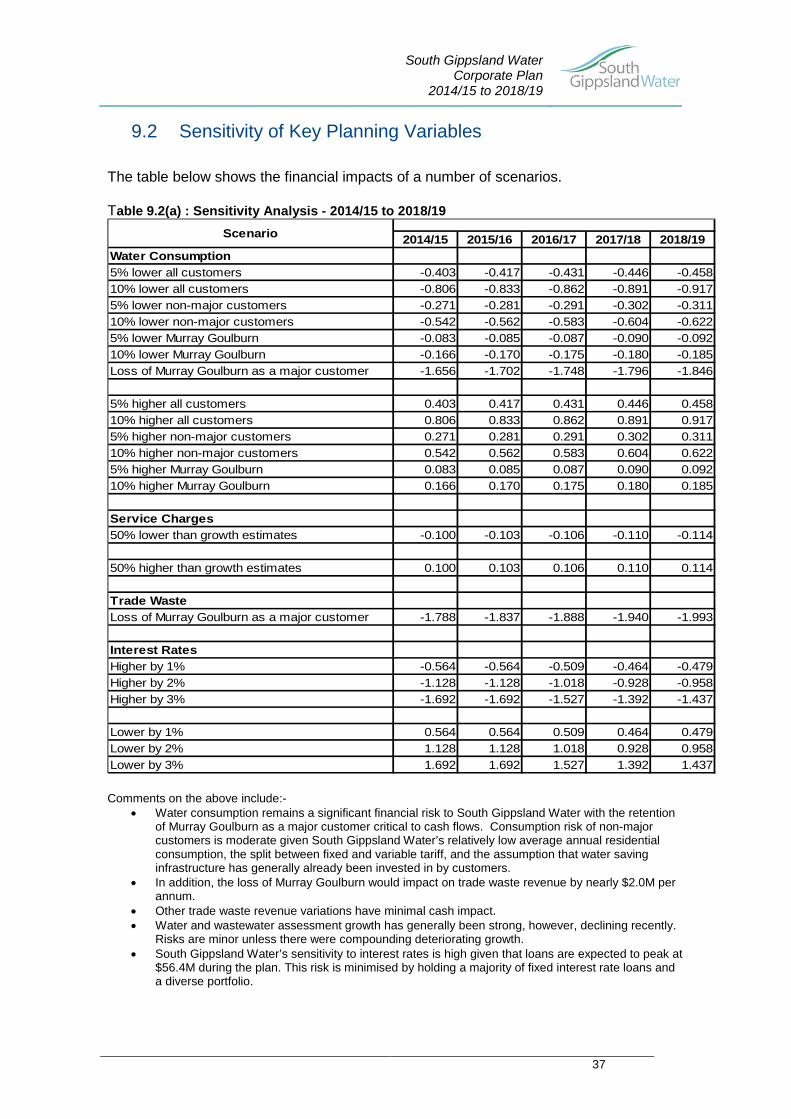
9.2 Sensitivity of Key Planning Variables
The table below shows the financial impacts of a number of scenarios. Table 9.2(a) : Sensitivity Analysis - 2014/15 to 2018/19
2014/15 2015/16 2016/17 2017/18 2018/19Water Consumption5% lower all customers -0.403 -0.417 -0.431 -0.446 -0.45810% lower all customers -0.806 -0.833 -0.862 -0.891 -0.9175% lower non-major customers -0.271 -0.281 -0.291 -0.302 -0.31110% lower non-major customers -0.542 -0.562 -0.583 -0.604 -0.6225% lower Murray Goulburn -0.083 -0.085 -0.087 -0.090 -0.09210% lower Murray Goulburn -0.166 -0.170 -0.175 -0.180 -0.185Loss of Murray Goulburn as a major customer -1.656 -1.702 -1.748 -1.796 -1.846
5% higher all customers 0.403 0.417 0.431 0.446 0.45810% higher all customers 0.806 0.833 0.862 0.891 0.9175% higher non-major customers 0.271 0.281 0.291 0.302 0.31110% higher non-major customers 0.542 0.562 0.583 0.604 0.6225% higher Murray Goulburn 0.083 0.085 0.087 0.090 0.09210% higher Murray Goulburn 0.166 0.170 0.175 0.180 0.185
Service Charges50% lower than growth estimates -0.100 -0.103 -0.106 -0.110 -0.114
50% higher than growth estimates 0.100 0.103 0.106 0.110 0.114
Trade WasteLoss of Murray Goulburn as a major customer -1.788 -1.837 -1.888 -1.940 -1.993
Interest RatesHigher by 1% -0.564 -0.564 -0.509 -0.464 -0.479Higher by 2% -1.128 -1.128 -1.018 -0.928 -0.958Higher by 3% -1.692 -1.692 -1.527 -1.392 -1.437
Lower by 1% 0.564 0.564 0.509 0.464 0.479Lower by 2% 1.128 1.128 1.018 0.928 0.958Lower by 3% 1.692 1.692 1.527 1.392 1.437
Scenario
Comments on the above include:-
• Water consumption remains a significant financial risk to South Gippsland Water with the retention of Murray Goulburn as a major customer critical to cash flows. Consumption risk of non-major customers is moderate given South Gippsland Water’s relatively low average annual residential consumption, the split between fixed and variable tariff, and the assumption that water saving infrastructure has generally already been invested in by customers.
• In addition, the loss of Murray Goulburn would impact on trade waste revenue by nearly $2.0M per annum.
• Other trade waste revenue variations have minimal cash impact. • Water and wastewater assessment growth has generally been strong, however, declining recently.
Risks are minor unless there were compounding deteriorating growth. • South Gippsland Water’s sensitivity to interest rates is high given that loans are expected to peak at
$56.4M during the plan. This risk is minimised by holding a majority of fixed interest rate loans and a diverse portfolio.
South Gippsland Water Corporate Plan
2014/15 to 2018/19
38
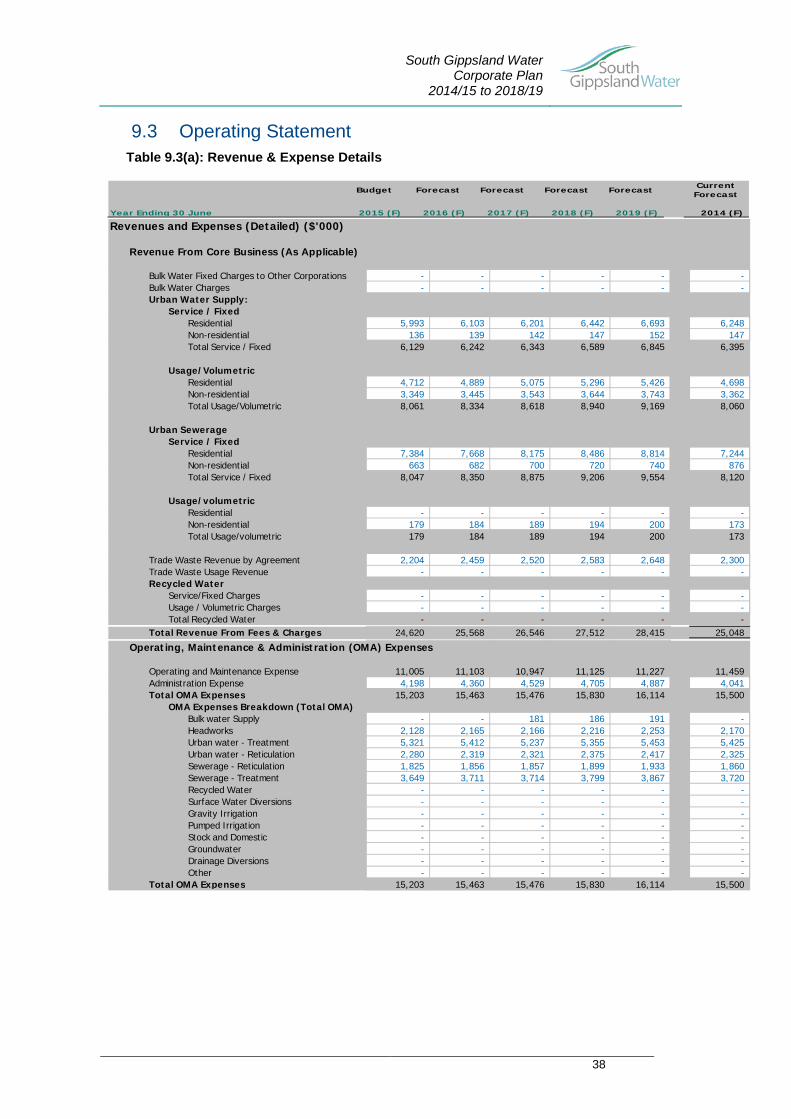
9.3 Operating Statement Table 9.3(a): Revenue & Expense Details
Revenues and Expenses (Detailed) ($'000)
Revenue From Core Business (As Applicable)
Bulk Water Fixed Charges to Other Corporations - - - - - -Bulk Water Charges - - - - - -Urban Water Supply:
Service / FixedResidential 5,993 6,103 6,201 6,442 6,693 6,248Non-residential 136 139 142 147 152 147Total Service / Fixed 6,129 6,242 6,343 6,589 6,845 6,395
Usage/VolumetricResidential 4,712 4,889 5,075 5,296 5,426 4,698Non-residential 3,349 3,445 3,543 3,644 3,743 3,362Total Usage/Volumetric 8,061 8,334 8,618 8,940 9,169 8,060
Urban SewerageService / Fixed
Residential 7,384 7,668 8,175 8,486 8,814 7,244Non-residential 663 682 700 720 740 876Total Service / Fixed 8,047 8,350 8,875 9,206 9,554 8,120
Usage/volumetricResidential - - - - - -Non-residential 179 184 189 194 200 173Total Usage/volumetric 179 184 189 194 200 173
Trade Waste Revenue by Agreement 2,204 2,459 2,520 2,583 2,648 2,300Trade Waste Usage Revenue - - - - - -Recycled Water
Service/Fixed Charges - - - - - -Usage / Volumetric Charges - - - - - -Total Recycled Water - - - - - -
Total Revenue From Fees & Charges 24,620 25,568 26,546 27,512 28,415 25,048
Operating, Maintenance & Administration (OMA) Expenses
Operating and Maintenance Expense 11,005 11,103 10,947 11,125 11,227 11,459Administration Expense 4,198 4,360 4,529 4,705 4,887 4,041Total OMA Expenses 15,203 15,463 15,476 15,830 16,114 15,500
OMA Expenses Breakdown (Total OMA)Bulk water Supply - - 181 186 191 -Headworks 2,128 2,165 2,166 2,216 2,253 2,170Urban water - Treatment 5,321 5,412 5,237 5,355 5,453 5,425Urban water - Reticulation 2,280 2,319 2,321 2,375 2,417 2,325Sewerage - Reticulation 1,825 1,856 1,857 1,899 1,933 1,860Sewerage - Treatment 3,649 3,711 3,714 3,799 3,867 3,720Recycled Water - - - - - -Surface Water Diversions - - - - - -Gravity Irrigation - - - - - -Pumped Irrigation - - - - - -Stock and Domestic - - - - - -Groundwater - - - - - -Drainage Diversions - - - - - -Other - - - - - -
Total OMA Expenses 15,203 15,463 15,476 15,830 16,114 15,500
Budget Forecast Forecast Forecast Forecast Current Forecast
Year Ending 30 June 2015 (F) 2016 (F) 2017 (F) 2018 (F) 2019 (F) 2014 (F)
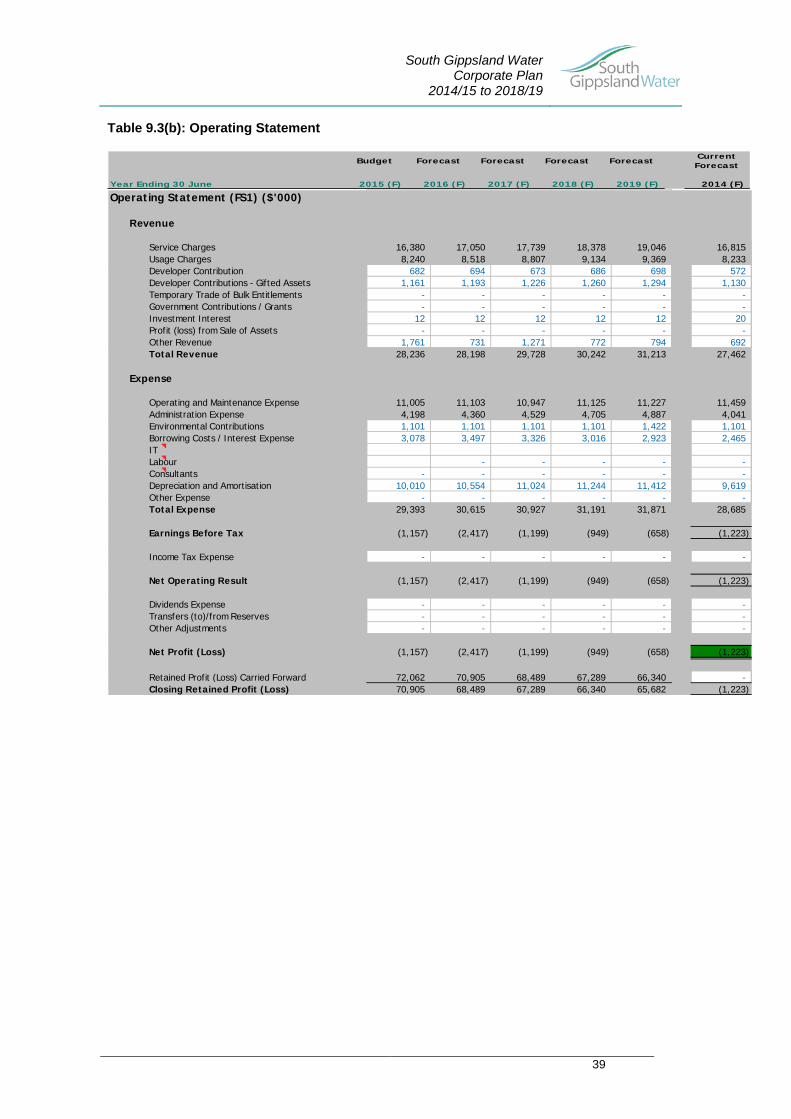
South Gippsland Water Corporate Plan
2014/15 to 2018/19
39
Table 9.3(b): Operating Statement
Operating Statement (FS1) ($'000)
Revenue
Service Charges 16,380 17,050 17,739 18,378 19,046 16,815Usage Charges 8,240 8,518 8,807 9,134 9,369 8,233Developer Contribution 682 694 673 686 698 572Developer Contributions - Gifted Assets 1,161 1,193 1,226 1,260 1,294 1,130Temporary Trade of Bulk Entitlements - - - - - -Government Contributions / Grants - - - - - -Investment Interest 12 12 12 12 12 20Profit (loss) from Sale of Assets - - - - - -Other Revenue 1,761 731 1,271 772 794 692Total Revenue 28,236 28,198 29,728 30,242 31,213 27,462
Expense
Operating and Maintenance Expense 11,005 11,103 10,947 11,125 11,227 11,459Administration Expense 4,198 4,360 4,529 4,705 4,887 4,041Environmental Contributions 1,101 1,101 1,101 1,101 1,422 1,101Borrowing Costs / Interest Expense 3,078 3,497 3,326 3,016 2,923 2,465ITLabour - - - - -Consultants - - - - - -Depreciation and Amortisation 10,010 10,554 11,024 11,244 11,412 9,619Other Expense - - - - - -Total Expense 29,393 30,615 30,927 31,191 31,871 28,685
Earnings Before Tax (1,157) (2,417) (1,199) (949) (658) (1,223)
Income Tax Expense - - - - - -
Net Operating Result (1,157) (2,417) (1,199) (949) (658) (1,223)
Dividends Expense - - - - - -Transfers (to)/from Reserves - - - - - -Other Adjustments - - - - - -
Net Profit (Loss) (1,157) (2,417) (1,199) (949) (658) (1,223)
Retained Profit (Loss) Carried Forward 72,062 70,905 68,489 67,289 66,340 -Closing Retained Profit (Loss) 70,905 68,489 67,289 66,340 65,682 (1,223)
Budget Forecast Forecast Forecast Forecast Current Forecast
Year Ending 30 June 2015 (F) 2016 (F) 2017 (F) 2018 (F) 2019 (F) 2014 (F)
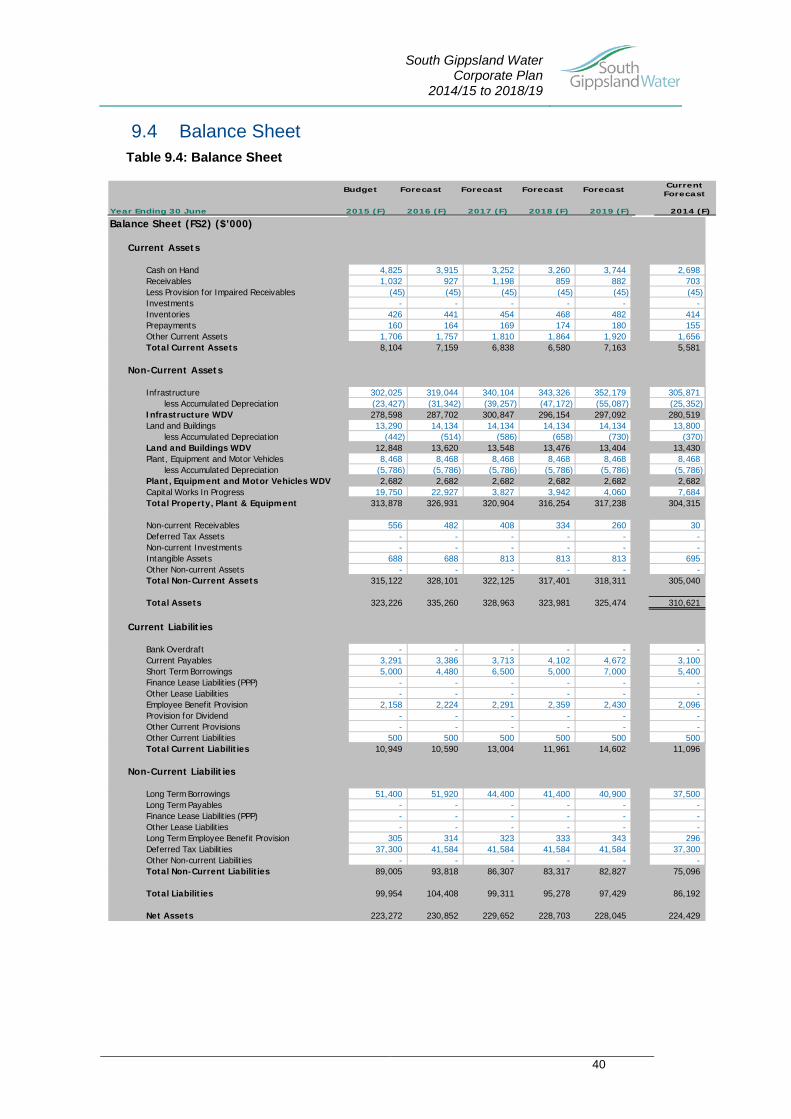
South Gippsland Water Corporate Plan
2014/15 to 2018/19
40
9.4 Balance Sheet Table 9.4: Balance Sheet
Balance Sheet (FS2) ($'000)
Current Assets
Cash on Hand 4,825 3,915 3,252 3,260 3,744 2,698Receivables 1,032 927 1,198 859 882 703Less Provision for Impaired Receivables (45) (45) (45) (45) (45) (45)Investments - - - - - -Inventories 426 441 454 468 482 414Prepayments 160 164 169 174 180 155Other Current Assets 1,706 1,757 1,810 1,864 1,920 1,656Total Current Assets 8,104 7,159 6,838 6,580 7,163 5,581
Non-Current Assets
Infrastructure 302,025 319,044 340,104 343,326 352,179 305,871less Accumulated Depreciation (23,427) (31,342) (39,257) (47,172) (55,087) (25,352)
Infrastructure WDV 278,598 287,702 300,847 296,154 297,092 280,519Land and Buildings 13,290 14,134 14,134 14,134 14,134 13,800
less Accumulated Depreciation (442) (514) (586) (658) (730) (370)Land and Buildings WDV 12,848 13,620 13,548 13,476 13,404 13,430Plant, Equipment and Motor Vehicles 8,468 8,468 8,468 8,468 8,468 8,468
less Accumulated Depreciation (5,786) (5,786) (5,786) (5,786) (5,786) (5,786)Plant, Equipment and Motor Vehicles WDV 2,682 2,682 2,682 2,682 2,682 2,682Capital Works In Progress 19,750 22,927 3,827 3,942 4,060 7,684Total Property, Plant & Equipment 313,878 326,931 320,904 316,254 317,238 304,315
Non-current Receivables 556 482 408 334 260 30Deferred Tax Assets - - - - - -Non-current Investments - - - - - -Intangible Assets 688 688 813 813 813 695Other Non-current Assets - - - - - -Total Non-Current Assets 315,122 328,101 322,125 317,401 318,311 305,040
Total Assets 323,226 335,260 328,963 323,981 325,474 310,621
Current Liabilities
Bank Overdraft - - - - - -Current Payables 3,291 3,386 3,713 4,102 4,672 3,100Short Term Borrowings 5,000 4,480 6,500 5,000 7,000 5,400Finance Lease Liabilities (PPP) - - - - - -Other Lease Liabilities - - - - - -Employee Benefit Provision 2,158 2,224 2,291 2,359 2,430 2,096Provision for Dividend - - - - - -Other Current Provisions - - - - - -Other Current Liabilities 500 500 500 500 500 500Total Current Liabilities 10,949 10,590 13,004 11,961 14,602 11,096
Non-Current Liabilities
Long Term Borrowings 51,400 51,920 44,400 41,400 40,900 37,500Long Term Payables - - - - - -Finance Lease Liabilities (PPP) - - - - - -Other Lease Liabilities - - - - - -Long Term Employee Benefit Provision 305 314 323 333 343 296Deferred Tax Liabilities 37,300 41,584 41,584 41,584 41,584 37,300Other Non-current Liabilities - - - - - -Total Non-Current Liabilities 89,005 93,818 86,307 83,317 82,827 75,096
Total Liabilities 99,954 104,408 99,311 95,278 97,429 86,192
Net Assets 223,272 230,852 229,652 228,703 228,045 224,429
Budget Forecast Forecast Forecast Forecast Current Forecast
Year Ending 30 June 2015 (F) 2016 (F) 2017 (F) 2018 (F) 2019 (F) 2014 (F)
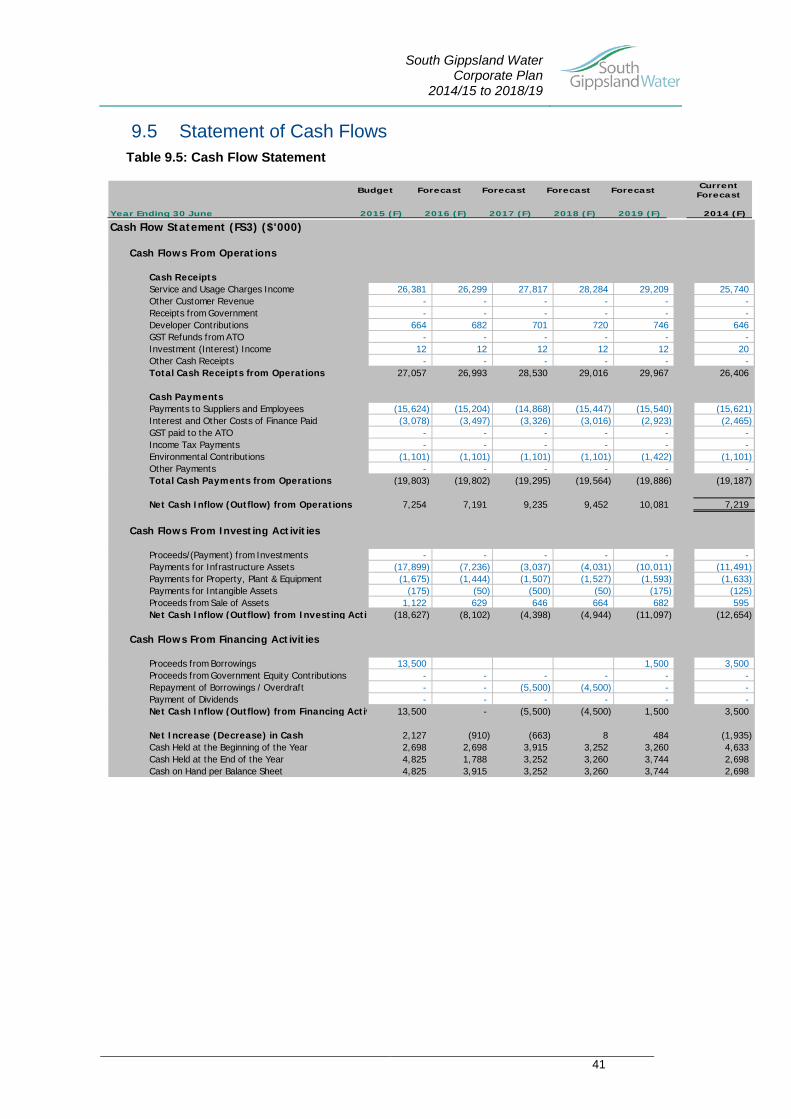
South Gippsland Water Corporate Plan
2014/15 to 2018/19
41
9.5 Statement of Cash Flows Table 9.5: Cash Flow Statement
Cash Flow Statement (FS3) ($'000)
Cash Flows From Operations
Cash ReceiptsService and Usage Charges Income 26,381 26,299 27,817 28,284 29,209 25,740Other Customer Revenue - - - - - -Receipts from Government - - - - - -Developer Contributions 664 682 701 720 746 646GST Refunds from ATO - - - - - -Investment (Interest) Income 12 12 12 12 12 20Other Cash Receipts - - - - - -Total Cash Receipts from Operations 27,057 26,993 28,530 29,016 29,967 26,406
Cash PaymentsPayments to Suppliers and Employees (15,624) (15,204) (14,868) (15,447) (15,540) (15,621)Interest and Other Costs of Finance Paid (3,078) (3,497) (3,326) (3,016) (2,923) (2,465)GST paid to the ATO - - - - - -Income Tax Payments - - - - - -Environmental Contributions (1,101) (1,101) (1,101) (1,101) (1,422) (1,101)Other Payments - - - - - -Total Cash Payments from Operations (19,803) (19,802) (19,295) (19,564) (19,886) (19,187)
Net Cash Inflow (Outflow) from Operations 7,254 7,191 9,235 9,452 10,081 7,219
Cash Flows From Investing Activities
Proceeds/(Payment) from Investments - - - - - -Payments for Infrastructure Assets (17,899) (7,236) (3,037) (4,031) (10,011) (11,491)Payments for Property, Plant & Equipment (1,675) (1,444) (1,507) (1,527) (1,593) (1,633)Payments for Intangible Assets (175) (50) (500) (50) (175) (125)Proceeds from Sale of Assets 1,122 629 646 664 682 595Net Cash Inflow (Outflow) from Investing Activ (18,627) (8,102) (4,398) (4,944) (11,097) (12,654)
Cash Flows From Financing Activities
Proceeds from Borrowings 13,500 1,500 3,500Proceeds from Government Equity Contributions - - - - - -Repayment of Borrowings / Overdraft - - (5,500) (4,500) - -Payment of Dividends - - - - - -Net Cash Inflow (Outflow) from Financing Activ 13,500 - (5,500) (4,500) 1,500 3,500
Net Increase (Decrease) in Cash 2,127 (910) (663) 8 484 (1,935)Cash Held at the Beginning of the Year 2,698 2,698 3,915 3,252 3,260 4,633Cash Held at the End of the Year 4,825 1,788 3,252 3,260 3,744 2,698Cash on Hand per Balance Sheet 4,825 3,915 3,252 3,260 3,744 2,698
Budget Forecast Forecast Forecast Forecast Current Forecast
Year Ending 30 June 2015 (F) 2016 (F) 2017 (F) 2018 (F) 2019 (F) 2014 (F)
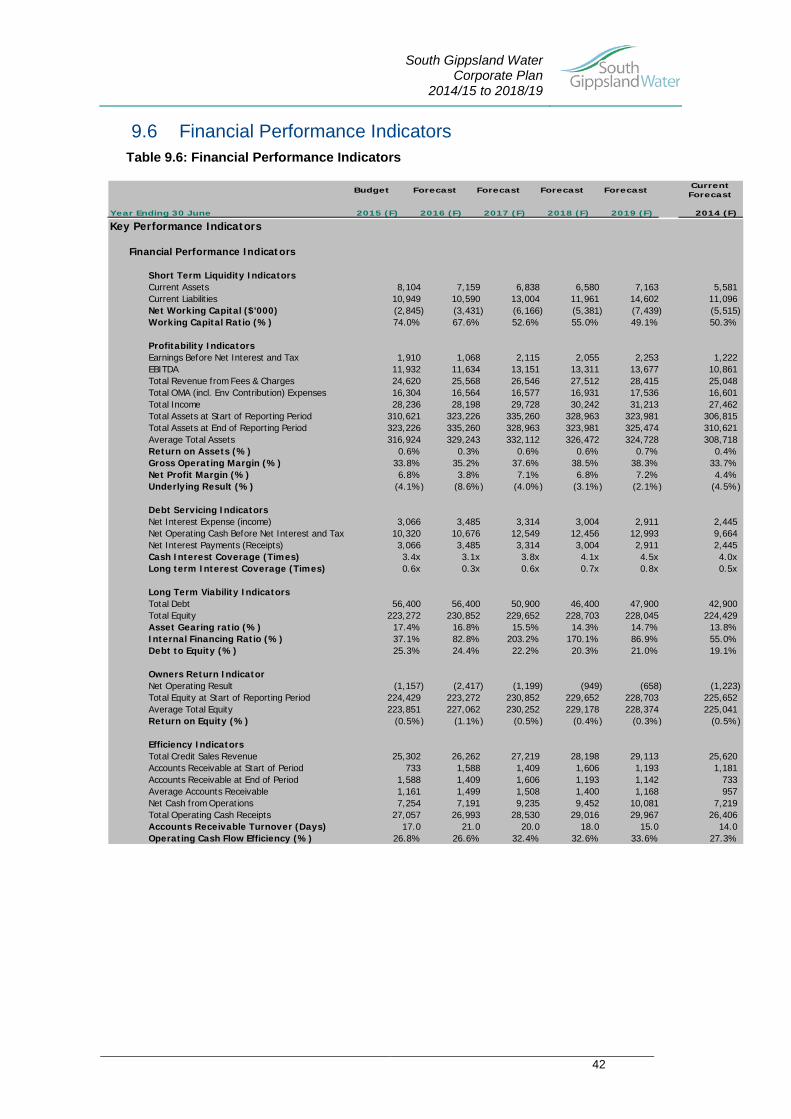
South Gippsland Water Corporate Plan
2014/15 to 2018/19
42
9.6 Financial Performance Indicators Table 9.6: Financial Performance Indicators
Key Performance Indicators
Financial Performance Indicators
Short Term Liquidity IndicatorsCurrent Assets 8,104 7,159 6,838 6,580 7,163 5,581Current Liabilities 10,949 10,590 13,004 11,961 14,602 11,096Net Working Capital ($'000) (2,845) (3,431) (6,166) (5,381) (7,439) (5,515)Working Capital Ratio (%) 74.0% 67.6% 52.6% 55.0% 49.1% 50.3%
Profitability IndicatorsEarnings Before Net Interest and Tax 1,910 1,068 2,115 2,055 2,253 1,222EBITDA 11,932 11,634 13,151 13,311 13,677 10,861Total Revenue from Fees & Charges 24,620 25,568 26,546 27,512 28,415 25,048Total OMA (incl. Env Contribution) Expenses 16,304 16,564 16,577 16,931 17,536 16,601Total Income 28,236 28,198 29,728 30,242 31,213 27,462Total Assets at Start of Reporting Period 310,621 323,226 335,260 328,963 323,981 306,815Total Assets at End of Reporting Period 323,226 335,260 328,963 323,981 325,474 310,621Average Total Assets 316,924 329,243 332,112 326,472 324,728 308,718Return on Assets (%) 0.6% 0.3% 0.6% 0.6% 0.7% 0.4%Gross Operating Margin (%) 33.8% 35.2% 37.6% 38.5% 38.3% 33.7%Net Profit Margin (%) 6.8% 3.8% 7.1% 6.8% 7.2% 4.4%Underlying Result (%) (4.1%) (8.6%) (4.0%) (3.1%) (2.1%) (4.5%)
Debt Servicing IndicatorsNet Interest Expense (income) 3,066 3,485 3,314 3,004 2,911 2,445Net Operating Cash Before Net Interest and Tax 10,320 10,676 12,549 12,456 12,993 9,664Net Interest Payments (Receipts) 3,066 3,485 3,314 3,004 2,911 2,445Cash Interest Coverage (Times) 3.4x 3.1x 3.8x 4.1x 4.5x 4.0xLong term Interest Coverage (Times) 0.6x 0.3x 0.6x 0.7x 0.8x 0.5x
Long Term Viability IndicatorsTotal Debt 56,400 56,400 50,900 46,400 47,900 42,900Total Equity 223,272 230,852 229,652 228,703 228,045 224,429Asset Gearing ratio (%) 17.4% 16.8% 15.5% 14.3% 14.7% 13.8%Internal Financing Ratio (%) 37.1% 82.8% 203.2% 170.1% 86.9% 55.0%Debt to Equity (%) 25.3% 24.4% 22.2% 20.3% 21.0% 19.1%
Owners Return IndicatorNet Operating Result (1,157) (2,417) (1,199) (949) (658) (1,223)Total Equity at Start of Reporting Period 224,429 223,272 230,852 229,652 228,703 225,652Average Total Equity 223,851 227,062 230,252 229,178 228,374 225,041Return on Equity (%) (0.5%) (1.1%) (0.5%) (0.4%) (0.3%) (0.5%)
Efficiency IndicatorsTotal Credit Sales Revenue 25,302 26,262 27,219 28,198 29,113 25,620Accounts Receivable at Start of Period 733 1,588 1,409 1,606 1,193 1,181Accounts Receivable at End of Period 1,588 1,409 1,606 1,193 1,142 733Average Accounts Receivable 1,161 1,499 1,508 1,400 1,168 957Net Cash from Operations 7,254 7,191 9,235 9,452 10,081 7,219Total Operating Cash Receipts 27,057 26,993 28,530 29,016 29,967 26,406Accounts Receivable Turnover (Days) 17.0 21.0 20.0 18.0 15.0 14.0Operating Cash Flow Efficiency (%) 26.8% 26.6% 32.4% 32.6% 33.6% 27.3%
Budget Forecast Forecast Forecast Forecast Current Forecast
Year Ending 30 June 2015 (F) 2016 (F) 2017 (F) 2018 (F) 2019 (F) 2014 (F)
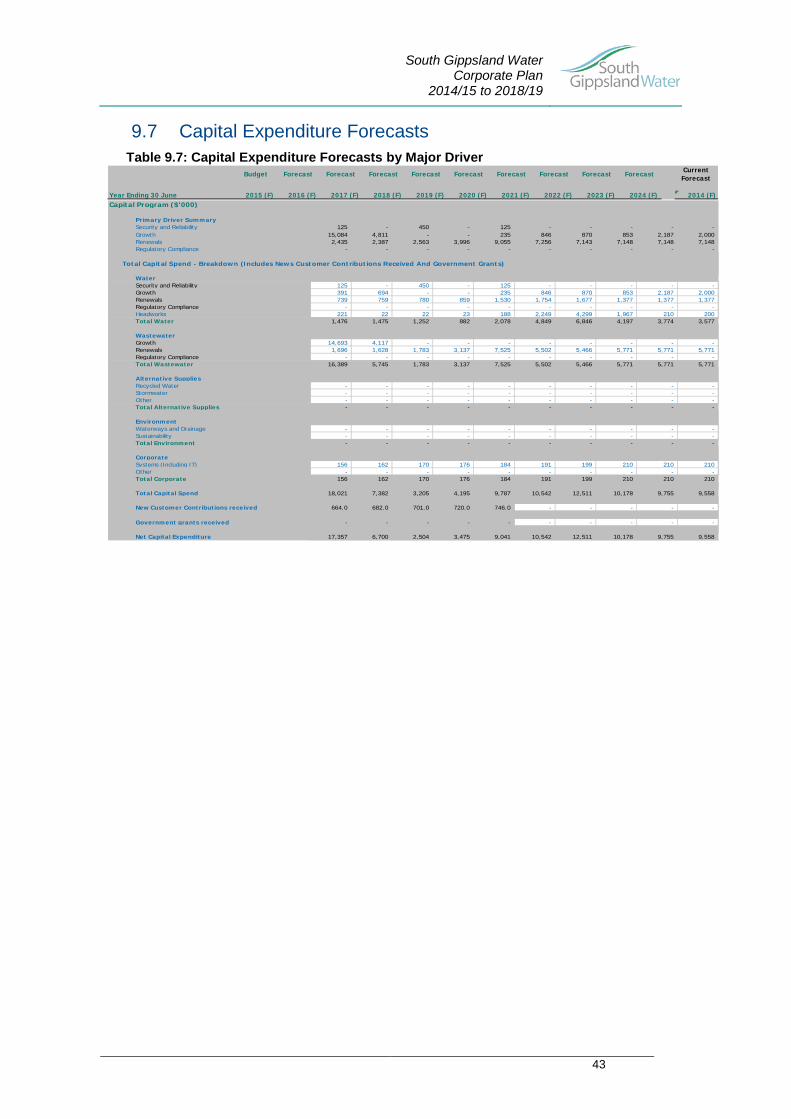
South Gippsland Water Corporate Plan
2014/15 to 2018/19
43
9.7 Capital Expenditure Forecasts Table 9.7: Capital Expenditure Forecasts by Major Driver
Budget Forecast Forecast Forecast Forecast Forecast Forecast Forecast Forecast Forecast Current Forecast
Year Ending 30 June 2015 (F) 2016 (F) 2017 (F) 2018 (F) 2019 (F) 2020 (F) 2021 (F) 2022 (F) 2023 (F) 2024 (F) 2014 (F) Capital Program ($'000)
Primary Driver SummarySecurity and Reliability 125 - 450 - 125 - - - - -Growth 15,084 4,811 - - 235 846 870 853 2,187 2,000Renewals 2,435 2,387 2,563 3,996 9,055 7,256 7,143 7,148 7,148 7,148Regulatory Compliance - - - - - - - - - -
Total Capital Spend - Breakdown (Includes News Customer Contributions Received And Government Grants)
WaterSecurity and Reliability 125 - 450 - 125 - - - - -Growth 391 694 - - 235 846 870 853 2,187 2,000Renewals 739 759 780 859 1,530 1,754 1,677 1,377 1,377 1,377Regulatory Compliance - - - - - - - - - -Headworks 221 22 22 23 188 2,249 4,299 1,967 210 200Total Water 1,476 1,475 1,252 882 2,078 4,849 6,846 4,197 3,774 3,577
WastewaterGrowth 14,693 4,117 - - - - - - - -Renewals 1,696 1,628 1,783 3,137 7,525 5,502 5,466 5,771 5,771 5,771Regulatory Compliance - - - - - - - - - -Total Wastewater 16,389 5,745 1,783 3,137 7,525 5,502 5,466 5,771 5,771 5,771
Alternative SuppliesRecycled Water - - - - - - - - - -Stormwater - - - - - - - - - -Other - - - - - - - - - -Total Alternative Supplies - - - - - - - - - -
EnvironmentWaterways and Drainage - - - - - - - - - -Sustainability - - - - - - - - - -Total Environment - - - - - - - - - -
CorporateSystems (Including IT) 156 162 170 176 184 191 199 210 210 210Other - - - - - - - - - -Total Corporate 156 162 170 176 184 191 199 210 210 210
Total Capital Spend 18,021 7,382 3,205 4,195 9,787 10,542 12,511 10,178 9,755 9,558
New Customer Contributions received 664.0 682.0 701.0 720.0 746.0 - - - - -
Government grants received - - - - - - - - - -
Net Capital Expenditure 17,357 6,700 2,504 3,475 9,041 10,542 12,511 10,178 9,755 9,558
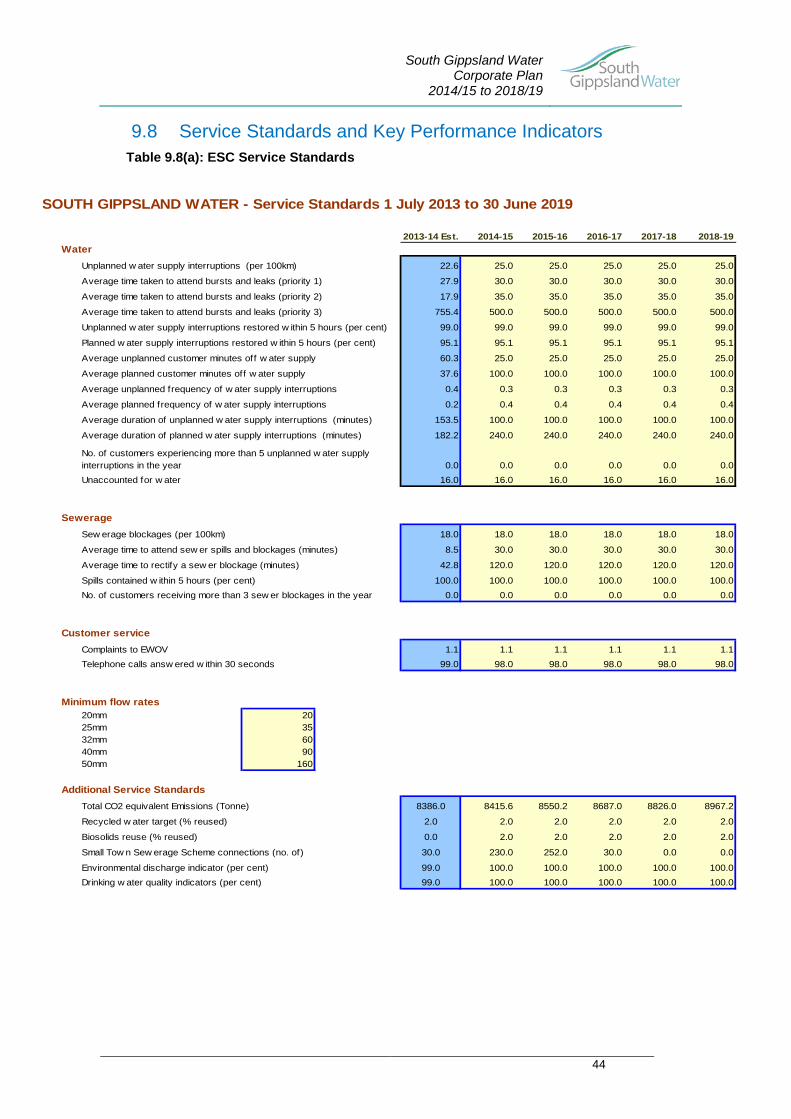
South Gippsland Water Corporate Plan
2014/15 to 2018/19
44
9.8 Service Standards and Key Performance Indicators Table 9.8(a): ESC Service Standards
SOUTH GIPPSLAND WATER - Service Standards 1 July 2013 to 30 June 2019
2013-14 Est. 2014-15 2015-16 2016-17 2017-18 2018-19Water
22.6 25.0 25.0 25.0 25.0 25.0
27.9 30.0 30.0 30.0 30.0 30.0
17.9 35.0 35.0 35.0 35.0 35.0
755.4 500.0 500.0 500.0 500.0 500.0
99.0 99.0 99.0 99.0 99.0 99.0
95.1 95.1 95.1 95.1 95.1 95.1
60.3 25.0 25.0 25.0 25.0 25.0
37.6 100.0 100.0 100.0 100.0 100.0
0.4 0.3 0.3 0.3 0.3 0.3
0.2 0.4 0.4 0.4 0.4 0.4
153.5 100.0 100.0 100.0 100.0 100.0
182.2 240.0 240.0 240.0 240.0 240.0
0.0 0.0 0.0 0.0 0.0 0.016.0 16.0 16.0 16.0 16.0 16.0
Sewerage18.0 18.0 18.0 18.0 18.0 18.0
8.5 30.0 30.0 30.0 30.0 30.0
42.8 120.0 120.0 120.0 120.0 120.0
100.0 100.0 100.0 100.0 100.0 100.00.0 0.0 0.0 0.0 0.0 0.0
Customer service1.1 1.1 1.1 1.1 1.1 1.1
99.0 98.0 98.0 98.0 98.0 98.0
Minimum flow rates20mm 2025mm 3532mm 6040mm 9050mm 160
Additional Service Standards8386.0 8415.6 8550.2 8687.0 8826.0 8967.2
2.0 2.0 2.0 2.0 2.0 2.0
0.0 2.0 2.0 2.0 2.0 2.0
30.0 230.0 252.0 30.0 0.0 0.0
99.0 100.0 100.0 100.0 100.0 100.099.0 100.0 100.0 100.0 100.0 100.0Drinking w ater quality indicators (per cent)
Complaints to EWOVTelephone calls answ ered w ithin 30 seconds
Biosolids reuse (% reused)
Total CO2 equivalent Emissions (Tonne)
Average duration of unplanned w ater supply interruptions (minutes)
Small Tow n Sew erage Scheme connections (no. of)
Average time to rectify a sew er blockage (minutes)
Spills contained w ithin 5 hours (per cent)
Environmental discharge indicator (per cent)
No. of customers receiving more than 3 sew er blockages in the year
Unplanned w ater supply interruptions (per 100km)
Average time taken to attend bursts and leaks (priority 1)
Average time taken to attend bursts and leaks (priority 2)
Average time taken to attend bursts and leaks (priority 3)
Recycled w ater target (% reused)
Average time to attend sew er spills and blockages (minutes)
Unplanned w ater supply interruptions restored w ithin 5 hours (per cent)
Planned w ater supply interruptions restored w ithin 5 hours (per cent)
Average unplanned customer minutes off w ater supply
Average planned customer minutes off w ater supply
Average duration of planned w ater supply interruptions (minutes)
No. of customers experiencing more than 5 unplanned w ater supply interruptions in the yearUnaccounted for w ater
Sew erage blockages (per 100km)
Average unplanned frequency of w ater supply interruptions
Average planned frequency of w ater supply interruptions
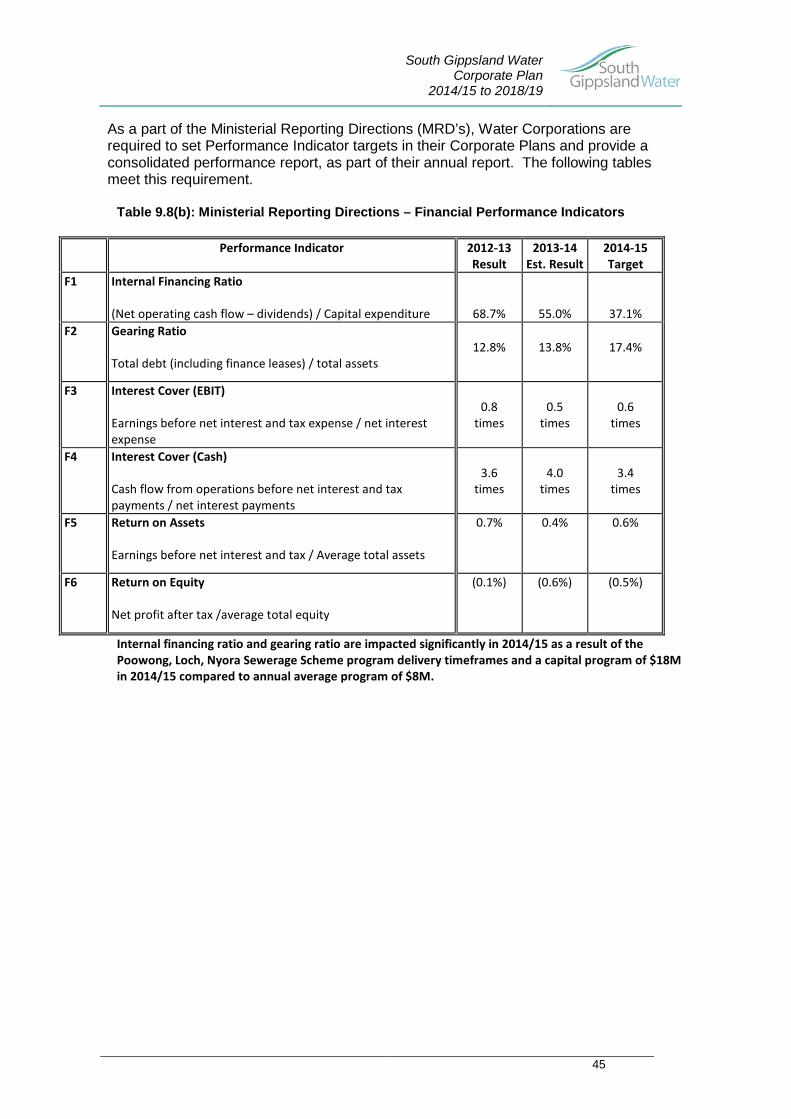
South Gippsland Water Corporate Plan
2014/15 to 2018/19
45
As a part of the Ministerial Reporting Directions (MRD’s), Water Corporations are required to set Performance Indicator targets in their Corporate Plans and provide a consolidated performance report, as part of their annual report. The following tables meet this requirement.
Table 9.8(b): Ministerial Reporting Directions – Financial Performance Indicators
Performance Indicator 2012-13
Result 2013-14
Est. Result 2014-15 Target
F1 Internal Financing Ratio (Net operating cash flow – dividends) / Capital expenditure
68.7%
55.0%
37.1% F2 Gearing Ratio
Total debt (including finance leases) / total assets
12.8%
13.8%
17.4%
F3 Interest Cover (EBIT) Earnings before net interest and tax expense / net interest expense
0.8
times
0.5
times
0.6
times
F4 Interest Cover (Cash) Cash flow from operations before net interest and tax payments / net interest payments
3.6
times
4.0
times
3.4
times
F5 Return on Assets Earnings before net interest and tax / Average total assets
0.7% 0.4% 0.6%
F6 Return on Equity Net profit after tax /average total equity
(0.1%) (0.6%) (0.5%)
Internal financing ratio and gearing ratio are impacted significantly in 2014/15 as a result of the Poowong, Loch, Nyora Sewerage Scheme program delivery timeframes and a capital program of $18M in 2014/15 compared to annual average program of $8M.
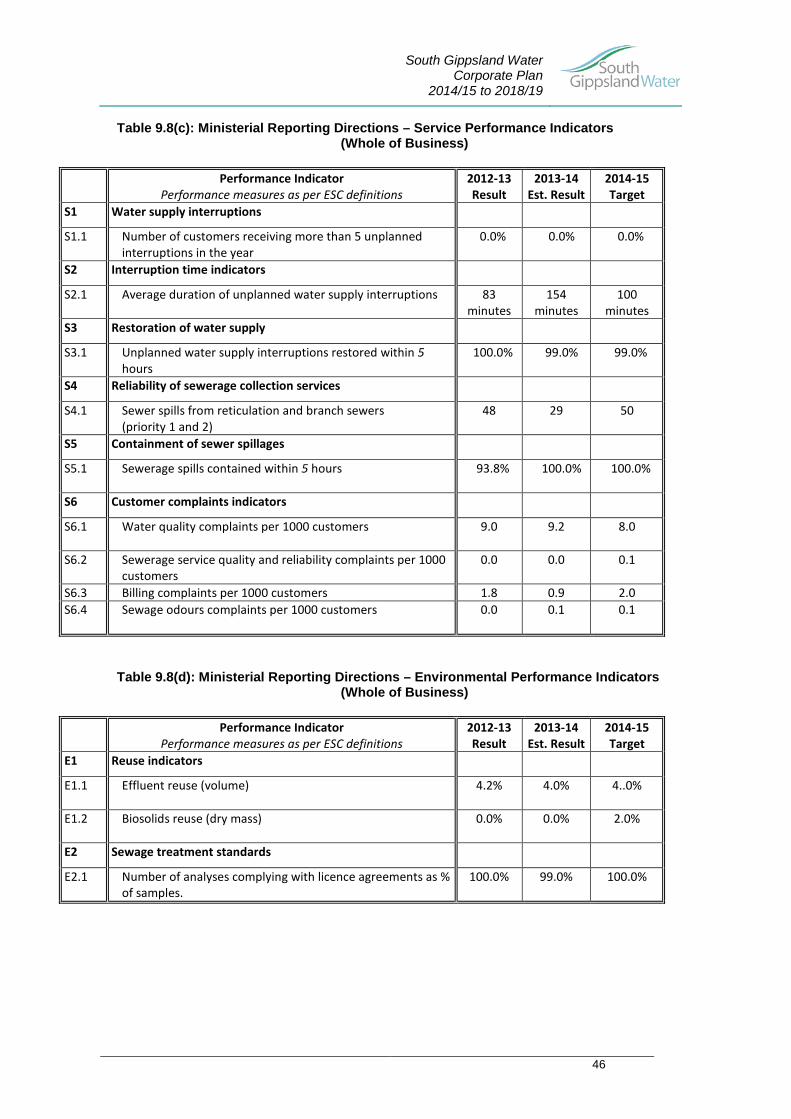
South Gippsland Water Corporate Plan
2014/15 to 2018/19
46
Table 9.8(c): Ministerial Reporting Directions – Service Performance Indicators (Whole of Business)
Performance Indicator
Performance measures as per ESC definitions 2012-13
Result 2013-14
Est. Result 2014-15 Target
S1 Water supply interruptions S1.1 Number of customers receiving more than 5 unplanned
interruptions in the year 0.0% 0.0% 0.0%
S2 Interruption time indicators S2.1 Average duration of unplanned water supply interruptions 83
minutes 154
minutes 100
minutes S3 Restoration of water supply S3.1 Unplanned water supply interruptions restored within 5
hours 100.0% 99.0% 99.0%
S4 Reliability of sewerage collection services S4.1 Sewer spills from reticulation and branch sewers
(priority 1 and 2) 48
29
50
S5 Containment of sewer spillages S5.1 Sewerage spills contained within 5 hours
93.8% 100.0% 100.0%
S6 Customer complaints indicators S6.1 Water quality complaints per 1000 customers 9.0 9.2
8.0
S6.2 Sewerage service quality and reliability complaints per 1000
customers 0.0 0.0 0.1
S6.3 Billing complaints per 1000 customers 1.8 0.9 2.0 S6.4 Sewage odours complaints per 1000 customers
0.0 0.1 0.1
Table 9.8(d): Ministerial Reporting Directions – Environmental Performance Indicators (Whole of Business)
Performance Indicator
Performance measures as per ESC definitions 2012-13
Result 2013-14
Est. Result 2014-15 Target
E1 Reuse indicators E1.1 Effluent reuse (volume)
4.2% 4.0% 4..0%
E1.2 Biosolids reuse (dry mass)
0.0% 0.0% 2.0%
E2 Sewage treatment standards E2.1 Number of analyses complying with licence agreements as %
of samples. 100.0% 99.0% 100.0%
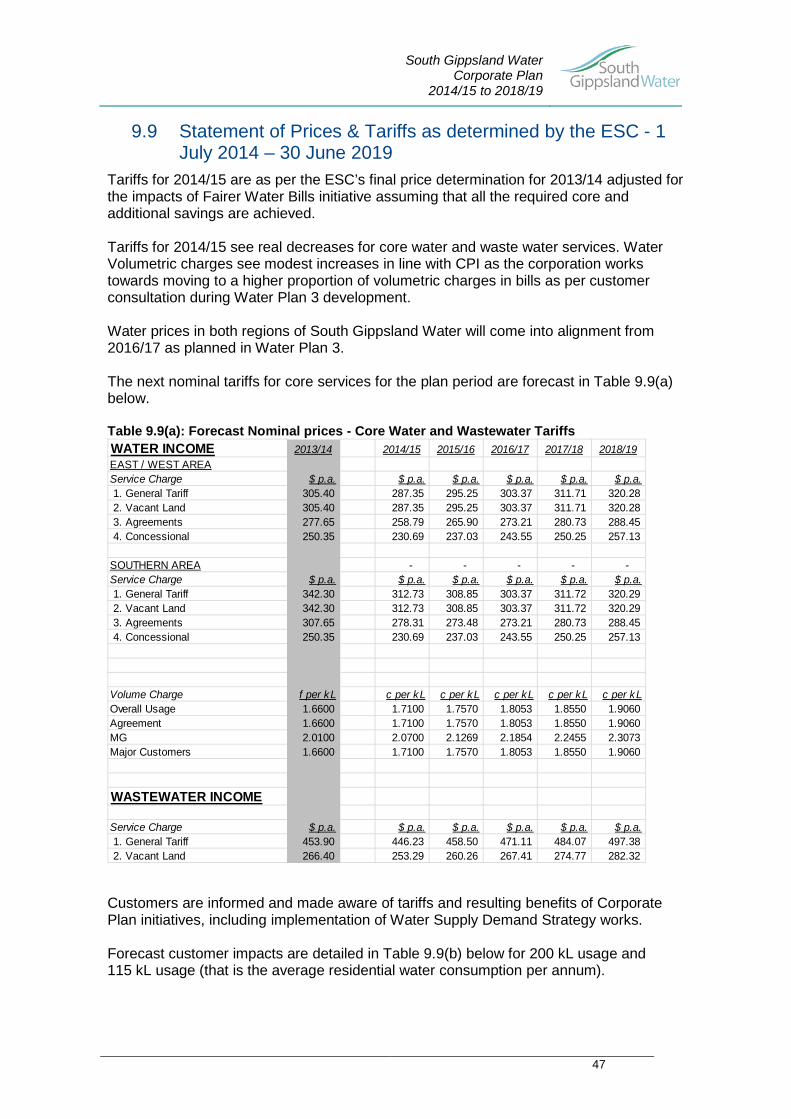
South Gippsland Water Corporate Plan
2014/15 to 2018/19
47
9.9 Statement of Prices & Tariffs as determined by the ESC - 1 July 2014 – 30 June 2019
Tariffs for 2014/15 are as per the ESC’s final price determination for 2013/14 adjusted for the impacts of Fairer Water Bills initiative assuming that all the required core and additional savings are achieved. Tariffs for 2014/15 see real decreases for core water and waste water services. Water Volumetric charges see modest increases in line with CPI as the corporation works towards moving to a higher proportion of volumetric charges in bills as per customer consultation during Water Plan 3 development. Water prices in both regions of South Gippsland Water will come into alignment from 2016/17 as planned in Water Plan 3. The next nominal tariffs for core services for the plan period are forecast in Table 9.9(a) below. Table 9.9(a): Forecast Nominal prices - Core Water and Wastewater Tariffs WATER INCOME 2013/14 2014/15 2015/16 2016/17 2017/18 2018/19EAST / WEST AREAService Charge $ p.a. $ p.a. $ p.a. $ p.a. $ p.a. $ p.a. 1. General Tariff 305.40 287.35 295.25 303.37 311.71 320.28 2. Vacant Land 305.40 287.35 295.25 303.37 311.71 320.28 3. Agreements 277.65 258.79 265.90 273.21 280.73 288.45 4. Concessional 250.35 230.69 237.03 243.55 250.25 257.13
SOUTHERN AREA - - - - - Service Charge $ p.a. $ p.a. $ p.a. $ p.a. $ p.a. $ p.a. 1. General Tariff 342.30 312.73 308.85 303.37 311.72 320.29 2. Vacant Land 342.30 312.73 308.85 303.37 311.72 320.29 3. Agreements 307.65 278.31 273.48 273.21 280.73 288.45 4. Concessional 250.35 230.69 237.03 243.55 250.25 257.13
Volume Charge f per kL c per kL c per kL c per kL c per kL c per kLOverall Usage 1.6600 1.7100 1.7570 1.8053 1.8550 1.9060 Agreement 1.6600 1.7100 1.7570 1.8053 1.8550 1.9060 MG 2.0100 2.0700 2.1269 2.1854 2.2455 2.3073 Major Customers 1.6600 1.7100 1.7570 1.8053 1.8550 1.9060
WASTEWATER INCOME
Service Charge $ p.a. $ p.a. $ p.a. $ p.a. $ p.a. $ p.a. 1. General Tariff 453.90 446.23 458.50 471.11 484.07 497.38 2. Vacant Land 266.40 253.29 260.26 267.41 274.77 282.32 Customers are informed and made aware of tariffs and resulting benefits of Corporate Plan initiatives, including implementation of Water Supply Demand Strategy works. Forecast customer impacts are detailed in Table 9.9(b) below for 200 kL usage and 115 kL usage (that is the average residential water consumption per annum).
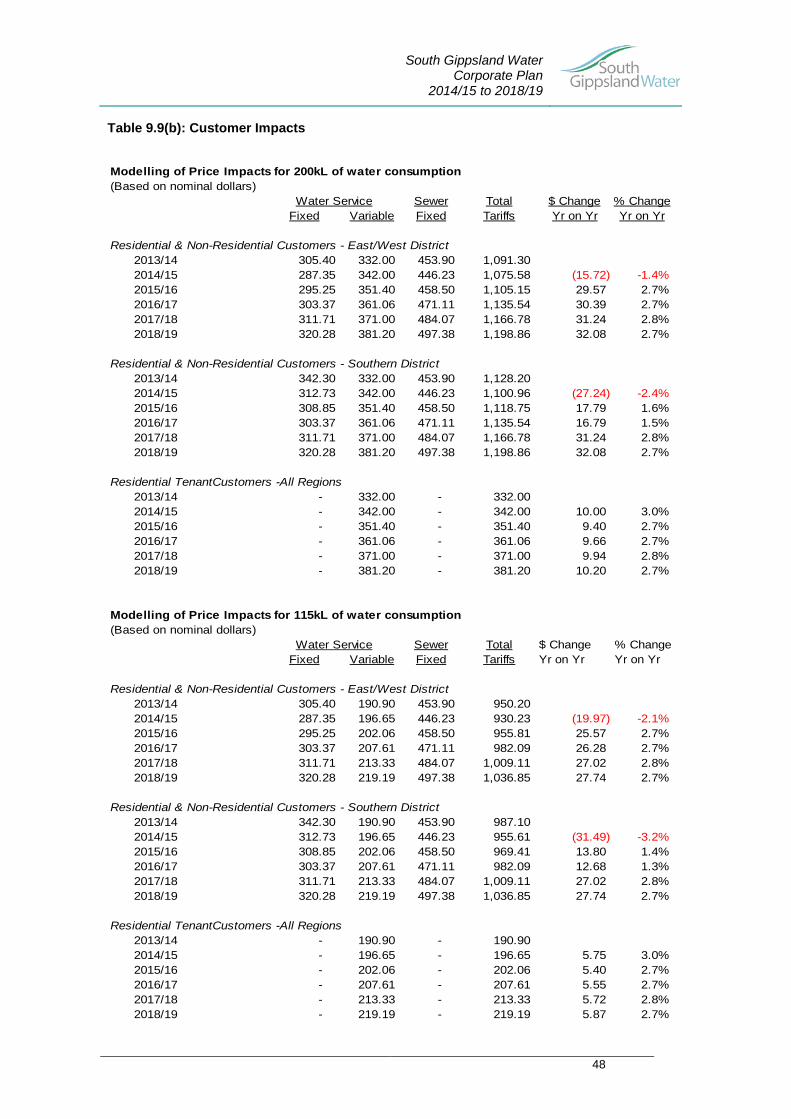
South Gippsland Water Corporate Plan
2014/15 to 2018/19
48
Table 9.9(b): Customer Impacts Modelling of Price Impacts for 200kL of water consumption(Based on nominal dollars)
Sewer Total $ Change % ChangeFixed Variable Fixed Tariffs Yr on Yr Yr on Yr
Residential & Non-Residential Customers - East/West District2013/14 305.40 332.00 453.90 1,091.30 2014/15 287.35 342.00 446.23 1,075.58 (15.72) -1.4%2015/16 295.25 351.40 458.50 1,105.15 29.57 2.7%2016/17 303.37 361.06 471.11 1,135.54 30.39 2.7%2017/18 311.71 371.00 484.07 1,166.78 31.24 2.8%2018/19 320.28 381.20 497.38 1,198.86 32.08 2.7%
Residential & Non-Residential Customers - Southern District2013/14 342.30 332.00 453.90 1,128.20 2014/15 312.73 342.00 446.23 1,100.96 (27.24) -2.4%2015/16 308.85 351.40 458.50 1,118.75 17.79 1.6%2016/17 303.37 361.06 471.11 1,135.54 16.79 1.5%2017/18 311.71 371.00 484.07 1,166.78 31.24 2.8%2018/19 320.28 381.20 497.38 1,198.86 32.08 2.7%
Residential TenantCustomers -All Regions2013/14 - 332.00 - 332.00 2014/15 - 342.00 - 342.00 10.00 3.0%2015/16 - 351.40 - 351.40 9.40 2.7%2016/17 - 361.06 - 361.06 9.66 2.7%2017/18 - 371.00 - 371.00 9.94 2.8%2018/19 - 381.20 - 381.20 10.20 2.7%
Modelling of Price Impacts for 115kL of water consumption(Based on nominal dollars)
Sewer Total $ Change % ChangeFixed Variable Fixed Tariffs Yr on Yr Yr on Yr
Residential & Non-Residential Customers - East/West District2013/14 305.40 190.90 453.90 950.20 2014/15 287.35 196.65 446.23 930.23 (19.97) -2.1%2015/16 295.25 202.06 458.50 955.81 25.57 2.7%2016/17 303.37 207.61 471.11 982.09 26.28 2.7%2017/18 311.71 213.33 484.07 1,009.11 27.02 2.8%2018/19 320.28 219.19 497.38 1,036.85 27.74 2.7%
Residential & Non-Residential Customers - Southern District2013/14 342.30 190.90 453.90 987.10 2014/15 312.73 196.65 446.23 955.61 (31.49) -3.2%2015/16 308.85 202.06 458.50 969.41 13.80 1.4%2016/17 303.37 207.61 471.11 982.09 12.68 1.3%2017/18 311.71 213.33 484.07 1,009.11 27.02 2.8%2018/19 320.28 219.19 497.38 1,036.85 27.74 2.7%
Residential TenantCustomers -All Regions2013/14 - 190.90 - 190.90 2014/15 - 196.65 - 196.65 5.75 3.0%2015/16 - 202.06 - 202.06 5.40 2.7%2016/17 - 207.61 - 207.61 5.55 2.7%2017/18 - 213.33 - 213.33 5.72 2.8%2018/19 - 219.19 - 219.19 5.87 2.7%
Water Service
Water Service
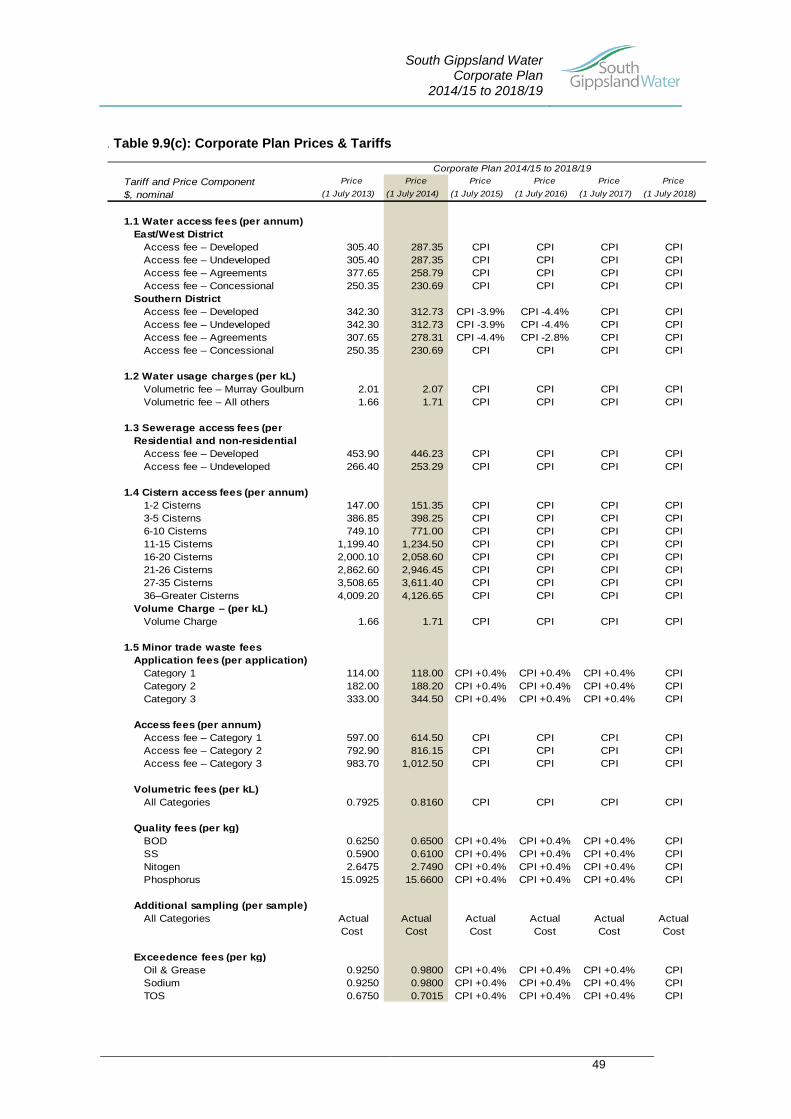
South Gippsland Water Corporate Plan
2014/15 to 2018/19
49
. Table 9.9(c): Corporate Plan Prices & Tariffs
Tariff and Price Component Price Price Price Price Price Price
$, nominal (1 July 2013) (1 July 2014) (1 July 2015) (1 July 2016) (1 July 2017) (1 July 2018)
1.1 Water access fees (per annum) East/West District
Access fee – Developed 305.40 287.35 CPI CPI CPI CPIAccess fee – Undeveloped 305.40 287.35 CPI CPI CPI CPIAccess fee – Agreements 377.65 258.79 CPI CPI CPI CPIAccess fee – Concessional 250.35 230.69 CPI CPI CPI CPI
Southern DistrictAccess fee – Developed 342.30 312.73 CPI -3.9% CPI -4.4% CPI CPIAccess fee – Undeveloped 342.30 312.73 CPI -3.9% CPI -4.4% CPI CPIAccess fee – Agreements 307.65 278.31 CPI -4.4% CPI -2.8% CPI CPIAccess fee – Concessional 250.35 230.69 CPI CPI CPI CPI
1.2 Water usage charges (per kL)Volumetric fee – Murray Goulburn 2.01 2.07 CPI CPI CPI CPIVolumetric fee – All others 1.66 1.71 CPI CPI CPI CPI
1.3 Sewerage access fees (per Residential and non-residential
Access fee – Developed 453.90 446.23 CPI CPI CPI CPIAccess fee – Undeveloped 266.40 253.29 CPI CPI CPI CPI
1.4 Cistern access fees (per annum)1-2 Cisterns 147.00 151.35 CPI CPI CPI CPI3-5 Cisterns 386.85 398.25 CPI CPI CPI CPI6-10 Cisterns 749.10 771.00 CPI CPI CPI CPI11-15 Cisterns 1,199.40 1,234.50 CPI CPI CPI CPI16-20 Cisterns 2,000.10 2,058.60 CPI CPI CPI CPI21-26 Cisterns 2,862.60 2,946.45 CPI CPI CPI CPI27-35 Cisterns 3,508.65 3,611.40 CPI CPI CPI CPI36–Greater Cisterns 4,009.20 4,126.65 CPI CPI CPI CPI
Volume Charge – (per kL)Volume Charge 1.66 1.71 CPI CPI CPI CPI
1.5 Minor trade waste feesApplication fees (per application)
Category 1 114.00 118.00 CPI +0.4% CPI +0.4% CPI +0.4% CPICategory 2 182.00 188.20 CPI +0.4% CPI +0.4% CPI +0.4% CPICategory 3 333.00 344.50 CPI +0.4% CPI +0.4% CPI +0.4% CPI
Access fees (per annum)Access fee – Category 1 597.00 614.50 CPI CPI CPI CPIAccess fee – Category 2 792.90 816.15 CPI CPI CPI CPIAccess fee – Category 3 983.70 1,012.50 CPI CPI CPI CPI
Volumetric fees (per kL)All Categories 0.7925 0.8160 CPI CPI CPI CPI
Quality fees (per kg)BOD 0.6250 0.6500 CPI +0.4% CPI +0.4% CPI +0.4% CPISS 0.5900 0.6100 CPI +0.4% CPI +0.4% CPI +0.4% CPINitogen 2.6475 2.7490 CPI +0.4% CPI +0.4% CPI +0.4% CPIPhosphorus 15.0925 15.6600 CPI +0.4% CPI +0.4% CPI +0.4% CPI
Additional sampling (per sample)All Categories Actual
Cost ActualCost
ActualCost
ActualCost
ActualCost
ActualCost
Exceedence fees (per kg)Oil & Grease 0.9250 0.9800 CPI +0.4% CPI +0.4% CPI +0.4% CPISodium 0.9250 0.9800 CPI +0.4% CPI +0.4% CPI +0.4% CPITOS 0.6750 0.7015 CPI +0.4% CPI +0.4% CPI +0.4% CPI
Corporate Plan 2014/15 to 2018/19
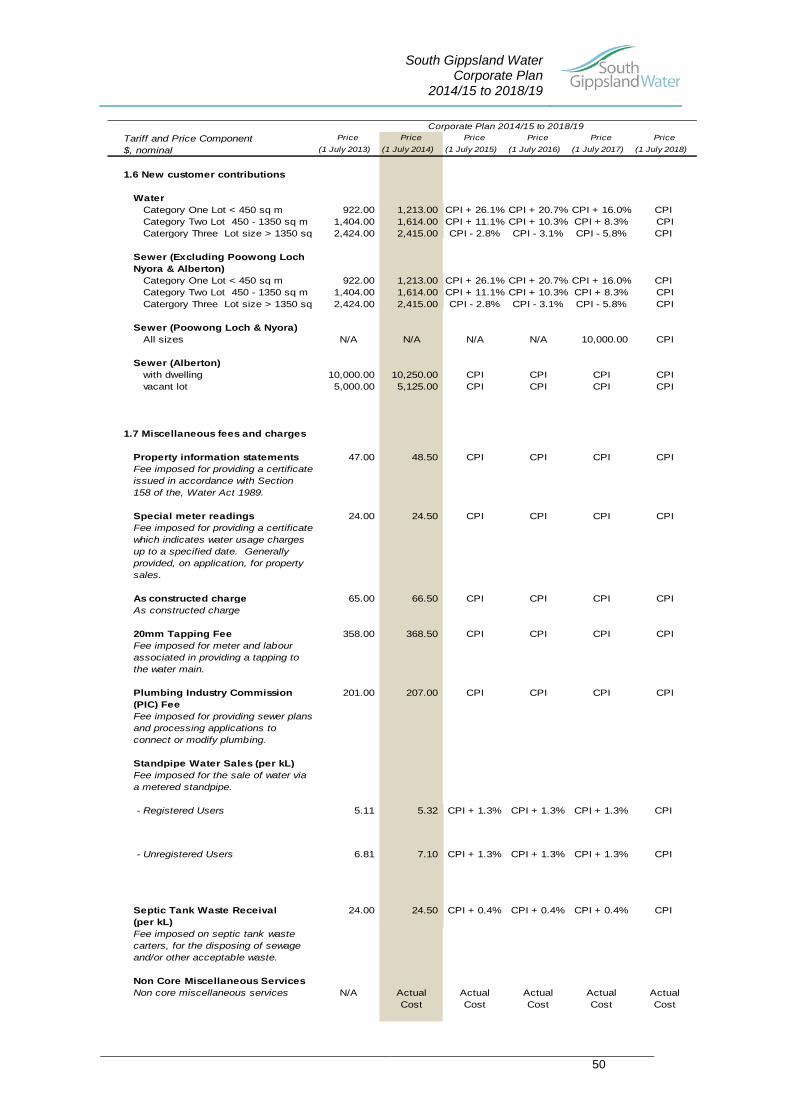
South Gippsland Water Corporate Plan
2014/15 to 2018/19
50
Tariff and Price Component Price Price Price Price Price Price
$, nominal (1 July 2013) (1 July 2014) (1 July 2015) (1 July 2016) (1 July 2017) (1 July 2018)
1.6 New customer contributions
WaterCategory One Lot < 450 sq m 922.00 1,213.00 CPI + 26.1% CPI + 20.7% CPI + 16.0% CPI Category Two Lot 450 - 1350 sq m 1,404.00 1,614.00 CPI + 11.1% CPI + 10.3% CPI + 8.3% CPICatergory Three Lot size > 1350 sq 2,424.00 2,415.00 CPI - 2.8% CPI - 3.1% CPI - 5.8% CPI
Sewer (Excluding Poowong Loch Nyora & Alberton)
Category One Lot < 450 sq m 922.00 1,213.00 CPI + 26.1% CPI + 20.7% CPI + 16.0% CPI Category Two Lot 450 - 1350 sq m 1,404.00 1,614.00 CPI + 11.1% CPI + 10.3% CPI + 8.3% CPICatergory Three Lot size > 1350 sq 2,424.00 2,415.00 CPI - 2.8% CPI - 3.1% CPI - 5.8% CPI
Sewer (Poowong Loch & Nyora)All sizes N/A N/A N/A N/A 10,000.00 CPI
Sewer (Alberton)with dwelling 10,000.00 10,250.00 CPI CPI CPI CPIvacant lot 5,000.00 5,125.00 CPI CPI CPI CPI
1.7 Miscellaneous fees and charges
Property information statements 47.00 48.50 CPI CPI CPI CPI
Special meter readings 24.00 24.50 CPI CPI CPI CPIFee imposed for providing a certificate which indicates water usage charges up to a specified date. Generally provided, on application, for property sales.
As constructed charge 65.00 66.50 CPI CPI CPI CPIAs constructed charge
20mm Tapping Fee 358.00 368.50 CPI CPI CPI CPIFee imposed for meter and labour associated in providing a tapping to the water main.
Plumbing Industry Commission (PIC) Fee
201.00 207.00 CPI CPI CPI CPI
Fee imposed for providing sewer plans and processing applications to connect or modify plumbing.
Standpipe Water Sales (per kL)Fee imposed for the sale of water via a metered standpipe.
- Registered Users 5.11 5.32 CPI + 1.3% CPI + 1.3% CPI + 1.3% CPI
- Unregistered Users 6.81 7.10 CPI + 1.3% CPI + 1.3% CPI + 1.3% CPI
Septic Tank Waste Receival(per kL)
24.00 24.50 CPI + 0.4% CPI + 0.4% CPI + 0.4% CPI
Fee imposed on septic tank waste carters, for the disposing of sewage and/or other acceptable waste.
Non Core Miscellaneous ServicesNon core miscellaneous services N/A Actual
CostActualCost
ActualCost
ActualCost
ActualCost
Fee imposed for providing a certificate issued in accordance with Section 158 of the, Water Act 1989.
Corporate Plan 2014/15 to 2018/19