Embed Size (px)
Citation preview

Corporate Governance Review 2018
72% declare full compliance, but only 27% give good insight into how the principles are applied
One in five provide extra gender diversity detail, up from last year
Just 6% give useful insight into development of executive pipeline and their succession planning
The average annual report reaches 172 pages; the front end increased over 10 years by some 28,000 words or 2.3 hours of additional reading time
The quality of culture reporting falls – just 33% of companies providing real insight
53% fail to showcase their resilience against key risk scenarios in their viability statement
Just 14% disclose non-financial metrics in performance share plans
Just 31% of companies provide strong accounts of shareholder engagement
2018 highlights
72%
172
1 in 5
6%
33%
53%
14%31%
Technology-related risks rise by 20% - over half the companies that cite them do not disclose board technology expertise
20%
41% provide good insight into how their board, committees and directors are annually evaluated
41%
Corporate Governance Review 2018
Section Page
The regulator’s perspective 02
Executive summary 03
The strategic report 08
Culture 22
Stakeholder engagement 26
Governance 32
Nomination committee 40
Audit committee 44
Remuneration committee 47
Navigating the new Code: better steps to governance 54
Recent and forthcoming developments 58
The Grant Thornton Governance Institute 62
About Grant Thornton 64
Contents
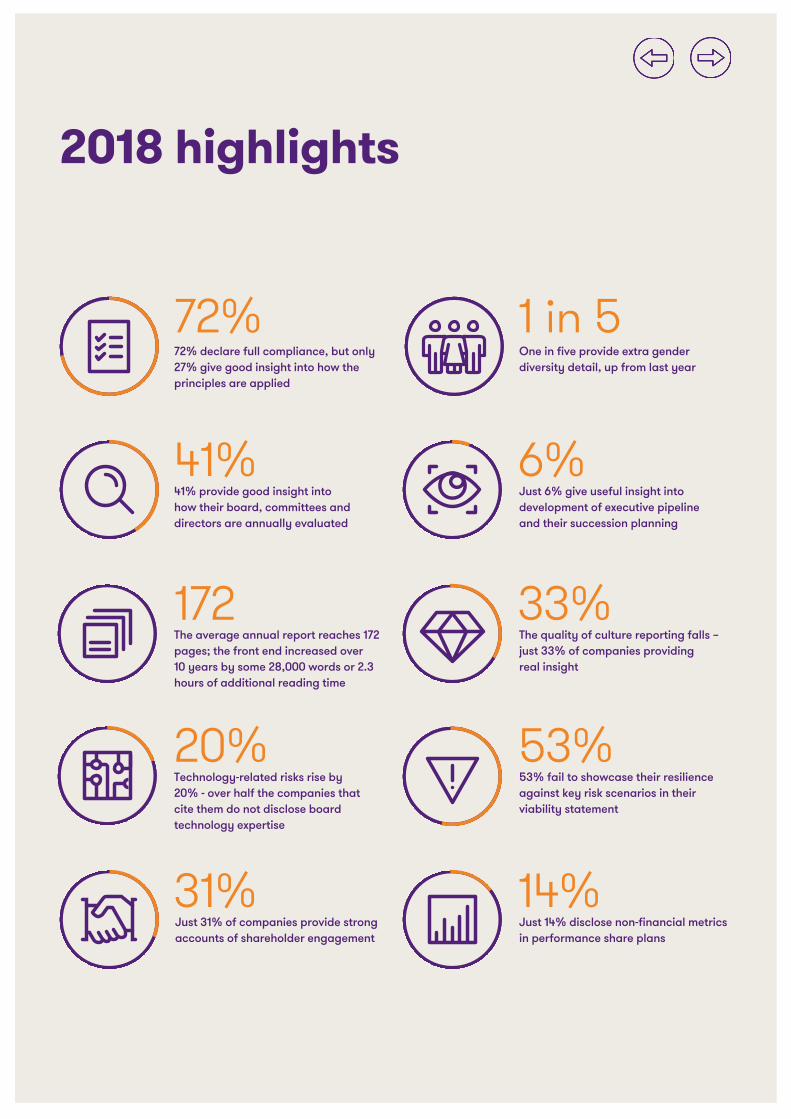
MethodologyThis review, now in its 17th year, comprises a comprehensive analysis of the annual reports of the companies in the FTSE 350.
It assesses compliance with: • the disclosure requirements of the UK Corporate
Governance Code 2016• the narrative reporting requirements set out in S414c of
the Companies Act 2006, as amended.
As well as assessing compliance with the Code, the review considers the quality and detail of explanations and draws attention to best practice and emerging trends in narrative reporting.
This year’s review covers 297 FTSE 350 companies (as of March 2018) with years ending between April 2017 and April 2018. Our analysis excludes investment trusts, as they are able to follow the AIC Code of Corporate Governance. The 2018 review therefore covers 99 from the FTSE 100 and 198 from the FTSE 250. Where we compare to previous years’ data, in 2017, our FTSE 350 sample included 305 companies – 99 from the FTSE 100 and 206 from the FTSE 250; in 2016, our FTSE 350 sample included 308 companies – 100 from the FTSE 100 and 208 from the FTSE 250; in 2015, it included 312 companies – 100 from the FTSE 100 and 212 from the FTSE 250.
Key findings are discussed in the body of the report. Full details of the questions can be provided on request from Alex Worters ([email protected]).
Simon Lowe would like to thank: Jide Ajomale, Rotimi Akinfenwa, Bhavi Joshi, Yaryna Kobel, Nash Matinyarare, Abigail Palmer, Navita Thomas and Alex Worters from Grant Thornton, Rebecca Dowman from Content Consulting, and Scarlett Brown from Tomorrow’s Company, for their work in preparing this report.
ViewpointsSimon would also like to give special thanks to Jessica Ground, Global Head of Stewardship at Schroders and Amanda Mellor, Group Secretary and Head of Corporate Governance at Marks and Spencer plc, for providing their viewpoints for this year’s review.
2 Corporate Governance Review 2018
The regulator’s perspective
Sir Win Bischoff, Chair, Financial Reporting Council
The FRC published a new UK Corporate Governance Code (the new Code) in July, which will take effect from 1 January 2019. The new Code has substantially evolved and builds on the progress the FRC has made to improve the quality of governance in the UK.
Grant Thornton’s review covers reporting against the 2016 Code, but it is clear some companies are already responding to several of the issues highlighted in the new Code, for example constructive relations with a wider range of stakeholders.
We agree with their overall conclusion that the findings are both “frustrating and encouraging”. We are pleased that the number and quality of introductions from the nomination committee has increased as the new Code gives the nomination committee a greater role in terms of board composition and succession planning. But it is disappointing that good quality reporting on culture has declined sharply. Building on our work in 2016, culture is now embedded within the new Code and greater priority should be given in future with detailed commentary to match.
The new Code has refocused attention on the need to report on the application of the Principles in a manner that can be evaluated. Grant Thornton found that currently only 27% of companies give detailed insights into how these are applied, so there is much to do to ensure improvements next year. Companies should cover the application of the Principles in the context of their particular circumstances and show how the board has set the company’s purpose and strategy, met its objectives and achieved the desired outcomes.
The effective application of the Principles should be supported by high quality reporting on the more detailed Provisions by signposting and cross-referencing to other relevant parts of the annual report to enable readers to obtain a full picture of governance.
While this report found that declared compliance with the Code is at an all-time high, explanations should be viewed as a positive opportunity to communicate. We remain concerned that in some cases a ‘tick-box’ approach to compliance is being used. ‘Comply or explain’ offers companies flexibility to present their individual approach and an explanation may be both justified and beneficial. We welcome high-quality explanations against the new Code where this improves levels of transparency and reporting on company practices.
It is concerning, therefore, that good or detailed accounts of shareholder engagement has declined for the fourth consecutive year. We are undertaking a significant review of the UK Stewardship Code, which will be consulted upon later this year, and expect that review to have a positive impact on engagement.
The FRC continues to be grateful to Grant Thornton for its ongoing corporate governance research and we look forward to seeing next year’s analysis, in the expectation that it will demonstrate real change in the way companies report their corporate governance.
We welcome Grant Thornton’s latest annual report into FTSE 350 corporate governance reporting, which comes at a time of significant change.
Corporate Governance Review 2018 3
The UK is witnessing a battle to restore trust in business – after a succession of corporate collapses, governance failings and controversial pay awards have hit the headlines.
Executive summary: governance takes centre stage
1 The Financial Aspects of Corporate Governance, The Committee on the Financial Aspects of Good Governance, 1992 (www.ecgi.org/codes/documents/cadbury.pdf).2 Guidance on the Strategic Report, FRC, July 2018 (www.frc.org.uk/getattachment/fb05dd7b-c76c-424e-9daf-4293c9fa2d6a/Guidance-on-the-Strategic-Report-31-7-18.pdf).3 Companies (Miscellaneous Reporting) Regulations 2018 (www.legislation.gov.uk/uksi/2018/860/contents/made).4 The UK Corporate Governance Code, FRC, July 2018 (https://www.frc.org.uk/getattachment/88bd8c45-50ea-4841-95b0-d2f4f48069a2/2018-UK-Corporate-Governance-Code-FINAL.PDF).
Simon Lowe, Chair, the Grant Thornton Governance Institute
As a result, governance is again in the spotlight, more so than at any time since the ‘Maxwell years’ which immediately preceded the 1992 Cadbury report1.
Given this climate, companies are facing a series of government and regulatory initiatives. Businesses have already had to grapple with the reporting requirements of the EU non-financial reporting directive, the new Guidance on the Strategic Report2, and the Companies (Miscellaneous Reporting) Regulations 20183.
And in July, the Financial Reporting Council (FRC) published its new ‘shorter, sharper’ UK Corporate Governance Code4 which, among other things:• emphasises better – rather than more – disclosure, focusing
on how companies apply its main principles• has fewer provisions• recognises the shared interests of boards, shareholders and
wider stakeholders.
Some companies have already started to address issues raised by the new Code, which takes effect from 1 January 2019 but others appear to have pressed the pause button.
All these developments – along with other, wider considerations – have influenced this 2018 corporate governance review, and its coverage of several new areas.
KEY FINDINGS
4 Corporate Governance Review 2018
ComplianceMore companies now comply with the 2016 Code. Seventy-two per cent of the FTSE 350 declare full compliance – a new high. Surprisingly, this compliance drive is spearheaded not by the FTSE 100 but by the FTSE 250. The improvement is likely to reflect the heightened discussion on governance and the ongoing consultations that have shaped the new Code.
But going forward, strict compliance will not be enough. In its new Code, the FRC moves beyond the traditional bedrock of ‘comply and explain’, focusing more widely on how companies apply the Code’s main principles. The listing rules require companies to include a statement about how they have applied these principles – a fact often overlooked: only 63% of the FTSE 350 provide some sort of statement, and only 27% discuss the application of the principles in a meaningful way.
Companies will now need to step up and give fuller, more informative disclosures about how they apply the principles.
Burgeoning paginationProviding such fuller disclosures is likely to mean that annual reports will continue to grow. In the 10 years that this review has tracked pagination, the average set of accounts has grown from 121 pages to 172, with the front end expanding by 64%. This growth could reflect the goal of greater transparency, but our research shows little correlation between the number of pages and the quality of disclosures. This suggests that longer reports do not lead inevitably to greater insight.
The mass of information in the front end represents, based on a word count of a sample of 150 companies over two years, an average of 74,000 words. With an increase of 64%, this suggests the front end has added 28,000 words over the last 10 years or 2.3 extra hours of reading. As the accuracy and reliability of the front end is only covered by the general obligation on directors, with limited input from auditors, to be fair, balanced and understandable, the scope for misinterpretation is growing.
A few companies have had success in reducing page numbers, either by wholesale rewrites or in one case by using no images. However, the main response to changes in the Code, and its associated guidance, over many years, has been to provide more, not necessarily better, reporting.
With the risk that the new Code could perpetuate this problem, boards need to stand back, challenge current reporting and commit their companies to a new narrative approach.
There is now an opportunity for a fundamental shift in the way companies report and communicate with their stakeholders. How many will seize the chance?
Risk reportingRisk reporting has been one of the present Code’s successes, with 81% of companies now providing high-quality risk disclosures. There has also been a growing attempt to link risks back to company strategies, so providing a barometer of trends and management concerns. But there is work to do: only 10% of the FTSE 350 give detailed explanations compared to 75% that provide some linkage.
The picture for macroeconomic risks changed surprisingly in 2018, with a fall of almost 30% in those citing Brexit. Despite widespread concern about the subject – including the FRC’s own emphasis on recognising and preparing for risks of the UK’s European withdrawal – only one-fifth of companies that disclose different macroeconomic and political risks mention Brexit as a separate key threat.
Reporting of technology-related risks increased by 20% this year. That said, more than half of the companies that cite such risks do not disclose having technology expertise on their board. Of particular concern are the consumer goods and financial services sectors, where there is a notable discrepancy between the high extent of perceived technological risks and the apparently low level of tech expertise represented on their boards.
The problem is accentuated in financial services, where there is a new regulatory requirement for board members to have deep sector experience. With the average age of non-executive directors being 61, it will be some time before many candidates have both strong IT skills and appropriate sector knowledge. Alternative strategies are being trialled – such as the creation of advisory boards consisting of Silicon Valley alumni and the appointment of board consultants to challenge thinking – yet the barriers to bringing tech skillsets onto boards will not disappear overnight.
Despite its significance, worryingly, this scarcity of tech expertise on boards is rarely acknowledged in annual reports.
This year our research delivers both frustrating and encouraging findings.
Corporate Governance Review 2018 5
DiversityThis year’s diversity findings are encouraging. The focus on gender diversity has increased, after apparently diminishing in 2017 – perhaps due to the impact of the Hampton-Alexander review reports5. One in five companies now offer extra detail on their gender diversity policy, up from last year but still lower than the 2015 high.
FTSE 100 companies still lead the way, reflecting the much higher focus that their size and prominence allow. The uneven progress of the past few years suggests that companies turn their attention away from diversity when the spotlight shifts. Increased investor pressure may be necessary to bring about permanent change.
Succession planningSuccession planning remains an area of concern, with very few companies providing good or detailed insight into its execution at board level. Just one in four give any insight into senior management succession planning.
The new Code requires the nomination committee to identify future skill needs, introduce greater diversity and develop future leaders several layers below the board; our results suggest such challenges should be pressing items for the next agenda.
CultureCorporate culture – and the role of boards in articulating and embedding that culture – has been a significant FRC focus in recent years, as reflected in the new Code. But the number of FTSE 350 companies providing strong accounts of company culture fell sharply this year, and less than a third of CEOs and fewer than six out of 10 chairs discuss their desired culture at all.
These disappointing results suggest that previous commitments to cultural change have not been heartfelt. To make real change – and to embed it throughout an organisation and enable it to be measured – will require stronger, vocal and ongoing commitment from the top.
5 Hampton-Alexander Review: FTSE Women Leaders – Improving gender balance in FTSE leadership: 2017 review, FTSE Women Leaders (https://assets.publishing.service.gov.uk/government/uploads/system/uploads/attachment_data/file/658126/Hampton_Alexander_Review_report_FINAL_8.11.17.pdf) and Hampton-Alexander Review: FTSE Women Leaders – initial report 2016, (https://assets.publishing.service.gov.uk/government/uploads/system/uploads/attachment_data/file/613085/ftse-women-leaders-hampton-alexander-review.pdf).
6 Corporate Governance Review 2018
ViabilityViability reporting has been in the regulator’s spotlight since the collapse of construction and facilities management firm, Carillion, in January 2018. Despite the 20146 requirement for boards to look beyond the statutory 12-month going concern period when considering their financial resilience, we have seen no improvement in the quality of viability reporting. While all but two companies make a viability statement, just over half (53%) give little or no insight into their viability in the face of key strategic risks.
The Financial Reporting Lab project on risk and viability reporting, published in late 2017, may influence next year’s reports. Construction and support services companies have been made aware that this issue will be on the FRC’s agenda when reviewing the accounts. However, until investors and banks start to use viability statement disclosure as a rich source of information when assessing a company’s robustness, other sectors are unlikely to move beyond boilerplate text.
RemunerationThe new Code clarifies the position on phased awards and total vesting and holding periods. In line with the government’s initiative to provide greater linkage and accountability between board pay and company performance, total vesting and holding periods of five years or more will apply to share awards granted to executives. In any case, the average combined vesting and holding period is now five years, which means the new guidance will have no real impact on better aligning the interests of businesses and directors in the FTSE 350.
Companies’ choice of performance conditions is perhaps of more concern, with most still only using financial metrics. In light of the strong new Code emphasis for directors to consider their wider stakeholder responsibilities under section 172 of the Companies Act7, this is a significant omission; focusing on financial metrics alone means that remuneration is not aligned to long-term sustainable success.
Just 14% of the FTSE 350 disclose non-financial metrics in their long-term incentive plans (LTIPs) yet, on average, companies have five financial and 4.5 non-financial KPIs; this suggests a disconnect between what companies say they value and how they measure performance.
The requirement for the naming of remuneration consultants reveals cause for concern. Disclosures show that two Big 4 audit firms act as consultants to 42% of the FTSE 350. The combination of these firms’ domination of the FTSE 350 audit arena, the current flurry of auditor re-tendering and resultant rate of churn, and the length of period that remuneration policies and incentive packages typically cover, suggests that the potential for conflicts will continue to grow, limiting auditor choice even further.
Engagement The regulator continues to emphasise the need for shareholder engagement, yet disclosures suggest a continuing decline. Less than one-third (31%) of the FTSE 350 give good or detailed accounts of their shareholder engagement, down for the fourth consecutive year. With the FRC reviewing the Stewardship Code this year, this area should be on companies’ radar.
A fresh look at governance
The new Code should encourage boards to reassess their governance practices. Indeed, a few companies are already applying practices recommended by the new Code, while remaining bound by listing rules to report under the 2016 Code until 2020. Others appear to have pressed the pause button until they see how first adopters respond. Companies need to start remodelling their annual reports now in order to avoid becoming non-compliant in the future.
6 The UK Corporate Governance Code, FRC, September 2014 (www.frc.org.uk/getattachment/59a5171d-4163-4fb2-9e9d-daefcd7153b5/UK-Corporate-Governance-Code-2014.pdf).7 Section 414CZA of the Companies Act 2006. This requirement is applicable for financial years beginning on or after 1 January 2019.
KEY FINDINGS

Corporate Governance Review 2018 7
8 Corporate Governance Review 2018
The strategic report
Front-end growth slows“The annual report is a medium of communication between the company’s directors and its shareholders… In general, information should only be placed in the annual report when it is relevant to shareholders.”
(FRC Guidance on the Strategic Report, 3.13)
Stakeholders and society expect ever more of business, putting pressure on companies to find better ways of communicating their key messages. Every year organisations try to make their annual reports easier to read and navigate, with recent innovations ranging from personalised formats to infographics. This bid to increase accessibility by adding new features may have influenced the continuing growth in the length of annual reports.
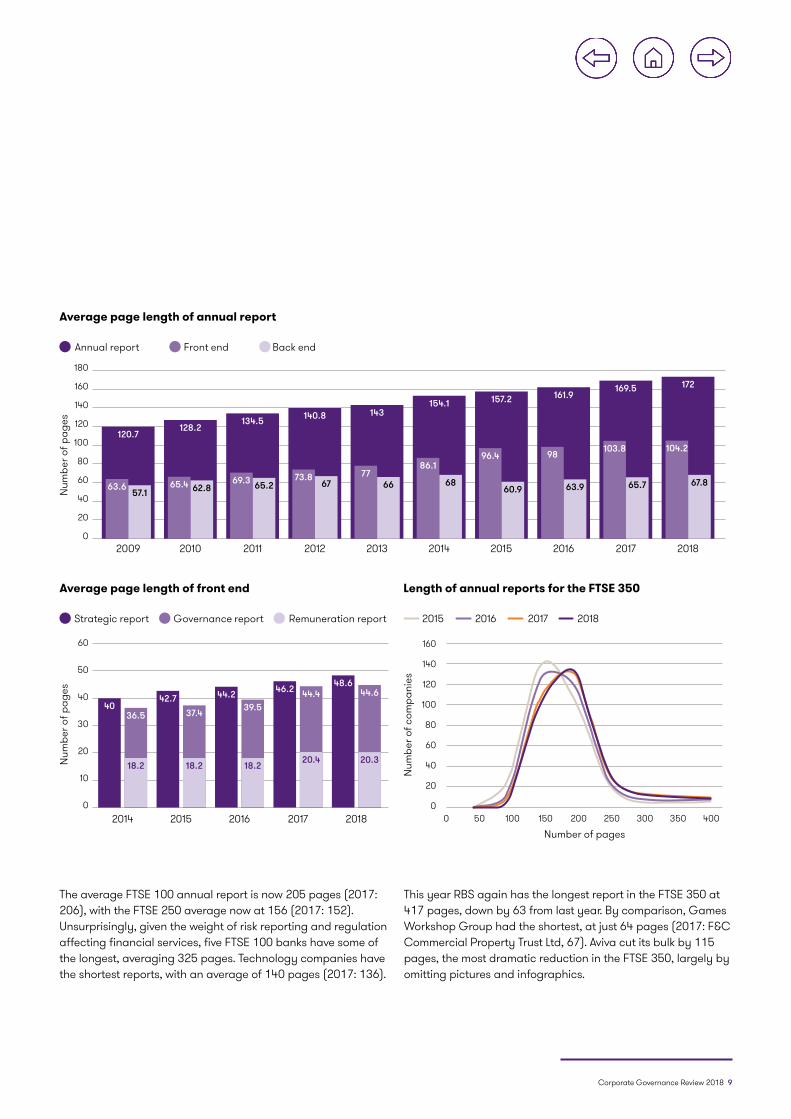
In the past decade, report lengths have grown consistently, with the average now stretching to 172 pages. While both the front-end narrative and the financial statements have grown, the front-end increase is much more noticeable – up by almost two-thirds (64%) over 10 years. In comparison, the financial section, which made up just under half of the average annual report in 2009, has grown by only 19%.
A word search of 150 of these accounts for two consecutive years suggests that the average front end now consists of some 74000 words - an increase of some 28,000 or two hours and 20 minutes of reading.
During this same period, the only real innovation to guard against the provision of misleading or rose-tinted information was the introduction of the requirement for a positive affirmation by the Directors that the information is “fair, balanced and understandable” (see more on page 20).
We have seen some examples of companies looking to innovate in the way they present information but in the main, companies seem to have held back on introducing major change, while awaiting clarity on the final reforms that the new Code would bring.
FAST FACTS
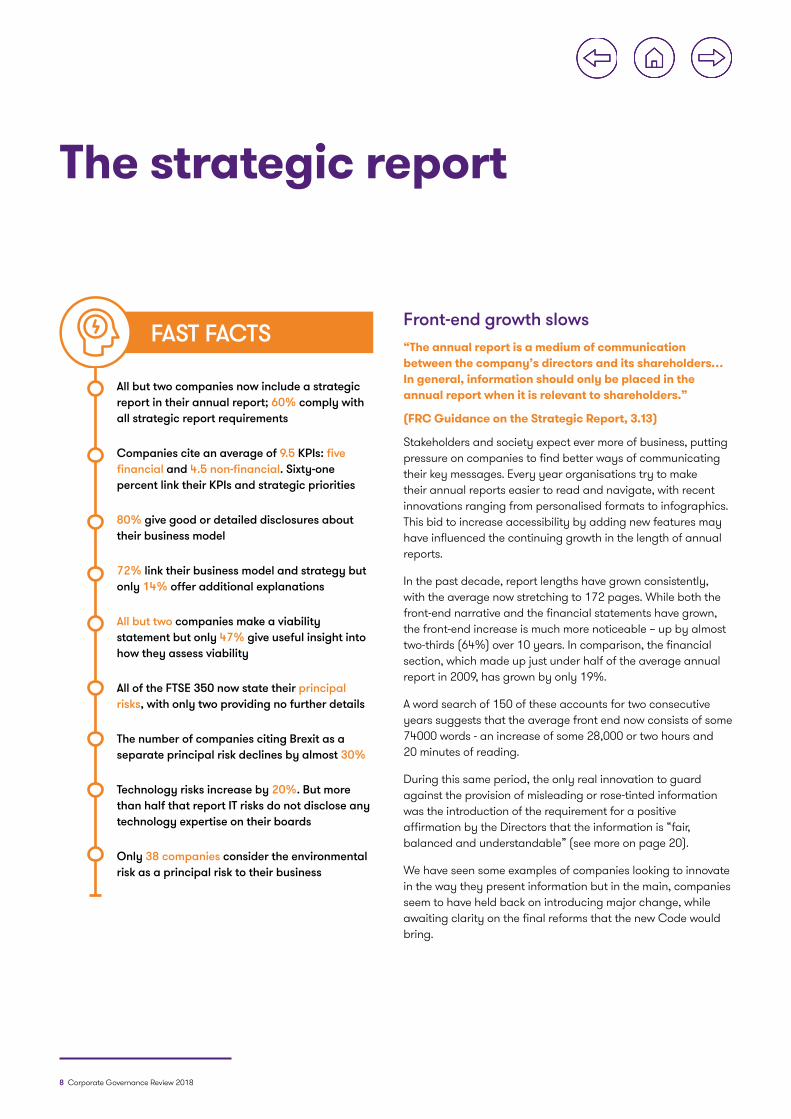
All but two companies now include a strategic report in their annual report; 60% comply with all strategic report requirements
Companies cite an average of 9.5 KPIs: five financial and 4.5 non-financial. Sixty-one percent link their KPIs and strategic priorities
80% give good or detailed disclosures about their business model
72% link their business model and strategy but only 14% offer additional explanations
All but two companies make a viability statement but only 47% give useful insight into how they assess viability
All of the FTSE 350 now state their principal risks, with only two providing no further details
The number of companies citing Brexit as a separate principal risk declines by almost 30%
Technology risks increase by 20%. But more than half that report IT risks do not disclose any technology expertise on their boards
Only 38 companies consider the environmental risk as a principal risk to their business
Corporate Governance Review 2018 9
Average page length of annual report
180
160
140
120
100
80
60
40
20
0
120.7128.2
134.5 140.8 143154.1 157.2 161.9
169.5 172
63.6 65.4 69.3 73.8 7786.1
96.4 98 103.8 104.2
57.1 62.8 65.2 67 66 6860.9 63.9 65.7 67.8
2009 2010 2011 2012 2013 2014 2015 2016 2017 2018
Annual report Front end Back end
Num
ber o
f pag
es
The average FTSE 100 annual report is now 205 pages (2017: 206), with the FTSE 250 average now at 156 (2017: 152). Unsurprisingly, given the weight of risk reporting and regulation affecting financial services, five FTSE 100 banks have some of the longest, averaging 325 pages. Technology companies have the shortest reports, with an average of 140 pages (2017: 136).
This year RBS again has the longest report in the FTSE 350 at 417 pages, down by 63 from last year. By comparison, Games Workshop Group had the shortest, at just 64 pages (2017: F&C Commercial Property Trust Ltd, 67). Aviva cut its bulk by 115 pages, the most dramatic reduction in the FTSE 350, largely by omitting pictures and infographics.
Average page length of front end
60
50
40
30
20
10
0
Strategic report Governance report Remuneration report
4042.7 44.2 46.2 48.6
36.5 37.4 39.544.4 44.6
18.2 18.2 18.2 20.4 20.3
2014 2015 2016 2017 2018
Num
ber o
f pag
es
Length of annual reports for the FTSE 350
160
140
120
100
80
60
40
20
050 1000 150 200 250 300 350 400
2017 201820162015
Number of pages
Num
ber o
f com
pani
es
10 Corporate Governance Review 2018
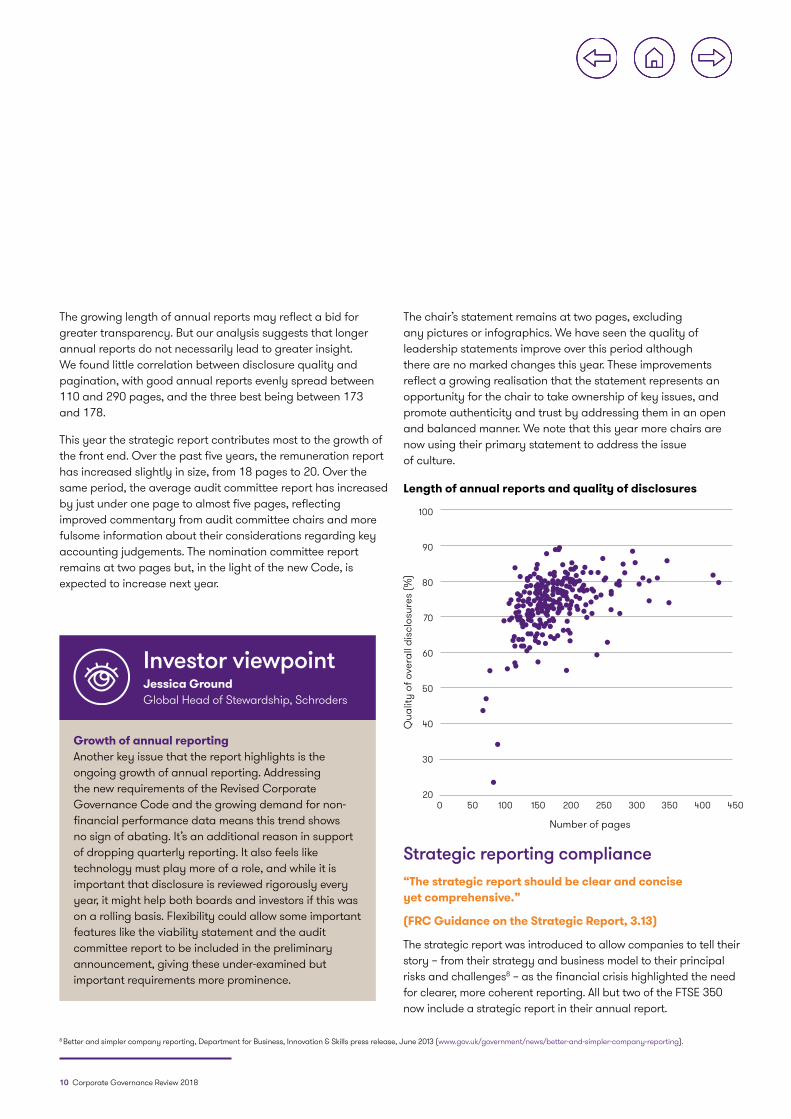
The growing length of annual reports may reflect a bid for greater transparency. But our analysis suggests that longer annual reports do not necessarily lead to greater insight. We found little correlation between disclosure quality and pagination, with good annual reports evenly spread between 110 and 290 pages, and the three best being between 173 and 178.
This year the strategic report contributes most to the growth of the front end. Over the past five years, the remuneration report has increased slightly in size, from 18 pages to 20. Over the same period, the average audit committee report has increased by just under one page to almost five pages, reflecting improved commentary from audit committee chairs and more fulsome information about their considerations regarding key accounting judgements. The nomination committee report remains at two pages but, in the light of the new Code, is expected to increase next year.
The chair’s statement remains at two pages, excluding any pictures or infographics. We have seen the quality of leadership statements improve over this period although there are no marked changes this year. These improvements reflect a growing realisation that the statement represents an opportunity for the chair to take ownership of key issues, and promote authenticity and trust by addressing them in an open and balanced manner. We note that this year more chairs are now using their primary statement to address the issue of culture.
Length of annual reports and quality of disclosures
100
90
80
70
60
50
40
30
200 50 100 150 200 250 300 350 450400
Number of pages
Qua
lity
of o
vera
ll di
sclo
sure
s (%
)
8 Better and simpler company reporting, Department for Business, Innovation & Skills press release, June 2013 (www.gov.uk/government/news/better-and-simpler-company-reporting).
Strategic reporting compliance“The strategic report should be clear and concise yet comprehensive.”
(FRC Guidance on the Strategic Report, 3.13)
The strategic report was introduced to allow companies to tell their story – from their strategy and business model to their principal risks and challenges8 – as the financial crisis highlighted the need for clearer, more coherent reporting. All but two of the FTSE 350 now include a strategic report in their annual report.
Investor viewpointJessica Ground Global Head of Stewardship, Schroders
Growth of annual reporting Another key issue that the report highlights is the ongoing growth of annual reporting. Addressing the new requirements of the Revised Corporate Governance Code and the growing demand for non-financial performance data means this trend shows no sign of abating. It’s an additional reason in support of dropping quarterly reporting. It also feels like technology must play more of a role, and while it is important that disclosure is reviewed rigorously every year, it might help both boards and investors if this was on a rolling basis. Flexibility could allow some important features like the viability statement and the audit committee report to be included in the preliminary announcement, giving these under-examined but important requirements more prominence.
Corporate Governance Review 2018 11
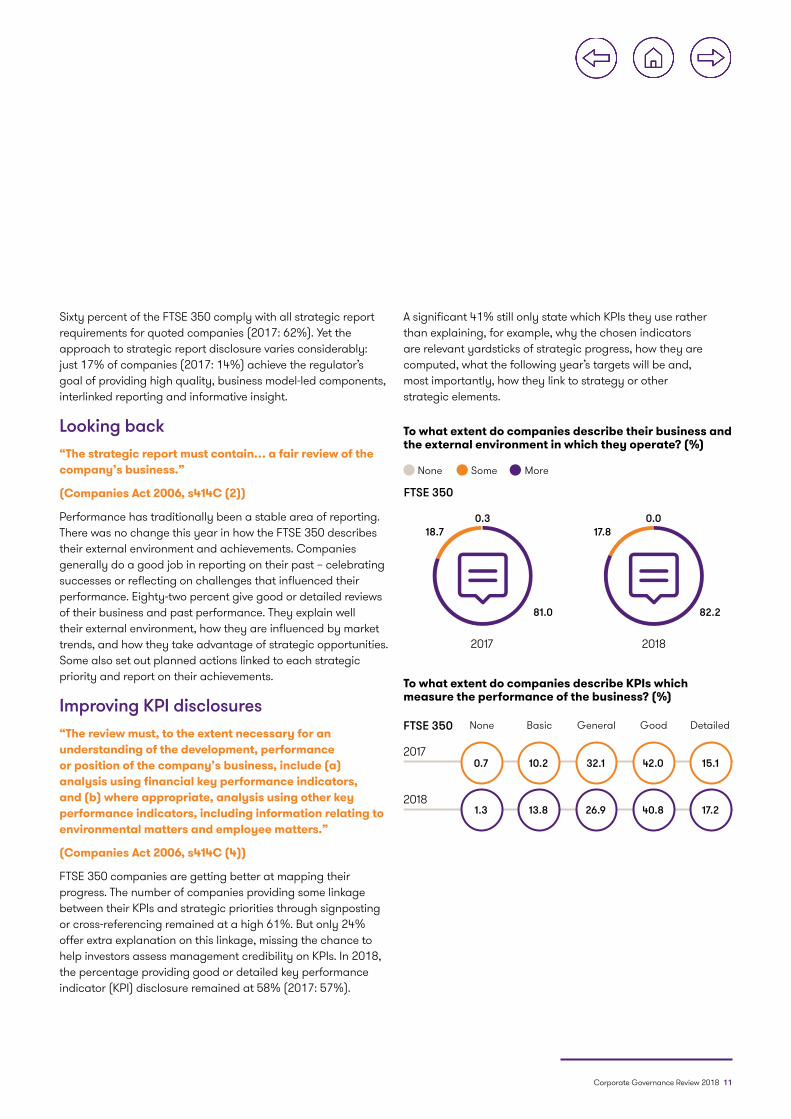
Sixty percent of the FTSE 350 comply with all strategic report requirements for quoted companies (2017: 62%). Yet the approach to strategic report disclosure varies considerably: just 17% of companies (2017: 14%) achieve the regulator’s goal of providing high quality, business model-led components, interlinked reporting and informative insight.
Looking back“The strategic report must contain… a fair review of the company’s business.”
(Companies Act 2006, s414C (2))
Performance has traditionally been a stable area of reporting. There was no change this year in how the FTSE 350 describes their external environment and achievements. Companies generally do a good job in reporting on their past – celebrating successes or reflecting on challenges that influenced their performance. Eighty-two percent give good or detailed reviews of their business and past performance. They explain well their external environment, how they are influenced by market trends, and how they take advantage of strategic opportunities. Some also set out planned actions linked to each strategic priority and report on their achievements.
Improving KPI disclosures “The review must, to the extent necessary for an understanding of the development, performance or position of the company’s business, include (a) analysis using financial key performance indicators, and (b) where appropriate, analysis using other key performance indicators, including information relating to environmental matters and employee matters.”
(Companies Act 2006, s414C (4))
FTSE 350 companies are getting better at mapping their progress. The number of companies providing some linkage between their KPIs and strategic priorities through signposting or cross-referencing remained at a high 61%. But only 24% offer extra explanation on this linkage, missing the chance to help investors assess management credibility on KPIs. In 2018, the percentage providing good or detailed key performance indicator (KPI) disclosure remained at 58% (2017: 57%).
A significant 41% still only state which KPIs they use rather than explaining, for example, why the chosen indicators are relevant yardsticks of strategic progress, how they are computed, what the following year’s targets will be and, most importantly, how they link to strategy or other strategic elements.
To what extent do companies describe their business and the external environment in which they operate? (%)
To what extent do companies describe KPIs which measure the performance of the business? (%)
MoreSomeNone
FTSE 350
81.0
18.70.3
2017
82.2
17.80.0
2018
None Basic DetailedGoodGeneral
1.3 13.8 26.9 40.8 17.22018
0.7 10.2 32.1 42.0 15.12017
FTSE 350
12 Corporate Governance Review 2018
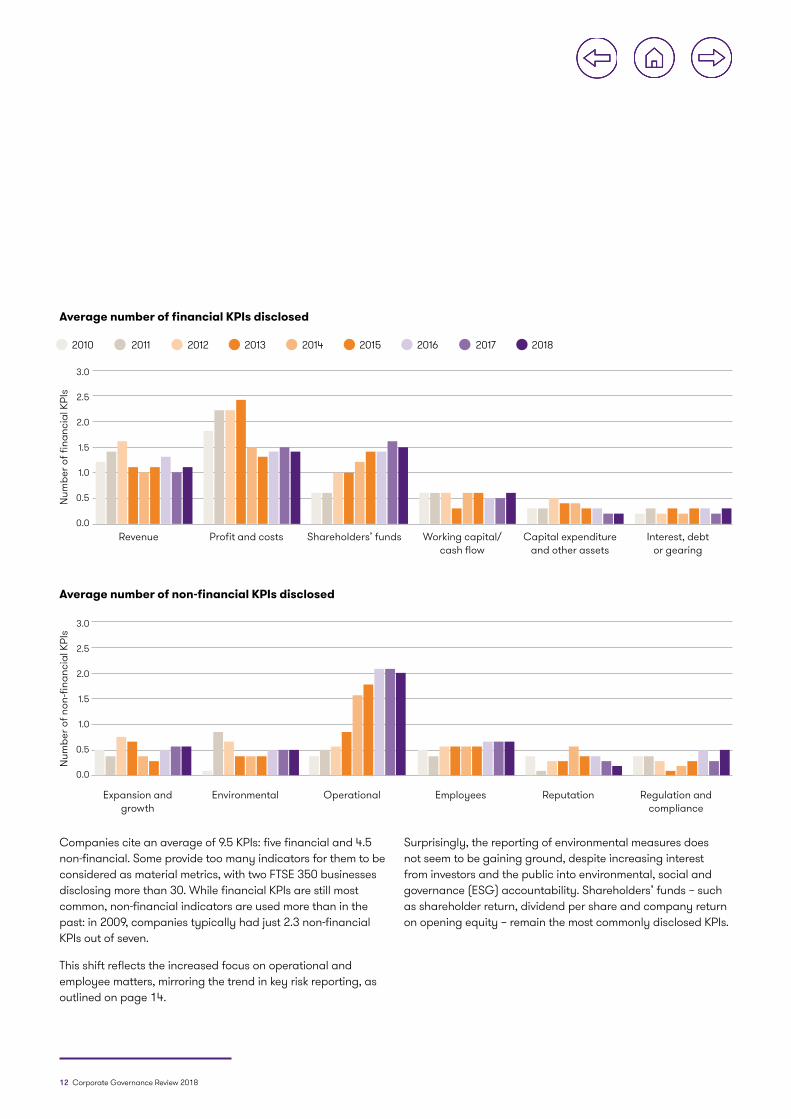
Companies cite an average of 9.5 KPIs: five financial and 4.5 non-financial. Some provide too many indicators for them to be considered as material metrics, with two FTSE 350 businesses disclosing more than 30. While financial KPIs are still most common, non-financial indicators are used more than in the past: in 2009, companies typically had just 2.3 non-financial KPIs out of seven.
This shift reflects the increased focus on operational and employee matters, mirroring the trend in key risk reporting, as outlined on page 14.
Surprisingly, the reporting of environmental measures does not seem to be gaining ground, despite increasing interest from investors and the public into environmental, social and governance (ESG) accountability. Shareholders’ funds – such as shareholder return, dividend per share and company return on opening equity – remain the most commonly disclosed KPIs.
Num
ber o
f fina
ncia
l KPI
s
Average number of financial KPIs disclosed
3.0
2.5
2.0
1.5
1.0
0.5
0.0Working capital/
cash flowCapital expenditure
and other assetsInterest, debt
or gearingShareholders’ fundsProfit and costsRevenue
2017 20182013 20162012 20152011 20142010
Num
ber o
f non
-fina
ncia
l KPI
s
3.0
2.5
2.0
1.5
1.0
0.5
0.0
Expansion and growth
Environmental Operational Employees Reputation Regulation and compliance
Average number of non-financial KPIs disclosed
Corporate Governance Review 2018 13
Wider value creation“In the case of a quoted company the strategic report must include… a description of the company’s business model.”
(Companies Act 2006, s414C (8)(b))
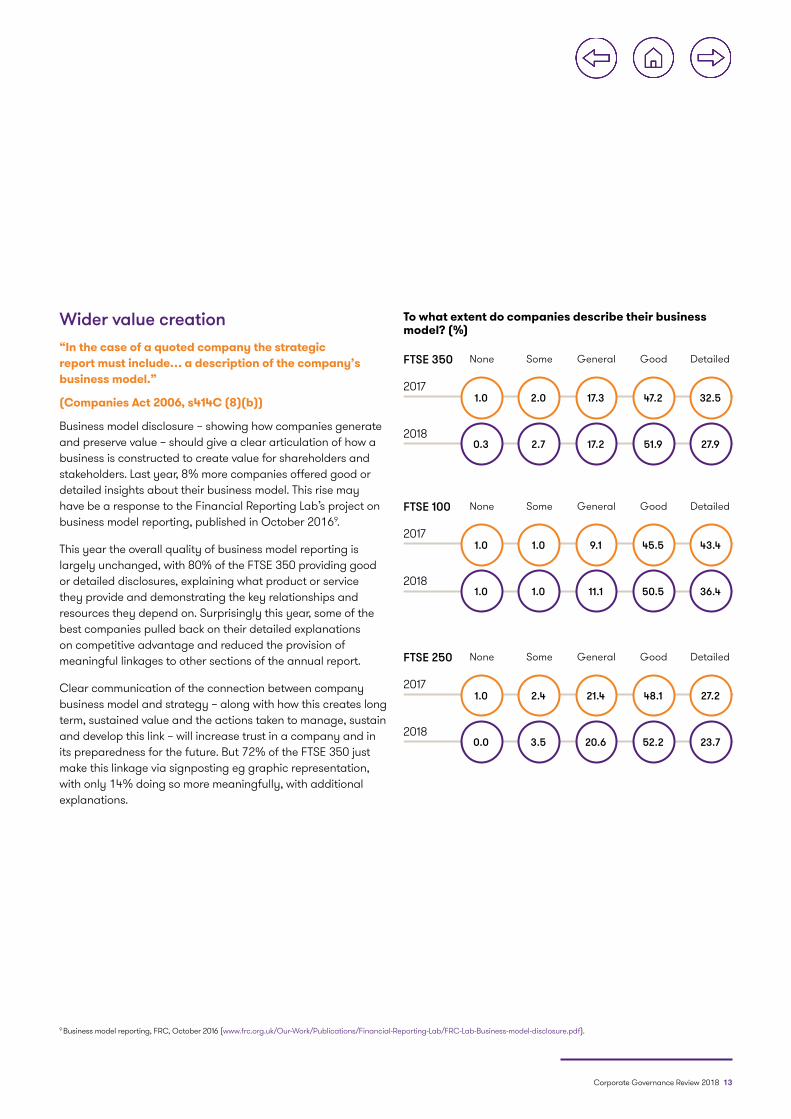
Business model disclosure – showing how companies generate and preserve value – should give a clear articulation of how a business is constructed to create value for shareholders and stakeholders. Last year, 8% more companies offered good or detailed insights about their business model. This rise may have be a response to the Financial Reporting Lab’s project on business model reporting, published in October 20169.
This year the overall quality of business model reporting is largely unchanged, with 80% of the FTSE 350 providing good or detailed disclosures, explaining what product or service they provide and demonstrating the key relationships and resources they depend on. Surprisingly this year, some of the best companies pulled back on their detailed explanations on competitive advantage and reduced the provision of meaningful linkages to other sections of the annual report.
Clear communication of the connection between company business model and strategy – along with how this creates long term, sustained value and the actions taken to manage, sustain and develop this link – will increase trust in a company and in its preparedness for the future. But 72% of the FTSE 350 just make this linkage via signposting eg graphic representation, with only 14% doing so more meaningfully, with additional explanations.
9 Business model reporting, FRC, October 2016 (www.frc.org.uk/Our-Work/Publications/Financial-Reporting-Lab/FRC-Lab-Business-model-disclosure.pdf).
To what extent do companies describe their business model? (%)
None
None
None
Some
Some
Some
Detailed
Detailed
Detailed
Good
Good
Good
General
General
General
0.3 2.7 17.2 51.9 27.92018
1.0 1.0 11.1 50.5 36.42018
0.0 3.5 20.6 52.2 23.72018
1.0 2.0 17.3 47.2 32.52017
1.0 1.0 9.1 45.5 43.42017
1.0 2.4 21.4 48.1 27.22017
FTSE 350
FTSE 100
FTSE 250
14 Corporate Governance Review 2018
Looking ahead“In the case of a quoted company the strategic report must, to the extent necessary for an understanding of the development, performance or position of the company’s business, include…the main trends and factors likely to affect the future development, performance and position of the company’s business.”
(Companies Act 2006, s414C (7))
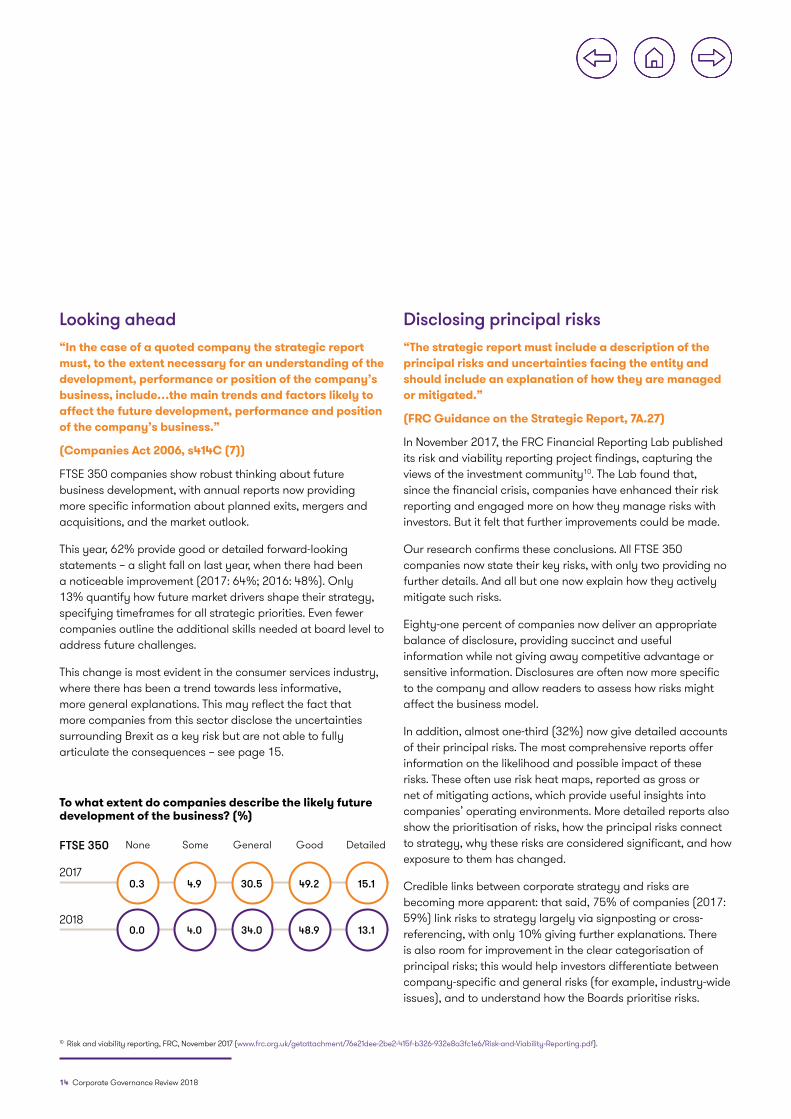
FTSE 350 companies show robust thinking about future business development, with annual reports now providing more specific information about planned exits, mergers and acquisitions, and the market outlook.
This year, 62% provide good or detailed forward-looking statements – a slight fall on last year, when there had been a noticeable improvement (2017: 64%; 2016: 48%). Only 13% quantify how future market drivers shape their strategy, specifying timeframes for all strategic priorities. Even fewer companies outline the additional skills needed at board level to address future challenges.
This change is most evident in the consumer services industry, where there has been a trend towards less informative, more general explanations. This may reflect the fact that more companies from this sector disclose the uncertainties surrounding Brexit as a key risk but are not able to fully articulate the consequences – see page 15.
Disclosing principal risks“The strategic report must include a description of the principal risks and uncertainties facing the entity and should include an explanation of how they are managed or mitigated.”
(FRC Guidance on the Strategic Report, 7A.27)
In November 2017, the FRC Financial Reporting Lab published its risk and viability reporting project findings, capturing the views of the investment community10. The Lab found that, since the financial crisis, companies have enhanced their risk reporting and engaged more on how they manage risks with investors. But it felt that further improvements could be made.
Our research confirms these conclusions. All FTSE 350 companies now state their key risks, with only two providing no further details. And all but one now explain how they actively mitigate such risks.
Eighty-one percent of companies now deliver an appropriate balance of disclosure, providing succinct and useful information while not giving away competitive advantage or sensitive information. Disclosures are often now more specific to the company and allow readers to assess how risks might affect the business model.
In addition, almost one-third (32%) now give detailed accounts of their principal risks. The most comprehensive reports offer information on the likelihood and possible impact of these risks. These often use risk heat maps, reported as gross or net of mitigating actions, which provide useful insights into companies’ operating environments. More detailed reports also show the prioritisation of risks, how the principal risks connect to strategy, why these risks are considered significant, and how exposure to them has changed.
Credible links between corporate strategy and risks are becoming more apparent: that said, 75% of companies (2017: 59%) link risks to strategy largely via signposting or cross-referencing, with only 10% giving further explanations. There is also room for improvement in the clear categorisation of principal risks; this would help investors differentiate between company-specific and general risks (for example, industry-wide issues), and to understand how the Boards prioritise risks.
To what extent do companies describe the likely future development of the business? (%)
None Some DetailedGoodGeneral
0.0 4.0 34.0 48.9 13.12018
0.3 4.9 30.5 49.2 15.12017
FTSE 350
10 Risk and viability reporting, FRC, November 2017 (www.frc.org.uk/getattachment/76e21dee-2be2-415f-b326-932e8a3fc1e6/Risk-and-Viability-Reporting.pdf).
Corporate Governance Review 2018 15
11 Guidance on Risk Management, Internal Control and Related Financial and Business Reporting, FRC, September 2014 (www.frc.org.uk/getattachment/d672c107-b1fb-4051-84b0-f5b83a1b93f6/Guidance-on-Risk-Management-Internal-Control-and-Related-Reporting.pdf).
12 The UK Corporate Governance Code 2018, Provision 28, (https://www.frc.org.uk/getattachment/88bd8c45-50ea-4841-95b0-d2f4f48069a2/2018-UK-Corporate-Governance-Code-FINAL.PDF)13 Recommendations of the Task Force on Climate-related Financial Disclosures, Financial Stability Board, June 2017 (www.fsb-tcfd.org/wp-content/uploads/2017/06/FINAL-TCFD-Report-062817.pdf).
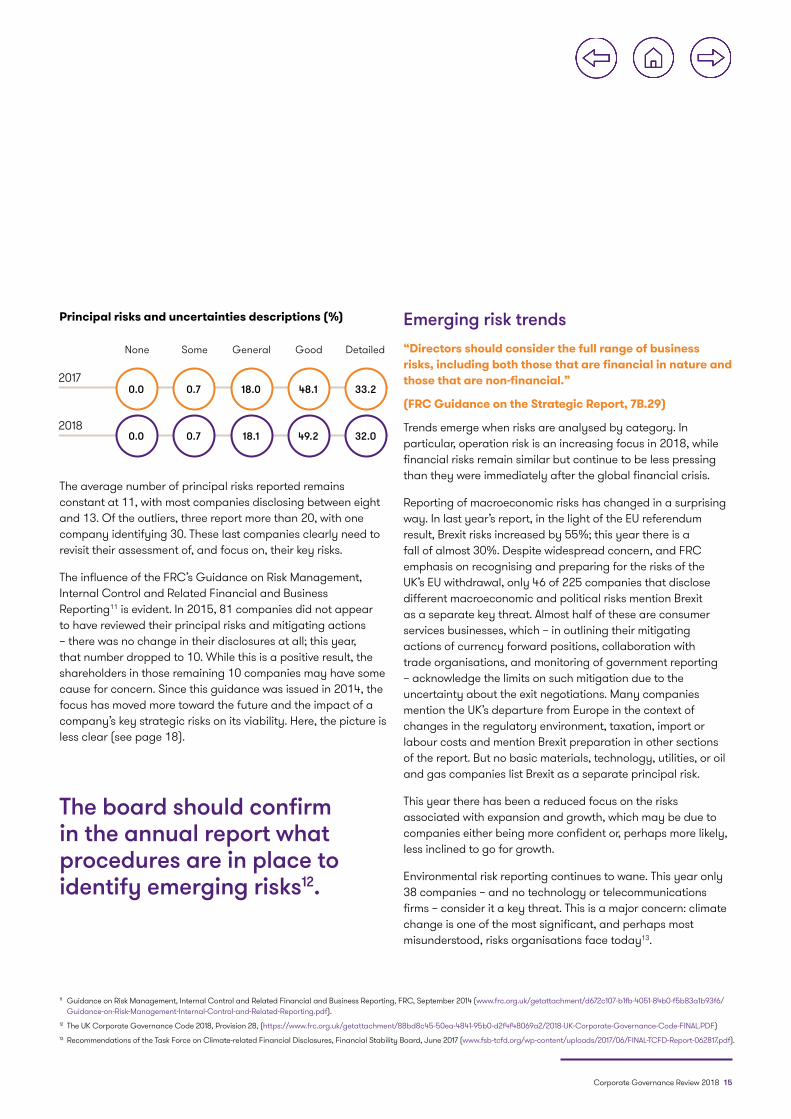
Principal risks and uncertainties descriptions (%)
None Some DetailedGoodGeneral
0.0 0.7 18.1 49.2 32.02018
0.0 0.7 18.0 48.1 33.22017
The average number of principal risks reported remains constant at 11, with most companies disclosing between eight and 13. Of the outliers, three report more than 20, with one company identifying 30. These last companies clearly need to revisit their assessment of, and focus on, their key risks.
The influence of the FRC’s Guidance on Risk Management, Internal Control and Related Financial and Business Reporting11 is evident. In 2015, 81 companies did not appear to have reviewed their principal risks and mitigating actions – there was no change in their disclosures at all; this year, that number dropped to 10. While this is a positive result, the shareholders in those remaining 10 companies may have some cause for concern. Since this guidance was issued in 2014, the focus has moved more toward the future and the impact of a company’s key strategic risks on its viability. Here, the picture is less clear (see page 18).
Emerging risk trends“Directors should consider the full range of business risks, including both those that are financial in nature and those that are non-financial.”
(FRC Guidance on the Strategic Report, 7B.29)
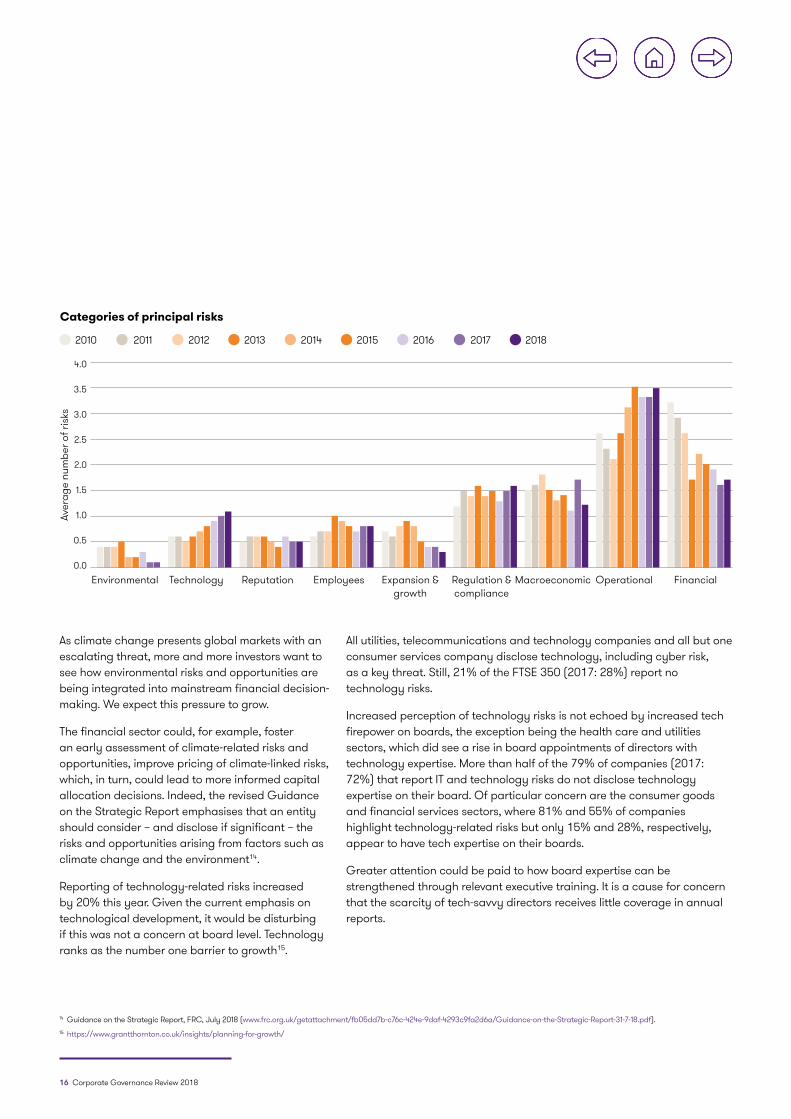
Trends emerge when risks are analysed by category. In particular, operation risk is an increasing focus in 2018, while financial risks remain similar but continue to be less pressing than they were immediately after the global financial crisis.
Reporting of macroeconomic risks has changed in a surprising way. In last year’s report, in the light of the EU referendum result, Brexit risks increased by 55%; this year there is a fall of almost 30%. Despite widespread concern, and FRC emphasis on recognising and preparing for the risks of the UK’s EU withdrawal, only 46 of 225 companies that disclose different macroeconomic and political risks mention Brexit as a separate key threat. Almost half of these are consumer services businesses, which – in outlining their mitigating actions of currency forward positions, collaboration with trade organisations, and monitoring of government reporting – acknowledge the limits on such mitigation due to the uncertainty about the exit negotiations. Many companies mention the UK’s departure from Europe in the context of changes in the regulatory environment, taxation, import or labour costs and mention Brexit preparation in other sections of the report. But no basic materials, technology, utilities, or oil and gas companies list Brexit as a separate principal risk.
This year there has been a reduced focus on the risks associated with expansion and growth, which may be due to companies either being more confident or, perhaps more likely, less inclined to go for growth.
Environmental risk reporting continues to wane. This year only 38 companies – and no technology or telecommunications firms – consider it a key threat. This is a major concern: climate change is one of the most significant, and perhaps most misunderstood, risks organisations face today13.
The board should confirm in the annual report what procedures are in place to identify emerging risks12.
16 Corporate Governance Review 2018
Aver
age
num
ber o
f ris
ks
Categories of principal risks
4.0
3.5
3.0
2.5
2.0
1.5
1.0
0.5
0.0
2017 20182013 20162012 20152011 20142010
Environmental Technology Reputation Employees Expansion & growth
Macroeconomic Operational FinancialRegulation & compliance
As climate change presents global markets with an escalating threat, more and more investors want to see how environmental risks and opportunities are being integrated into mainstream financial decision-making. We expect this pressure to grow.
The financial sector could, for example, foster an early assessment of climate-related risks and opportunities, improve pricing of climate-linked risks, which, in turn, could lead to more informed capital allocation decisions. Indeed, the revised Guidance on the Strategic Report emphasises that an entity should consider – and disclose if significant – the risks and opportunities arising from factors such as climate change and the environment14.
Reporting of technology-related risks increased by 20% this year. Given the current emphasis on technological development, it would be disturbing if this was not a concern at board level. Technology ranks as the number one barrier to growth15.
14 Guidance on the Strategic Report, FRC, July 2018 (www.frc.org.uk/getattachment/fb05dd7b-c76c-424e-9daf-4293c9fa2d6a/Guidance-on-the-Strategic-Report-31-7-18.pdf).15 https://www.grantthornton.co.uk/insights/planning-for-growth/
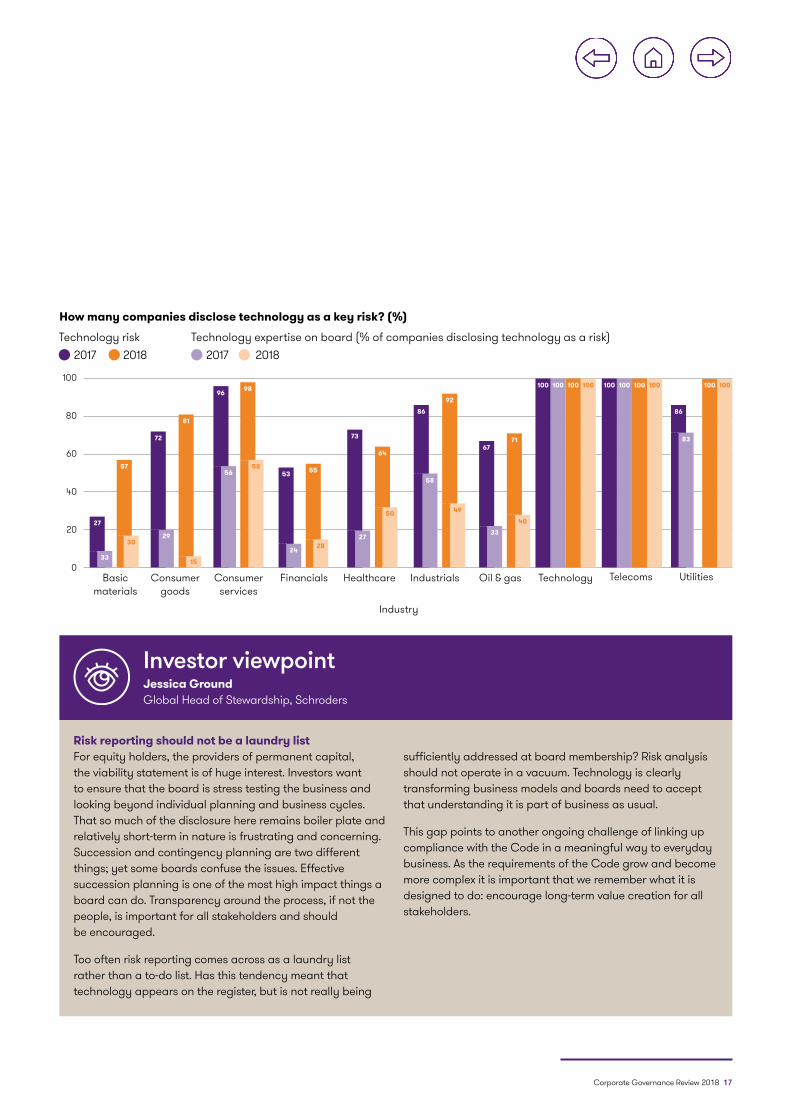
All utilities, telecommunications and technology companies and all but one consumer services company disclose technology, including cyber risk, as a key threat. Still, 21% of the FTSE 350 (2017: 28%) report no technology risks.
Increased perception of technology risks is not echoed by increased tech firepower on boards, the exception being the health care and utilities sectors, which did see a rise in board appointments of directors with technology expertise. More than half of the 79% of companies (2017: 72%) that report IT and technology risks do not disclose technology expertise on their board. Of particular concern are the consumer goods and financial services sectors, where 81% and 55% of companies highlight technology-related risks but only 15% and 28%, respectively, appear to have tech expertise on their boards.
Greater attention could be paid to how board expertise can be strengthened through relevant executive training. It is a cause for concern that the scarcity of tech-savvy directors receives little coverage in annual reports.
Corporate Governance Review 2018 17
How many companies disclose technology as a key risk? (%)
Technology risk 2017 20172018 2018
Technology expertise on board (% of companies disclosing technology as a risk)
IndustrialsHealthcareFinancialsConsumer services
Consumer goods
Basic materials
Oil & gas UtilitiesTelecomsTechnology
Industry
100
80
60
40
20
0
27
72
81
96 98
5856 53
73
27
58
33
55
64
86
6771
100 100100 100100 100 100100 100 100
92
24
57
30
15
28
50 49
40
33
29
Investor viewpointJessica Ground Global Head of Stewardship, Schroders
Risk reporting should not be a laundry list For equity holders, the providers of permanent capital, the viability statement is of huge interest. Investors want to ensure that the board is stress testing the business and looking beyond individual planning and business cycles. That so much of the disclosure here remains boiler plate and relatively short-term in nature is frustrating and concerning. Succession and contingency planning are two different things; yet some boards confuse the issues. Effective succession planning is one of the most high impact things a board can do. Transparency around the process, if not the people, is important for all stakeholders and should be encouraged.
Too often risk reporting comes across as a laundry list rather than a to-do list. Has this tendency meant that technology appears on the register, but is not really being
sufficiently addressed at board membership? Risk analysis should not operate in a vacuum. Technology is clearly transforming business models and boards need to accept that understanding it is part of business as usual.
This gap points to another ongoing challenge of linking up compliance with the Code in a meaningful way to everyday business. As the requirements of the Code grow and become more complex it is important that we remember what it is designed to do: encourage long-term value creation for all stakeholders.
86
83
18 Corporate Governance Review 2018
The viability statement“Taking account of the company’s current position and principal risks, the directors should explain in the annual report how they have assessed the prospects of the company, over what period they have done so and why they consider that period to be appropriate. The directors should state whether they have a reasonable expectation that the company will be able to continue in operation and meet its liabilities as they fall due over the period of their assessment, drawing attention to any qualifications or assumptions as necessary.”
(UK Corporate Governance Code 2016, C.2.2)
The 2017 FRC Financial Reporting Lab reports showed that developing viability statements helps companies to better analyse their risk appetite, particularly by incorporating stress and sensitivity analyses into their risk management processes16. Yet companies need to be bolder in their viability report disclosures if they are to give investors and other stakeholders a true insight to their long-term resilience and sustainability.
Although all but two FTSE 350 companies offer a viability statement, less than half (2018: 47%; 2017: 49%) give good or detailed disclosures with specific insights into how they assess viability, including the scenarios considered and how these scenarios link back to the principal risks.
Just 13 companies (2017: 17), mostly in financial services and basic materials, fully address the detail envisaged by the FRC; for example, by including quantitative outcomes of scenario analysis, and disclosing the probability and extent of mitigating activities modelled in response to the scenarios.
Most (53%) produce statements that give little or no insight into their viability in the face of key strategic risks. Their statements remain largely disconnected from principal risks and make little specific reference to business strategy. They do not report explicitly on their methodology and give only basic or general disclosure as to the period the assessment covers and why this timing is appropriate. This figure was similar to last year (51%), suggesting the issue will continue to be a key focus for regulators and of growing interest to investors.
Do companies provide a satisfactory viability statement?FTSE 350 None Some General Good Detailed
2017 0.3 2.0 49.2 42.9 5.6
2018 0.7 1.7 50.8 42.4 4.4
FTSE 100 None Some General Good Detailed
2017 1.0 2.0 43.4 45.5 8.1
2018 1 0 48.5 46.5 4
FTSE 250 None Some General Good Detailed
2017 0.0 1.9 52.4 41.3 4.4
2018 0.5 2.5 52 40.5 4.5
16 Risk and viability reporting, FRC, November 2017 (www.frc.org.uk/getattachment/76e21dee-2be2-415f-b326-932e8a3fc1e6/Risk-and-Viability-Reporting.pdf)
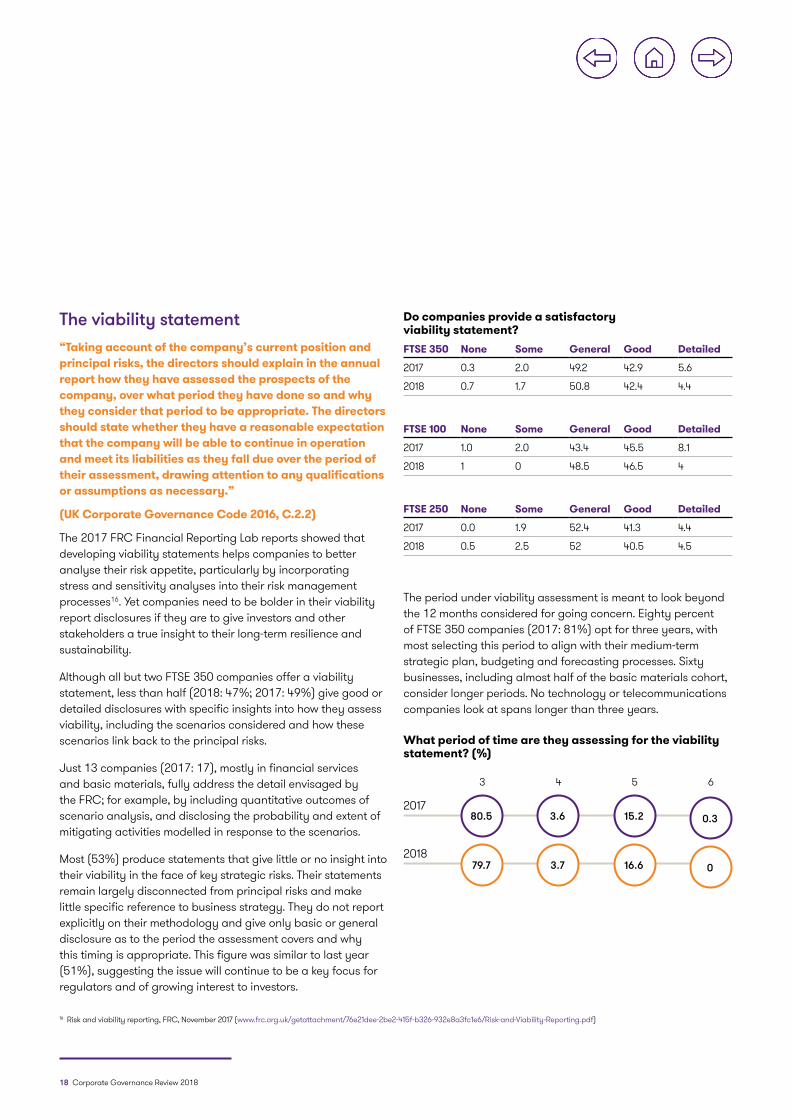
The period under viability assessment is meant to look beyond the 12 months considered for going concern. Eighty percent of FTSE 350 companies (2017: 81%) opt for three years, with most selecting this period to align with their medium-term strategic plan, budgeting and forecasting processes. Sixty businesses, including almost half of the basic materials cohort, consider longer periods. No technology or telecommunications companies look at spans longer than three years.
What period of time are they assessing for the viability statement? (%)
2017
3
80.5
79.7
4
3.6
3.7
5
15.2
16.6
6
0.3
02018
Corporate Governance Review 2018 19
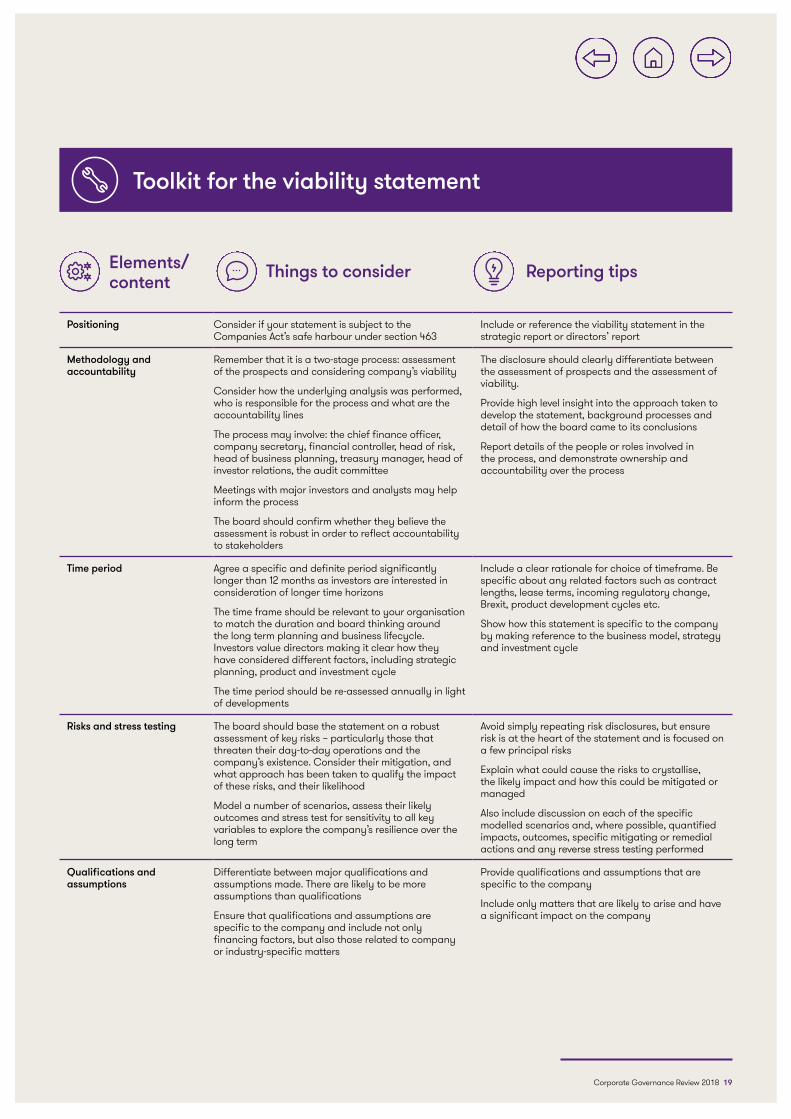
Toolkit for the viability statement
Positioning Consider if your statement is subject to the Companies Act’s safe harbour under section 463
Include or reference the viability statement in the strategic report or directors’ report
Methodology and accountability
Remember that it is a two-stage process: assessment of the prospects and considering company’s viability
Consider how the underlying analysis was performed, who is responsible for the process and what are the accountability lines
The process may involve: the chief finance officer, company secretary, financial controller, head of risk, head of business planning, treasury manager, head of investor relations, the audit committee
Meetings with major investors and analysts may help inform the process
The board should confirm whether they believe the assessment is robust in order to reflect accountability to stakeholders
The disclosure should clearly differentiate between the assessment of prospects and the assessment of viability.
Provide high level insight into the approach taken to develop the statement, background processes and detail of how the board came to its conclusions
Report details of the people or roles involved in the process, and demonstrate ownership and accountability over the process
Time period Agree a specific and definite period significantly longer than 12 months as investors are interested in consideration of longer time horizons
The time frame should be relevant to your organisation to match the duration and board thinking around the long term planning and business lifecycle. Investors value directors making it clear how they have considered different factors, including strategic planning, product and investment cycle
The time period should be re-assessed annually in light of developments
Include a clear rationale for choice of timeframe. Be specific about any related factors such as contract lengths, lease terms, incoming regulatory change, Brexit, product development cycles etc.
Show how this statement is specific to the company by making reference to the business model, strategy and investment cycle
Risks and stress testing The board should base the statement on a robust assessment of key risks – particularly those that threaten their day-to-day operations and the company’s existence. Consider their mitigation, and what approach has been taken to qualify the impact of these risks, and their likelihood
Model a number of scenarios, assess their likely outcomes and stress test for sensitivity to all key variables to explore the company’s resilience over the long term
Avoid simply repeating risk disclosures, but ensure risk is at the heart of the statement and is focused on a few principal risks
Explain what could cause the risks to crystallise, the likely impact and how this could be mitigated or managed
Also include discussion on each of the specific modelled scenarios and, where possible, quantified impacts, outcomes, specific mitigating or remedial actions and any reverse stress testing performed
Qualifications and assumptions
Differentiate between major qualifications and assumptions made. There are likely to be more assumptions than qualifications
Ensure that qualifications and assumptions are specific to the company and include not only financing factors, but also those related to company or industry-specific matters
Provide qualifications and assumptions that are specific to the company
Include only matters that are likely to arise and have a significant impact on the company
Reporting tipsThings to considerElements/content
20 Corporate Governance Review 2018
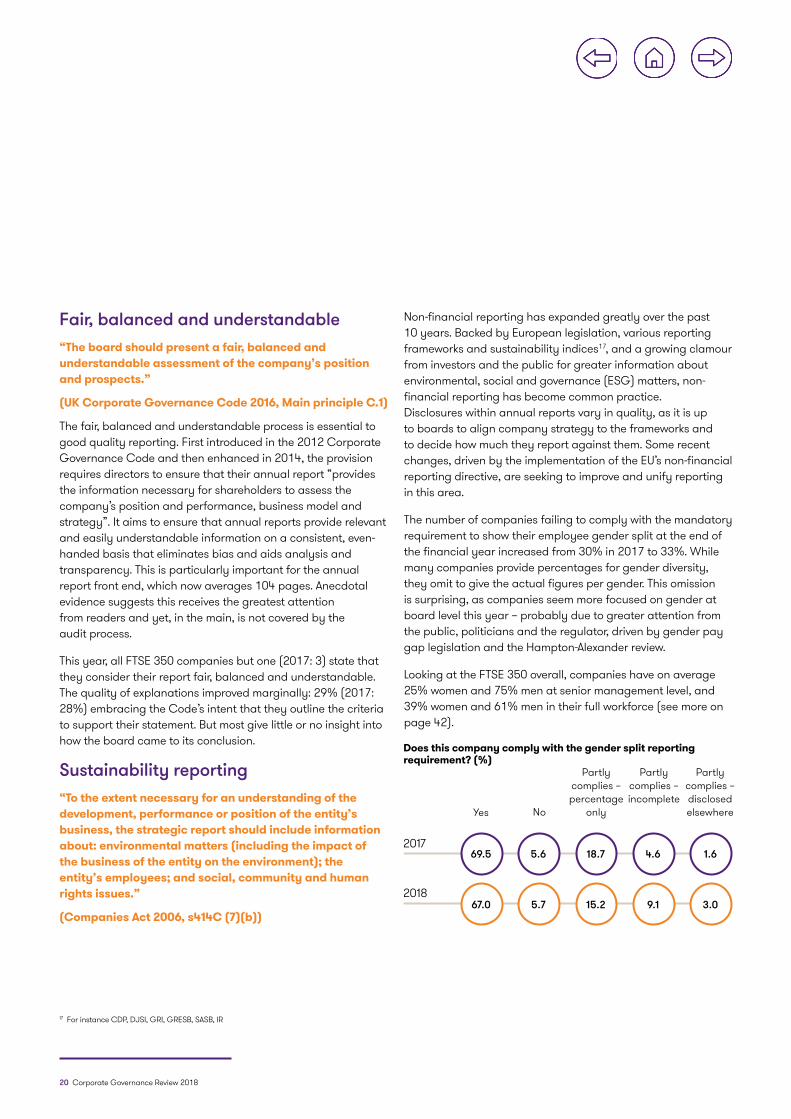
Does this company comply with the gender split reporting requirement? (%)
Yes No
Partly complies – disclosed elsewhere
Partly complies – incomplete
Partly complies – percentage
only
69.5 5.6 18.7 4.6 1.62017
67.0 5.7 15.2 9.1 3.02018
17 For instance CDP, DJSI, GRI, GRESB, SASB, IR
Fair, balanced and understandable“The board should present a fair, balanced and understandable assessment of the company’s position and prospects.”
(UK Corporate Governance Code 2016, Main principle C.1)
The fair, balanced and understandable process is essential to good quality reporting. First introduced in the 2012 Corporate Governance Code and then enhanced in 2014, the provision requires directors to ensure that their annual report “provides the information necessary for shareholders to assess the company’s position and performance, business model and strategy”. It aims to ensure that annual reports provide relevant and easily understandable information on a consistent, even-handed basis that eliminates bias and aids analysis and transparency. This is particularly important for the annual report front end, which now averages 104 pages. Anecdotal evidence suggests this receives the greatest attention from readers and yet, in the main, is not covered by the audit process.
This year, all FTSE 350 companies but one (2017: 3) state that they consider their report fair, balanced and understandable. The quality of explanations improved marginally: 29% (2017: 28%) embracing the Code’s intent that they outline the criteria to support their statement. But most give little or no insight into how the board came to its conclusion.
Sustainability reporting “To the extent necessary for an understanding of the development, performance or position of the entity’s business, the strategic report should include information about: environmental matters (including the impact of the business of the entity on the environment); the entity’s employees; and social, community and human rights issues.”
(Companies Act 2006, s414C (7)(b))
Non-financial reporting has expanded greatly over the past 10 years. Backed by European legislation, various reporting frameworks and sustainability indices17, and a growing clamour from investors and the public for greater information about environmental, social and governance (ESG) matters, non-financial reporting has become common practice. Disclosures within annual reports vary in quality, as it is up to boards to align company strategy to the frameworks and to decide how much they report against them. Some recent changes, driven by the implementation of the EU’s non-financial reporting directive, are seeking to improve and unify reporting in this area.
The number of companies failing to comply with the mandatory requirement to show their employee gender split at the end of the financial year increased from 30% in 2017 to 33%. While many companies provide percentages for gender diversity, they omit to give the actual figures per gender. This omission is surprising, as companies seem more focused on gender at board level this year – probably due to greater attention from the public, politicians and the regulator, driven by gender pay gap legislation and the Hampton-Alexander review.
Looking at the FTSE 350 overall, companies have on average 25% women and 75% men at senior management level, and 39% women and 61% men in their full workforce (see more on page 42).

Over the past two years, nearly all companies have correctly reported levels of greenhouse gas emissions. Yet there has been no significant improvement in the content or quality of disclosures on environmental and employee issues, despite a similar, growing interest.
In 2018, there was a 4% improvement in the reporting of social, community and human rights activities. This may be linked to the EU non-financial reporting directive18, which introduced new reporting requirements for public interest in the UK. There was a
clear increase in companies providing a meaningful discussion of anti-bribery and corruption, again probably driven by its inclusion as a key matter in the non-financial reporting directive.
To what extent does the company explain environmental matters, employee matters and social, community and human rights activities? (%)
Environmental matters
20182016 2017
60.061.4 63.0
38.037.0 36.1
2.01.6 1.0
MoreSomeNone
Social, community and human rights activities
2.41.9 2.6
31.645.8 36.4
66.052.3 62.0
Employee matters
1.31.9 1.3
28.427.6 28.9
70.370.5 69.8
Corporate Governance Review 2018 21
18 Directive/2014/95/EU, EU, October 2014 (http://eur-lex.europa.eu/legal-content/EN/TXT/PDF/?uri=CELEX:32014L0095&from=EN), implemented into UK law as The Companies, Partnerships and Groups (Accounts and Non-Financial Reporting) Regulations 2016.
22 Corporate Governance Review 2018
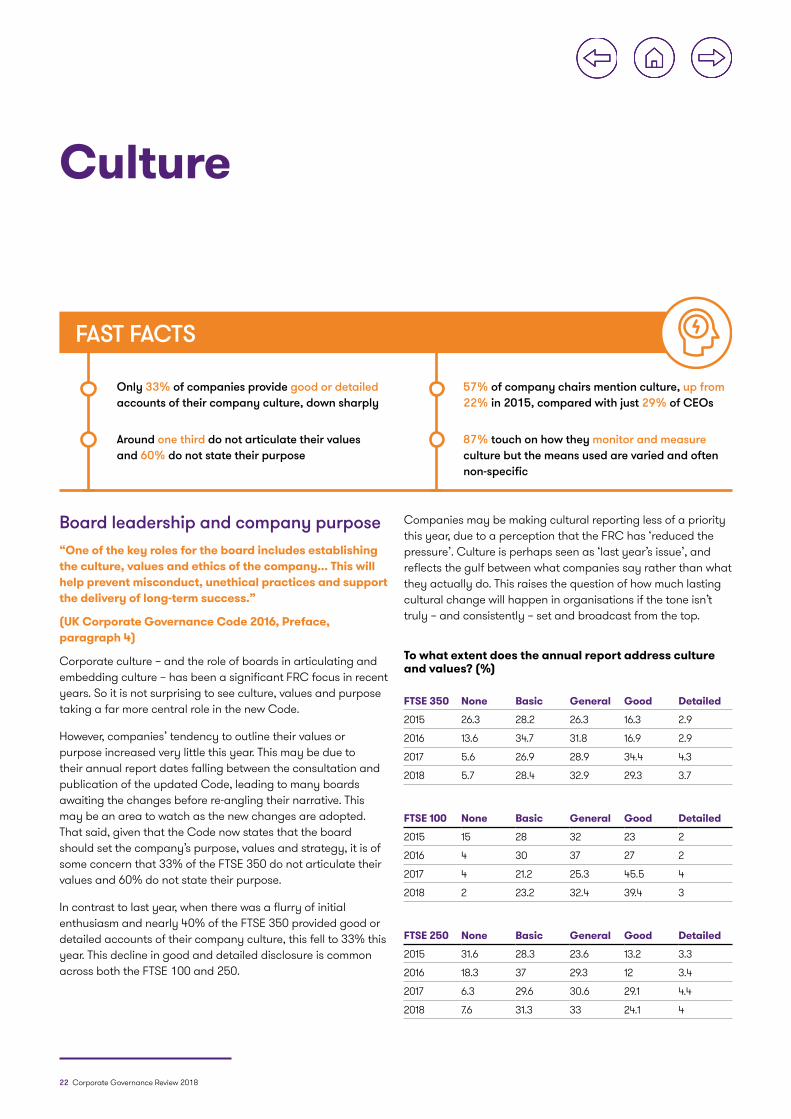
Culture
Only 33% of companies provide good or detailed accounts of their company culture, down sharply
57% of company chairs mention culture, up from 22% in 2015, compared with just 29% of CEOs
Around one third do not articulate their values and 60% do not state their purpose
87% touch on how they monitor and measure culture but the means used are varied and often non-specific
FAST FACTS
Board leadership and company purpose “One of the key roles for the board includes establishing the culture, values and ethics of the company... This will help prevent misconduct, unethical practices and support the delivery of long-term success.”
(UK Corporate Governance Code 2016, Preface, paragraph 4)
Corporate culture – and the role of boards in articulating and embedding culture – has been a significant FRC focus in recent years. So it is not surprising to see culture, values and purpose taking a far more central role in the new Code.
However, companies’ tendency to outline their values or purpose increased very little this year. This may be due to their annual report dates falling between the consultation and publication of the updated Code, leading to many boards awaiting the changes before re-angling their narrative. This may be an area to watch as the new changes are adopted. That said, given that the Code now states that the board should set the company’s purpose, values and strategy, it is of some concern that 33% of the FTSE 350 do not articulate their values and 60% do not state their purpose.
In contrast to last year, when there was a flurry of initial enthusiasm and nearly 40% of the FTSE 350 provided good or detailed accounts of their company culture, this fell to 33% this year. This decline in good and detailed disclosure is common across both the FTSE 100 and 250.
Companies may be making cultural reporting less of a priority this year, due to a perception that the FRC has ‘reduced the pressure’. Culture is perhaps seen as ‘last year’s issue’, and reflects the gulf between what companies say rather than what they actually do. This raises the question of how much lasting cultural change will happen in organisations if the tone isn’t truly – and consistently – set and broadcast from the top.
To what extent does the annual report address culture and values? (%)
FTSE 350 None Basic General Good Detailed
2015 26.3 28.2 26.3 16.3 2.9
2016 13.6 34.7 31.8 16.9 2.9
2017 5.6 26.9 28.9 34.4 4.3
2018 5.7 28.4 32.9 29.3 3.7
FTSE 100 None Basic General Good Detailed
2015 15 28 32 23 2
2016 4 30 37 27 2
2017 4 21.2 25.3 45.5 4
2018 2 23.2 32.4 39.4 3
FTSE 250 None Basic General Good Detailed
2015 31.6 28.3 23.6 13.2 3.3
2016 18.3 37 29.3 12 3.4
2017 6.3 29.6 30.6 29.1 4.4
2018 7.6 31.3 33 24.1 4

Corporate Governance Review 2018 23
To be most effective, culture should be aligned to strategy. Reflecting this and the changes to the Code, this year we assessed whether company annual reports outline how their culture supports their strategy and business model, and how culture is connected – if at all – to directors’ remuneration. Twenty-six per cent of the FTSE 350 include some detail on how their culture enables or is connected to their strategy, while an additional 36% refer to this but do not provide detail. Remuneration is less well linked to culture (see page 48).
Tone from the top“It is important that the board sets the correct ‘tone from the top’. The directors should lead by example and ensure that good standards of behaviour permeate throughout all levels of the organisation.”
(UK Corporate Governance Code 2016, Preface, paragraph 4)
The number of chairs talking about culture in their opening statements continues to rise. This year, 57% mention culture, up from 22% in 2015. We also see a trend in chairs using their primary statement to talk about the topic, rather than consigning it to their governance statements. It is perhaps an acknowledgement that putting governance at the heart of a company’s strategy requires consistent messaging from the top.
This recognition seems to have passed most CEOs by, with no change in the number of chief executives discussing company culture in their annual statements (29%). This is surprising given the FRC’s conclusion that the CEO is the primary promoter of an organisation’s culture, and the increased focus on culture in the new Code. This area requires greater discussion at board level.
Does the chair discuss the culture and values of the company? (%)
FTSE 350
No
Yes – in chair’s introduction to the annual
report (primary statement)
Yes – in both
Yes – in chair’s introduction to the corporate governance
report
43.6 14.1 27.9 14.42017
42.7 18.9 21.9 16.52018
61.4 12.7 16.9 9.12016
77.9 11.9 9.6 0.62015
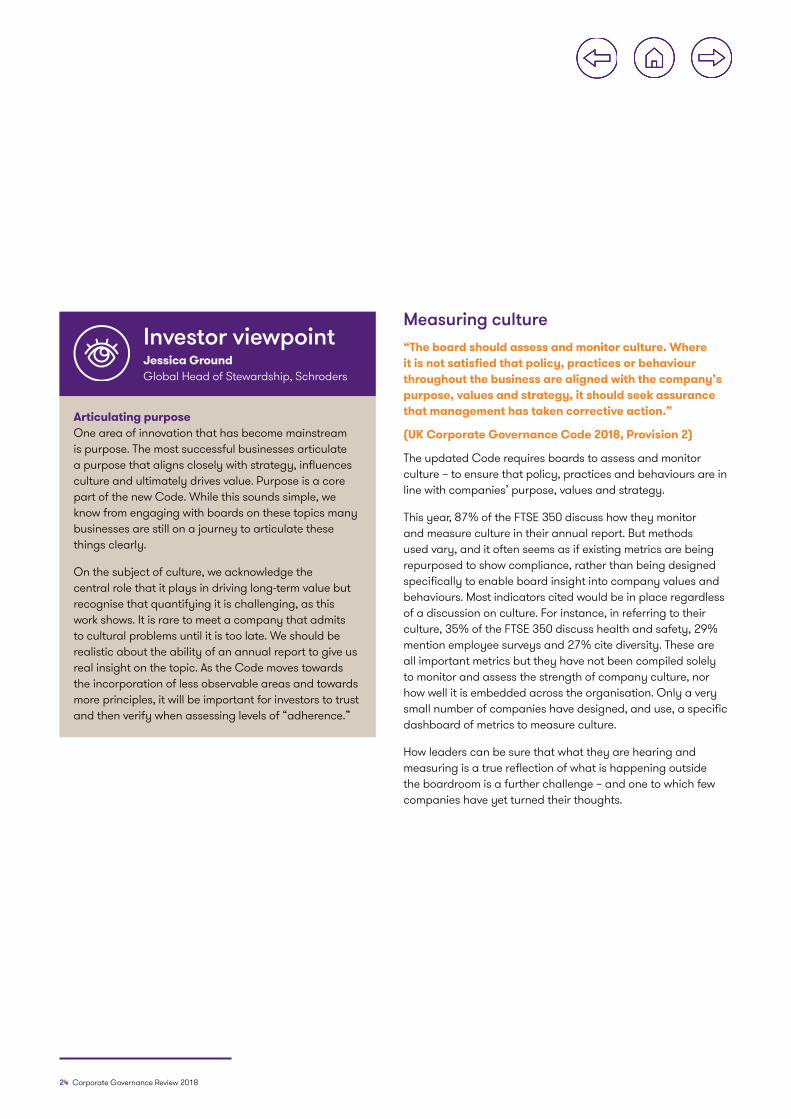
24 Corporate Governance Review 2018
Measuring culture“The board should assess and monitor culture. Where it is not satisfied that policy, practices or behaviour throughout the business are aligned with the company’s purpose, values and strategy, it should seek assurance that management has taken corrective action.”
(UK Corporate Governance Code 2018, Provision 2)
The updated Code requires boards to assess and monitor culture – to ensure that policy, practices and behaviours are in line with companies’ purpose, values and strategy.
This year, 87% of the FTSE 350 discuss how they monitor and measure culture in their annual report. But methods used vary, and it often seems as if existing metrics are being repurposed to show compliance, rather than being designed specifically to enable board insight into company values and behaviours. Most indicators cited would be in place regardless of a discussion on culture. For instance, in referring to their culture, 35% of the FTSE 350 discuss health and safety, 29% mention employee surveys and 27% cite diversity. These are all important metrics but they have not been compiled solely to monitor and assess the strength of company culture, nor how well it is embedded across the organisation. Only a very small number of companies have designed, and use, a specific dashboard of metrics to measure culture.
How leaders can be sure that what they are hearing and measuring is a true reflection of what is happening outside the boardroom is a further challenge – and one to which few companies have yet turned their thoughts.
Investor viewpointJessica Ground Global Head of Stewardship, Schroders
Articulating purpose One area of innovation that has become mainstream is purpose. The most successful businesses articulate a purpose that aligns closely with strategy, influences culture and ultimately drives value. Purpose is a core part of the new Code. While this sounds simple, we know from engaging with boards on these topics many businesses are still on a journey to articulate these things clearly.
On the subject of culture, we acknowledge the central role that it plays in driving long-term value but recognise that quantifying it is challenging, as this work shows. It is rare to meet a company that admits to cultural problems until it is too late. We should be realistic about the ability of an annual report to give us real insight on the topic. As the Code moves towards the incorporation of less observable areas and towards more principles, it will be important for investors to trust and then verify when assessing levels of “adherence.”
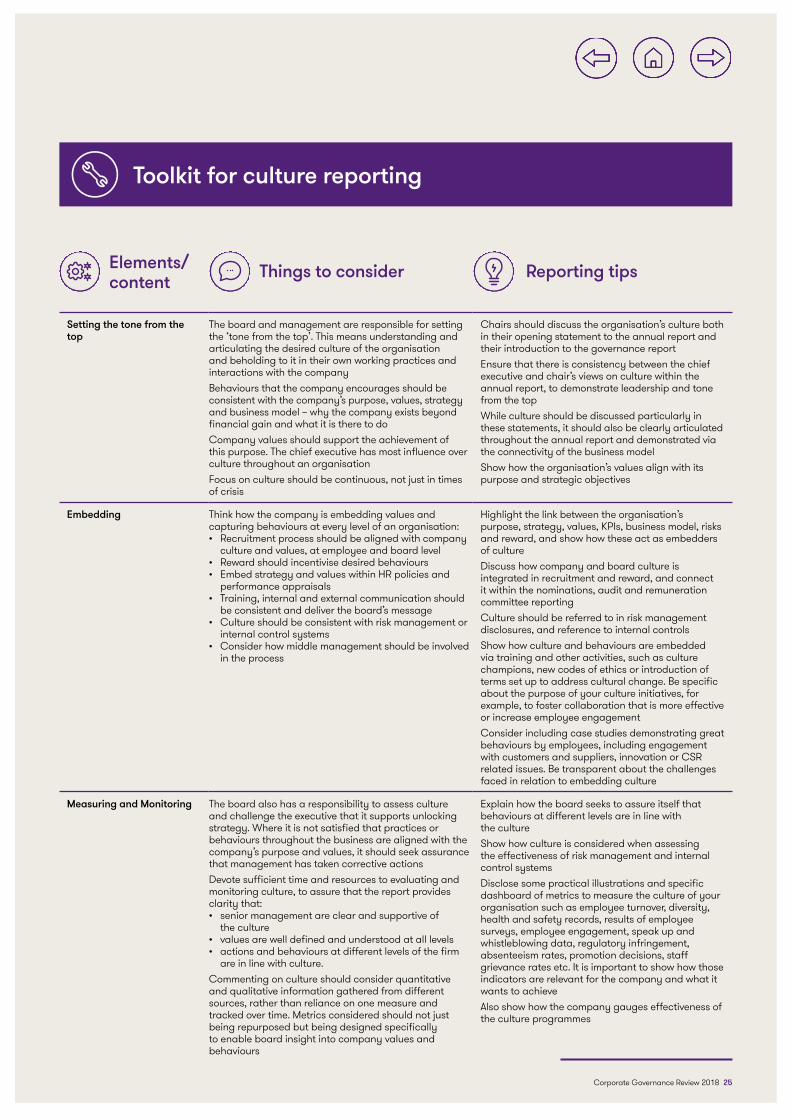
Toolkit for culture reporting
Corporate Governance Review 2018 25
Setting the tone from the top
The board and management are responsible for setting the ‘tone from the top’. This means understanding and articulating the desired culture of the organisation and beholding to it in their own working practices and interactions with the company Behaviours that the company encourages should be consistent with the company’s purpose, values, strategy and business model – why the company exists beyond financial gain and what it is there to do Company values should support the achievement of this purpose. The chief executive has most influence over culture throughout an organisation Focus on culture should be continuous, not just in times of crisis
Chairs should discuss the organisation’s culture both in their opening statement to the annual report and their introduction to the governance report Ensure that there is consistency between the chief executive and chair’s views on culture within the annual report, to demonstrate leadership and tone from the top While culture should be discussed particularly in these statements, it should also be clearly articulated throughout the annual report and demonstrated via the connectivity of the business modelShow how the organisation’s values align with its purpose and strategic objectives
Embedding Think how the company is embedding values and capturing behaviours at every level of an organisation: • Recruitment process should be aligned with company
culture and values, at employee and board level • Reward should incentivise desired behaviours • Embed strategy and values within HR policies and
performance appraisals• Training, internal and external communication should
be consistent and deliver the board’s message • Culture should be consistent with risk management or
internal control systems • Consider how middle management should be involved
in the process
Highlight the link between the organisation’s purpose, strategy, values, KPIs, business model, risks and reward, and show how these act as embedders of culture Discuss how company and board culture is integrated in recruitment and reward, and connect it within the nominations, audit and remuneration committee reporting Culture should be referred to in risk management disclosures, and reference to internal controls Show how culture and behaviours are embedded via training and other activities, such as culture champions, new codes of ethics or introduction of terms set up to address cultural change. Be specific about the purpose of your culture initiatives, for example, to foster collaboration that is more effective or increase employee engagementConsider including case studies demonstrating great behaviours by employees, including engagement with customers and suppliers, innovation or CSR related issues. Be transparent about the challenges faced in relation to embedding culture
Measuring and Monitoring The board also has a responsibility to assess culture and challenge the executive that it supports unlocking strategy. Where it is not satisfied that practices or behaviours throughout the business are aligned with the company’s purpose and values, it should seek assurance that management has taken corrective actions Devote sufficient time and resources to evaluating and monitoring culture, to assure that the report provides clarity that: • senior management are clear and supportive of
the culture • values are well defined and understood at all levels• actions and behaviours at different levels of the firm
are in line with culture. Commenting on culture should consider quantitative and qualitative information gathered from different sources, rather than reliance on one measure and tracked over time. Metrics considered should not just being repurposed but being designed specifically to enable board insight into company values and behaviours
Explain how the board seeks to assure itself that behaviours at different levels are in line with the culture Show how culture is considered when assessing the effectiveness of risk management and internal control systems Disclose some practical illustrations and specific dashboard of metrics to measure the culture of your organisation such as employee turnover, diversity, health and safety records, results of employee surveys, employee engagement, speak up and whistleblowing data, regulatory infringement, absenteeism rates, promotion decisions, staff grievance rates etc. It is important to show how those indicators are relevant for the company and what it wants to achieve Also show how the company gauges effectiveness of the culture programmes
Reporting tipsThings to considerElements/content
26 Corporate Governance Review 2018
Stakeholder engagement
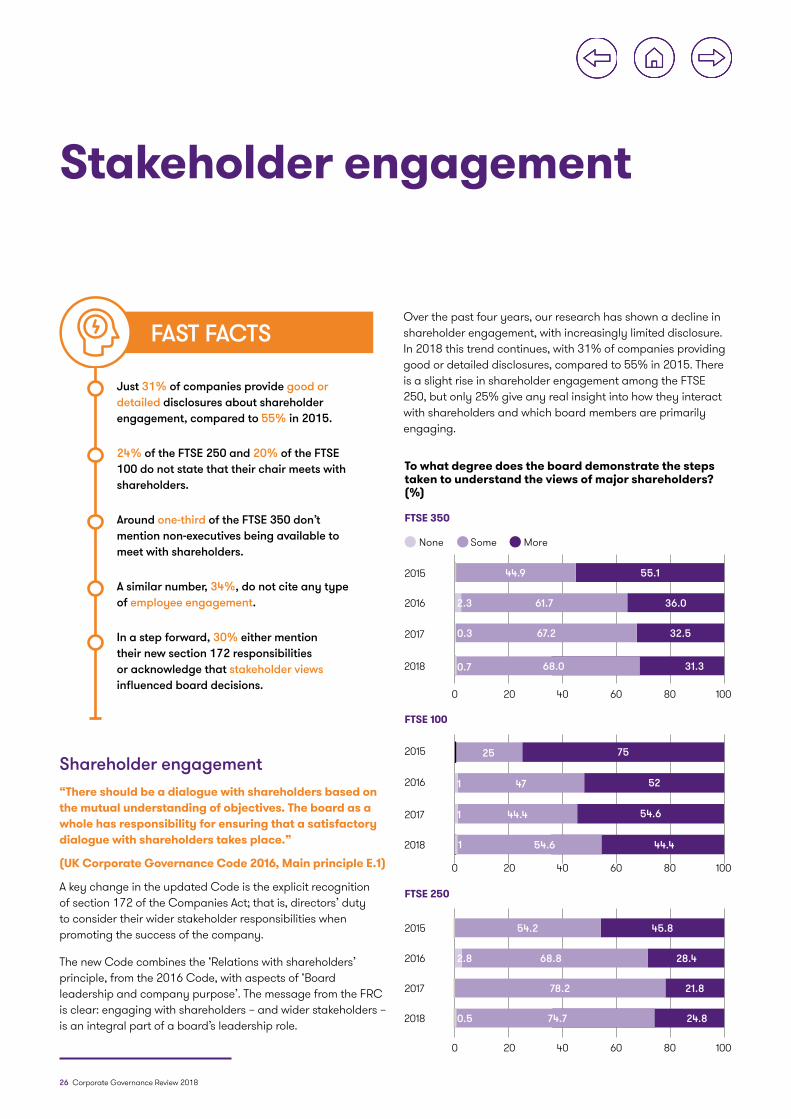
Shareholder engagement “There should be a dialogue with shareholders based on the mutual understanding of objectives. The board as a whole has responsibility for ensuring that a satisfactory dialogue with shareholders takes place.”
(UK Corporate Governance Code 2016, Main principle E.1)
A key change in the updated Code is the explicit recognition of section 172 of the Companies Act; that is, directors’ duty to consider their wider stakeholder responsibilities when promoting the success of the company.
The new Code combines the ‘Relations with shareholders’ principle, from the 2016 Code, with aspects of ‘Board leadership and company purpose’. The message from the FRC is clear: engaging with shareholders – and wider stakeholders – is an integral part of a board’s leadership role.
To what degree does the board demonstrate the steps taken to understand the views of major shareholders? (%)
FTSE 350
0 20 40 60 80 100
None Some More
2018 68.0 31.3
2017 67.20.3 32.5
2016 61.72.3 36.0
2015 44.9 55.1
0.7
0 20 40 60 80 100
FTSE 100
2017 44.41 54.6
2016 471 52
2015 25 75
2018 54.6 44.41
FTSE 250
0 20 40 60 80 100
2016 68.82.8 28.4
2015 54.2 45.8
2017 78.2 21.8
2018 74.7 24.80.5
FAST FACTS
Just 31% of companies provide good or detailed disclosures about shareholder engagement, compared to 55% in 2015.
24% of the FTSE 250 and 20% of the FTSE 100 do not state that their chair meets with shareholders.
Around one-third of the FTSE 350 don’t mention non-executives being available to meet with shareholders.
A similar number, 34%, do not cite any type of employee engagement.
In a step forward, 30% either mention their new section 172 responsibilities or acknowledge that stakeholder views influenced board decisions.
Over the past four years, our research has shown a decline in shareholder engagement, with increasingly limited disclosure. In 2018 this trend continues, with 31% of companies providing good or detailed disclosures, compared to 55% in 2015. There is a slight rise in shareholder engagement among the FTSE 250, but only 25% give any real insight into how they interact with shareholders and which board members are primarily engaging.
Investor viewpointJessica Ground Global Head of Stewardship, Schroders
Corporate Governance Review 2018 27
19 Board leadership and company purpose, provision 3.
The new Code19 says that, as well as holding formal general meetings, the chair should seek to engage regularly with major shareholders, to understand their views on governance and performance against strategy. The chair should also ensure the board has a clear understanding of shareholders’ views. Committee chairs, meanwhile, should seek to engage with shareholders on significant matters related to their areas of responsibility.
While the quality of reporting of engagement remains low, more companies do seem to report on meetings with investors. Fifty-six percent of the FTSE 350 provide information about direct meetings between non-executive directors and major shareholders. As with last year, this is more common in the FTSE 100, 65% of which mention face-to-face meetings compared with 51% of the FTSE 250.
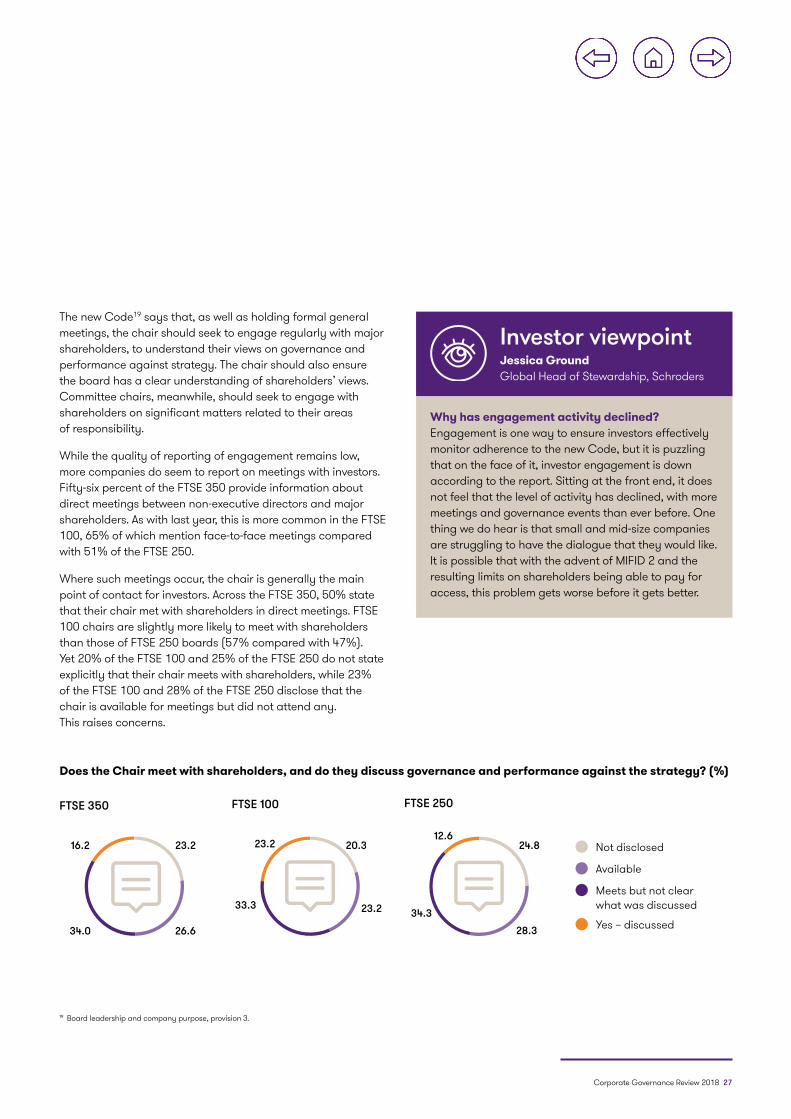
Where such meetings occur, the chair is generally the main point of contact for investors. Across the FTSE 350, 50% state that their chair met with shareholders in direct meetings. FTSE 100 chairs are slightly more likely to meet with shareholders than those of FTSE 250 boards (57% compared with 47%). Yet 20% of the FTSE 100 and 25% of the FTSE 250 do not state explicitly that their chair meets with shareholders, while 23% of the FTSE 100 and 28% of the FTSE 250 disclose that the chair is available for meetings but did not attend any. This raises concerns.
Does the Chair meet with shareholders, and do they discuss governance and performance against the strategy? (%)
Not disclosed
Available
Yes – discussed
Meets but not clear what was discussed
24.820.323.223.2
26.634.0
16.2
28.3
23.233.334.3
12.6
FTSE 350 FTSE 250FTSE 100
Why has engagement activity declined? Engagement is one way to ensure investors effectively monitor adherence to the new Code, but it is puzzling that on the face of it, investor engagement is down according to the report. Sitting at the front end, it does not feel that the level of activity has declined, with more meetings and governance events than ever before. One thing we do hear is that small and mid-size companies are struggling to have the dialogue that they would like. It is possible that with the advent of MIFID 2 and the resulting limits on shareholders being able to pay for access, this problem gets worse before it gets better.
28 Corporate Governance Review 2018
Other non-executives“…Non-executive directors should be offered the opportunity to attend scheduled meetings with major shareholders and should expect to attend meetings if requested by major shareholders. The senior independent director should attend sufficient meetings with a range of major shareholders to listen to their views in order to help develop a balanced understanding of the issues and concerns of major shareholders.”
(UK Corporate Governance Code 2016, E.1.1)
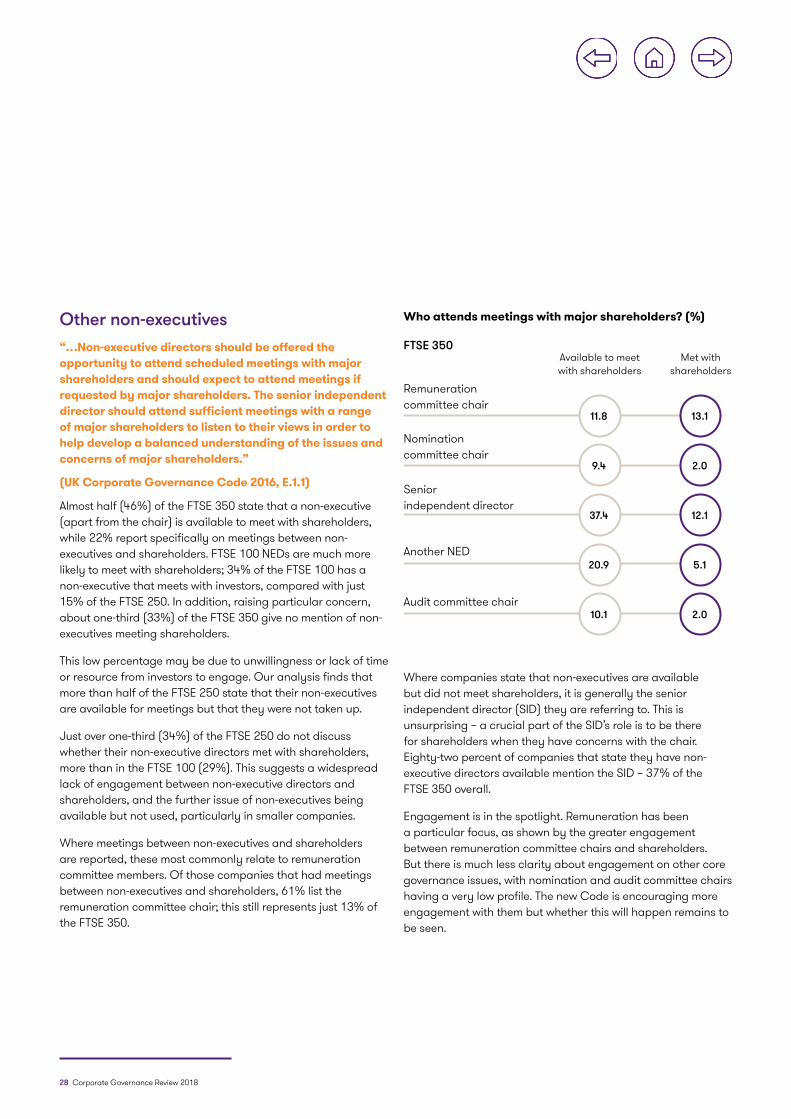
Almost half (46%) of the FTSE 350 state that a non-executive (apart from the chair) is available to meet with shareholders, while 22% report specifically on meetings between non-executives and shareholders. FTSE 100 NEDs are much more likely to meet with shareholders; 34% of the FTSE 100 has a non-executive that meets with investors, compared with just 15% of the FTSE 250. In addition, raising particular concern, about one-third (33%) of the FTSE 350 give no mention of non-executives meeting shareholders.
This low percentage may be due to unwillingness or lack of time or resource from investors to engage. Our analysis finds that more than half of the FTSE 250 state that their non-executives are available for meetings but that they were not taken up.
Just over one-third (34%) of the FTSE 250 do not discuss whether their non-executive directors met with shareholders, more than in the FTSE 100 (29%). This suggests a widespread lack of engagement between non-executive directors and shareholders, and the further issue of non-executives being available but not used, particularly in smaller companies.
Where meetings between non-executives and shareholders are reported, these most commonly relate to remuneration committee members. Of those companies that had meetings between non-executives and shareholders, 61% list the remuneration committee chair; this still represents just 13% of the FTSE 350.
Where companies state that non-executives are available but did not meet shareholders, it is generally the senior independent director (SID) they are referring to. This is unsurprising – a crucial part of the SID’s role is to be there for shareholders when they have concerns with the chair. Eighty-two percent of companies that state they have non-executive directors available mention the SID – 37% of the FTSE 350 overall.
Engagement is in the spotlight. Remuneration has been a particular focus, as shown by the greater engagement between remuneration committee chairs and shareholders. But there is much less clarity about engagement on other core governance issues, with nomination and audit committee chairs having a very low profile. The new Code is encouraging more engagement with them but whether this will happen remains to be seen.
Who attends meetings with major shareholders? (%)
FTSE 350
13.1
12.1
2.0
5.1
2.0
37.4
9.4
11.8
20.9
10.1
Met with shareholders
Available to meet with shareholders
Remuneration committee chair
Nomination committee chair
Senior independent director
Another NED
Audit committee chair
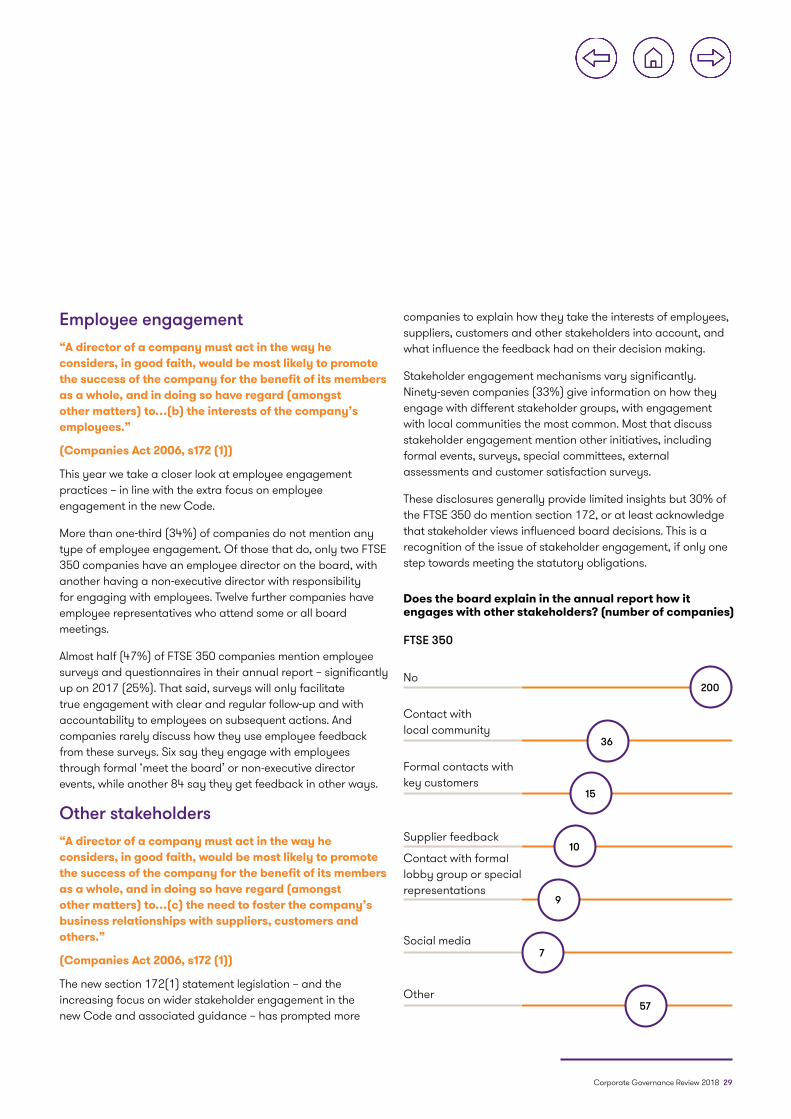
Corporate Governance Review 2018 29
Employee engagement “A director of a company must act in the way he considers, in good faith, would be most likely to promote the success of the company for the benefit of its members as a whole, and in doing so have regard (amongst other matters) to…(b) the interests of the company’s employees.”
(Companies Act 2006, s172 (1))
This year we take a closer look at employee engagement practices – in line with the extra focus on employee engagement in the new Code.
More than one-third (34%) of companies do not mention any type of employee engagement. Of those that do, only two FTSE 350 companies have an employee director on the board, with another having a non-executive director with responsibility for engaging with employees. Twelve further companies have employee representatives who attend some or all board meetings.
Almost half (47%) of FTSE 350 companies mention employee surveys and questionnaires in their annual report – significantly up on 2017 (25%). That said, surveys will only facilitate true engagement with clear and regular follow-up and with accountability to employees on subsequent actions. And companies rarely discuss how they use employee feedback from these surveys. Six say they engage with employees through formal ‘meet the board’ or non-executive director events, while another 84 say they get feedback in other ways.
Other stakeholders “A director of a company must act in the way he considers, in good faith, would be most likely to promote the success of the company for the benefit of its members as a whole, and in doing so have regard (amongst other matters) to…(c) the need to foster the company’s business relationships with suppliers, customers and others.”
(Companies Act 2006, s172 (1))
The new section 172(1) statement legislation – and the increasing focus on wider stakeholder engagement in the new Code and associated guidance – has prompted more
companies to explain how they take the interests of employees, suppliers, customers and other stakeholders into account, and what influence the feedback had on their decision making.
Stakeholder engagement mechanisms vary significantly. Ninety-seven companies (33%) give information on how they engage with different stakeholder groups, with engagement with local communities the most common. Most that discuss stakeholder engagement mention other initiatives, including formal events, surveys, special committees, external assessments and customer satisfaction surveys.
These disclosures generally provide limited insights but 30% of the FTSE 350 do mention section 172, or at least acknowledge that stakeholder views influenced board decisions. This is a recognition of the issue of stakeholder engagement, if only one step towards meeting the statutory obligations.
Does the board explain in the annual report how it engages with other stakeholders? (number of companies)
FTSE 350
57
200No
10Supplier feedback
15
Formal contacts with key customers
9
Contact with formal lobby group or special representations
36
Contact with local community
7Social media
Other
30 Corporate Governance Review 2018
Viewpoint on governanceAmanda Mellor Group Company Secretary and Head of Governance, Marks and Spencer plc
Viewpoint on governanceIn today’s social and political climate, trust in institutions of all kinds is at a premium. Public and media scrutiny of what organisations say and do is relentless, immediate and unforgiving. It is therefore more important than ever for businesses to articulate what they do and understand that they are expected to be accountable to wider society, not just their investors.
Recognising the wider stakeholder community has been an important part of M&S’s DNA for many years. In fact, in 1964, our then Deputy Chairman, Lord Sieff wrote that “the main purpose of building up a great business should not be merely to make money. A company has its responsibilities, not only to shareholders but also to the staff, the customers and the whole community in which it trades. Unless it gives satisfaction, and even happiness to all concerned, it will fail in its aims in the long term.” These sentiments are as important to M&S now as they were over 50 years ago and were somewhat prescient of the duties covered by Section 172 of the Companies Act, the new UK Corporate Governance Code and the current governance environment. They are central to the way we do business.
The new Code seeks to address stakeholder responsibility and public perception issues, particularly in the areas of remuneration, workforce representation and stakeholder engagement.
The Code calls for businesses to do more to enhance workforce representation and suggests a number of possible mechanisms for Boards to consider in support of this; however, it is important that businesses reflect carefully on this and find the structure that works best for them.
At M&S, constructive dialogue between the Board, management and the wider workforce is integral to our understanding of the business. This is co-ordinated through our Business Involvement Group (BIG), a national network of 3,400 elected employee representatives from stores and business areas who independently represent the employee voice. BIG representatives including their head are elected by their peers. They play a key role not only in ensuring our colleagues’ views are understood at the highest level, but also in helping colleagues understand and navigate business change.
The success of the BIG network has led to a high level of mutual trust, openness and understanding. The Chairman of National BIG now attends two full Board meetings and one Remuneration Committee meeting a year to share colleague perspectives on the issues under discussion and to gain first-hand understanding of the issues being debated at Board and Committee level.
The role and remit of the Committee was reviewed in 2017 and its duties expanded to cover the reward framework for the wider business, ensuring fairness as well as responsibility for gender pay and other areas of reporting. This has already had a tangible impact on executive pay outcomes, as illustrated by the Committee’s exercise of discretion articulated in this year’s Directors Remuneration Report.
There are also greater disclosure requirements for annual reports, especially around stakeholder engagement. The annual report has always been one of the prime opportunities for companies to present their stories, but with the plethora of topics and regulatory issues to be covered, it can so easily be treated as a legal and regulatory box-ticking exercise. This is an approach we at M&S have always consciously tried to avoid.
Corporate Governance Review 2018 31
Viewpoint on governanceAmanda Mellor Group Company Secretary and Head of Governance, Marks and Spencer plc
We want our story to be a good read and accessible. To drive clarity, we are increasingly looking to de-clutter and put more online. In this digital age, we urge regulators to look at the necessity for producing printed documents!
This year it was particularly important to present the ‘unvarnished truth’ and the issues affecting the business and to articulate the significant transformation plans to return the business to sustainable profitable growth. Good engagement with colleagues, BIG and other stakeholders has been vital to get everyone to understand the issues we face and to shape and support our plans. This was particularly important as we accelerated our store closure programme, given the impact on colleagues and customers.
While these appear to be internal matters, we believe that external reporting on issues such as employee engagement is not only good for M&S, but it feeds into a wider conversation with the public about fairness and the pressures facing the High Street. We have always tried to be brave and to confront issues directly, which is often hard to articulate in print. We know we will not always get it right, but these are important conversations to have to build trust.
With the new Code, companies need to be mindful of how their actions and responses, or indeed the lack of them, to such sensitive topics are perceived, what they are doing to address these key areas of public concern and why they believe their actions are in the best interest of their business and their stakeholders. The quality of boards and their actions, as well
as their reporting, will be under more scrutiny than ever. Failure to step up and provide clear insight will have a significant influence on the reporting regime of the future, which could ultimately end with legislation.
As our business moves forward, so will our reporting. We will always seek to tell our story in an honest, informative and engaging way, rather than simply responding to regulatory requirements. It is our hope that all businesses will also move to genuinely embrace good governance principles as a matter of course, thereby earning the trust of their shareholders, colleagues, communities and customers.
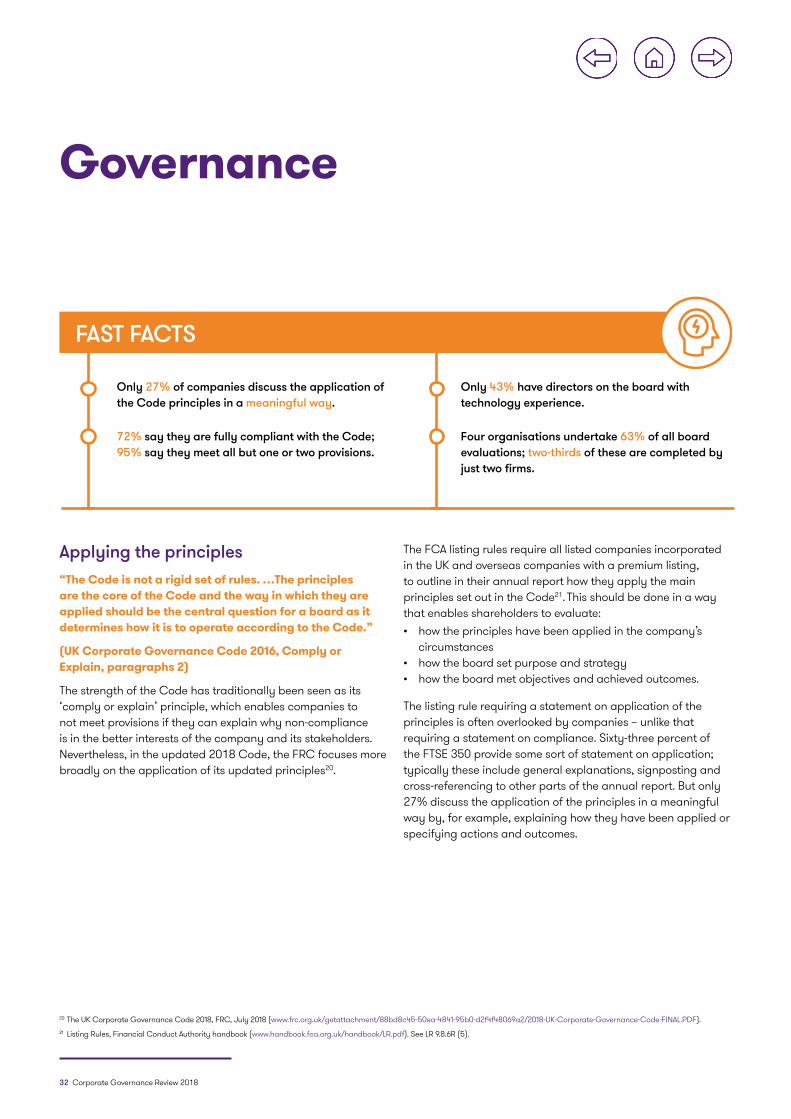
32 Corporate Governance Review 2018
Governance
Only 27% of companies discuss the application of the Code principles in a meaningful way.
72% say they are fully compliant with the Code; 95% say they meet all but one or two provisions.
Only 43% have directors on the board with technology experience.
Four organisations undertake 63% of all board evaluations; two-thirds of these are completed by just two firms.
FAST FACTS
Applying the principles“The Code is not a rigid set of rules. …The principles are the core of the Code and the way in which they are applied should be the central question for a board as it determines how it is to operate according to the Code.”
(UK Corporate Governance Code 2016, Comply or Explain, paragraphs 2)
The strength of the Code has traditionally been seen as its ‘comply or explain’ principle, which enables companies to not meet provisions if they can explain why non-compliance is in the better interests of the company and its stakeholders. Nevertheless, in the updated 2018 Code, the FRC focuses more broadly on the application of its updated principles20.
The FCA listing rules require all listed companies incorporated in the UK and overseas companies with a premium listing, to outline in their annual report how they apply the main principles set out in the Code21. This should be done in a way that enables shareholders to evaluate:• how the principles have been applied in the company’s
circumstances • how the board set purpose and strategy• how the board met objectives and achieved outcomes.
The listing rule requiring a statement on application of the principles is often overlooked by companies – unlike that requiring a statement on compliance. Sixty-three percent of the FTSE 350 provide some sort of statement on application; typically these include general explanations, signposting and cross-referencing to other parts of the annual report. But only 27% discuss the application of the principles in a meaningful way by, for example, explaining how they have been applied or specifying actions and outcomes.
20 The UK Corporate Governance Code 2018, FRC, July 2018 (www.frc.org.uk/getattachment/88bd8c45-50ea-4841-95b0-d2f4f48069a2/2018-UK-Corporate-Governance-Code-FINAL.PDF). 21 Listing Rules, Financial Conduct Authority handbook (www.handbook.fca.org.uk/handbook/LR.pdf). See LR 9.8.6R (5).
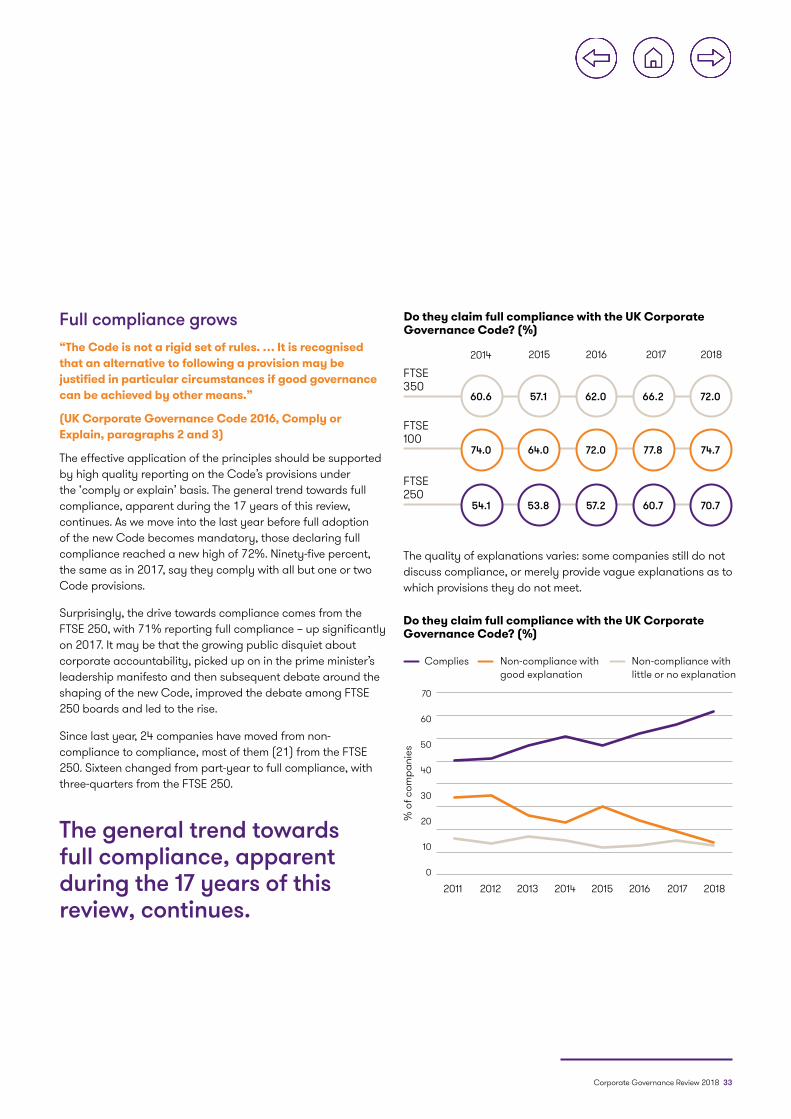
Corporate Governance Review 2018 33
Full compliance grows“The Code is not a rigid set of rules. … It is recognised that an alternative to following a provision may be justified in particular circumstances if good governance can be achieved by other means.”
(UK Corporate Governance Code 2016, Comply or Explain, paragraphs 2 and 3)
The effective application of the principles should be supported by high quality reporting on the Code’s provisions under the ‘comply or explain’ basis. The general trend towards full compliance, apparent during the 17 years of this review, continues. As we move into the last year before full adoption of the new Code becomes mandatory, those declaring full compliance reached a new high of 72%. Ninety-five percent, the same as in 2017, say they comply with all but one or two Code provisions.
Surprisingly, the drive towards compliance comes from the FTSE 250, with 71% reporting full compliance – up significantly on 2017. It may be that the growing public disquiet about corporate accountability, picked up on in the prime minister’s leadership manifesto and then subsequent debate around the shaping of the new Code, improved the debate among FTSE 250 boards and led to the rise.
Since last year, 24 companies have moved from non-compliance to compliance, most of them (21) from the FTSE 250. Sixteen changed from part-year to full compliance, with three-quarters from the FTSE 250.
Do they claim full compliance with the UK Corporate Governance Code? (%)
2014 2015 2016 2017 2018
60.6 57.1 62.0 66.2 72.0
FTSE 350
74.0 64.0 72.0 77.8 74.7
54.1 53.8 57.2 60.7 70.7
FTSE 100
FTSE 250
Do they claim full compliance with the UK Corporate Governance Code? (%)
Complies Non-compliance with good explanation
Non-compliance with little or no explanation
70
60
50
40
30
20
10
0
2011 2013 20152012 2014 2016 20182017
% o
f com
pani
es
The quality of explanations varies: some companies still do not discuss compliance, or merely provide vague explanations as to which provisions they do not meet.
The general trend towards full compliance, apparent during the 17 years of this review, continues.
34 Corporate Governance Review 2018
Reasons for non-compliance“…reasons should be explained clearly and carefully to shareholders, who may wish to discuss the position with the company and whose voting intentions may be influenced as a result.”
(UK Corporate Governance Code 2016, Comply or Explain, paragraph 3)
Directors’ independence (or lack of it) has traditionally been the main reason for non-compliance. Therefore, in the initial draft of the new Code, the regulator suggested a number of changes to board independence. Not all these draft proposals reached the final version, due to the many comments received during the consultation period22. This confirms the challenging nature of this area.
Although there was a significant reduction this year, 16 companies still declare non-compliance with the requirement (B.1.2) that at least half of a board is made up of independent non-executive directors. The requirement for the chair to be independent on appointment (A.3.1) is the second-highest area of non-compliance.
Remuneration non-compliance is still relatively high. Yet fewer companies declare non-compliance with the provision relating to remuneration committee membership criteria (D.2.1), and to that covering clawbacks and the holding periods of shares after vesting or exercise (D.1.1). In 2018, non-compliance with provision D.2.2 – which requires that the remuneration committee sets remuneration for all executives and the chair and recommends remuneration for senior management – entered the list of top 10 non-compliance areas. This is mainly because companies state that the
remuneration committee has authority to recommend – but not to approve – the remuneration of the chair. Others reported non-compliance because its remuneration committee monitors – but does not make recommendations concerning – the level and structure of remuneration for senior management. In entering the non-compliance top 10, D.2.2 replaced provision C.3.723.
Many companies do not meet certain provisions in the Code, yet fail to declare non-compliance. Thirteen per cent (2017: 14%), for instance, do not say that their non-executive directors (and senior independent director) meet without the chair at least annually to evaluate the chair’s performance, as outlined in provisions A.4.2 and B.6.3. Similarly, while the Code requires that the chair should meet with shareholders to discuss governance and strategy and that this should be recorded in the annual report, 23% (2017: 22%) of companies do not say this explicitly. Such findings, together with declarations of non-compliance, show that only 52% of FTSE 350 companies are actually fully considering the provisions of the Code.
22 Feedback Statement: Consulting on a revised UK Corporate Governance Code, FRC, July 2018 (www.frc.org.uk/getattachment/90797f4b-37a1-463e-937f-5cfb14dbdcc4/2018-UK-Corporate-Governance-Code-Feedback-Statement-July-2018.pdf).
23 Provision C.3.7 referred to the requirement that external audit contracts be put out to tender at least every 10 years; this became a legal mandate due to changes in line with the EU directive.
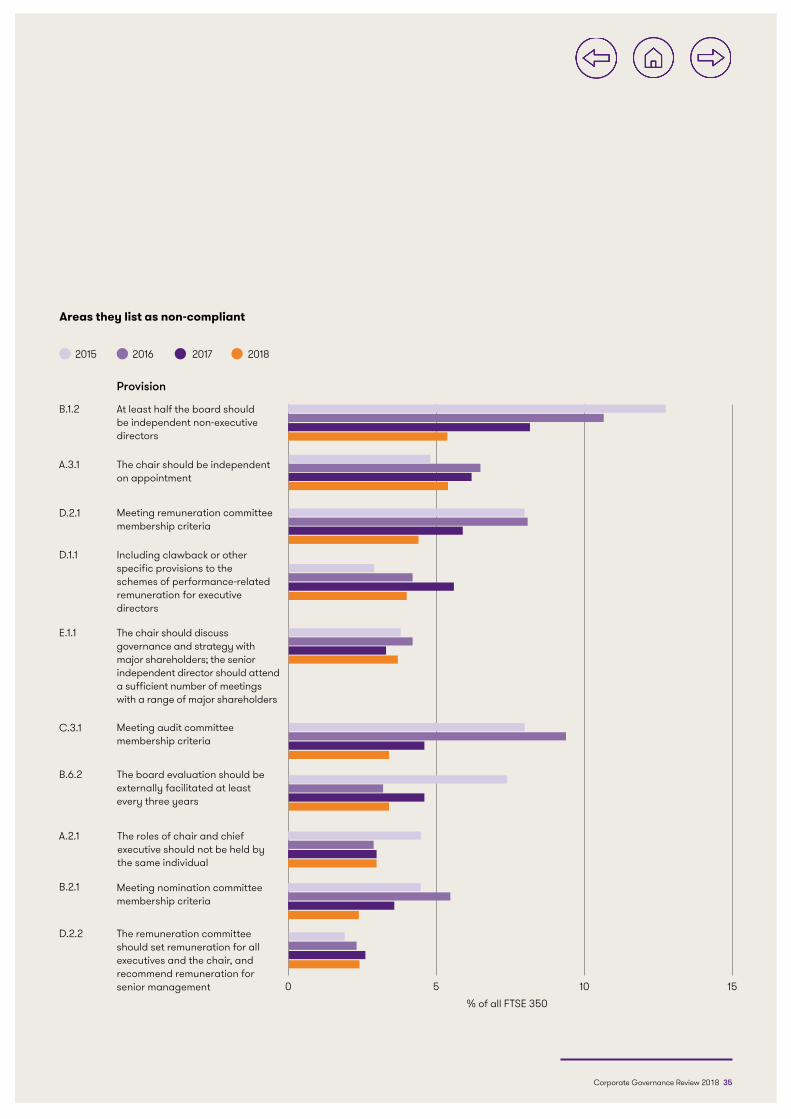
Corporate Governance Review 2018 35
Areas they list as non-compliant
2017 2018 20162015
At least half the board should be independent non-executive directors
B.1.2
Provision
A.3.1
D.2.1
D.1.1
The chair should be independent on appointment
Meeting remuneration committee membership criteria
Including clawback or other specific provisions to the schemes of performance-related remuneration for executive directors
C.3.1 Meeting audit committee membership criteria
B.6.2 The board evaluation should be externally facilitated at least every three years
B.2.1 Meeting nomination committee membership criteria
E.1.1 The chair should discuss governance and strategy with major shareholders; the senior independent director should attend a sufficient number of meetings with a range of major shareholders
A.2.1 The roles of chair and chief executive should not be held by the same individual
% of all FTSE 3500 105 15
D.2.2 The remuneration committee should set remuneration for all executives and the chair, and recommend remuneration for senior management
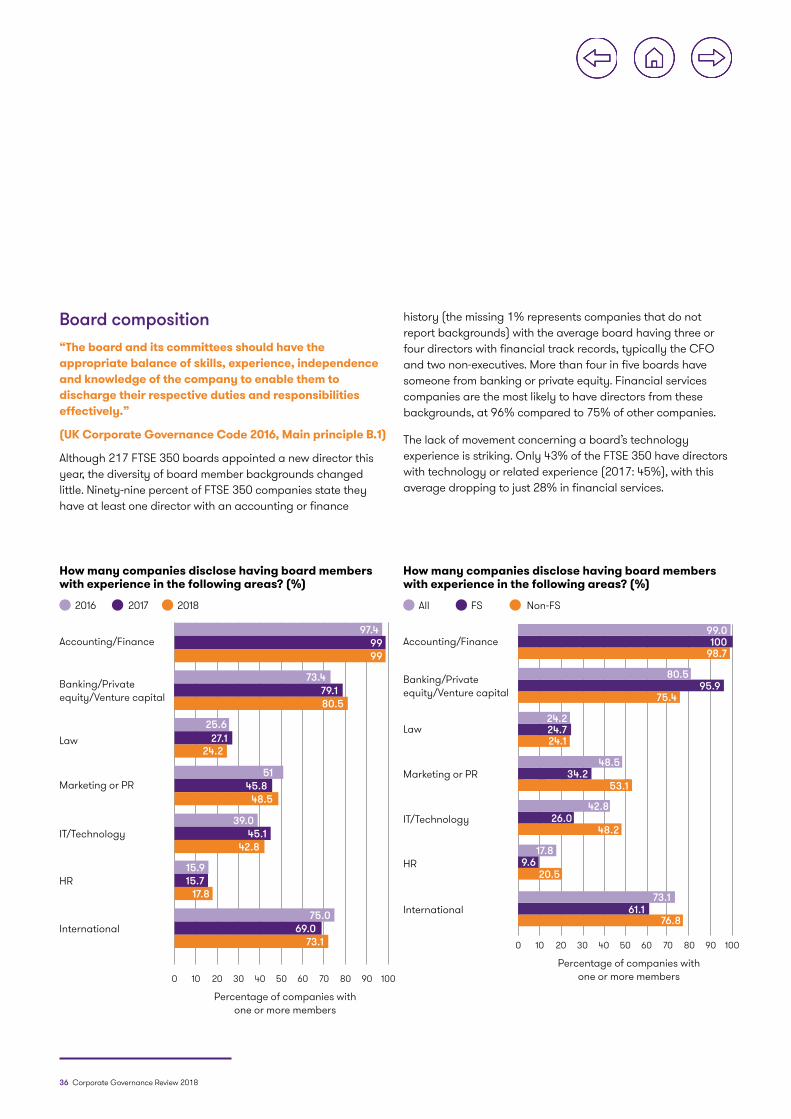
36 Corporate Governance Review 2018
Board composition“The board and its committees should have the appropriate balance of skills, experience, independence and knowledge of the company to enable them to discharge their respective duties and responsibilities effectively.”
(UK Corporate Governance Code 2016, Main principle B.1)
Although 217 FTSE 350 boards appointed a new director this year, the diversity of board member backgrounds changed little. Ninety-nine percent of FTSE 350 companies state they have at least one director with an accounting or finance
history (the missing 1% represents companies that do not report backgrounds) with the average board having three or four directors with financial track records, typically the CFO and two non-executives. More than four in five boards have someone from banking or private equity. Financial services companies are the most likely to have directors from these backgrounds, at 96% compared to 75% of other companies.
The lack of movement concerning a board’s technology experience is striking. Only 43% of the FTSE 350 have directors with technology or related experience (2017: 45%), with this average dropping to just 28% in financial services.
How many companies disclose having board members with experience in the following areas? (%)
Accounting/Finance
Banking/Private equity/Venture capital
Law
Marketing or PR
IT/Technology
International
HR
2016 2017 2018
0 10 5030 70 9020 6040 80 100
Percentage of companies with one or more members
9999
97.4
73.479.180.5
25.627.1
24.2
45.848.5
51
39.045.1
42.8
15.717.8
15.9
75.069.0
73.1
How many companies disclose having board members with experience in the following areas? (%)
Accounting/Finance
Banking/Private equity/Venture capital
Law
Marketing or PR
IT/Technology
International
HR
All FS Non-FS
0 10 5030 70 9020 6040 80 100
Percentage of companies with one or more members
99.0100
98.7
80.595.9
75.4
24.224.724.1
48.534.2
53.1
42.826.0
48.2
17.89.6
20.5
73.161.1
76.8
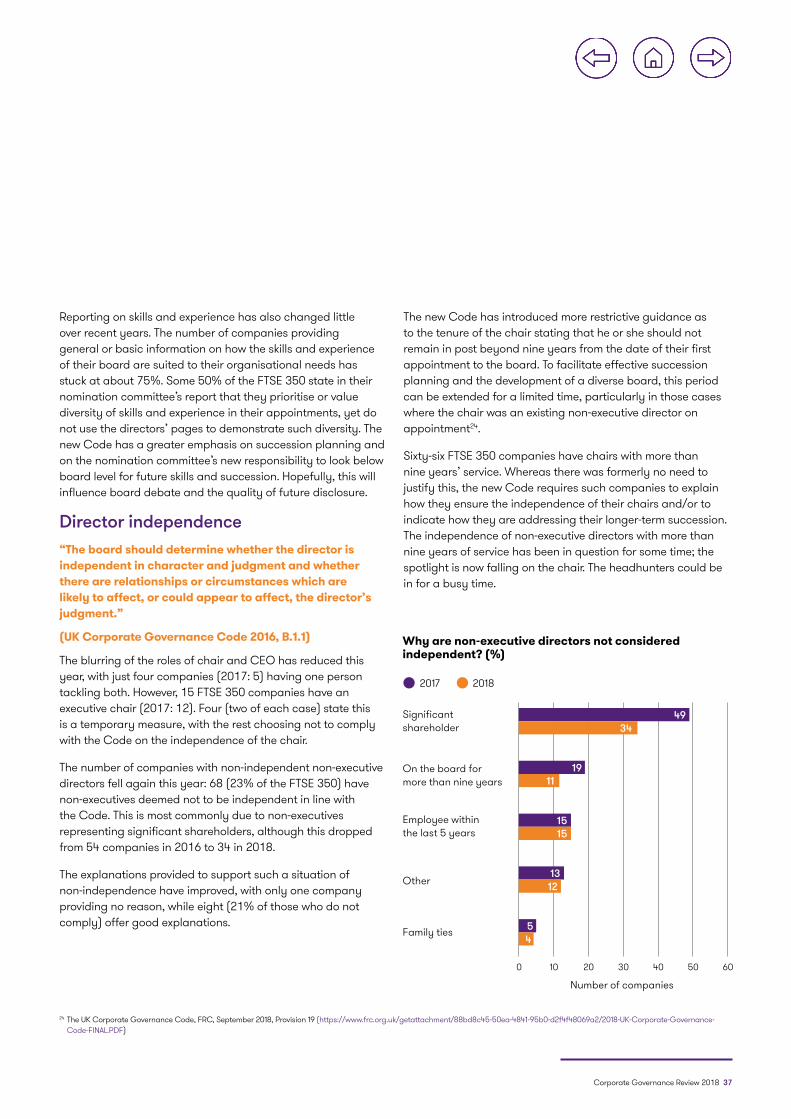
Corporate Governance Review 2018 37
Reporting on skills and experience has also changed little over recent years. The number of companies providing general or basic information on how the skills and experience of their board are suited to their organisational needs has stuck at about 75%. Some 50% of the FTSE 350 state in their nomination committee’s report that they prioritise or value diversity of skills and experience in their appointments, yet do not use the directors’ pages to demonstrate such diversity. The new Code has a greater emphasis on succession planning and on the nomination committee’s new responsibility to look below board level for future skills and succession. Hopefully, this will influence board debate and the quality of future disclosure.
Director independence“The board should determine whether the director is independent in character and judgment and whether there are relationships or circumstances which are likely to affect, or could appear to affect, the director’s judgment.”
(UK Corporate Governance Code 2016, B.1.1)
The blurring of the roles of chair and CEO has reduced this year, with just four companies (2017: 5) having one person tackling both. However, 15 FTSE 350 companies have an executive chair (2017: 12). Four (two of each case) state this is a temporary measure, with the rest choosing not to comply with the Code on the independence of the chair.
The number of companies with non-independent non-executive directors fell again this year: 68 (23% of the FTSE 350) have non-executives deemed not to be independent in line with the Code. This is most commonly due to non-executives representing significant shareholders, although this dropped from 54 companies in 2016 to 34 in 2018.
The explanations provided to support such a situation of non-independence have improved, with only one company providing no reason, while eight (21% of those who do not comply) offer good explanations.
The new Code has introduced more restrictive guidance as to the tenure of the chair stating that he or she should not remain in post beyond nine years from the date of their first appointment to the board. To facilitate effective succession planning and the development of a diverse board, this period can be extended for a limited time, particularly in those cases where the chair was an existing non-executive director on appointment24.
Sixty-six FTSE 350 companies have chairs with more than nine years’ service. Whereas there was formerly no need to justify this, the new Code requires such companies to explain how they ensure the independence of their chairs and/or to indicate how they are addressing their longer-term succession. The independence of non-executive directors with more than nine years of service has been in question for some time; the spotlight is now falling on the chair. The headhunters could be in for a busy time.
Why are non-executive directors not considered independent? (%)
0 10 503020 6040
Number of companies
Employee within the last 5 years
1515
Family ties 54
Significant shareholder
4934
On the board for more than nine years
1911
Other1312
2017 2018
24 The UK Corporate Governance Code, FRC, September 2018, Provision 19 (https://www.frc.org.uk/getattachment/88bd8c45-50ea-4841-95b0-d2f4f48069a2/2018-UK-Corporate-Governance-Code-FINAL.PDF)
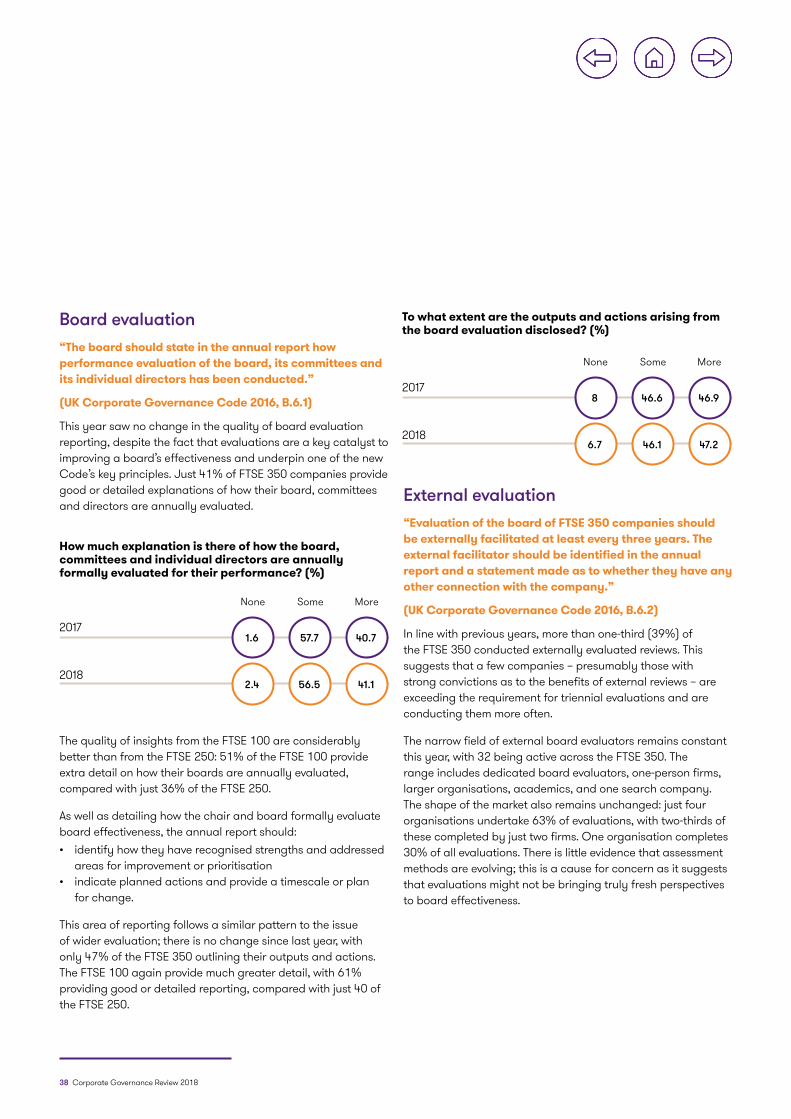
38 Corporate Governance Review 2018
Board evaluation“The board should state in the annual report how performance evaluation of the board, its committees and its individual directors has been conducted.”
(UK Corporate Governance Code 2016, B.6.1)
This year saw no change in the quality of board evaluation reporting, despite the fact that evaluations are a key catalyst to improving a board’s effectiveness and underpin one of the new Code’s key principles. Just 41% of FTSE 350 companies provide good or detailed explanations of how their board, committees and directors are annually evaluated.
The quality of insights from the FTSE 100 are considerably better than from the FTSE 250: 51% of the FTSE 100 provide extra detail on how their boards are annually evaluated, compared with just 36% of the FTSE 250.
As well as detailing how the chair and board formally evaluate board effectiveness, the annual report should:• identify how they have recognised strengths and addressed
areas for improvement or prioritisation• indicate planned actions and provide a timescale or plan
for change.
This area of reporting follows a similar pattern to the issue of wider evaluation; there is no change since last year, with only 47% of the FTSE 350 outlining their outputs and actions. The FTSE 100 again provide much greater detail, with 61% providing good or detailed reporting, compared with just 40 of the FTSE 250.
External evaluation“Evaluation of the board of FTSE 350 companies should be externally facilitated at least every three years. The external facilitator should be identified in the annual report and a statement made as to whether they have any other connection with the company.”
(UK Corporate Governance Code 2016, B.6.2)
In line with previous years, more than one-third (39%) of the FTSE 350 conducted externally evaluated reviews. This suggests that a few companies – presumably those with strong convictions as to the benefits of external reviews – are exceeding the requirement for triennial evaluations and are conducting them more often.
The narrow field of external board evaluators remains constant this year, with 32 being active across the FTSE 350. The range includes dedicated board evaluators, one-person firms, larger organisations, academics, and one search company. The shape of the market also remains unchanged: just four organisations undertake 63% of evaluations, with two-thirds of these completed by just two firms. One organisation completes 30% of all evaluations. There is little evidence that assessment methods are evolving; this is a cause for concern as it suggests that evaluations might not be bringing truly fresh perspectives to board effectiveness.
How much explanation is there of how the board, committees and individual directors are annually formally evaluated for their performance? (%)
1.6
2.4
57.7
56.5
40.7
41.1
None Some More
2017
2018
To what extent are the outputs and actions arising from the board evaluation disclosed? (%)
8
6.7
46.6
46.1
46.9
47.2
None Some More
2017
2018
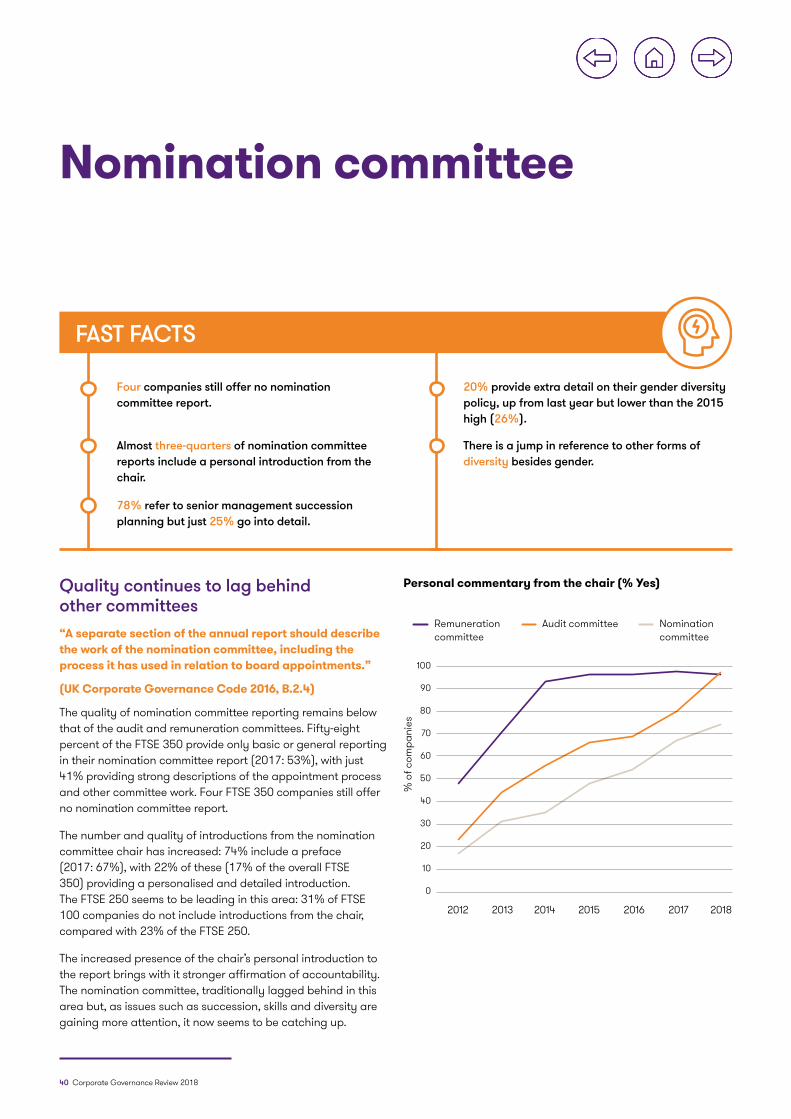
40 Corporate Governance Review 2018
Nomination committee
Four companies still offer no nomination committee report.
20% provide extra detail on their gender diversity policy, up from last year but lower than the 2015 high (26%).
Almost three-quarters of nomination committee reports include a personal introduction from the chair.
78% refer to senior management succession planning but just 25% go into detail.
There is a jump in reference to other forms of diversity besides gender.
FAST FACTS
Quality continues to lag behind other committees“A separate section of the annual report should describe the work of the nomination committee, including the process it has used in relation to board appointments.”
(UK Corporate Governance Code 2016, B.2.4)
The quality of nomination committee reporting remains below that of the audit and remuneration committees. Fifty-eight percent of the FTSE 350 provide only basic or general reporting in their nomination committee report (2017: 53%), with just 41% providing strong descriptions of the appointment process and other committee work. Four FTSE 350 companies still offer no nomination committee report.
The number and quality of introductions from the nomination committee chair has increased: 74% include a preface (2017: 67%), with 22% of these (17% of the overall FTSE 350) providing a personalised and detailed introduction. The FTSE 250 seems to be leading in this area: 31% of FTSE 100 companies do not include introductions from the chair, compared with 23% of the FTSE 250.
The increased presence of the chair’s personal introduction to the report brings with it stronger affirmation of accountability. The nomination committee, traditionally lagged behind in this area but, as issues such as succession, skills and diversity are gaining more attention, it now seems to be catching up.
Personal commentary from the chair (% Yes)
Audit committee Nomination committee
Remuneration committee
2012 2014 20162013 2015 2017 2018
% o
f com
pani
es
100
90
80
70
60
50
40
30
20
10
0
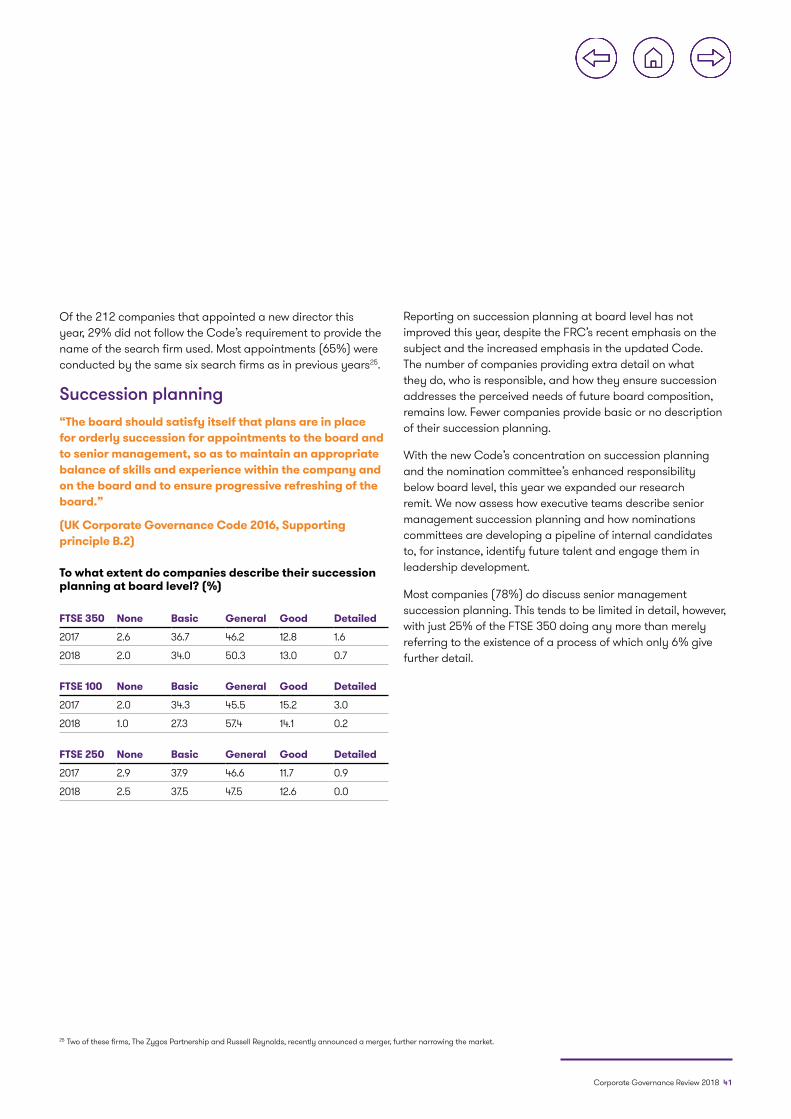
Corporate Governance Review 2018 41
Of the 212 companies that appointed a new director this year, 29% did not follow the Code’s requirement to provide the name of the search firm used. Most appointments (65%) were conducted by the same six search firms as in previous years25.
Succession planning“The board should satisfy itself that plans are in place for orderly succession for appointments to the board and to senior management, so as to maintain an appropriate balance of skills and experience within the company and on the board and to ensure progressive refreshing of the board.”
(UK Corporate Governance Code 2016, Supporting principle B.2)
25 Two of these firms, The Zygos Partnership and Russell Reynolds, recently announced a merger, further narrowing the market.
To what extent do companies describe their succession planning at board level? (%)
FTSE 350 None Basic General Good Detailed
2017 2.6 36.7 46.2 12.8 1.6
2018 2.0 34.0 50.3 13.0 0.7
FTSE 100 None Basic General Good Detailed
2017 2.0 34.3 45.5 15.2 3.0
2018 1.0 27.3 57.4 14.1 0.2
FTSE 250 None Basic General Good Detailed
2017 2.9 37.9 46.6 11.7 0.9
2018 2.5 37.5 47.5 12.6 0.0
Reporting on succession planning at board level has not improved this year, despite the FRC’s recent emphasis on the subject and the increased emphasis in the updated Code. The number of companies providing extra detail on what they do, who is responsible, and how they ensure succession addresses the perceived needs of future board composition, remains low. Fewer companies provide basic or no description of their succession planning.
With the new Code’s concentration on succession planning and the nomination committee’s enhanced responsibility below board level, this year we expanded our research remit. We now assess how executive teams describe senior management succession planning and how nominations committees are developing a pipeline of internal candidates to, for instance, identify future talent and engage them in leadership development.
Most companies (78%) do discuss senior management succession planning. This tends to be limited in detail, however, with just 25% of the FTSE 350 doing any more than merely referring to the existence of a process of which only 6% give further detail.
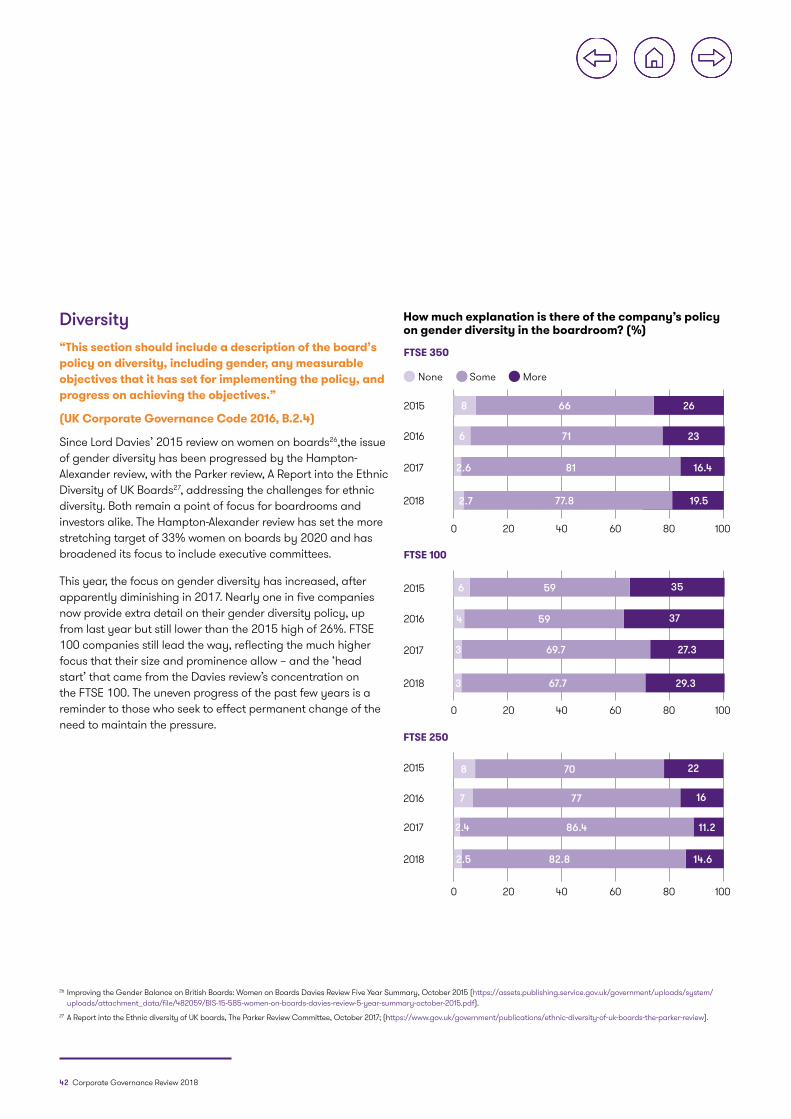
42 Corporate Governance Review 2018
0 20 40 60 80 100
2018
0 20 40 60 80 100
2017
2016
2015
2018
0 20 40 60 80 100
2017
How much explanation is there of the company’s policy on gender diversity in the boardroom? (%)
FTSE 350
None Some More
FTSE 100
FTSE 250
2.7 77.8 19.5
594 37
2016 777 16
67.7 29.33
2018 82.8 14.62.5
596 35
2015 708 22
3 69.7 27.3
2.4 86.4 11.2
2017
2016
2015
2.6 81 16.4
6 71 23
8 66 26
Diversity“This section should include a description of the board’s policy on diversity, including gender, any measurable objectives that it has set for implementing the policy, and progress on achieving the objectives.”
(UK Corporate Governance Code 2016, B.2.4)
Since Lord Davies’ 2015 review on women on boards26,the issue of gender diversity has been progressed by the Hampton-Alexander review, with the Parker review, A Report into the Ethnic Diversity of UK Boards27, addressing the challenges for ethnic diversity. Both remain a point of focus for boardrooms and investors alike. The Hampton-Alexander review has set the more stretching target of 33% women on boards by 2020 and has broadened its focus to include executive committees.
This year, the focus on gender diversity has increased, after apparently diminishing in 2017. Nearly one in five companies now provide extra detail on their gender diversity policy, up from last year but still lower than the 2015 high of 26%. FTSE 100 companies still lead the way, reflecting the much higher focus that their size and prominence allow – and the ‘head start’ that came from the Davies review’s concentration on the FTSE 100. The uneven progress of the past few years is a reminder to those who seek to effect permanent change of the need to maintain the pressure.
26 Improving the Gender Balance on British Boards: Women on Boards Davies Review Five Year Summary, October 2015 (https://assets.publishing.service.gov.uk/government/uploads/system/uploads/attachment_data/file/482059/BIS-15-585-women-on-boards-davies-review-5-year-summary-october-2015.pdf).
27 A Report into the Ethnic diversity of UK boards, The Parker Review Committee, October 2017; (https://www.gov.uk/government/publications/ethnic-diversity-of-uk-boards-the-parker-review).
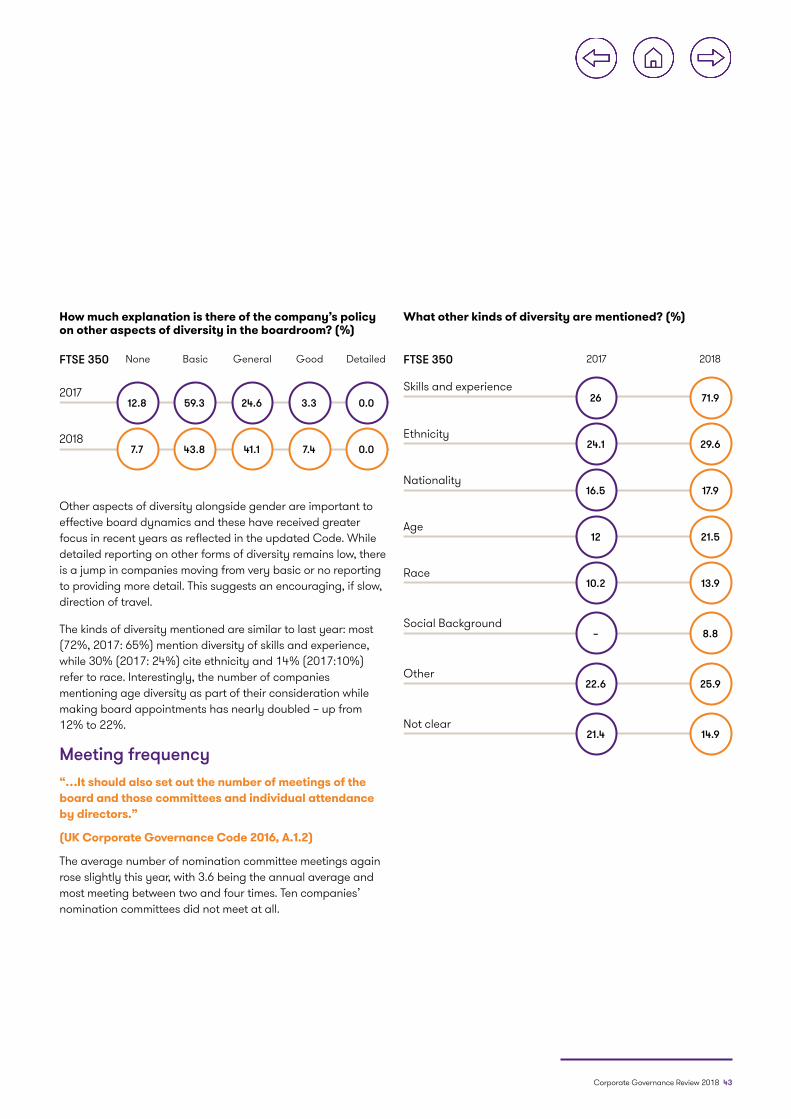
Corporate Governance Review 2018 43
How much explanation is there of the company’s policy on other aspects of diversity in the boardroom? (%)
None Basic DetailedGoodGeneral
12.8 59.3 24.6 3.3 0.02017
7.7 43.8 41.1 7.4 0.02018
FTSE 350
Other aspects of diversity alongside gender are important to effective board dynamics and these have received greater focus in recent years as reflected in the updated Code. While detailed reporting on other forms of diversity remains low, there is a jump in companies moving from very basic or no reporting to providing more detail. This suggests an encouraging, if slow, direction of travel.
The kinds of diversity mentioned are similar to last year: most (72%, 2017: 65%) mention diversity of skills and experience, while 30% (2017: 24%) cite ethnicity and 14% (2017:10%) refer to race. Interestingly, the number of companies mentioning age diversity as part of their consideration while making board appointments has nearly doubled – up from 12% to 22%.
Meeting frequency“…It should also set out the number of meetings of the board and those committees and individual attendance by directors.”
(UK Corporate Governance Code 2016, A.1.2)
The average number of nomination committee meetings again rose slightly this year, with 3.6 being the annual average and most meeting between two and four times. Ten companies’ nomination committees did not meet at all.
What other kinds of diversity are mentioned? (%)
20182017
24.1 29.6Ethnicity
16.5 17.9Nationality
12 21.5Age
10.2 13.9Race
– 8.8Social Background
22.6 25.9Other
21.4 14.9Not clear
26 71.9Skills and experience
FTSE 350
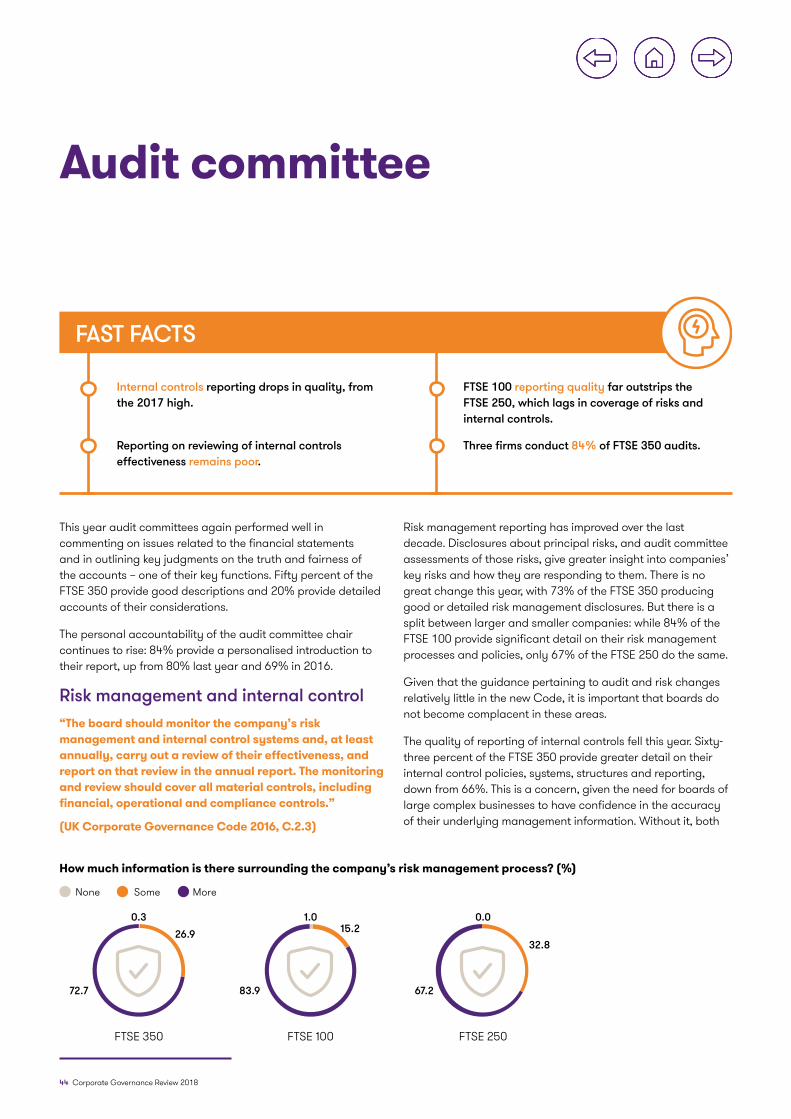
44 Corporate Governance Review 2018
Audit committee
Internal controls reporting drops in quality, from the 2017 high.
FTSE 100 reporting quality far outstrips the FTSE 250, which lags in coverage of risks and internal controls.
Reporting on reviewing of internal controls effectiveness remains poor.
Three firms conduct 84% of FTSE 350 audits.
FAST FACTS
This year audit committees again performed well in commenting on issues related to the financial statements and in outlining key judgments on the truth and fairness of the accounts – one of their key functions. Fifty percent of the FTSE 350 provide good descriptions and 20% provide detailed accounts of their considerations.
The personal accountability of the audit committee chair continues to rise: 84% provide a personalised introduction to their report, up from 80% last year and 69% in 2016.
Risk management and internal control“The board should monitor the company’s risk management and internal control systems and, at least annually, carry out a review of their effectiveness, and report on that review in the annual report. The monitoring and review should cover all material controls, including financial, operational and compliance controls.”
(UK Corporate Governance Code 2016, C.2.3)
Risk management reporting has improved over the last decade. Disclosures about principal risks, and audit committee assessments of those risks, give greater insight into companies’ key risks and how they are responding to them. There is no great change this year, with 73% of the FTSE 350 producing good or detailed risk management disclosures. But there is a split between larger and smaller companies: while 84% of the FTSE 100 provide significant detail on their risk management processes and policies, only 67% of the FTSE 250 do the same.
Given that the guidance pertaining to audit and risk changes relatively little in the new Code, it is important that boards do not become complacent in these areas.
The quality of reporting of internal controls fell this year. Sixty-three percent of the FTSE 350 provide greater detail on their internal control policies, systems, structures and reporting, down from 66%. This is a concern, given the need for boards of large complex businesses to have confidence in the accuracy of their underlying management information. Without it, both
How much information is there surrounding the company’s risk management process? (%)
MoreSomeNone
FTSE 350
26.9
72.7
0.3
FTSE 100
83.9
15.21.0
FTSE 250
67.2
32.8
0.0
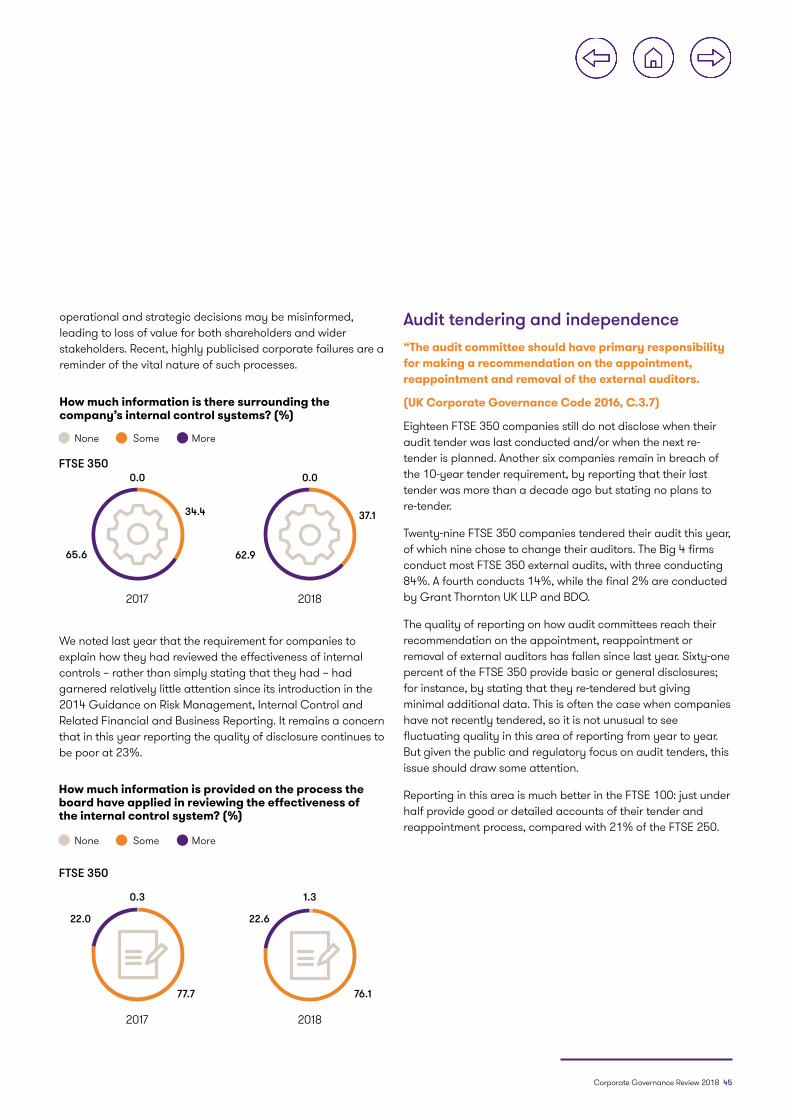
Corporate Governance Review 2018 45
How much information is there surrounding the company’s internal control systems? (%)
How much information is provided on the process the board have applied in reviewing the effectiveness of the internal control system? (%)
We noted last year that the requirement for companies to explain how they had reviewed the effectiveness of internal controls – rather than simply stating that they had – had garnered relatively little attention since its introduction in the 2014 Guidance on Risk Management, Internal Control and Related Financial and Business Reporting. It remains a concern that in this year reporting the quality of disclosure continues to be poor at 23%.
Audit tendering and independence“The audit committee should have primary responsibility for making a recommendation on the appointment, reappointment and removal of the external auditors.
(UK Corporate Governance Code 2016, C.3.7)
Eighteen FTSE 350 companies still do not disclose when their audit tender was last conducted and/or when the next re-tender is planned. Another six companies remain in breach of the 10-year tender requirement, by reporting that their last tender was more than a decade ago but stating no plans to re-tender.
Twenty-nine FTSE 350 companies tendered their audit this year, of which nine chose to change their auditors. The Big 4 firms conduct most FTSE 350 external audits, with three conducting 84%. A fourth conducts 14%, while the final 2% are conducted by Grant Thornton UK LLP and BDO.
The quality of reporting on how audit committees reach their recommendation on the appointment, reappointment or removal of external auditors has fallen since last year. Sixty-one percent of the FTSE 350 provide basic or general disclosures; for instance, by stating that they re-tendered but giving minimal additional data. This is often the case when companies have not recently tendered, so it is not unusual to see fluctuating quality in this area of reporting from year to year. But given the public and regulatory focus on audit tenders, this issue should draw some attention.
Reporting in this area is much better in the FTSE 100: just under half provide good or detailed accounts of their tender and reappointment process, compared with 21% of the FTSE 250.
MoreSomeNone
MoreSomeNone
FTSE 350
FTSE 350
2017
2017
2018
2018
34.4
77.7
65.6
22.0
62.9
22.6
0.0
0.3
0.0
1.3
37.1
76.1
operational and strategic decisions may be misinformed, leading to loss of value for both shareholders and wider stakeholders. Recent, highly publicised corporate failures are a reminder of the vital nature of such processes.
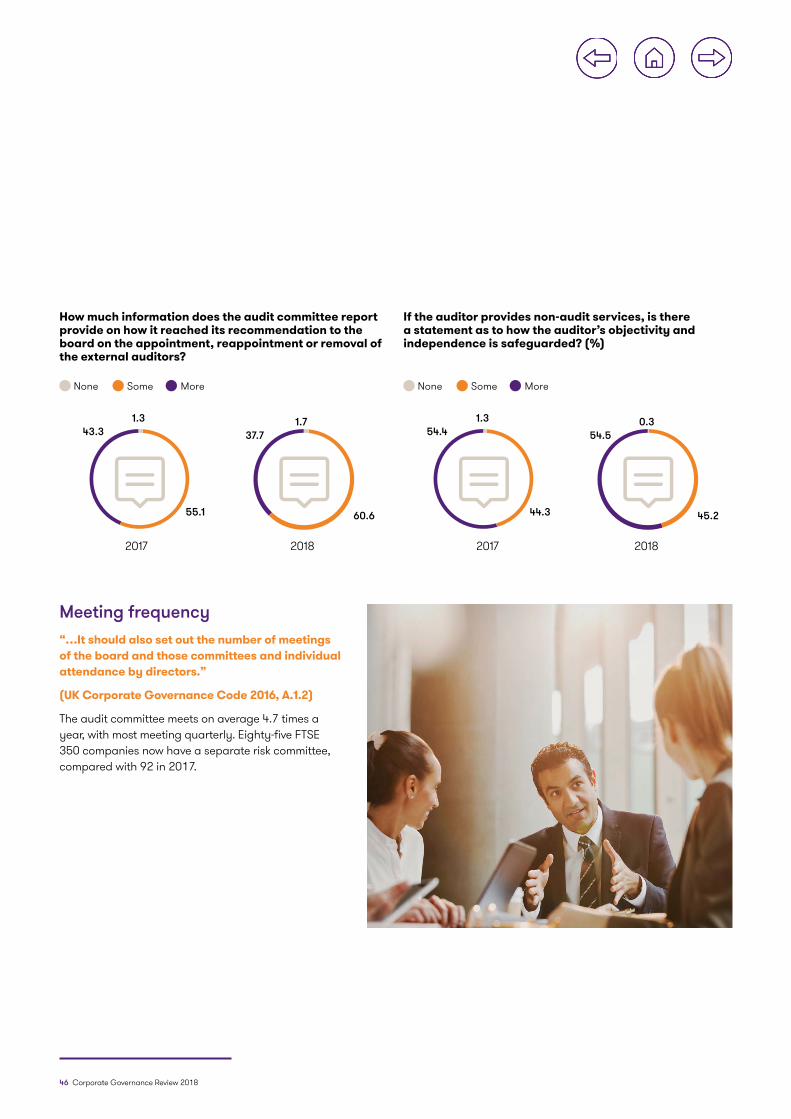
46 Corporate Governance Review 2018
How much information does the audit committee report provide on how it reached its recommendation to the board on the appointment, reappointment or removal of the external auditors?
MoreSomeNone
60.6
37.71.7
2018
55.1
43.31.3
2017
If the auditor provides non-audit services, is there a statement as to how the auditor’s objectivity and independence is safeguarded? (%)
MoreSomeNone
45.2
54.50.3
2018
44.3
54.41.3
2017
Meeting frequency“…It should also set out the number of meetings of the board and those committees and individual attendance by directors.”
(UK Corporate Governance Code 2016, A.1.2)
The audit committee meets on average 4.7 times a year, with most meeting quarterly. Eighty-five FTSE 350 companies now have a separate risk committee, compared with 92 in 2017.
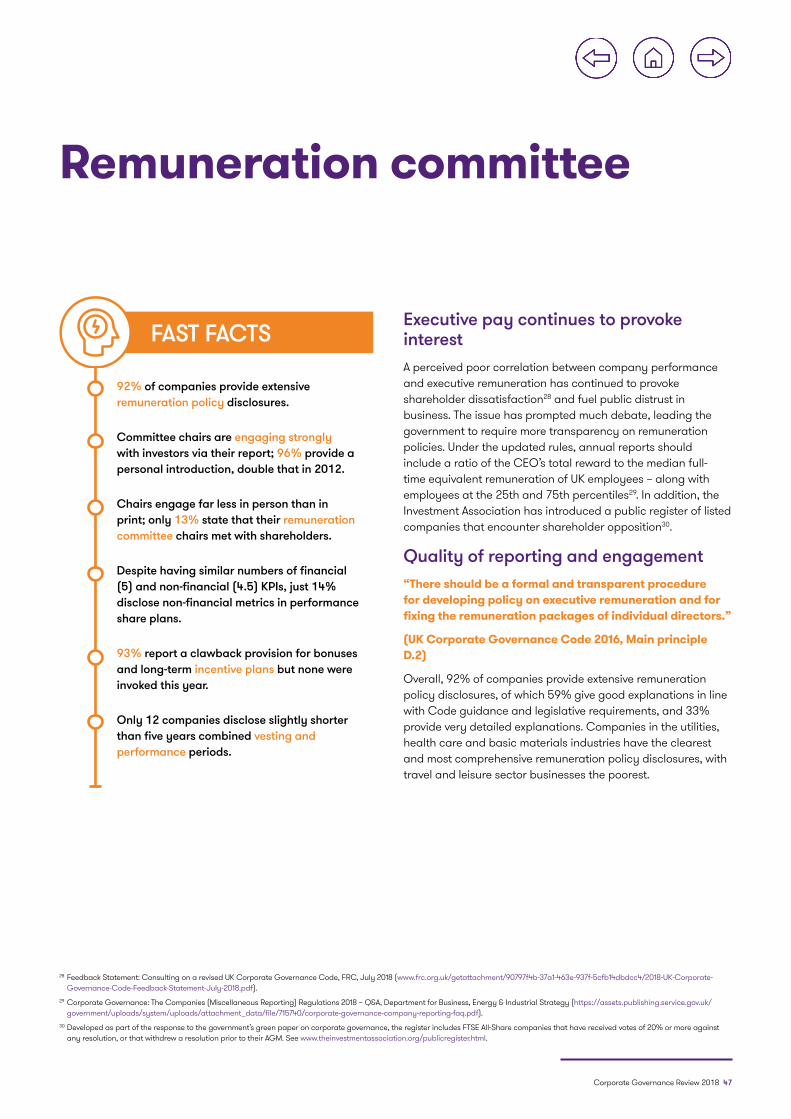
Corporate Governance Review 2018 47
Remuneration committee
FAST FACTS
92% of companies provide extensive remuneration policy disclosures.
Committee chairs are engaging strongly with investors via their report; 96% provide a personal introduction, double that in 2012.
Chairs engage far less in person than in print; only 13% state that their remuneration committee chairs met with shareholders.
Despite having similar numbers of financial (5) and non-financial (4.5) KPIs, just 14% disclose non-financial metrics in performance share plans.
93% report a clawback provision for bonuses and long-term incentive plans but none were invoked this year.
Only 12 companies disclose slightly shorter than five years combined vesting and performance periods.
Executive pay continues to provoke interestA perceived poor correlation between company performance and executive remuneration has continued to provoke shareholder dissatisfaction28 and fuel public distrust in business. The issue has prompted much debate, leading the government to require more transparency on remuneration policies. Under the updated rules, annual reports should include a ratio of the CEO’s total reward to the median full-time equivalent remuneration of UK employees – along with employees at the 25th and 75th percentiles29. In addition, the Investment Association has introduced a public register of listed companies that encounter shareholder opposition30.
Quality of reporting and engagement “There should be a formal and transparent procedure for developing policy on executive remuneration and for fixing the remuneration packages of individual directors.”
(UK Corporate Governance Code 2016, Main principle D.2)
Overall, 92% of companies provide extensive remuneration policy disclosures, of which 59% give good explanations in line with Code guidance and legislative requirements, and 33% provide very detailed explanations. Companies in the utilities, health care and basic materials industries have the clearest and most comprehensive remuneration policy disclosures, with travel and leisure sector businesses the poorest.
28 Feedback Statement: Consulting on a revised UK Corporate Governance Code, FRC, July 2018 (www.frc.org.uk/getattachment/90797f4b-37a1-463e-937f-5cfb14dbdcc4/2018-UK-Corporate-Governance-Code-Feedback-Statement-July-2018.pdf).
29 Corporate Governance: The Companies (Miscellaneous Reporting) Regulations 2018 – Q&A, Department for Business, Energy & Industrial Strategy (https://assets.publishing.service.gov.uk/government/uploads/system/uploads/attachment_data/file/715740/corporate-governance-company-reporting-faq.pdf).
30 Developed as part of the response to the government’s green paper on corporate governance, the register includes FTSE All-Share companies that have received votes of 20% or more against any resolution, or that withdrew a resolution prior to their AGM. See www.theinvestmentassociation.org/publicregister.html.
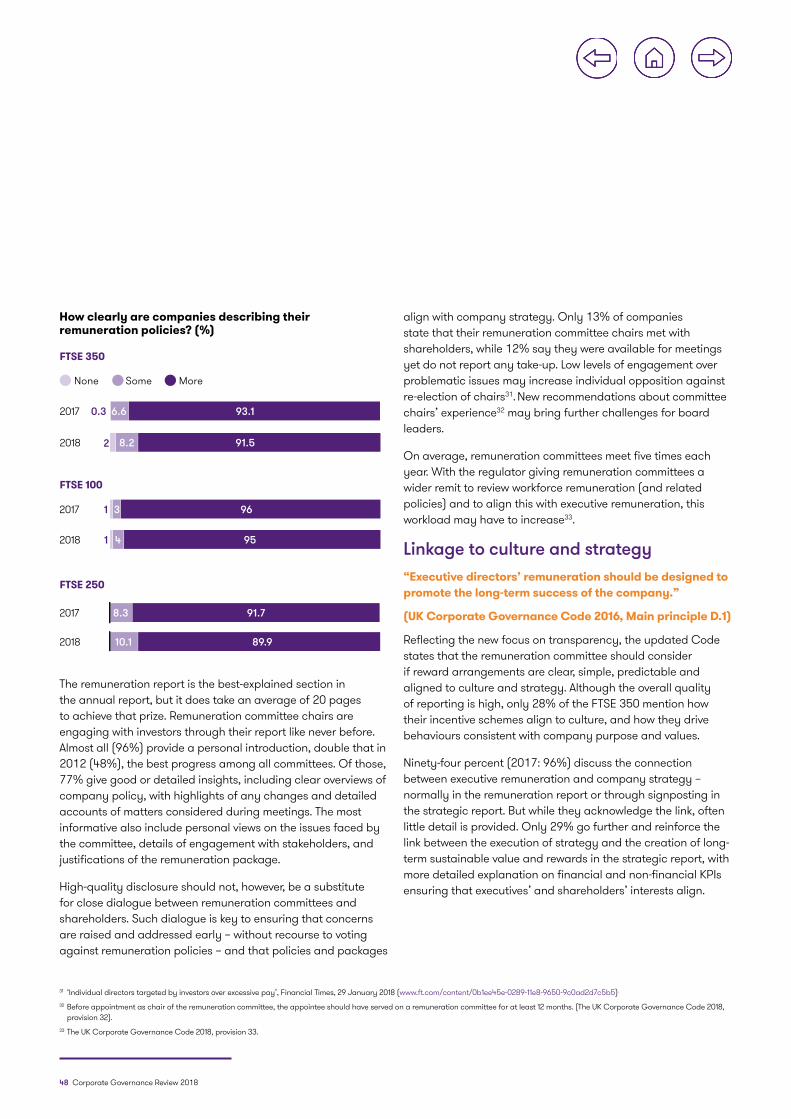
48 Corporate Governance Review 2018
How clearly are companies describing their remuneration policies? (%)
FTSE 350
FTSE 100
FTSE 250
None Some More
2017 0.3 93.16.6
2018 2 91.58.2
2017 8.3 91.7
2018 89.910.1
12017 3 96
2018 951 4
The remuneration report is the best-explained section in the annual report, but it does take an average of 20 pages to achieve that prize. Remuneration committee chairs are engaging with investors through their report like never before. Almost all (96%) provide a personal introduction, double that in 2012 (48%), the best progress among all committees. Of those, 77% give good or detailed insights, including clear overviews of company policy, with highlights of any changes and detailed accounts of matters considered during meetings. The most informative also include personal views on the issues faced by the committee, details of engagement with stakeholders, and justifications of the remuneration package.
High-quality disclosure should not, however, be a substitute for close dialogue between remuneration committees and shareholders. Such dialogue is key to ensuring that concerns are raised and addressed early – without recourse to voting against remuneration policies – and that policies and packages
align with company strategy. Only 13% of companies state that their remuneration committee chairs met with shareholders, while 12% say they were available for meetings yet do not report any take-up. Low levels of engagement over problematic issues may increase individual opposition against re-election of chairs31. New recommendations about committee chairs’ experience32 may bring further challenges for board leaders.
On average, remuneration committees meet five times each year. With the regulator giving remuneration committees a wider remit to review workforce remuneration (and related policies) and to align this with executive remuneration, this workload may have to increase33.
Linkage to culture and strategy“Executive directors’ remuneration should be designed to promote the long-term success of the company.”
(UK Corporate Governance Code 2016, Main principle D.1)
Reflecting the new focus on transparency, the updated Code states that the remuneration committee should consider if reward arrangements are clear, simple, predictable and aligned to culture and strategy. Although the overall quality of reporting is high, only 28% of the FTSE 350 mention how their incentive schemes align to culture, and how they drive behaviours consistent with company purpose and values.
Ninety-four percent (2017: 96%) discuss the connection between executive remuneration and company strategy – normally in the remuneration report or through signposting in the strategic report. But while they acknowledge the link, often little detail is provided. Only 29% go further and reinforce the link between the execution of strategy and the creation of long-term sustainable value and rewards in the strategic report, with more detailed explanation on financial and non-financial KPIs ensuring that executives’ and shareholders’ interests align.
31 ‘Individual directors targeted by investors over excessive pay’, Financial Times, 29 January 2018 (www.ft.com/content/0b1ee45e-0289-11e8-9650-9c0ad2d7c5b5).
32 Before appointment as chair of the remuneration committee, the appointee should have served on a remuneration committee for at least 12 months. (The UK Corporate Governance Code 2018, provision 32).
33 The UK Corporate Governance Code 2018, provision 33.
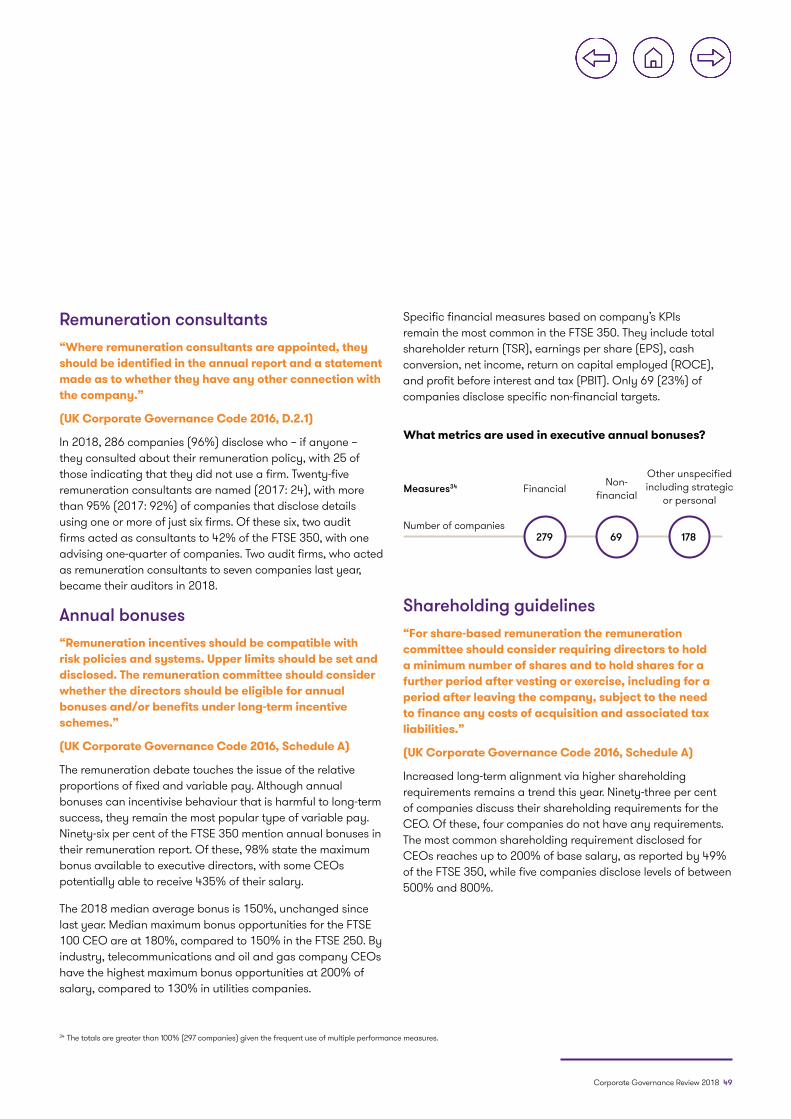
Corporate Governance Review 2018 49
34 The totals are greater than 100% (297 companies) given the frequent use of multiple performance measures.
Remuneration consultants“Where remuneration consultants are appointed, they should be identified in the annual report and a statement made as to whether they have any other connection with the company.”
(UK Corporate Governance Code 2016, D.2.1)
In 2018, 286 companies (96%) disclose who – if anyone – they consulted about their remuneration policy, with 25 of those indicating that they did not use a firm. Twenty-five remuneration consultants are named (2017: 24), with more than 95% (2017: 92%) of companies that disclose details using one or more of just six firms. Of these six, two audit firms acted as consultants to 42% of the FTSE 350, with one advising one-quarter of companies. Two audit firms, who acted as remuneration consultants to seven companies last year, became their auditors in 2018.
Annual bonuses“Remuneration incentives should be compatible with risk policies and systems. Upper limits should be set and disclosed. The remuneration committee should consider whether the directors should be eligible for annual bonuses and/or benefits under long-term incentive schemes.”
(UK Corporate Governance Code 2016, Schedule A)
The remuneration debate touches the issue of the relative proportions of fixed and variable pay. Although annual bonuses can incentivise behaviour that is harmful to long-term success, they remain the most popular type of variable pay. Ninety-six per cent of the FTSE 350 mention annual bonuses in their remuneration report. Of these, 98% state the maximum bonus available to executive directors, with some CEOs potentially able to receive 435% of their salary.
The 2018 median average bonus is 150%, unchanged since last year. Median maximum bonus opportunities for the FTSE 100 CEO are at 180%, compared to 150% in the FTSE 250. By industry, telecommunications and oil and gas company CEOs have the highest maximum bonus opportunities at 200% of salary, compared to 130% in utilities companies.
Specific financial measures based on company’s KPIs remain the most common in the FTSE 350. They include total shareholder return (TSR), earnings per share (EPS), cash conversion, net income, return on capital employed (ROCE), and profit before interest and tax (PBIT). Only 69 (23%) of companies disclose specific non-financial targets.
Shareholding guidelines “For share-based remuneration the remuneration committee should consider requiring directors to hold a minimum number of shares and to hold shares for a further period after vesting or exercise, including for a period after leaving the company, subject to the need to finance any costs of acquisition and associated tax liabilities.”
(UK Corporate Governance Code 2016, Schedule A)
Increased long-term alignment via higher shareholding requirements remains a trend this year. Ninety-three per cent of companies discuss their shareholding requirements for the CEO. Of these, four companies do not have any requirements. The most common shareholding requirement disclosed for CEOs reaches up to 200% of base salary, as reported by 49% of the FTSE 350, while five companies disclose levels of between 500% and 800%.
What metrics are used in executive annual bonuses?
17869279
Measures34 Financial Non-financial
Other unspecified including strategic
or personal
Number of companies
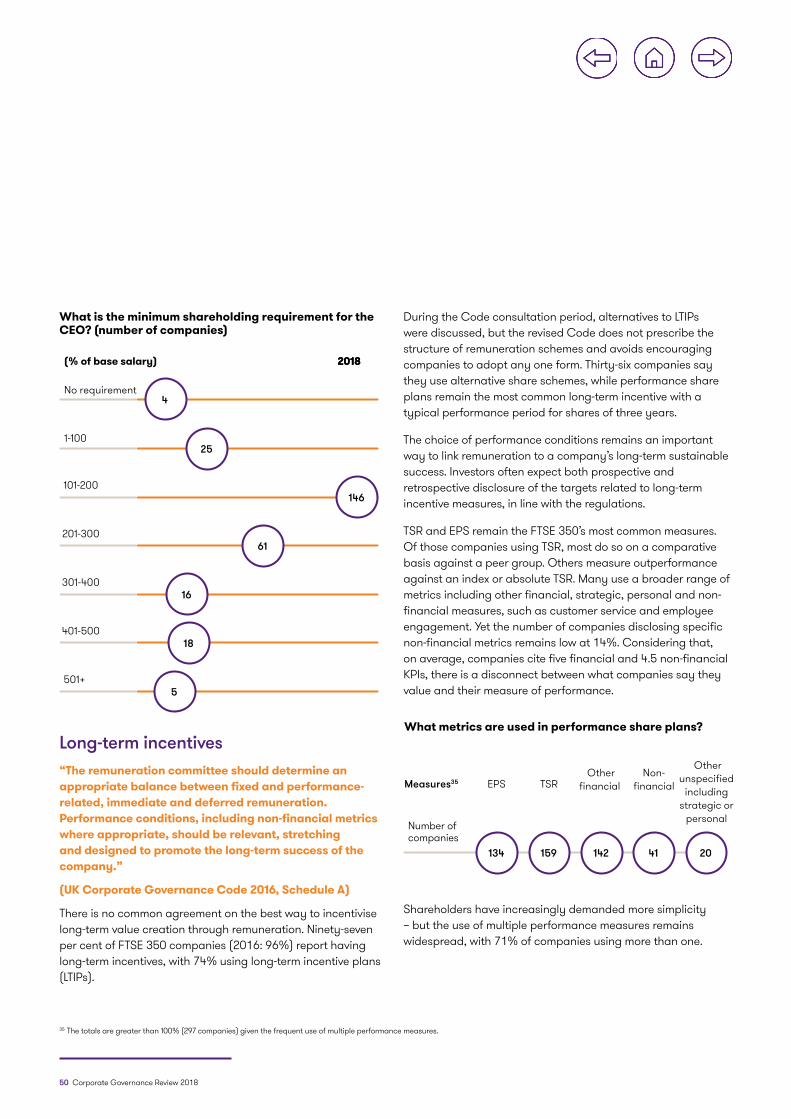
50 Corporate Governance Review 2018
What is the minimum shareholding requirement for the CEO? (number of companies)
4
25
146
61
16
18
5
No requirement
1-100
101-200
201-300
301-400
401-500
501+
20182018(% of base salary)
Long-term incentives “The remuneration committee should determine an appropriate balance between fixed and performance-related, immediate and deferred remuneration. Performance conditions, including non-financial metrics where appropriate, should be relevant, stretching and designed to promote the long-term success of the company.”
(UK Corporate Governance Code 2016, Schedule A)
There is no common agreement on the best way to incentivise long-term value creation through remuneration. Ninety-seven per cent of FTSE 350 companies (2016: 96%) report having long-term incentives, with 74% using long-term incentive plans (LTIPs).
During the Code consultation period, alternatives to LTIPs were discussed, but the revised Code does not prescribe the structure of remuneration schemes and avoids encouraging companies to adopt any one form. Thirty-six companies say they use alternative share schemes, while performance share plans remain the most common long-term incentive with a typical performance period for shares of three years.
The choice of performance conditions remains an important way to link remuneration to a company’s long-term sustainable success. Investors often expect both prospective and retrospective disclosure of the targets related to long-term incentive measures, in line with the regulations.
TSR and EPS remain the FTSE 350’s most common measures. Of those companies using TSR, most do so on a comparative basis against a peer group. Others measure outperformance against an index or absolute TSR. Many use a broader range of metrics including other financial, strategic, personal and non-financial measures, such as customer service and employee engagement. Yet the number of companies disclosing specific non-financial metrics remains low at 14%. Considering that, on average, companies cite five financial and 4.5 non-financial KPIs, there is a disconnect between what companies say they value and their measure of performance.
Shareholders have increasingly demanded more simplicity – but the use of multiple performance measures remains widespread, with 71% of companies using more than one.
What metrics are used in performance share plans?
142159134
Measures35 EPS TSR Other
financial
Number of companies
41 20
Non-financial
Other unspecified
including strategic or
personal
35 The totals are greater than 100% (297 companies) given the frequent use of multiple performance measures.
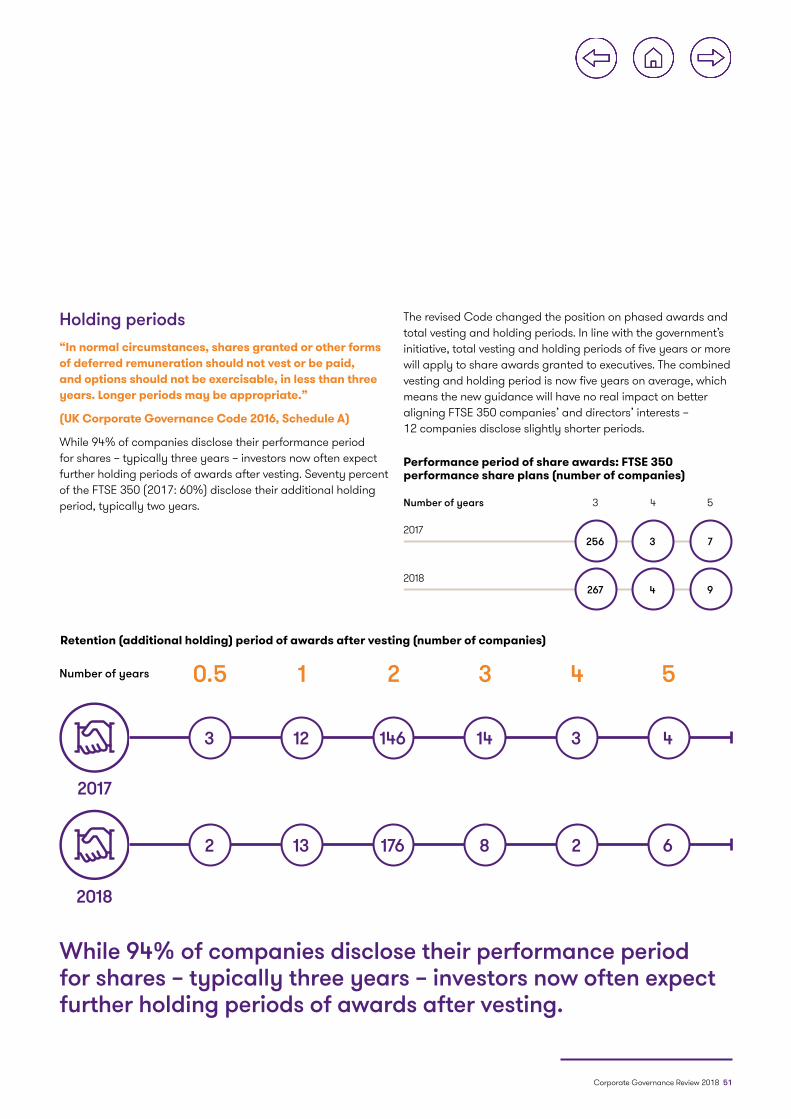
Corporate Governance Review 2018 51
Performance period of share awards: FTSE 350 performance share plans (number of companies)
7
9
3
4
256
267
Number of years 3 4 5
2017
2018
Holding periods“In normal circumstances, shares granted or other forms of deferred remuneration should not vest or be paid, and options should not be exercisable, in less than three years. Longer periods may be appropriate.”
(UK Corporate Governance Code 2016, Schedule A)
While 94% of companies disclose their performance period for shares – typically three years – investors now often expect further holding periods of awards after vesting. Seventy percent of the FTSE 350 (2017: 60%) disclose their additional holding period, typically two years.
Retention (additional holding) period of awards after vesting (number of companies)
0.5Number of years 1 2 3 4 5
14
8
4
6
146
176
3
2
12
13
3
2
2018
2017
While 94% of companies disclose their performance period for shares – typically three years – investors now often expect further holding periods of awards after vesting.
The revised Code changed the position on phased awards and total vesting and holding periods. In line with the government’s initiative, total vesting and holding periods of five years or more will apply to share awards granted to executives. The combined vesting and holding period is now five years on average, which means the new guidance will have no real impact on better aligning FTSE 350 companies’ and directors’ interests – 12 companies disclose slightly shorter periods.
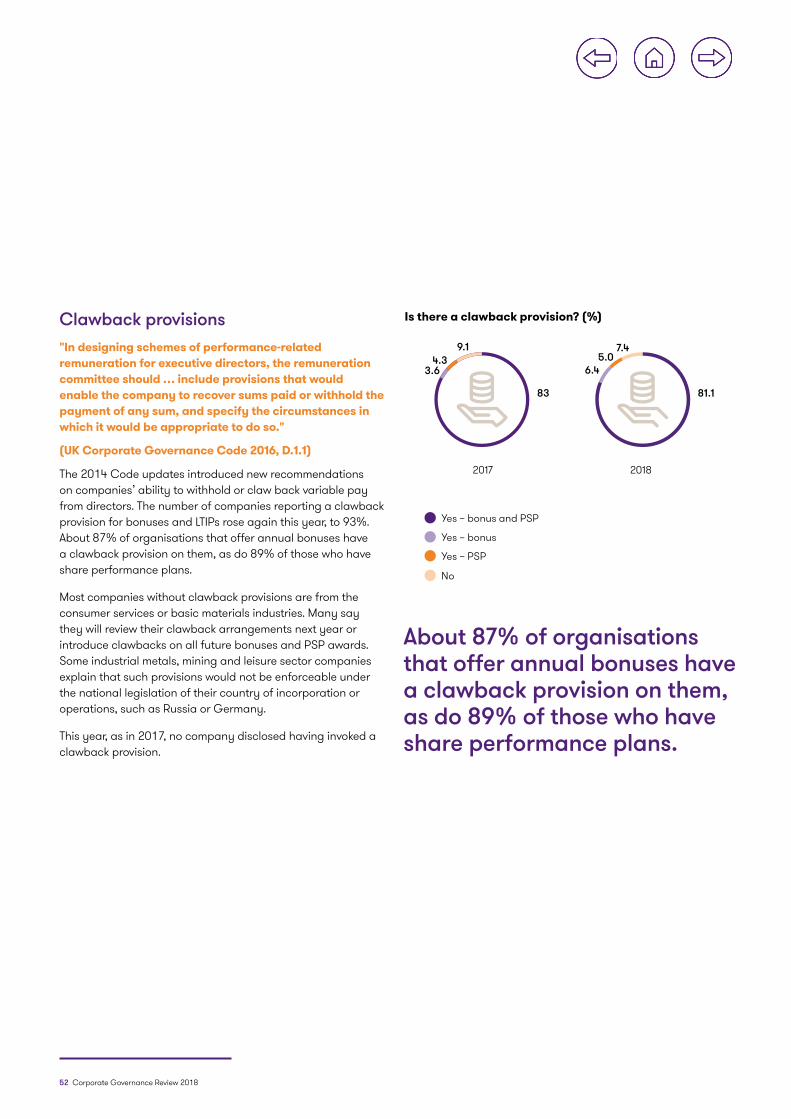
52 Corporate Governance Review 2018
Clawback provisions"In designing schemes of performance-related remuneration for executive directors, the remuneration committee should … include provisions that would enable the company to recover sums paid or withhold the payment of any sum, and specify the circumstances in which it would be appropriate to do so."
(UK Corporate Governance Code 2016, D.1.1)
The 2014 Code updates introduced new recommendations on companies’ ability to withhold or claw back variable pay from directors. The number of companies reporting a clawback provision for bonuses and LTIPs rose again this year, to 93%. About 87% of organisations that offer annual bonuses have a clawback provision on them, as do 89% of those who have share performance plans.
Most companies without clawback provisions are from the consumer services or basic materials industries. Many say they will review their clawback arrangements next year or introduce clawbacks on all future bonuses and PSP awards. Some industrial metals, mining and leisure sector companies explain that such provisions would not be enforceable under the national legislation of their country of incorporation or operations, such as Russia or Germany.
This year, as in 2017, no company disclosed having invoked a clawback provision.
Is there a clawback provision? (%)
Yes – bonus and PSP
Yes – bonus
Yes – PSP
No
83 81.1
6.45.0
7.4
3.64.3
9.1
2017 2018
About 87% of organisations that offer annual bonuses have a clawback provision on them, as do 89% of those who have share performance plans.

54 Corporate Governance Review 2018
This year’s research revealed both encouraging and frustrating trends.
The frustration lay in evidence that companies were stalling in areas where they had previously improved, for example, in providing better explanations and accountability.
This may have been due to them holding back on further innovation until the provisions of the new Code became clear. If so, they need wait no longer.
Navigating the new Code: steps to better governance
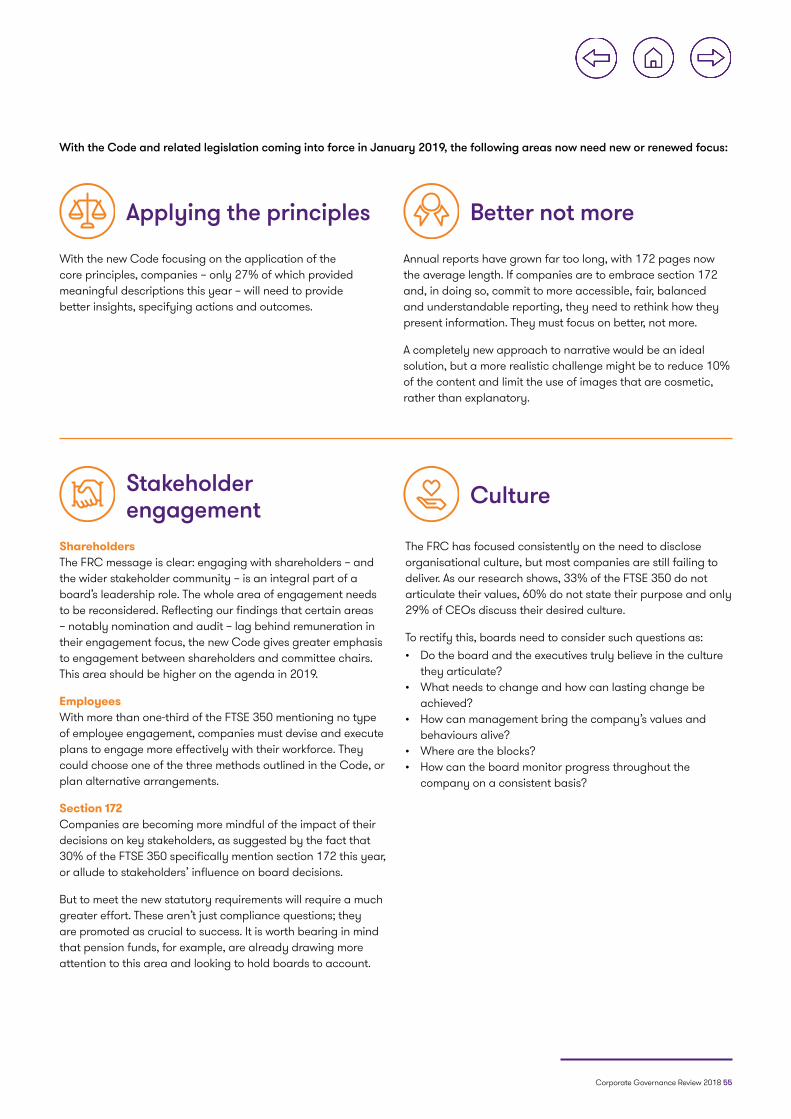
Corporate Governance Review 2018 55
Shareholders The FRC message is clear: engaging with shareholders – and the wider stakeholder community – is an integral part of a board’s leadership role. The whole area of engagement needs to be reconsidered. Reflecting our findings that certain areas – notably nomination and audit – lag behind remuneration in their engagement focus, the new Code gives greater emphasis to engagement between shareholders and committee chairs. This area should be higher on the agenda in 2019.
EmployeesWith more than one-third of the FTSE 350 mentioning no type of employee engagement, companies must devise and execute plans to engage more effectively with their workforce. They could choose one of the three methods outlined in the Code, or plan alternative arrangements.
Section 172Companies are becoming more mindful of the impact of their decisions on key stakeholders, as suggested by the fact that 30% of the FTSE 350 specifically mention section 172 this year, or allude to stakeholders’ influence on board decisions.
But to meet the new statutory requirements will require a much greater effort. These aren’t just compliance questions; they are promoted as crucial to success. It is worth bearing in mind that pension funds, for example, are already drawing more attention to this area and looking to hold boards to account.
The FRC has focused consistently on the need to disclose organisational culture, but most companies are still failing to deliver. As our research shows, 33% of the FTSE 350 do not articulate their values, 60% do not state their purpose and only 29% of CEOs discuss their desired culture.
To rectify this, boards need to consider such questions as: • Do the board and the executives truly believe in the culture
they articulate? • What needs to change and how can lasting change be
achieved? • How can management bring the company’s values and
behaviours alive?• Where are the blocks?• How can the board monitor progress throughout the
company on a consistent basis?
Annual reports have grown far too long, with 172 pages now the average length. If companies are to embrace section 172 and, in doing so, commit to more accessible, fair, balanced and understandable reporting, they need to rethink how they present information. They must focus on better, not more.
A completely new approach to narrative would be an ideal solution, but a more realistic challenge might be to reduce 10% of the content and limit the use of images that are cosmetic, rather than explanatory.
With the new Code focusing on the application of the core principles, companies – only 27% of which provided meaningful descriptions this year – will need to provide better insights, specifying actions and outcomes.
Applying the principles
Stakeholder engagement
Better not more
Culture
With the Code and related legislation coming into force in January 2019, the following areas now need new or renewed focus:
56 Corporate Governance Review 2018
The new Code gives the nomination committee a greater role to play in addressing emerging skills needs, meeting the challenges of diversity and planning for succession below board level. With just 14% of companies addressing succession planning meaningfully, there is a steep slope to climb.
A vital and growing challenge relates to technology: there is a skills gap between people with tech-based knowhow and those with the wide experience board membership requires. Companies need to consider how they can bridge the divide. The issue is particularly pressing for organisations in the consumer goods and financial services sectors, which tend to rate tech risks highly but have low levels of technology experience on their boards.
Board effectiveness evaluation may help with design of the future-fit board, but this year’s disclosures indicate a need for format change, more innovative approaches, and explicit company reporting on follow-up actions. The emergence of new major players in the external evaluator market – which sees four firms handling almost two-thirds of all evaluations – would bring more fresh perspectives.
With just 46 companies highlighting Brexit as a key threat, boards need to give greater attention to the potential risks that the UK’s withdrawal from the EU poses for their organisation, and to how they will respond.
By the time most companies are finalising their next set of annual reports, the UK’s 2019 March EU exit date will be almost upon them, so there should be far greater clarity. Risk annual report drafting in the light of Brexit will require late consideration as exit negotiation facts emerge.
Brexit
Boards fit for the future
Long-term incentives
Viability
In line with the new Code’s focus on simplicity, alignment to culture and proportionality, companies need to ensure that reward is clearly linked to what they say they value and their performance measures.
As it is, there is a very apparent disconnect between the proportion of non-financial KPIs disclosed and the low level of companies (14%) that cite specific non-financial performance metrics.
Viability reporting needs to improve greatly before it can deliver the envisaged level of insight for investors and other interested parties. As we have seen, less than half of the FTSE 350 give useful insight into their longer-term viability. Companies should expect increased scrutiny in this area, as the FRC broadens its focus beyond the construction and support services sectors.

Corporate Governance Review 2018 57
Investor viewpointJessica Ground Global Head of Stewardship, Schroders
It is hard not to be encouraged by the all-time high levels of compliance with the UK Corporate Governance Code (the Code). Strong governance and investor stewardship is a hallmark of the UK market, and practices in this area continue to be exported globally. One of the strengths of the system is how it evolves; the stakeholder focus in the new Code feels particularly relevant given the expanding role that companies are playing in our societies. We look forward to the implementation of the next iteration with interest. As always, we expect some innovative examples that will set the standard over time.
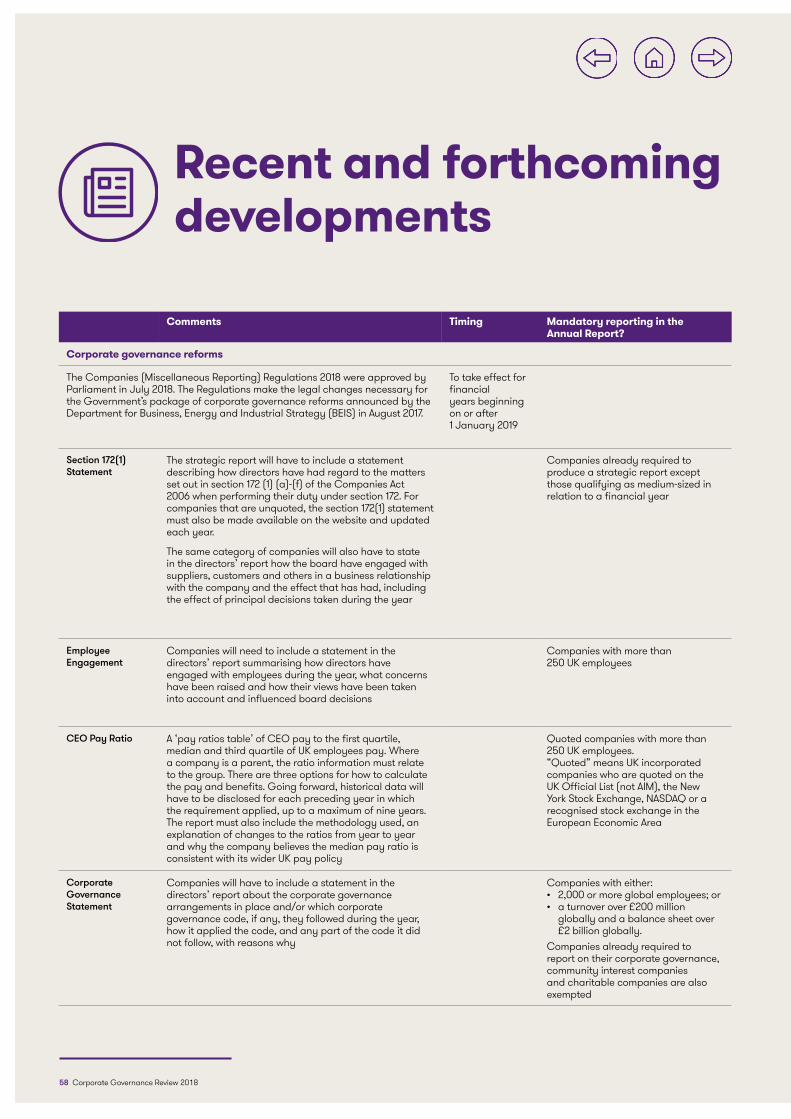
58 Corporate Governance Review 2018
Comments Timing Mandatory reporting in the Annual Report?
Corporate governance reforms
The Companies (Miscellaneous Reporting) Regulations 2018 were approved by Parliament in July 2018. The Regulations make the legal changes necessary for the Government’s package of corporate governance reforms announced by the Department for Business, Energy and Industrial Strategy (BEIS) in August 2017.
To take effect for financial years beginning on or after 1 January 2019
Section 172(1) Statement
The strategic report will have to include a statement describing how directors have had regard to the matters set out in section 172 (1) (a)-(f) of the Companies Act 2006 when performing their duty under section 172. For companies that are unquoted, the section 172(1) statement must also be made available on the website and updated each year.
The same category of companies will also have to state in the directors’ report how the board have engaged with suppliers, customers and others in a business relationship with the company and the effect that has had, including the effect of principal decisions taken during the year
Companies already required to produce a strategic report except those qualifying as medium-sized in relation to a financial year
Employee Engagement
Companies will need to include a statement in the directors’ report summarising how directors have engaged with employees during the year, what concerns have been raised and how their views have been taken into account and influenced board decisions
Companies with more than250 UK employees
CEO Pay Ratio A ‘pay ratios table’ of CEO pay to the first quartile, median and third quartile of UK employees pay. Where a company is a parent, the ratio information must relate to the group. There are three options for how to calculate the pay and benefits. Going forward, historical data will have to be disclosed for each preceding year in which the requirement applied, up to a maximum of nine years. The report must also include the methodology used, an explanation of changes to the ratios from year to year and why the company believes the median pay ratio is consistent with its wider UK pay policy
Quoted companies with more than 250 UK employees.“Quoted” means UK incorporated companies who are quoted on the UK Official List (not AIM), the New York Stock Exchange, NASDAQ or a recognised stock exchange in the European Economic Area
Corporate Governance Statement
Companies will have to include a statement in the directors’ report about the corporate governance arrangements in place and/or which corporate governance code, if any, they followed during the year, how it applied the code, and any part of the code it did not follow, with reasons why
Companies with either:• 2,000 or more global employees; or• a turnover over £200 million
globally and a balance sheet over £2 billion globally.
Companies already required to report on their corporate governance, community interest companies and charitable companies are also exempted
Recent and forthcoming developments
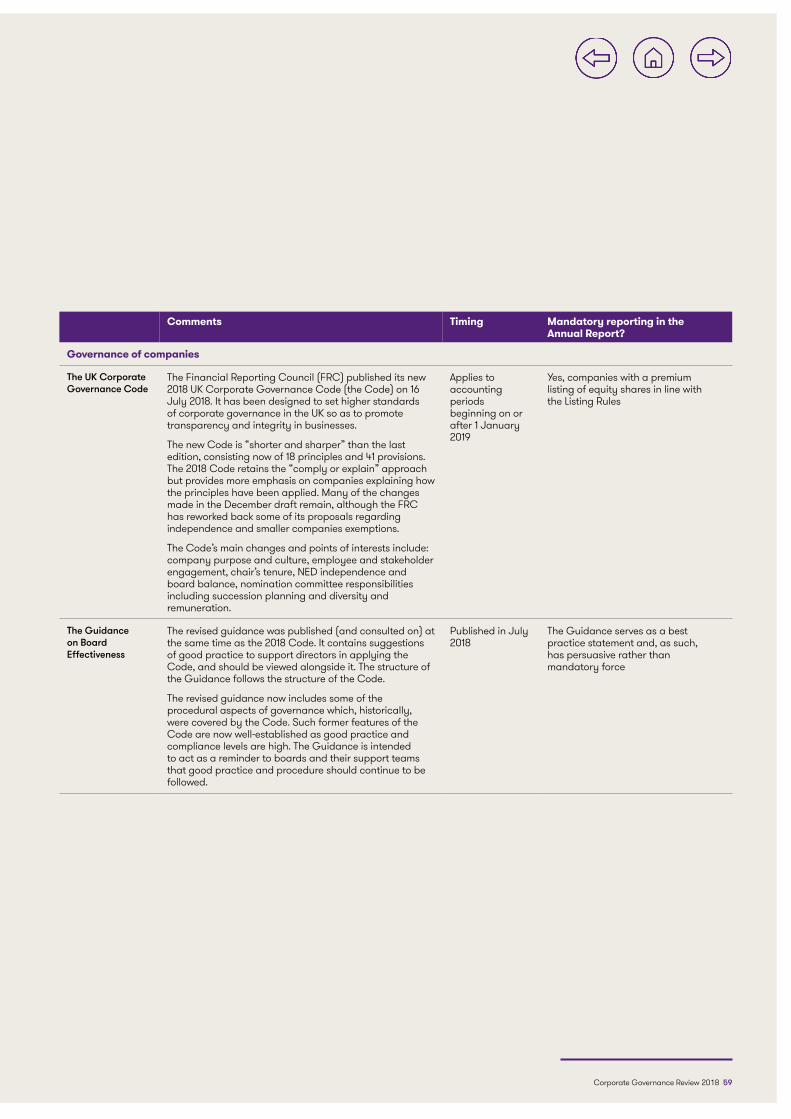
Corporate Governance Review 2018 59
Comments Timing Mandatory reporting in the Annual Report?
Governance of companies
The UK Corporate Governance Code
The Financial Reporting Council (FRC) published its new 2018 UK Corporate Governance Code (the Code) on 16 July 2018. It has been designed to set higher standards of corporate governance in the UK so as to promote transparency and integrity in businesses.
The new Code is “shorter and sharper” than the last edition, consisting now of 18 principles and 41 provisions. The 2018 Code retains the “comply or explain” approach but provides more emphasis on companies explaining how the principles have been applied. Many of the changes made in the December draft remain, although the FRC has reworked back some of its proposals regarding independence and smaller companies exemptions.
The Code’s main changes and points of interests include: company purpose and culture, employee and stakeholder engagement, chair’s tenure, NED independence and board balance, nomination committee responsibilities including succession planning and diversity and remuneration.
Applies to accounting periods beginning on or after 1 January 2019
Yes, companies with a premium listing of equity shares in line with the Listing Rules
The Guidance on Board Effectiveness
The revised guidance was published (and consulted on) at the same time as the 2018 Code. It contains suggestions of good practice to support directors in applying the Code, and should be viewed alongside it. The structure of the Guidance follows the structure of the Code.
The revised guidance now includes some of the procedural aspects of governance which, historically, were covered by the Code. Such former features of the Code are now well-established as good practice and compliance levels are high. The Guidance is intended to act as a reminder to boards and their support teams that good practice and procedure should continue to be followed.
Published in July 2018
The Guidance serves as a best practice statement and, as such, has persuasive rather than mandatory force
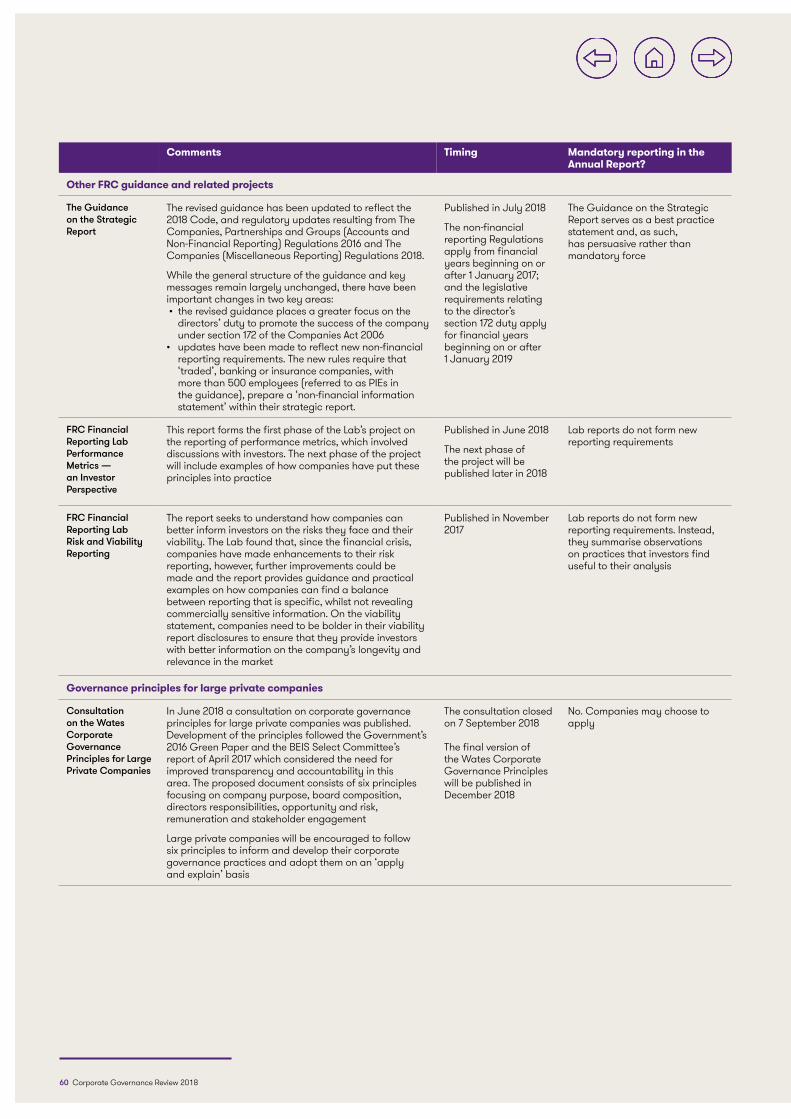
60 Corporate Governance Review 2018
Comments Timing Mandatory reporting in the Annual Report?
Other FRC guidance and related projects
The Guidance on the Strategic Report
The revised guidance has been updated to reflect the 2018 Code, and regulatory updates resulting from The Companies, Partnerships and Groups (Accounts and Non-Financial Reporting) Regulations 2016 and The Companies (Miscellaneous Reporting) Regulations 2018.
While the general structure of the guidance and key messages remain largely unchanged, there have been important changes in two key areas: • the revised guidance places a greater focus on the
directors’ duty to promote the success of the company under section 172 of the Companies Act 2006
• updates have been made to reflect new non-financial reporting requirements. The new rules require that ‘traded’, banking or insurance companies, with more than 500 employees (referred to as PIEs in the guidance), prepare a ‘non-financial information statement’ within their strategic report.
Published in July 2018
The non-financial reporting Regulations apply from financial years beginning on or after 1 January 2017; and the legislative requirements relating to the director’s section 172 duty apply for financial years beginning on or after 1 January 2019
The Guidance on the Strategic Report serves as a best practice statement and, as such, has persuasive rather than mandatory force
FRC FinancialReporting LabPerformance Metrics —an Investor Perspective
This report forms the first phase of the Lab’s project on the reporting of performance metrics, which involved discussions with investors. The next phase of the project will include examples of how companies have put these principles into practice
Published in June 2018
The next phase of the project will be published later in 2018
Lab reports do not form new reporting requirements
FRC FinancialReporting LabRisk and ViabilityReporting
The report seeks to understand how companies can better inform investors on the risks they face and their viability. The Lab found that, since the financial crisis, companies have made enhancements to their risk reporting, however, further improvements could be made and the report provides guidance and practical examples on how companies can find a balance between reporting that is specific, whilst not revealing commercially sensitive information. On the viability statement, companies need to be bolder in their viability report disclosures to ensure that they provide investors with better information on the company’s longevity and relevance in the market
Published in November 2017
Lab reports do not form new reporting requirements. Instead, they summarise observations on practices that investors find useful to their analysis
Governance principles for large private companies
Consultation on the Wates Corporate Governance Principles for Large Private Companies
In June 2018 a consultation on corporate governance principles for large private companies was published. Development of the principles followed the Government’s 2016 Green Paper and the BEIS Select Committee’s report of April 2017 which considered the need for improved transparency and accountability in this area. The proposed document consists of six principles focusing on company purpose, board composition, directors responsibilities, opportunity and risk, remuneration and stakeholder engagement
Large private companies will be encouraged to follow six principles to inform and develop their corporate governance practices and adopt them on an ‘apply and explain’ basis
The consultation closed on 7 September 2018
The final version of the Wates Corporate Governance Principles will be published in December 2018
No. Companies may choose to apply
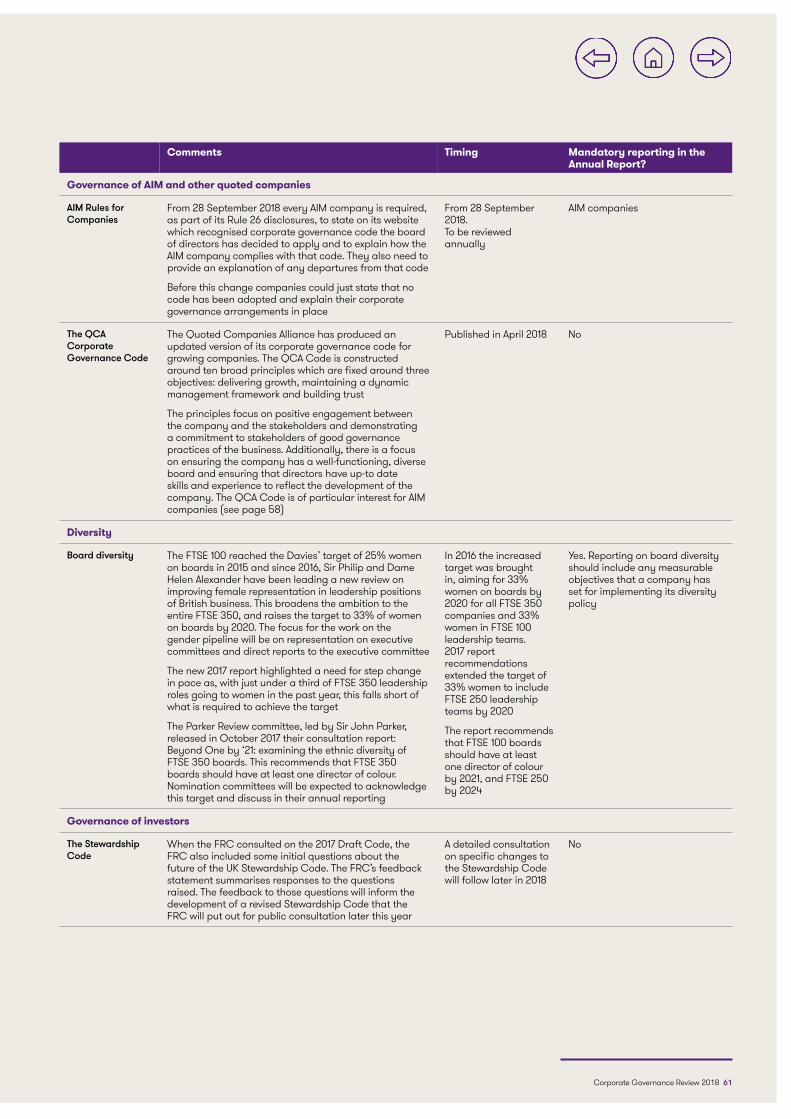
Corporate Governance Review 2018 61
Comments Timing Mandatory reporting in the Annual Report?
Governance of AIM and other quoted companies
AIM Rules for Companies
From 28 September 2018 every AIM company is required, as part of its Rule 26 disclosures, to state on its website which recognised corporate governance code the board of directors has decided to apply and to explain how the AIM company complies with that code. They also need to provide an explanation of any departures from that code
Before this change companies could just state that no code has been adopted and explain their corporate governance arrangements in place
From 28 September 2018. To be reviewed annually
AIM companies
The QCA Corporate Governance Code
The Quoted Companies Alliance has produced an updated version of its corporate governance code for growing companies. The QCA Code is constructed around ten broad principles which are fixed around three objectives: delivering growth, maintaining a dynamic management framework and building trust
The principles focus on positive engagement between the company and the stakeholders and demonstrating a commitment to stakeholders of good governance practices of the business. Additionally, there is a focus on ensuring the company has a well-functioning, diverse board and ensuring that directors have up-to date skills and experience to reflect the development of the company. The QCA Code is of particular interest for AIM companies (see page 58)
Published in April 2018 No
Diversity
Board diversity The FTSE 100 reached the Davies’ target of 25% women on boards in 2015 and since 2016, Sir Philip and Dame Helen Alexander have been leading a new review on improving female representation in leadership positions of British business. This broadens the ambition to the entire FTSE 350, and raises the target to 33% of women on boards by 2020. The focus for the work on the gender pipeline will be on representation on executive committees and direct reports to the executive committee
The new 2017 report highlighted a need for step change in pace as, with just under a third of FTSE 350 leadership roles going to women in the past year, this falls short of what is required to achieve the target
The Parker Review committee, led by Sir John Parker, released in October 2017 their consultation report: Beyond One by ‘21: examining the ethnic diversity of FTSE 350 boards. This recommends that FTSE 350 boards should have at least one director of colour. Nomination committees will be expected to acknowledge this target and discuss in their annual reporting
In 2016 the increased target was brought in, aiming for 33% women on boards by 2020 for all FTSE 350 companies and 33% women in FTSE 100 leadership teams.2017 report recommendations extended the target of 33% women to include FTSE 250 leadership teams by 2020
The report recommends that FTSE 100 boards should have at least one director of colour by 2021, and FTSE 250 by 2024
Yes. Reporting on board diversity should include any measurable objectives that a company has set for implementing its diversity policy
Governance of investors
The Stewardship Code
When the FRC consulted on the 2017 Draft Code, the FRC also included some initial questions about the future of the UK Stewardship Code. The FRC’s feedback statement summarises responses to the questions raised. The feedback to those questions will inform the development of a revised Stewardship Code that the FRC will put out for public consultation later this year
A detailed consultation on specific changes to the Stewardship Code will follow later in 2018
No
62 Corporate Governance Review 2018
The Grant Thornton Governance Institute
Simon LoweChair, The Grant Thornton Governance InstituteT 020 7728 2451E [email protected] Sarah BellT 020 7728 2409E [email protected] Karen BriceT 020 7728 3318E [email protected]
Yaryna Kobel T 020 7865 2452E [email protected] Nash MatinyarareT 020 7184 4488E [email protected]
Jide AjomaleT 020 7728 2670E [email protected]
Governance matters
For further information, visit: grantthornton.co.uk/governancematters
Corporate Governance Review 2018
Is the role of company secretary fit for the future?
Engagement beyond the boardroom: What do your stakeholders expect?
Corporate Governance Review: Toolkit 2017
Corporate Governance Review: Toolkit2017
Corporate Governance Review 2018
Is the role of company secretary fit for the future?
Governance
Stakeholders
International
Corporate Governance Report 2018
Engagement beyond the boardroom: What do your stakeholders expect?
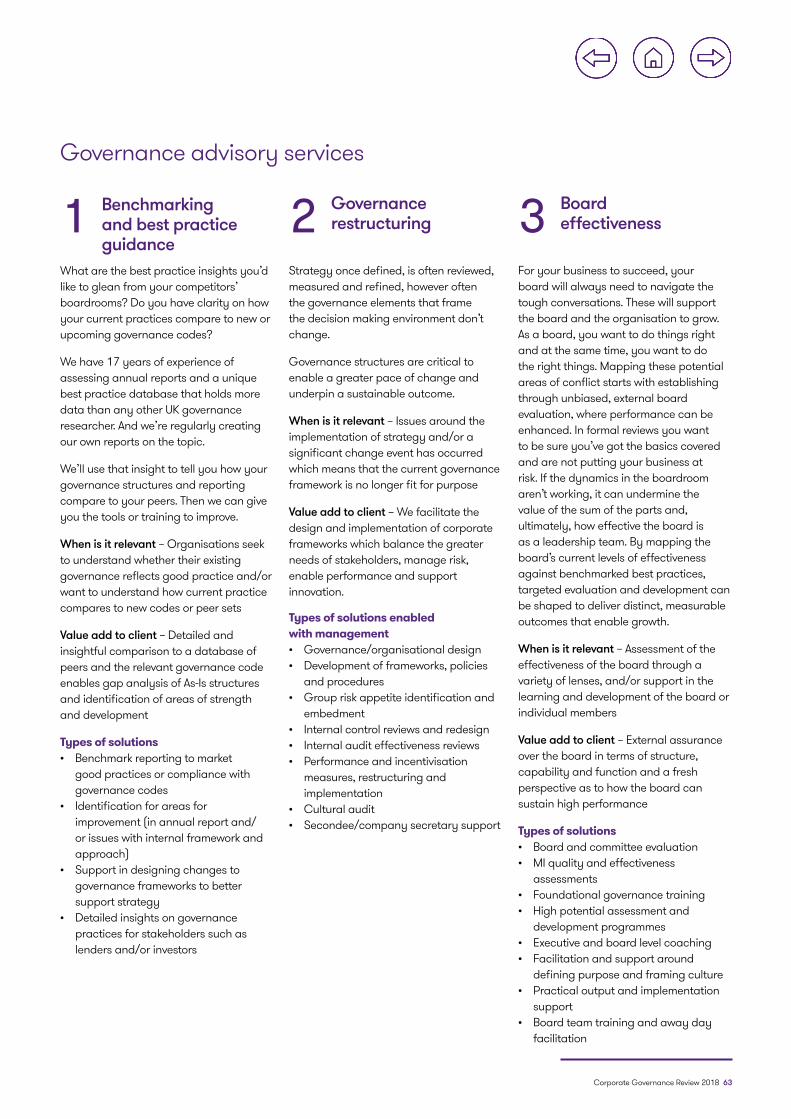
Corporate Governance Review 2018 63
Governance advisory services
What are the best practice insights you’d like to glean from your competitors’ boardrooms? Do you have clarity on how your current practices compare to new or upcoming governance codes?
We have 17 years of experience of assessing annual reports and a unique best practice database that holds more data than any other UK governance researcher. And we’re regularly creating our own reports on the topic.
We’ll use that insight to tell you how your governance structures and reporting compare to your peers. Then we can give you the tools or training to improve.
When is it relevant – Organisations seek to understand whether their existing governance reflects good practice and/or want to understand how current practice compares to new codes or peer sets
Value add to client – Detailed and insightful comparison to a database of peers and the relevant governance code enables gap analysis of As-Is structures and identification of areas of strength and development
Types of solutions• Benchmark reporting to market
good practices or compliance with governance codes
• Identification for areas for improvement (in annual report and/or issues with internal framework and approach)
• Support in designing changes to governance frameworks to better support strategy
• Detailed insights on governance practices for stakeholders such as lenders and/or investors
Strategy once defined, is often reviewed, measured and refined, however often the governance elements that frame the decision making environment don’t change.
Governance structures are critical to enable a greater pace of change and underpin a sustainable outcome.
When is it relevant – Issues around the implementation of strategy and/or a significant change event has occurred which means that the current governance framework is no longer fit for purpose
Value add to client – We facilitate the design and implementation of corporate frameworks which balance the greater needs of stakeholders, manage risk, enable performance and support innovation.
Types of solutions enabled with management• Governance/organisational design• Development of frameworks, policies
and procedures• Group risk appetite identification and
embedment• Internal control reviews and redesign• Internal audit effectiveness reviews• Performance and incentivisation
measures, restructuring and implementation
• Cultural audit• Secondee/company secretary support
For your business to succeed, your board will always need to navigate the tough conversations. These will support the board and the organisation to grow. As a board, you want to do things right and at the same time, you want to do the right things. Mapping these potential areas of conflict starts with establishing through unbiased, external board evaluation, where performance can be enhanced. In formal reviews you want to be sure you’ve got the basics covered and are not putting your business at risk. If the dynamics in the boardroom aren’t working, it can undermine the value of the sum of the parts and, ultimately, how effective the board is as a leadership team. By mapping the board’s current levels of effectiveness against benchmarked best practices, targeted evaluation and development can be shaped to deliver distinct, measurable outcomes that enable growth.
When is it relevant – Assessment of the effectiveness of the board through a variety of lenses, and/or support in the learning and development of the board or individual members
Value add to client – External assurance over the board in terms of structure, capability and function and a fresh perspective as to how the board can sustain high performance
Types of solutions• Board and committee evaluation• MI quality and effectiveness
assessments• Foundational governance training• High potential assessment and
development programmes• Executive and board level coaching• Facilitation and support around
defining purpose and framing culture• Practical output and implementation
support• Board team training and away day
facilitation
1 2 3Benchmarking and best practice guidance
Governance restructuring
Board effectiveness
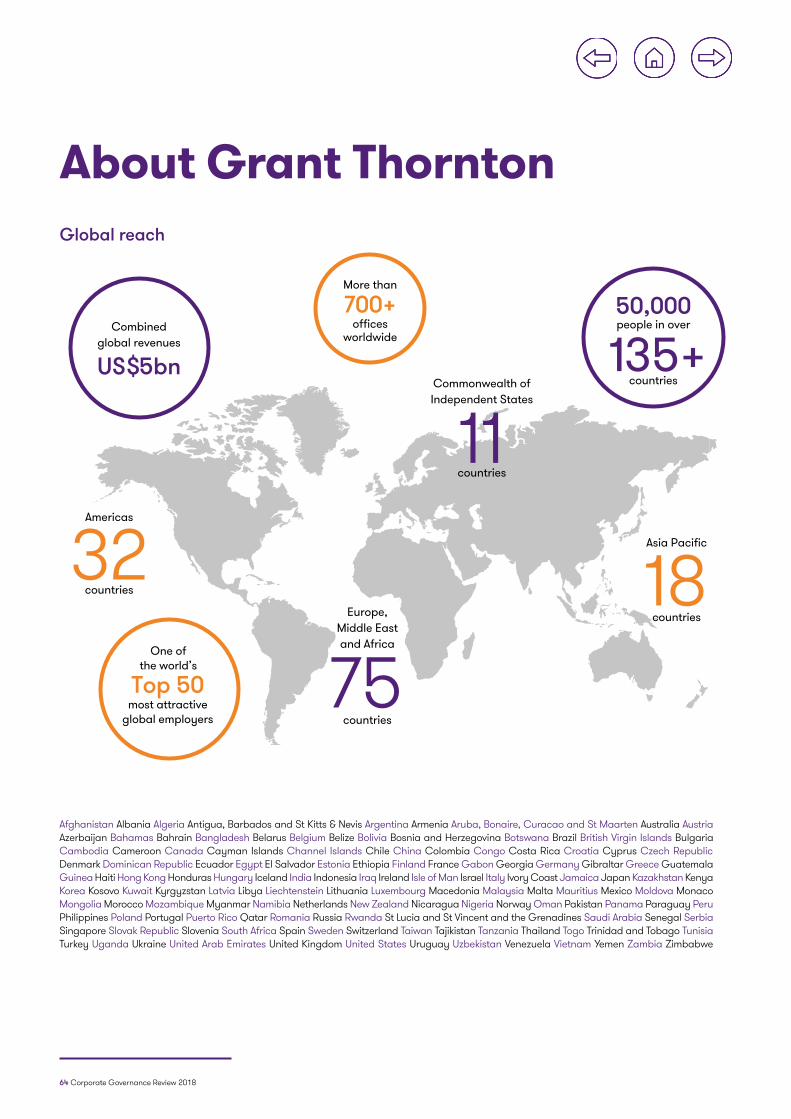
64 Corporate Governance Review 2018
About Grant Thornton
Afghanistan Albania Algeria Antigua, Barbados and St Kitts & Nevis Argentina Armenia Aruba, Bonaire, Curacao and St Maarten Australia Austria Azerbaijan Bahamas Bahrain Bangladesh Belarus Belgium Belize Bolivia Bosnia and Herzegovina Botswana Brazil British Virgin Islands Bulgaria Cambodia Cameroon Canada Cayman Islands Channel Islands Chile China Colombia Congo Costa Rica Croatia Cyprus Czech Republic Denmark Dominican Republic Ecuador Egypt El Salvador Estonia Ethiopia Finland France Gabon Georgia Germany Gibraltar Greece Guatemala Guinea Haiti Hong Kong Honduras Hungary Iceland India Indonesia Iraq Ireland Isle of Man Israel Italy Ivory Coast Jamaica Japan Kazakhstan Kenya Korea Kosovo Kuwait Kyrgyzstan Latvia Libya Liechtenstein Lithuania Luxembourg Macedonia Malaysia Malta Mauritius Mexico Moldova Monaco Mongolia Morocco Mozambique Myanmar Namibia Netherlands New Zealand Nicaragua Nigeria Norway Oman Pakistan Panama Paraguay Peru Philippines Poland Portugal Puerto Rico Qatar Romania Russia Rwanda St Lucia and St Vincent and the Grenadines Saudi Arabia Senegal Serbia Singapore Slovak Republic Slovenia South Africa Spain Sweden Switzerland Taiwan Tajikistan Tanzania Thailand Togo Trinidad and Tobago Tunisia Turkey Uganda Ukraine United Arab Emirates United Kingdom United States Uruguay Uzbekistan Venezuela Vietnam Yemen Zambia Zimbabwe
Combined global revenues
US$5bn
Global reach
Americas
Asia Pacific
Commonwealth of Independent States
Europe, Middle East and Africa
32 18
11
75countries
countries
countries
countries
One of the world’s
most attractive global employers
Top 50
50,000people in over
countries135+
More than 700+
offices worldwide

© 2018 Grant Thornton UK LLP. All rights reserved.
‘Grant Thornton’ refers to the brand under which the Grant Thornton member firms provide assurance, tax and advisory services to their clients and/or refers to one or more member firms, as the context requires. Grant Thornton UK LLP is a member firm of Grant Thornton International Ltd (GTIL). GTIL and the member firms are not a worldwide partnership. GTIL and each member firm is a separate legal entity. Services are delivered by the member firms. GTIL does not provide services to clients. GTIL and its member firms are not agents of, and do not obligate, one another and are not liable for one another’s acts or omissions. This publication has been prepared only as a guide. No responsibility can be accepted by us for loss occasioned to any person acting or refraining from acting as a result of any material in this publication.
EPI.1294
grantthornton.co.uk