Embed Size (px)
Citation preview
Corporate Governance Practices and Financial Performance of Selected
Family Managed Medium Sized Listed Companies in India
*
Prepared by S P Jain Institute of Management & Research, Mumbai
Sponsored by
National Foundation for Corporate Governance
*
Jiban K Mukhopadhyay
Debasis Mallik
Dolly Dhamodiwala
March 2012, Mumbai
| P a g e ii
Contents Preface .......................................................................................................................... vi
Executive Summary ................................................................................................................. x
Chapter 1 Major Issues in Corporate Governance ............................................................... 1
1.1 Introduction
1.2 Variances in Corporate Governance Practices
1.3 Corporate Governance High on the Agenda of Corporate and Countries
1.4 Does Good Governance Impact Financial Performance?
1.5 Why the Focus on Corporate Governance in Family Owned Firms
1.6 The Present Study by SPJIMR
Chapter 2 Studies on Corporate Governance and Financial Performance In Medium‐sized Family Managed Companies .................................................................... 13
2.1 Background
2.2 Concentration of Ownership and Control in Family Managed Firms
2.3 Relationship between Corporate Governance and Financial Performance in India
2.4 Family Managed Business – A Pioneering Management Program of SPJIMR
2.5 Objectives of the Study and Approach
Chapter 3 The Structural Models of Family Firms ............................................................. 21
3.1 What Are Family Managed Firms
3.2 Conceptual Models of Family Firms
Model 1 : The Two‐System Model
Model 2 : The Three Circle Model
Model 3 : The Development Model
3.3 Governance Structures in Family Businesses
3.4 Family Businesses in India
3.5 Focus of SPJIMR Study
| P a g e iii
Chapter 4 Regulatory Framework for Corporate Governance in India .............................. 33
4.1 Evolution of Corporate Governance in India
The CII Initiative
SEBI sets up Kumar Mangalam Birla Committee
4.2 Clause 49 of the Listing Agreement
RBI Advisory Group headed by Dr. R H Patil
N R Narayan Murthy Committee
4.3 Provisions under Clause 49 of the Listing Agreement
Mandatory Provisions
Non‐mandatory Requirements
4.4 Corporate Governance Voluntary Guidelines ‐2009
4.5 National Voluntary Guidelines for Social, Environmental and Economic
Responsibilities of Business – July, 2011
4.6 The Companies Act 1956
J J Irani Committee
4.7 The Companies Bill, 2008
4.8 The Companies Amendment Bill, 2011
4.9 Corporate Governance Rating
Chapter 5 Review of Literature on Corporate Governance and its Impact on Firm Performance .................................................................................................... 55
5.1 Studies Relating to Corporate Governance and Firm Performance in Developed Countries
Multi‐country Results for Indices and Sub‐indices
Firm Characteristics
5.2 Research Work Done for Emerging Asian Markets – Taiwan and Korea
Family Involvement and Firm Performance
5.3 Research Work done in European Countries
5.4 Studies pertaining to Corporate Governance and Firm Performance in India
5.5 Link between Corporate Governance ( taken as outcomes of CG ) and Financial Performance
5.6 Relationship between Institutional Investors’ stakes and Corporate governance index.
5.7 Relationship between institutional Investors’ stakes and Financial Performance (Tobin’s Q )
5.8 Variables for Corporate Governance
| P a g e iv
5.9 Variables for Financial Performance
5.10 Association between Governance and Market Value
5.11 Association of Sub‐indices of CG with Tobin’s Q
5.12 Conclusions
5.13 Association between governance indices and firm value
5.14 Summary of Observations from above Studies
Chapter 6 Methodology ................................................................................................... 83
6.1 Background
6.2 Updates on Corporate Governance Regulatory Framework
6.3 Literature Review
6.4 Selection of Sample
6.4.1 Database Selection
6.4.2 Sample Companies
6.5 Classification of Sample Companies
6.6 Selection of Corporate Governance Parameters
6.6.1 Data on Corporate Governance – Identification of Parameters
6.7 Variable Formation Procedure
6.8 Formation of Indices
6.9 Description of Financial Variables
6.10 Regression Analysis
6.11 Multiple and Stepwise Regression
6.12. Assumptions and Constraints
Appendix 6.1
Parameters for Compliance with SEBI Clause 49 of Listing Agreement
Selected for Impact on Firm Performance
Annexure 6.2
Corporate Governance: Variable Description
Chapter 7 Empirical Findings of the Study ...................................................................... 107
7.1 Background
7.2 Regression Analysis
7.2.1 Unadjusted Data – 2006 (Table 1)
7.2.2 Analysis based on Unadjusted Data for 2010 (Table 2)
7.2.3 Analysis Based on Adjusted Data for 2006 (Table 3)

| P a g e v
7.2.4 Analysis based on Adjusted Data for 2010 (Table 4 )
7.3 Conclusion
Chapter 8 Suggestions and Recommendations ............................................................... 133
8.1 Recommendations for Family Managed Companies
8.2 Recommendations for Regulatory Authorities
8.3. Is there a Case for a Differentiated regime of Corporate Governance for Medium sized Companies?
8.4 Need for a better Monitoring Mechanism
8.5 Role of Apex Chambers of Industry and Commerce and Industry‐specific Associations
8.6 Role of NFCG
References .............................................................................................................. 141

| P a g e vi
Preface
National Foundation for Corporate Governance (NFCG) was set up by the Ministry of
Corporate Affairs, Government of India, in partnership with Confederation of Indian Industry
(CII), Institute of Company Secretaries of India (ICSI) and Institute of Chartered Accountants
of India (ICAI). In the year 2010, ICWAI and the National Stock Exchange also joined NFCG as
its partners. NFCG ‘s mission is to promote better Corporate Governance practices in India
by fostering a culture for promoting good governance, voluntary compliance and effective
participation of different stakeholders and create a framework for best practices, structure,
processes and ethics in business. In this way it intends to make a significant difference to the
Indian Corporate Sector by raising the standards of Corporate Governance in India.
S P Jain Institute of Management & Research (SPJIMR), Mumbai is one of the top 10
Business Schools in India and has pioneered the Post Graduate Management Program for
Family Managed Businesses. NFCG has accredited SPJIMR as a partner institute to carry out
research and training in corporate governance on a regular basis.
During the period 2007‐08 to 2008‐09, SPJIMR had carried out a Research Study
‘Showcasing Best Practices in Corporate Governance by Medium Sized Family Managed
Public Limited Companies – Three Case Studies’. The report was submitted to NFCG in
September 2008. Thereafter on April 27, 2009, a Round Table was organized by SPJIMR to
disseminate the findings of the Research Study and to discuss the major issues brought out
by the Study in a public forum. A Training Program on Corporate Governance and
compliance related issues was also conducted by SPJIMR for owners and promoters of
Family Managed companies on April 17 and 18, 2010.

| P a g e vii
The present Research Study, sponsored by NFCG, – ‘A Study on Corporate Governance
Practices and Financial Performance of Selected Family Managed Medium Sized Listed
Companies in India” was initiated in 2010‐11 and completed in the current year 2011‐12.
The study is based on secondary research which involved a detailed scrutiny of corporate
governance practices and financial performance of a selected sample of medium sized
family managed listed companies. The information relating to Corporate Governance was
obtained from the annual reports of these companies for two time periods, financial years
2005‐06 and 2009‐10. Data on financial performance was obtained from the Capitaline
database as well as the Annual Reports of the companies. Over 100 companies were
selected for the Study from the total of 230 medium sized family managed companies as
defined by us. Due to inconsistencies in the availability of data eventually the analysis could
be carried out for 57 companies.
The uniqueness of our Study lies in the fact that this is the first time that the influence of
corporate governance has been assessed on the financial performance of family managed
companies in India. The other distinctive feature of our Study is that for studying the
corporate governance practices of these companies we have considered not only the
Mandatory and Non‐mandatory/Recommendatory requirements under SEBI clause 49 but
also the measures taken by the companies voluntarily as suggested by the Ministry of
Corporate Affairs in its Guidelines 2009. However we believe that good corporate
governance practices need not be based only on compliance with Mandatory requirements
or a few selected Non‐mandatory requirements. Good corporate governance practices
should also be based on certain voluntary measures which go beyond mere compliance. For
considering these ‘Beyond Compliance’ measures we have also examined the initiatives
taken by the companies for creation of value for all its stakeholders including HR
Development, Quality Improvement for benefit of customers, Environment Protection,
Health and Safety for its employees and for the welfare of the Society at large.
To establish the influence of Corporate Governance parameters on the Financial
Performance a combination of Multiple and Step‐wise Regression Analysis was undertaken.
After assessing the influence of a series of corporate governance parameters on a selected
set of financial indicators, the Study has concluded that Corporate Governance has a

| P a g e viii
definite impact on financial performance of family managed firms. More importantly, it has
been observed that the initiatives taken by the companies for creating value for all its
stakeholders like Developmental and Promotional measures for its Employees, (i.e. HR
initiatives), Customers (Quality Improvement) and the Society (Environmental concerns)
grouped as Beyond Compliance measures have come out as the single most decisive factor
having a direct impact on Financial Performance. These value creation measures have
revealed a high and positive relationship with almost all financial performance variables in
2010. Apart from these, governance practices relating to disclosures in the annual reports,
aimed at sharing more information with the shareholders and investors which reflects a
higher degree of transparency in the balance sheets has also had a positive influence on the
financial performance in terms of higher Market Capitalization and Tobin’s Q .
The study was carried out by Prof. Jiban K Mukhopadhyay Professor & Coordinator of
Corporate Governance Initiatives, SPJIMR, Dr. Debasis Mallik, Associate Professor, SPJIMR
and Ms. Dolly Dhamodiwala, Senior Researcher, SPJIMR.
The study is expected to be of value to Investors, Stock Exchanges, Regulators, Researchers
and even the Family Managed companies themselves as it brings out the long term benefits
of corporate governance and stakeholder value creation on company performance and
valuation.
We are extremely grateful to NFCG and its Board of Trustees, Core Group and the
Secretariat for giving us an opportunity to carry out this pioneering study. We would also
like to express our thanks to Ms Shalini Budathoki for her excellent coordination and
support.
We have received valuable guidance from Dr. M L Shrikant (DBA, Harvard) Hon. Dean,
SPJIMR and Dr. Sesha Iyer, Director, SPJIMR for conducting the study and we are grateful to
them for their direction.
We are also thankful to Ms. Sonali Saxena and Ms. Sabita Patnayak, Research Associates for
their assistance in compilation of data.

| P a g e ix
Without the sincere encouragement and support from NFCG and all those at SPJIMR it
would not have been possible to bring out this Report.
March 30, 2012 Jiban Mukhopadhyay
Mumbai Debasis Mallik
Dolly Dhamodiwala

| P a g e x
Executive Summary
I. Background
National Foundation for Corporate Governance ( NFCG ) accredited S P Jain Institute of
Management & Research (SPJIMR) in 2005‐06 as a partner Institute to carry out research
studies, conduct training programs, etc. to fulfill its Mission, which is to promote better
corporate governance practices in India, by fostering a culture of good governance,
voluntary compliance and effective participation of different stakeholders and thus create a
framework for best practices, structure, processes and ethics in business.
SPJIMR one of the top 10 Business Schools in India, inter alia, has pioneered the Post
Graduate Management Program for Family Managed Businesses and has developed an
insight into the management and operations of family managed businesses in India. As an
accredited Institute of NFCG, SPJIMR has already carried out a research study ‘Showcasing
Best Practices in Corporate Governance by Medium sized Family Managed Public Limited
Companies – Three Case Studies’ in 2008. The present research study on ‘Corporate
Governance Practices and Financial Performance of Family Managed Medium Sized Listed
Companies in India’ has been sponsored by NFCG.
This is a pioneering study in which the influence of corporate governance practices have
been assessed on financial performance of companies which are owned and managed by
families or promoter groups.
The Report is divided into eight chapters.
Chapter I presents ‘Major Issues in Corporate Governance’
Chapter II gives the rationale behind the research on this subject, ‘Study on Corporate
Governance and Financial Performance in Medium sized Family Managed Companies’,
Chapter III discusses the ‘The Structural Models of Family Firms’

| P a g e xi
Chapter IV ‘Regulatory Framework for Corporate Governance in India’ traces the
evolution of corporate governance and the regulatory norms and guidelines instituted in
the country for improvement of corporate governance practices in India.
Chapter V presents the ‘Review of Literature on Corporate Governance and its Impact on
Firm Performance’.
Chapter VI ‘Methodology ‘details the approach and methodology adopted for the Study
Chapter VII gives the ‘Empirical Findings of the Study’
Chapter VIII ‘Suggestions and Recommendations’ enlists our recommendations emerging
out of the Study.
II. Why the Study of Corporate Governance in Family Managed Firms?
Sir Adrien Cadbury defined Corporate Governance as a system by which companies are
directed and controlled. Boards of Directors are responsible for the governance of their
companies. The role of shareholders’ in governance is to appoint the directors and the
auditors and to satisfy themselves that an appropriate governance structure is in place. This
definition stresses the leadership role of the board. Corporate Governance provides the
structure for defining, implementing and monitoring the company’s goals and objectives
and ensuring accountability to its shareholders and investors. Thus, the directors perform
the stewardship role and are the guardians of the company’s assets and have been
delegated the authority by the shareowners to act on their behalf.
In developing economies including India, where ownership is concentrated and large
shareholders dominate and influence management, the role of the board becomes all the
more important to avoid conflict of interest and protect the interests of minority
shareholders. Though an elaborate regulatory framework for corporate governance has
been put in place by SEBI and the Ministry of Corporate Affairs, in India, compliance to even
the mandatory norms has been slow and limited to the barest minimum, especially by the
medium sized family managed companies, where the promoters’ equity holding is high at
times exceeding even 50 percent of the total. This gives the promoters greater control over
their company’s operations and may lead to conflicts of interest between the management

| P a g e xii
and other minority shareholders. Conflicts generally arise if promoter directors pursue their
own financial interests which result in diminished financial returns to other investors and
increased agency costs.
In India family businesses contribute significantly to the GDP. Despite their concentrated
family ownership and control, their presence is critical to the growth and development of
our economy. Our study has therefore proposed to explore the corporate governance
practices of this crucial segment of public limited companies and assess their impact on
financial performance of these firms.
III. Survey of Literature
Before undertaking the present Study on ‘Corporate Governance and Financial Performance
in Medium sized Family Managed Companies’, we carried out a review of research works
done on the same subject. Several studies have been carried out in developed and
developing markets to understand the relationship between corporate governance and firm
performance. A study which combined all the corporate governance parameters into a
combined index has concluded that better governed firms are relatively more profitable,
more valuable and pay out more cash to their shareholders. Some of the key sub‐indices of
corporate governance which have significantly influenced financial performance are
Minority Shareholders’ Rights, Ownership Pattern, Disclosures of Transactions with Related
Parties, Executive and Director Compensation and Board procedures.
Most of the studies in developing countries have concentrated on a few selected
parameters of corporate governance relating to ownership such as board size, board
independence (adequate number of independent directors on the board), promoters’
control on board, insider ownership and ownership concentration, CEO and board
autonomy, to assess their impact on financial performance of firms and firm value. The
association between corporate governance and financial performance is driven more by
board structure sub‐index in Korea, where it is positively associated with higher profitability.

| P a g e xiii
In a study conducted for firms in Taiwan it was concluded that shareholders in family firms
with higher insider ownership and control (say 50 percent or more) have greater motivation
to monitor the firm’s operations and ensure longevity of the firm. The convergence of the
promoters’ interests would lead to more efficient management and better firm
performance. However, according to another study there is a contrary view that with higher
insider ownership and control by families.
A recent study conducted for India (2008) has also considered all the major indices of
Corporate Governance and combined them into a composite index, Indian Corporate
Governance Index (ICGI) to assess its influence on firm performance. The study has found
evidence of a positive and statistically significant relationship between overall Corporate
Governance Index and Tobin’s Q which is an indicator of the market value of listed firms.
However, this is more true of a larger sized firms included in the BSE‐200 index. It is not
significant for smaller sized firms.
IV. Objective of the Study and Approach
The objective of our study on ‘Corporate Governance and Financial Performance of Medium
sized Family Managed Companies’ is to explore the relationship between corporate
governance practices and financial performance of these medium sized family managed
companies.
• Definition: For the purpose of the Study, Medium sized Family Managed firms were
defined as those having promoters’ shareholding at 25 percent or more of the total
shareholding and total assets ranging from Rs. 200 crore to Rs. 2,000 crore.
• Review of Literature: Before finalizing the methodology, a review of similar studies
carried out in the past was undertaken. This review brought to light the key
parameters of corporate governance which have influenced the performance of
firms, particularly family owned firms in developing countries and in India.

| P a g e xiv
• Identification of Parameters: The study is based on desk research and econometric
analysis of data pertaining to corporate governance and Financial Performance. The
Study commenced with identification of a set of parameters of corporate
governance practices as laid down in SEBI Clause 49 of the Listing Agreement of
Stock Exchanges with the companies. Some of these were selected to represent
independent variables. Another set of parameters indicating the financial
performance of the companies was selected which was considered to be the
dependent variables.
The parameters of corporate governance were classified as,
i) Mandatory
ii) Non‐mandatory parameters,
iii) Parameters based on Voluntary Guidelines announced by the Ministry of Corporate
Affairs in 2009 and
iv) Parameters which went Beyond Compliance and covered the company’s practices
aimed at creating value for its other stakeholders like employees, customers,
suppliers and Society at large. These included HR development and training, quality
improvement programs, health and safety related initiatives and environment
protection measures.
All the four sets of governance parameters were streamlined and only those which can have
a possible direct or indirect influence on financial performance were selected. Each of these
parameters was further sub‐divided into sub‐parameters indicating the manner in which the
companies complied with the corporate governance norms. In this manner the final list
constituted 82 sub‐parameters of corporate governance.
In the same way 13 different variables of financial performance were identified to as
dependent variables to understand the impact of corporate governance parameters on
them. These included,
i) Profit after Tax, PAT,
ii) Price to Book Value Ratio, P/B Ratio

| P a g e xv
iii) Average Annualized Earnings per share, EPS,
iv) Total Sales
v) Book Value
vi) Total Assets
vii) Total Debt
viii) Return on Capital Employed – ROCE
ix) Return on Net worth – RONW
x) Interest Coverage Ratio
xi) Debt Equity Ratio
xii) Market Capitalization and
xiii) Tobin’s Q.
• Selection of Sample: The sample companies were selected from the database of
Mumbai based companies listed on BSE and NSE. From this group of companies,
those promoted by leading business houses were eliminated. To this narrowed down
group of 4,603 companies our twin criteria of medium size and family management
as defined above were applied. This brought down the total to nearly 237
companies.
• Data collection: The Capitaline Database of Annual Reports of listed companies was
used for the purpose of collecting data on corporate governance as well as financial
performance for the two reference periods – 2005‐06 and 2009‐10. During the
scrutiny of Annual Reports we came across several data gaps, especially for the
earlier year. Some of the companies were not even present in the earlier year. Hence
the final data entry could be done for only 57 companies. Financial data were also
collected for these 57 companies.
• Regression Analysis: A combination of multiple and step‐wise regression has been
used for our analysis. As observed in other similar studies, control variables like size
of the companies, have not been used to study the impact of a set of independent
variables on the dependent variable, i.e., the different financial variables. This was
| P a g e xvi
due to the small size of the sample in various asset classes. The study depended on
results emerging from the step‐wise regression analysis, though the output of
multiple regression analysis helped for determining the initial interaction among the
variables. In this way, the independent variables which have very high influence on
the dependent variable were considered. In the second step the variable which has
the next highest influence is considered. This process continued till a stage is
reached when the independent variables have no significant influence on the
dependent variable, going by acceptable levels of p‐values and t‐values. This helped
avoiding multicollinearity problems among the independent variables.
V. Empirical Findings of the Study
Despite the constraints of data availability and smaller size of the sample the study has
succeeded in establishing a strong relationship between some of the corporate governance
parameters of sample firms and their financial performance.
The results from the regression analysis have been classified into four groups:
i) Results emerging out of unadjusted data for the financial year 2006,
ii) Results emerging out of unadjusted data for the year 2010,
iii) Results emerging out of Adjusted data for 2006 and
iv) Results emerging out of Adjusted data for the year 2010.
Our study of corporate governance practices over the five year period between 2006 and
2010 has shown that there is a slow but distinct improvement in the governance practices of
the sample family managed companies. The relationship between certain parameters of
corporate governance and financial variables has also strengthened over the years as
observed in 2010.
The key financial variables impacted by these corporate governance parameters are Tobin’s
Q, Market Capitalization, Total Assets, Total Sales, Interest‐coverage ratio and P/B ratio. All

| P a g e xvii
these dependent variables have shown a high regression coefficient with the above
corporate governance parameters with R‐squared ranging between 0.31 to 0.45.
We have highlighted here the results of our regression analysis emerging out of the adjusted
data for 2010, as these have brought out the impact of corporate governance parameters
more sharply. Tobin’s Q, which is the widely used financial variable, is indicative of the
value of the firm in the market. This is denoted as the ratio of Market Value of Equity to
Debt/Estimated Replacement Value of Assets. Tobin’s Q has shown a high and positive
relationship with Beyond Compliance Initiatives taken by the sample companies. These
measures, which are aimed at value creation for shareholders and all other stakeholders like
employees, consumers, investors, etc., would have enhanced investors’ trust in the
companies resulting in higher market value of their equity and debt.
Family managed companies intending to raise funds from foreign investors would have
invested in better HR development practices including health and safety of their employees
to acquire a better image in the market. Quality improvement programs generally aimed at
greater consumer satisfaction create value for the customers. Investment in these measures
would have also enhanced the company’s brand equity. Environment protection initiatives
reported in the annual reports along with all other value enhancing measures indicate the
company’s investment in sustainability, further increasing its brand value. All these
measures together have significantly influenced Tobin’s Q and Market Cap of the
companies.
The other major corporate governance parameter influencing Tobin’s Q and Market
Capitalization is Voluntary Disclosures of remuneration packages of Non‐executive
Directors. This reveals greater transparency in the annual reports and hence invokes
investors’ trust. Foreign investors attach a great deal of importance to transparency in the
balance sheets especially with regard to remunerations. Disclosure of remuneration of non‐
executive and independent directors is mandatory but some companies voluntarily disclose
more details like the fixed component as well as the performance related component of the
total remunerations, as suggested under Voluntary Guidelines issued by the Ministry of
Corporate Affairs, Government of India.
| P a g e xviii
Remuneration of Directors, especially the performance related component, is an important
motivating factor having a significant influence on the Director’s contribution in the
performance of the company. In family managed companies, promoter directors and even
independent directors with performance linked remuneration, strive at profit maximization
and growth of the company. All this would lead to improvement in the company’s market
cap and Tobin’s Q .
The other performance variables which have shown a positive relationship with corporate
governance parameters are Total Assets and Total Sales. Besides, Beyond Compliance and
Voluntary Disclosure of Remunerations, Total Assets is also influenced by Board
Composition, Number of subsidiaries and associate companies and Shareholders’ rights to
information.
In conclusion the governance practices which have had the maximum influence on financial
performance in 2010, are the initiatives which have created value for all stakeholders i.e.
the measures taken beyond mere compliance with mandatory and non‐mandatory norms
and voluntary disclosures relating to remuneration packages of Non‐executive Directors.
Apart from their significant influence on Tobin’s Q and Market Cap, these have impacted
Total Sales, P/B Ratio, Interest coverage ratio and Return on Net worth.
The importance of the value creation measures for all stakeholders and disclosure of vital
financial information to shareholders has been well appreciated by family managed
companies, as these firms have matured over the four year period and have graduated from
simply complying with minimum mandatory requirements to voluntary disclosures and
better compliance procedures. These companies have ultimately been rewarded by market
forces as they have outperformed their counterparts across all financial performance
indicators.

| P a g e xix
VI. Recommendations
Medium sized Family managed companies with the prime objective of profit maximization
and greater control of promoter and family over the board and all its strategic decisions,
need to change their mindsets and invest in value creation measures for all their
stakeholders as this is bound to yield higher returns in the long run and higher valuations.
The regulatory authorities need to evolve a more effective monitoring mechanism to ensure
better implementation of the norms of corporate governance. Complying simply with the
mandatory norms is not going to be sufficient to attract good quality investors. The
procedures and processes adopted are even more important to yield the desired results.
Regulatory authorities and even apex industry associations should play the role of
facilitators and advisors to the relatively smaller sized listed companies as with their limited
resources they may not be able to adhere to all the requirements of governance, even
though they may appreciate the ultimate results.
NFCG could consider commissioning a similar study on corporate governance and financial
performance with a larger sample size to establish that there is a positive relationship
between the two. The study could also bring out the improvements made by the listed firms
in their corporate governance practices as this would help in assessing the effectiveness of
the existing regulations.

| P a g e 1
Chapter ‐ 1
Major Issues in Corporate Governance
1.1 Introduction
Corporate Governance from the perspective of business enterprises, is defined as a system
of structures and processes that direct and control companies. It specifies the distribution of
rights and responsibilities among company’s stakeholders (including shareowners, directors
and managers) and articulates the rules and procedures for making decisions on corporate
affairs. Thus corporate governance provides the structure for defining, implementing and
monitoring a company’s goals and objectives and ensuring accountability to its shareholders
and investors.
Within companies, corporate governance issues generally arise from the divergent roles of
Agency and Stewardship. The shareowners transfer their capital to the managers who play
the role of agents. Stewardship refers to the role of directors who act as the guardians of
the company’s assets and have been delegated the authority by the shareowners to act on
their behalf. To maintain an effective relationship between providers of funds to the
company and the mangers of the company, a high level of trust must exist between both.
The Board serves as the conduit between the two.
The foundation of Trust among shareholders, directors and managers can be built on the
four main pillars of corporate governance. These are Transparency, Accountability, Fairness
and Responsibility. These four pillars have provided the foundation for the six principles of
corporate governance, instituted by OECD and expressed in its ‘Principles of Corporate
Governance (2004)’. These six principles are:

| P a g e 2
1. Ensuring the basis of an Effective Corporate Governance Framework‐ transparent
and efficient markets, consistent with rule of law and clear division of responsibilities
among supervisory, regulatory and enforcement authorities
2. The Protection of Rights of Shareowners and key Ownership functions ‐ a framework
that protects and facilitates exercise of the rights of shareholders
3. Equitable treatment of shareowners – all shareholders including minority and foreign
shareholders to be treated equitably and they have a right to effective redressal of
violation of their rights.
4. Role of all Stakeholders in corporate governance ‐ active co‐operation between
corporation and all stakeholders; shareholders, customers, suppliers, employees,
investors and society in creating wealth, jobs and sustainability of financially sound
enterprises.
5. Disclosures and Transparency – timely and accurate disclosures on all material
matters relating to the corporation including financial performance, ownership and
governance.
6. Responsibilities of the Board – framework to ensure strategic guidance to the
corporation by the Board, effective monitoring of the management of the
corporation and Accountability of the Board to the corporation and its shareholders
From a broader perspective of the economic, political and legal environment in which the
companies operate, corporate governance is considered as the foundation of reforms which
strengthens and modernizes a country’s economy in the global market. The more widely
the four principles of corporate governance are applied, the more equitably and effectively
will resources be allocated. International guidelines have been published to advance the
benefits of corporate governance more widely in promoting economic growth, widening the
capital market, encouraging business integrity and thus help in alleviating poverty.
Corporate governance in its broadest sense is therefore the balance between economic and
social goals and between individual and communal goals. The governance framework is
there to encourage the efficient use of resources and equally to ensure accountability for

| P a g e 3
the stewardship of these resources. The aim is to align as nearly as possible the interests of
individuals, corporations and society.1
In the words of Anne Simpson, ‘Corporate governance is the meeting of the private interest
and the public good: Shareholders rely upon effective governance for the investment
returns which fund pensions and insurance and protect savings; for companies it underpins
both enterprise and accountability; for the wider community transparency and
accountability in governance is vital for ensuring prosperity and the contribution to the
public purse upon which social welfare relies.2
Having a good corporate governance philosophy and a well documented corporate
governance framework is imperative for business enterprises, (both listed and unlisted), for
investors including Banks, Financial Institutions and above all for the State.
The major incentive for corporations to adopt internationally accepted governance
standards is that these standards assist them in achieving their aim of attracting investment,
both domestic and international. For States, adoption of governance standards, enables
them to strengthen their economies and encourage business probity.1
The convergence of both these standards has its impact on the development of Capital
Market with different categories of players.
A well developed capital market is an indication of economic growth and many studies have
emphasized the linkage between capital market development and improved resource
allocation and economic growth. Other studies have evidenced that development of capital
market is related to protection of minority investors which is an essential element of good
corporate governance. (La Porta et al., 1997, 1998 and Gleaser, Johnson and Shleifer,). 3
The effectiveness of corporate governance is dependent on myriad factors and cannot
simply be measured by profitability, growth or share performance. There are many variables
1 Sir Adrien Cadbury – Foreword to a Study by Stijn Clacssens on Corporate Governance and Development in ‘Focus’ – Global Corporate Governance Forum. 2 Introduction to International Corporate Governance Network Yearbook 2005, Anne Simpson, ICGN 3 La Porta et al, 1997, 1998 and Shleifer, 2000, ‘Investor Protection and Corporate Governance’, Journal of Financial Economics, 58.

| P a g e 4
that affect these measures. However it would be a fair assumption to make that good
governance helps to maintain market confidence and financial stability.
All countries have their own unique system of corporate governance, reflecting different
economic, cultural and legal environment. While rules and regulations are central to good
governance, an overly stringent regulatory system such as Sarbanes Oxley Act in the US may
not have the desired effect.
Thus, Litvak, 2007 and Romano, 20094 in their studies have supported a more flexible
approach to governance, which leaves room for firms to adjust their governance to firm
specific needs. This is reflected in the Comply or Explain rules of UK Combined Code of
Corporate Governance. (Financial Reporting Council, 2006).
According to Sir Adrian Cadbury, how widely the benefits of good governance are
distributed depends on the institutional and structural context within which firms carry out
their activities. Corporations work within a governance framework which is set by laws of
the country, regulations and the company’s own constitution set by those who own and
fund the company and by the expectations of those it serves. The framework will differ from
country to country and its effectiveness depends on its coherence and on the degree of
reliance that can be placed on its constituent parts.
1.2 Variances in Corporate Governance Practices
The factors affecting the efficiencies of capital markets are many, the more important being
good liquidity and low transaction costs. The availability of high quality information also aids
efficiency and maintains investor confidence and overall market attractiveness. Given these
factors and the regulatory and legislative measures that support efficient markets there are
4 Litvak Kate, (2007) ‘The Impact of the Sarbanes –Oxley Act on Non-US Companies Cross Listed in the US’ Journal of Corporate Finance, Vol. 13 and Romano Roberta , 2009, ‘Does the Sarbanes Oxley Act have a Future?’ Yale Journal on Regulation, Vol. 26
| P a g e 5
some distinct variations in the manner in which capital markets function in the developed
and developing economies.
Most developed markets are associated with dispersed share ownership and fragmented
ownership structures. Here the key concerns are monitoring management and ensuring that
managers act in the interest of the shareholders. Institutional shareholders like Insurance
companies and pension funds are relied upon to safeguard shareholders’ interests.
In developing and emerging markets, ownership is concentrated and large shareholders
(promoters or founding family members) dominate and influence management at times to
the detriment of minority shareholders’ interests. Institutional directors are not very
experienced or influential and disclosure and transparency norms are still being evolved.
Implementation and enforcement of laws is weak. Conflict of interests arise out of cross
holdings of shares (companies own shares in one another). The regulatory framework for
companies in such markets and the ensuing monitoring mechanisms, have to be drawn up
keeping in mind the characteristics of the constituent firms.
Depending on the maturity of the markets and legal, ethical and financial environment, each
country has to devise its own regulatory framework for corporate governance. But yet the
real standards of corporate governance can only be determined by the measures the
companies themselves adopt either voluntarily or otherwise to improve the way they are
directed and controlled. These measures are guided by the size of the firms, their structure
and ownership and their priorities. For smaller sized firms, which, are family owned or
controlled corporate governance at times can become a handicap. Yet, as companies
expand and diversify and embark upon organic or inorganic growth there is a corresponding
need for long term investments from outside. These funds of course come at a cost‐
loosening of control, greater accountability and investor protection – which are the
fundamental principles of good governance.

| P a g e 6
1.3 Corporate Governance High on the Agenda of Corporate and
Countries
Corporate governance has currently become an immensely debated issue for corporate
entities, financial institutions and even State owned enterprises. This is because
globalization and the increased cross border flow of funds require enhanced levels of
accountability and transparency which can invoke greater trust from the investors. Private
capital has today become an important source of funds for investment. Private Equity firms
not only act as financial investors but also at times advise the companies on operational
matters like diversification, shifts in business focus, talent search, etc. Despite the inherent
variations in their ownership structures and management practices majority of firms today
are looking out for private equity from international investors. But this is increasingly
channeled through Institutions who act as intermediaries. Funds seek acceptable returns
wherever they are placed. In looking for the spreads of risks and rewards, the standards
adopted for corporate governance by companies have a measurable role to play. The
Institutions would invariably assess the borrowers applying the same tests of security and
rate of return wherever they place their funds in the world. This calls for convergence of
corporate governance regulations and standards which is not always feasible given the
divergent nature of firms across developed and emerging economies.
What can be expected out of companies whether privately held family owned businesses or
widely held or state owned enterprises is that they follow the basic pillars of corporate
governance identified by OECD – Fairness, Transparency, Accountability and Responsibility.
If corporations have to earn the trust of their investors or fund managers, they will have to
be open about their objectives and the way they would be going about achieving these
objectives. Resources flow to companies which inspire Trust. Hence the principles of
Transparency and Disclosures are the key to investor confidence which in turn is an
important element of the firm’s long term financial performance.
| P a g e 7
1.4 Does Good Governance Impact Financial Performance?
Several studies focusing on developed and emerging markets have concluded that well
governed companies have registered better performance in financial terms. Adoption of
best practices in Governance has led to:
a) Improved access to external financing resulting in greater efficiencies due to greater
knowledge of investors with regard to the company’s strategies
b) Lower cost of capital
c) Improved operational performance through more efficient management and better
asset allocation
d) Better financial performance and company valuation as seen in:
i) Improved Economic Value Added (EVA) ‐ A Credit Lyonnais South Asia (
CLSA) 20015 study of 100 largest emerging markets, has shown that best
corporate governance practices in emerging markets had 8 percentage
points higher EVA than the average of all firms in the country.
ii) Improved Profitability – An ABN/AMRO Study of Brazil based firms6 with CG
Ratings showed that their P/E ratios were 20 percent higher, RoEs at 45
percent higher and Net margins 76 percent higher than those with below
average CG practices. A Study by L Brown and M Caylor of Georgia State
University7 in 2004 has shown that well governed companies outperformed
poorly governed ones by 18.7 percent in terms of RoI and 23.8 percent for
RoE.
iii) Higher Returns on Assets – Research by Sung Je Byun of Columbia University
in 20068 concluded that firms with superior corporate governance practices
5 CLSA ‘Saints and Sinners: Who’s got Religion’, CLSA Corporate governance Watch, April, 2001 6 B. Erbiste,’Corporate Governance in Brazil: ‘Is there a link between Corporate Governance and Financial Performance in the Brazilian Market?’ ABN AMRO, Asset Management, July, 2005 7 L. Brown & M. Caylor ‘Corporate Governance & Firm Performance’ Dec. 2004, SSRN 8 Governance Metrics International (GMI), Global Survey

| P a g e 8
had higher RoE and better RoA and RoC. (Return on Capital). For top rated
companies the RoE was 14.35 percent while for the bottom level companies
it was 9.20 percent . RoA of top rated companies was also higher at 4.81
percent compared to 3.46 percent for the bottom based companies.
Return on Capital (RoC) was also better at 10.26 percent compared to 6.69
percent .
iv) Higher Firm Valuation and Share Performance – Company Valuations were
higher and investors were willing to pay higher share premiums ranging up to
30‐40 percent for better governed companies. This was concluded by a
McKinsey Survey in 2002,9 across all countries including Eastern Europe,
Africa, and Asia.
A similar pattern was observed in a Study of 2000 companies over a five year
period carried out by R Grandmont et al for Deutsche Bank10 in Latin America,
Africa, Eastern Europe and Middle East in 2004. The Study had identified
higher valuation premiums in terms of Price/Cash Flow, Price/Earnings,
Earnings Value/EBITDA and Price/Book Value
More recent research by P Gompers, J Ishii and A Metrick11 on 1500 large US
companies in the 1990s has indicated that superior corporate governance
practices retain a significant impact on a company’s market value and higher
returns to shareholders. US based firms with better governance had faster
sales growth and were more profitable than their peers.
9 McKinsey Global Opinion Survey, New York, Mckinsey, 2002 10 Renato Grandmont, Gavin Grant and Flavia Silva, ‘Beyond the Numbers, Materiality of Corporate Governance ‘ Deutsche Bank,Nov. 2005 11 P. Gompers, J Ishii and A Metrick ‘Corporate Governance and Equity Prices’ , Quarterly Journal of Economics, 118(1):107-155

| P a g e 9
v) Reduced Share Price Volatility ‐ The study by Brown and Caylor12 referred
above also concluded that well governed companies had a share price
volatility which was 5.6 percent below average.
vi) Reduced risk of corporate crises and scandals ‐ Companies with good
corporate governance practices are known to incorporate effective risk
management systems and are hence better equipped to cope with crises.
A Study by J Derwall and H Vervijmeren, ‘Corporate Governance and the Cost
of Equity Capital: Evidence from GMI’s Governance Ratings’ in 2007 for US
companies and H Ashbaugh Skaife and Ryan la fond 200613, concluded that
firms with better governance present lower agency risks resulting in
shareowners’ and lenders’ willingness to provide capital at a lower cost to the
company.
1.5 Why the Focus on Corporate Governance in Family Owned Firms
In most locations outside USA and UK, especially in the emerging markets in India and East
Asia, family owned or family managed firms contribute the bulk of industrial output and
have a significant share in market capitalization. Ownership in such firms is often
concentrated within the controlling family.14
Members of these controlling families hold their shares by use of pyramids, cross
shareholdings and indirect ownership to expand the divergence between control rights and
shareholder rights, (Sacristan – Navarro and Gomez‐Anson 2007)15. Problems arise when the
controlling family shareholders tend to expropriate funds against the interests of the
12 Brown and Caylor, op cit. 13 J Derwall, H Verwijmeren, ‘Corporate Governance and the Cost of Equity Capital: Evidence from GMI’s Governance Rating in 2007, and H Ashbaugh Skaife and Ryan La Fond, ‘Firms’ Corporate Governance and the Cost of Debt’,an Analysis of US Firms, GMI Ratings’ in 2006, 14 ‘Corporate Governance in India – Evolution and Challenges’, Rajesh Chakrabarti , College of Management , Georgia Tech, Atlanta 15 Sacristan‐Navarro, M, and Gomez‐Anson, S (2007), ‘Family Ownership and Pyramids in the Spanish Market’. Family Business Review, No.20.
| P a g e 10
minority shareholders. To add to the problems the boards in these family controlled firms
are not very independent (have fewer independent directors) and disclosure norms are not
appropriately followed.
The above problem of family ownership and control is even more exacerbated in emerging
markets like India, where majority of publicly traded firms have highly concentrated
ownership structures.
The share of promoters/owners/promoter groups in total equity holdings is higher at 50
percent or even higher, with promoters exerting greater authority over management and
significant influence over major company decisions. Disclosures and Transparency norms are
not fully developed and even if they are regulated, they are not generally complied with.
Boards are not fully independent and conflicts of interest arise due to cross share
ownership. More importantly implementation and enforcement mechanisms are weak.
The Indian corporate landscape is no different from that in other emerging countries and is
marked by concentrated ownership of equity, pyramiding and tunneling of funds among
group companies. Independent directors on boards have largely been ineffective and
institutional directors have by and large failed to carry out their monitoring functions.
Enforcement of corporate laws has remained soft. Pyramiding and Family control of
businesses is quite evident as seen by the high shareholding of promoters averaging as high
as 48.1 percent in 2002 (Topalova 2004).
The Satyam episode is a case in point of drastic shortcomings of the Boards and their
failures particularly those of Independent Directors to detect glaring mismanagement and
expropriation of funds by promoters.
Though there has been a steady improvement in the corporate governance regulatory
norms and guidelines has improved steadily in India, largely based on the patterns followed
in UK and USA, the bigger challenge of implementation of rules at the ground level still
remains. While companies like Infosys, the Tata Group, the Godrej Group, in keeping with
the international trends, have voluntarily adopted higher standards of governance and CSR
| P a g e 11
even beyond the regulatory requirements, there are a significantly large number of
companies with concentrated ownership and control, which have done nothing beyond
mere compliance with the mandatory regulations.
1.6 The Present Study by SPJIMR
It was against this backdrop of the prevailing Corporate Governance scenario in India and
the practices adopted by majority of family managed listed companies, that the present
study was conceptualized. As will be seen later in the subsequent chapters, a series of
studies across developed and developing economies in USA, Eastern Europe, Brazil, and East
Asia, have concluded that superior corporate governance standards have greatly influenced
the long term equity performance of listed companies. It has been affirmed that investors
including global institutional investors are willing to pay significantly higher premiums for
shares of well governed companies. Better governed companies also have higher valuations,
reduced share price volatility and faster growth in turnover. Considering these and several
other benefits, it was necessary to bring into focus the importance of good governance in
our Family Managed companies.
Secondly, our regulatory framework for Corporate Governance is still being evolved. The
Companies Amendment Bill, 2011 is yet to be enacted. The debate whether too much
regulation leads to indifference and thus evasion is still continuing in corporate circles. At
this stage what is more required is an improved monitoring mechanism to ensure better
implementation. Compliance with regulatory norms apart, adoption of better governance
standards should be a voluntary process and emanate from within the board rooms of the
corporate themselves. Understanding the impact of effective corporate governance
practices and higher ethical standards, on the long term financial performance of firms is
important for promoters of family owned firms. It needs to be recognized that good
governance adds value by improving the firm’s performance through more efficient and
transparent management and better asset allocation. This could provide a strong motivation
for strengthening the governance mechanisms in these firms. Our study thus strives to

| P a g e 12
create a case for a better realization of the long term benefits of good governance standards
and the need to strengthen the compliance processes adopted by listed and even unlisted
companies in India.

| P a g e 13
Chapter ‐ 2
Study on Corporate Governance and Financial Performance
In Medium‐sized Family Managed Companies
2.1 Background
National Foundation for Corporate Governance (NFCG) has accredited S P Jain Inst. of
Management and Research (SPJIMR) as a partner institute to carry out research and
conduct training programs relating to corporate governance practices in India.
Since 2007, SPJIMR has been engaged in research studies on Corporate Governance based
on primary survey of family managed listed companies and secondary data from Annual
Reports of these companies. The Institute submitted its first Study, ‘Best Practices in
Corporate Governance by Medium‐sized Family Managed Companies – Three Case Studies’
in March 2010. A Round Table on Excellence in Corporate Governance was also organized by
SPJIMR in 2009 to discuss the findings of the Study in an open forum. The proceedings of
this Round Table were also incorporated in the above Study.
The Institute had also carried out a short two day training program for promoters and
mentors of family managed companies in 2009 as part of its mandate for creating greater
awareness of Corporate Governance norms and practices in India.
The proposal for the present study was submitted to NFCG as part of its Work Plan for the
year 2010‐11. Due to some time constraints there was a spill over to the year 2011‐12. The

| P a g e 14
present study, ’Corporate Governance and Financial Performance in Medium‐sized Family
Managed Companies’ was initiated in the light of the increasing importance of good
governance in a company led by a strong and independent Board.
2.2 Concentration of Ownership and Control in Family Managed Firms
In most countries outside USA and UK, especially in the emerging markets in East Asia,
family owned or family managed firms contribute the bulk of industrial output and have a
significant share in market capitalization.16 Asian economies as a Group share certain
common features that affect the nature of corporate governance in the region. Most Asian
countries are marked with concentrated stock ownership and preponderance of family
controlled businesses. Corporate governance issues have been of critical importance since
the Asian crisis which is believed was partly caused by lack of transparency and poor
corporate governance.17
Ownership in such firms is often concentrated within the controlling family. Serious
problems arise when these controlling families expropriate the interests of minority
shareholders. A few studies have argued ( Scott, 2003)18 that firm managements can select
accounting policies to serve their own interests like maximizing self bonuses affecting the
share value of the firm Family owned firms hold their shares through complicated cascades
of intermediate firms using methods of indirect ownership, pyramids and cross holdings to
construct control chains that separate cash flow rights and control rights .This is the main
cause of inducing agency problem between controlling families and minority shareholders,
which in turn will lead to other incentives to engage in earnings management. Having less
independent boards and fewer disclosures in regard to corporate governance add to the
16 Classens Stijn, Simon Djanokov, Joseph P H Fanand Larry H P Lang, 2002, ‘Disentangling the Incentive and Enhancement Effects of Large
Shareholdings’, Journal of Finance, 57(6). 17 ‘Survey of Literature on Corporate Governance in Asia’ 18 Scott W R, 2003, ‘Financial Accounting Theory’, Toronto, Canada, Prentice Hall.

| P a g e 15
problem. A Study by Sciacia and Mazzola , 2008 19 found that family firms where family
members’ involvement in management is high, have worse financial performance because
family members have less professional competency, less social capital, more conflicts
among family members and a trend towards non‐financial goals rather than financial goals. A more recent Study by Mei‐Lyng Yang, ‘The Impact of Controlling Families and Family CEOs
on Earnings Management, 2010’ 20, has concluded that in firms with controlling families, the
higher the level of insider ownership the larger the magnitude of discretionary accruals.
Earnings management is one way in which controlling families decrease earnings quality to
expropriate the interest of minority shareholders. Secondly, non‐family CEOs in these firms
have a tendency to manipulate earnings. The Study has strongly recommended that
governance mechanisms of family owned firms need to be strengthened. This will increase
the level of trust of outside investors in family firms and lower the cost of capital and in turn
enhance the value of the firm.
In the light of the above corporate governance scenario in emerging economies and their
need to attract foreign investment and expand through cross border acquisitions and trade,
it is imperative that good governance practices are embedded in their culture as this would
have long term implications on the performance of the firms, particularly family controlled
firms.
2.3 Relationship between Corporate Governance and Financial
Performance in India
A large majority of the firms listed on Indian Stock Exchanges are those in which ownership
is concentrated within the promoting families. Promoters exert considerable influence over
management and consequently over all major decisions. Minority shareholders who are
19 Sciacia, S & Mazzola R, ‘Family Involvement in Ownership and Management, Explaining Non‐linear Effects on Performance’, Family
Business Review, No. 21. 20 Mei‐Ling Yang, ‘The Impact of Controlling Families and Family CEOs on Earnings Management’ , Family Business Review, 23(3)
| P a g e 16
usually not well aware of the company’s operational aspects have to be content with
financial returns on their equity holdings. As long as the company is doing well financially,
promoters or the controlling family groups do not have sufficient motivation to invest in IT
related infrastructure or highly skilled manpower to put in place superior corporate
governance practices like setting up a separate Risk Management Dept., or installing state‐
of‐the–art IT systems for internal controls or constituting separate board level committees
for nomination and remuneration of directors and senior management personnel.
Disclosures to minority shareholders through annual reports or through postings on the
company websites are minimum. Concern for the welfare of other stakeholders in the
company like suppliers, consumers, employees and even Society at large is limited. In short
compliance to corporate governance norms is there but only in letter and not in spirit.
Whether this situation would be sustainable in the long run is debatable.
This issue of corporate governance and its impact on the performance of the firm has not
been researched well in the Indian context though abroad innumerable studies have been
carried out on this subject. The Satyam episode and the resultant financial mismanagement
which went against the interests of the investors and minority shareholders had triggered a
serious debate on the lacuna in the shareholders’ awareness of good governance practices
and the deficiencies in the monitoring mechanisms of regulatory agencies with respect to
compliance of the governance norms and provisions.
Our focus on corporate governance and its relationship with the company’s financial
performance attempts to examine this oft debated issue of family ownership and control
and its impact on the overall financial performance of the company and in particular the
returns to the minority shareholders . Effective implementation of corporate governance
practices in a long term sustainable manner is expected to benefit all stakeholders including
the controlling shareholders and would result in higher firm valuations in the long run.

| P a g e 17
2.4 Family Managed Business – A Pioneering Management Program of
SPJIMR
S P Jain Institute of Management & Research, Mumbai, India has been the pioneer in
launching a specially tailored management program for promoters of Family Managed
Companies and their second and third generation successors and family member directors.
Since 1997, SPJIMR has conducted 15 Post Graduate Programs in Management of Family
Managed Businesses for directors and young family members of family owned enterprises.
Considering the Institute’s expertise and domain knowledge on Family Managed Businesses
it was relevant to focus on this group of companies for our Study.
2.5 Objectives of the Study and Approach
Objectives of the Study : To explore the relationship between corporate governance
practices and financial performance of medium‐sized family managed companies.
Definitions : For the purpose of the Study, we have defined Family Managed Companies as
those having promoters’ shareholding of 25 percent or more in the total shareholding of the
company. Medium‐sized companies are those with total assets ranging from Rs. 200 crore
to Rs. 2000 crore.
To get more meaningful results the sample was narrowed down by eliminating companies
which were subsidiaries of large business houses or those promoted by them. Hence
companies promoted by the house of Tatas, the Birla Group and the Ambani Group were
excluded from the sample.
Sample Size : As this Study was intended to be based on desk research , the sample size for
the final analysis was determined to be 57, though the final database constituted over 100
companies spread over various asset classes.

| P a g e 18
Statistical Analysis : The Study entailed the development of a set of quantitative models to
analyze the impact of corporate governance practices on selected financial parameters of
the firms selected for the research.
We attempted to study whether consistent corporate governance practices resulted in
improving financial performance. To conduct the Study approximately 82 indicators of good
governance practices were identified covering the broad categories of (a) Mandatory
parameters, (b) Non‐mandatory parameters – Clause 49 and Non‐mandatory parameters –
Voluntary Guidelines and (c) Parameters Beyond Compliance. The Study attempts to
examine whether good corporate governance leads to better financial performance using
Regression Analysis.
A host of financial parameters were considered for the purpose. These variables include:
Tobin's Q, Debt Equity ratio (DE), Interest Coverage (IC), Returns on Assets (ROA), Return on
Net Worth (RNW), Return on Capital Employed (RCE), Excess of Returns over Nifty (ER),
Earnings per Share (EPS), Total Assets (TA), Annualized Yield (AY) and Average Annual
Market Capitalization (AMC). It was observed that adherence to corporate governance
norms and regulations has improved from 2006 to 2010, as far as the sample data are
considered. Results also show that corporate governance parameters explain to an extent of
45 percent of the variability in financial parameters, e.g., Tobin's Q.
Using statistical models, the direction of movement of the variables under the broad
categories of corporate governance practices and financial performance was determined.
The Study has identified the depth of the relationship between the variables and whether
there was a pattern over a period of time.
It can be seen from the objectives and the research methodology proposed that the Study
intended to bring out the materiality of corporate governance on company’s financial
performance and share prices or market capitalization. The focus is on medium sized, family
managed, listed companies as defined above, since such companies constitute a significant
proportion of companies listed with BSE and NSE.

| P a g e 19
The findings of the Study are important to regulators, investors and academics who contend
that good CG is important for increasing investor confidence and good firm performance.
The focus on Medium sized Family Managed Companies is unique to our Study as most
other studies, in India particularly, have assessed the corporate governance practices of all
listed companies without distinguishing between their ownership structures and control
mechanisms. These two factors significantly affect the governance practices of these
companies as well as their financial performance.

| P a g e 20
| P a g e 21
Chapter ‐ 3
The Structural Models of Family Firms
3.1 What Are Family Managed Firms
Before entering into the debate regarding corporate governance practices in family owned
and controlled firms and their impact on firm performance, it would be pertinent here to
understand the structure and operations of family owned firms. A family owned business
is defined as a business where a single family owns the majority of stock and has total
control. Family members also form part of the management and make the most important
decisions concerning the business.
Family businesses draw their inherent strength for survival from shared history, identity
and a common language of families. It is only in these enterprises that commitment to the
point of self sacrifice can be expected in the name of general family good. When owners
and key managers are bound by family bonds, their values, traditions and priorities spring
from a common source.21 When working well together families can bring to the company,
the level of commitment, long term vision and investment, speed of action and love and
devotion to the company that non‐family businesses yearn for.
According to Sir Adrian Cadbury, in “Family Firms and their Guidance; Creating
Tomorrow’s Companies from Today’s”, the keys to success of a family business are:
A clear and understood structure separating governance of the firm and affairs of
the family;
An effective board with competent independent outside directors;
21 ‘Generation to Generation Life Cycles of the Family Business’ Kelin Gersick, John Davis, Marion Hampton and Ivan Lansberg, Harvard
Business School Press

| P a g e 22
Logical structure of the firm with clear chain of command and decision making
process;
Well documented and respected recruitment, promotion and compensation
policies.
A brief overview of the different models of family firms would explain the development
cycles that a family firm goes through before it reaches the final stage of maturity.
3.2 Conceptual Models of Family Firms
Model 1. The Two‐System Model
Early stage classic models of Family firms focused on the two overlapping sub‐systems in a
Family firm – Family and Business. Each of these sub‐systems had its own norms,
membership rules, value structures and organizational structures. The key challenge was to
find strategies that satisfied both these sub‐systems.
Problems arose since the same individuals had to fulfill obligations in both the systems e.g.
as parents and professional managers. In addition the business had to operate on sound
business practices and principles while meeting the family needs of employment, identity
and income.
Model 2. The Three Circle Model
The two‐system model was later elaborated by Tagiuri and Davis at Harvard in the early
1980s. They argued that the family firms need to make critical distinction between
ownership and management within the business circle. Some are owners but not involved in
business operations while others are managers but do not control shares. As a result the
three circle model emerged. (See Exhibit I). The three circle model describes the business as
three independent but overlapping sub‐systems. Business, Ownership and Family. Any
individual in a family can occupy any one of the seven sectors formed by the overlapping

| P a g e 23
circles. A person who has only one connection to the firm can be in one of the outside
sectors, 1, 2 or 3. On the other hand persons who have more than one connection will be in
one of the overlapping sectors.
Exhibit I : The Three-Circle Model of Family Business
The centre sector 7, would hold an owner who is also a family member and works as an
employee of the firm. Specifying different roles and subsystems helps in breaking down the
complex interactions within the family business and makes it easier to see why each family
member would take decisions regarding major business policies like dividend distribution or
succession. This model has provided a useful tool for understanding the source of inter‐
personal conflicts, role dilemmas, priorities and boundaries of family firms.
Model 3. The Development Model
With the passage of time and as the business grows many changes take place in the
organization and family. As individuals move across boundaries inside the system, the whole
business changes. There may be new entrants in the business from the next generation or a
senior family member/employee may be retiring or shares may be passed down to new

| P a g e 24
individuals or family members. These transitions form a continuous process. By adding these
developments over time to the three circles model, a three dimensional developmental
model is formed. (See Exhibit II). This model represents the sequence of changes that each
of these sub‐systems go through.
Exhibit II: The Three-Dimensional Developmental Model
i) Ownership Developmental Dimension : This explains how the business moves from the
Controlling Owner to his off springs ‐ Sibling Partnership and then as the siblings grow and
expand their own families it grows into Cousin Consortiums. Other new owners are added
either from the family or outside in the form of shareholders or trusts. Hence the ownership
structure is continuously evolving and this dimension helps in understanding what type of
ownership structure the company has developed. Our study has considered family owned
firms which have dispersed ownership but yet 25 percent or more of the equity is held by
the expanded family.

| P a g e 25
ii) Family Development Dimension : This captures the structural and inter‐personal
development of the family through marriages , parenthood and sibling relationships. This
dimension explains how the original young business family grows and how young adults
from the next generation enter the business and chalk out their career paths. The Working
Together stage is most crucial as three generations of different age groups would be
attempting to manage complex relations as parents, siblings, in‐laws, cousins and children
of different ages. Different career paths and personal agendas put a strain on the business.
Family communications and clear operating procedures are important at this stage.
iii) Business Developmental Dimension : This dimension describes how the business grows
from a start‐up and matures and expands into a Business House. The expansion stage covers
a broad spectrum of companies which are trying to shape the growth curve and emerging
structure of the business to serve the need of the evolving ownership group and the
developing family. Family businesses at this stage experience both positive and negative
consequences of growth and increased opportunities. If the business succeeds new
opportunities of growth are created for owners and acceptable returns on investment are
generated for both family and non‐family owners.
The final Maturity stage on the Business Axis requires market assessment and
determination, whether the business products are evolving or are losing the market. Even
when the company is operating with extraordinary efficiency there are forces of change
from outside which will affect its existence. There are two ways out‐ Renewal or Recycling
or the Death of the firm. The rationale for categorizing businesses in these three models is
to provide a framework for the development of family businesses over time and in each
dimension and to understand how the combination of stages across ownership, family and
business can help us to analyze the dynamics of any family firm.

| P a g e 26
3.3 Governance Structures in Family Businesses
When the family business grows into the maturity stage, it tends to become more complex
with ownership being both direct and indirect. The family holdings are generally in the
hands of Trusts with a few trustees wielding authority over the company’s destiny.
Succeeding generations may however challenge the legal structure framed by the principle
owner. The best way says Ivan Lansberg to keep the shareholders happy is to establish
forums where the issues and concerns of the business, shareholders and the family can be
openly discussed and constructively challenged. – Good Governance22
According to Lansberg the three pillars of family business governance are:
i) The Board of Directors
ii) The Shareholders’ Assembly
iii) The Family Council
Good governance is the smooth and effective interplay of all these three after a complete
understanding of its rights, privileges and responsibilities.
The Family Council constitutes family shareholders and managers and also other family
members whose lives are affected by the business. The Council addresses vital issues which
promote the welfare of the family members. These can intrude upon the work of the Board
or the Management.
But the Family Council is important since here the family’s core values are articulated,
policies are elaborated and conflicts resolved. In this, the Council sets the tone and pace of
Good Governance. As John A Davis senior lecturer in Entrepreneurial Management Unit at
Harvard Business School puts it, there is a need to have a family assembly and a family
council.
22 Succeeding Generations : Realizing the Dream of Families in Business’ by Ivan Lansberg

| P a g e 27
The family assembly is made up of all families in the business. The Council directs the
selection of leadership, the process of succession planning and plays a vital role in guiding
the board and management on the principles and values to be upheld by them. In this way it
benefits all the families by creating policies and strengthening business‐family
communication and bond. Amongst the policies a family council might create include:
• Employment standards for the next generation
• Career development policies for family employees
• Family compensation
• Succession process including retirement ages
• Ownership including buy‐sell agreements
• Dividends
Hence it is advisable that there is an overlap in the membership of the Board and the Family
Council. Davis adds that a family council or family assembly complements rather than
replaces the board of directors. Each of the above policies except ownership needs to be
consulted with the board and board’s endorsement obtained before it becomes official. It is
even more pertinent to have a Family Constitution which over a long term defines the vision
of the future, its core values and beliefs and its succession process.
3.4 Family Businesses in India
It has been observed in several studies conducted in India that 33 percent of all family
businesses survive to the second generation and just 13 percent to the third generation and
only 4 percent go beyond the third generation. Nearly one‐third of the family businesses
disintegrate due to generational conflicts.
Despite several odds, the forces that have helped Indian family businesses to survive are the
close‐knit family structure, team work combined with respect for elders and perpetuation of
family values.
| P a g e 28
Worldwide family managed or family owned businesses account for 65 – 80 percent of all
businesses.23 Most of these are small scale proprietorships, but it is also affirmed that a
significant number of them are among the largest and most successful businesses. In India
family businesses contribute as much as 60‐70 percent of GDP and though complex in their
structures their presence is critical to the growth and development of our economy. Family
owned businesses that have attained higher growth and consistent success in India are
those that have expanded and diversified beyond their original set‐up, displayed long term
vision, ability to adapt and become truly professional on a global scale.
The rapid influx of private equity in India in almost all high growth sectors – telecom,
broadcasting, media, hospitality, infrastructure etc. has prompted the Indian family
businesses to restructure and adapt to the changing environment through strategic tie‐ups
with foreign investors to gain maximum benefits from the opening up of the economy.
A new global study on family businesses by Grant Thornton, a consultancy firm (2003) has
declared that as many as 46 percent of Indian businessmen feel that their successor should
come from within the family. In comparison only 22 percent of North Americans and 24
percent of Europeans subscribe to this view.
Dynasties of Firms in Indian Industry
A Special Report, ‘Adventures in Capitalism’ by Patrick Foulis published in The Economist,
Oct. 22, 2011, refers to India as a land of red hot start‐ups and new entrepreneurs but
emphasizes the dynastic nature of firms led by some of the most prominent captains of
Indian industry. In terms of value added, the Report says, Indian Capitalism is concentrated.
A Govt. Survey of nearly 2,00,000 service firms formal and informal in 2007, concluded that
the top 0.2 percent firms had accounted for 40 percent of total output and that two states,
Maharashtra and Karnataka collectively contributed to half the output. The Report states
that nearly 70 percent of Indian Stock Market value is concentrated in the BSE 100 index of
the largest firms. India accounts for 3 percent of the world’s stock market.
23 Dreux D. R. 1990, ‘Financing Family Business: Alternatives to Selling Out or Going Public’ Family Business Review III (3).
| P a g e 29
Commenting on the unusual ownership structure of Indian firms the Report says that it was
only after liberalization that the conventional family owned firms were exposed to fierce
competition from within and abroad, due to the opening up of the economy and decontrols.
In the post liberalization regime, many family owned firms have fizzled out. Of the largest 20
listed firms on the stock market, only five remain today in a recognizable form among the
top 20 private firms ranked by market value.
A nine year analysis of the shares in total profits of top 100 Indian listed firms by ownership
shows that a large chunk of around 41 percent of the aggregate profits were generated by
State controlled companies ( oil and coal). Blue chip firms controlled by Institutional firms
like ITC and subsidiaries of foreign firms like Hindustan Unilever, together account for only
18 percent but a significantly large share of 41 percent was contributed by firms under
some form of family or founder control. This includes profits of Tata Sons, though most of its
shares are owned by family trusts which are meant to be independent entities.
The Report has observed that the dynamic Indian market has witnessed the entry of fresh
new firms like the Adani Group’s empire of ports, power and coal built by Gautam Adani and
Sun Pharmaceuticals, a global generic drugs manufacturer, or first generation entrepreneurs
from sunrise industries like telecom and IT – Bharati Airtel and HCL. Yet the older family
owned giants like the Tata Group, Birla Group, Godrej Group and Reliance Industries have
adapted, matured and continued to hold their position in the market. These successful
Family Managed companies in India are adaptable, ingenious and combustible and form the
backbone of India’s private sector. Structurally these firms are conglomerates with one or
two core activities and a chain of other subsidiary or associate firms. This cascading of firms
has helped them to access foreign capital without losing family control. Being controlled by
family owners, capital is largely ploughed back in existing or new but related businesses –
Vertical Integration or Horizontally. The question remains whether the need to raise capital
to finance growth will dilute the family’s stake or will they hold their own under a regime of
private equity and take‐over.
The other problem faced by these companies is that of succession. The family
conglomerates have expanded under the founders who have been running the businesses,
| P a g e 30
but with foreign investment coming in and the second generation seeming to be a detached
group, this problem could assume serious proportions.
Just as Indian economy has opened up to large foreign investments in all major sectors,
India Inc. has also launched several mega take‐overs like that of Corus by Tata’s and Zain (
African mobile operator ) by Bharati Airtel, These are of course the preserves of Big Groups.
But the medium and smaller sized family conglomerates like Godrej Consumer Products
have also been looking outward for inorganic growth. The author terms them as ‘Pocket
MNCs’ , using a series of bolt‐on acquisitions to build up a strong presence abroad. Indian
companies especially publicly traded companies of which family firms constitute a
formidable sub‐group, will have to work towards raising their governance standards, better
accounting practices, greater transparency and sharing of information, which will earn them
greater trust and hence long term financial benefits. As these family owned or managed
businesses attempt to forge partnerships with investors abroad, they will have to
concentrate on their competitiveness and responsibility. Competitiveness is driven by risk
appetite which pushes the businesses to build bigger and stronger enterprises.
Responsibility is defined by commitment to environment, social benefit and good
governance. Concentration on such practices would add credibility to the companies which
are aspiring to attract long term strategic capital from global investors.
3.5 Focus of SPJIMR Study
Our Study on Corporate Governance and Financial Performance of Family Managed Firms is
therefore rightly focused on this diverse conglomerate of firms at different stages of
maturity. Leaving the big Groups aside we have attempted to study the prevailing
governance practices in medium sized firms with total assets between Rs. 200 crore to Rs.
2000 crore and examine their relationship with the financial performance of these firms. All
the selected companies have reached the top end of the Three‐dimensional Development
Model. On the Business Axis all have been listed and reached the stage of Maturity and are
looking for investment from public. Ownership is diversified – Cousin Consortium stage, with

| P a g e 31
many shareholders belonging to the same family or Group. The firms are large enough with
strong growth paths to attract outside investors but they constantly have to weigh the
attractiveness of new capital sources against the cost of giving up ownership. The Study
attempts to test the hypothesis that ‘Better Corporate Governance results in better
Financial Performance’.

| P a g e 32

| P a g e 33
Chapter ‐ 4
Regulatory Framework for Corporate Governance in India
4.1 Evolution of Corporate Governance in India
Corporate governance has become a central issue in developing countries particularly since
the Asian crisis, which is believed to have been partly caused by poor governance and lack of
transparency in East Asian countries. Asian economies as a group share certain common
features that affect the governance practices in the region. Businesses in most Asian
countries are marked with concentrated ownership and preponderance of family control or
state control forming an important component of the corporate sector in these countries.
This has led to what is known as pyramiding of corporate control, tunneling of corporate
gains to other family owned entities and expropriation of minority shareholder value. It is
due to the prevalence of these practices that the legal framework for corporate governance
in these Asian countries and India has come under strict scrutiny.
In terms of corporate laws and financial regulations, India has emerged far better than other
East Asian countries. The Companies Act 1956 has been the foundation of Corporate
Governance and Accounting Systems in India. Since liberalization wide‐ranging changes
were brought about in the laws and regulations relating to the financial markets. The single
most important development has been the establishment of Securities and Exchange Board
of India (SEBI) in 1992. SEBI has played a crucial role in establishing the basic minimum
compliance norms for corporate governance by listed companies.
| P a g e 34
The CII Initiative
With the opening of the economy and increased competition under the liberalized regime
concerns were raised regarding corporate governance practices in India. The process of
restructuring of the corporate governance framework and development of a Code of
Corporate Governance was initiated by CII in 1996. A National Task Force was set up under
the Chairmanship of Rahul Bajaj, past President of CII and presently Chairman of the Bajaj
Group. The Task force made a number of recommendations relating to board constitution,
role of non‐executive directors, role of audit committees and others. The committee
submitted its Code in 1998.
SEBI sets up Kumar Mangalam Birla Committee
In 1999, SEBI set up a committee under the Chairmanship of Kumaramangalam Birla, to
suggest suitable recommendations for the Listing Agreement of Companies with their Stock
Exchanges to improve the existing standards of Corporate Governance in the listed
companies. The committee paid much attention to role and composition of the Board of
directors, disclosure laws and share transfers. Recognizing that accountability, transparency
and equal treatment of all stakeholders are the key elements of corporate governance the
Committee evolved a Code of Governance in the context of the prevailing conditions in the
capital market. The Code was accepted in 2000 by SEBI and incorporated into a new Clause
49, which was inserted into the Listing Agreement of Companies with their Stock Exchanges.
4.2 Clause 49 of the Listing Agreement
The provisions of this Clause are applicable to all entities seeking listing approval and having
a paid up capital of Rs. 3.0 crore and above or a net worth of Rs. 25 crore or more at any
time in the history of the company. The provisions contained in Clause 49, took effect in
phases between 2000 and 2003 as described later in this chapter.
| P a g e 35
RBI Advisory Group headed by Dr. R H Patil
The recommendations of this Group which were submitted to SEBI in 2001, covered some
more codes and principles of private sector companies including consolidation of accounts
incorporating performance of subsidiaries, criteria of independent directors and disclosures.
N R Narayan Murthy Committee
In 2002, SEBI constituted another committee under the Chairmanship of N R Narayan
Murthy the then Chief Mentor of Infosys Technologies Ltd., to further streamline the
provisions of Clause 49. Based on the recommendations of the Committee SEBI revised
some sections of the Clause in August 2003 and later once again after further deliberations
in December 2003.
In October 2004, SEBI published a revised Clause 49, relating to corporate governance,
which set forth a schedule for newly listed companies and those already listed to comply
with the revisions. Major changes in the Clause included amendments /additions to
provisions relating definition of independent directors, strengthening the responsibility of
Audit Committees and requiring Boards to adopt a formal Code of Conduct.
Later the date for compliance with these new provisions was extended to December 2005,
since a large number of companies were unprepared to fully implement the changes.
In January 2006, SEBI issued some further clarifications on Clause 49 which included:
1. The maximum time gap between board meetings of listed companies to be increased
from three to four months.
2. Sitting fees paid to non‐executive directors would not require the previous approval
of shareholders
3. Certifications of internal controls and internal control systems by CEOs and CFOs
would cover financial reporting only.
The revised Clause 49, came into effect on January 13, 2006.
Further amendments were made in some of the provisions of the Clause in July 2007 which
dealt with quarterly reporting. SEBI made it optional for companies to either present an

| P a g e 36
unaudited or audited quarterly result and year to date financial results to Stock Exchanges
within one month from the end of each quarter. If the option is to present unaudited results
then the results will be subject to limited review and the report will have to be submitted to
SEs within two months from the end of the quarter.
4.3 Provisions under Clause 49 of the Listing Agreement
In its final form the Clause 49 of the Listing Agreement covered the following provisions
regarding corporate governance by listed companies.
Mandatory Provisions
I. Board of Directors: Composition of the Board, Definition of Independent
directors and proportion of Independent Directors in the total board
strength, Compensation of non‐executive directors and disclosures, Board
meetings, Information to be made available to the Board, membership of
Board level committees by the directors and Code of Conduct
II. Audit Committee: Its constitution, its meetings, role, powers and review of
information ,
III. Subsidiary companies: Number of subsidiaries, review of financial statements
of the subsidiaries by the holding company, transactions of the listed holding
company with the subsidiaries and other related disclosures
IV. Disclosures: These include a series of mandatory disclosures like basis of
Related Party Transactions, Accounting treatment, Risk management,
Utilization of proceeds of public issues, Remuneration of Directors,
Management Discussion and Analysis Report in the company’s Annual
Report, setting up of Shareholders/Investors Grievances committee and
other items to be reported to the shareholders.
V. CEO/CFO Certification: This certification relates to the review of financial
statements and cash flow statements by the CFO, compliance with existing
| P a g e 37
accounting standards, laws and regulations, responsibility for maintaining
internal controls, etc.
VI. Separate Section in the Company’s Annual Report on Corporate Governance
VII. Compliance certificate from Auditors or practicing Company Secretaries
Non‐mandatory Requirements
These included provisions regarding the following :
I. Tenure of Independent directors
II. Constitution of the Remuneration Committee
III. Declaration of Half‐yearly Financial Performance including summary of
significant events to be sent to shareholders’ residences
IV. Progression towards a regime of Unqualified Financial Statements
V. Training of Board members in the business model and risk profile of business
parameters of the company including their responsibilities.
VI. Evaluation of Non‐executive Board members
VII. Whistle Blower Policy
To curb the recurrence of accounting scandals like the one at Satyam Computers, a panel of
experts was set up at SEBI. This panel recommended:
i) Rotation of Audit Partners
ii) Selection of CFO by the company’s Audit Committee
iii) Standardization of disclosure of earnings
iv) Streamlining the submission of financial results.
SEBI has amended the listing agreement to include the above recommendations. Since then
SEBI issued several circulars relating to amendments regarding applicability and
enforcement of corporate governance provisions.

| P a g e 38
4.4 Corporate Governance Voluntary Guidelines ‐2009
During India Corporate Week in December 2009, the Ministry of Corporate Affairs brought
out a set of Voluntary Guidelines for improvement of corporate governance practices by the
listed companies. The objective of the guidelines was to encourage the use of better
governance practices through voluntary adoption. The Guidelines issued a series of
recommendations elaborating the various mandatory and non‐mandatory provisions of
Clause 49 of the Listing Agreement and suggested that the companies could adopt them on
a voluntary basis in order to further improve their governance practices. The major
recommendations referred to:
I. Board of Directors : Appointment of Directors, Separation of offices of Chairman and
CEO, Nomination Committee and maximum limit of directorships in public limited
and private companies that are either holding or subsidiary companies of public
companies.
II. Independent Directors: Attributes of Independent Directors and their certification of
Independence, Tenure of Independent Directors (not more than six years).
III. Remuneration of Directors: Guiding principles relating to Remuneration of Directors
including Non‐Executive and Independent Directors suggested, which should link
corporate and individual performance. Incentive schemes to be designed around
appropriate performance benchmarks with rewards for materially improved
company performance. Suitable balance between fixed and variable remuneration.
Performance related component of remuneration to form significant proportion of
the package. Remuneration policy for Board members and key executives to be
announced
IV. Remuneration of Non‐Executive and Independent Directors: Non‐executive Directors
to be paid a fixed contractual remuneration subject to an appropriate ceiling and an
appropriate percent of net profits of the company. Uniform remuneration for all
Non‐Executive Directors. Independent Directors to be paid adequate sitting fees
depending on criteria of Net worth and Turnover. No stock options for Independent
Directors so as not to compromise their independence.

| P a g e 39
V. Responsibilities of Remuneration Committee and Procedures relating to Annual
Evaluation of Performance of Directors.
VI. Training of Directors: Through suitable methods to enrich their skills.
VII. Risk Management : Board to affirm and report the framework and oversee the
system every six months.
VIII. Board Evaluation: Performance of Directors and Committees thereof to be
evaluated.
IX. Audit Committee of the Board: More elaborations on the Powers, Role and
Responsibilities of the Audit Committee
X. Appointment of Internal Auditors: Internal auditor should not be an employee of the
company to ensure credibility and independence of the audit process.
XI. Certification of Independence from Auditors: Affirmation of arm’s length relationship
with the auditors
XII. Rotation of Audit Partners and Audit Firms: Audit partners every three years and
Audit Firm every five years.
XIII. Secretarial Audit.
XIV. Institution of Mechanism for Whistle Blowing.
These guidelines are expected to serve as a benchmark for the corporate sector and would
also help the sector in achieving the highest governance standards. Adoption of the
guidelines would also translate into much higher level of stakeholder confidence which is
crucial to ensure long term sustainability and value generation by businesses. These
guidelines were very detailed and not all companies are known to have fully adopted these
guidelines.

| P a g e 40
4.5 National Voluntary Guidelines for Social, Environmental and
Economic Responsibilities of Business – July, 2011
These form a refinement over the earlier ‘Corporate Social Responsibility Voluntary
Guidelines, 2009 and are designed for all businesses irrespective of size, sector or location.
The Guidelines have nine basic principles:
I. Businesses should conduct and govern themselves with Ethics, Transparency and
Accountability
II. Businesses should provide goods and services that are safe and contribute to
sustainability throughout their life cycles
III. Businesses should promote the wellbeing of all employees
IV. Businesses should respect the interests of and be responsible towards all
stakeholders, especially those disadvantaged, vulnerable and marginalized
V. Businesses should respect and promote human rights
VI. Businesses should respect, protect and make efforts to restore the environment
VII. Businesses when influencing public and regulatory policy should do so in a
responsible manner
VIII. Businesses should support inclusive growth and equitable development
IX. Businesses should engage with and provide value to their customers and consumers
in a responsible manner
4.6 The Companies Act 1956
The Companies Act, 1956 provides the legal framework for corporate entities in India. The
Act has made provisions for some aspects of corporate governance which include number,
role, powers, duties and liabilities of directors and restrictions placed on them. Other
provisions include number and frequency of board meetings, rights of minority
shareholders, maintenance of books of accounts and development of accounting standards,
audit obligations and report of auditors. Since 1956, as many as 24 amendments have been
made in the Act providing statutory provisions relating to corporate governance.

| P a g e 41
Several major amendments had been proposed in the Companies (Amendment Bill) 2003.
But their consideration has been held back in anticipation of a comprehensive review of the
Company Law through a Consultative process.
In view of the changes in the national and international economic environment and the
expansion and growth of our economy the Central Govt. had decided to repeal the
Companies Act 1956 and enact a new legislation to provide for renewed provisions to
enable an accelerated growth of the economy.
As a first step of the review a Concept Paper on Company law was drawn and put up on the
electronic media for opinions and suggestions from all interested parties. The need was to
bring about harmony between SEBI’s Clause 49 provisions and those of corporate
governance in the Company’s Act.
J J Irani Committee
As a number of suggestions were received from various bodies on the Concept Paper, it was
felt that these proposals should be evaluated by an expert committee. Hence in December
2004, a Committee was constituted under the chairmanship of Dr. J J Irani the then Director
of Tata Sons. The objectives of the Committee were to address the changes in the national
and international scenario facing listed companies, enable internationally accepted best
practices and provide adequate flexibility for timely evolution of legal reforms in response
to the changing business models. The report of the Committee was submitted in May, 2005.
4.7 The Companies Bill, 2008
On October 23, 2008, the Minister for Corporate Affairs, introduced the new Companies Bill,
2008 into the parliament. It was subsequently referred to the Department related
Parliamentary Standing Committee on Finance for examination and report. The Bill sought
to enable the corporate sector in India to operate in a regulatory environment of best
international practices that foster entrepreneurship, investment and growth. A number of
| P a g e 42
other improvements were proposed in the new bill including board meetings to be
conducted through video conferencing and recognizing votes cast through e‐mail.
Before the report could be submitted by the parliamentary committee the Loksabha was
dissolved and the Bill lapsed. It was later reintroduced without any change in August, 2009.
It was again referred to the Parliamentary Standing Committee on Finance for examination
and report. The Committee gave its Report on Aug. 31, 2010. During the period Central
Government had received several suggestions from various stakeholders for amendments in
the Bill. The Parliamentary Committee had also made a large number of recommendations
in its Report. In view of the large number of amendments proposed in the Companies Bill,
the Central Government decided to withdraw the Companies Bill 2009 and introduce a fresh
Bill the companies Amendment Bill 2011, incorporating all the recommendations.
4.8 The Companies Amendment Bill, 2011
After over six years, since the J J Irani Committee Report was submitted, the Companies
Amendment Bill was tabled in the Parliament on Dec. 14, 2011. The Bill was vetted by
Parliament’s Standing Committee on Finance headed by former finance minister, Yashwant
Sinha.
The amendments in the Bill are aimed at strengthening governance in companies and
enhancing transparency. The new Bill seeks to ensure greater board independence, higher
levels of accountability through additional disclosure norms, facilitate raising of capital,
protection of minority shareholders and setting up of a CSR Committee.
| P a g e 43
In brief the following amendments have been recommended:
I. Corporate Social Responsibility expenditure to be two percent of profit of last three
years. A mandatory CSR committee.
II. Independent Directors to be appointed from a notified data bank containing names,
addresses and qualifications of persons who are eligible. They can be appointed for
two consecutive terms of five years each. A cooling off period of three years to be
maintained before reappointment.
III. A Code of Conduct for Independent directors
IV. Independent Directors to give a declaration of independence every year.
V. No stock option for independent directors.
VI. An individual auditor can be appointed for one term of five years and an audit firm
for two terms of five years. A cooling off period of five years before reappointment.
Auditors are not to provide non‐audit services
VII. An audit partner and his team may be changed every year by the company.
VIII. Incoming Audit Firm and Outgoing Audit Firm should not have common partners.
IX. An auditor should not hold any securities in the company or its subsidiaries or have
any business interest with the company or be indebted to it or have a relative who is
a director in the company.
X. Secretarial Audit – a practicing company secretary to report to the Board that the
company has complied with all the requirements under the Companies Act as well as
other laws applicable to the company.
XI. Companies to provide an exit option to minority shareholders who may disagree
with the firm’s decision to acquire a firm do a corporate or loan restructuring or
diversify into unrelated business area.
Apart from reducing the number of sections drastically the Bill has also prescribed 33
new concepts and definitions. We have briefly discussed below the proposed
amendments pertaining to Corporate Governance.

| P a g e 44
I. Preliminary
Some of the new definitions introduced refer to One Person Company, An Associate
Company, Small Company, Employee Stock Option, Promoter, Related Party, Turnover,
Chief Executive Officer, Chief Financial Officer, and Global Depository Receipt.
II. Matters relating to Incorporation of a Company
Declaration by the Director: Within this list of amendments, the major one is the
declaration by a director in a prescribed form that the subscribers have paid the value of
shares agreed to be paid by them and a confirmation that the company has filed a
verification of its Registered Office with the Registrar.
Exit Option for Minority Shareholders: A company which has raised money from public
through a prospectus and has an unutilized amount out of the money so raised, shall not
change its objects unless a special resolution is passed and other requirements of
advertisements are complied with. The company has to give an exit opportunity to
dissenting shareholders and other investors if they are not agreeable with the
company’s diversification plans, acquisition of another firm, or a corporate or loan
restructuring plan or proposals for transfer or sale of the existing business.
The provision attempts to address typical issues in Indian companies where promoters
holding majority of the shareholding generally ignore the voice of minority shareholders
in some of their major corporate decisions. This amendment is now expected to give a
greater say to the minority shareholders in the company’s business plans, many of which
presently have the freedom and flexibility to buy, sell or merge and demerge businesses.
This is a minority investor friendly move but may prove to be cumbersome for the
companies. The minority investors who wish to exit would not be simply selling their
shares in the open market but could demand a specific option more on the lines of a
buyback or a delisting offer. Companies going through financial pressures and intending
to sell their assets to raise funds may not be able to offer exit options to dissenting

| P a g e 45
minority shareholders. Again if this is done the prevailing norm of 25 percent public
holding of equity for listed companies may be difficult to comply with given the exit
options.
III. Prospectus and Allotment of Securities
The Bill governs the issue of all types of securities. Under the Companies Act, 1956, only
shares and debentures were covered. The Bill has included provisions which apply to
public offer, private placement or issue by way of bonus or rights issue.
IV. Share Capital and Debentures
Certain provisions have been included which relate to further issue of shares for
increasing the subscribed paid up capital, voting power of preference shareholders,
issue of bonus shares, buyback of shares, offer of shares to employees by way of ESOPs,
etc. The scope of the section relating to transfer and transmission of securities has also
been widened to include all types of securities.
All these provisions will help the regulators in monitoring the entire paid up share capital
of the company and also assess the number of shares held by various categories of
shareholders and their voting power.
V. Management and Administration
Additional Information to be provided in the Annual Returns: The annual returns of the
company have been elaborated to include additional information like particulars of its
holdings and subsidiary and associate companies. It should also include changes in the
number of shares held by promoters and top ten shareholders of the company and
matters relating to certification of compliances, disclosures, remuneration of directors
and key managerial personnel.
| P a g e 46
In case of companies with prescribed paid up capital and turnover, certification of
annual return by a practicing company secretary has been made mandatory.
These provisions will bring in greater transparency relating to shareholding by
promoters and majority shareholders. Disclosures relating to key financial outflows of
the company would help in monitoring them more effectively.
VI. Accounts of Companies
Scope of Directors’ Report Widened: The Bill recognizes that books of accounts may be
kept in electronic form. Balance Sheet and Profit & Loss Account have been defined
collectively as Financial Statements. Along with financial statements, consolidated
financial statements of all subsidiaries and associate companies shall be prepared and
laid before the AGM.
This disclosure of consolidated financial statements will bring to light all transactions
done by the listed company with its subsidiaries and give an opportunity to minority
shareholders to question suspect dealings with the associate companies.
The scope of the Directors’ Report has been widened to include additional information
like number of board meetings, policy of the company relating to appointment of
directors and their remuneration, explanation or comments by the board on every
qualification, reservation or remark or disclaimer made by the company secretary in the
Secretarial Audit Report, particulars relating to loans, guarantees, investments, etc.
The Directors’ Responsibility Statement in case of a listed company should include
additional statement relating to internal financial controls and Compliance of all
applicable laws.
These provisions have placed greater responsibility on the directors in the areas of loans
and investments, appointment of directors and their remunerations, explanations with
regard to audit qualifications, and commitment on internal controls and compliance with
| P a g e 47
all types of regulations. Directors’ Report and Directors’ Responsibility Statement being
part of the published annual report will make all the shareholders aware of the decisions
taken by the board in these key areas of governance and any shortcoming can be
challenged by the shareholders and investors.
Corporate Social Responsibility: Every company having a net worth of Rs. 500 crore or
more or turnover of Rs. 1,000 crore or more or a net profit of Rs. 5.0 crore shall
constitute a Corporate Social Responsibility Committee of the Board consisting of three
or more directors (at least one being an independent director). The committee will
recommend the CSR policy of the Board.
The Board of every such company must ensure that in every financial year the company
spends at least two percent of the average net profit of the company made during the
three immediately preceding financial years in pursuance of the CSR policy. Failure to do
so needs to be reported with reasons thereof in the Directors’ report.
This move to make CSR compulsory for certain high net worth companies will ensure
that this function of giving back to the Society is taken more seriously and made
sustainable by the promoters and directors of the company . Earlier it was treated as a
mere compulsion with some funds channelized in this direction. With the passing of the
Bill there will be a commitment to ensure that a certain percentage of profits flow into
CSR activities every year. This is an excellent provision in the direction of inclusive
growth and social sector reforms.
VII. Audit and Auditors
Rotation of Auditors and Audit firms: The Bill provides for compulsory rotation of
individual auditors every five years and of audit firm every ten years for listed and
certain other class of companies. A transition period of three years has been provided to
comply with this provision.
| P a g e 48
Prescription of Auditing Standards: Central Govt. will prescribe the auditing standards
as recommended by the Institute of Chartered Accountants in consultation with the
National Financial Reporting Authority.
Responsibilities of Auditors: Auditors have to comply with auditing standards. Certain
new provisions for disqualification of auditors have also been prescribed.
Partner or partners of the audit firm and the firm shall be jointly and severally
responsible for the liability, whether civil or criminal as provided in the Act or any other
law. If any fraudulent practice civil or criminal, by the auditors is proved the Audit
partner/partners and the firm are punishable.
The prescriptions for Auditors and their compulsory rotation every five years together
with compliance to auditing standards recommended by Institute of Chartered
Accountants of India, will ensure complete transparency in the internal workings of
companies in order to avoid any future Satyam like scams.
VIII. Appointment and Qualification of Directors
Appointment of Independent Directors (IDs): One of the major criticisms of the current
policy of appointment of Independent Directors is that the promoters exert tremendous
influence in determining and appointing Independent Directors. This issue has been
addressed by making it mandatory for all listed and certain other class of companies to
constitute a Nomination and Remuneration committee consisting of three or more Non‐
Executive Directors of which not less than half should be Independent Directors. The
Committee has to consider candidates for appointments as IDs and recommend them to
the Board. The Bill also proposes the formation of a Databank of IDs from which suitable
persons may be selected.
This is expected to bring in greater objectivity in to the process of nomination of IDs and
preclude the influence of promoters on them. The Bill prescribes that at least one‐third
of the directors on the Board should be IDs. This is a departure from the prevailing
| P a g e 49
norms wherein half the directors had to be independent in case the company has an
Executive Chairman or he is related to the promoter of the company. This represents a
dilution from the existing position. The Bill also provides for at least one woman director
on the Board.
The definition of an ID has been considerably tightened: The definition now includes
positive attributes of independence namely that the Director should be a person of
integrity and possess relevant expertise and experience in the opinion of the Board.
Central govt. is also vested with powers to prescribe qualifications of IDs. Every ID is
required to declare that he or she meets the criteria of independence. Participation of
minority shareholders in the appointment of IDs has been kept non‐mandatory.
Directorship in not more than 20 companies: The number of companies in which a
person can be a director has been increased from 15 to 20. Of the 20, he cannot become
a director in more than 10 companies.
Role and Functions: Section IV of the Bill lays down the code which sets out the role
functions and duties of the IDs and also those relating to their appointment, resignation
and evaluation.
These prescriptions make the role of the IDs quite onerous and could enhance the level
of monitoring of the listed companies which is so crucial for good governance practices.
Liability of the IDs: The Bill limits the liability of the ID only in respect of acts of omission
or commission by a company which had occurred with his knowledge, attributable
through Board processes and with his consent or connivance or where he had not acted
diligently.
Remuneration: In a break from the earlier norms, an ID is entitled only to fees for
attending meetings of the boards and possibly commissions within certain limits. The
Bill expressly disallows IDs from obtaining stock options.

| P a g e 50
Companies may find it difficult to get directors of the requisite caliber unless they are
appropriately remunerated.
Tenure: To ensure that IDs maintain their independence, the term of their tenure has
been prescribed. The initial term is prescribed as five years following which further
appointment would require a special shareholder resolution. The total tenure shall not
exceed two consecutive terms.
All the provisions relating to IDs, their appointment procedures, their liabilities, tenure,
role and functions are in the right direction and place greater responsibilities on the IDs
which was very vital for ensuring greater board independence. Limiting the liabilities of
IDs to acts which have occurred with his knowledge or in his presence, provides a
safeguard mechanism for the ID who need not be held liable for all Board decisions,
even those taken without his presence.
Mandatory constitution of Nomination and Remuneration Committee, Stakeholders
Relationship Committee and CSR Committee means that the IDs and Non‐executive
Directors would be more involved in the operations of the company and would have to
take greater interest in the appointment of Directors and key management personnel .
They will also have to be more engaged with all the stakeholders and resolve grievances
of all security holders.
IX. Meetings of Board and its Powers
Audit Committee: Composition of the Audit Committee has been changed. The
committee shall now comprise of three minimum directors, majority of them being
Independent Directors. Majority of them should also be having the ability to read and
understand financial statements.
Vigilance Mechanism : Every listed company and such other class of companies shall
have a vigilance mechanism in the prescribed manner.
| P a g e 51
Stakeholders Relationship Committee: Every company which has more than 1000
shareholders, debenture holders or deposit holders shall constitute a Stakeholders
Relationship committee consisting of a Chairman who is a non‐executive Director and
such others as may be decided by the Board.
Disclosure of Interest by a Director: This has been made mandatory and not
discretionary as was there in the Companies Act of 1956. Even in case of a Private
Company an interested director cannot vote or take part in the discussions relating to
any matter in which he is interested.
Investments by a company: A Company, unless otherwise prescribed, shall not make
investments through more than two layers of investment companies subject to certain
exemptions.
Related Party Transactions: No approval of Central Govt. is required for entering into
any elated party transactions. No approval of Central govt. is required for appointment
of any director, or any other person to any office or place of profit in the company or its
subsidiary.
Certain new Related Party Transactions are provided in the Bill which requires approval
of the Board.
The Bill provides for certain new matters which are to be transacted by the Directors at
their Board meetings only.
Insider Trading: The Act already had a provision relating to prohibition on forward
dealing in securities of the company by a director or key management personnel. The Bill
now provides the provisions for prohibiting insider trading in the company.
All these provisions are aimed at strengthening the supervision mechanism of the
company by the regulators, strengthening the powers of the Board especially the IDs

| P a g e 52
and above all prohibiting fraudulent transactions with related parties for which the
Board is made responsible.
X. Appointment and Remuneration of Managerial Personnel
Managing Director/Whole Time Director/Manager: These appointments have to be
approved by a General Meeting by special resolution instead of ordinary resolution. The
Bill provides for provision related to Secretarial Audit in certain prescribed companies
and also prescribes the functions of the Company Secretary.
This ensures greater involvement of shareholders in key appointments on the Board and
management.
XI. Inspection, Inquiry and Investigation
Central govt. will set up a Serious Fraud Investigation Office (SFIO) for investigation of
frauds relating to a company. The affairs of a Related Company can also be investigated
by the inspector. If a fraud is reported Central govt. is empowered to file an application
to the Tribunal for appropriate disgorgement of such assets, property or cash and for
holding of such director, key management personnel, officer or other person liable
personally without any limitation of liability. SIFO however can act if and when someone
has lodged a complaint or someone has initiated an enquiry.
4.9 Corporate Governance Rating
Rating of practices of Corporate Governance and Value Creation for its Stakeholders is being
carried out by leading Rating Agencies like CRISIL. This type of rating helps the companies
greatly as an unbiased evaluation of the company’s corporate governance practices is
carried out by an outside and reputed agency and an appropriate Rating Certificate is given.
The Company can use this certificate for raising finance from the market as well as from

| P a g e 53
foreign investors. This results in greater resources and better resource allocation and
enhanced investor confidence in the company leading to better valuation.
The basis for rating a company for its corporate governance practices is the company’s
compliance with SEBI Clause 49 of the Listing Agreement with the Stock Exchanges and also
the manner in which the various norms are fulfilled.

| P a g e 54
| P a g e 55
Chapter ‐ 5
Review of Literature on Corporate Governance and its Impact on Firm Performance
Corporate Governance has been an important field for research within the financial
discipline. Even in the developing economies, regulators have recognized that effective
corporate governance systems promote a strong financial market that can attract greater
private investment which in turn has a definitive impact on Growth and Employment.
Extensive research work has been undertaken in developed and developing countries, on
corporate governance practices and their relationship with various financial parameters for
predicting firm performance. Most of the studies have analyzed the relationship between
one or two aspects of corporate governance like board size and board independence or
presence of institutional investors on the board or duality of CEOs with selected financial
parameters. However studies with a larger sample base have examined the combined
effects of all the corporate governance parameters as well as each individual parameter
separately on different indicators of financial performance. Of course not all aspects of
corporate governance have shown a positive or negative relationship with financial
performance but after having reviewed a sizable number of globally conducted studies,
including those in India, we have observed a definite link between good governance and
firm performance. It may be affirmed here that financial parameters cannot be taken as the
sole indicators of firm performance. Customer satisfaction and employee loyalties are also
good predictors of the current and more importantly the future success of a company.
We commence the review by broadly highlighting the findings of the studies carried out in
the developed economies and then follow up with some of the studies focusing on

| P a g e 56
companies in emerging economies like Korea and India. Some studies focusing on BRIC
countries have clearly brought out the variations in the relationships between corporate
governance measures and firm performance.
5.1 Studies Relating to Corporate Governance and Firm Performance in
Developed Countries ( USA ) and Emerging Economies ( BRIK)
i) A Study conducted by Lawrence D Brown and Marcus L. Caylor of Goergia State
University published in 2003, titled, ‘Corporate Governance and Firm Performance’ is
based on data for corporate governance practices of 2372 firms which are related to
their financial performance in 2002. For measuring the strength of corporate
governance of a firm, the study has compiled and used 51 factors indicating corporate
governance practices of a firm. The 51 factors are coded either 0 or 1, depending on
whether the firm’s corporate governance standards are minimally accepted or not.
These minimum standards were listed by the researchers. Each firm’s 51 binary
variables were then summed up to derive a Gov‐Score which is a composite measure of
corporate governance standards. The 51 factors were grouped under eight governance
categories – Audit, Board of Directors, Charter/By‐laws, Director Education, Executive
and Director Compensation, Ownership, Progressive practices and State of
Incorporation. The data used were provided by Institutional Shareholder Services (ISS)
for US firms listed on the Stock exchanges.
The eight corporate governance categories were then associated with six performance
parameters ‐ Return on Equity, Net profit margin, Sales growth, Tobin’s Q, Dividend
yield and Share repurchases. Each of these parameters were adjusted for their industry
groups.
Broadly the results reveal that firms with better overall governance, as measured via
larger Gov‐Scores, had higher returns on equity, higher profit margins, were more
valuable, paid out more cash dividends, and repurchased more shares from their
shareholders. In contrast, firms with poorer governance, as measured via lower Gov‐
| P a g e 57
Scores, had lower returns on equity, lower profit margins, were less valuable, paid out
less cash dividends, and repurchased fewer shares.
Analyzing specific measures of corporate governance the study concludes that good
governance, as measured using executive and director compensation, is most highly
associated with good performance. In contrast, good governance as measured using
charter/bylaws is most highly associated with bad performance.
The results of the study depicting the association of each of the eight specific
governance categories listed above, with each of the six performance measures have
been summarized as follows:
1. Return on equity is positively associated with six governance categories and five
of them are significant (State of incorporation of the company is the exception).
2. Return on equity has a negative and significant relation with the other two
categories i.e. audit and charter/bylaws.
3. Net profit margin is positively associated with six categories and four of them
are significant (ownership and state of incorporation are the exceptions).
Similar to results on return on equity, net profit margin has a negative and
significant relation with the other two categories, audit and charter/bylaws.
4. Sales growth is positively associated with four categories but none of the
relations are significant. Sales growth is negatively and significantly associated
with both board of directors and ownership.
5. Tobin’s Q is positively associated with seven categories but only two of them
are significant, i.e., the anti‐takeover categories viz. charter/bylaws and state of
incorporation. Interestingly, the principal ISS anti‐takeover category, charter‐
bylaws, is negatively associated with both return on equity and net profit
margin.
6. Dividend yield is positively associated with five categories and all the
correlations are significant. Regarding the other three categories,
charter/bylaws is the only one that has a negative and significant relation with
dividend yield.

| P a g e 58
7. Share repurchases are positively associated with five categories but only two of
them, board of directors and progressive practices, are significant. Regarding
the other three categories, audit and charter/bylaws have a negative and
significant relation with share repurchases.
The results for specific governance categories are summarized as follows:
These are presented in decreasing order of their conformance with expected performance
1. Executive and Director compensation is positively correlated with all six performance
measures and the relation is significant three times.
2. Progressive practices, board of directors, director education, and ownership, are
positively correlated with five of the performance measures and the relation is
significant four, four, three, and two times, respectively.
3. State of incorporation has its expected positive sign four times, once with
significance.
4. Audit has a positive sign only twice, and it is never significant with the expected
positive sign. In contrast, it is significant three of the four times that it has a negative
sign.
5. Charter/bylaws, which lie at the heart of the widely used G‐Index, has a positive sign
only once. However, it has the right sign least often compared to any of the eight
categories and it has a significant coefficient of the wrong sign most often (i.e., four
times).
In summary, the study says that better governed firms are relatively more profitable,
have higher valuation and pay out more dividends to shareholders. Compensation of
executives and directors is most highly associated with good performance.
ii) It is generally believed that good governance is achieved through rules that protect
minority investors. An implicit assumption here is that good corporate governance
practices are universal and a common set of rules should be applied to all countries and
all firms within a specific country i.e. ‘One size largely fits all’ A study ‘Does One Size Fit
All in Corporate Governance? Evidence from Brazil and other BRIC Countries’ conducted

| P a g e 59
by Bernard S. Black, University of Texas at Austin, Law School and McCombs Business
School, Antonio Gledson de Carvalhoof Fundacao Getulio Vargas School of Business at
Sao Paulo and Erica Gorga of Fundacao Getulio Vargas Law School at Sao Paulo (draft
September 2010) has tried to explain that one set of rules – One size‐ does not fit all .
There is only limited evidence on the extent to which a common set of governance
practices would be beneficial for most firms in most countries.
The study has conducted an in‐depth assessment of the relationship between corporate
governance and firm market values in Brazil, which is a large emerging economy and
part of the BRIC countries. They have then extended the Study to prior research done
for three other countries in BRIC but have excluded China and considered Korea. – BRIK.
These four country studies have then been used to assess which governance practices
predict high firm market values for which type of firms and in which countries.
The study provides a reasonable cross‐section of practices in major emerging markets
and a reasonable basis for assessing the extent to which one size fits all in corporate
governance.
The uniqueness of the study lies in its twist in the generally adopted methodology, in
that while assessing the importance of a particular aspect of corporate governance, it
controls for all other aspects of governance. Omitting these controls, which is a common
practice in studies of particular aspects of governance such as board independence,
disclosure, audit committees, etc., may produce omitted variable bias. By examining
how adding these controls affect the association between firm market value and aspects
of governance, across four countries, the study assesses this source of bias; which is
often important. The results provide evidence that one size is far from fitting all.
In all the four emerging economies an overall corporate governance index predicts
higher firm market value but while examining which aspects of corporate governance

| P a g e 60
drives that result and for which firms, there are some common themes but also large
differences.
The study finds a positive and statistically significant association between Brazil
Corporate Governance Index (BCGI measured at year‐end 2004) and firm market value
(measured at year‐ends 2005 and 2006). This association is consistent with prior
research, both cross‐country studies and in other country case studies. But when the
sub‐indices are examined, the consistency with other studies disappears.
Multi‐country Results for Indices and Sub‐indices
An overall governance index significantly and positively predicts Tobin’s Q in all four
countries. There are also strong common patterns for sub‐indices included one at a time.
Almost all individual coefficients are positive as seen below:
1. Minority shareholder rights sub‐index is positive for Tobin’s Q and significant in all
three countries with this sub‐index;
2. Disclosure sub‐index is positive and at least marginally significant in all four
countries;
3. Ownership parity sub‐index is positive and significant in the two countries.
4. Board procedure sub‐index is positive and significant in Brazil and Korea and positive
in India.
5. Board structure is more mixed, with significant positive coefficients in India and
Korea, but an insignificant negative coefficient in Brazil.
6. Related party transactions are insignificant, with mixed sign, in the two countries
with this sub‐index, Brazil and India.
Firm Characteristics
The study has also examined the association between governance and firm market value
which varies with firm characteristics. It has focused on four characteristics: industry sector
(manufacturing versus non‐manufacturing firms); size (large versus small firms); growth
(faster versus slower‐growing firms); and profitability (more versus less profitable firms).
| P a g e 61
The results for the overall Brazil Corporate Governance Index BCGI show that BCGI is a
significant predictor of Tobin’s Q for non‐manufacturing firms, but not manufacturing firms,
for small firms but not large firms and for high‐growth but not low‐growth firms. However,
the difference between the two groups is not statistically significant for large versus small
firms. There is no appreciable difference between the co‐efficient on BCGI for high versus
low‐profitability firms.
At the aggregate level, the results of the study suggest that ownership parity, shareholder
rights and probably disclosures are likely to be important governance sub‐indices across a
number of countries. Firm‐level governance appears to matter in predicting firm market
value, but which aspects of governance matter vary substantially across countries. The
principal regularities from cross‐country studies are that board independence and disclosure
predict firm market value. The board independence result does come up as significant after
examination in particular countries. The disclosure result is suspect, because in country
studies, disclosure weakens when one controls for the rest of governance. Thus, the
apparent lessons from cross‐country studies are less clear when one looks at each country
related studies.
5.2 Research Work Done for Emerging Asian Markets – Taiwan and
Korea
i) We have reviewed three studies carried out for these emerging markets. The findings of
these studies are summarized below:
A study carried out for Taiwan, ‘Family Involvement and Family Firm Performance in Taiwan’
by En‐Te‐Chen, Queensland University of Technology, Stephen Gray University of
Queensland and John Nowland City University of Hong Kong, has tried to establish a
relationship between family involvement and firm performance. Family members can be
involved in their firm’s management through four mechanisms; ownership, board of
directors’ representation, family CEOs and family managers.

| P a g e 62
Family members have the option of appointing family members and family representatives
in these positions. The study has used data from an emerging market, Taiwan, that requires
disclosure of family and representative relationships. The data are collected from annual
reports (2007) of 536 family firms listed on the Taiwan Stock Exchange. The study essentially
reveals that the form of family involvement is related to both firm characteristics and other
family involvement measures.
Family‐controlled firms are identified as those where a family group holds more board seats
(including seats held directly and through representatives) than any other individual or
group on the board, or if the family group that founded the firm holds the same number of
board seats as the next largest group.
Unlike other US based studies, this study makes a distinction between family members and
family representatives as it asserts that they provide different agency costs and stewardship
benefits to minority shareholders. Family representatives, as employees of the family’s
listed and unlisted entities, are expected to be somewhat aligned with the interests of the
family but not to the same extent as family members. For example, it is expected that family
representatives are less likely than family members to facilitate and consume private
benefits of control as their personal interests are less aligned with those of the family group.
The study then goes on to examine the interactions among the mechanisms of family
involvement i.e. whether family directors, family chairmen, family CEOs and family
managers are used as complementary or substitute measures of family involvement.
Citing the results of other studies it is argued that family ownership helps to align the
interests of the family with other shareholders but only up to a certain point. Beyond this
point, further ownership or excess control rights help to entrench the position of the family,
which is associated with deteriorating firm performance. However, studies of unlisted family
firms have not found such significant results. Other studies have also concluded that there is
a positive effect on firm performance if the CEO is a family member particularly the first
| P a g e 63
generation or founder CEOs.( Anderson and Reeb, 2003; 24Maury, 2006;25 Villalonga and
Amit, 2006 26).
Based on Stewardship theory, (CEO same as Chairman) family members are expected to
provide greater benefits to shareholders than family representatives. This is because family
members are more likely to be aligned with the long‐term view of the family, while the view
of family representatives is likely to be limited to the duration of their own career within the
family business group.
From the correlations between various family involvement measures it is found that family
ownership is positively correlated with family directors, family chairmen, family CEO and
family management.
Family Involvement and Firm Performance
The study relates all four mechanisms of family involvement to firm performance. Return on
assets (RoA) has been used as the primary measure of firm performance. Examining the
effect of family involvement on firm performance the study concludes that there is negative
relationship between family directors, family managers and firm performance. This is
particularly the case when family members hold more board positions than expected by
their ownership position. These findings suggest that families are using these positions to
entrench their control, which results in higher agency costs to shareholders. However the
relationship with firm performance is positive in case of first generation family owners than
later generations.
Further it is observed that family member directors have a greater negative effect on firm
performance than family representative directors. Moreover allowing the family to use
24 Anderson R and D Reeb, 2004 ,’Board Composition : Balancing Family Influence in S&P 500 Firms’ administrative Sciences quarterly, 49. 25 Maury B, 2006, ‘ Family Ownership and Firm Performance : Empirical Evidence from Western European Corporations’ Journal of Corporate Finance, 12. 26 Villalonga B and R Amit, 2006, ‘ How do Family Ownership, Management and Control affect Firm Value?’ Journal of Financial Economy, 80.
| P a g e 64
family representatives instead of family members on the board of directors results in high
agency costs to shareholders.
For policy makers the results suggest that firm performance could be improved by limiting
family involvement. In particular, restricting the proportion of board seats the family can
hold to their ownership position.
The results raise the possibility that previously documented relationships between
ownership and firm performance may be driven by other omitted measures of family
involvement. Once all measures of family involvement are included there is no relationship
between ownership variables and firm performance. Furthermore, the study finds a number
of interactions among family involvement measures. Families prefer to be involved in their
firms through family members or family representatives but seldom both. The study
concludes that further research could examine this in more detail by studying which
particular combinations of family involvement are associated with better and worse
performance.
ii) ‘The Impact of Controlling Families and Family CEOs on Earnings Management in Taiwan’
is another Study reviewed by us for Taiwan. This study carried out by Mei‐Ling Yang
Published in the Family Business Review, June 2010, is also based on data obtained from
firms in Taiwan. Earnings management has been referred to by some researchers as a
measure of managerial opportunism in financial reporting.
The researcher has compared the findings of his study with earlier published research work
and has developed and tested two hypotheses relating to insider ownership. The first
hypothesis states that in the case of firms with controlling families, insider ownership is
positively associated with the degree of earnings management. The second hypothesis is
that in case of firms with controlling families, the motivation of non‐family CEOs to
manipulate earnings is stronger than that of family CEOs at a given level of ownership.
| P a g e 65
This study is based on a large sample of 3914 firms with nearly 70 percent of them being
firms with controlling families.
Two main conclusions have emerged out of the study:
1. In case of firms with controlling families, the higher the level of insider ownership
the larger the magnitude of discretionary accruals supporting the entrenchment
hypothesis. This documents the fact that that through earnings management,
controlling families affect the quality of earnings and expropriate the interests of
minority shareholders.
2. Non‐family CEOs have a greater tendency to manipulate earnings than family CEOs
at a given level of ownership.
The study has emphasized the need to develop a strong governance mechanism for
family firms. This will enhance investor trust in family firms and help raise funds at
lower capital cost.
iii) Another interesting Study reviewed by us for Korea, has also tried to establish a
relationship between corporate governance and financial performance of firms. For the
Study ‐ ‘How Corporate Governance Affects Firm Value – Evidence on Channels from Korea’
– October 2010 carried out by Bernard Black, Northwestern University, Law School and
Kellogg School of Management, Woochan Kim, KDI School of Public Policy and Management,
Hasung Jang of Korea University Business School and Kyung Suh Park of Korea University
Business School, the researchers have developed a broad Korean corporate governance
index (KCGI) index, and extended it to the cross‐sectional results in an earlier study by
Black, Jang and Kim (2006), to a multiyear, firm fixed effects framework:
Through their research work, the analysts have confirmed that Higher KCGI predicts higher
firm market value.‐ Tobin’s Q. This result is driven principally by Board Structure sub‐index
and to a lesser extent by Ownership Parity and Disclosure. There is some evidence that the
Board Structure results are likely to be causal for large firms. Shareholders’ rights and board
procedure sub‐indices are not significant.
The study then investigates the channels through which governance might produce :

| P a g e 66
(i) Higher firm market value without higher overall firm value, through reduced insider
self‐dealing; or
(ii) More efficient operation and hence an increase in overall firm value.
Evidence of both the effects is noticed. Reduced insider self‐dealing is observed to have
transferred greater wealth to outside shareholders and improved firm performance and
hence overall firm value. Related party transactions are less adverse to firm value.
5.3 Research Work done in European Countries
i) A study carried out for Family owned companies in Spain, ‘Family Ownership and Control,
Presence of other Large Shareholders and Firm Performance – Spain’ by Maria Sacristan‐
Navarro, Silvia Gomez‐Anson and Laura Cobeza Garcia is based on the data relating to
ownership and firm performance of 118 non‐financial firms in Spain between 2002 and
2008. Family firms are defined as those which have more than 10 percent of voting rights.
Reviewing past research work on the relationship between family ownership and firm
performance, the study has cited several instances where family firms have outperformed
non‐family companies, for example, due to families’ longer‐term horizons or concerns about
reputation. In fact, family owners are thought to be more interested in company survival
and to focus on further horizons than other categories of large shareholders.
In another study, the Resource‐based View (RBV) states that family firms may have potential
advantages based on their path‐dependent resources, idiosyncratic organizational
processes, behavioral and social phenomena or leadership and strategy‐making capabilities
(Habbershon & Williams, 2000)27. The idiosyncratic resources and abilities unique to family
firms, ‘familiness,’ may be a source of competitive advantage if the companies are able to
exploit them.
27 Habbershon T & Williams M (2000) ‘A Model of Understanding the competitiveness of Family Controlled companies ‘ in P. Poutziours (Eds) ‘Tradition or Entrepreneurship in the new Economy’ Manchester Business School.
| P a g e 67
Contrary to the above there are other arguments that show that families as owners may
protect their interests with governance systems intended to maximize utility. They demand
market returns and may prefer to sacrifice efficiency for equity, thus damaging other
investors’ interests (Lee, 2006)28. Moreover, families may be oriented to maintaining control
of the companies they found or acquire, to making value reducing acquisitions that benefit
the dominant family and to seeing executive positions in the firm as a means of providing
high‐paying jobs to the offspring instead of selecting the best managers that the market
could provide; families may extract private benefits from control.
However studies in Western European countries have reported that family ownership
improves performance, especially in well‐regulated economies. For the United States,
McConaughy and Phillips (1999)29 also report that family ownership has a positive effect on
performance, and Anderson and Reeb (2003)30 find a nonlinear relationship between family
holdings and performance.
After considering the above viewpoints the present study has developed its own hypotheses
for testing. The hypotheses tested are :
1. Higher family ownership leads to higher firm performance
2. Family control decreases firm performance.
3. Presence of another significant shareholder enhances firm performance.
The study claims that if other large shareholders are there such as institutional
shareholders, then they may mitigate expropriation of minority shareholders since they
would monitor and moderate family influence on firm performance.
The dependent variable used here again is Return on Assets (RoA) defined as firm book
value of operating profit/book value of total assets.
28 Lee M, ,2006 ‘Family Firm Performance- Further Evidence’family Business Review ,19. 29 McConaughy D L & Phillips G M (1999) ‘Founders versus Descendants-The Profitability, Efficiency, Growth Characteristics and Financing in large Public Founding Family Controlled Firms’ Family Business Review, 12 30 Anderson & Reeb, op. cit.
| P a g e 68
The independent variables used are :
1) Firm ownership and family ownership
2) Control related measures
3) Divergence between control rights held by largest shareholder and cash flow
rights
The control variables are firm growth, language, size and age.
The results of the analysis done on the basis of Pool Regression, show the following;
1) The percentage of ownership held by the largest owner does not affect
profitability.
2) Family ownership and family control (Family CEO and/or Chairman) also do not
affect profit significantly
3) The presence of a second significant shareholder positively affects profitability
with statistical significance of 0.01 level.
4) Use of control mechanisms (WEDGE, mean difference between control rights
and cash flows) negatively influences firm performance at .05 level.
5) Firm RoA is negatively influenced by firm leverage (LEV i.e. book value of total
debts /book value of total assets) and firm size; in both cases at the 0.01 level
but positively by the firm age at the 0.05 level.
The researchers have applied other alternative methodologies to test their hypotheses and
have obtained divergent results. According to the models that take into account both
unobservable heterogeneity and the endogeneity of ownership, neither large shareholdings
nor large shareholdings held by families appear to influence profitability. Thus, the results
again do not support Hypothesis 1. What seem to influence performance are family control
and the presence of a second large shareholder.
It is also observed that Family CEOs and/or Chairmen negatively influence performance,
which supports Hypothesis 2.
The presence of a second significant shareholder enhances performance, as suggested by
Hypothesis 3. Indeed, the presence of a single other shareholder is the one that presents a
| P a g e 69
more consistent and significant coefficient for all the econometric techniques. The study
therefore concludes on a note of caution when comparing results of different empirical
studies. Many factors like the definition of family firms, varying samples and methodology
and different institutional environments can affect the results of the analysis.
5.4 Studies pertaining to Corporate Governance and Firm Performance
in India
i) A Study carried out by Pitabas Mohanty at National Stock Exchange, ‘Institutional
Investors and Corporate Governance Practices in India’ attempts to understand the role of
institutional investors in the corporate governance system of a company in India. It is
generally understood that Institutional investors play a passive role in the corporate
governance practices in India though they are actually nominated by the financial
institutions to supervise the accounting and governance practices and also to see that their
investments earn expected returns.
The study starts with the premise that the fundamental objective of the institutional
investors is to maximize the shareholders’ wealth and not monitoring the activities of the
company. In contrast to most other studies which have taken Tobin’s Q as a measure of
performance of the company the study has developed a new measure of financial
performance which is Excess Stock Returns.
In a different approach to the measurement of corporate governance, instead of looking at
the processes of corporate governance, the study has attempted to assess the outcomes of
good corporate governance while developing the measures of corporate governance. This
means that having an audit committee is not enough for the company to practice good
corporate governance. Its outcome should be in the form of accounts being in order.
Another example is not only maximization of returns to shareholders but also maximizing
the interests of all stakeholders. Hence the study has included factors like transparency in
accounting policies, excise and corporate tax evasion, environmental pollution, etc. All these
| P a g e 70
measures numbering 19, have been combined into one composite index. The two measures
of financial performance are Tobin’s Q and Excess Stock Returns for next year.
The corporate governance data and the financial performance data are analyzed for 113
companies.
Using the two sets of measures as described above for corporate governance and financial
performance, the study has observed that companies with excellent corporate governance
records have actually outperformed the stocks of companies with poor governance
practices.
It was not possible to directly examine the role of institutional investors in promoting good
corporate governance. Hence the study has used a proxy to assess whether the institutional
investors play a key role in the corporate governance system of a company. This is the data
on returns that the company has generated for its shareholders. This assumes that
institutional investors and mutual funds generally invest in companies which generate high
shareholders’ returns. A simple ordinary Least Square (OLS) regression method was used.
Applying this method the study has concluded that with the exception of mutual funds and
financial institutions there is no positive link between performance of the companies and
the stake of institutional investors in the companies. In fact there was a negative link
between the banks’ shareholding and performance of the company.
5.5 Link between Corporate Governance ( taken as outcomes of
corporate governance ) and Financial Performance
To assess the impact of 19 measures of corporate governance on financial performance, the
study has assigned differential weights to each measure and then given scores to each of
the sample companies for each measure. Higher weightage is given to measures relating to
shareholders and lower to measures relating to all other stakeholders like suppliers,
customers, employees and society. All the scores are then added up to get one composite
corporate governance index.

| P a g e 71
After developing a composite index for each company and a composite index for all 113
companies, it sets out to examine the financial performance of these companies. This is
done by using Tobin’s Q and stock returns. Tobin’s Q is the sum of the market value of
equity and book value of debt divided by the book value of total assets. The researcher feels
that there are some problems relating to the use of Tobin’s Q by itself and hence he has also
considered stock returns as another measure. The stock returns are actually excess stock
returns over the returns for the industry as a whole. This is computed as the difference
between the actual return and the median return of the stocks in the same industry.
As mentioned above the study has found a positive relationship between corporate
governance index and financial performance measured in terms of Tobin’s Q and excess
stock returns.
5.6 Relationship between Institutional Investors’ Stakes and Corporate
Governance Index
To study the pattern of institutional ownership in these 113 companies, the researcher has
considered the mean and median ownership stake of nine different types of institutions
including banks. Comparing these stakes with corporate governance index, it is concluded
that there is a positive relationship between corporate governance index and debt holding
of Development Finance Institutions (DFIs). Contrary to this there is a negative relationship
between the stakes of banks and UTI and corporate governance index.
5.7 Relationship between institutional Investors’ Stakes and Financial
Performance (Tobin’s Q)
For establishing this relationship, the study makes an assumption that institutional investors
become active only when their stakes are high above a threshold point, because the
benefits from active monitoring will exceed the costs of monitoring.
| P a g e 72
The results have shown that there is a positive relationship between the stakes of mutual
funds and financial performance. It is also a two way relationship in that it is the financial
performance that is determining the stakes of mutual funds in these companies and the
investment by these investors is also improving the financial performance of these
companies.
The second important conclusion is that there is a positive relationship between debt
extended by the DFIs and the company’s financial performance.
ii) ‘Corporate Governance and Firm Performance: Evidence from India’ conducted by Lal C
Chugh, University of Massachusetts, Boston Joseph W Meador, Northeastern University and
Ashwini Shanth Kumar, University of Massachusetts, Boston, is another study reviewed by
us for India. The study has concluded that a company with better governance structure
incorporating a larger board size creates better opportunities and can acquire larger
resources thus enhancing financial performance. On the other hand an excessively
autonomous board with a high proportion of independent directors lowers performance. It
also concludes that CEO‐duality or one director holding the post of Chairman and MD does
not have any measurable synergies with financial performance.
Before initiating the study, the researchers have tried to test their hypotheses and
scrutinized other similar research work carried out for firms in US and other developed
countries, where the firm structure and ownership patterns are different. There is some
empirical evidence that greater shareholder rights lead to higher growth rates, higher
profitability and lower cost of capital. (Gompers, Ishii and Metrick, 2003;31 Bebchuk, Cohen
and Ferrel32, 2004; Bebchuk, 2006)33. Yet some other studies have also concluded that
greater shareholder rights involve higher disclosure costs, less efficient decision making,
short term focus on profitability and higher costs of capital.(Weber, 2006;34 Hermalin
31 Op. cit. pg. 16 32 Bebchuk, Lucian a, Cohen Alma & Ferrel Allen2004, Harvard Law school, John Mollin Centre, discussion paper no. 491 33 BebchukLucian A, ‘letting shareholders set the Rules’, 2006, Harvard Law Review, 119. 34 Weber Joseph, ‘Discussion of the effects of Corporate Governance on Firms’ credit ratingsjournal of accounting & economics, Oct. 2006.
| P a g e 73
Weisbach, 200735; and Ashbaugh‐Skaife, et al. 200636). Chugh and Meador 200837 and 2010
have also argued that beyond an optimum level, shareholders’ rights can result in
diminishing returns.
The researchers have developed three different hypotheses. These are to test the
Relationship between Financial Performance and i) Board size, ii) Board autonomy and iii)
Independence of Board Chair.
i) A relatively large board size can improve the firm’s financial performance.
This is referred to as the ‘Resource Enrichment Theory’
ii) Board autonomy measured by the number of independent
directors/outside directors will minimize agency costs and thereby improve
financial performance
iii) CEO duality or the ‘Stewardship Theory’ where the Chairman and the CEO
functions are combined (when the Chairman is also the CEO or MD), will
enhance of the performance of the company.
Similar studies have again been reviewed to test these hypotheses. Some of them have
concluded that a relatively large board size can improve performance by acquiring better
managerial talent, better access to financial and product markets, better relationships with
suppliers and better alliances with other stakeholders and interest groups. ( Nicholson and
Kiel, 200738, Van den Berghe and Levrau, 200439).This is referred by the authors as the
‘Resource Enrichment Theory’. Contrary to this other studies have shown that there is an
optimal board size beyond which performance gets affected.( Bennedsen, Kongsted and
Neilson, 200840)
35 Hermalin B.E. 7 Weisbach M S 2007, ‘Transparency & Corporate Governance’NBER working Paper. 36 Ashbaug-Skaife. op. cit. Pg. 17 37 Chugh L.C.& Meador J, 2008 & ‘Analysis of Levels and patterns of Shareholders’ Rights, Journal of Business & Economics Research, 6 (5) and ‘Corporate Governance & Firm Performance (1990-2006)’, Journal of Business & Economics Research, 8(9) 38 Nicholson G J & Kiel G C 2007, ‘Can Directors Impact Performance’ Corporate Governance an International Review, 15. 39 Van den Berghe, L A A & Levrau, A, 2004 ‘Evaluating Boards of Directors: ‘What constitutes a Good Corporate Board? Corporate Governance , An International Review, 12 40Bennedsen M Kongsted H C & Neilson K M 2008, ‘The Causal Effect of Board Size and the Performance of Small and Medium Size Firms’, Journal of Banking and Finance, 32

| P a g e 74
It is also evidenced that board autonomy measured by the proportion of
independent/outside/non‐executive directors can effectively monitor and supervise
management and enhance shareholder value and performance by minimizing agency costs.
However excessive board autonomy can put management at career risks and lead to higher
management turnover generating higher costs( Heffes, 200741), higher agency costs for
creditors, (Weber, 200642) and higher costs for protecting the proprietary position of the
firm.
Some research has supported that CEO duality where the CEO is also the Chairman, could
enhance performance as there is one responsible and accountable person at the top –
Steward, empowered to take effective and timely decisions ( Donaldson and Davis, 1991;43
Braun and Sharma, 200744). But several others have recorded that combining both the
positions may prevent the board from effective oversight and could result in lower
performance. (Millstein 199245; Coles et al. 200146).
The present study has analyzed data of companies listed on NSE‐50, excluding banks and
financial companies, representing 60 percent of total market capitalization in 2009. This
cross‐sectional study has used Return on Assets (RoA) as the dependent variable and not
Return on Equity. This is to minimize the impact of capital structure decisions.
The three independent variables are board size, board autonomy and CEO‐duality. Company
size, as measured by both sales and assets is used as a control variable.
From the correlation matrix prepared based on the above variables, it is observed that
board size and financial performance are positively related but on the other hand
proportion of independent directors is negatively correlated to firm performance indicating
41 Heffes Allen M ‘have the New rules Improved Boards?’Financial Executive, May 2007. 42 Weber, op. cit. pg. 78 43 Donaldson L & Davis J H, 1991, ‘Returns’ Australian Journal of Management, 16. 44 Braun M & Sharma A, 2007 Should the CEO also be the Chair of the Board, An Empirical Examination of Family Controlled Firms,’ Family Business review, 20 (2) 45 Millstein I. 1992, ‘The Limits of Corporate Power, Existing the Constraints on the Exercise of Corporate Discretion’, New York , McMillon 46 Coles et al, 2001, ‘An Examination of the Relationship of Governance Mechanism to Performance, Journal of Management, 27.
| P a g e 75
that excessive board autonomy can reduce profitability. CEO‐duality is also negatively
correlated with profit.
Three different models have been developed in the study to test the hypotheses for three
different company size indexes. From the regression results it is observed that there is a
positive relationship between board size and financial performance in all the three size
models and at a statistical significance of 1 percent. But excessive board autonomy
(proportion of independent directors), has a negative coefficient in all the three models
though not statistically significant.
CEO duality has a negative coefficient, though not significant in the first two models but
becomes significant at 10 percent only in the third model when both asset size and sales size
are controlled. Thus combining the positions of CEO and Chairman can create agency costs
and lower RoA. There is an absence of any positive effect associated with stewardship.
Hence CEO‐duality does not create any synergies and hence there is no support for
Stewardship Theory.
Iii) ‘Insider Ownership and Firm Value – Evidence from Indian Corporate Sector’ is a paper
prepared by Manoj Pant and Manoranjan Pattanayak, for Indian listed firms.
The Paper has examined the effects of insider ownership on corporate value in India. To
investigate the relation between equity and firm value, data for 1833 BSE and NSE listed
companies for the period 2000‐01 to 2003‐04 have been used. Several studies conducted
for the Indian CG system have been reviewed and the results scrutinized. For instance a
study by Khanna and Palepu(1999)47 has suggested that insider ownership has a positive and
significant effect on firm value while directors’ holding has no perceptible impact. Later in
2005 Sarkar and Sarkar48 have provided evidence that promoter shareholding has no impact
on firm value in case of low growth firms but it has a positive impact on firms with high
growth.
47 Khanna Tarun & Krishna Palepu, 1999, ‘Emerging Market Business Groups, Foreign Investors and Corporate Governance, NBER, Working Papers 48 Sarkar Jayati and Subrota Sarkar, 1999, ‘The Governance of Indian Corporates ‘, in India Development Report.

| P a g e 76
The empirical and theoretical literature suggests that the relationship between
managerial/insider ownership and firm value is non‐linear in nature. This non‐linearity is
ascribed to the convergence of interest and entrenchment hypothesis. When the
shareholding of insiders is very low, the entrenchment effect is non‐operational due to less
control over the decision‐making process of the firm. However, once they gain controlling
authority in the firm, they can entrench themselves or pursue non‐value maximizing
activities. As per the entrenchment hypothesis, more equity ownership by a
manager/insider may lead to lower financial performance. But with majority ownership (say,
more than 50 per cent), their interest is better aligned with the interests of the firm. It may
be noted that incentive effects operate positively at all levels of ownership. Each increment
in shareholding induces the manager/insider to perform. However, it is the dominance of
the entrenchment effect over the incentives effect at a medium level of ownership that
drives the value of the firm downwards.
Considering the above arguments, the paper has stated its hypothesis below;
Hypothesis I: Firm performance is a non‐monotonic function of share ownership by insiders.
In other words, firm value first increases, then decreases and thereafter increases with
insider
ownership.
Hypothesis II: Firms with a foreign promoter/collaborator will have a higher market value
than completely domestically owned firms.
The paper has considered three types of performance parameters such as a) Tobin’s Q, b)
Accounting ratios like RoA, RoE and Earnings per share (EPS) and c) Agency cost measures
like operating expense ratio and asset turnover.
Analyzing these performance parameters with ownership of insiders, it shows that the
average Tobin’s Q is 0.69 when the insider shareholding is less than 50 percent but increases
to 0.73 when shareholding increases to 51 percent. Similar results are observed for other
performance parameters like RoA, RoE and EPS.
| P a g e 77
The paper confirms that with an increase in insider ownership firm value initially increases
as insiders have the incentive to perform to entrench themselves. But when their stake
exceeds even 20 percent, they play a crucial role in the process of decision making and
hence may have the incentive to consume at office or divert funds to entities where they
have exclusive ownership rights.
In India ownership is highly concentrated. Governance structures allow insiders to entrench
only at higher levels of ownership. Once they have a substantial stake in the firm so that the
probability of a takeover is lower they may try to divert the firm’s resources at the cost of
ordinary shareholders.
In another model the paper has included foreign shareholding as a variable which is
included in the promoters’ shareholding. It is revealed that firms with a foreign promoter
share tend to have a higher market value and higher operating income.
iv) ‘Firm Level Corporate Governance in Emerging Markets : A Case Study for India, is a more
recent Study carried out by N. Balasubramanian, IIM, Bangalore, Bernard Black, University of
Texas at Austin and Vikramaditya Khanna, University of Michigan , Law School.
The study is based on a survey of 370 public ltd. companies in India carried out in 2006 to
assess their compliance with legal norms relating to corporate governance. It has identified
areas in which Indian corporate governance is relatively strong and those in which it is
weak. On the whole it has concluded that Indian corporate governance rules are more
appropriate for larger companies but the regulation regarding related party transactions
needs to be strengthened. Besides, the study concludes that there needs to be some
relaxation in the regulations regarding smaller companies.
The study has also examined the relationship between measures of governance and
indicators of the firm’s financial performance. It has found evidence of a positive
relationship for an overall governance index and separately for indices covering shareholder

| P a g e 78
rights and disclosure. But this is evident only for large sized firms in the BSE 200 index and
insignificant for smaller sized firms.
Though the researchers have admitted that the degree of bias in the sample selection is
small, there is a tilt in favor of larger firms which are likely to follow better corporate
governance practices.
5.8 Variables for Corporate Governance
The study has identified 49 firm attributes that are considered to be indicators of good
corporate governance, for which complete data were available and were sufficiently
different from other elements included in the corporate governance index. These have been
grouped into indices of Board structure (including board independence), Disclosures,
Related Party Transactions, Shareholder rights and Board procedures. Each of these indices
has a number of sub‐indices. Using these indices an overall Indian Corporate Governance
Index (ICGI ) score has been obtained by normalizing each index to mean=0 and standard
deviation=1 and then summing the normalized index scores.
5.9 Variables for Financial Performance
For assessing the relationship between corporate governance and financial performance,
the Study has used Tobin’s Q as the dependent variable and regressed it against the overall
corporate governance index, ICGI. Other measures of performance like market‐to‐book
value and market‐to‐sales are also used. Since many firm characteristics can potentially be
associated with Tobin’s Q and governance, the study has considered a broad array of control
variables to address this omitted variable bias. Size of assets has been used to control for
the effect of firm size on Tobin’s Q. As a proxy for firm age, the study has used data on
number of years since the firm was listed since younger firms tend to be growing faster and
are more intangible‐asset intensive leading to higher Tobin’s Q. Another control variable
used is leverage, measured as debt/market value of common equity. Other control variables
are used to control firm’s growth and performance due to other factors like average sales
| P a g e 79
growth, capital intensity, R&D Expenses/Sales, etc. Since both board structure and Tobin’s
Q may reflect industry factors, industry dummy variables have also been used.
5.10 Association between Governance and Market Value
Tobin’s Q being the main measure of performance it has been regressed against ICGI. The
study has observed that firms which are intangible asset intensive have higher Tobin’s Q.
More profitable firms also have higher Tobin’s Q as do firms with high foreign ownership. A
fact uncommon in other countries but noticed in Indian industries is that larger sized firms
have higher Tobin’s Q. For medium sized firms the association is not observed. The opposite
is observed in other countries as concluded by other studies.
5.11 Association of Sub‐indices of CG with Tobin’s Q
Most sub‐indices of corporate governance are often correlating with each other albeit
moderately. By regressing Tobin’s Q with sub‐indices of corporate governance it was seen
that essentially only two sub‐indices namely Disclosure Index and Shareholders’ Rights Index
are positively and significantly associated with Tobin’s Q.
5.12 Conclusions of the study
1. Majority of firms have complied with the requirements of board independence
and other related measures since that was made was made mandatory.
2. Related party transactions were common but their approval requirements were
weak.
3. On disclosures, there was considerable room for improvement.
4. Voting by shareholders and postal voting was not very active.
5.13 Association between governance indices and firm value
There was a positive and statistically significant correlation between ICGI and firm Market
Value in India. This was true more for larger firms (BSE 200) than for medium or smaller
| P a g e 80
sized firms. This could be because larger firms have high public visibility, good analyst’s
coverage and extensive foreign ownership.
In terms of sub‐indices of governance, it was revealed that Disclosures and Shareholders’
Rights are positively associated with firm market value. The other sub‐indices are
insignificant. The non‐results for board independence contrast with other recent studies of
emerging markets, which have found a positive association between the two. The study
shows that India’s legal requirements for board independence are strict enough so that over
compliance does not produce valuation gains even for large firms and could be too strict for
small firms.
5.14 Summary of Observations from above Studies
Our review and scrutiny of the results of the above research studies and their comparison
with those emerging out of studies for India has helped us in devising appropriate
methodology for our study besides formulating and testing hypotheses which are more
applicable in the light of the type of ownership and control of companies in India and the
prevailing corporate governance regulatory and legal framework.
One thing which has clearly emerged from the review is that the overall corporate
governance measure i.e. corporate governance Index has a positive relationship with
financial performance of companies across all countries both developed and emerging
markets. It is when different parameters of corporate governance i.e. sub‐indices are
measured that the variations occur in the relationships. Again the positive relationship is
mostly observed in larger sized manufacturing firms rather than medium or small sized firms
where size is measured by value of total assets.
The commonly used measures of financial performance are Tobin’s Q, Return on Assets,
Return on Equity, Profitability, Sales Growth, Share Turnover and Firm Valuation.

| P a g e 81
Most of the cross‐country studies have concentrated on three to four major parameters of
corporate governance which are related to ownership and control, which are distinctive
features of family managed companies and hence the relationships studied are relevant to
our study. While studying ownership and control, the studies have analyzed the equity
holdings of the owners/promoters or founding families, the number of promoters/family
members on the board (and number of independent directors), the structure and size of the
boards, the duality of Chairman and CEO and the degree of independence of the Chairman.
There is a perceptible variance between the results of the studies carried out in USA and
Western Europe and those carried out in the emerging and Asian economies. According to a
study of over 2000 firms in USA, good governance as measured by executives’ and directors’
compensation, is most highly associated with good performance. This study contrary to
other studies in emerging markets argues that Tobin’s Q does not increase with higher
board independence (larger number of independent directors on board). The size of the
board matters for returns on equity and net profit margins. However the board size could be
limited between 6 & 15 in number.
In UK there is emphasis on separation of the roles of Chairman and CEO since it is widely
held that companies with an independent chairman have outperformed those with
chairman and CEO’s posts combined into one. Independence of board is also defined as an
important determinant of good corporate governance due to its greater potential for
oversight.
Most of the studies (Brazil, Korea, India and Taiwan) have concluded that board
independence (limiting the number of family members on board) and to some extent board
size (at an optimum level) have a positive relationship with firm performance. A common
observation that has emerged from these studies is that the presence of family control
through concentrated ownerships and larger family presence on boards and management
have a negative effect on firm performance measured by return on assets and profitability.
Larger levels of family (Insider) ownership according to studies in Korea and Taiwan could
lead to earnings management and lower the quality of earnings. Lowering of Insider self‐
| P a g e 82
dealings could increase the transfer of wealth to outside shareholders and help improve
firm performance and hence overall value of firms.
In a study for India it was observed that though Tobin’s Q has a positive relationship with
overall corporate governance index, it is mostly true of larger sized firms i.e. BSE 200, size
being measured by size of assets. The same relationship is not observed for medium and
smaller sized firms. Board independence was not observed to have a significant relationship
with firm performance and valuation. The other sub‐indices which seem to have a positive
relationship with firm performance are board procedures, disclosures and shareholders’
rights which are true for India, Brazil and Korea.
In another study where the relationship between insider ownership and firm value in India
was assessed, it was concluded that with an increase in insider ownership, firm value
initially increases as insiders have the incentive to perform to entrench themselves. But
when their stake exceeds even 20 percent and goes up to 50 percent, they play a crucial role
in the process of decision making and hence may have the incentive to consume at office or
divert funds to entities where they have exclusive ownership rights.
In India ownership is highly concentrated. Governance structures allow insiders to entrench
only at higher levels of ownership. Once they have a substantial stake in the firm so that the
probability of a takeover is lower, they may try to divert the firm’s resources at the cost of
ordinary shareholders. This type of non‐linear relationship is observed for Tobin’s Q, and
other performance parameters like RoA, RoE and EPS.
Another empirical study for India has brought out a positive relationship between board size
and financial performance at a statistical significance of 1 percent. But it has also concluded
that excessive board autonomy (proportion of independent directors), has a negative
coefficient, though not statistically significant. CEO duality has a negative coefficient, though
not significant but it becomes significant at 10 percent only when both asset size and sales
size are controlled. This result shows that combining the positions of Chairman and CEO
creates additional agency costs and lowers the RoA thus impairing firm performance.
| P a g e 83
Chapter ‐ 6
Methodology
6.1 Background
The objective of the present study of ‘Corporate Governance Practices and Financial
Performance of selected Family Managed Medium sized listed Companies’ was to establish
a relationship between corporate governance practices in these companies and their
financial performance and how this relationship would result in creation of value for all
stakeholders.
This research study thus aims at assessing the impact of good governance practices on the
company’s performance as measured in terms of selected financial parameters. Corporate
governance practices have been rated in terms of compliance with Clause 49 of the
Agreement of Listed companies with their Stock Exchanges – Mandatory and Non‐
mandatory requirements as well as the measures voluntarily taken by the companies to
improve their governance practices in accordance with the Voluntary Guidelines announced
by the Ministry of Corporate Affairs in December 2009. Going beyond compliance emphasis
has also been on the manner in which the governance mechanism has been executed
differentiating between companies which comply with the Clause 49 provisions merely for
the sake of complying with mandatory requirements and those which have made extra
efforts and investment to improve their governance mechanisms such as installation of the
latest IT systems or setting up of separate departments or committees for the purpose. A
separate set of parameters have been drawn up to measure value creation by the
companies for their shareholders and all other stakeholders.
The study is based on desk research and econometric analysis of data collected to establish
the relationship between the selected variables. The annual reports of the companies giving
| P a g e 84
a separate chapter on corporate governance and the balance sheets of the companies which
provide the financial performance indicators – absolute numbers and ratios – have formed
the basic source of data and information.
6.2 Updates on Corporate Governance Regulatory Framework
Before embarking on the study, it was necessary to collect up‐to‐date information on the
norms and provisions laid down in Clause 49 of the Listing Agreement of Companies with
their Stock Exchanges. All modifications, additions and deletions carried out by SEBI in
Clause 49 since its announcement in Jan. 2006 and circulated to the listed companies from
time to time through their Stock Exchanges were scrutinized and included in the database.
In addition, announcements made by the Ministry of Corporate Affairs from time to time
regarding corporate governance regulatory framework, including Corporate Governance
Voluntary Guidelines – Dec. 2009 were studied. The Guidelines have enlisted a number of
voluntary measures to be adopted by the listed companies for improving their corporate
governance practices. These along with the new provisions in Clause 49, helped in selecting
the key parameters of governance in family managed companies.
Based on the information published in the annual reports of the companies, the prevailing
governance practices which went beyond just compliance with the regulatory norms were
also examined. These were the practices undertaken by companies voluntarily to improve
their corporate governance standards and create value for all their stakeholders‐
employees, consumers, suppliers, creditors and society. These were activities relating to
human resource development, environment protection, energy conservation, quality
improvement and corporate social responsibility aimed at benefiting all these stakeholders
and invoke their confidence for the long term sustainability of the company.

| P a g e 85
6.3 Literature Review
Before finalizing the methodology, a review of similar studies already carried out in the past
was undertaken. The aim was to examine their objectives, key parameters focused upon
and the statistical models used to assess the relationship between corporate governance
practices and various criteria of financial performance including Tobin’s Q. Our review
included several studies carried out for family managed/controlled companies in both
developed and emerging markets like India. These have been discussed in detail in Chapter ‐
5. It was observed that there is a positive relationship between some of the parameters of
corporate governance and criteria of financial performance in family owned and managed
companies. Most of these studies have considered a selected set of corporate governance
indicators, essentially board composition, promoters’ shareholding, insider ownership and
other related aspects to study their impact on financial performance of the companies.
However, our study has considered the entire range of corporate governance practices as
included in the regulatory framework. Our study, thus considers corporate governance
practices which are mandatory and non‐mandatory under the regulatory framework as well
as those which are taken up voluntarily including practices which are beyond compliance.
The review of these research studies has helped in determining the major corporate
governance parameters which predict firm performance. It has also helped in comparing the
corporate governance practices adopted by family managed companies across developed
and emerging economies and the constraints faced by this group of companies in complying
with the prevailing regulatory framework due to their inherent ownership structures.
As family managed companies have their unique governance structures with in‐built
tendency to create wealth for the majority shareholders – the family owners or promoters,
the task of identifying medium sized companies with acceptable governance standards was
quite complex. A suitable mechanism had to be designed to identify medium‐sized family
managed companies from within the 6000 odd companies listed on the BSE and NSE. It was
decided to restrict the analysis to companies which had their registered/corporate offices in
Mumbai.
| P a g e 86
6.4 Selection of Sample
At the outset, it was decided to define Family Managed Medium‐sized Companies.
i) Family Managed Companies were defined as those in which the promoters‐ either
individuals or their immediate family or a joint family or a family holding company or
a combination of these held equity to the extent of 25 percent or more of the total
shareholding of the company.
ii) Medium‐sized companies were defined as those with Value of Total Assets ranging
between Rs. 200 crore to Rs. 2000 crore.
As the corporate governance practices were to be assessed over two time periods, it was
decided that all data for the above defined companies would be collected for the
financial years 2005‐06 and 2009‐10.
6.4.1 Database Selection
For selection of the companies, the database of companies listed on both BSE and NSE in
2009‐10 was obtained from CMIE Prowess. This database contained all the relevant
information relating to the listed companies, classified into regions, size, ownership,
shareholding pattern etc. which were relevant for our study.
From the Prowess Database, companies based in the Western Region were selected and
then further sub‐divided into those based in Mumbai. This threw up 4,829 companies in
Mumbai which were listed on both BSE and NSE. From this group all public sector
companies and banks were eliminated and only Indian owned or foreign subsidiaries
/associate companies in the private sector were selected. This group also constituted
companies promoted by leading business houses like Tata’s, Birla’s and Ambani’s and their
subsidiaries/associates. All these were also removed from the group. This reduced the
group’s size to 4,603. This therefore provided the base for selection of our sample of
medium‐sized family managed companies as defined above.
| P a g e 87
6.4.2 Sample Companies
To the narrowed down group of 4,603 companies we applied the criteria of family
ownership i.e. promoters’/promoter group’s equity holding to be greater than 25 percent
of total holding. Application of this criterion further brought down the number to 900
companies. From this group we had to select only medium‐sized companies. These were
defined as those having total assets in the range of Rs. 200‐2000 crore. Hence, from the 900
companies those falling within this asset range were selected. This resulted in the final
selection of 237 companies which met with our twin criteria of being Family Managed and
Medium‐sized companies.
It was decided to draw from this identified group a sample of 100 companies for our study.
For this purpose the stratified sampling technique was used.
The identified 237 companies were stratified into two categories:
Category A ‐Those having promoters’ equity holding more than 50 percent forming 71
percent of the total (168 companies).
Category B ‐ Those with promoters’ equity holding between 25‐50 percent forming 29
percent of the total (59 companies).
Applying the same proportionate representation to our sample of 100, it was decided to
select 71 companies from group A and 29 companies from group B.
To give adequate representation to the asset classes in the sample, Groups A and B were
further sub‐divided into three major asset classes:
1. Total asset size ‐ Rs. 200‐800 crore
2. Total asset size ‐ Rs. 800‐1400 crore
3. Total asset size ‐ Rs. 1400‐ 2000 crore
Based on the proportion of units in each asset class in Group A and B, the two sub‐samples
of 71 companies (More than 50 percent promoters’ equity) and 29 companies ( 25‐50

| P a g e 88
percent promoters’ equity) were further sub‐divided into three different asset classes as
seen in the following table.
6.5 Classification of Sample Companies
Table 6.1
Initial Classification of Sample Companies
Asset Class (Rs. Crore) Cos. with Promoters’ Equity more than 50 percent
Cos. with Promoters’ Equity 25 – 50 percent
Total
200‐800 49 (70 percent ) 21 (71 percent ) 70
801‐1400 15 (21 percent ) 5 (18 percent ) 20
1401‐2000 7 (9 percent ) 3 (11 percent ) 10
Total 71 (100 percent ) 29 (100 percent ) 100
To give adequate representation to major industry groups in the sample, the companies in
Group A and Group B were further classified into nine major groups. – Pharmaceuticals and
Chemicals, IT, Electricals and Electronics, Textiles, Jewelry, Engineering, Infrastructure,
Minerals and Metals and Others.
After determining the size of each stratum in the sample as in Table 6.1 above, the
companies were selected and included based on their industry‐wise distribution in each
asset class. Though an attempt was made to cover all the 100 units in the sample, we faced
several constraints at the time of data entry. During scrutiny of annual reports of the
selected companies we came across several data gaps. In some cases data were not
available for the final year while in others the companies had been merged with other
companies. Due to these constraints only 57 companies could be finally considered as
sample for our analysis. The break‐up of these 57 in three asset classes is seen in Table 6.2
below:
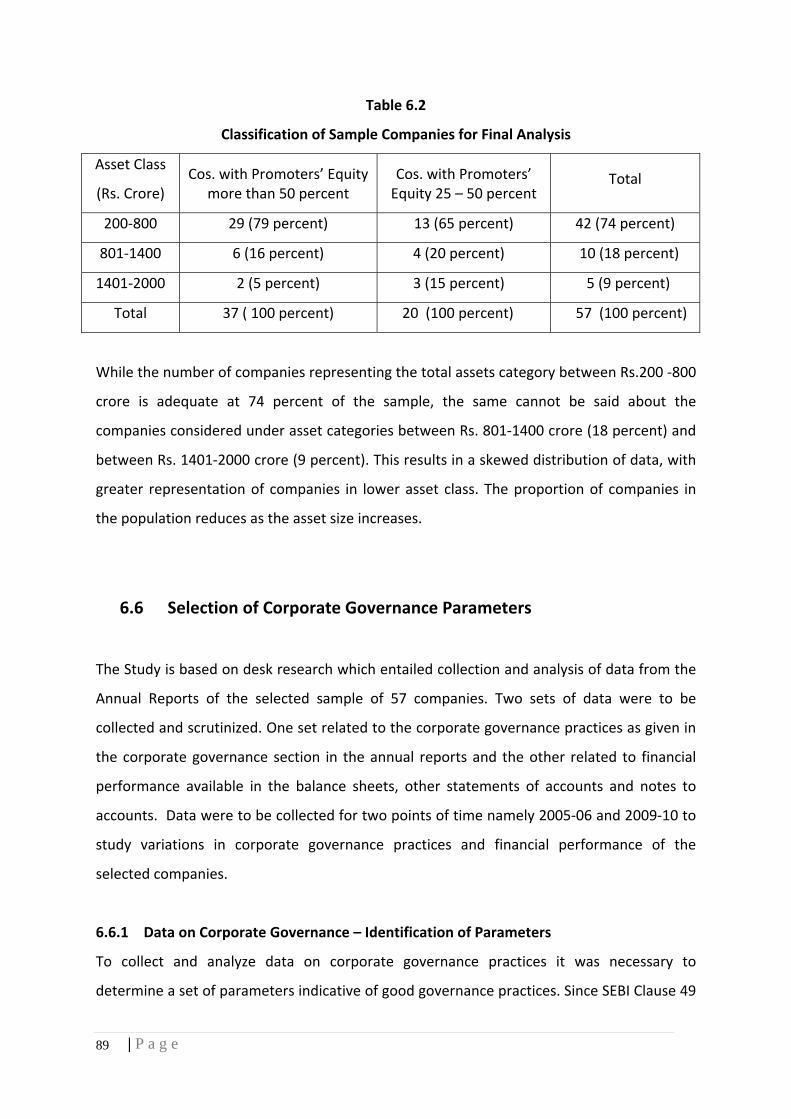
| P a g e 89
Table 6.2
Classification of Sample Companies for Final Analysis
Asset Class
(Rs. Crore) Cos. with Promoters’ Equity
more than 50 percent Cos. with Promoters’ Equity 25 – 50 percent
Total
200‐800 29 (79 percent) 13 (65 percent) 42 (74 percent)
801‐1400 6 (16 percent) 4 (20 percent) 10 (18 percent)
1401‐2000 2 (5 percent) 3 (15 percent) 5 (9 percent)
Total 37 ( 100 percent) 20 (100 percent) 57 (100 percent)
While the number of companies representing the total assets category between Rs.200 ‐800
crore is adequate at 74 percent of the sample, the same cannot be said about the
companies considered under asset categories between Rs. 801‐1400 crore (18 percent) and
between Rs. 1401‐2000 crore (9 percent). This results in a skewed distribution of data, with
greater representation of companies in lower asset class. The proportion of companies in
the population reduces as the asset size increases.
6.6 Selection of Corporate Governance Parameters
The Study is based on desk research which entailed collection and analysis of data from the
Annual Reports of the selected sample of 57 companies. Two sets of data were to be
collected and scrutinized. One set related to the corporate governance practices as given in
the corporate governance section in the annual reports and the other related to financial
performance available in the balance sheets, other statements of accounts and notes to
accounts. Data were to be collected for two points of time namely 2005‐06 and 2009‐10 to
study variations in corporate governance practices and financial performance of the
selected companies.
6.6.1 Data on Corporate Governance – Identification of Parameters
To collect and analyze data on corporate governance practices it was necessary to
determine a set of parameters indicative of good governance practices. Since SEBI Clause 49

| P a g e 90
had laid down two sets of sub‐clauses, Mandatory and Non‐mandatory, our parameters for
compliance with Clause 49 were also classified into two sets, i) Mandatory and ii) Non‐
mandatory.
In addition to Clause 49, the Ministry of Corporate Affairs had also announced a set of
Voluntary Guidelines in 2009 in order to encourage the listed companies to voluntarily
adopt them for improving their governance standards and also serve as a benchmark for the
corporate sector. To examine the adoption of these voluntary guidelines by the sample
companies, a third set of parameters was formed – iii) Voluntary Governance Parameters.
Finally, in order to examine the practices which went beyond compliance like those adopted
for creation of value for all other stakeholders, a fourth set of parameters was formed, iv)
Beyond Compliance .
All the four groups of parameters were streamlined in order to select the ones which would
have a direct or indirect relationship with financial performance. Our review of earlier
research work on the same subject had also thrown up a few parameters of good
governance. Based on their adaptability to Indian corporate environment, a few more
parameters were also included selectively in the above four groups.
It was observed from the reports on corporate governance of the companies, that though all
the companies adhered to the mandatory norms of Clause 49, the approach of each
company towards compliance was different. For instance, though Clause 49 has mandated
the setting up of only Audit Committee and Shareholders/Investors Grievance Committee,
some companies had gone ahead and set up a number of other Board level committees like
the Remuneration Committee (Non‐mandatory), Nomination Committee, Corporate
Governance committee Human Resource Committee. This reflects deliberate efforts and
investment aimed at greater supervision and improvement in CG practices.
Again the manner in which some of the companies complied with the mandatory/non‐
mandatory clauses and voluntary guidelines differed. For instance some well governed
companies had set up separate depts., for risk management and internal controls and even
| P a g e 91
invested in sophisticated IT procedures like ERP‐SAP for strengthening these departments.
On the other hand, some companies had simply assigned these tasks to their audit dept. or
HR dept. The role and responsibilities assumed by the Audit Committees also differed
significantly across companies. Not all the Audit Committees carried out all the 15 different
functions mandated in Clause 49. Even if they did it was not reported in the annual reports.
Some of the practices relating to the mandatory disclosure norms and transactions with
related parties, differed from company to company. Hence it was necessary to distinguish
between companies which had simply complied with the norms and those which had done
more than the minimum required and also reported it to their shareholders through their
Annual Reports.
To bring out these differences, each of the parameters in the three sets described above,
was assigned sub‐parameters indicating the manner in which the companies complied with
the norms. These four sets of parameters along with their sub‐parameters are seen in
Appendix VI.I
6.7 Variable Formation Procedure
This section explains the process or methodology adopted to build indices using various
parameters of corporate governance. The entire set of corporate governance parameters
has been divided into four categories: (a) Mandatory Provisions under Clause 49, (b) Non‐
Mandatory Provisions under Clause 49, (c) Non‐Mandatory Provisions under Voluntary
Guidelines (2009), and (d) Beyond Compliance Initiatives. The details are available in
Annexure – I.
When the unadjusted data was considered, we had the following distribution of variables:
a) Mandatory Clause 49: 56 variables,
b) Non‐Mandatory Clause 49: 7 variables,
c) Non‐Mandatory Voluntary Guidelines: 8 variables, and
d) Beyond Compliance: 11 variables, totaling to 82 variables.
| P a g e 92
Among these, 15 variables were represented as percentage values. Twelve variables were
pure numbers. Other than these 27 variables, the rest 55 variables out of the total 82
variables were binary variables, which represented only two situations: YES or NO. Within a
broad category, we created indices with these binary variables to represent a single
variable.
For example, Beyond Compliance Initiatives for HR, Quality Improvement & Environmental
Protection is a broad category. This constitutes sub‐categories like – Periodic training for
employees, Training for other stakeholders, Performance improvement programs, Women's
security and empowerment, Quality Improvement Programs and Certifications,
Environment Protection and Safety and Health for employees as mentioned in Annual
Reports.
All these variables were represented as Yes or No, depending on whether the company has
undertaken these measures and reported in its annual report. If a company answers Yes for
all the variables, then it gets a score of 6, which is the maximum. Sometimes, it may so
happen that the presence of a particular sub‐category, instead of adding value to good
governance, reduces it. In all such cases the use of “0” and “1” to represent “non‐
availability” and “availability”, is reversed. In some cases, we were also required to integrate
a ratio scale sub‐category with a binary scale sub‐category while creating a variable.
In all such cases we have used weightages, so that the impact of one sub‐category is not
over‐emphasized or under‐emphasized.
6.8 Formation of Indices
We now look at formation of the indices. The corporate governance parameters are the
final variables considered for the study. These parameters were further divided into
categories and sub‐categories. As mentioned earlier, there are a total of 82 sub‐categories.
Generally, each sub‐category belongs to an overall category of measurement of corporate
governance. Such sub‐categories have been clubbed together to form indices.
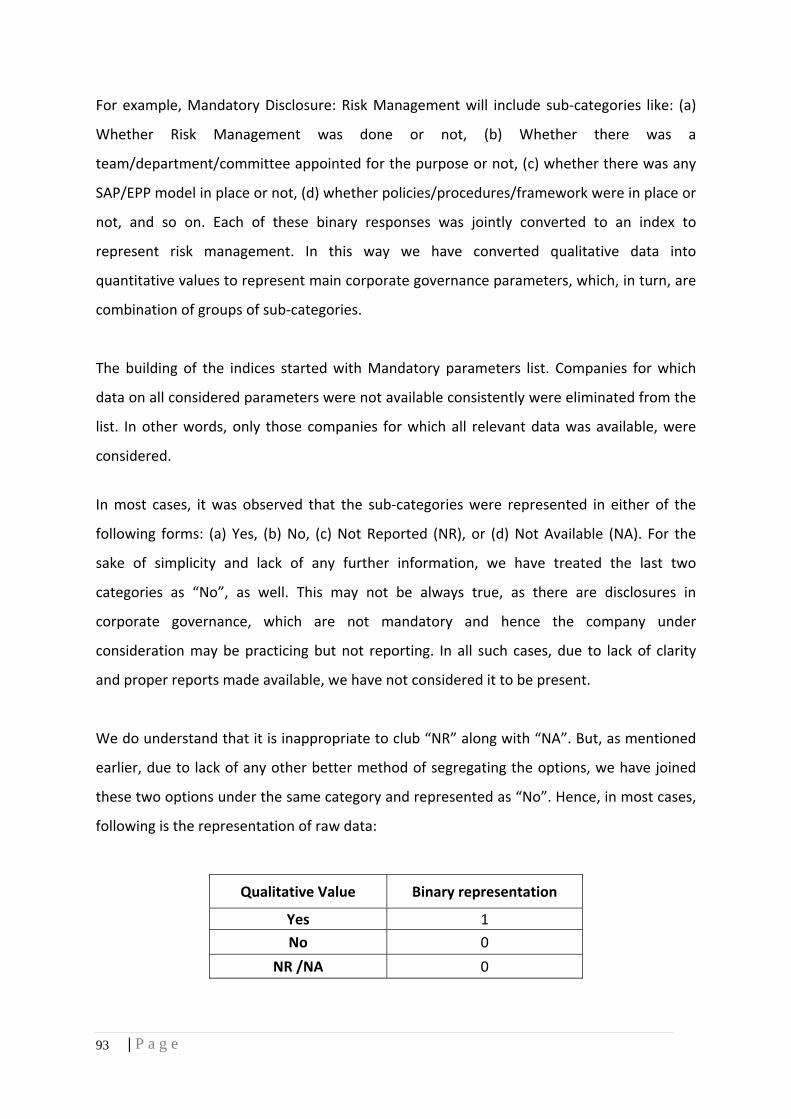
| P a g e 93
For example, Mandatory Disclosure: Risk Management will include sub‐categories like: (a)
Whether Risk Management was done or not, (b) Whether there was a
team/department/committee appointed for the purpose or not, (c) whether there was any
SAP/EPP model in place or not, (d) whether policies/procedures/framework were in place or
not, and so on. Each of these binary responses was jointly converted to an index to
represent risk management. In this way we have converted qualitative data into
quantitative values to represent main corporate governance parameters, which, in turn, are
combination of groups of sub‐categories.
The building of the indices started with Mandatory parameters list. Companies for which
data on all considered parameters were not available consistently were eliminated from the
list. In other words, only those companies for which all relevant data was available, were
considered.
In most cases, it was observed that the sub‐categories were represented in either of the
following forms: (a) Yes, (b) No, (c) Not Reported (NR), or (d) Not Available (NA). For the
sake of simplicity and lack of any further information, we have treated the last two
categories as “No”, as well. This may not be always true, as there are disclosures in
corporate governance, which are not mandatory and hence the company under
consideration may be practicing but not reporting. In all such cases, due to lack of clarity
and proper reports made available, we have not considered it to be present.
We do understand that it is inappropriate to club “NR” along with “NA”. But, as mentioned
earlier, due to lack of any other better method of segregating the options, we have joined
these two options under the same category and represented as “No”. Hence, in most cases,
following is the representation of raw data:
Qualitative Value Binary representation
Yes 1
No 0
NR /NA 0
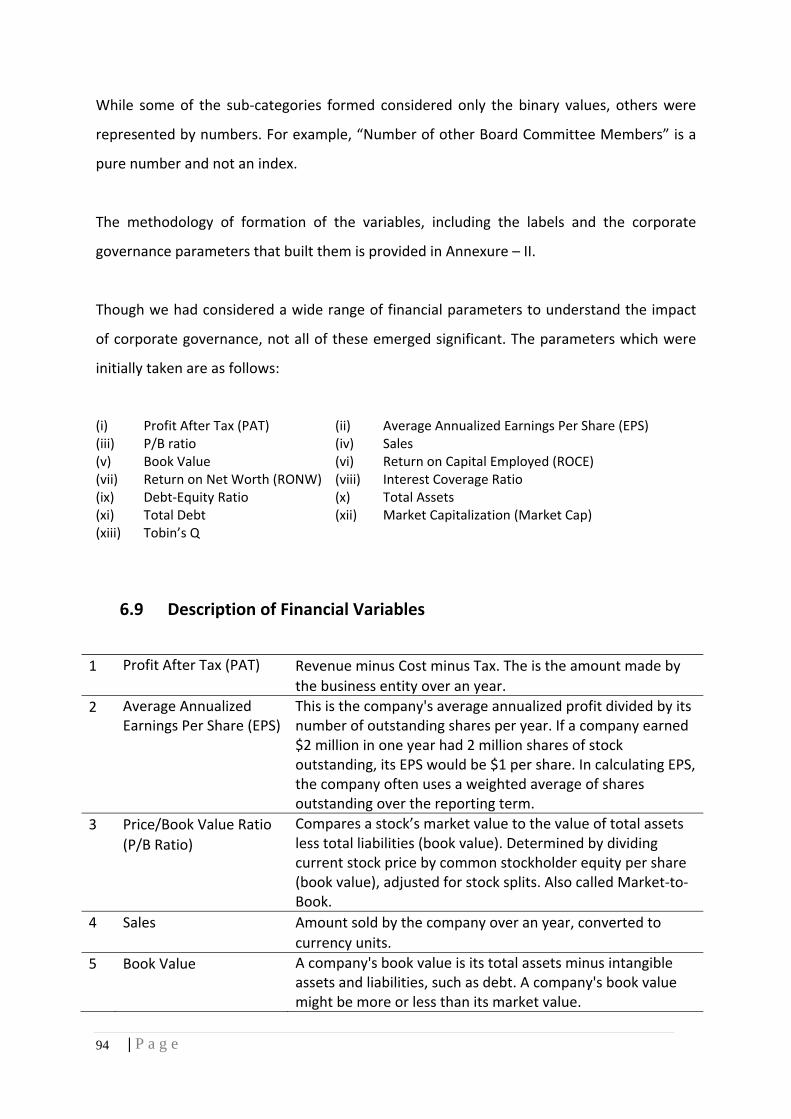
| P a g e 94
While some of the sub‐categories formed considered only the binary values, others were
represented by numbers. For example, “Number of other Board Committee Members” is a
pure number and not an index.
The methodology of formation of the variables, including the labels and the corporate
governance parameters that built them is provided in Annexure – II.
Though we had considered a wide range of financial parameters to understand the impact
of corporate governance, not all of these emerged significant. The parameters which were
initially taken are as follows:
(i) Profit After Tax (PAT) (ii) Average Annualized Earnings Per Share (EPS) (iii) P/B ratio (iv) Sales (v) Book Value (vi) Return on Capital Employed (ROCE) (vii) Return on Net Worth (RONW) (viii) Interest Coverage Ratio (ix) Debt‐Equity Ratio (x) Total Assets (xi) Total Debt (xii) Market Capitalization (Market Cap) (xiii) Tobin’s Q
6.9 Description of Financial Variables
1 Profit After Tax (PAT)
Revenue minus Cost minus Tax. The is the amount made by the business entity over an year.
2 Average Annualized Earnings Per Share (EPS)
This is the company's average annualized profit divided by its number of outstanding shares per year. If a company earned $2 million in one year had 2 million shares of stock outstanding, its EPS would be $1 per share. In calculating EPS, the company often uses a weighted average of shares outstanding over the reporting term.
3 Price/Book Value Ratio (P/B Ratio)
Compares a stock’s market value to the value of total assets less total liabilities (book value). Determined by dividing current stock price by common stockholder equity per share (book value), adjusted for stock splits. Also called Market‐to‐Book.
4 Sales Amount sold by the company over an year, converted to currency units.
5 Book Value A company's book value is its total assets minus intangible assets and liabilities, such as debt. A company's book value might be more or less than its market value.

| P a g e 95
6 Return on Capital Employed (ROCE)
This is used as a measure of returns that a company is realizing from its capital employed. Capital employed is represented as total assets minus current liabilities. ROCE is a ratio that indicates the efficiency and profitability of a company’s capital investments (which includes stocks, shares and long term liabilities).
7 Return on Net Worth (RONW)
RONW is used as a measure of company’s profitability. It reveals how much profit a company generates with the money that the equity shareholders have invested. The ratio is useful for comparing the profitability of the company to that of similar firms in the industry.
8 Interest Coverage Ratio
This is used to measure a company’s earnings relative to the interest that it pays. It is a financial leverage ratio as it analyses a company’s financial viability regarding its debt.
ExpenseInterest EBITRatio CoverageInterest =
EBIT stands for Earnings before Interest and Taxes. This is also referred to as operating income, which is revenue minus operating expenses. Interest expense is the amount of interest the company pays on its debt.
9 Debt‐Equity Ratio
This is an indicator of financial leverage. It compares assets provided by creditors to assets provided by shareholders. Its determined by dividing long‐term debt by common stockholder equity.
10 Total Assets It comprises of all assets that have value in exchange. It includes both fixed assets and current assets.
11 Total Debt Amount owned by the company for funds borrowed. Debt can be represented by a loan note, bond, mortgage or other form stating repayment terms and, if applicable, interest requirements. These different forms all imply intent to pay back an amount owed by a specific date, which is set forth in the repayment terms. It includes short‐term debts and long‐term debts.
12 Market Capitalization The total currency value of all outstanding shares. It is computed as shares times current market price. It is a measure of corporate size.
13 Tobin’s Q AssetsTotal
Cap.Market AssetsTotalDebt TotalQ sTobin' +=
Source: www.FinancialFormulas.net, and Forbes Financial Glossary We included data for two years – 2006 and 2010 in the index. As 2006 is the base year in
which most corporate entities just started with reporting their corporate governance

| P a g e 96
practices as mandated under Clause 49, we collected data on that year as a starting
benchmark. Then, to study the developments in the practices of corporate governance over
the years, we considered data from 2010 to understand whether improvements in
corporate governance practices were leading to better financial returns.
To achieve this, we used regression analysis using financial parameters from the list
provided earlier as the dependent variables and the corporate governance indices as
independent variables.
6.10 Regression Analysis
We used both Multiple and Step‐wise Regression as our statistical models.
A Multiple Regression Model assumes there is a relationship between a single dependent
variable, which is metric and several independent variables which can be metric
(quantitative variable) and non‐metric (qualitative variable) in nature. However, non‐metric
independent variables can be only nominal (when it takes only two values “0” and “1”) and
not multinomial (when the variable takes several nominal values like “1”, “2”, “3”,etc.).
Typically “Y” is denoted as the dependent variable and the independent variables are
denoted by “X1, X2, X3, …, Xn”. The model can be represented as follows:
εβββββ ++++++= nn XXXXY ...3322110
The model says that the values of Y can be represented by a mean level –
nn XXXX βββββ +++++ ...3322110 – that changes as X1, X2, X3, …, Xn change, combined
with random fluctuations, described by the error term ε, that causes the values of Y to
deviate from the mean level. The β values are called the regression coefficients. These are
unknown and determined from the regression output. β0 is the intercept term of the model
and the other β values are the regression coefficients of the independent variables. The
intercept term captures the influence of other factors, other than corporate governance.
Based on the above equation, we can also generate the hypothesis to be tested. Let us take
an example. Let us assume that our regression equation is as follows:
( )

| P a g e 97
Tobin’s Q = β0 BCHRQE + β1 MMD + β2 MNSAC + β3 NMVGRI + β4 NM49RCI
In this case our null hypothesis will be that none of the corporate governance parameters
considered, i.e., BCHRQE, MMD, MNSAC, NMVGRI and NM49RCI have any influence on
Tobin’s Q. Mathematically, it is represented as:
0: 43210 ==== ββββH
The Alternative Hypothesis will be that at least one of the corporate governance parameters
influences Tobin’s Q. Mathematically, it is represented as:
0: 43211 ≠≠≠≠ ββββH
If the null hypothesis is rejected for at least one of the independent variables, it would
imply, that independent variable influences Tobin’s Q.
All the regression models are performed, based on this formulation of hypothesis testing.
Along with all regression outputs, p‐value and the t‐value associated with the independent
variables have also been mentioned. A brief description of the above is pertinent, in this
context.
The p‐value is the probability of getting a test statistic equal to or more extremely than the
same result, given that the null hypothesis H0, is true. It is often referred to as the observed
level of significance and is the smallest level at which H0 can be rejected. The general
thumb‐rule for rejecting H0 based on the p‐value approach is as follows:
If the p‐value is less than 0.01, then we can say that the H0 is rejected at 99 percent level of
confidence or 1 percent level of significance.
If the p‐value lies between 0.01 and 0.05, i.e., 0.01 < p‐value < 0.05, then we can say that
the H0 is rejected at 95 percent level of confidence or 5 percent level of significance.
If the p‐value lies between 0.05 and 0.10, i.e., 0.05 < p‐value < 0.10, then we can say that
the H0 is rejected at 90 percent level of confidence or 10 percent level of significance.
| P a g e 98
If the p‐value is greater than 0.10, then we can say that the H0 is accepted at 90 percent
level of confidence or 10 percent level of significance.
In the last case, the independent variable is considered to have no influence on the
dependent variable.
The t‐value is used as a cross‐check mechanism of the p‐value approach. However, the
interpretation of values considered by “t” is different from p‐value. A higher value of “t”
would generally imply a higher influence of the independent variable on the dependent
variable. In other words, it would imply a strong case of rejection of the null hypothesis.
Generally, a higher value of “t” is accompanied with a very low p‐value. The sign of “t‐value”
is also important to be interpreted. If the “t‐value” has a positive sign, if would imply that
the relationship between the dependent and the independent variable is direct. That is, if
the value of the independent variable increases, the value of the dependent variable will
also increase, though not by the same proportion and amount. Conversely, if the “t‐value”
has a negative sign, if would imply that the relationship between the dependent and the
independent variable is inverse. That is, if the value of the independent variable increases,
the value of the dependent variable will decrease, though not by the same proportion and
amount of the increase.
6.11 Multiple and Stepwise Regression
A Multiple regression output typically provides a predictive output by displaying the values
of the coefficients. Other than this, we can come to know about the overall explanatory
power of all the independent variables taken together, on the dependent variable,
commonly called the R‐Squared value. It is also possible to get an understanding about the
relative explanatory power of the individual independent variables from the regression
output. This can be achieved by observing the p‐values and the t‐values of the independent
variables, as generated by the regression output.
In our analysis, we have used a combination of Multiple Regression and Stepwise
Regression. In the case of Multiple Regression we consider all independent variables which
| P a g e 99
may or may not influence the dependent variable, in context. In the process, we have to
carefully observe the p‐values and the t‐values to understand which independent variables
impact the dependent variable and which do not. In the case of Stepwise Regression, we run
regression in steps. In the first step we consider the independent variable which has the
highest influence on the dependent variable. In the second step, we consider the
independent variable which has the next highest influence on the dependent variable, and
so on. We run the process till we reach a stage when the independent variables no more
influence the dependent variable, going by the acceptable levels of the p‐values and the t‐
values.
For the analysis, the data relating to corporate governance parameters and financial
performance were collected from Capital Line and from Annual Reports of the respective
companies considered for the study. There were instances where spikes were observed in
the data due to non‐availability of information. For example, for a particular variable data
were observed to fluctuate between 6 and 8.5, but there are a few observations where data
show “0” value. This “0” is not the true value of the variable – it has been used due to non‐
availability of information. Hence, on various occasions due to non‐availability of data, “0”
or “Nil” has been reported either by the data sources (i.e., Capital Line) or when the data
were compiled by the researchers from the company Annual Reports. Needless to say, this
has an adverse impact on the final results and analysis, as it increases the variability of the
concerned variable. Hence, we have conducted our study in two phases. In Phase I we have
used the original data without any adjustment. In Phase II we have used approximations
wherever data was missing or it was given as “0” wrongly due to non‐availability.
6.12 Assumptions and Constraints
The entire data was divided into categories as mentioned in Table 6.2 (page 86)
A quick summary is as follows : Companies with Promoter’s Equity above 50 percent and total assets of Rs.200 to Rs.800 crore. (29) Companies with Promoter’s Equity above 50 percent and total assets of Rs.800 to Rs.1400 crore.(6) Companies with Promoter’s Equity above 50 percent and total assets of Rs.1400 to Rs.2000 crore.(2) Companies with Promoter’s Equity within 25‐50 percent and assets of Rs.200 to Rs.800 crore. (13) Companies with Promoter’s Equity within 25‐50 percent and assets of Rs.800 to Rs.1400 crore. (4) Companies with Promoter’s Equity within 25 ‐ 50 percent and assets of Rs.1400 to Rs.2000 crore. (3)
| P a g e 100
The numbers represented in brackets, at the end of each category show the number of
companies in that category, selected for the study. The total number of companies
considered for the study is 57. The distribution of the sample companies in various size
classes is the same as their presence in the overall set of 230 companies, initially considered
for the study. Though a diversified range of companies has been considered for the study
and a conscious effort was made to have a good sample size across all categories, due to
several constraints we could not maintain the balance. The smaller number of sample
companies representing larger asset size class, could influence our findings. The non‐
availability of annual reports and financial performance data consistently for both the years
for the selected companies. This is another shortcoming that could have affect the results of
the study.
Secondly, as many other studies have done, we have not considered control variables to
study the impact of a few independent variables, controlling the impact of others. There
were two reasons for not doing this. Our sample size for some of the sub‐classes (based on
total assets and promoters’ shareholding pattern) being very small, it would not have been
possible to create control variables, based on these classes. Another reason was that we did
not use any results from multiple regressions directly – we have used results only from
stepwise regression analysis, where one variable enters at a time, to study the impact on
the dependent variables. This process leaves us with less independent variables influencing
the dependent variable. Nevertheless, we wish to admit that the study assumes that use of
control variables would not have led to any different results than the present one.
Lastly, the clubbing of “NR”, “NA” and “NO” as “0”, which in reality may have different
interpretations depending on the availability and/or reporting of the sub‐category (under
corporate governance) in the Annual Report, is a limitation of the study.
Despite the constraints, the study has been largely successful in bringing about a strong
relationship between some of the corporate governance parameters and financial
performance of companies.
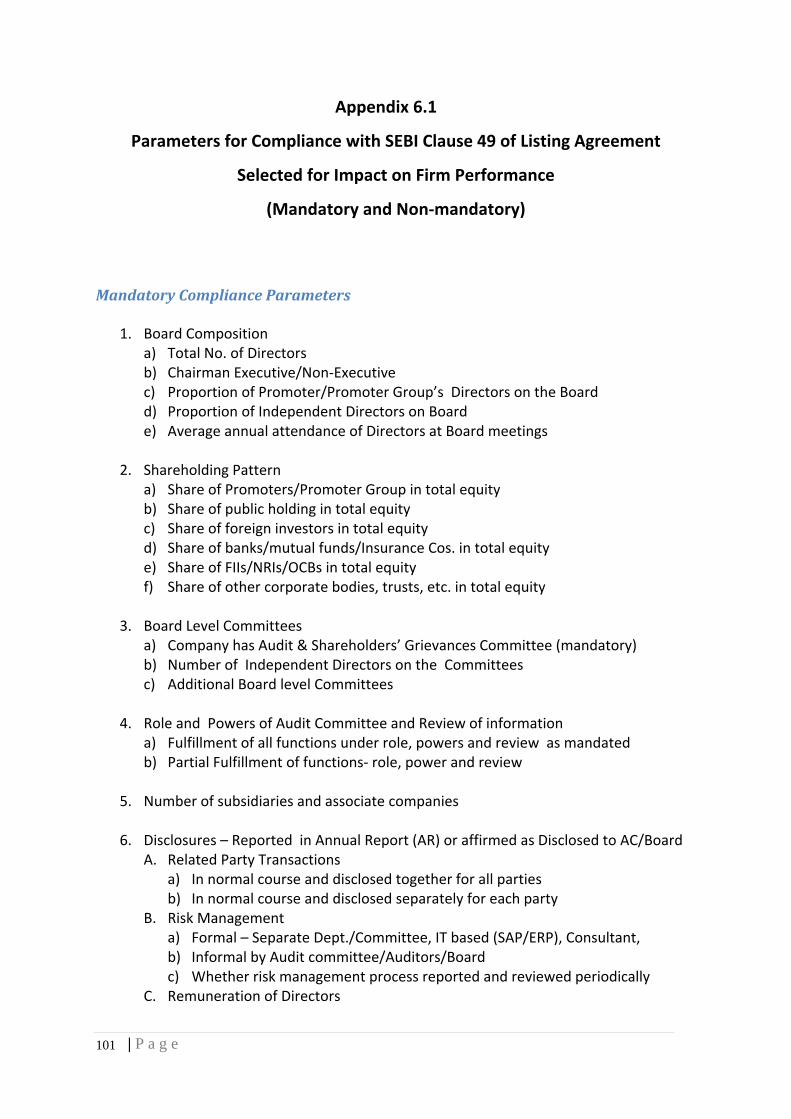
| P a g e 101
Appendix 6.1
Parameters for Compliance with SEBI Clause 49 of Listing Agreement
Selected for Impact on Firm Performance
(Mandatory and Non‐mandatory)
Mandatory Compliance Parameters
1. Board Composition a) Total No. of Directors b) Chairman Executive/Non‐Executive c) Proportion of Promoter/Promoter Group’s Directors on the Board d) Proportion of Independent Directors on Board e) Average annual attendance of Directors at Board meetings
2. Shareholding Pattern
a) Share of Promoters/Promoter Group in total equity b) Share of public holding in total equity c) Share of foreign investors in total equity d) Share of banks/mutual funds/Insurance Cos. in total equity e) Share of FIIs/NRIs/OCBs in total equity f) Share of other corporate bodies, trusts, etc. in total equity
3. Board Level Committees
a) Company has Audit & Shareholders’ Grievances Committee (mandatory) b) Number of Independent Directors on the Committees c) Additional Board level Committees
4. Role and Powers of Audit Committee and Review of information
a) Fulfillment of all functions under role, powers and review as mandated b) Partial Fulfillment of functions‐ role, power and review
5. Number of subsidiaries and associate companies
6. Disclosures – Reported in Annual Report (AR) or affirmed as Disclosed to AC/Board
A. Related Party Transactions a) In normal course and disclosed together for all parties b) In normal course and disclosed separately for each party
B. Risk Management a) Formal – Separate Dept./Committee, IT based (SAP/ERP), Consultant, b) Informal by Audit committee/Auditors/Board c) Whether risk management process reported and reviewed periodically
C. Remuneration of Directors

| P a g e 102
a) Criteria / Remuneration of NEDs in AR b) Salary/sitting fee/bonuses/ESOPs for all directors c) Service contract/term of directors in AR d) Shares & Convertible Debentures held by Non‐Executive Directors, reported
In AR D. Disclosure by Management ‐Management Discussion & Analysis
a) All eight items reported b) Less than eight items c) Financial/Comm. Transactions of personal interest that may be in conflict, by
Sr. Mgt. E. Procedures for Internal Controls
a) Formal ‐ Separate Dept./Committee, SAP/ERP, Consultant b) Informal – By Auditors
F. Shareholders’ rights to Info. –reported in AR a) Relationship between Directors/ Appt. of dirs. In AR b) Prospectus and letter of issuance/other information to stock exchanges in AR c) Qtly results/Analysts' presentation on website d) Constitution of Shareholders’/Investors’ Grievances Committee e) Power of share transfer given to officer/registrar/agent in AR
7. Other Compliance Requirements
a) CEO Certification b) Report on corporate governance in Annual Report c) Compliance Certificate from Auditors/Co. secretary in annual Report
Nonmandatory Compliance Parameters 1. Remuneration Committee
a) Decides policy and criteria on remuneration for EDs b) Remuneration policy for EDs and any deviations disclosed in AR c) Terms of reference, role, authority, and performance disclosed in AR d) Composition of Rem. Comm.
2. Shareholders’ Rights
a) Half‐yearly results sent to residence/on website
3. Whistle Blower Policy
Nonmandatory Compliance Parameters Enlisted in Voluntary Guidelines 2009 1. Remuneration of Directors
a) Remuneration of NEIDs/NEDs linked to performance b) Fixed Contractual Remuneration of NEIDs/NEDs c) Uniform remuneration system for all NEDs & IDs
2. Directors' Responsibility statement in AR to include compliance with all applicable laws
3. Review of Internal Controls by Board and reporting to shareholders

| P a g e 103
4. Secretarial Audit to be conducted by a competent professional & reported in AR.
Parameters Beyond Compliance
1. Resolution of disputes (if avail in AR) 2. Management Oversight (With IT procedures) 3. Incentives through ESOPs‐ Directors, Senior Management, Other Executives 4. HR Initiatives – Periodic Training for Employees, Other Stakeholders 5. Performance Improvement Programs 6. Women’s Security and Empowerment 7. Quality Improvement Programs and Certifications in AR 8. Environment protection/Safety and Health in AR 9. Innovation and technology absorption(in AR) 10. Energy conservation (in AR) 11. R&D for public and customer benefits (in AR) 12. Corporate social responsibility (in AR)

| P a g e 104
Annexure – 6.2 Corporate Governance: Variable Description
MANDATORY DISCLOSURES
Parameter Label Category Sub‐category
MBCI Board Composition
Index
Chairman
Executive Non‐executive, non‐independent Non‐exec, independent CMD
Vice‐Chairman Executive Non‐executive, non‐independent Non‐exec, independent
Exec. Director, (including MD)
Number of EDs, excluding Exec. Chairman Percentage of EDs, incl. Exec Chmn / Vice Chmn and CMD)
Non‐Exec. Dir (non‐Independent), excl.
Chmn
Number of promoters
Percentage in Board Composition Non‐Exec
Independent Dir, excl. Chmn
Number
Percentage in Board Composition Total Directors
Promoters on Board Number Percentage in Board Composition
Directors' Average Attendance
MSHP_PP Shareholding Pattern
Promoter/Promoter group Foreign promoter FIIs/NRI/OCBs Banks / MFs/Insurance cos. Other Bodies Corporate Individuals Others
MNID Number of Independent Directors in Audit Committee
MPRACI Audit Committee Index
Powers of Audit Committee
Investigation Seek Information from employees Secure advice of Legal & other experts
Role of Audit Committee
Availability All 15 Roles Considered
MNSAC Number of Subsidiaries or Associated Companies
MDRPTI Disclosure: Related Party Transactions
(RPT) Index
Whether Company has RPTs in Normal Course RPTs normal course disclosed together for Groups in AR If yes, RPTs normal course disclosed separately for each party in Annual Report
MRMI Disclosure: Risk Management Index
Risk Management done or not Done by Committee/dept/team SAP/ERP/model Consultant Auditor/AC/Board Policy/Procedures/framework Process Reviewed periodically

| P a g e 105
Annexure 6.2 (Cont.) MANDATORY DISCLOSURES
Variable Label Category Sub‐category
MDRDI Disclosure: Remuneration of Directors
Criteria / Remuneration To Non‐Executive Directors(NEDs) in AR Salary/sitting fee/bonuses/ESOPs for all directors Service contract/term of directors disclosed Shares & Conv. Debentures held by NEDs, disclosed In AR
MMD Number of Disclosures by Management
Mandatory Management Discussion & Analysis: 1‐8 in AR
MPICI Procedures of Internal Control
Availability of Procedures BY Auditor's/AC Committee By Department / Committee By SAP/ERP/model By Consultant
MDSRII Disclosure: Shareholders' Rights to
Information
Relationship between Directors/ Appt. of Dirs. in AR
Prospectus & letter of issuance/other info. to stock exchanges in AR (Y/N/NR) Qtly results/Analysts' presentations on website Shareholders’/Investors' Grievances Committee Power of share transfer given to officer/registrar/agent
NON‐MANDATORY DISCLOSURES: Clause 49
Variable Label Category Sub‐category
NM49RCI Constitution of Remuneration Committee
Remuneration committee exists Decides policy and criteria on remuneration for EDs Remuneration policy for EDs and any deviations disclosedTerms of ref/role/authority and perf. disclosed in AR
NM49NED Remuneration Committee Composition: Number of Exe. Dirs.
Chairman, No. of Independent Directors No. of Executive Directors
NM49WBP Whistle Blower Policy Available or not
NON‐MANDATORY Voluntary Guidelines
Variable Label Category Sub‐category
NMVGRI Remuneration of NEDs & NEIDs
Remuneration of NEDs linked to performance Fixed contractual remuneration to NEDs Variable Remuneration of IDs linked to Performance Fixed Contractual Remuneration to IDs Uniform remuneration system for all NEDs & IDs
NMVGSAI Secretarial Audit Index Review of Internal controls by Board & reporting to Directors’ Responsibility statement in AR Secretarial Audit to be conducted by competent prof.

| P a g e 106
Annexure 6.2 (Cont.) BEYOND COMPLIANCE PARAMETERS
Variable Label Category Sub‐category
BCNOBLC
Number of Other Board Level Committees
BCITE Incentives through ESOPs
Executive Directors Non‐Exec. Directors Sr. Mgmt Other Executives
BCHRQE HR, Quality & Environmental Initiatives
Periodic training for employees Training for other stakeholders Performance improvement programs Women's security and empowerment Quality Improvement Programs and Certifications (in AR) Environment protection/Safety and Health measures (in AR)

| P a g e 107
Chapter ‐ 7
Empirical Findings of the Study
7.1 Background
Corporate Governance has been an important area of research within the financial sector
since the early 1990s. There have been debates whether the Anglo‐Saxon Market‐model of
Corporate Governance is superior to the bank‐based models of Germany and Japan.
Opinions also differ regarding the extent of regulations required for effective corporate
governance practices. Whatever the model adopted, the quality of corporate governance in
the developed countries is far advanced than that in the developing countries. This chasm
between the standards of corporate governance in the developed countries and emerging
markets is increasingly being recognized. Emerging markets in their efforts to expand and
modernize their financial sector have begun to appreciate the fact that good corporate
governance systems promotes the development of a strong financial system which in turn
will have a positive impact on their economic growth.
Our review of the research work carried out on corporate governance practices in Europe
and other advanced Asian economies has shown that as compared to other emerging
markets corporate governance in India is still evolving. Though the government and capital
market regulators have tried to put in place a robust regulatory framework based on the
UK‐USA model of governance, a number of issues still remain to be resolved. These are
intrinsic to the nature and ownership of firms listed in India like the limited involvement of
minority shareholders in company’s strategic decisions and their rights to company
information, duality of Chairman and CEO, the role of independent directors and the board

| P a g e 108
and the extent of transparency and accountability maintained by the company in their
annual balance sheets are as yet unresolved.
The provisions contained in Clause 49, of the Listing Agreement of companies with the Stock
Exchanges took effect in phases between 2000 and 2003 and later with several amendments
SEBI Clause 49, came in to effect from January 2006.
Our earlier Study ‘Corporate Governance in Medium‐sized Family Managed Listed
Companies – Three Case Studies’ and the detailed scrutiny of Corporate Governance
Reports in the annual reports of these listed companies for the present study, have revealed
that though four years have elapsed, majority of the medium‐sized family managed
companies are experiencing constraints relating to compliance with Clause 49 and are
barely fulfilling the minimum governance regulations. Despite a complex regulatory
framework, there is no effective monitoring mechanism instituted by SEBI and the Stock
Exchanges. By and large, no significant modifications have been made in the Corporate
Governance Reports published in the annual reports of the companies. Moreover, the
Companies Amendment Bill, 2011 is yet to be enacted in the parliament and in its present
form it may throw up a new series of issues relating to compliance. Evidently despite the
advancements in the Indian Capital Market, corporate governance is yet in its infancy in
India.
No amount of regulations can significantly alter the corporate governance environment in
the country, unless the benefits of governance, transparency and business ethics are
recognized by the owners or those in control. In such an environment the incentives to
invest in elaborate infrastructure of corporate governance are not very high. Compliance is
restricted largely to the mandatory norms with minimum investments in specialized
departments and procedures. Some of the family managed companies have even
questioned whether the same regulatory environment can be made applicable to all the
companies across the board irrespective of their size or ownership. – Whether One Size Fits
All?
| P a g e 109
Given the fact that 65‐70 percent of listed companies in India are family owned or
controlled, there is a strong motivation for management to ensure long term share price
increases at any cost. Does this mean that closely held family business firms perform better
than widely held professionally run firms? Do they command better stock prices than widely
held firms? And if so, do they give adequate importance to corporate governance? Or are
they willing to make large investments in IT related procedures for corporate governance?
Has greater awareness and adoption of corporate governance practices helped these firms
in increasing their market capitalization? Does the convergence of interest by
owners/promoters in these firms predict a positive relationship between ownership and
performance? Or does the entrenchment of ownership predict a negative relationship with
performance?
Very little research work exists on these issues in the Indian context. As presented in the
literature review, some of the studies on corporate governance in India have brought out a
positive relationship between insider ownership and firm value (Khanna and Palepu,
199949). However, another Study by Sarkar and Sarkar (1999)50 has shown a non‐linear
relationship between shareholdings of owner directors and firm value. Yet another more
recent study paper by Pant and Pattanayak for the period 2000‐01 and 2003‐04 has shown
that the relationship between managerial–insider ownership and firm value is non‐linear in
nature. When the shareholding of insiders is very low, the entrenchment effect is non‐
operational due to less control over the decision making process. However, once the
insiders gain controlling authority over the firm they can get entrenched and could pursue
non‐value maximizing activities. The study has also brought out that in case of foreign
shareholding, there is a monotonic increase in share value and result in higher market value.
A more recent Study , (2008) conducted for 296 companies for the reference period 2005 by
Bernard Black, N. Balasubranian and Vikramaditya Khanna has shown that irrespective of
the pattern of ownership, there is a positive and statistically significant correlation between
financial performance represented by Tobin’s Q and overall corporate governance index .
Separating the sub‐indices of corporate governance the study has also shown that indices of
49 Op. cit. pg. 81. 50 Op. cit. pg. 81
| P a g e 110
disclosure (to shareholders and analysts) and shareholder rights are positively and
significantly associated with firm market value.
Our study has tried to explain the intricacies of these relationships between ownership,
governance and financial performance. The objective is to bring to light the fact that if
family managed companies perform better due to concentration and convergence of
interest, better corporate governance practices would only go on to improve the
performance to the benefit of all stakeholders and not only the shareholders.
As given in the Chapter – VI, we have considered a number of parameters relating to
corporate governance practices of 57 family managed companies, spread over three asset
classes. For the study, we considered the impact of corporate governance parameters on
financial performance, taking one at a time. In other words, we studied how each of the
financial performance indicators was impacted by the corporate governance parameters. As
we have used Stepwise Regression for the analysis, not all parameters under corporate
governance appear in all the regression output results. Only the variables which have a
significant influence on financial performance have been indicated and discussed.
7.2 Regression Analysis
As mentioned earlier, we have used regression analysis to study the impact of corporate
governance parameters on financial performance of companies. Let us start with
Unadjusted Data of 2006.
7.2.1 Unadjusted Data – 2006 (Table 7.1)
When we consider results from 2006 raw data (refer to Table – 7.1) we find that the most
significant financial variables which were impacted by corporate governance indices are
Interest Coverage Ratio, Total Assets and Total Sales. All these dependent variables have an
R‐squared value close to 0.30. Interest Coverage Ratio helps us understand the ease with

| P a g e 111
which a company repays the interest component of outstanding debt. It is given as the ratio
of Earnings before Interest and Taxes (EBIT) and Interest Expenses. A lower value of Interest
Coverage Ratio would imply that the company has a high burden of debt expenses, and vice
versa. As a thumb rule, if the Interest Coverage Ratio is less than 1.5 the ability of the
company to meet interest expenses is poor. Further lower values of Interest Coverage Ratio
would question the company’s revenue flows. Hence, Interest Coverage Ratio is a good
indicator of the company’s overall financial health and ability to sustain with debt burden.
Table 7.1 : Stepwise Regression Output for Unadjusted Data 2006
Dependent Variable R‐SquaredIndep. Variables t‐value p‐value
Profit After Tax (PAT) 0.1741417MDSRII 3.1704 0.0025
NM49NED ‐2.0013 0.0504
Average Annualized EPS 0.1892425MDRPTI ‐4.0789 0.0000MBCI 2.2783 0.0268
P/B Ratio 0.1655327NMVGRI 3.0095 0.0040
MMD ‐2.1070 0.0398
Sales 0.2790627NMVGRI 2.7506 0.0081
BCHRQE 2.6444 0.0107
Book Value 0.1848061MDRPTI ‐4.0318 0.0000MBCI 2.5489 0.0137
Return on Net Worth (RONW) 0.1945178
MRMI 2.6428 0.0107
NM49WBP 2.1179 0.0388
Interest Coverage Ratio 0.326265 NM49WBP 3.2132 0.0022
MMD ‐3.3796 0.0014
MDRDI 2.0301 0.0474
Debt‐Equity Ratio 0.1732291MDRDI ‐2.7199 0.0088
NM49RCI 2.5758 0.0128
Total Assets 0.3019368BCHRQE 2.8515 0.0062NM49NED 2.5855 0.0126
MBCI 2.4898 0.0160
Total Debt 0.2517554MNID 2.8604 0.0060NM49NED 2.4603 0.0172
Market Capitalization 0.1250 NMVGRI 2.7773 0.0075
Tobin's Q 0.199395 NMVGRI 3.2209 0.0022MPRACI 1.9874 0.0521

| P a g e 112
It can be seen in Table 7.1, that the value of R‐squared for the dependent variable Interest‐
coverage Ratio is significantly higher at 0.326265. Interest Coverage Ratio is the Ratio of
Profit before Interest and Taxes (EBIT) to Interest Expenses (IE). It indicates the ability of the
company to repay the interest component of its outstanding debt. A high interest coverage
ratio means that the firm generates enough funds flow that can easily meet its interest
burden even if earnings before interest and taxes suffer a considerable decline. Lenders use
this ratio to assess a firm’s debt raising capacity. Ideally the Interest Coverage Ratio should
be more than 1.5. If it is lower it indicates that the company’s ability to service its debt is
poor. Further the lower values of the ratio would question the company’s revenue flows. On
the whole this ratio is a good indicator of the overall financial health of the company.
Interest‐Coverage Ratio highly influenced by Mandatory Disclosure of Remuneration of
Directors and Presence of Whistle Blower Policy but inversely related to Disclosures in
Management Discussion & Analysis (R‐Squared = 0.3263)
Interest‐Coverage Ratio highly influenced by Mandatory Disclosure of Remuneration of
Directors
In our Regression Analysis, Interest Coverage Ratio is influenced by three variables of
corporate governance (R‐squared = 0.3263). Firstly and understandably it has a significant
and positive relationship at 5 percent level of confidence with Mandatory Disclosure of
Directors’ Remuneration. This includes criteria of remuneration to directors, service
contracts of directors and even shares and debentures held by directors. In addition this
sub‐clause also requires disclosure of pecuniary relationships or transactions of non‐
executive directors with the company. Such detailed disclosures by companies in the annual
reports indicate a higher degree of transparency to the shareholders and analysts. Though
this sub‐clause is mandatory all companies are not in the habit of disclosing all such
remuneration related details in their annual reports. Hence, companies with better
disclosures have indicated better revenue flows to the company and hence better financial
health.
| P a g e 113
Interest Coverage Ratio significantly Impacted with Presence of Whistle Blower Policy
The sub‐clause relating to the establishment of a whistle blower policy is a non‐mandatory
sub‐clause of SEBI Clause 49. Under this, the company is expected to establish a mechanism
for employees to report to management concerns about unethical behavior, actual or
suspected fraud or violation of the company’s code of conduct or ethics policy. This
mechanism also provides safeguards to employees against victimization, while providing
direct access to the chairman of the audit committee.
Having a well declared whistle blower policy is also a good indication of the company’s
degree of transparency and its intent to take action against any fraudulent practices by the
management. Instituting this policy in family managed companies is more of an exception
and being non‐mandatory it is generally not declared in the annual reports. The companies
that have declared this policy to the shareholders and have implemented it have obviously
commanded greater confidence among the investors and shareholders and better earnings
and funds flows and hence higher Interest‐coverage ratios.
Total Assets
Total Assets are positively related with Board Composition, Composition of Remuneration
Committee and Company’s Initiatives Beyond Compliance ( R‐Squared = 0.30194)
Total Assets have a significant relationship with Company’s Board Composition
Total assets include fixed assets, investments, current assets including inventories, debtors,
loans and advances and miscellaneous expenditure. A higher value of total assets is
indicative of the robust size of the firm in terms of fixed investment in plant and machinery,
secure and sizeable financial investments and loans and a good current assets position
which is a sign of financial strength. In our analysis, this is the next important indicator of
the company’s financial performance which is significantly influenced by board composition
and other board related aspects like separation of the roles of Chairman and CEO, Total

| P a g e 114
number of directors and proportion of promoters and independent directors on board and
attendance of directors at the board meetings. A better board composition with greater
number of independent directors, adequate number of promoters who take strategic
decisions and regular attendance of board meetings by all the directors taken together,
point towards better governance practices. Hence this index has a high and positive
correlation with total assets of the company indicating superior financial strength of the
company.
Total Assets significantly influenced by Beyond Compliance Initiatives like Company’s
Initiatives for HR development, Welfare of other Stakeholders, Performance
Enhancement and Quality Improvement Programs and Environment and Employees’
Safety related Initiatives.
All these parameters are initiatives taken by the company which are beyond mere
compliance with corporate governance norms and are directed at the welfare of all its
stakeholders like employees, customers and suppliers. Companies are however directed to
disclose these initiatives to their shareholders and hence are expected to take action under
each of these. Not all companies especially family managed companies have made efforts at
fulfilling all these requirements. Those which have undertaken to increase value for all their
stakeholders in a sustainable manner, in the areas of HR development by training, health
and safety measures for their employees, brought about improvements in product quality
improvement, acquired quality certifications like ISO ‐9000, 14000 and taken environment
protection measures have performed well in terms of a stronger asset position. This is
reflected in the higher t‐value of Beyond Compliance at 2.851 in relation to total assets.
Total Assets influenced by Composition of the Remuneration Committee
Composition of the Remuneration Committee is a non‐mandatory requirement but many
companies have formed the Remuneration Committee represented by the stipulated
number of independent directors. This is an action in the right direction as this committee is
required to frame and implement a well declared policy of remuneration for its directors
and senior management. This leads to prevention of conflict of interest as at least three IDs
| P a g e 115
are required to be on the committee. The presence of the remuneration committee is a
deterrent to mismanagement of funds by way of remuneration to promoters and executive
directors. This therefore results in a robust asset position.
Total Sales
Total Sales significantly Impacted by Voluntary Disclosures of Remuneration Packages of
Non‐Executive and Independent Directors and also Measures Beyond Compliance for all
Stakeholders ( R‐Squared = 0.2790)
The value of gross and net sales is an important measure of the income of the firm from its
operations and along with total assets indicates the operational efficiency of the firm. This is
the third major financial parameter which is significantly influenced by disclosures relating
to the remuneration of non‐executive directors. This is a mandatory disclosure under sub‐
clause IV E of SEBI Clause 49 and also further elaborated and emphasized under Voluntary
Guidelines of 2009 which requires more detailed disclosures. Even as early as 2006,
companies which disclosed all aspects of remuneration of their EDs and Non‐EDs appear to
have performed well as seen by their higher sales volumes. This shows greater level of
confidence of shareholders, customers and suppliers and other stakeholders in the
company.
Total Sales influenced by Beyond Compliance parameters affecting welfare of all
Stakeholders.
As in case of assets, these Beyond Compliance measures have had a significant impact on
total sales of the company. These initiatives are not mandatory and are not uniform for all
companies. But companies which have invested in HR development or Quality enhancement
or Environment Issues have invoked greater confidence of their customers earning a better
brand equity resulting in higher sales.

| P a g e 116
Higher sales also indicate higher earnings which are generated through better utilization of
assets. A higher ratio of sales to total assets shows a more efficient employment of assets
and hence better earnings.
7.2.2 Analysis based on Unadjusted Data for 2010 (Table 7.2)
Table 7.2 shows the regression output of unadjusted data for the year 2010, i.e. after a span
of nearly four years since the announcement of SEBI Clause 49. The regression results for
2010 are more encouraging than those of 2006 as most companies would have put in place
systems and procedures to comply with the mandatory and a few of the non‐mandatory
provisions of Clause 49. This has resulted in better financial performance as influenced by
some of the parameters of corporate governance. The average R‐squared value of the
different measures of financial performance generated from corporate governance
parameters has increased from 0.21 in 2006 to 0.27 in 2010. This explains that the influence
of corporate governance on the finances of the company has grown stronger over the years.
Total Assets and Total Sales highly influenced by Corporate Governance Parameters
Total Assets and Total Sales have been significantly influenced by corporate governance
parameters, as observed for 2006, as well.
Total Assets strongly influenced by Board Composition, Shareholders’ Rights , Review of
Internal Controls by Board including Secretarial Audit and Whistle Blower Policy
With R‐squared for total assets higher at 0.3753361, the explanatory power of this
regression has increased from 0.30 in 2006 to 0.375 in 2010. Total assets are greatly
influenced by Board Composition (also in 2006), Disclosure of Shareholders’ Rights to
Information, Disclosure of Internal controls and their Review by Board, Secretarial Audit and
Whistle Blower policy. The last two are non‐mandatory and voluntary but compliance to
these has had a positive impact on the size of total assets. This also indicates an
improvement in the corporate governance practices of larger sized firms in the sample. The
boards of these companies would have become independent with appointment of more
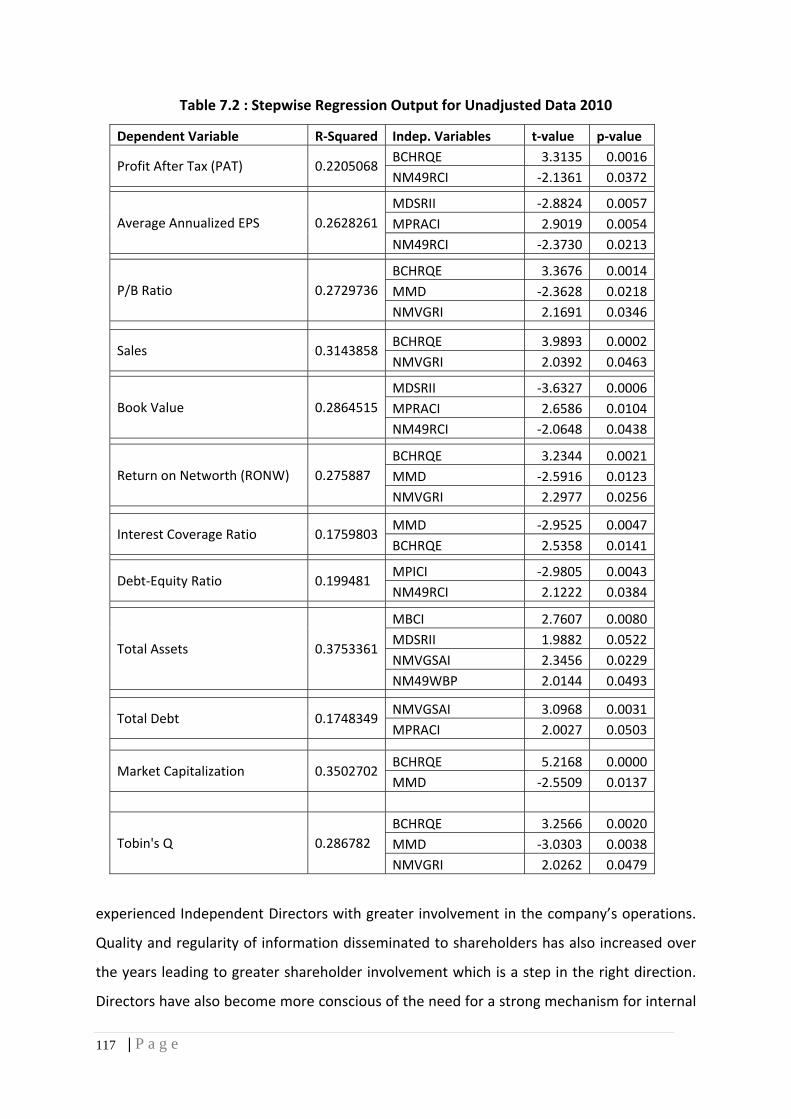
| P a g e 117
Table 7.2 : Stepwise Regression Output for Unadjusted Data 2010
Dependent Variable R‐Squared Indep. Variables t‐value p‐value
Profit After Tax (PAT) 0.2205068BCHRQE 3.3135 0.0016 NM49RCI ‐2.1361 0.0372
Average Annualized EPS 0.2628261MDSRII ‐2.8824 0.0057 MPRACI 2.9019 0.0054 NM49RCI ‐2.3730 0.0213
P/B Ratio 0.2729736BCHRQE 3.3676 0.0014 MMD ‐2.3628 0.0218 NMVGRI 2.1691 0.0346
Sales 0.3143858BCHRQE 3.9893 0.0002 NMVGRI 2.0392 0.0463
Book Value 0.2864515MDSRII ‐3.6327 0.0006 MPRACI 2.6586 0.0104 NM49RCI ‐2.0648 0.0438
Return on Networth (RONW) 0.275887 BCHRQE 3.2344 0.0021 MMD ‐2.5916 0.0123 NMVGRI 2.2977 0.0256
Interest Coverage Ratio 0.1759803MMD ‐2.9525 0.0047 BCHRQE 2.5358 0.0141
Debt‐Equity Ratio 0.199481 MPICI ‐2.9805 0.0043 NM49RCI 2.1222 0.0384
Total Assets 0.3753361
MBCI 2.7607 0.0080 MDSRII 1.9882 0.0522 NMVGSAI 2.3456 0.0229 NM49WBP 2.0144 0.0493
Total Debt 0.1748349NMVGSAI 3.0968 0.0031 MPRACI 2.0027 0.0503
Market Capitalization 0.3502702BCHRQE 5.2168 0.0000 MMD ‐2.5509 0.0137
Tobin's Q 0.286782 BCHRQE 3.2566 0.0020 MMD ‐3.0303 0.0038 NMVGRI 2.0262 0.0479
experienced Independent Directors with greater involvement in the company’s operations.
Quality and regularity of information disseminated to shareholders has also increased over
the years leading to greater shareholder involvement which is a step in the right direction.
Directors have also become more conscious of the need for a strong mechanism for internal

| P a g e 118
controls to avoid any potential financial crisis. A robust IT based system of internal controls
devised with the active involvement of directors and suitably implemented under their
supervision coupled with a detailed Secretarial Audit conducted by competent
professionals have had a positive influence on total assets.
Total Sales influenced by Beyond Compliance Measures and Voluntary Disclosure of
Remuneration Package of Directors
As in 2006, total sales have again been impacted by two important parameters of corporate
governance. Beyond Compliance parameters like HR development, Quality and
Performance improvement and Environment related programs have strongly influenced
total sales with R‐Squared = 0.314. Once again this is evident of the fact that the company
which has enhanced value for all its stakeholders has performed better in terms of its
turnover and hence the overall earnings. As in 2006, Disclosures of Remuneration of
Directors which is a voluntary parameter has also had a significant influence on total sales.
Remuneration is made up of two components – Fixed and Performance linked. In family
managed companies, performance linked remuneration would always motivate promoter
directors, executive directors and even senior management to ensure better operational
performance of the company aimed at profit maximization. This would invariably result in
higher sales, higher profits and better growth. This practice of disclosing all relevant details
regarding remuneration of different categories of directors has helped the companies to
invoke confidence of all their stakeholders including investors and customers resulting in
higher sales volumes. The difference in 2010 is that the degree of explanatory power for the
data is stronger at 0.314.
Interest Coverage Ratio influenced by Beyond Compliance parameters
It is observed that unlike in 2006, the influence of corporate governance parameters on
interest‐coverage ratio has declined significantly with R‐squared at 0.176. The governance
parameters showing a relationship with this ratio are also different from 2006. The
relationship is positive but weak with only Beyond Compliance parameters. The
fundamental reason for this could be the general trend among listed companies to be
| P a g e 119
deleveraged in recent years resulting in the decline in the debt component of financing and
lower interest exposure.
Market Capitalization and Tobin’s Q significantly influenced by Beyond Compliance
Parameters and Voluntary Disclosures of Directors’ Remuneration Package
In 2010, two other important financial parameters namely Market Capitalization and
Tobin’s Q have emerged which are significantly influenced by i) Initiatives Beyond
Compliance, ii) Voluntary Disclosure of Remuneration Packages of Non‐Executive and
Independent Directors and iii) Disclosure of items under Management Discussion and
Analysis. The latter of course is once again inversely correlated with Market Capitalization
and Tobin’s Q.
Tobin’s Q as worked out by James Tobin is defined as the ratio of Market Value of Equity
and Debt / Estimated Replacement Value of Assets. The denominator is the replacement
costs of all Assets and not the book value. Hence this ratio is an improvement over the P/B
ratio.
The value of R‐Squared for the regression between Market Capitalization and corporate
governance parameters is very strong at 0.35. It is also quite strong for Tobin’s Q at 0.287.
Beyond Compliance initiatives taken by the company and reported in their annual reports as
well as on their websites provide a good visibility to the company in the market and also
improve its brand equity. These initiatives not only create value for the shareholders and
employees but also for customers and Society at large. For instance environment protection
measures and health and safety related investments enhance the image of the company as
a good employer with concerns for the society at large. HR initiatives like training and
development enable the company to tap the best HR talent in the market and
improvements in quality of the products raise customer loyalty and increase sales. All these
together would have a strong influence on Market Cap. and even Tobin’s Q.
In addition, Voluntary Disclosures of Remuneration Packages have also had a strong
influence on Tobin’s Q. As explained above directors’ remuneration especially the variable

| P a g e 120
performance linked component, is linked to the company’s growth in earnings and profit.
Superior operational performance would lead to better financial performance and better
share price thus creating wealth for its shareholders. There would have been a significant
increase in the explanatory power of Tobin’s Q, but because of the weak performance of
total debt, the increase in Tobin’s Q is not remarkable.
Other financial variables which are significantly affected by the same corporate governance
parameters are Return‐on‐Net worth (RoNW – R‐ Squared=0.276) and Price to Book Value
Ratio (P/B Ratio – R‐Squared= 0.273)
Price‐to‐Book Value Ratio Impacted by Beyond Compliance Measures and Voluntary
Disclosure of Remuneration Packages of Directors
The Price‐to‐Book Value Ratio is a company valuation ratio which indicates how the equity
stock of the company is assessed in the capital market. Valuation ratios are the most
comprehensive measures of a firm’s performance. This is defined by the Market Value per
share/Book Value per share. This ratio reflects the contribution of the firm in the creation of
wealth in the market.
Our regression analysis has shown a significant impact of Beyond Compliance Initiatives of
the company on P/B ratio. This indicates that these value creation measures have not only
benefited the employees and customers of the company but have also succeeded in
escalating the share price of the company in the market thus creating wealth for its
shareholders. Voluntary disclosures regarding the remunerations of directors have also
played an important role in raising the share prices.
The same factors have also influenced the Return on Net worth of the company.

| P a g e 121
Market Capitalization, Tobin’s Q, Interest‐coverage ratio and P/B ratio negatively
influenced by Management Discussion and Analysis
Analysis based on unadjusted data for 2010 shows that disclosures under management
discussion and analysis which is a mandatory requirement under Clause 49, has an inverse
relationship with most of the financial variables like Market Cap, Tobin’s Q and to a lesser
extent Interest‐coverage ratio and P/B ratio. This implies that companies disclosing all the
eight items required under the head ‘Management Discussion and Analysis’ have failed to
register good financial performance as measured by market related financial indicators like
Market Cap, Tobin’s Q and even Interest‐coverage ratio and P/B ratio. This could imply that
information relating to all eight items under Management Discussion such as industry
structure and developments, company’s share in the industry, segment‐wise performance,
outlook for the company, opportunities and threats, risks and concerns, measures for
internal controls, financial performance with respect to operational performance and HR
developments, though disclosed, have not been adequately discussed in the annual reports
of these companies.
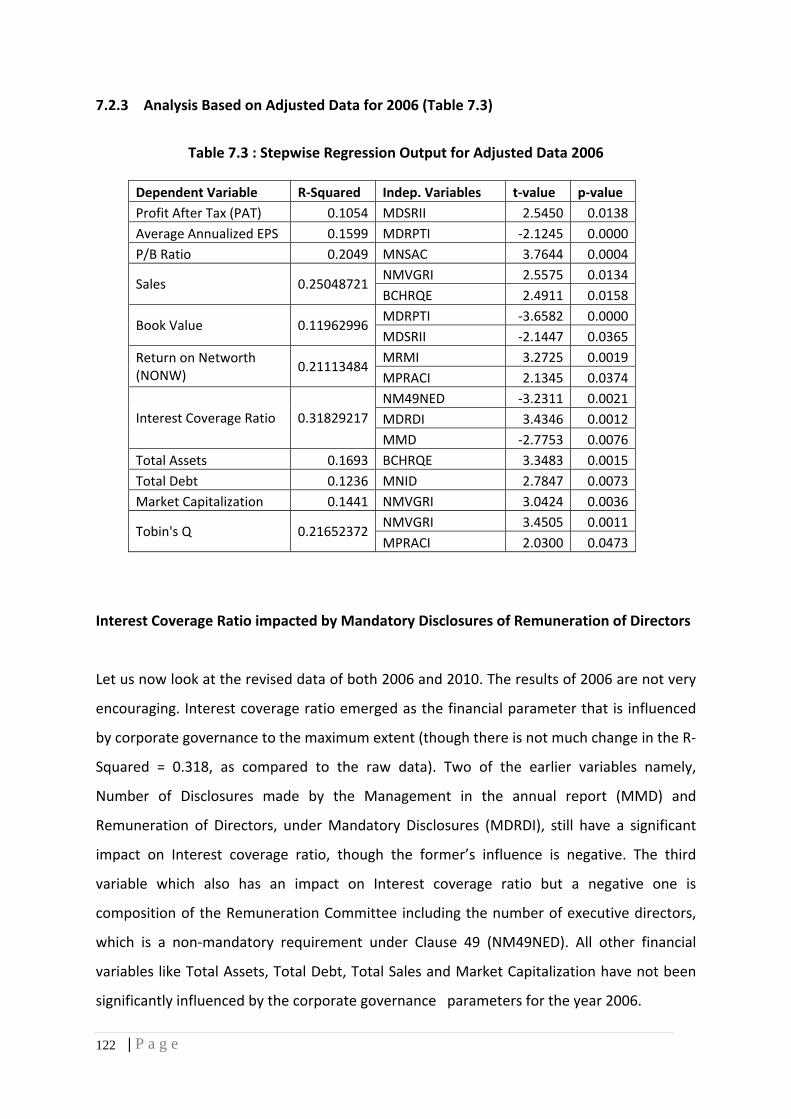
| P a g e 122
7.2.3 Analysis Based on Adjusted Data for 2006 (Table 7.3)
Table 7.3 : Stepwise Regression Output for Adjusted Data 2006
Dependent Variable R‐Squared Indep. Variables t‐value p‐value Profit After Tax (PAT) 0.1054 MDSRII 2.5450 0.0138 Average Annualized EPS 0.1599 MDRPTI ‐2.1245 0.0000 P/B Ratio 0.2049 MNSAC 3.7644 0.0004
Sales 0.25048721NMVGRI 2.5575 0.0134 BCHRQE 2.4911 0.0158
Book Value 0.11962996MDRPTI ‐3.6582 0.0000 MDSRII ‐2.1447 0.0365
Return on Networth (NONW) 0.21113484
MRMI 3.2725 0.0019 MPRACI 2.1345 0.0374
Interest Coverage Ratio 0.31829217NM49NED ‐3.2311 0.0021 MDRDI 3.4346 0.0012 MMD ‐2.7753 0.0076
Total Assets 0.1693 BCHRQE 3.3483 0.0015 Total Debt 0.1236 MNID 2.7847 0.0073 Market Capitalization 0.1441 NMVGRI 3.0424 0.0036
Tobin's Q 0.21652372NMVGRI 3.4505 0.0011 MPRACI 2.0300 0.0473
Interest Coverage Ratio impacted by Mandatory Disclosures of Remuneration of Directors
Let us now look at the revised data of both 2006 and 2010. The results of 2006 are not very
encouraging. Interest coverage ratio emerged as the financial parameter that is influenced
by corporate governance to the maximum extent (though there is not much change in the R‐
Squared = 0.318, as compared to the raw data). Two of the earlier variables namely,
Number of Disclosures made by the Management in the annual report (MMD) and
Remuneration of Directors, under Mandatory Disclosures (MDRDI), still have a significant
impact on Interest coverage ratio, though the former’s influence is negative. The third
variable which also has an impact on Interest coverage ratio but a negative one is
composition of the Remuneration Committee including the number of executive directors,
which is a non‐mandatory requirement under Clause 49 (NM49NED). All other financial
variables like Total Assets, Total Debt, Total Sales and Market Capitalization have not been
significantly influenced by the corporate governance parameters for the year 2006.

| P a g e 123
7.2.4 Analysis based on Adjusted Data for 2010 (Table 7.4 )
The output of this Regression Analysis is by far the most comprehensive compared to the
earlier results. The corporate governance parameters which have impacted the financial
performance variables after adjusting the data for 2010 are not very different from those
observed earlier for unadjusted data. However the values of R‐squared are higher compared
to the unadjusted data for 2010.
As can be seen in Table 7.4, the major corporate governance parameters which have
influenced key financial variables are Beyond Compliance Initiatives of the companies,
Voluntary Disclosure of Remunerations of the Directors and the Constitution of the
Remuneration Committee. As observed in the earlier results Disclosures by Management
relating to company’s production performance, industry outlook, opportunities and threats
and risks and controls has had a negative impact on the financial variables, particularly
Tobin’s Q, Market Cap, Return on Net worth and Interest‐coverage Ratio.
Barring this negative relationship of Management Discussion and Analysis there is a
distinctly positive and significant relationships of major corporate governance parameters
i.e. Beyond Compliance Initiatives, Disclosures of Remuneration, Constitution of
Remuneration Committee and to some extent Rights of Shareholders with Financial
Performance. Key financial variables like Tobin’s Q (R‐Squared = 0.45), Market Capitalization
(R‐ Squared = 0.41 ), Total Assets ( R‐Squared = 0.39), Interest‐coverage Ratio ( R‐Squared =
0.38 ) and P/B Ratio have all been influenced highly by improved CG practices in 2010.

| P a g e 124
Table 7.4 : Stepwise Regression Output for Adjusted Data 2010
Dependent Variable R‐Squared Indep. Variables t‐value p‐value
Profit After Tax (PAT) 0.2675851BCHRQE 3.3601 0.0014 NM49RCI ‐2.9326 0.0049
Average Annualized EPS 0.1857497MDSRII ‐3.0623 0.0034 MPRACI 2.5498 0.0136
P/B Ratio 0.3082815BCHRQE 3.4518 0.0011 MMD ‐2.8785 0.0057 NMVGRI 2.5011 0.0155
Sales 0.3135113BCHRQE 3.9255 0.0002 NMVGRI 2.0210 0.0483
Book Value 0.2291457MDSRII ‐3.7974 0.0004 MPRACI 2.3515 0.0224
Return on Networth (NONW) 0.290361
BCHRQE 3.2031 0.0023 MMD ‐2.8615 0.0060 NMVGRI 2.4712 0.0167
Interest Coverage Ratio 0.3829146
MMD ‐2.9160 0.0053 BCHRQE 1.6373 0.1077 NM49NED ‐3.4303 0.0012 MDRDI 2.5725 0.0131 MPRACI 2.1264 0.0383
Total Assets 0.3908548MBCI 3.8911 0.0003 MNSAC 3.1048 0.0031 MDSRII 2.0857 0.0418
Total Debt 0.2787168MNSAC 2.6873 0.0096 NMVGSAI 2.8126 0.0069 MPRACI 1.9954 0.0511
Market Capitalization 0.4127838BCHRQE 5.1712 0.0000 MMD ‐3.2596 0.0020 NMVGRI 2.0180 0.0487
Tobin's Q 0.4490902
BCHRQE 3.1362 0.0028 MMD ‐3.0299 0.0038 MNSAC 2.9602 0.0047 NMVGRI 2.4052 0.0198 NM49RCI ‐2.1384 0.0373
These results therefore clearly bring out the fact that good corporate governance practices,
whether mandated or taken up voluntarily are rewarded with better financial performance.
| P a g e 125
Tobin’s Q significantly influenced by Beyond Compliance Initiatives, Voluntary Disclosure
of Directors’ Remuneration packages, Number of Subsidiaries and Associate companies
and Constitution of Remuneration Committee
All these four parameters of corporate governance have revealed a positive and high
influence on Tobin’s Q. The significant ones being Beyond Compliance parameters which
have resulted in value creation not only for shareholders but all other stakeholders
especially employees and customers. These welfare and promotional measures being
reported in the Annual Reports seem to have enhanced investor trust in these companies
resulting in better performance of their equity shares in the market. As mentioned in the
foregoing chapters companies intending to raise funds from the FIIs would have been
motivated to put in place ethical business practices, with a greater degree of transparency
and better shareholder involvement. These companies seem to have also created a good
image in the eyes of their employees, customers, suppliers and even financiers who are
more confident about their dealings with these companies. All these factors would have
succeeded in raising the value of Tobin’s Q.
The other two parameters impacting on Tobin’s Q are Voluntary Disclosures regarding
Remuneration of Directors and Non‐mandatory Constitution of the Remuneration
Committee, the latter being negative. It may be inferred that remuneration is one
motivating factor which can have a positive impact on the company’s operations leading to
higher output and sales and in turn better earnings and rewards to the directors and senior
management. In case of family managed companies, promoter directors especially executive
and full‐time directors aim at profit maximization and growth in the company’s earnings
through expansion, innovation and modernization. All this would inevitably lead to the
improvement in the company’s share value and market cap due to increased shareholder
confidence. Tobin’s Q has also been influenced by number of subsidiaries and associate
companies of the company.
| P a g e 126
Market Cap. significantly impacted by Beyond Compliance Initiatives and Voluntary
Disclosure of Directors’ Remuneration packages.
As Market Cap. is a variable that is used for determining Tobin’s Q, it has been impacted by
the same corporate governance parameters and to the same extent., with R‐Squared for
Market Cap. at 0.4127.
Total Assets significantly influenced by Board Composition, Number of
Subsidiaries/Associate companies and Shareholders’ Rights
As discussed in terms of unadjusted data for 2010, Total Assets are influenced by Board
Composition and Shareholders’ Rights with a slightly higher value of R‐Squared 0.3908
compared to 0.375 for the raw data. As discussed above as boards are strengthened due to
enlargement in size with induction of larger number of independent directors, the company
will benefit from their experience and guidance and would embark on expansion and
diversification into other allied areas. It may also go in for foreign acquisitions and entry into
global markets. This would lead to a healthy growth in its assets.
The high positive relationship between the company’s subsidiaries and its asset size is also
obvious as growth in the company’s operations through subsidiaries would lead to growth in
assets. As the company grows in size and stature it tends to share more information about
its performance with its shareholders. This enables it to gain their trust and confidence
which is reflected in the significant influence of Shareholders’ rights on total assets.
Interest –Coverage Ratio significantly Influenced by Beyond Compliance Initiatives,
Mandatory Disclosure of Remuneration and a strong Audit Committee
In case of the unadjusted data for 2010, it was seen that interest‐Coverage ratio was
influenced essentially by Beyond Compliance measures adopted by the company for all its
stakeholders. However the revised 2010 data reveal a deeper relationship with Interest‐
coverage Ratio significantly impacted by not only Initiatives Beyond Compliance but also by
Mandatory Disclosures of Directors’ Remuneration and the Role, Powers and Responsibility
of the Audit Committee ( R‐Squared = 0.3829) Of these, Mandatory Disclosure of
| P a g e 127
Remuneration of Directors was observed to be a highly influencing factor on this ratio which
was also observed for the year 2006 (Revised Data).
While revising the data for Interest‐coverage ratio, we observed that there were three
variables under corporate governance indices which emerged as significant contributors to
the explanatory power of Interest‐coverage Ratio. (Other than Management Discussion –
negative influence‐ and Measures Beyond Compliance which also emerged as significant for
2010 raw data). These are Composition of Remuneration Committee – negative influence,
Mandatory Disclosure of Remuneration of Directors and Mandatory Audit Committee index.
Out of these three, Remuneration Committee composition ( negative influence) and
Disclosure of Directors’ Remuneration had shown a high influence on this ratio even for the
revised data for 2006. This shows that our data revision has benefited the analysis of the
Regression outputs. While looking at the data revision process carefully it was seen that all
the three variables had high volatility due to the missing values for various companies.
Hence the extrapolation process for estimating the missing values has led to the significance
of these variables to create impact on Interest‐coverage ratio. However we do not rule out
the possibility of any other form of interpretation , which we may have failed to capture.
Influence of Audit Committee on Interest‐coverage Ratio
An important outcome of the revision in 2010 data is the significant impact of the increasing
role, power and responsibilities of the Audit Committee. The overriding influence that a
strong Audit Committee can have on a company’s financial performance is unquestionable.
It is clear here that over the four year period since the announcement of SEBI Clause 49, the
responsibilities of the Audit Committee have increased tremendously and it is second only
to the Board in terms of its power as a watchdog for the financial performance of the
company. The Audit Committee ensures that the company is in a good position to service all
its borrowings and have a healthy balance sheet. The positive effect of its role and powers is
very clearly reflected in the company’s ability to generate earnings to raise debt and meet
its interest expenses regularly, a good Interest‐coverage Ratio.

| P a g e 128
Audit Committee also has a strong influence on other performance variables like Total
Debt, Total Sales Influenced by Beyond Compliance Measures and Voluntary Disclosures
of Directors’ Remuneration package
The influence of these two corporate governance parameters on Total Sales is almost the
same as seen for unadjusted data for 2010 and is also consistent with the data for adjusted
and unadjusted data for 2006. This consistency in the explanatory power of the
independent variables to this extent across all four sets of data is not observed for any other
financial variable.
These two parameters of corporate governance which are essentially Non‐mandatory and
Voluntary have also emerged as the main influencing factors affecting several other financial
performance variables for the years 2006 and 2010.
7.3 Conclusion
Table 7.5 : Financial Performance depicted by Tobin’s Q across all Regression Models
Data: 2006 (Unadjusted) Dependent Variable R‐Squared Indep. Variables t‐value p‐value
Tobin's Q 0.19939499NMVGRI 3.2209 0.0022MPRACI 1.9874 0.0521
Data: 2010 (Raw)
Tobin's Q 0.28678203BCHRQE 3.2566 0.0020MMD ‐3.0303 0.0038NMVGRI 2.0262 0.0479
Data: 2006 (Revised)
Tobin's Q 0.21652372NMVGRI 3.4505 0.0011MPRACI 2.0300 0.0473
Data: 2010 (Revised)
Tobin's Q 0.44909018
BCHRQE 3.1362 0.0028MMD ‐3.0299 0.0038MNSAC 2.9602 0.0047NMVGRI 2.4052 0.0198NM49RCI ‐2.1384 0.0373

| P a g e 129
Influence of Voluntary disclosures of Remuneration
As Tobin’s Q is an important measure of Financial Performance, we have tried to examine
which are the most common governance parameters that have influenced it across two time
periods – 2006 and 2010. It can be seen that Voluntary Disclosure of Remuneration
Packages of the Non‐Executive Directors and Independent Directors has consistently
emerged as the factor affecting Tobin’s Q. The influence of the Audit Committee which was
an important factor in 2006 does not appear in the results for 2010. On the other hand
Constitution of the Remuneration Committee, which is a non‐mandatory requirement has
emerged as one of the factors in 2010 for revised data but it has shown a negative
relationship with Tobin’s Q.
The third variable which also has an impact on Interest coverage ratio but a negative one is
composition of the Remuneration Committee including the number of executive directors,
which is a non‐mandatory requirement under Clause 49 (NM49NED).
Influence of Measures Beyond Compliance
Company’s initiatives at creating value for all Stakeholders through a series of
developmental and promotional measures for its Employees, (HR initiatives), Customers
(Quality Improvement) and the Society (Environmental concerns) termed here as Beyond
Compliance measures have in fact come out as the single most decisive factor having a
direct impact on Financial Performance. These have revealed a high and positive
relationship with almost all performance variables in 2010 (Unadjusted and Adjusted).
Apart from their significant impact on Market Cap. and Tobin’s Q, these measures have
shown a direct impact on Total Sales, P/B Ratio, Interest –coverage Ratio and even Return
on net worth. Though this relationship was observed for the year 2006, it was limited to
only total sales and total assets. This is understandable as in 2006, companies were more in
the process of complying with mandatory CG regulations and concentrating more on returns
to their shareholders and promoters.
| P a g e 130
Over the four year period between 2006 and 2010, companies have shown a definite
improvement in their governance practices and some have even moved beyond compliance
with adoption of non‐mandatory governance practices and even those benefiting other
stakeholders. This shift from shareholders to all stakeholders has paid off in terms of better
performance in the market.
Impact of Voluntary Disclosures of Remuneration of Non‐executive Directors and
Remuneration Committee
Comparing the results across all the four models it can once again be concluded that
adoption of non‐mandatory and voluntary governance practices aimed at bringing about
greater transparency in the balance sheets has rewarded the companies with higher Market
Cap. and Tobin’s Q. In fact the companies have also performed well in terms of Total Sales
and to some extent in terms of P/B Ratio and Return on net worth.
What does this imply?
In the past family managed companies including those promoted by prominent industry
groups like Bajaj and Godrej have been concentrating more on maximizing returns to the
promoting family shareholders. Even though the control of the company, the voting rights
and decisions were concentrated in the hands of the promoters and their families, the
resultant gains to the Family owners were justified as long as the minority shareholders also
benefited in terms of higher returns on their equity. However as the Indian capital market
matured and deepened with the entry of foreign investors these family owned companies
who were keen on raising funds in the market had to stay in tune with the developments in
the market. The benefits of good governance practices adopted by the widely held
companies were obvious. The advantages of corporate governance came to be recognized
and appreciated by these closely held companies. The initial practice of complying with only
the mandatory requirements of Clause 49, was replaced by serious efforts at bringing about
an all‐round improvement in governance, with more independent boards, reduction in
family controls, constitution of other Board level committees and greater emphasis on risk

| P a g e 131
management and internal controls. Our study has shown that those companies which took
the initiatives of investing in better processes and procedures for improving their
governance and even going beyond mere compliance to benefit all their stakeholders have
ultimately been rewarded by market forces.
One of the major constraints facing family managed companies was the issue relating to
disclosures. Sharing of information with minority shareholders was never their strong point.
Disclosures and particularly those relating to remuneration of directors have come out as
other important factors for better performance in the market. Foreign investors and even
domestic retail shareholders have shown greater interest in the companies with more
transparent balance sheets. The strong relationship between transparency and financial
performance has also been brought out clearly by our regression analysis.
An overall review of the outputs of all the different forms of regressions that we have
conducted reveals that HR, Quality improvement and Environment protection initiatives
associated with Beyond Compliance (BCHRQE) emerges as the most significant influencing
variable on company’s finances.
Variable
BCHRQ
E
NMVG
RI
MMD
MDSRII
MPR
ACI
NM49
RCI
MBC
I
MDRD
I
MDRP
TI
MNSA
C
NM49
NED
NM49
WBP
NMVG
SAI
MRM
I
MPICI
Total
Frequency 18 14 13 9 9 7 5 4 4 4 4 3 3 2 1 100
The above data provide the frequency of appearance of the independent variables in the
regression outputs which brings out their impact on different financial parameters across
data various sets.
As we observe, other than Beyond Compliance measures (BCHRQE), Voluntary Disclosure of
Remuneration of Non‐executive Directors (NMVGRI) and Disclosures made by the
Management under Management Discussion and Analysis (MMD) in the annual report have

| P a g e 132
emerged as the most significant variables influencing company’s finances, though the latter
has a negative influence on market related financial variables.
We can thus infer that good corporate governance practices do lead to encouraging
financial returns. It is also recognized by the market.
| P a g e 133
Chapter 8
Suggestions and Recommendations
From the conclusions emerging out of our empirical analysis in Chapter VII, it is now
established that corporate governance practices, when implemented in the right spirit,
would have a positive influence on financial performance of firms, irrespective of their size
or ownership. Based on the findings of our study, we are making some suggestions and
recommendations for the concerned players.
8.1 Recommendations for Family Managed Companies
On the basis of these conclusions we have attempted to make a few recommendations for
Family Managed companies – those which are already listed and those which are intending
to get listed on the Stock Exchanges. These recommendations are all the more relevant for
some of the well performing SMEs for whom a new platform has been created by BSE and
NSE for raising equity from the market. With an increasing number of promoter managed
companies turning to the equity market for raising low cost funds it is imperative for them
to be prepared for greater transparency and accountability, board independence and
responsibility towards minority shareholders. The implications of these measures of good
governance on ownership and control of the promoters in these companies have to be
weighed against the larger benefits of raising funds from the capital market.
Our study has brought into focus the high and positive relationship between some of the
key corporate governance practices adopted by the more progressive family managed
companies and their financial performance. Among the mandatory parameters of corporate
governance it is observed that number of subsidiaries and associate companies and
disclosure of remuneration criteria and remunerations of non‐executive directors and role
and powers of Audit Committee have had a positive and significant influence on Tobin’s Q

| P a g e 134
and interest coverage ratio. Among the voluntary compliance parameters, Voluntary
Disclosure of Non‐Executive Directors’ Remuneration packages (ie. fixed and variable
components) has displayed a significant positive impact on these two major financial
variables. ie. Tobin’s Q & Market Capitalization.
Of course the predominance of Beyond Compliance parameters having influenced several
financial indicators has further emphasized that well governed companies which have
invested in welfare measures for their employees and other stakeholders have also been
rewarded by the market in terms of higher Tobin’s Q, Market Cap, Asset Size and Sales.
This once again reinforces our argument that companies which have made substantial
investments for improving their governance practices have been rewarded by higher
valuations. Family Managed companies could therefore be apprised of the long term
benefits of moving in that direction.
Family owned companies would do well to shift their focus from the main objective of profit
maximization for their promoters and majority shareholders to other developmental
initiatives aimed at maximizing the welfare of all their stakeholders.
Even though promoters and their family members in these companies generally exert
control over all strategic and policy related issues, it is essential to appreciate the role of
employees particularly senior management, customers, suppliers, institutional investors and
banks in the growth and profitability of firms. These will inevitable unfold far‐reaching
implications on their financial performance and growth in the long run.
We therefore recommend that family managed companies going in for IPOs and listing on
the Stock Exchanges could initially focus on altering their mindsets and priorities and
consider investing in systems and procedures which encourage better communication and
sharing of information with minority shareholders and greater transparency is brought into
their balance sheets. These companies may also consider appropriate measures aimed at
greater value creation for all their stakeholders, especially their employees and senior
| P a g e 135
management as this would invoke greater confidence of their own employees and
customers and invoke investors’ trust so vital to survive in the capital market.
These companies would also have to proffer a bigger role to their independent directors
and reward them with performance related compensations since these would in the long
run result in higher returns and better valuations in the market.
Riding on the wave of globalization, more and more Indian companies are expanding their
global operations and the family owned companies are not far behind. Cross border
acquisitions of brands and companies and financial or technical collaborations are not
uncommon even for some medium sized firms. In their dealings with global companies
even in the emerging markets, the family managed companies will have to gear up and
invest in specialized manpower and set up separate departments to make information on
their operations available in real time to their global counterparts to match their corporate
governance practices.
As seen in the previous chapter, the influence of the above mentioned governance
parameters is quite significant on the valuation ratios which indicate the assessment of a
company in the capital market. The market value of the equity reflects the combined
influence of risks and returns and is the most comprehensive measure of a firm’s
performance.
This once again reinforces our argument that companies which have made substantial
investments for improving their governance practices have been rewarded by higher
valuations. Family Managed companies could therefore be apprised of the long term
benefits of moving in that direction.
8.2 Recommendations for Regulatory Authorities
During our scrutiny of corporate governance reports of family managed companies it was
observed that the system of reporting corporate governance initiatives has not altered
much since 2006. Though several amendments were made in SEBI Clause 49 and Voluntary
| P a g e 136
Guidelines were also issued in 2009, the pattern of reporting the barest minimum has not
changed for a large majority of firms. While some companies have shared all their
compliance measures with their minority shareholders, a large majority have reported only
that which is mandatory. Under Clause 49, some of the measures of corporate governance
need to be reported only to the board or the Audit Committee. Hence, all such measures are
not included in the corporate governance reports. Minority shareholders are therefore not
fully aware of companies’ compliance with even the mandatory provisions. These
information gaps had posed some constraints for our study as well.
Compliance to Clause 49 was made mandatory since 2006. The reference period for our
study was 2005‐06 to 2009‐10. This four year period can be considered to be too short for
medium sized family managed companies to change over their promoter driven governance
systems and bring about a drastic transformation in their reporting procedures. Hence, it is
a bit too early to make any policy level recommendations for the compliance related issues
concerning these companies.
8.3 Is there a Case for a Differentiated regime of Corporate Governance
for Medium sized Companies?
Small and medium sized companies, although overshadowed in public consciousness by the
large high market‐cap companies, are in many ways the backbone of Indian industry which
is also the case in most other economies including US and Europe. As they grow they form
part of the next generation of large market cap companies. It is therefore essential for them
to cultivate the right governance culture since it becomes more difficult to acquire this as
they grow. Again, given the same legal and regulatory framework in which the relatively
smaller sized firms operate otherwise, there may not be the need for them to have a
differentiated code for corporate governance.
A countervailing argument in favor of a differentiated regime for small and medium sized
firms would be the disproportionate financial burden faced by these companies for
designing and implementing the systems to comply with the mandatory governance norms.

| P a g e 137
Added to that would be the time taken for these companies to change over to sophisticated
IT based MIS and other reporting systems. SEBI Clause 49 itself has a number sub‐clauses
each relating to a series of governance measures to be put in place. For instance, there are
7‐8 types of mandatory disclosures to be made to various authorities both internal and
external. Implementing those measures, auditing them and then reporting them to
authorities at various levels itself would put a heavy burden on the senior management and
in particular the Audit Committee which needs to be adequately compensated. Small and
medium sized companies would then be prone to adopting sub‐standard practices for
complying with all the mandatory requirements. This would thus go against the very basic
principle of drawing up a regulatory framework for governance.
At this stage, keeping in mind the resource constraints faced by small and medium sized
firms and their limited capacity to comply with all the mandatory requirements of Clause 49,
it would be advisable to adopt a more flexible approach towards companies having genuine
inherent problems with their implementation. The Stock Exchanges could consider bringing
out a comprehensive document like a Ready Reckoner providing suitable guidelines for
corporate governance and the procedures and systems that can be adopted by small and
medium sized companies in a cost effective manner.
Some studies have shown that for governance ‘One Size does not Fit All’. Hence, at least in
the initial stages it would be practical to adopt a flexible approach for smaller sized firms
entering the market for raising funds for their growth and expansion programs. At this
stage, it may not be viable for them to incur the additional financial burden of compliance
with stringent governance norms.
These have revealed a high and positive relationship with almost all performance variables
in 2010 (Unadjusted and Adjusted).

| P a g e 138
8.4 Need for a better Monitoring Mechanism
As the Indian capital market expands and attains maturity regulations for governance are
bound to increase in keeping with the global standards. Presently, there is a pressing need
for a more sophisticated process of auditing the implementation process. Monitoring has to
be done both internally and externally by the Stock Exchanges. Discrepancies have to be
brought to the attention of SEBI. With the plethora of regulations faced by the listed
companies and no proper monitoring systems even the larger sized companies have not
been able to fully comply with those which are really necessary. For instance, the
constitution of the Remuneration Committee is necessary but it has been kept non‐
mandatory, while so many others are made mandatory. There is a need to have a relook at
the impact of some of the mandatory provisions from the point of view of their proper
implementation.
With the enactment of the Companies Amendment Bill the burden of compliance with a
new spate of regulations will only increase further. The task would become even more
stupendous for medium sized firms especially the new entrants for whom all these may not
be compatible with their prevailing status or ownership structures.
8.5 Role of Apex Chambers of Industry and Commerce and Industry‐
specific Associations
These apex bodies, which are established for the benefits of their members, have by and
large concentrated on issues concerning larger sized public limited companies. These
entities could play an advisory and facilitating role while assisting their members,
particularly the Family Managed and other medium sized companies entering the capital
market. While it is possible for the larger sized listed companies to appoint consultants and
legal advisors, even for raising funds from foreign investors, the same may not be possible
for small and medium sized firms. Services could be provided individually to companies as
the constraints of each may be different depending upon its size and ownership. It is only
| P a g e 139
with the support of these organizations that these firms would appreciate the benefits of
investing in improved governance practices. A good corporate governance culture could
thus evolve leading to the strengthening of the entire financial sector.
8.6 Role of NFCG
Need for more elaborate study
The findings of this complex study have been quite encouraging. Unlike other studies carried
out in the Indian context, we have tried to establish the relationship between a number of
financial performance variables besides Tobin’s Q and four different sets of corporate
governance parameters, which included mandatory, non‐mandatory, voluntary and beyond
compliance measures. Our results have shown that there is definitely a high and positive
relationship between most of the corporate governance parameters and financial
performance indicators. Besides Market Cap & Tobin’s Q, even P/B ratio, Total Sales, Total
Assets and Return on Net Worth are positively influenced by good governance practices.
All these findings need to be established more emphatically with more elaborate,
econometric analysis, if any policy related recommendations have to be made on the basis
of the study. For this purpose, the study has to overcome some of the constraints and
limitations faced by us in the initial study.
In Chapter 6, we have mentioned about the limitations of the data due to the skewed
sample size, which is tilted more towards companies in the smaller asset class of Rs. 200‐800
crore at 74 percent of the sample. We have observed that the proportion of companies in
the population reduces as the asset size increases. The smaller sized companies may not
have had the resources to adopt the desired processes for implementation of the prescribed
corporate governance practices.
| P a g e 140
NFCG could therefore consider commissioning a similar study on corporate governance
practices and financial performance, with a larger sample size. With a larger sample size, it
could be possible to assess the segment‐wise and size‐wise influence of good governance on
financial performance of these companies. This type of Study could also bring out the
gradual improvements made over the years by the listed firms, which could help in assessing
the effectiveness of the existing regulations in the capital market.
***
Jiban K Mukhopadhyay Debasis Mallik Dolly Dhamodiwala
Mumbai,
March, 2012
| P a g e 141
References 1. ‘Corporate Governance Board Leadership Training Resources Kit – Vol. I’ Global
Corporate Governance Forum (GCGF ), The International Finance Corporation, World Bank Group, Washington DC.
2. ‘Corporate Governance and Development’ A Paper by Stign Claessens Global Corporate Governance Forum ‐ GCGF –Focus I
3. ‘Corporate Governance in India Evolution and Changes’ Rajesh Chakrabarty College of Management, Georgia Tech, Atlanta, USA.
4. ‘Corporate Governance and Firm Performance’ Lawrence D. Brown & Marcus Caylor‐ Georgia State University, USA
5. ‘Encouraging Enterprise & Market Confidence, Effective CG Framework – A Dialogue’ Inst. Of Chartered Accountants of England & Wales (ICEW), (Reference in Introduction to International Corporate Governance Network 2005 by Anne, Simpson)
6. ‘Guidance on Good Practices in Corporate Governance Disclosures’ Inter‐governmental Working Group of Experts on International Standards of Accounting & Reporting – UNCTAD
7. ‘Does One Size Fit All in Corporate Governance ‐ Evidence from Brazil and other BRIK Countries’ Bernard S. Black, University of Texas at Austin, Law School and McCombs Business School, Antonio de Carvalho , Fundacao Getulio Vargas School of Business at Sao Paulo and and Erica Gorga, Fundacao Getulio Vargas Law School at Sao Paulo
8. ‘Materiality of Corporate Governance – Beyond the Numbers’ Deutsche Bank Study, United nations Environment Program – Financial Initiative (UNEP)
9. ‘GMI Rating Report’ ‐ Governance Metrics international Inc., USA 10. ‘Better Corporate Governance More Value for Everyone’, Business &
Development‐ Discussion Paper, Initiative of Business, Competitiveness and Development Program of the World Bank Institute.
11. ‘Governance, Risk and Compliance Handbook’ Edited by Anthony Tarantino, PhD 12. ‘Generation to Generation – Life Cycles of the Family Business’, Kelin Gersick,
JohnDavis, Marion McCollom Hampton and Ivan Lansberg – HBS Press 13. ‘Succeeding Generations Realizing the Dream of Families in Business’, Ivan
Lansberg 14. ‘Adventures in Capitalism‘,Patrick Foulis – Article in The Economist, Oct. 20, 2011 15. ‘ India – Codes and Rules‘ Asian Corporate Governance Association 16. Annual Report – 2010‐11, Ministry of Corporate Affairs, Govt. of India 17. ‘ Corporate Governance Voluntary Guidelines’ 2009 and 2011
| P a g e 142
18. ‘Family Involvement and Family Firm Performance – Taiwan’ En‐Te Chen Queensland University of Technology, Stephen Gray University of Queensland, John Nowland, City University of Hong Kong
19. ‘The Impact of Controlling Families and Family CEOs on Earnings Management’ 20. Mei‐Ling Yang Family Business Review, June 18, 2010 21. ‘Family Ownership and Control, the Presence of Other Large Shareholders and
Firm Performance : Further Evidence’ Spain, Maria Sacristan‐Navarro, Silvia Gomez and Laura Cabeza‐Garcia, Family Business Review, March 21, 2011
22. ‘How Corporate Governance Affects Firm Value – Evidence on Channels from Korea’
23. Bernard S. Black Northwestern University, Law School and Kellogg School of Management, Woochan Kim, KDI School of Public Policy and Management, Hasung Jang, Korea University Business School Kyung‐suh Park Korea University Business School
24. ‘Family Ownership and Control, Presence of other Large Shareholders and Firm Performance – Spain’, Maria Sacristan‐Navarro, Silvia Gomez‐Anson and Laura Cobeza Garcia
25. ‘Institutional Investors and Corporate Governance Practices in India’ – Pitabas Mohanty – National Stock Exchange.
26. ‘Corporate Governance and Firm Performance: Evidence from India’, Lal C Chugh, University of Massachusetts, Boston, Joseph W Meador, Northeastern University, Ashwini Shanth Kumar, University of Massachusetts, Boston
27. ‘Insider Ownership and Firm Value – Evidence from Indian Corporate Sector’, Manoj Pant and Manoranjan Pattanayak
28. ‘Firm Level Corporate Governance in Emerging markets : A Case Study for India’ (February 2008), N. Balasubramanian, IIM, Bangalore, Bernard Black, University of Texas at Austin, Vikramaditya Khanna, University of Michigan , Law School
29. Database –Prowess by CMIE 30. Database ‐ Capitaline