Embed Size (px)
Citation preview

CORPORATE GOVERNANCE, FIRM PERFORMANCE, AND EXECUTI VE
COMPENSATION:
EVIDENCE FROM CHINA
A Thesis Submitted to the College of
Graduate Studies and Research
In Partial Fulfillment of the Requirements
For the Degree of Master of Science in Finance
In the Department of Finance and Management Science
Edwards School of Business
University of Saskatchewan
Saskatoon, Saskatchewan, Canada
By
XIANG LI
Copyright Xiang Li, April 2010. All rights reserved.

i
PERMISSION TO USE
In presenting this thesis in partial fulfilment of the requirements for a Postgraduate degree from
the University of Saskatchewan, I agree that the Libraries of this University may make it freely
available for inspection. I further agree that permission for copying of this thesis in any manner,
in whole or in part, for scholarly purposes may be granted by the professor or professors who
supervised my thesis work or, in their absence, by the Head of the Department or the Dean of the
College in which my thesis work was done. It is understood that any copying or publication or
use of this thesis or parts thereof for financial gain shall not be allowed without my written
permission. It is also understood that due recognition shall be given to me and to the University
of Saskatchewan in any scholarly use which may be made of any material in my thesis.
Requests for permission to copy or to make other use of material in this thesis in whole or
part should be addressed to:
Head of the Department of Finance and Management Science
Edwards School of Business
University of Saskatchewan
25 Campus Drive
Saskatoon, Saskatchewan S7N 5A7
ii
ABSTRACT
This study investigates the relationships among corporate governance mechanism, firm
performance, and executive compensation within Chinese publicly listed firms. The corporate
governance structure in China is a unique combination of the Anglo-American model and the
German system by including a board of director and a supervisory board simultaneously, and has
two monitoring organs, independent directors and supervisory board, co-existing. One of the
special features of the Chinese publicly listed firms is their close relationship with the
government because most of them were converted from state-owned enterprises at the beginning
of the market-oriented economic reform in China. Therefore, we attempt to explore the effects of
political connections of their ultimate controllers on corporate governance mechanism, on firm
performance, and on executive compensation in China. Our findings indicate a dysfunctional
corporate governance system in China, which cannot bring improved firm performance but grant
executives high compensations. While we take into consideration the political connections, our
results show that they deteriorate corporate governance mechanism, but do not result in inferior
firm performance. Robustness tests demonstrate a non-linear effect of corporate governance on
executive compensation, jointly depending on the status of a firm’s political connection and its
ownership structure.

iii
ACKNOWLEDGMENTS
I would like to express my sincere gratefulness to my thesis supervisor Dr. Zhenyu Wu for
all his invaluable guidance, assistance and encouragement. The large amount of time and energy
he generously offered to assist me were curial to the establishment and development of this thesis
and I thank him for his direction and patience. It has been my pleasure and honor to have worked
with him. I would also like to thank the members on my supervisory committee, Dr. Craig
Wilson and Dr. George Tannous, as well as my external examiner, Dr. Alfred Lehar, for their
helpful comments and constructive suggestions.
I would like to thank the data providers of this thesis, SINOFIN and GTA, for granting me
the access to the data needed. Also, I wish to extend my appreciation to Dr. Shujun Ding at York
University, Dr. Yuanshun Li at Ryerson University, Dr. Chunxin Jia at Peking University, and Dr.
Zhenyu Wu at the University of Saskatchewan, for sharing part of their manually collected data.
I would also like to express my thankfulness to all the faculty and staff members of the
Department of Finance and Management Science, specially Dr. Marie Racine and Ms. Brenda
Orischuk, for their assistance and caring during my studies at the University of Saskatchewan.
Finally, I would like to thank my family and friends for their encouragement and help,
especially my parents who have devoted all their efforts in me, I am grateful for their continuing
understanding and countless support throughout my entire life.

iv
TABLE OF CONTENTS
page
PERMISSION TO USE ................................................................................................................... i
ABSTRACT .................................................................................................................................... ii
ACKNOWLEDGMENTS ............................................................................................................. iii
LIST OF FIGURES ....................................................................................................................... vi
LIST OF TABLES ........................................................................................................................ vii
CHAPTER 1 INTRODUCTION .......................................................................................................................... 1
CHAPTER 2 LITERATURE REVIEW AND INSTITUTIOANL BACKGROUND .......................................... 6
2.1 The Agency Problem ............................................................................................................. 6 2.1.1 Agency Problem and the Contract Theory ...................................................................... 6 2.1.2 Agency Problem between Owner and Management ....................................................... 7 2.1.3 Agency Problem between Large and Small Investors .................................................... 9
2.2 Firm Performance and Executive Compensation ................................................................ 10 2.3 Corporate Governance and Firm Performance .................................................................... 12 2.4 Ownership Structure and Firm Performance ....................................................................... 14 2.5 Studies on Chinese Issues .................................................................................................... 15
2.5.1 The Chinese Economic Reform and Compensation Reform ........................................ 16 2.5.2 Corporate Governance Mechanism in Chinese Publicly Listed Companies ................ 17
2.5.2.1 Board of directors as an operating organ ................................................................ 17 2.5.2.2 Supervisory board as a monitoring organ ............................................................... 19 2.5.2.3 Independent directors as a monitoring organ ......................................................... 21
2.5.3 Political Connections in Chinese Listed Companies .................................................... 22 2.6 Research Questions ............................................................................................................. 23
CHAPTER 3 DATA AND VARIABLES ............................................................................................................ 27
3.1 Data ..................................................................................................................................... 27 3.2 Variables .............................................................................................................................. 29
3.2.1 Dependent Variables ..................................................................................................... 29 3.2.2 Independent Variables ................................................................................................... 31 3.2.3 Control Variables .......................................................................................................... 32
3.2.3.1 Firm performance and risk ..................................................................................... 32 3.2.3.2 Characteristics of board of directors and supervisory board .................................. 32 3.2.3.3 Agency .................................................................................................................... 33 3.2.3.4 Ownership structure ............................................................................................... 34 3.2.3.5 Other control variables ........................................................................................... 34
3.2.4 Political Connection Variables ...................................................................................... 35
CHAPTER 4

v
METHODOLOGY ....................................................................................................................... 36
4.1 Testing Corporate Governance – Performance Relationship .............................................. 36 4.2 Testing Corporate Governance / Performance – Pay Relationship ..................................... 37 4.3 Testing the Influence brought by Political Connections...................................................... 39
CHAPTER5 EMPIRICAL RESULTS ............................................................................................................... 41
5.1 Descriptive Statistics ........................................................................................................... 41 5.2 Effects of Corporate Governance on Market Performance ................................................. 42 5.3 Effects of Corporate Governance on Executive Compensation .......................................... 43 5.4 Effects of Political Connections of Ultimate Controllers .................................................... 44 5.5 Effects of Political Connections of Ultimate Controllers—Robustness Tests .................... 46
CHAPTER 6 CONCLUSION ............................................................................................................................. 52
REFERENCES ............................................................................................................................. 55
vi
LIST OF FIGURES
Figure page Figure 1. Summary of Effects of Corporate Governance on Firm Performance and Executive
Compensation ............................................................................................................................... 60
Figure 2. Summary of Effects of Political Connections on Corporate Governance, Firm
Performance and Executive Compensation .................................................................................. 61

vii
LIST OF TABLES
Table page
Table 1. Descriptive Statistics ....................................................................................................... 62
Table 2. Effects of Corporate Governance on Market Performance ............................................. 64
Table 3. Effects of Corporate Governance on Executive Compensation ...................................... 65
Table 4. Effects of Political Connections of Ultimate Controllers ............................................... 66
Table 5. Effects of Political Connections of Ultimate Controllers for Firms with SOE=0........... 68
Table 6. Effects of Political Connections of Ultimate Controllers for Firms with SOE>0........... 71
Table 7. Summary of the Results of Robustness Tests ................................................................. 74
1
CHAPTER 1 INTRODUCTION
The importance of executive compensation is well documented in the corporate governance
literature (e.g., Jensen and Murphy, 1990; Kaplan, 1994; Sheilfer and Vishny, 1997; Firth, Fung
and Rui, 2006; Kato and Long, 2006). Pay-performance relationship has long been considered as
a crucial element of providing proper incentives for top executives (Jensen and Murphy, 1990;
Firth, et al., 2006; Kato and Long, 2006; Ding, Wu, Li, Jia, 2009). Many studies on this topic
have shown significant pay-performance relationship, but with rather weak pay-performance
sensitivity (Jensen and Murphy, 1990; Firth, et al., 2006; Kato and Long, 2006). Other than
performance, studies have shown that the corporate governance mechanism significantly impacts
the level of executive compensation (Boyd, 1994; Ryan and Wiggins, 2004). Various researchers
have extensively investigated different aspects of corporate governance mechanisms, including
board independence, board size, board meeting frequency and the overall board control level,
and have found such factors having significant influence on firm performance and/or executive
compensations (Boyd, 1994; Yermack, 1996; Eisenberg, Sundgren, and Wells, 1998; Vafeas,
1999; Ryan and Wiggins, 2004).
Chinese market has become one of the largest emerging markets in the world. With the
extraordinary growth, the unique Chinese corporate governance mechanism is starting to receive
much attention. In the hope of learning from the mature markets, China has borrowed from both
of the most effective corporate governance mechanisms in the global markets, the German and
the Anglo-American corporate governance structures (Xiao, Dahya and Lin, 2004; Xi, 2006;
Firth, Fung, and Rui, 2007; Jia, Ding, Li, and Wu, 2009). Thus, one of the special features of the
Chinese corporate governance mechanism is a combination of these two models, resulting in the
coexistence of the board of directors and the supervisory board. Within this unique structure, two
monitoring organs are in place; one is independent directors adopted from the Anglo-American
corporate governance structure, the other one is the supervisory board designed on the basis of
the German model. Due to their overlapping of functions, unfortunately, the roles of these two

2
monitoring units played in the Chinese corporate governance system have long been under
debate. Unlike supervisory boards in Germany, the Chinese supervisory boards are not engaged
in daily operation management; instead, their main responsibility is to monitor the behaviors of
executives and board of directors (Xiao, et al., 2004; Xi, 2006; Ding, et al., 2009). It is worth
noting that, after 2006 which saw the new Chinese Corporate Law became effective, supervisory
board has received much more attention than ever. Intensive debates have been raised to discuss
the functionality of this uniquely structured corporate governance system. Many researchers hold
the opinion that with two monitoring organs holding almost the same responsibilities would
weaken the effectiveness of the overall corporate governance system (Xiao, et al., 2004; Xi, 2006;
CFA Institute, 2007). Studying the effectiveness of this unique Chinese corporate governance
system offers us with insights that may only be available within such special research setting,
and findings of this study may provide ideas for other emerging markets that are working on
improving their corporate governance systems.
Previous literature on corporate governance has shown that the board meeting frequency
and board independence have significant impacts on firm performance and executive
compensation (Vafeas, 1999; Ryan and Wiggins, 2004). We extend such studies into the Chinese
market and investigate the monitoring functions of supervisory board and independent directors
on the firm performance and executive compensations in the Chinese publicly listed companies.
Prior studies (e.g., Xiao, et al., 2004; Xi, 2006; Chen, Firth, Gao and Rui, 2006; Firth, et al.,
2006; Firth, et al., 2007) on the Chinese corporate governance either only focus on one of the
two monitoring units, or only investigate part of the routes through which monitoring effects play
roles. In our study, we examine the effectiveness of both monitoring organs, supervisory board
and independent directors, in Chinese publicly listed firms. Furthermore, we explore the impacts
of corporate governance on both firm performance and executive compensation, and the specific
routes of such effects, while taking the interactions among them into consideration.
Since most of the Chinese publicly listed companies were converted from state-owned
enterprises at the beginning of the market-oriented economic reform in China (Xiao, et al., 2004;
Jia, et al., 2009), it is noteworthy that one of their typical features is their close relationships with
the government, including the central government, local government, and/or the military.
Therefore, we further specify the effects of political connection on corporate governance, firm
performance and executive compensation within the Chinese publicly listed firms. Effects of
3
political connections have been widely studied in the international framework. Prior research
suggests that the politically connected companies would enjoy various benefits, including easier
access to credit (Khwaja and Mian, 2005), no higher cost of capital even when quality of earning
disclosure is poor (Chaney, Faccio and Parsley, 2008), higher possibility of getting bailouts when
the firm encounters financial distress (Faccio, Masulis and McConnell, 2006), more favorable
polices which create obstacles for competitors to enter into the market (Bunkanwanicha and
Wiwattanakantang, 2009), and lower taxation (Faccio, 2006). Contradicting to the above findings,
Fan, Wong and Zhang (2007) research on effects of political connections of CEOs on corporate
governance and firm performance using Chinese data from 1993 to 2001, and conclude that
political connections of CEOs significantly deteriorate the functionality of corporate governance
mechanism and lower firm performance in China. In our research, after taking into consideration
the interactions existing among political connections, corporate governance, and firm
performance, we examine the effects of political connections on corporate governance, firm
performance and executive compensation in the Chinese publicly listed firms.
We investigate the research questions proposed using data from Year 2001 to Year 2006
from the Shanghai stock exchange and Shenzhen stock exchange, the two capital markets in
China. Our results show a clear picture of dysfunctional Chinese corporate governance
mechanism. Supervisory board and independent directors are not sufficiently effective to
improve firm performance; furthermore, the monitoring organs are so dysfunctional that they
increase executive compensations significantly. Our findings about the effects of political
connections are even more interesting. Instead of using political connections of CEOs, we study
the effects of political connection of a firm’s ultimate controller, since the special ownership
structure in China gives the ultimate controller substantial power over the firm1. Consistent with
Fan et al. (2007), our results show political connections of ultimate controllers significantly
weaken the efficiency and effectiveness of the corporate governance mechanism in China.
However, results from our empirical tests on how political connections impacts firm performance 1 The ownership structure of the Chinese publicly listed firms is unique in several ways: First, the ownership is highly concentrated. Previous literature (e.g., Chen, Firth, Gao, and Rui, 2006; Firth, et al., 2006; Jia, et al., 2009) documents that there usually exists a dominate shareholder who has substantially larger ownership than the next largest shareholder in line. Second, this dominant shareholder often appears to have a direct or indirect political tie with the central government, local government, and/or military (Firth et al., 2006). Third, three different classes of shares exist on the market, including state-owned share, legal person shares, and tradable shares, with each class comprises of approximately one-third of the total shares issued by the Chinese publicly listed firms. The first two classes of shares are non-tradable on the stock market, while the last class is freely traded by the Chinese investors (Firth et al., 2006; Ding, et al., 2009; Jia, et al., 2009).

4
fail to give significant results, which are inconsistent with Fan et al. (2007) who find negative
impacts of political connections on firm performance in Chinese IPOs, or with other research
which claims positive influences of such connections on firm performance (Hillman, 2005;
Faccio 2006; Bunkanwanicha and Wiwattanakantang, 2009). Such finding may result from the
co-existence of the two opposite effects2 which eventually offset each other, leaving us with an
insignificant result. Although our test on effects of political connections on executive
compensation yields no significant results, furthermore, the robustness tests provide interesting
findings. The results indicate that the corporate governance mechanism has a non-linear effect on
executive compensation, jointly determined by a firm’s political connection and ownership
structure status. The close firm-government relationship results in poorly functioning corporate
governance mechanism, which brings no improvement in firm performance but grants executives
high compensation.
Our study on the relationships among the corporate governance mechanism, firm
performance and executive compensation in Chinese markets contributes to the literature in
several ways. First, this is one of the early studies that discuss how the monitoring functions
provided by the two-tier-board corporate governance structure influence the firm performance
and executive compensation in China. The debate over the effectiveness of the Chinese corporate
governance mechanism has been intensive, and our study serves to provide empirical evidence to
this issue. Second, we explore the influence of political connections on corporate governance,
firm performance, and executive compensation in China. The unique ownership structure in
China has granted the ultimate controllers substantial influence over the listed firms and
therefore investigating the effects of their political connections is crucial for understanding the
Chinese corporate governance mechanism. Such issue has been rarely touched in the Chinese
market. Last, with the development of globalization and the increasing economy integration, our
study may offer policy implications to other developing markets on how to improve their
2 In our study, we find the political connections of ultimate controller negatively affect the efficiency and effectiveness of corporate governance. According to prior studies (Shleifer and Vishny, 1997; Fan et al., 2007), the lower effectiveness of corporate governance mechanism may result in poorer market performance. Having said that, prior literature indicate that political connections may send a strong positive signal to the market since political ties have been concluded to have various benefits, such as easier access to capital, and higher likelihood of getting financial bailouts (Khwaja and Mian, 2005; Faccio, Masulis and McConnell, 2006; Bunkanwanicha and Wiwattanakantang, 2009), and therefore tends to enhance the firm performance. The two effects of political connections on market performance work in opposite directions. When these two effects offset each other, the empirical results show an insignificant influence of the combination of the two effects over market performance. For detailed discussion, please refer to Section 5.4.

5
corporate governance mechanisms.
The paper proceeds as follows: in Chapter 2, we introduce the institutional background in
China, review previous literatures, and propose our research questions. Data and variables are
described in Chapter 3, followed by Chapter 4 which demonstrates our methodology and
empirical models. Chapter 5 presents the results and the relevant discussion, and conclusions are
drawn in Chapter 6.

6
CHAPTER 2 LITERATURE REVIEW AND INSTITUTIOANL BACKGROUND
2.1 The Agency Problem
2.1.1 Agency Problem and the Contract Theory
The central task of corporate governance is to deal with the agency problem generated from
the contractual arrangements among factors of production (Shleifer and Vishny, 1997). The
evolution of agency problem is accompanied with the development of contract theory. According
to the contract theory brought up by Coase (1937) and further developed by Alchian and
Demsetz (1972), Jensen and Meckling (1976), as well as Fama and Jensen (1983), the firm is
considered as “a set of contracts among factors of production” (Fama, 1980, p. 289), with each
single factor acts solely with the motivation of self-interest maximization. Agency relationship is
described by Jensen and Meckling (1976) as “a contract under which one or more persons (the
principals) engage another person (the agent) to perform some service on their behalf which
involves delegating some decision making authority to the agent” (p. 308). Since both parties act
to maximize their own utilities, divergences occur between the principal’s interests and the
agent’s actions. Jensen and Mecking (1976) define the agency cost as “the sum of the monitoring
expenditures by the principal, the bonding expenditures by the agent and the residual loss”, with
the residual loss referring to “the dollar equivalent of the reduction in welfare experienced by the
principal as a result of divergence between the agent’s decision and the ones maximizing the
principal’s welfare” (p. 308).
To explain agency problem with the contract theory, agency cost is described as the sum of
“ the cost of structuring, monitoring and bonding a set of contracts among agents with conflicting
interests” (Fama and Jensen, 1983, p. 304). Ideally, the principals and the agents would sign a
“complete contract” (Shleifer and Vishny, 1997, p. 741) which foresees every single future
contingency and specifies corresponding actions under each. However, since complete contracts
require a prediction of every state of the world, it is obviously “technically infeasible” (Shleifer
and Vishny, 1997, p. 741) to establish. Therefore, the contractual rights will be separated into two

7
types: specific control rights—i.e., the rights specified under circumstances foreseen in the
contracts, and residual control rights—i.e., the rights to decide in unpredicted situations
(Grossman and Hart, 1986). The purchase of the residual control rights is viewed as ownership
and the efficient allocation of such residual rights of control is a complicated question between
the principals and the agents.
2.1.2 Agency Problem between Owner and Management
Agency problem exists at all levels of management within firms, between the owners and
managers, between large and small investors, between different types of investors, between
different levels of managers, and so on. Among all these, the most extensively discussed one is
the agency cost caused by the separation of ownership and control. In a modern corporation with
diffused ownership structure, it is extremely normal to observe this separation. Such prevalence
exists for the following reasons. First, within a well developed capital market, the shareholders
are able to alter their investments among firms with fairly low transaction cost (Fama, 1980).
Portfolio theory suggests that, due to the diversification of investment across many corporations,
investors normally have no direct interest in engaging in any particular firm’s activities (Fama,
1980). On the other hand, agents possessing special skills and relevant knowledge about firm
managing or monitoring are willing to rent their human capital to firms at an appropriate rental
rate, which depends on the performance of the firm (Fama, 1980; Fama and Jensen, 1983).
Consequently, diffused shareholders are not qualified for or interested in taking any roles in firm
management or monitoring, and are willing to delegate their management or decision control
rights to the agents (Fama, 1980; Fama and Jensen, 1983).
With the separation of ownership and control, agency problems between the firm owners
and the managers arise. Since the managers intend to maximize their personal utility instead of
acting in the owners’ best interest, a reduction in the owners’ welfare occurs. Although according
to the ownership theory the firm owners have the residual rights to make decisions whenever the
circumstances are not foreseen by the contract, it is not possible for the owners to do so for the
reason of lacking qualification and enough information (Shleifer and Vishny, 1997). Under such
circumstances, hence, most of the residual rights are actually held by the managers and this
results in their having power to allocate resources according to their own will (Shleifer and
Vishny, 1997). Again, because of the self-interest maximization, such managers will take this
opportunity to expropriate the owners. Such expropriation can take various forms. Shleifer and

8
Vishny (1997) indicate that in some countries where investors are not well protected, say Russia,
Korea, or Italy, the managerial expropriation of investors takes direct methods such as cashing
out or transfer pricing. In the countries with legal system better protecting investors, for example
the United States, the expropriation of funds by managers is accomplished through other indirect
approaches. The managers may use the investors’ funds to consume perquisites. Or the managers
tend to “expand the firm beyond what is rational, reinvesting the free cash, pursuing pet projects,
and so on” (Shleifer and Vishny, 1997, p. 742). Furthermore, the managerial expropriation of
shareholders can take the form of entrenching the managers themselves to ensure their job
positions at an appealing level of compensation, even when they are not qualified or suitable for
the job anymore (Morck, Shleifer, and Vishny, 1988; Shleifer and Vishny, 1997).
In order to shrink such divergences between the interests of the managers and the owners,
the owners need to establish incentive contracts for the managers and effective monitoring
system within the corporation (Jensen and Meckling, 1976). Incentive contracts perform as an
instrument to align the interests of the managers with those of the owners (Shleifer and Vishny,
1997), and they may have different types such as stock options, equity ownership, or dismissal
threats if certain performance measurements are low (Jensen and Meckling, 1976; Fama, 1980).
The adoption of incentive contracts is frequently observed in practice. Many scholars have
researched on the relationship between the management ownership and firm performance (Berle
and Means, 1932; Morck, et al., 1988). Berle and Means (1932) suggest that due to the small size
of management ownership within large corporations, it is not the managers’ greatest concern to
maximize the firm value. Morck, et al. (1988) find a non-linear relationship existing between the
inside ownership and the firm value. Pay-performance relationship is also tested to show the
effectiveness of incentive contracts in alleviating the agency problem. Jensen and Murphy (1990),
Kaplan (1994), and Firth, et al. (2006), among many other researchers, have found positive
association between the executive pay and firm performance, using various performance
measurements and in different jurisdictions.
Monitoring is widely believed to be another effective way of resolving the agency problem.
As Fama and Jensen (1983) addressed, the decision management and decision control ought to
be separated to reduce agency cost when the decision-making and the residual risk-bearing are
separated. Put it differently, when there is a separation of ownership and control, a monitoring
system independent from management need to be established in order to mitigate the agency

9
problem. Monitoring can be conducted through several means. When ownership is concentrated
in a small number of residual claimants, decision control shall be in hands of these large
shareholders for “ratifying and monitoring important decisions and setting rewards” (Fama and
Jensen, 1983, p. 308). These large shareholders help to reduce agency problem as they have
enough control power to influence the decisions and strategies of the firm, and also they are
interested in maximizing profit (Shleifer and Vishny, 1997). When ownership is diffused,
however, it is impossible and inefficient for every residual claimant to be involved in the
decision control process. As mentioned before, a majority of the residual claimants are not
interested in, or qualified for performing any functions in the decision control process, and for
that reason, are willing to delegate the decision control rights to certain agents who are
competent for the job, for instance, board of directors (Fama, 1980; Fama and Jensen, 1983).
Board of directors is a common organization within the decision control system with the power
to fire, hire, set compensation schemes, and monitor major firm decisions (Fama and Jensen,
1983; Jensen, 1993). As Fama and Jensen (1983) declare, “exercise of these top-level decision
control rights by the board helps to ensure separation of decision management and control even
at the top of the organization” (p. 311). Monitoring can also take other forms, such as “decision
hierarchies”, in which the senior level agents are in charge of monitoring the subordinate agents
(Fama and Jensen, 1983, p. 310), and “mutual monitoring system”, in which agents monitor each
other for the reason that the rental rate of the agent’s human capital depends on firm performance
(Fama, 1980; Fama and Jensen, 1983, p. 310).
2.1.3 Agency Problem between Large and Small Investors
Agency problem does not only exist between the managers and the owners. It also appears
between the large and small investors. In the literature, this type of agency problem is also called
that between the controlling shareholders and the minority shareholders. Shleifer and Vishny
(1997), La Porta, Lopez-de-Silanes, and Shleifer (1999), and La Porta, Lopez-de-Silanes,
Shleifer and Vishny (2000) all suggest that, in many countries where large shareholder is
prevalent within modern corporations, the agency problem between the large shareholders with
controlling power over the firm and the leftover minority shareholders is astonishingly
significant. The controlling shareholders have enough voting power to influence the decisions
made by the firm. Within the process of using these control rights, the controlling shareholder
may, and very frequently will, try to maximize their own welfare at the expense of the minority

10
shareholders. Such expropriation can be many different types. The controlling shareholder can
pay out special dividends only to themselves instead of “pro-rata distribution” (Shleifer and
Vishny, 1997, p. 758). Or they can build up business relationships with the firms they personally
control, and sell the company’s output to the solely owned firms at prices that well below market
(Shleifer and Vishny, 1997). La Porta et. al (2000) considered both of the controlling
shareholders and the managers as “the insiders” (p. 4), and minority shareholders and creditors
as outsiders. They claim that, no matter who the insider is, as long as he/she has enough power to
control the firm, outsider is always the one being expropriated. Consequently, outside investors
need to have their rights legally protected (La Porta et. al, 2000).
Shleifer and Vishny (1997) compare the corporate governance systems in some of the most
developed countries with the most effective corporate governance mechanisms, and conclude
that “both the legal protection of investors and some form of concentrated ownership are
essential elements of a good corporate governance system” (p. 769). Large investors perform as
a monitoring instrument to make sure that the managers would distribute profits. Legal
protection helps the large investors to “exercise their power over the management” (Shleifer and
Vishny, 1997, p. 769), and more importantly, legal protection helps the small investors “against
the expropriation by both the managers and the large investors” (Shleifer and Vishny, 1997, p.
769). The authors highlight that large investors and legal protection are indispensable and
complementary elements in a successful corporate governance system (Shleifer and Vishny,
1997). La Porta et. al (2000) also point out the importance of legal protection for the outside
investors, including laws and enforcements. The authors consider corporate governance to be “a
set of mechanisms through which outside investors protect themselves against expropriation by
the insiders” (p. 4), and the legal protection is the key as it cuts down the efficiency of the
“expropriation technology” (p. 6) by the insiders (La Porta et. al, 2000). As a result, the insiders’
private benefits resulting from control are reduced. They argue that the legal approach is a more
“ fruitful way” (p. 6) to describe and to understand different corporate governance systems around
the world (La Porta et. al, 2000).
2.2 Firm Performance and Executive Compensation
In the corporate governance literature, pay-performance relationship has been considered as
a key element for providing proper incentives for executives and therefore alleviating agency
problem. Hence research on pay-performance relationship has been extensively conducted.

11
Unfortunately, the empirical results are inconsistent. The results presented by Jensen and Murphy
(1990) and Kaplan (1994) indicate a significantly positive relationship between executive
compensation and firm performance, though with a rather weak pay-performance sensitivity. In
Jensen and Murphy’s (1990) study, the association between firm performance and CEO
compensation is proved to be strong, but on average every $1,000 change in shareholder’s wealth
only leads to 2 cents of change in CEO’s incentive pay. Kaplan (1994) employs different
measures of firm performance, including earnings, stock returns and sales, to test the
pay-performance relationship, and illustrate CEOs’ cash compensation to be an increasing
function of firm performance. This issue has also been studied in the Chinese markets. Firth, et al.
(2006) demonstrate the existence of pay-performance relationship in Chinese publicly listed
companies, although the levels of significance of such relationships are affected by the different
types of controlling shareholders.
However, results from some other research do not support this conclusion. The findings of
Boyd (1994) suggest that CEO compensation is not significantly related to firm size or
accounting profitability; instead, it is negatively related to the degree of board control, which is
measured by CEO duality, percentage of insiders, board ownership, and institutional ownership.
Core, Holthausen and Larcker (1999) support Boyd’s (1994) findings, and suggest that lower
levels of board control lead to greater CEO cash compensations. They also find that the CEO
compensation is significantly larger when the CEO also holds the position of the board chair, the
board size is bigger, and more “gray” directors3 or directors appointed directly by the CEO
present on the board. The authors conclude that the weaker the governance mechanisms are, the
severer the agency problems there will be, and the higher the compensation will be received by
CEOs. Cyert, Kang, and Kumar (2002) also find that the firm’s ownership structure has impact
on CEO compensation. More specifically speaking, they find the level of the CEO’s
compensation has a significantly negative association with the size of the equity ownership of the
board members (Cyert et al., 2002). The above mixed findings suggest that, besides firm
performance, corporate governance mechanism and ownership structures also have contributed
to the diversity of executive compensation level.
3 In their research “gray” directors are defined as “if he or his employer receives payments from the company in excess of his board pay” (p. 382).

12
2.3 Corporate Governance and Firm Performance
The impacts of corporate governance mechanism on firm performance have received
dramatic attention in the corporate governance literature. Since Jensen (1993) addresses that
having a bigger sized team may lead to an ineffectively functioned board, the study of
relationship between board size and the firm performance has become prevailing. Supporting
Jensen’s theory, Yermack (1996) uses 452 large U.S. companies and finds that there exists an
inverse association between board size and the firm value measured by Tobin’s Q. The result
shows the major part of loss in firm value happens when the board size grows from relatively
small to relatively medium. The author also finds that the companies with smaller boards tend to
have greater operating profitability and higher likelihood of CEO dismissal after poor firm
performance. Consistent with Yermack’s findings, Eisenberg, Sundgren and Wells (1998) find a
negative relation between board size and firm’s profitability measured by industry-adjusted
return on asset using a sample of nearly 900 small-sized Finnish firms. The consistent results of
these two studies, which are conducted on different categories of companies in different
countries, enhance the explanatory power of board size in firm performance.
One other board activity that has been researched on is the board meeting frequency. Vafeas
(1999) studies 307 U.S. firms over a period from 1990-1994, and shows that board meeting
frequency is negatively associated with firm value measured by the market-to-book ratio. Vafeas
(1999) explains that this result roots in the growth of the board activity after a drop of share price.
Furthermore, Vafeas (1999) finds improvements in firm performance subsequent to the abnormal
frequent board meetings, and observes that such improvements are the strongest in the firms that
performed poorly before. These findings support Jensen’s (1993) argument of board meeting
being reactive instead of proactive.
There are some other board characteristics sparking the interest of researchers in the
corporate governance field. Jensen (1993) claims that when the CEO also performs as the
chairman of the board, the lack of board independence makes it “extremely difficult for the board
to respond early to failure in its top management team” (p. 867). Further evidence was provided
by Goyal and Park (2002), whose results show that the CEO turnover is significantly less
sensitive to firm performance when the positions are combined. The likelihood of CEO turnover
increases only by 2.5% as the stock returns decline by one unit of standard deviation when the
titles are combined, while 5.3% when the titles are separated. In contrast, Brickley, Coles, and

13
Jarrell (1997) find no evidence showing that combined leadership structure leads to poorer
performance. The authors suggest that the title separation does not only bring benefit, but also
incurs cost, which includes the agency cost of monitoring the non-CEO board chairman,
information sharing cost between the CEO and the chairman, and incentive costs associated with
a succession process in which CEOs are promised the chairman title (Brickley, et al., 1997). The
cost induced may offset the advantage that a separate CEO-Chairman leadership offers.
Therefore the authors suggest the titles should only be separated when the costs are low
(Brickley, et al., 1997).
One widely adopted monitoring organ in the Anglo-American corporate governance system
is the independent director. The corporate governance literature emphasizes the independent
directors as an efficient way to mitigate agency problems and to improve the quality of corporate
governance. In theory it is expected that the outside directors represent the minority
shareholder’s best interest since the failure of fulfilling their duties may incur an extensive
reputation cost (Fama and Jensen, 1983). A number of studies conclude that boards dominated
by outsiders tend to act in the shareholders’ interest. Hermalin and Weisbach (1988) show that
boards with more independent directors have higher probabilities to remove poorly performed
CEOs. Beasley (1996), Uzun, Szewczyk and Varma (2004) and Chen, et al. (2006) provide
evidence that firms with higher percentage of independent directors on board are less likely to
commit financial fraud. Beasley (1996)’s analysis of comparing 75 fraud firms and 75 non-fraud
ones shows significant greater percentages of outside directors appointed on the boards of
non-fraud firms. Board size also shows a positive relationship with the likelihood of financial
statement fraud. Uzun, et al. (2004) find the likelihood of “corporate wrongdoing” (p. 33) is a
decreasing function of the percentages of independent directors on the board. Their results also
illustrate an increase in independent directors on the auditing and compensation committees
leads to a decrease in the incidence of financial fraud (Uzun, et al., 2004). Chen, et al. (2006)
further demonstrate the monitoring effects offered by independent outside directors by studying
the Chinese publicly listed firms over the period of 1999-2003. The authors suggest increasing
the proportion of outside directors is an effective way to reduce financial fraud since the
outsiders tend to monitor management more closely and thus assist to deter frauds (Chen, et al.,
2006). Karamanou and Vafeas (2005), Firth, et al. (2007), and Lai and Tam (2007) all indicate
that firms with boards dominated by independent directors have better quality of accounting

14
information, using either the U.S. or Chinese data.
Unfortunately, the findings about the relationship between the percentage of independent
directors on the board and the firm performance are mixed. Agrawal and Knoeber (1996) study
approximately 400 large U.S. firms and find an abnormal result showing the existence of a
negative relationship between firm performance and the percentage of outside members on the
board. However, Hermalin and Weisbach (1991) and Klein (1998) find no direct association
between the board composition and firm performance. Hermalin and Weisbach (1991) give this
finding several explanations: it could be because the inside and outside directors have equal
incentives to represent the shareholder’s interest, especially after the control of top-management
over the board-selection is taken into consideration; or it could be due to the advantages brought
by the inside directors, such as providing advice and information on firm’s daily operation for
CEO in order to achieve value maximization (Hermalin and Weisbach, 1991). Klein’s (1998)
study indicates that having a reasonable number of insiders on finance and investment
committees can actually improve firm performance since the internal directors contribute to firm
performance with certain valuable knowledge.
2.4 Ownership Structure and Firm Performance
The ownership structure of the firm is also considered a factor that has impacts on the firm
performance and value. Morck, et al. (1988) find a non-linear relationship between the inside
ownership and the firm performance measured by Tobin’s Qs. They illustrate that ownership
positively links to Tobin’s Q within the range of 0% to 5% of inside ownership, negatively in the
range of 5% to 25%, and further positively beyond 25% (Morck, et al., 1988). The authors
explain the non-linear relationship with two hypotheses, convergence-of-interest hypothesis and
entrenchment hypothesis (Morck, et al., 1988). Under convergence-of-interest hypothesis, the
firm value increases as the inside ownership gets larger, since the management aligns their
interests with the shareholders. On the contrary, under entrenchment hypothesis, the firm value
decreases with the inside ownership because a substantial power over the firm’s equity provides
insurance of employment and appealing salaries, resulting in lower level of monitoring and
reduction in firm value (Morck, et al., 1988). The authors therefore conclude that as inside
ownership increases, firm value first rises because the convergence-of-interest effect dominates
the entrenchment effect, then falls as the entrenchment effect takes the lead (Morck, et al., 1988).
Furthermore, studies are also conducted on the relationship between ownership structure and

15
executive compensation. For instance, Core et al. (1999) find that both board structure and
ownership structure are associated with the CEO compensation, and CEO compensation seems
to have a negative relationship with CEO’s ownership. Especially if there exist a “non-CEO
internal board member” (p. 372) or an “external blockholder” (p. 372) possessing a minimum of
5% of the shares, the CEO compensation is significantly lower. Cyert et al. (2002) finds that the
CEO’s compensation is a decreasing function of the equity ownership of the board of directors.
The role of large shareholder in corporate governance mechanism has been extensively
discussed in numerous studies as well. The monitoring function provided by the large
shareholders helps to alleviate the agency problems (Jensen and Meckling, 1976; Morck, Shleifer
and Vishny, 1989; Shleifer and Vishny, 1997). Nevertheless, every coin has two sides. Ownership
concentration may also create other agency problems. For instance, large shareholders have the
incentive to expropriate the interests of minority shareholders, other investors, as well as
employees and managers through various means while they use the control rights to benefit
themselves (Shleifer and Vishny, 1997). One way of doing so is using the superior voting power
to pay special dividends to themselves or develop “other business relationships with the
companies they control” (Shleifer and Vishny, 1997, p. 758). Burkart, Gromb and Panunzi (1997)
made an interesting argument that firm’s ownership structure is actually determined as “a
trade-off between the gains from monitoring and those from managerial initiative” (p. 694). The
authors argue that managerial initiative adds to firm value and the managers tend to show more
incentives when there is less interference from the shareholders (Burkart, et al., 1997). However,
this means that a loss in corporate control from the insufficient monitoring occurs at the same
time. On the other hand, when the ownership structure is more concentrated, control and
monitoring are better performed while managerial initiative is sacrificed. Therefore, the
ownership structure performs as a mechanism to settle the problem of the trade-off between
managerial initiative and corporate control (Burkart, et al., 1997).
2.5 Studies on Chinese Issues
The Chinese stock market has been soaring over the past 18 years. Although with a rough
period in the early stage, Chinese stock market has successfully managed to become one of the
largest stock markets in the world. As of December 31st 2007, there are 860 companies listed on
Shanghai Stock Exchange, and the total market capitalization reached USD 3,694 billion. It was
ranked the second largest exchange in Asia in term of market value, and the sixth largest

16
worldwide. Shenzhen Stock Exchange listed 670 companies and the combined capitalization
amounted to USD 785 billion in the same year. By the end of 2007, the Shanghai and Shenzhen
Stock Exchanges together had 1,530 listed companies, with a total market value added up to
nearly RMB 31,044 billion, or USD 4,479 billion. Furthermore, the new capital raised from
Initial Public Offering amounted to RMB 447 billion, or USD 63 billion within Chinese stock
market during 2007, which made Chinese stock market to rank No.1 globally by IPO proceeds4.
This dramatically growing market has received unprecedented attention. Consequently,
numerous scholars have been conducting studies comprehensively using Chinese stock market as
their research setting.
2.5.1 The Chinese Economic Reform and Compensation Reform
The Chinese economic reform was introduced 30 years ago, and its core content was the
adoption and application of free market policies. There were two most significant steps in this
reform: first, the establishment of two stock exchanges, Shanghai stock exchange and Shenzhen
stock exchange, in 1990 and 1991, respectively (Kato and Long, 2006; Xi, 2006; Ding, et al.,
2009); and second, the privatization of Chinese state owned enterprises (hereafter SOEs), which
then became listed on these two stock exchanges (Firth, et al., 2006).
Accompanying the economic reform, the executive compensation, especially executive
compensation within the SOEs, also went through a compensation reform. Prior to 1978, the
government had a powerful control over the SOEs. All the profits made by the SOEs were
required to remit to the government and none was left to be kept by the enterprises. There was no
autonomy or incentive schemes to motivate the executives, nor can the executives share any of
the profits generated in the enterprises. Firm performance did not affect the executive
compensation in any way; instead, it was other factors, such as job title, individual’s seniority,
level of management, firm size, region, and industry, determined the size of the compensation
(Kato and Long, 2006). The compensation system implemented in China was a simple universal
compensation scheme (Ding et al., 2009). After 1978, “profit retention and profit sharing
schemes” were employed (Firth et al., 2006, p. 696), meaning that a portion of the profit was
allowed to be kept by SOEs, and SOEs were allowed to increase the compensation of their
executives and employees using this kept profit (Ding et al., 2009). In addition, more autonomy
4 See Ding et al. (2009), Jia, et al. (2009), Shanghai Stock Exchange (English): http://www.sse.com.cn/sseportal/en_us/ps/home.shtml, and Shenzhen Stock Exchange (English): http://www.szse.cn/main/en/ for more details.

17
was given to the SOEs and the incentive scheme was introduced. The compensation system
gradually converted into a combination of a fixed “base salary” and a variable “risk salary”
based on performance throughout the country (Kato and Long, 2006, p. 953). Liu and Otsuka
(2004) conduct a study of Chinese executive compensation using survey information from 1995
to 1999, and their results illustrate that the incentive pay system is implemented in more than
80% of the firms in their research sample.
One thing which is noteworthy is that, according to regulation of the China Securities
Regulatory Commission (CSRC), executive compensation is required to be reported in the firms’
annual reports, including salary and bonus. Unfortunately, these two component parts are not
required to be reported separately. It is also worth noting that in Chinese publicly listed
companies, the use of cash compensation dominates the use of stock options. Firth et al. (2006)
point out that there is very little information disclosure about the stock options granted to the
executives. As a result, in this study we follow Firth et al. (2006) and Kato and Long (2006) and
use only the executives’ cash compensations.
2.5.2 Corporate Governance Mechanism in Chinese Publicly Listed Companies
Chinese publicly listed companies have two very unique characteristics. One is the highly
concentrated ownership. It is very frequent that there exists a dominant shareholder which has
substantial power over the firm. And this dominant shareholder often appears to have either
direct or indirect relationship with the government and/or the government related agencies.
According to the findings of Chen, et al. (2006), for listed SOEs, on average about 60% of
shares are ultimately controlled by the government and its related agencies. The other unique
characteristic of the corporate governance in Chinese publicly listed companies is that according
to the regulation, the corporate governance mechanism in Chinese firms are
two-tier-board-based, which combines the German and the Anglo-American corporate
governance structures, and has both the board of directors and the supervisory board. The main
responsibilities of supervisory board involve monitoring the board of directors and top
executives, rather than engaging in firm’s daily operations (Ding et al., 2009).
2.5.2.1 Board of directors as an operating organ
As mentioned above, a dual-board corporate governance system is declared mandatory to
the publicly listed firms in China by China Securities Regulatory Commission (CSRC). Within
this unique system, board of directors is primarily an operating organ rather than a monitoring

18
one, in which board members work with management team rather closely on firm’s daily
operations (CFA Institute, 2007). According to the 1993 Corporate Law, board of directors in
Chinese publicly listed firms mainly oversees and aids management decision making on firm’s
day-to-day operations, including convening the shareholder meetings, helping to lay out the
operation and investment plans, merger and acquisition plans, financial budget plans, bond
issuance plans, company dissolution plans, hiring and dismissing the management team members,
and so forth5.
The composition of the board of directors in China has evolved over time. Before 2001
there was no independent director required to the Chinese listed companies. Therefore, very few
companies had independent directors on their boards. According to Clarke (2006), it was
reported by CSRC that merely 314 independent directors were appointed on the boards of 1100
firms listed on Shanghai Stock Exchange and Shenzhen Stock Exchange by 2001. As a result,
boards were dominated by the insiders. In the process of introducing independent directors to
Chinese corporate governance system, and furthermore making the regulation mandatory, the
weight of independent directors in Chinese listed firms has increased dramatically. Currently it is
required that independent directors have at least one-third of the seats on the board.
In 2001 China issued “The Code of Corporate Governance for Listed Companies in China”
in the hope of giving further directions on firm corporate governance and enhancing the overall
quality of the Chinese corporate governance system. It introduced several specialized committees
into the board of directors. According to this code,
“The board of directors of a listed company may establish a corporate strategy committee,
an audit committee, a nomination committee, a remuneration and appraisal committee and
other special committees in accordance with the resolutions of the shareholders’ meeting”
(p. 7).
Important roles are assigned to the independent directors on these committees to improve the
quality of corporate governance. According to the documentation,
“The audit committee, the nomination committee and the remuneration and appraisal
committee shall be chaired by an independent director, and independent directors shall
constitute the majority of the committees” (p. 7)6.
5 Refer to the Company Law of People’s Republic of China from State Administration for Industry and Commerce of China: http://wzj.saic.gov.cn/pub/ShowContent.asp?CH=ZCFG&ID=213&myRandom=.174839104 6 For more detailed duties of the corporate strategy committee, the audit committee, the nomination committee and
19
However, the CFA institute conducted a survey on Chinese corporate governance system in 2007,
which indicates the absence of nomination committee and remuneration committee is rather
prevalent. It is also indicated in this survey that the nomination and remuneration process is
“primarily handled by the management team or directed by the state” (p. 9).
2.5.2.2 Supervisory board as a monitoring organ
The other piece of the dual-board mechanism is the supervisory board, whose role in the
governance system has long been under debate. It is worth noting that, after the new Chinese
Corporate Law became effective in 2006, supervisory board has received much more attention
than ever (Ding, et al., 2009; Jia, et al., 2009).
Since in Chinese firms the largest shareholder usually has effective control (Firth, et al.,
2006), minority shareholders encounter agency problems besides the one generated from the
separation of ownership and management, including the potential expropriation by controlling
shareholders, the “diversion of resources to managers and controlling shareholders”, and the
“manipulation of stock prices” (Chen, et al., 2006, p. 428). In other words, minority shareholders
in Chinese publicly listed companies face two layers of agency problems, the one caused by the
separation of ownership and control and the one between large shareholders and small
shareholders.
As mentioned earlier, monitoring is widely believed to be an effective way to mitigate the
agency problems (Jensen and Meckling, 1976; Morck, Shleifer and Vishny, 1989). Unlike the
effective role of large shareholders in addressing agency conflicts in other economies (Shleifer
and Vishny, 1997), the history of Chinese stock market indicates that the role large shareholders
play in Chinese corporate governance mechanism is particularly controversial given the unique
ownership structure in China.
Therefore, CSRC declares that protecting small shareholders is one of their priorities.
According to the 1993 Corporate Law, the involvement of supervisory board was implemented
mandatorily by all listed companies. The supervisory board in China is not in charge of
appointing or evaluating management team members (Xiao, et al., 2004; Xi, 2006; Ding, et al.,
2009). Their main duties consist of supervising the management team and the board of directors,
and also examining the company’s financial affairs (Xi, 2006). However, the monitoring function
the remuneration and appraisal committee, refer to “The Code of Corporate Governance for Listed Companies in China”: http://www.ecgi.org/codes/code.php?code_id=23
20
of the supervisory board is also controversial. A number of studies show that at least in the
publicly listed firms, supervisory board’s functionality is compromised (Xi, 2006; Xiao et al.,
2004). Xi (2006) describes the supervisory board as nothing more than a decoration vase to the
Chinese corporate governance system. Xiao et al. (2004) conclude in their research that the
supervisory board in most of the Chinese publicly listed companies only performs as “an
honored guest”, “ a friendly advisor”, or “a censored watchdog” 7(p. 40).
On the other hand, some other researchers find that supervisory board reports, which are
made mandatory as a part of the corporate annual report, seem to be valued by the investors
(Dahya, Karbhari, Xiao and Yang, 2003). In their study, it is shown that when a firm fails to
issue the supervisory board report, the market reacts negatively (Dahya, et al., 2003). It also
suggests the value of the supervisory board report is associated with the role played by the
supervisory board in the firm’s corporate governance system. If the supervisory board does not
performs effectively, the usefulness of the supervisory board report is very limited. On the
contrary, if the supervisory board performs as “an independent watchdog”, the supervisory board
report is valuable (Dahya, et al., 2003). Firth, et al. (2007) further illustrate that supervisory
board has the ability to improve the quality of a firm’s financial disclosure by conducting the
research on the earnings informativeness of Chinese publicly listed companies between 1998 and
2003. Three proxies are adopted for measuring earnings informativeness, including
earnings-return association, absolute discretionary accruals, and audit firms’ opinions (clean or
modified reports), and it is found that the supervisory board size and its meeting frequency have
positive relationships with the informativeness of earnings (Firth, et al., 2007). The
independence from the control of board of directors and the expertise in finance and accounting
are suggested as the main explanations for such improvement in accounting informativeness
brought by the supervisory board (Firth, et al., 2007).
7 Xiao (2004) categorizes the role of supervisory board in china into four groups: “honored guest”, “ friendly adviser”, “ censored watchdog” and “independent watchdog” (p. 40). “Honored guest” means that the supervisory board “performs a nominal or honorary role. Specifically, supervisors ‘pretend’ to comply with basic legal requirements, but in reality they do little besides maintaining a mere physical presence” (p. 44). “Friendly adviser” means the supervisory board “SB provides consultancy and advice to the BoD, but they do not confront board directors and senior managers even when problems exist” (p. 46). The supervisory board performing a “censored watchdog” role “seeks to perform its duties diligently in preparing ‘informative’ reports, monitoring the actions of the BoD and providing comments on actions perceived to be motivated poorly” (p. 46). However, the supervisory board is still dominated by the board of directors and top management therefore is not able to disclose all the information in the Supervisory Board Report. “Independent watchdog” refers to such supervisory board which “performs its monitoring duties ‘largely’ independently of any interference and/or sanctions from the BoD, the CEO and large shareholders” (p. 47).
21
2.5.2.3 Independent directors as a monitoring organ
Independent directors were officially adopted by the Chinese corporate governance system
in 2001, and further enhanced and made mandatory in 2003. According to the CSRC regulations,
each listed company in China is required to have at least one-third of the board members to be
independent directors8. The monitoring function provided by independent directors is well
documented in the corporate governance literature under Anglo-American corporate governance
settings. China introduced this organ in the hope of improving the quality of the Chinese
corporate governance following the advanced western corporate governance system.
Since then, a number of academic studies have been conducted on the monitoring role of
independent directors in the Chinese publicly listed companies. Chen, et al. (2006) indicate that
the Chinese listed firms with a high proportion of independent directors on the board have less
possibility to engage in financial fraud. Their research is based on the Chinese publicly listed
firms between the year of 1999 and 2003, and illustrates the monitoring effects brought by the
independent directors. The authors argue that the outsiders monitor the managers’ behaviors
more tightly and therefore increasing the percentage of outside directors significantly help
reduce financial fraud (Chen, et al., 2006). Firth, et al. (2007) and Lai and Tam (2007) provide
evidence showing that firms with boards dominated by independent directors have better quality
of accounting information in China. It is shown in Firth, et al. (2007) that the higher the
percentage of independent directors, the greater earnings-return coefficient, the lower the
absolute discretionary accruals, and the cleaner the audit reports. In other words, these results
mean that the higher the percentage of independent directors on board, the greater earnings
informativeness. Lai and Tam (2007) study the publicly listed companies in Chinese stock
market over the period of 2000 to 2002. They find that the voluntary adoption of independent
directors and higher percentage of independent directors on board decrease the level of income
smoothing, and therefore generate a better quality of accounting information. The authors
indicate that the independent directors play an important monitoring role in the Chinese
8 The Guidelines for Introducing Independent Directors to the Board of Directors of Listed Companies (“Guidelines”) was issued by CSRC in August, 2001. The “Guidelines” made it mandatory that all listed companies in China must have at minimum two independent directors on the board by 30th June 2002, and by 30th June, 2003, independent directors must consist of at minimum one third of the board members. Independent directors is defined in “Guidelines” by CSRC as follows: “an independent director is a director who holds no posts in other company other than the position of director, and who maintain no relations with the listed company and its major shareholder that might prevent them from making objective judgment independently.”
22
corporate governance mechanism (Lai and Tam, 2007). Kato and Long (2005) find the adoption
of independent directors in Chinese listed companies helps improve the sensitivity between CEO
turnover and firm performance.
Similar to the findings in the United States, the research on board composition and firm
performance in China does not yield a clear result. Bai, Liu, Lu, Song and Zhang (2004) find no
significant association between the percentage of independent directors on the board and firm
performance measured by Tobin’s Q using the information from Chinese publicly listed firm
between the year of 1999 and 2001.
2.5.3 Political Connections in Chinese Listed Companies
As mentioned above, the Chinese listed firms usually have government-related dominant
shareholders. Therefore, it is natural for us to consider the effect of political connections on
corporate governance and firm performance.
Prior studies (e.g., La Porta, et al., 1999; La Porta, et al., 2000) show that government
intervenes is more severe in countries with weak protection of property rights, and many
researchers have shown that the politically connected firms enjoy many benefits. Khwaja and
Mian (2005) address that in Pakistan, the politically connected firms have greater access to credit;
these firms receive 45% greater loans, even if they have 50% higher default rates comparing
with their non-connected peers. Faccio (2006) shows evidence of politically connected firm
enjoying lower tax rates and greater market share than the ones without connections using
information from 47 countries. Faccio, et al. (2006) indicate that when firms encounter financial
distress the political-connected ones have a significantly higher likelihood of getting bailouts
using information of 450 politically connected firms from 35 countries. Bunkanwanicha and
Wiwattanakantang (2009) study the effects of political connections within Thai companies, and
find that once the firms establish political connections with the government, their
market-to-book ratio increases by 242% and they outperform their non-connected peers by 160%.
The authors also provide evidence showing that political connections bring favorable policies
and regulations to the firms and thus create obstacles for both domestic and foreign competitors
entering the industry and help the connected firms obtain 50% more market share
(Bunkanwanicha and Wiwattanakantang, 2009). Chaney, Faccio and Parsley (2008) find that the
political ties are able to mitigate the cost of disclosing poor quality earnings; lower disclosure
quality would normally raise the cost of debt for non-connected firms, but the poorer quality of

23
earnings report does not seem to affect the cost of debt for those politically connected firms.
It is obvious from the above studies that politically connected firms enjoy extensive
benefits and generally gain from such political ties. Research on relationship between firm
performance and the connection to government, however, has yield mixed results. Hillman (2005)
shows evidence of the positive relationship between political connections and firms’
market-based performances. She explained the results using the resource dependence theory,
which addresses that the linkage between firm and government can reduce the uncertainty
created by the external environment through various means including additional advice and
information, preferential access to resources, and legitimacy, and therefore improves the
likelihood of survival and performance of the firm (Hillman, 2005). Faccio (2006) studies
20,202 publicly traded companies from 47 countries, and finds that the firm value increases
significantly after the firm’s businessperson enters politics. This increase appears to be more
significant when the political ties established by the businessperson are stronger, for example
being elected as the prime minister (Faccio, 2006).
Different from Hillman (2005) and Faccio (2006), Fan, et al. (2007) find in their research
that political connections negatively influence Chinese firm’s long-run performance. Their study
is based on a sample of 790 IPO companies over a period of 1993 to 2001. In terms of corporate
governance, they mainly focus on board composition. Their findings indicate that CEO’s
political connection leads to more government officials and fewer numbers of professionals on
the board, and they conclude CEO’s political connection is associated with weak corporate
governance and low board professionalism (Fan, et al., 2007). They also provide evidence
showing that the firms with CEOs politically tied perform significantly worse than the ones
without, using long-term post-IPO stock returns as well as accounting performances (Fan, et al.,
2007). That is to say the Chinese publicly listed firms, instead of benefiting from the political
ties, are actually suffering from them. This interesting finding brings our attention to examine the
effects of political connections using Chinese markets as a research setting, as some distinctive
insights may generate from such unique Chinese political background and economic
environment.
2.6 Research Questions
As discussed earlier, in order to explain the factors that may affect the executive
compensations, various studies have been conducted with different focuses. Extensive studies
24
have been conducted on firm performance, many of which show significantly positive
relationship though low pay-performance sensitivities (Jensen and Murphy, 1990; Kaplan, 1994;
Boyd, 1994; Firth et al., 2006; Kato and Long, 2006). Some other studies focus on the impacts
that corporate governance mechanism brings to executive compensations. Many aspects of
corporate governance mechanism have been studied, among which board of directors and
ownership structure have received the most attention (Morck et al., 1989; Boyd, 1994; Yermack,
1996; Brickley et al., 1997; Shleifer and Vishny, 1997; Eisenberg et al., 1998; Vafeas, 1999; Core
et al., 1999; Goyal and Park, 2002; Chen et al., 2006, Firth et al., 2007). Among all these studies
on corporate governance, many have suggested that the effectiveness of corporate governance
mechanism is inversely related to executive compensation (Boyd, 1994; Core et al., 1999; Ryan
and Wiggins, 2004).
Our study contributes to both streams of the literature in the unique Chinese market setting,
with the special corporate governance mechanism consisting of two boards, board of directors
and supervisory board, and also two monitoring organs, supervisory board and independent
directors. On one hand, our study investigates the monitoring effects of the unique Chinese
corporate governance mechanism on executive compensation in Chinese publicly listed
companies. On the other hand, we examine the influence of firm performance on executive
compensations in these companies as well. By doing both ways, we attempt to draw a complete
picture which characterizes the factors determine the executive compensations in Chinese
publicly listed firms.
As we conduct our research in the Chinese market, we further take into account the
potential effects of political connections, one of the most special features of the Chinese publicly
listed companies, to explore the impacts of such connections on corporate governance
mechanism, firm performance and executive compensations. Political connections are shown to
bring many benefits to the connected firms in different research for the reason of ensuring easier
access to capital, more possible policy support and inside information on policy making, and
therefore lead to improved firm performance (Khwaja and Mian, 2005; Faccio, 2006; Faccio, et
al., 2006; Bunkanwanicha and Wiwattanakantang, 2009; Chaney, et al., 2008). However, Fan et
al. (2007) investigate the political connections in China prior to 2002 and show an interesting
result that political connections lower both the effectiveness of corporate governance and firm
performance.

25
Compared to Fan et al. (2007), the sample adopted in our research covers the period of
2001 to 2006, during which the development of Chinese capital market involves both the
unfolding process of legal protection of investors and the unprecedentedly observed reform of
corporate governance mechanism. Nevertheless, politically connected firms may react negatively
to such improvement as their primary goals may be political and social responsibilities, instead
of solely maximizing shareholders’ wealth (Bai, et al., 2004; Firth et al., 2006; Fan et al., 2007).
Furthermore, better-functioned corporate governance may become an obstacle when the
government attempts to extract rents from the politically connected companies and therefore are
not welcomed. Hence, we predict political connections would have negative effects on corporate
governance mechanism to lower the monitoring efficiency and effectiveness.
As we mentioned before, previous studies on the influence of political connections on firm
performance have yield mixed results, which show such connections to have both benefits and
drawbacks. The overall negative results of Fan et al. (2007) are understandable because the
negative effects of political connections dominate the positive ones. It will be interesting to
investigate the influence of political connections in Chinese publicly listed firms using our
sample, since there has been steady improvement in corporate governance mechanism on both
macro-environment level as well as firm-specific level. Due to such encouraging changes, we
predict the positive effects that political connections bring may play a dominant role, or at least
off-set the negative influences of such connections may carry.
In summary, the central idea of our study is to investigate the influence of corporate
governance on executive compensation, while considering the interactions existing among
corporate governance, firm performance and executive compensation. Additionally, we examine
the channels through which such impacts are exerted. As we conduct our research in the Chinese
market, special features in companies listed on it need to be taken into account. Therefore, we
further focus on the impacts of political connections on corporate governance, firm performance,
and potentially executive compensation. As this study is exploratory, we develop two sets of
research questions, instead of hypotheses, based on the agency theory. The main research
questions are:
Set one:
Does corporate governance affect firm performance in Chinese publicly listed firms?
Does corporate governance affect executive compensation in Chinese publicly listed firms?

26
Through which channel(s) does the monitoring function of corporate governance affect
executive compensation in Chinese publicly listed firms?
Set two:
Do political connections affect Corporate Governance in Chinese listed publicly firms?
Do political connections affect firm performance in Chinese publicly listed firms?
Do political connections affect executive compensation in Chinese publicly listed firms?

27
CHAPTER 3 DATA AND VARIABLES
3.1 Data
The data employed in this study are acquired from two sources. We follow Ding, et al.
(2009) and extract a majority part from datasets established by SINOFIN9 and GTA10, two
leading financial market data-collecting companies in China. The databases SINOFIN and GTA
published are well known for their accuracy, coverage and credibility. For instance, the very
popularly used database developed by GTA, China Stock Market and Accounting Research
Database (CSMAR), consists of more than 60 databases which cover the Chinese financial
market, industrial studies, and economic statistics on national as well as regional levels. The two
CSMAR datasets mainly used in our study are China Corporate Governance database and China
Financial Statements database. The China Corporate Governance Database contains various
aspects of corporate governance information of all listed companies on Shanghai and Shenzhen
Stock Exchanges, including company profiles, corporate governance activities, for example
board/supervisory board meetings and independent directors, ownership structure changes,
profile and the share nature of the 10 largest shareholders, profiles and annual salaries of top
management, and many more. The Financial Statement Database covers the financial
information of all companies listed on the Shanghai Stock Exchange and the Shenzhen Stock
Exchange from the year 1990 onwards under standardized financial data format, including
information from balance sheet, income statement, cash flow statement, statement of retained
earnings and more.
The other well known data vendor SINOFIN also provides databases that cover information
9 SINOFIN is developed by China Center for Economic Research (CCER) at Peking University. It provides information on Chinese economy and Chinese capital market. CCER was established by Peking University in 1994, with the purpose of further developing teaching, researching, and training. SINOFIN was established by CCER with many well-known professors, aiming for providing internationalized data services to foreign investors and academic researchers, and the “creation of transparent information”. 10 GTA is a major provider of Chinese real-time and historical economic and financial market data, as well as Chinese industry data. GTA provides data to international financial and educational institutions, and its products have been widely used in many research and studies.

28
on Chinese economy and Chinese capital market. The databases we adopt in our research
developed by SINOFIN are CCER China Corporate Governance Database, CCER China Stock
Market Database, and CCER China Financial Statement Database. All the above three databases
cover all the companies listed on Shanghai and Shenzhen Stock Exchanges since the early 1990s.
We use the databases developed by GTA and SINOFIN as complementarities to each other in
order to ensure the access to all the variables we need. All the databases are established under the
notion of guaranteed data quality and comparable database structure as American counterparts,
such as CRSP and Compustat. The quality of the databases has been very well acknowledged and
they are widely adopted in previous research on financial, accounting and economic issues of
China, which have been published on a variety of national and international journals. (Bai, et al.,
2004; Kato and Long, 2006; Firth et al. 2006; Firth et al., 2007; Fan et al., 2007; Jia, 2007)
A relatively small part of data, which is not obtainable from these databases, is manually
collected by four researchers from three Canadian universities and one Chinese university11. This
fraction includes the information on the status of political connections of the firm’s ultimate
controller, which is not available through either SINOFIN or GTA. The quality of the dataset we
are using is widely accepted. To further enhance the quality of our study, we performed
cross-checking during the process of data hand-collecting to ensure the consistency between our
data sample and the original information disclosed in the published corporate annual reports,
which can be found on the official website of China Securities Regulation Commission12.
The data used in this study are from Year 2001 to Year 2006 with over 1,400 observations
in each year. Several important events happened within this period. In 2001 the Guidelines for
Introducing Independent Directors to the Board of Directors of Listed Companies was issued by
CSRC and independent directors were officially adopted in the Chinese corporate governance
system. In 2005 the Corporate Law 1993 was amended and became effective on January 1st 2006,
further enhancing the monitoring function provided by the supervisory board. Therefore, we
believe our data sample carries relevant information on the above significant legal changes.
One thing which should be noted here is that the information on individual compensation is
only available after 2005. Such information includes the payment to each director on the board,
11 These four researchers are Dr. Shujun Ding at York University, Dr. Yuanshun Li at Ryerson University, Dr. Chunxin Jia at Peking University, and Dr. Zhenyu Wu at the University of Saskatchewan. We would like to thank them for letting us use part of the data they manually collected from over 7,000 annual reports of Chinese publicly listed companies. 12 Official website of China Securities Regulatory Commission: www.csrc.gov.cn

29
each supervisor on the supervisory board, and each executive on the top management team.
Before 2005, only information about group compensations of directors, supervisors, and top
management team was required to be disclosed in the annual reports of the listed companies. For
instance, they disclosed the total compensation of the 3 directors who receive the highest
payments on the board, the total compensation of the 3 senior managers who receive the highest
payments on the top management team, and the total compensation of all the incumbent directors,
supervisors, and top management team members. Due to such data limitation, we only adopted
the latter three compensation information in our study, which will be further discussed in the
following sections.
3.2 Variables
We introduce the dependent, independent, and control variables in this sub-section. The
control variables we include in this study are consistent with the previous literature such as Firth
et al. (2006, 2007) and Ding, et al. (2009).
3.2.1 Dependent Variables
We use two sets of dependent variables in this study. One set of variables are the
measurements for firm performance, and the other set includes the executive compensation
variables. These two sets of dependent variables are respectively used for testing the monitoring
effects of corporate governance mechanism on firm performance in publicly listed Chinese firms,
and examining their monitoring functions on agency problems between the managers and
shareholders within those same companies. We use the market return (MR) as the measurement
for firm performance to test the effect of corporate governance on firm performance. The
variable market return is measured by annual stock return with dividends13.
According to the Code of Corporate Governance for Listed Firms in China, the listed
companies should establish an incentive rewarding system that ties the management
compensation with the firm and individual working performance together. Board of directors is
responsible for approving the performance assessment and further disclosing and explaining the
results to the shareholders. Corporate Law clearly states that determining the compensation
received by the top management to be a duty of the board of directors. Differently, the
compensations received by the directors are proposed by the board of directors and approved by
13 An alternative proxy for firm performance is return on asset (ROA), which we use for checking the robustness of our results. No qualitative change was found.

30
the shareholders’ meeting. Addressed in Corporate Law, one of the authorities that shareholders’
meeting shall exercise is to determine the issues concerning the remunerations of directors and
supervisors. Previous studies (Kato and Long, 2006, Firth et. al. 2006) use CEO compensation or
average rate of compensation of top 3 executives in their research to test the pay-performance
relationship in Chinese publicly listed firms. In this study, we will employ compensations for
various groups of executives, including (1) total compensation received by all executives,
including directors, supervisors, and senior management team (PayTotal), (2) the sum of the
three highest compensation amounts received by the board members (PayBtop3), and (3) the sum
of the three highest compensation amounts received by the members on the management team
(PayMtop3). In other words, we include compensations received by board members and the top
management team separately, and also total compensation received by all groups of executives.
Monitoring function is expected to have two different effects on executive compensations.
According to Vafeas (1999), monitoring provided through corporate governance system impacts
the firm performance, which partially determines the executive compensation (Corporate Law,
2005; Kato and Long, 2006). The other effect of monitoring is to discipline the executives’
behaviors, to reduce management discretion, and to avoid over-pay (Chen et al., 2006; Firth et al.,
2007; Ding et al., 2009). In the current study we employ different dependent variables to
measure various groups of executives’ pays, in the hope of separating the two monitoring
functions from each other. Doing so also helps further investigate the monitoring effects on
different groups of executives’ compensations.
Following the literature (Firth et al. 2006, 2007; Ding, et al., 2009), we use the
compensation variables in the form of natural logarithm. To deal with the zero values of some of
the compensation variables appearing in the sample, we add the value of one to each
compensation value and then take the nature logarithm of the sum. Mathematically, the
compensation variable is defined as
L n ln( 1).compensation compensation= +
One thing which should be mentioned again is that the executive compensation employed in
this study is in the form of cash only. Previous studies on Chinese market indicate that cash
compensation to executives dominates the use of stock options, and furthermore, the information
disclosure on the stock options granted to the executives is very limited in the Chinese publicly
listed firms (Firth et al., 2006; Kato and Long, 2006; Ding, et al., 2009). Therefore, we simply

31
follow the previous literature (e.g., Firth et al., 2006; Kato and Long, 2006; Ding et al., 2009)
and use only the cash compensation for the executives.
3.2.2 Independent Variables
Following the previous literature on board monitoring (Hermalin and Weisbach, 1988;
Jensen, 1993; Vafeas, 1999), we consider several board characteristics which have been shown to
have influence on the effectiveness of corporate governance system, including the percentage of
directors who are independent and board meeting frequency. In this study, we focus on
investigating the monitoring function provided by the supervisory board and independent
directors within the Chinese corporate governance mechanism. Therefore, we use supervisory
board meeting frequency (SBMF) to capture the monitoring activities of the supervisory board,
and we use the proportion of independent directors on the board (ID) to explore the monitoring
role played by the independent directors in Chinese listed firms. Board meeting frequency (BMF)
is as well included following the literatures to examine the board monitoring functions.
The variable SBMF and BMF are defined as the number of supervisory board meetings per
year and the number of board meetings per year, respectively, following the definition of board
meeting frequency given by Vafeas (1999) who studies the board monitoring function in large
publicly listed firms. SBMF and BMF are both continuous variables. ID measures the portion of
the board directors who are independent, and its value is within the range from 0 to 1.
There are several issues which need to be further considered when we use the above
independent variables. According to previous research on the board’s monitoring function,
several factors, including the past firm performance (Vafeas, 1999) and firm’s risk-taking
behaviors (Wu, Li, Ding, and Jia, 2009), may affect the board meeting frequency. It is illustrated
in Vafeas (1999) that the current year board meeting frequency is negatively related to the
past-year firm performance, since an increase in board activities results from the attempts of
helping the firm cope with various problems causing a poor performance. In addition, Jensen
(1993) suggests board size to be another factor which may influence the functionality of the
board of directors, because the larger the board, the less effectively the board will function and
the easier CEO can gain control. Thus, following Vafeas (1999) and Wu and Chua (2009), we
further separate the monitoring-induced boarding meeting frequency (MIBMF) from the
performance-risk-and-size-induced board meetings, the monitoring-induced supervisory board
meeting frequency (MISBMF) from the performance-risk-and-size-induced supervisory board

32
meetings, and the monitoring-induced independent director portion (MIID) from the
performance-risk-and-size-induced independent director portion. The model we use to perform
such separation is discussed in Chapter 4 in detail.
3.2.3 Control Variables
We include five groups of control variables for capturing important and special features of
the Chinese publicly listed firms. These five groups of variables are firm performance and risk
measurements, board of directors/supervisory board characteristics variables, agency variables,
ownership structure measurements, and some other control variables that do not fall into any
categories mentioned above.
3.2.3.1 Firm performance and risk
Firm performance and risk-taking behavior of a firm may have double folded effects on the
executive compensations. First, since the current year firm performance is partially dependent on
the past year performance, we use past year firm performance as a control variable to test
potential influence of corporate governance on firm performance. Second, as mentioned before,
firm performance and risk taken by the firm from the past year may affect the board and
supervisory board meeting frequency and the proportion of the independent directors sitting on
the board. For these reasons, the firm performance and the risk variables are used to separate the
monitoring-induced corporate governance activities from the non-monitoring-induced
component, and are two of the control variables in investigating the monitoring effects of
corporate governance on firm performance.
It has been shown that the profitability of a company impacts its market performance
significantly. Therefore, following Yermack (1996), we adopt return on assets from the previous
year (LagROA) as a proxy for the past year firm performance. The risk variables applied in this
study include the debt-to-asset ratio (DTA) which measures financial leverage and represents the
bankruptcy risk of the firm in the current year, and (LagDTA) for the year before. Similarly, we
also employ the standard deviation of stock returns (Sigma) to measure the total risk taken by the
firm’s shareholders in the present year, and (LagSigma) for the year before.
3.2.3.2 Characteristics of board of directors and supervisory board
One of the most important characteristics of a board, either the board of directors or
supervisory board is its size. Addressed by Jensen (1993) which claims that large boards may
lead to inefficiency, and further supported by empirical studies such as Yermack (1996) and

33
Eisenberg et al. (1998), an inverse relationship between board size and firm value is
demonstrated across different classes of firms in different countries. Thus, we include the size of
board of directors (Bsize) and the size of supervisory board (SBsize) in our analysis. The
variable Bsize measures the total number of directors on the board in each firm, and SBsize is a
variable measuring the total number of members sitting on the supervisory board.
3.2.3.3 Agency Variables
The combined position of the CEO and chairman of the board has attracted much attention
and discussion. Addressed in Jensen and Meckling (1976), one of the major reasons causing
agency problems between owners and managers is the separation of ownership and control.
Upon separation, management has the incentive to maximize personal benefit at the expense of
the owner’s interests. In some of the Chinese publicly listed companies, CEO also performs as
chairman of the board of directors. Such duality may have two different effects on the
effectiveness of corporate governance. On one hand, since the firm’s controlling shareholders
frequently have representatives sitting on the board of directors (Ding et al., 2009), combining
the positions of CEO and board chair may potentially lead to a combination of management and
ownership and therefore reduce the underlying agency cost. On the other hand, as suggested by
many researchers (e.g. Jensen, 1993; Goyal and Park, 2002), as the CEO holds the position of the
board chair as well, the independence of the board is compromised and it becomes very difficult
for the board to remove the poorly performed CEOs. Under such situation the corporate
governance efficiency is lowered. To capture the possible effects of the CEO-board-chair duality,
therefore, we include a dummy variable (Duality) which takes the value of one if CEO and board
chair are the same individual, and zero otherwise. This control variable is also adopted by
previous research in this stream of literature, such as Bai, et al., (2004), Chen et al., (2006), Firth
et al., (2007), Ding et al., (2009) and Jia, et al., (2009).
In addition, big CPA firms, such as the Big 4, are sometimes found to improve the
credibility of the firm’s financial statements and therefore are considered to have a positive
signaling effect in the market (Firth et al. 2007). In our study, a dummy variable (Audit) is
included to capture the auditing practice of the Chinese publicly listed firms. It takes the value of
one if the auditing of the listed firm is performed by one of the Big 4 CPA firms, and zero
otherwise.

34
3.2.3.4 Ownership structure
Ownership structure is proved to have certain impacts on the firm performance. Large
shareholders help improve monitoring over the management, however on the other hand, have
incentive to expropriate small shareholders (Jensen and Meckling, 1976; Morck, et al., 1989;
Shleifer and Vishny, 1997). A special case appearing within the Chinese publicly listed firms is
the existence of dominant shareholders who are usually directly or indirectly related with
government or government-affiliated organizations. Another unique feature of the Chinese stock
market is the existence of non-tradable shares. According to Firth et al. (2006), three major
classes of shares exist in the Chinese stock market. One class is the state shares owned by the
central and local governments, and SOEs. The second class is legal person shares held by the
legal entities, which are frequently ultimately controlled by government. State shares and legal
person shares are non-tradable on the stock market. The third class is tradable shares possessed
by private institutions and individual investors. As indicated by Firth et al. (2006), on average
state shares, legal person shares, and tradable shares each comprises about one-third of shares
issued by the Chinese publicly listed firms.
In summary, we include four ownership structure variables in order to capture the special
ownership structure features of the Chinese publicly listed firms. The first and second ones are
respectively the largest shareholder’s ownership in percentage (Largest), and the ownership held
by government and/or government-affiliated agencies (SOE). Following Firth et al. (2006), we
also include the percentage of tradable common shares (Tradable) in the analysis to take the
unique features carried by non-tradable shares into consideration. Finally, following Chen et al.
(2006) and Ding, et al. (2009), we include the Herfindahl index (HHI) for the largest ten
shareholders excluding the largest one, to measure the ownership concentration. It is calculated
using the formula
102
2
,kk
HHI s=
=∑
where ks represents the ownership held by the kth largest shareholder in percentage
measurement.
3.2.3.5 Other control variables
Prior research (Conyon, 1997; Firth et al., 2006) has shown a significantly positive link
between the CEO’s compensation and firm size. Therefore, we consider firm size as one of the

35
important control variables to be included in our study. Firm size is measured by the natural
logarithm of the book value of firm’s total assets (LnTA).
One other set of control variables popularly used is the industry dummies, which capture the
industry effects. According to the industries categorization issued by CSRC14, 13 industries are
categorized and therefore 12 industry dummy variables are constructed and included in the
analysis. In this study we have excluded all listed firms that are within the financial industries.
The last sub-category of control variables in our study is the year dummies. Similar to the
industry dummies, the year dummy variables help control the year and macro-level effects on the
firm’s corporate governance system, firm performance and executive compensation. Our data
sample covers the time period from 2001 to 2006, and thus five year dummy variables are
included in the analysis.
3.2.4 Political Connection Variables
A unique feature of the Chinese listed firms is their close relationship with the government.
Therefore, we propose to test the influence of political connections on corporate governance,
firm performance and executive compensation in our study. Following Fan et al. (2007), we
identify political connections both existing presently and formerly. However, different from Fan
et al. (2007), we adopt the political connection of the firm’s ultimate controller to investigate the
effect of political connections on executive compensation instead of using the political
connection of CEOs. One of the major reasons of doing so is that the different types of the
controlling shareholders within the publicly listed firms in China are shown to have various
influences on the application of incentive pay (Firth et al. 2006), and the influence of distinct
types of ultimate controllers seems to be more powerful than the influence of individual
executives (Firth, et al., 2007). The political connection of the ultimate controller (POLITICAL)
is adopted in our study as a dummy variable which has the value of one if the ultimate controller
has a background of government and/or military, and zero otherwise.
14 According to the industry categorizations issued by CSRC, there are 13 different industries in China. They are agriculture, industry 1; mining, industry 2; manufacture, industry 3; electricity, industry 4; construction, industry 5; transportation, industry 6; IT, industry 7; wholesale and retail, industry 8; banking, industry 9; real estate, industry 10; service, industry 11; media, industry 12; and conglomerate, industry 13.

36
CHAPTER 4 METHODOLOGY
The main issues examined in the current study are the effects of corporate governance
mechanism in China on the performance of Chinese publicly listed firms and on their executive
compensations. As mentioned in the introduction section, there exist interactions between the
corporate governance practice and firm performance. To take such interactions into account, we
adopt multi-stage models to test how corporate governance and firm performance jointly
influence the executive compensations. The models we use are similar to the methodology
employed in Vafeas (1999) and Wu and Chua (2009), and we further develop the model to better
accommodate the research questions raised in our study and the special features of the Chinese
market.
4.1 Testing Corporate Governance – Performance Relationship
As mentioned in Section 3.2.2, certain factors influence the corporate governance practices
of a firm. The major elements include firm performance from the previous year, the risk-taking
behaviors of the firm in the past year, and the sizes of the board of directors and the supervisory
board. Therefore, we consider it essential to separate the monitoring-induced corporate
governance activities from such effects brought by these factors. The first stage of testing the
relationship between corporate governance and firm performance is the OLS regressions using
BMF/SBMF/ID as dependent variables:
0 1
2
3
4
5
6
/ / *
*
* /
*
*
*
BMF SBMF ID Lagged Firm Performance
Lagged Risk Variables
Board Supervisory Board Characteristics Variables
Agency Variable
Ownership Structure Variables
Other Control Variables
α αααααα ε
= ++++++ + 1. (1.1)
Equation (1.1) is used to exercise such a separation. Residuals of the corresponding dependent
variables, BMF_RES, SBMF_RES, ID_RES, are generated by estimating 1ε . BMF_RES,
SBMF_RES, ID_RES are residuals free from impacts of the past firm performance, past firm

37
risk-taking behaviours, the sizes of two boards, and other explanatory factors. Thus, the three
residuals are considered to be good representatives to measure monitoring-driven corporate
governance activities. We correspondingly rename these residuals as MIBMF, MISBMF, and
MIID as addressed in Section 3.2.2, which is to say:
1/ / .MIBMF MISBMF MIID ε=
The second stage of the model is to test the relationship between monitoring function
offered by corporate governance system and firm performance. The OLS regression uses the
firm’s market performance as the dependent variable, adopts residuals from stage 1 as the
independent variables, and includes other control variables. Technically, the second stage is
described as the following:
0 1 2 3
4
5
6
7
8 2
* * *
*
*
*
*
* .
Firm Performance MIBMF MISBMF MIID
Lagged Firm Performance
Risk Variables
Agency Variable
Ownership Structure Variables
Other Control Variables
β β β ββββββ ε
= + + ++++++ + (1.2)
where the dependent variable Firm Performance is represented by the market return (MR).
4.2 Testing Corporate Governance / Performance – Pay Relationship
As addressed in the previous sections, the corporate governance activities can be jointly
determined by the size of board of directors/supervisory board, the firm performance and the risk
taken by the firm from the past year, and other control variables. We have explained the great
importance of separating the monitoring-driven corporate governance activities from the above
effects. One may ask how the corporate governance practice affects executive compensations
specifically. To answer this question, we try to examine whether corporate governance activities
impacts the executive compensation directly, or indirectly through firm performance, or both.
Therefore, two tests are conducted to further investigate the subtle monitoring effects. The model
we adopt to test how corporate governance and firm performance affect executive compensation
while including the interactions between corporate governance and firm performance is a
three-stage model with Models (1.1) and (1.2) as Stages 1 and 2, respectively.
The same as before, the residuals variables, MIBMF, MISBMF, MIID, are generated from
Model (1.1). To conduct Stage 3, we estimate the residual variable 2ε from Model (1.2) above

38
and assign PERF_RES to be its name. We also predict the fitted value of Firm Performance,
F_PERF. The third stage is an OLS model using executive pays as the dependent variables, and
we have three of them: Ln(PayTotal), Ln(PayBtop3), and Ln(PayMtop3). There are two different
models in this stage, with each focusing on a different path through which executive
compensations can be influenced by monitoring effects.
0 1 2 3
4 5
6
7
8 3
* * *
* _ *
*
*
* .
LnCompensation MIBMF MISBMF MIID
PERF RES Risk Variables
Agency Variable
Ownership Structure Variables
Other Control Variables
δ δ δ δδ δδδδ ε
= + + ++ ++++ + (2.1)
0 1
2
3
4
5 4
* _
*
*
*
* . (2.2)
LnCompensation F PERF
Risk Variables
Agency Variable
Ownership Structure Variables
Other Control Variables
φ φφφφφ ε
= +++++ +
As addressed above, the three-stage model composed of Equation (1.1), (1.2) and (2.1)
allows us to investigate the relationship among corporate governance, firm performance and
executive compensation while we take into consideration the interactions between the corporate
governance activities and firm performance. Model (2.1) helps show how the monitoring-driven
corporate governance activities, MIBMF, MISBMF, and MIID, influence the executive
compensation. As mentioned previously, we anticipate the monitoring function to affect
executive compensation in two ways. One way is that monitoring helps improve the firm
performance, and due to the compensation is partially based on firm performance, such
improvement leads to an increase in the executive compensation. The other way is that
monitoring helps discipline the behaviors of the executives and reduce the occurrence of
over-pay. Therefore, if 1δ , 2δ and 3δ take positive signs, we confirm that the first monitoring
effect is of more power. If 1δ , 2δ and 3δ are negatively significant, however, the second
aspect of the monitoring effects dominates the first one. Model (2.2) helps to show how firm
performance impacts the executive compensation. Put it differently, model (2.2) helps us confirm
whether the corporate governance activities affect the executive pay through firm performance.

39
4.3 Testing the Influence brought by Political Connections
One of the special features of the Chinese listed firms is that the political connection
between a firm and government is quite prevalent. Therefore, we propose to test the effects of the
political connections on corporate governance practice, performance, and executive
compensations in Chinese publicly listed firms. Fan et al. (2007) claim the political connections
of CEO lower the efficiency of corporate governance because the professionalism of board of
directors is compromised, and find a negative effect of political connections on firm performance
in the Chinese market. However, Faccio (2006) and Hillman (2005) demonstrate a positive
relationship between political connections and firm performance. The interactions observed
among political connections, corporate governance, and firm performance may lead to a potential
endogeneity problem.
In order to test the influence of political connections on firm performance and executive
compensation, we adopt a similar three-stage model as introduced in section 4.2 to take into
consideration the potential interactions among corporate governance, firm performance and
political connections. Stage 1 tests the effect of political connections on corporate governance
characteristics while including the possible impacts of the previous year’s financial performance
and risk-taking behaviours, as well as current board/supervisory board size, on current year’s
corporate governance activities. It is described as follows:
0 1
2
3
4
5
6
/ / *
*
*
* /
*
*
BMF SBMF ID Political Connection Variable
Lagged Firm Performance
Lagged Risk Variables
Board Supervisory Board Characteristics Variables
Agency Variable
Ownership Structure Vari
µ µµµµµµ
= ++++++
7 5* . (3.1)
ables
Other Control Variablesµ ε+ +
where the Political Connection Variable is the political connection of the company’s ultimate
controller (POLITICAL). By estimating5ε , the residual variables, BMF_RES, SBMF_RES, and
ID_RES, are generated respectively for measuring the monitoring functions of the corporate
governance system.
Stage 2 investigates the impacts of political connections and the monitoring effects of the
corporate governance system on firm performance. The market return (MR) is used as the

40
dependent variable, political connections and residuals from Stage 1 as the independent variables,
and other control variables are also included. The Stage 2 model is the following,
0 1
2
3
4
5
6
7
*
* 1
*
*
*
*
*
Firm Performance Political Connection Variable
Residual from Stage
Lagged Firm Performance
Risk Variables
Agency Variable
Ownership Structure Variables
Other Control Variable
ρ ρρρρρρρ
= +++++++ 6. (3.2)s ε+
Similarly, we estimate 6ε and generate residual variable PERF_RES, representing the factors
that cannot be captured by either political connections or the monitoring functions provided by
corporate governance mechanism.
The third stage helps us investigate the influence of political connections on executive
compensations. Model (3.3) enables us to examine the overall effects of political connections on
the executive compensation, it is
0 1
2
3
4
5
6
7 7
*
* 1
* _
*
*
*
* .
LnCompensation Political Connection Variable
Residuals from Stage
PERF RES
Risk Variables
Agency Variable
Ownership Structure Variables
Other Control Variables
π πππππππ ε
= +++++++ + (3.3)
The three-stage model composed of Equation (3.1), (3.2), and (3.3) helps us first handle the
potential endogeneity problem and then investigate the combined influence of political
connections on firm performance and on executive compensation.
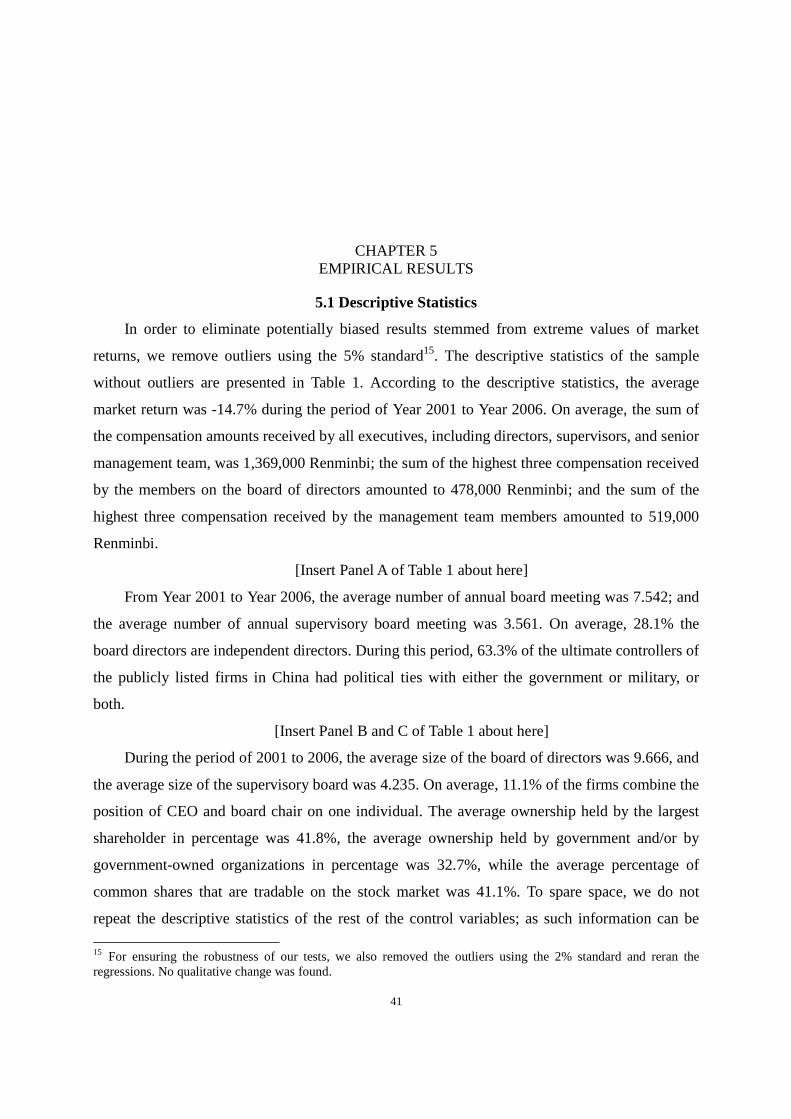
41
CHAPTER 5 EMPIRICAL RESULTS
5.1 Descriptive Statistics
In order to eliminate potentially biased results stemmed from extreme values of market
returns, we remove outliers using the 5% standard15. The descriptive statistics of the sample
without outliers are presented in Table 1. According to the descriptive statistics, the average
market return was -14.7% during the period of Year 2001 to Year 2006. On average, the sum of
the compensation amounts received by all executives, including directors, supervisors, and senior
management team, was 1,369,000 Renminbi; the sum of the highest three compensation received
by the members on the board of directors amounted to 478,000 Renminbi; and the sum of the
highest three compensation received by the management team members amounted to 519,000
Renminbi.
[Insert Panel A of Table 1 about here]
From Year 2001 to Year 2006, the average number of annual board meeting was 7.542; and
the average number of annual supervisory board meeting was 3.561. On average, 28.1% the
board directors are independent directors. During this period, 63.3% of the ultimate controllers of
the publicly listed firms in China had political ties with either the government or military, or
both.
[Insert Panel B and C of Table 1 about here]
During the period of 2001 to 2006, the average size of the board of directors was 9.666, and
the average size of the supervisory board was 4.235. On average, 11.1% of the firms combine the
position of CEO and board chair on one individual. The average ownership held by the largest
shareholder in percentage was 41.8%, the average ownership held by government and/or by
government-owned organizations in percentage was 32.7%, while the average percentage of
common shares that are tradable on the stock market was 41.1%. To spare space, we do not
repeat the descriptive statistics of the rest of the control variables; as such information can be
15 For ensuring the robustness of our tests, we also removed the outliers using the 2% standard and reran the regressions. No qualitative change was found.
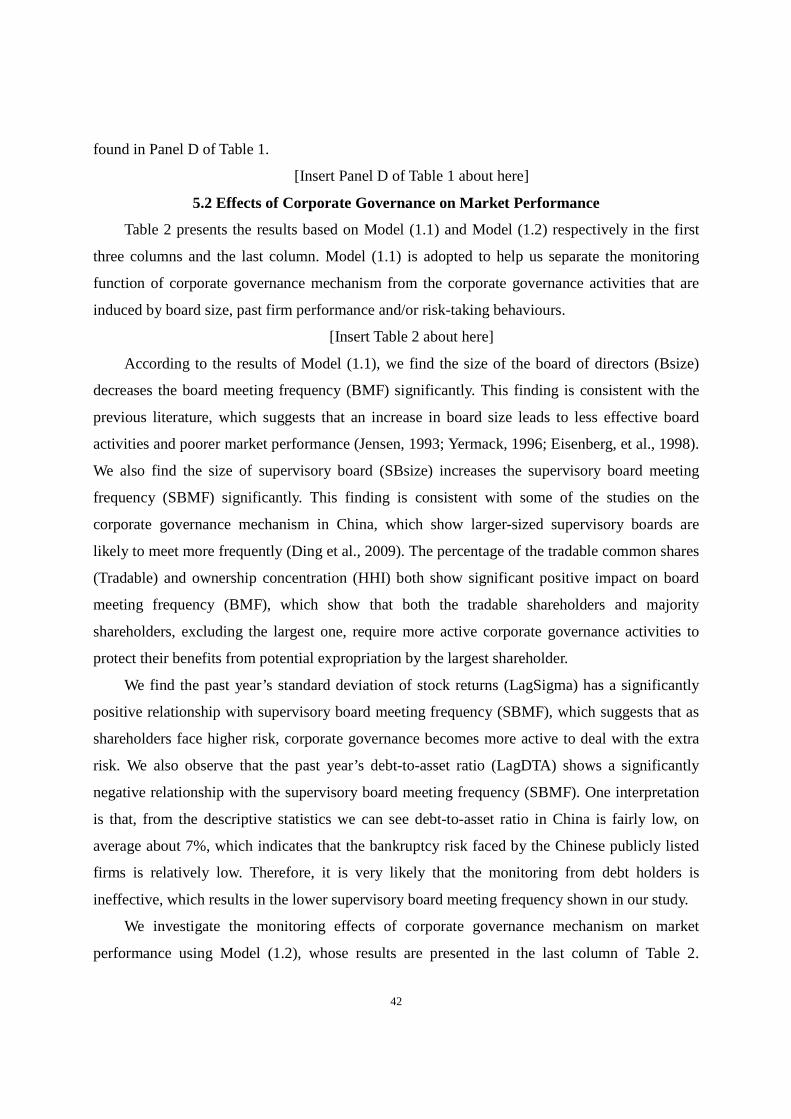
42
found in Panel D of Table 1.
[Insert Panel D of Table 1 about here]
5.2 Effects of Corporate Governance on Market Performance
Table 2 presents the results based on Model (1.1) and Model (1.2) respectively in the first
three columns and the last column. Model (1.1) is adopted to help us separate the monitoring
function of corporate governance mechanism from the corporate governance activities that are
induced by board size, past firm performance and/or risk-taking behaviours.
[Insert Table 2 about here]
According to the results of Model (1.1), we find the size of the board of directors (Bsize)
decreases the board meeting frequency (BMF) significantly. This finding is consistent with the
previous literature, which suggests that an increase in board size leads to less effective board
activities and poorer market performance (Jensen, 1993; Yermack, 1996; Eisenberg, et al., 1998).
We also find the size of supervisory board (SBsize) increases the supervisory board meeting
frequency (SBMF) significantly. This finding is consistent with some of the studies on the
corporate governance mechanism in China, which show larger-sized supervisory boards are
likely to meet more frequently (Ding et al., 2009). The percentage of the tradable common shares
(Tradable) and ownership concentration (HHI) both show significant positive impact on board
meeting frequency (BMF), which show that both the tradable shareholders and majority
shareholders, excluding the largest one, require more active corporate governance activities to
protect their benefits from potential expropriation by the largest shareholder.
We find the past year’s standard deviation of stock returns (LagSigma) has a significantly
positive relationship with supervisory board meeting frequency (SBMF), which suggests that as
shareholders face higher risk, corporate governance becomes more active to deal with the extra
risk. We also observe that the past year’s debt-to-asset ratio (LagDTA) shows a significantly
negative relationship with the supervisory board meeting frequency (SBMF). One interpretation
is that, from the descriptive statistics we can see debt-to-asset ratio in China is fairly low, on
average about 7%, which indicates that the bankruptcy risk faced by the Chinese publicly listed
firms is relatively low. Therefore, it is very likely that the monitoring from debt holders is
ineffective, which results in the lower supervisory board meeting frequency shown in our study.
We investigate the monitoring effects of corporate governance mechanism on market
performance using Model (1.2), whose results are presented in the last column of Table 2.

43
According to the results, none of the monitoring functions of board meeting frequency (MIBMF),
supervisory board meeting frequency (MISBMF), and the independent directors (MIID) shows
significant impacts on market performance. Such results suggest that the monitoring function of
Chinese corporate governance mechanism is not sufficiently effective to lead to an improved
firm performance.
Several other variables have significant impacts on market performance, including firm
performance from last year (LagROA), current year’s risk taking behaviours (Sigma), Largest
shareholder’s ownership (Largest), firm size (LnTA); and the type of Auditing firm (Audit)
marginally (at the 10% significance level) affects market performance as well.
5.3 Effects of Corporate Governance on Executive Compensation
Table 3 presents the results of Stage 3 which investigates the effects of corporate
governance on executive compensation, based on the first two stages modelled by Equations (1.1)
and (1.2). The effects of the monitoring function of corporate governance on executive
compensations in Chinese publicly listed firms are tested using Model (2.1) and illustrated in the
first three columns of Table 3. In the meantime, the effects of market performance on executive
compensations are tested by Model (2.2) and presented in its last three columns.
From the results of Model (2.1), we observe that the monitoring function of the independent
directors (MIID) shows a significantly positive relationship with the total pay of all executives,
and with the sum of the highest three compensations received by management team members.
In the meantime, the monitoring effect of the supervisory board (MISBMF) shows a significantly
positive relationship with the total pay of all executives, and a marginally positive relationship
with the sum of the highest three compensations received by board members. According to the
results shown in the last three columns of Table 3, market performance shows a significantly
positive impact on all three categories of executive compensations. The strong positive
relationships between market performance and executive compensations are consistent with the
previous literature, and also with the process of the compensation reform16 in Chinese publicly
listed companies.
The results from all four regressions in the 3-stage model suggest that the corporate
governance mechanism is dysfunctional in curbing the executive pays in Chinese publicly listed
16 The performance-based compensation, usually in the form of cash bonuses, is implemented gradually throughout the country (Liu and Otsuka, 2004; Kato and Long, 2006; Firth, et al., 2006; Ding, et al., 2009).

44
firms, rather than increasing them through improving the firm performance. The reasons behind
such interpretation may include the following: first, we do not find a significant relationship
between corporate governance mechanism and market performance from Model (1.2), which
suggests that the corporate governance system is not effective so that it does not improve firm
performance. Second, since China is still an underdeveloped market which is far from mature,
there exist special reasons which may contribute to such effects. Previous studies have argued
that the monitoring organs in the Chinese corporate governance system at least do not work
(Xiao et al., 2004; Xi, 2006), and our findings are consistent with them and suggest that both
monitoring organs are dysfunctional in the Chinese publicly listed firms. With the special
features of the Chinese market, such as the weak legal protection, unique ownership structure,
and political connections, these results are not surprising at all. A summary of our main findings
on the effects of corporate governance on firm performance and executive compensation in the
Chinese publicly listed firms is presented in Figure1.
[Insert Table 3 about here]
[Insert Figure 1 about here]
We also find that the sum of the top 3 compensations received by board members and the
sum of the top 3 compensations received by members in the management team increase
significantly if the board chair also serves as CEO of the firm (Duality). This is consistent with
the findings of prior studies which suggest that the combination of the two positions leads to less
independent boards and ineffective corporate governance (Jensen, 1993; Goyal and Park, 2002).
The type of the auditing firms (Audit) also shows a significantly positive relationship with
executive compensations. Such relationship, together with the marginally positive effect of the
variable Audit on market performance, can be interpreted as a positive signaling effect carried by
the Big 4 CPA firms for auditing.
Other variables, such as the largest shareholder’s ownership (Largest), the government held
ownership (SOE), financial leverage in the current year (DTA), and firm size (LnTA), are also
shown to have significant influence on executive compensations. These results are also
consistent with prior literatures (Firth et al., 2006; Ding et al., 2009).
5.4 Effects of Political Connections of Ultimate Controllers
Due to the prevalent existence of political ties between the Chinese publicly listed firms and
the government and/or military, we focus on the effects that such political connections bring to

45
corporate governance, firm performance and executive compensation in this subsection. The
political connection we study here is the political connection of the firm’s ultimate controller
(POLITICAL). The effects of political connections of ultimate controllers on corporate
governance mechanism tested by Model (3.1) are presented in the first three columns of Panel A
of Table 4. Each column illustrates one aspect of corporate governance mechanism, such as
board meeting frequency (BMF), supervisory board meeting frequency (SBMF), and the portion
of board member as independent directors (ID). The very last column of Panel A presents the
effects of political connections on market performance, which is examined by adopting Model
(3.2).
[Insert Panel A of Table 4 about here]
The results are interesting. First, findings show that the political connections of ultimate
controllers of Chinese publicly listed companies significantly decrease the board meeting
frequency at the 0.1% significance level, reduce the supervisory board meeting frequency at the
5% significance level, and lower the portion of independent directors sitting on the board at the
1% significance level. These results show that, the political connections of ultimate controllers
decrease the efficiency and deteriorate the functionality of the corporate governance mechanism
in China significantly. Control variables show consistent results with previous findings.
Different from the findings of Fan et al. (2007) who focus on the political connections of
CEOs using the Chinese data from an earlier time period, the results of Model (3.2) shown in the
last column of Panel A of Table 4 suggest that the market performance of Chinese publicly listed
companies is not affected by the political connections of their ultimate controllers, nor is
influenced by the monitoring functions of the corporate governance. These findings are of
interest and consistent with the results of Model (1.2). As addressed in the previous sections,
political connections may influence market performance in two ways: first, according to prior
studies (Shleifer and Vishny, 1997; Fan et al., 2007), the lower effectiveness of corporate
governance mechanism may result in poor market performance. Thus, it is natural to expect
lower market returns caused by the political ties of the ultimate controllers. Second, having
political connections may send a strong positive signal to the market since political ties have
been conclude to serve as an insurance of easier access to capital, higher likelihood of getting
financial bailouts, as well as providing potential inside policy information (Khwaja and Mian,
2005; Faccio, et al., 2006; Bunkanwanicha and Wiwattanakantang, 2009). These two potential

46
effects of political connections on market performance may offset, and the empirical results show
that this is what occurs. It is noteworthy that these findings are different from those from the
previous studies, some of which show positive effects and some show negative ones (e.g.
Bunkanwanicha and Wiwattanakantang, 2009; Fan, et al., 2007).
Panel B of Table 4 illustrates the empirical results of the impacts of the ultimate controllers’
political connections on executive compensation based on Model (3.3). The findings suggest that
the political connections of ultimate controllers in Chinese publicly listed companies do not
influence any of the three compensation variables we adopt. Due to the special features of the
underdeveloped Chinese market, however, it is critical to further investigate this issue using
some appropriate robustness tests. We summarize our main findings on the effects of political
connections on corporate governance, firm performance and executive compensation in the
Chinese publicly listed firms in Figure 2.
[Insert Panel B of Table 4 about here]
[Insert Figure 2 about here]
5.5 Effects of Political Connections of Ultimate Controllers—Robustness Tests
While the results in the above sub-section do not show a significant political-connection
effect on firm performance or on executive compensation, it is worth further investigating the
interactions between two major features of Chinese publicly listed firms, political connections of
ultimate controllers and state ownership.
In the Chinese market, the association of a firm with government or government-owned
organizations is reflected through two variables. One is the political connection of ultimate
controller (POLITICAL), which directly measures the ultimate controller’s current and/or former
connections with government and/or military. The other variable is the ownership held by
government and/or government-owned organizations (SOE), which indirectly reflects the
relationship between the firm and government. In this sub-section, we further examine the effects
of political connections by forming four sub-samples using the above two variables. We subset
our research sample by SOE first to allow us testing the subtle effects of political connections on
executive compensations within firms that have no government-owned shares (SOE=0) and
firms that have government ownership (SOE>0). We then further subset these two sub-groups by
identifying whether the ultimate controller of the firm shows a political connection
(POLITICAL=1) or not (POLITICAL=0). By doing so we form a 2 by 2 matrix which includes

47
four subsamples, each of which has different levels of SOE and/or POLITICAL from the rest
three groups. These four subsamples are: one that has neither government ownership nor political
connections of ultimate controllers (SOE=0 & POLITICAL=0), one that has no government
ownership but shows political connections of ultimate controllers (SOE=0 & POLITICAL=1),
one that has government ownership but no political connections of ultimate controllers (SOE>0
& POLITICAL=0), and the last one that shows government ownership as well as political
connections of ultimate controllers (SOE>0 & POLITICAL=1).
Table 5 presents the results of our test within all the firms that have no government-owned
shares (SOE=0). Panel A of Table 5 illustrates the results of Models (3.1) and (3.2) using the
firms that have neither government ownership nor political connections of ultimate controllers
(SOE=0 & POLITICAL=0). Panel B of Table 5 illustrates the results of Models (3.1) and (3.2)
using the firms that have no government ownership but have politically-connected ultimate
controllers (SOE=0 & POLITICAL=1). Consistent with previous results, we still find that board
size (Bsize), supervisory board size (SBsize), stock return volatility in the past year (lagSigma),
the percentage of tradable common shares (Tradable), and firm size (LnTA) significantly impact
the activism of corporate governance. The results of Model (3.2) in Panel B show that the
monitoring function of independent directors (ID_RES) increases market performance at the 5%
significance level, while in Panel A no impact of the monitoring functions of corporate
governance on market performance is found. Such results indicate that within firms that have no
government ownership but have political connections, independent directors, as one of the major
monitoring organs, demonstrate their effectiveness and help improve firm performance
significantly.
[Insert Panel A and B of Table 5 about here]
Panel C of Table 5 illustrates the results based on Model (3.3) within the firms that have no
government ownership (SOE=0), with the results of non-politically connected firms
(POLITICAL=0) in the first three columns and the results of politically connected firms
(POLITICAL=1) in the last three columns. According to the results, we find that when firms
have neither government-owned shares nor political connections (SOE=0 & POLITICAL=0), the
independent directors (ID_RES) show a significantly positive relationship with the sum of the
top 3 compensations received by management team members. Among firms that have no
government ownership but present political connections of ultimate controllers (SOE=0 &

48
POLITICAL=1), we find the monitoring function of supervisory board (SBMF_RES)
significantly reduces the sum of the top 3 compensations received by board members and
marginally reduces the total pay of all executives. Such results demonstrate the effectiveness of
the supervisory board as one of the major monitoring organs within the Chinese publicly listed
firms that have no government-owned shares but are politically connected.
The variable Audit increases all three categories of executive compensations significantly
within the firms that have neither government-owned shares nor political connections, however
no such effect is found in firms without government ownership but with political connections of
the ultimate controllers. Consistent with the results of the whole sample, the largest shareholder’s
ownership still presents significantly negative relationships with certain categories of executive
compensations, and firm size still shows a strong positive relationship with all categories of
executive compensations.
[Insert Panel C of Table 5 about here]
Table 6 illustrates the results of the same tests within all the firms shown to have
government-owned shares (SOE>0). The results of Model (3.1) and Model (3.2), within the
firms that have government ownership but not politically connected (SOE>0 & POLITICAL=0),
are presented respectively in the first three columns and the last column of Panel A of Table 6.
The results of Model (3.1) and Model (3.2) within the firms that have both government
ownership and political connections of ultimate controllers (SOE>0 & POLITICAL=1) are
respectively presented in the first three columns and the last column of Panel B of Table 6.
Consistent with the previous findings, board size (Bsize) shows significantly negative
relationship with board meeting frequency (BMF) and supervisory board size (SBsize) shows
significantly positive relationship with supervisory board meeting frequency (SBMF). As
presented in Panel A of Table 6, having one of the Big 4 CPA firms as the auditing firm (Audit)
seems to significantly increase supervisory board meeting frequency and the portion of
independent directors on the board within the group of firms that have government ownership
but no political connections (SOE>0 & POLITICAL=0). Hiring one of the Big 4 CPA firms as
the auditing firm seems to have put more pressure on the monitoring organs by encouraging the
supervisory board and independent directors to work more actively. As presented in Panel B of
Table 6, the portion of tradable shares positively affects the board meeting frequency and
supervisory board meeting frequency within the firms that have both government ownership and

49
political connections of the ultimate controllers (SOE>0 & POLITICAL=1). It is consistent with
the previous results showing that tradable shareholders call for higher level of corporate
governance to prevent their interests from being deprived by large shareholders. Firm size (LnTA)
shows a significantly positive relationship with all three corporate governance proxies, as the
results of considering the whole sample. Other control variables, such as ownership
concentration (HHI), past year’s risk taking behaviours (LagDTA and LagSigma), the percentage
of largest shareholder’s ownership (Largest), show significant influence on corporate governance
activities as well.
The results of Model (3.2) based on firms that have government ownership but no
politically-connected ultimate controllers are consistent with our results based on the full sample,
with no influence of corporate governance on market performance being shown. Similar to our
previous findings, firm size shows a significantly positive relationship with market performance.
For firms that have both government ownership and politically-connected ultimate controllers,
LagROA and Audit also show significantly positive relationships with market performance,
which again suggest the positive signalling effects of having one of the Big 4 CPA firms to
perform auditing.
[Insert Panel A and B of Table 6 about here]
Panel C of Table 6 illustrates the results of Model (3.3) within the firms that have
government ownership (SOE>0), with the results of non-politically connected firms
(POLITICAL=0) in the first three columns and the results of politically connected firms
(POLITICAL=1) in the last three columns. From the results, we observe that the monitoring
function of the supervisory board meeting frequency (SBMF_RES) significantly increases the
total pay of all executives and marginally increases the sum of the top 3 compensations received
by board members within the firms that have government ownership but non-politically
connected (SOE>0 & POLITICAL=0). The above findings suggest that supervisory boards
within such firms perform dysfunctionally. We also notice that both of the monitoring function of
the board of directors (BMF_RES) and that of the independent directors (ID_RES) show
significantly positive influence on the total pay of all executives and on the sum of the top 3
compensations received by the management team members within the firms presenting the
existence of government-owned shares as well as political connections of ultimate controllers
(SOE>0 & POLITICAL=1). These findings illustrate the dysfunctionality of the monitoring

50
organs in firms with both government ownership and politically connected ultimate controllers.
[Insert Panel C of Table 6 about here]
Multiple control variables also show significant impacts on executive compensations, which
are consistent with the previous results. Within the firms that have government ownership but not
politically connected, the percentage of government ownership negatively impacts the sum of the
top 3 compensations received by board members as well as that of the management team
members. Within the firms presenting the existence of government-owned shares as well as
political connections of ultimate controllers, we find the current year’s financial leverage (DTA)
negatively impacts the total compensations and the sum of the top 3 compensations received by
management team members; the type of auditing firm (Audit) positively impacts the total
compensations and the sum of the top 3 compensations received by management team members,
and therefore once again suggests a positive signalling effect of hiring one of the Big 4 as
auditing firm; ownership concentration (HHI) positively impacts the total compensations and the
sum of the top 3 compensations received by board members, which indicates the large
shareholders expropriate minority shareholder’s interests by paying higher compensations to
themselves. Firm size (LnTA) still significantly increases all categories of executive
compensations for all firms with government ownership existing.
Overall, the robustness tests about the effects of political connections on executive
compensation reveal interesting results. Table 7 provides a clear summary of the important
findings from our robustness tests. According to the table, we can observe that as the
firm–government relationship changes, the effectiveness of the corporate governance mechanism
differs. According to our robustness test results, the corporate governance mechanism is
confirmed to have a non-linear effect on executive compensation, jointly depending on the status
of a firm’s political connections and its ownership structure. Put it differently, although the
political connections of ultimate controllers may not affect firm performance or executive
compensation independently, its influences can be shown when it is combined with the
characteristics of state-owned shares17.
[Insert Table 7 about here]
In order to test the robustness of our results, we used ROA as an alternative proxy for firm
17 These are especially confirmed by the empirical results based on subsamples constructed using the value of SOE only. Results are available upon request.

51
performance and re-run all the models stated above. No qualitative change in the results was
found. In order to check for multicollinearity, we compute the variance inflation factors (VIF) for
the variables, and values are lower than 10, suggesting that no serious multicollinearity problem
exists.

52
CHAPTER 6 CONCLUSIONS AND LIMITATIONS
China is one of the most promising emerging markets in the world. With its fast growing
economy, China has kept improving the effectiveness and efficiency of its corporate governance
mechanism. Both the German model and the Anglo-American mechanism are considered as the
best corporate governance structures in the global economy, and therefore the Chinese authorities
have made an attempt to combine them in the hope of boosting the Chinese corporate
governance reform. Doing so leads to a unique Chinese corporate governance structure, with the
presence of two boards and the coexistence of two monitoring organs. However, the current
corporate governance structure in China raises debates on its functionality, since many have
claimed that the overlapping functions of the two monitoring organs lead to inefficiency and
ineffectiveness (e.g., Xiao, et al., 2004; Xi, 2006; Ding, et al., 2009). Although there is a rich
literature on corporate governance and executive compensation in mature markets, we hope the
uniqueness of the Chinese market may offer some different insights to this issue for emerging
markets.
The Chinese publicly listed firms not only have a special corporate governance system, they
also have many other unique features, including the existence of non-tradable shares, highly
concentrated ownership structures, and close relationship with the government. Particularly, the
presence of political connections is especially prevalent, as the rest emerging markets. The
effects of political connections have been examined by various studies, many of which show
political connections bring benefits to the firm. Such benefits could be in the form of easier
access to capital, lower taxation, policy support, and useful inside information, which eventually
lead to better market performance (e.g., Khwaja and Mian, 2005; Faccio, 2006; Bunkanwanicha
and Wiwattanakantang, 2009). One recent study on the Chinese market, Fan et al. (2007),
however yield contradicting results. Their findings suggest the Chinese politically connected
firms have less effective corporate governance and perform worse in the market. In other words,
the Chinese politically connected firms suffer from such ties with the government, rather than

53
benefiting from them. The important role of political connections and the interesting findings of
Fan, et al. (2007) indicate that examining the effects of political connections on corporate
governance, firm performance and executive compensation in the Chinese market is essential,
and may offer us better understandings toward the unfolding process of the corporate governance
reform.
Our study examines the relationships among corporate governance, firm performance, and
executive compensation in a more recent period that is not covered by previous studies. We
investigate this issue in detail by testing the specific channels through which corporate
governance may influence firm performance and executive compensations. Our findings suggest
a dysfunctional corporate governance mechanism in China, with the monitoring units can not
bring improved firm performance, but grant executive high compensations. Furthermore, we
identify the political connections of firms’ ultimate controllers and study their impacts on
corporate governance, firm performance, and executive compensation. Consistent with Fan et al.
(2007), our findings demonstrate that the political connections deteriorate the functionality of
corporate governance mechanism. However, in contrast to Fan et al. (2007), we do not find a
negative relationship between political connection and firm performance, which indicates the
politically connected firms in China do not underperform their non-politically connected peers.
Although our test of political connections on executive compensation fails to give significant
results, the robustness tests suggest that when the firm-government relationship changes, the
effectiveness of corporate governance mechanism differs. A non-linear effect of corporate
governance mechanism on executive compensation is shown when political connections of firms’
ultimate controllers and firms’ ownership structures are jointly considered. Overall, the
robustness test results indicate that the close relationship between firms and the government
leads to a dysfunctional corporate governance mechanism in China, with the deteriorated
monitoring organs which are unable to improve the firm performance but enhance the pay to
executives.
Reviewing the process of the on-going corporate governance reform, we can see the efforts
that China has made to strive for an effective corporate governance structure. Establishments and
amendments of new or existing rules, and codifying supervisory boards and independent
directors into one corporate governance system are all attempts adopted by the Chinese
government to enhance corporate governance. However, little significant progress has been made.

54
Various factors may contribute to such dilemma (Clarke, 2006; Xi, 2006), and the close
firm-government relationship might have been a particularly important one. Thus, the distinctive
Chinese political, social, and economic environment brings serious challenges to the Chinese
economic reform.
Limitations of the current study are also acknowledged. For example, the existence of
non-tradable shares may offer, to some extent, inaccurate or even biased results. However, since
this is one of the special features of the Chinese market, we have no choice but to include them
into our research. To lower the potential of having biased results, we follow prior literature (e.g.,
Chen, et al., 2006; Firth, et al., 2006; Fan, et al., 2007; Ding, et al., 2009) and include a control
variable measuring the percentage of shares that are non-tradable in the analysis. Also, our study
is limited by data availability. The pay variables we have adopted are all group compensations,
due to the reason that executive’s individual payment information only became available after
Year 2005 and is not adequate for us to use. It would be more interesting to see how corporate
governance mechanism affects individual executive’s pay, which should generate a clearer
picture of how the corporate governance system in the Chinese publicly listed company works.
Future research continuing along this route will make considerable contribution to this field of
study.

55
REFERENCES
Agrawal, A., and C.R. Knoeber. 1996. Firm performance and mechanisms to control agency problems between managers and shareholders. Journal of Financial and Quantitative Analysis 31: 377-397.
Alchian, A., and H. Demsetz. 1972. Production, information costs, and economic organization.
The American Economic Review 62: 777-795. Bai, C., Q. Liu, J. Lu, F.M. Song, and J. Zhang. 2004. Corporate governance and market
valuation in China. Journal of Comparative Economics 32: 599-616. Beasley, M. 1996. An empirical analysis between the board of director composition and financial
fraud. The Accounting Review 71: 443-466. Berle, A., and G. Means. 1932. The modern corporation and private property. New York: the
Macmillian Company. Brickley, J.A., J.L. Coles, and G. Jarrell. 1997. Leadership structure: Separating the CEO and
chairman of the board. Journal of Corporate Finance 3: 189-220. Boyd, B. 1994. Board control and CEO compensation. Strategic Management Journal 15:
335-344. Bunkanwanicha, P., and Y. Wiwattanakantang. 2009. Big business owners in politics. Review of
Financial Studies 22: 2133-2168. Burkhart, M., D. Gromb, and F. Panunzi. 1997. Large shareholders, monitoring, and the value of
the firm. Quarterly Journal of Economics 112: 693-728. CFA Institute. 2007. China Corporate Governance Survey. ISBN: 978-1-932495-65-2 (PDF) Chaney, P., M. Faccio, and D. Parsley. 2008. The quality of accounting information in politically
connected firms. Available at: http://ssrn.com/abstract=966379 Chen, G., M. Firth, D.N. Gao, and O.M. Rui. 2006. Ownership, corporate governance, and fraud:
Evidence from China. Journal of Corporate Finance 12: 424-448. Clarke, D. 2006. The Independent Director in Chinese Corporate Governance. Delaware Journal
of Corporate Law 31: 125-228. Coase, R.H. 1937. The nature of the firm. Economica 4: 386-405. Conyon, M.J. 1997. Corporate governance and executive compensation. International Journal of
Industrial Organization 15: 493-509.

56
Core, J., R. Holthausen, and D. Larcker. 1999. Corporate governance, chief executive officer compensation, and firm performance. Journal of Financial Economics 51: 371-406.
Cyert, R., S. Kang, and P. Kumar. 2002. Corporate governance, takeovers, and top-management
compensation: Theory and evidence. Management Science 48: 453-469. Dahya, J., Y. Karbhari, J. Xiao, and M. Yang. 2003. The usefulness of the supervisory board
report in China. Corporate Governance: An International Review 11: 308-321. Demsetz, H., and K. Lehn. 1985. The structure of corporate ownership: causes and consequences.
Journal of Political Economy 93: 1155-1178. Ding, S., Z. Wu, Y. Li, C. Jia. 2009. Can the Chinese two-tier-board system control the board
chair pay? Asian Journal of Finance and Accounting 1: 1-22. Eisenberg, T.S., S. Sundgren, and M.T. Wells. 1998. Larger board size and decreasing firm value
in small firms. Journal of Financial Economics 48: 35-54. Fama, E. 1980. Agency problems and the theory of the firm. The Journal of Political Economy
88: 288-307. Fama, E., and M.C. Jensen. 1983. Separation of ownership and control. Journal of Law and
Economics 26: 301-325. Faccio, M. 2006. Politically-connected firms. American Economic Review 96: 369-386. Faccio, M. 2006. The characteristics of politically connected firms. Available at SSRN:
http://ssrn.com/abstract=918244 Faccio, M., R. Masulis, and J. McConnell. 2006. Political connections and corporate bailouts.
Journal of Finance 61: 2597-2635. Fan, J., T.J. Wong, and T. Zhang. 2007. Politically connected CEOs, corporate governance, and
post-IPO performance of China’s newly partially privatized firms. Journal of Financial Economics 84: 330-357.
Firth, M., P. Fung, and O. Rui. 2006. Corporate performance and CEO compensation in China.
Journal of Corporate Finance 12: 693-714. Firth, M., P. Fung, and O. Rui. 2007. Ownership, two-tier board structure, and the
informativeness of earnings: evidence from China. Journal of Accounting and Public Policy 26: 463-496.
Goyal, V., and C. Park. 2002. Board leadership structure and CEO turnover. Journal of
Corporate finance 8: 49-66.

57
Grossman, S.J., and O.D. Hart. 1986. The costs and benefits of ownership: A theory of vertical and lateral integration. The Journal of Political Economy 94: 691-719.
Hermalin, B.E., and M.S. Weisbach. 1988. The determinants of board composition. Rand
Journal of Economics 19: 589-606. Hermalin, B. E., and M.S. Weisbach. 1991. The effects of board composition and direct
incentives on firm performance. Financial Management 20: 101-113 Hillman, A. 2005. Politicians on the board of directors: Do connections affect the bottom line?
Journal of Management 31: 464-481. Jensen, M.C. 1993. The modern industrial revolution, exit, and the failure of internal control
systems. The Journal of Finance 48: 831-880. Jensen, M.C., and W.H. Meckling. 1976. Theory of the firm: managerial behavior, agency costs
and ownership structure. Journal of Financial Economics 3: 305-360. Jensen, M.C., and K.J. Murphy. 1990. Performance and top management incentives. Journal of
Political Economy 98: 225-264. Jia, C., S. Ding, Y. Li, and Z. Wu. 2009. Frauds, enforcement actions, and the role of corporate
governance. Journal of Business Ethics, forthcoming. Kaplan, S. 1994. Top executive rewards and firm performance: a comparison of Japan and the
United States. Journal of Political Economy 102: 510-546. Karamanou, I., and N. Vafeas. 2005. The association between corporate boards, audit committees,
and management earnings forecasts: an empirical analysis. Journal of Accounting Research 43: 453–486.
Kato, T., and C. Long, 2005. CEO Turnover, firm Performance, and corporate governance in
Chinese listed firms. Available at SSRN: http://ssrn.com/abstract=687350. Kato, T., and C. Long. 2006. Executive compensation, firm performance, and corporate
governance in China: Evidence from firms listed in the Shanghai and Shenzhen Stock Exchanges. Economic Development and Cultural Change 54: 945-983.
Khwaja, A., and A. Mian. 2005. Do lenders favor politically connected firms? Rent provision in
an emerging financial market. The Quarterly Journal of Economics 120: 1371-1411. Klein, A. 1998. Firm performance and board committee structure. Journal of Law and
Economics 41: 275-303. La Porta, R., F. Lopez-de-Silanes, and A. Shleifer. 1999. Corporate ownership around the world.
The Journal of Finance 54: 471-517.

58
La Porta, R., F. Lopez-de-Silanes, A. Shleifer, and R. Vishny. 2000. Investor protection and
corporate governance. Journal of Financial Economics 58: 3-27. Lai, L., and H. Tam. 2007. Independent directors and the propensity to smooth earnings: A study
of corporate governance in China. The Business Review 7: 328-335. Liu, D., and K. Otsuka. 2004. A comparison of management incentives, abilities, and efficiency
between SOEs and TVEs: The case of the iron and steel industry in China. Economic Development and Cultural Change 52: 759-780.
Morck, R., A. Shleifer, and R. Vishny. 1988. Management ownership and market valuation.
Journal of Financial Economics 20: 293-315 Morck, R., A. Shleifer, and R. Vishny. 1989. Alternative mechanisms of corporate control.
American Economic Review 79: 842-852. Ryan Jr., H., and R. Wiggins III. 2004. Who is in whose pocket? Director compensation, board
independence, and barriers to effective monitoring. Journal of Financial Economics 73: 497-524.
Shleifer, A., and R. Vishny. 1986. Large shareholders and corporate control. Journal of Political
Economy 94: 461-488. Shleifer, A., and R. Vishny. 1997. A survey of corporate governance. Journal of Finance 52:
737-783. Uzun, H., S.H. Szewczyk, and R. Varma. 2004. Board composition and corporate fraud.
Financial Analysts Journal 60: 33–43. Vafeas, N. 1999. Board meeting frequency and firm performance. Journal of Financial
Economics 53: 113-142. Wu, Z., and J. Chua. 2009. Board monitoring and access to debt financing. Advances in
Financial Economics 13: 119-137. Wu, Z., Y. Li, S. Ding, and C. Jia. 2009. Supervisory board and financial risk-taking: Behaviors
in Chinese listed companies. Corporate Boards: Managers of Risk, Sources of Risk, co-edited by Professor Robert W. Kolb and Professor Donald Schwartz, Blackwell Publishing Ltd.
Xi, C., 2006. In search of an effective monitoring board model: Board reforms and the political
economy of corporate law in China. Connecticut Journal of International Law 22: 1-46. Xiao, J.Z, J. Dahya, and Z. Lin. 2004. A grounded theory exposition of the role of the
supervisory board in China. British Journal of Management 15: 39-55.

59
Xie, B., W.N. Davidson III, and P.J. DaDalt. 2003. Earnings management and corporate
governance: The role of the board and the audit committee. Journal of Corporate Finance 9: 295-316.
Yermack, D. 1996. Higher market valuation of companies with a small board of directors.
Journal of Financial Economics 40: 185-211. Yueh, L. 2004. Wage reforms in China during the 1990s. Asian Economic Journal 18: 149-164.

60
Figure 1. Summary of Effects of Corporate Governance on Firm Performance and Executive Compensation
The variable MR measures the annual stock return with dividends. Three executive compensation variables are the total pay received by all executives (PayTotal), the total of 3 highest compensations paid to the members on the board of directors (PayBtop3), and the total of 3 highest compensations paid to the members on the management team (PayMtop3). In the study, we use the natural logarithm of them, Ln(PayTotal), Ln(PayBtop3), and Ln(PayMtop3). BMF measures the board meeting frequency in a year, SBMF indicates the supervisory board meeting frequency in a year, and the variable ID stands for the portion of board directors who are independent. LagROA measures return on assets in the previous year. This figure summarizes the main findings of our tests on the effects of corporate governance on firm performance and executive compensation. The sign “+” represents for positive relationships. Dashed lines represents for non-significant results.
LagROA
BMF
MR
SBMF
ID
+ +
+ +
+
+
+
Ln(PayTotal)
Ln(PayMtop3)
Ln(PayBtop3)

61
Figure 2. Summary of Effects of Political Connections on Corporate Governance, Firm
Performance and Executive Compensation
The variable MR measures the annual stock return with dividends. Three executive compensation variables are the total pay received by all executives (PayTotal), the total of 3 highest compensations paid to the members on the board of directors (PayBtop3), and the total of 3 highest compensations paid to the members on the management team (PayMtop3). In the study, we use the natural logarithm of them, Ln(PayTotal), Ln(PayBtop3), and Ln(PayMtop3). BMF measures the board meeting frequency in a year, SBMF indicates the supervisory board meeting frequency in a year, and the variable ID stands for the portion of board directors who are independent. POLITICAL is a dummy variable measuring whether the ultimate controller is politically connected to government and/or military. If yes, it has a value of one, and zero otherwise. This figure summarizes the main findings of our tests on the effects of political connections on corporate governance, firm performance and executive compensation. The sign “-” represents for negative relationships. Dashed lines represents for non-significant results.
POLITICAL
Ln(PayBtop3)
Ln(PayMtop3)
- --
BMF
SBMF
ID
MR
Ln(PayTotal)

62
Table 1. Descriptive Statistics
Panel A. Descriptive Statistics of the Dependent Variables
The variable MR measures the annual stock return with dividends. Three executive compensation variables are the total pay received by all executives (PayTotal), the total of 3 highest compensations paid to the members on the board of directors (PayBtop3), and the total of 3 highest compensations paid to the members on the management team (PayMtop3). In the study, we use the natural logarithm of them, Ln(PayTotal), Ln(PayBtop3), and Ln(PayMtop3).
Sample without Outliers
Varible Mean S.D Min Max N MR -0.147 0.315 -0.805 0.533 6574
Ln(PayTotal) 13.763 0.904 0.000 17.128 6719 Ln(PayBtop3) 12.448 1.980 0.000 16.754 6397 Ln(PayMtop3) 12.782 0.964 0.000 16.754 6729
Panel B. Descriptive Statistics of the Independent Variables
BMF measures the board meeting frequency in a year, SBMF indicates the supervisory board meeting frequency in a year, and the variable ID stands for the portion of board directors who are independent.
Sample without Outliers
Variable Mean S.D Min Max N BMF 7.452 3.126 2.000 34.000 6902 SBMF 3.561 1.672 1.000 25.000 6903
ID 0.281 0.121 0.000 0.667 6933
Panel C. Descriptive Statistics of the Political Connection Variable
POLITICAL is a dummy variable measuring whether the ultimate controller is politically connected to government and/or military. If yes, it has a value of one, and zero otherwise.
Sample without Outliers
Variable Mean S.D Min Max N
POLITICAL 0.633 0.482 0.000 1.000 6176

63
Panel D. Descriptive Statistics of the Control Variables
LagROA measures return on assets in the previous year, and DTA measures the debt-asset ratio in a year. The variable Sigma indicates the total risk taken by shareholders measured by the standard deviation of stock returns in a year. Features of the two boards are measured by board size (BSize) and size of supervisory board (SBSize).The variable Duality is a dummy variable with a value of one if the board chair and the CEO are the same person and zero otherwise. The variable Audit is a dummy variable with a value of one if the auditor of a firm is one of big four CPA firms and zero otherwise. The ownership structure variables include the percentage of ownership held by the largest shareholder (Largest), the percentage of ownership held by government and/or by government-owned organizations (SOE), the portion of common shares that are tradable in the stock markets (Tradable), and ownership concentration measured by Herfindahl index (HHI). Other control variables include firm size measured by the logarithm of firm’s total assets (LnTA).
Sample without Outliers
Variable Mean S.D Min Max N Firm Performance and Risk Variables
LagROA -0.008 0.376 -13.084 0.514 5575 DTA 0.069 0.142 -0.000 6.830 6922 Sigma 0.024 0.005 0.002 0.060 6301
Characteristics of Board of Directors and Supervisory Board
Bsize 9.666 2.197 4.000 19.000 6940 Sbsize 4.235 1.415 0.000 13.000 6940
Agency Variable Duality 0.112 0.315 0.000 1.000 6904 Audit 0.085 0.278 0.000 1.000 6508
Ownership Structure Variables Largest 0.418 0.169 0.011 0.991 6941
SOE 0.327 0.262 0.000 0.886 6926 Tradable 0.411 0.129 0.000 1.000 6941
HHI 0.020 0.028 0.000 0.404 6941 Other Control Variables
LnTA 21.137 0.992 12.314 26.978 6922

64
Table 2. Effects of Corporate Governance on Market Performance Results presented this table are based on Models (1.1) and (1.2), respectively. The dependent variables in Model (1.1) are board meeting frequency (BMF), supervisory board meeting frequency (SBMF), and the portion of board directors who are independent directors (ID). The dependent variable in Model (1.2) is the annual stock return with dividends (MR).
Model (1.1) Model (1.2) Dep. Var. BMF SBMF ID MR Coef. t Coef. t Coef. t Coef. t MIBMF -- -- -- -- -- -- 0.001 1.150 MISBMF -- -- -- -- -- -- -0.002 -0.810 MIID -- -- -- -- -- -- 0.044 0.660 LagROA -0.051 -0.280 -0.001 -0.010 0.006 1.860 0.048** 3.070 DTA -- -- -- -- -- -- 0.035 1.170 LagDTA 0.012 0.030 -0.428* -2.110 0.004 0.570 -- -- Sigma -- -- -- -- -- -- -6.666*** -7.870 LagSigma 40.317*** 3.530 15.894** 2.570 -0.038 -0.200 -- -- Bsize -0.085*** -3.990 -- -- -0.008*** -20.890 -- -- SBsize -- -- 0.054** 3.080 -- -- -- -- Duality -0.042 -0.300 0.086 1.130 0.004 1.580 0.002 0.210 Audit -0.113 -0.670 0.069 0.760 0.004 1.490 0.022 1.650 Largest 0.392 0.910 0.329 1.400 -0.005 -0.730 0.082* 2.360 SOE -0.246 -1.230 0.139 1.280 -0.006 -1.680 -0.006 -0.410 Tradable 1.388** 2.830 0.480 1.800 -0.006 -0.770 -0.011 -0.280 HHI 6.236** 3.060 0.248 0.220 0.047 1.340 0.131 0.800 LnTA 0.193*** 3.500 0.035 1.180 0.005*** 4.950 0.042*** 9.580 Industry Dummies Yes Yes Yes Yes Year Dummies Yes Yes Yes Yes _cons 3.222** 2.600 2.446*** 3.640 0.327*** 15.390 -0.398*** -4.000 N 5020 5010 5022 4766 F Value 10.370*** 18.650*** 134.680*** 126.500*** Adj R-squared 0.046 0.084 0.409 0.424
***p<0.001, **p<0.01, *p<0.05.
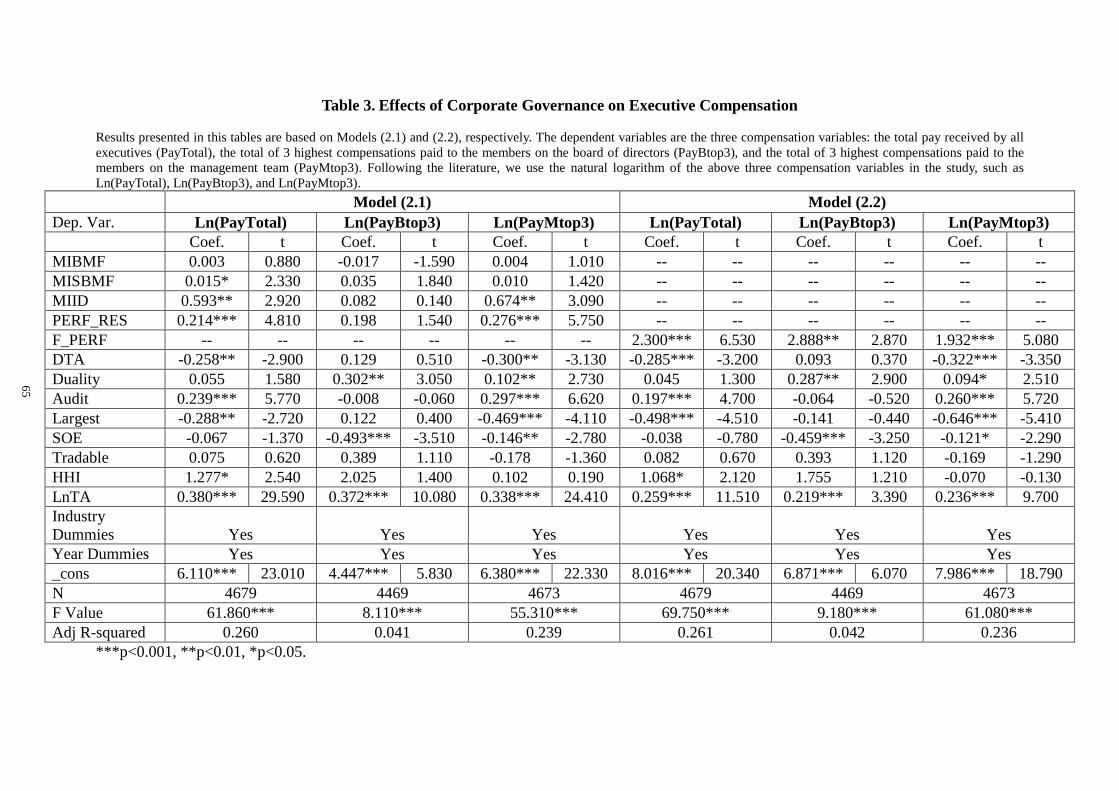
Table 3. Effects of Corporate Governance on Executive Compensation
Results presented in this tables are based on Models (2.1) and (2.2), respectively. The dependent variables are the three compensation variables: the total pay received by all executives (PayTotal), the total of 3 highest compensations paid to the members on the board of directors (PayBtop3), and the total of 3 highest compensations paid to the members on the management team (PayMtop3). Following the literature, we use the natural logarithm of the above three compensation variables in the study, such as Ln(PayTotal), Ln(PayBtop3), and Ln(PayMtop3).
Model (2.1) Model (2.2) Dep. Var. Ln(PayTotal) Ln(PayBtop3) Ln(PayMtop3) Ln(PayTotal) Ln(PayBtop3) Ln(PayMtop3) Coef. t Coef. t Coef. t Coef. t Coef. t Coef. t MIBMF 0.003 0.880 -0.017 -1.590 0.004 1.010 -- -- -- -- -- -- MISBMF 0.015* 2.330 0.035 1.840 0.010 1.420 -- -- -- -- -- -- MIID 0.593** 2.920 0.082 0.140 0.674** 3.090 -- -- -- -- -- -- PERF_RES 0.214*** 4.810 0.198 1.540 0.276*** 5.750 -- -- -- -- -- -- F_PERF -- -- -- -- -- -- 2.300*** 6.530 2.888** 2.870 1.932*** 5.080 DTA -0.258** -2.900 0.129 0.510 -0.300** -3.130 -0.285*** -3.200 0.093 0.370 -0.322*** -3.350 Duality 0.055 1.580 0.302** 3.050 0.102** 2.730 0.045 1.300 0.287** 2.900 0.094* 2.510 Audit 0.239*** 5.770 -0.008 -0.060 0.297*** 6.620 0.197*** 4.700 -0.064 -0.520 0.260*** 5.720 Largest -0.288** -2.720 0.122 0.400 -0.469*** -4.110 -0.498*** -4.510 -0.141 -0.440 -0.646*** -5.410 SOE -0.067 -1.370 -0.493*** -3.510 -0.146** -2.780 -0.038 -0.780 -0.459*** -3.250 -0.121* -2.290 Tradable 0.075 0.620 0.389 1.110 -0.178 -1.360 0.082 0.670 0.393 1.120 -0.169 -1.290 HHI 1.277* 2.540 2.025 1.400 0.102 0.190 1.068* 2.120 1.755 1.210 -0.070 -0.130 LnTA 0.380*** 29.590 0.372*** 10.080 0.338*** 24.410 0.259*** 11.510 0.219*** 3.390 0.236*** 9.700 Industry Dummies Yes Yes Yes Yes Yes Yes Year Dummies Yes Yes Yes Yes Yes Yes _cons 6.110*** 23.010 4.447*** 5.830 6.380*** 22.330 8.016*** 20.340 6.871*** 6.070 7.986*** 18.790 N 4679 4469 4673 4679 4469 4673 F Value 61.860*** 8.110*** 55.310*** 69.750*** 9.180*** 61.080*** Adj R-squared 0.260 0.041 0.239 0.261 0.042 0.236
***p<0.001, **p<0.01, *p<0.05.
65

66
Table 4. Effects of Political Connections of Ultimate Controllers
Results presented in Panel A of this table are based on Models (3.1) and (3.2), and those presented in Panel B are based on Model (3.3).
Panel A. Effects on Corporate Governance Mechanism and Market Performance
Model (3.1) Model (3.2) Dep. Var. BMF SBMF ID MR Coef. t Coef. t Coef. t Coef. t POLITICAL -0.586*** -5.770 -0.132* -2.390 -0.005** -2.740 -0.001 -0.110 BMF_RES -- -- -- -- -- -- 0.001 1.050 SBMF_RES -- -- -- -- -- -- -0.002 -0.860 ID_RES -- -- -- -- -- -- 0.048 0.700 LagROA -0.039 -0.210 0.012 0.120 0.007* 2.090 0.048** 3.040 DTA -- -- -- -- -- -- 0.033 1.100 LagDTA 0.147 0.390 -0.391 -1.910 0.004 0.600 -- -- Sigma -- -- -- -- -- -- -6.450*** -7.470 LagSigma 44.817*** 3.890 14.503* 2.310 -0.038 -0.190 -- -- Bsize -0.077*** -3.530 -- -- -0.008*** -20.680 -- -- SBsize -- -- 0.046** 2.610 -- -- -- -- Duality -0.043 -0.300 0.110 1.440 0.004 1.610 0.003 0.280 Audit -0.200 -1.150 0.080 0.840 0.005 1.570 0.021 1.510 Largest 0.657 1.490 0.348 1.450 -0.005 -0.630 0.100** 2.810 SOE 0.002 0.010 0.210 1.840 -0.003 -0.830 -0.009 -0.520 Tradable 1.504** 3.010 0.535* 1.960 -0.005 -0.540 0.003 0.080 HHI 5.820** 2.840 -0.013 -0.010 0.045 1.300 0.143 0.860 LnTA 0.233*** 4.130 0.046 1.540 0.005*** 4.790 0.041*** 9.080 Industry Dummies Yes Yes Yes Yes Year Dummies Yes Yes Yes Yes _cons 2.350 1.850 2.239*** 3.230 0.331*** 15.310 -0.401*** -3.880 N 4817 4807 4819 4566 F Value 11.100*** 16.860*** 126.390*** 119.790*** Adj R-squared 0.054 0.082 0.413 0.430
***p<0.001, **p<0.01, *p<0.05.

67
Panel B. Effects on Executive Compensation: Model (3.3)
Model (3.3) Dep. Var. Ln(PayTotal) Ln(PayBtop3) Ln(PayMtop3) Coef. t Coef. t Coef. t POLITICAL 0.032 1.250 0.026 0.360 0.004 0.160 BMF_RES 0.004 0.950 -0.016 -1.460 0.008* 2.060 SBMF_RES 0.014* 2.010 0.031 1.540 0.006 0.790 ID_RES 0.554** 2.620 0.265 0.430 0.697*** 3.230 PERF_RES 0.218*** 4.790 0.218 1.660 0.271*** 5.830 DTA -0.242** -2.670 0.172 0.660 -0.271** -2.930 Duality 0.065 1.820 0.341*** 3.370 0.100** 2.760 Audit 0.246*** 5.700 0.031 0.250 0.307*** 6.920 Largest -0.274* -2.510 0.176 0.560 -0.417*** -3.740 SOE -0.091 -1.750 -0.523*** -3.490 -0.146** -2.770 Tradable 0.063 0.510 0.353 0.980 -0.170 -1.330 HHI 1.205* 2.360 1.948 1.320 0.053 0.100 LnTA 0.371*** 27.930 0.342*** 8.940 0.318*** 23.420 Industry Dummies Yes Yes Yes Year Dummies Yes Yes Yes _cons 6.324*** 22.940 5.091*** 6.410 6.799*** 24.150 N 4486 4291 4480 F Value 55.920*** 6.850*** 52.540*** Adj R-squared 0.255 0.037 0.244
***p<0.001, **p<0.01, *p<0.05.
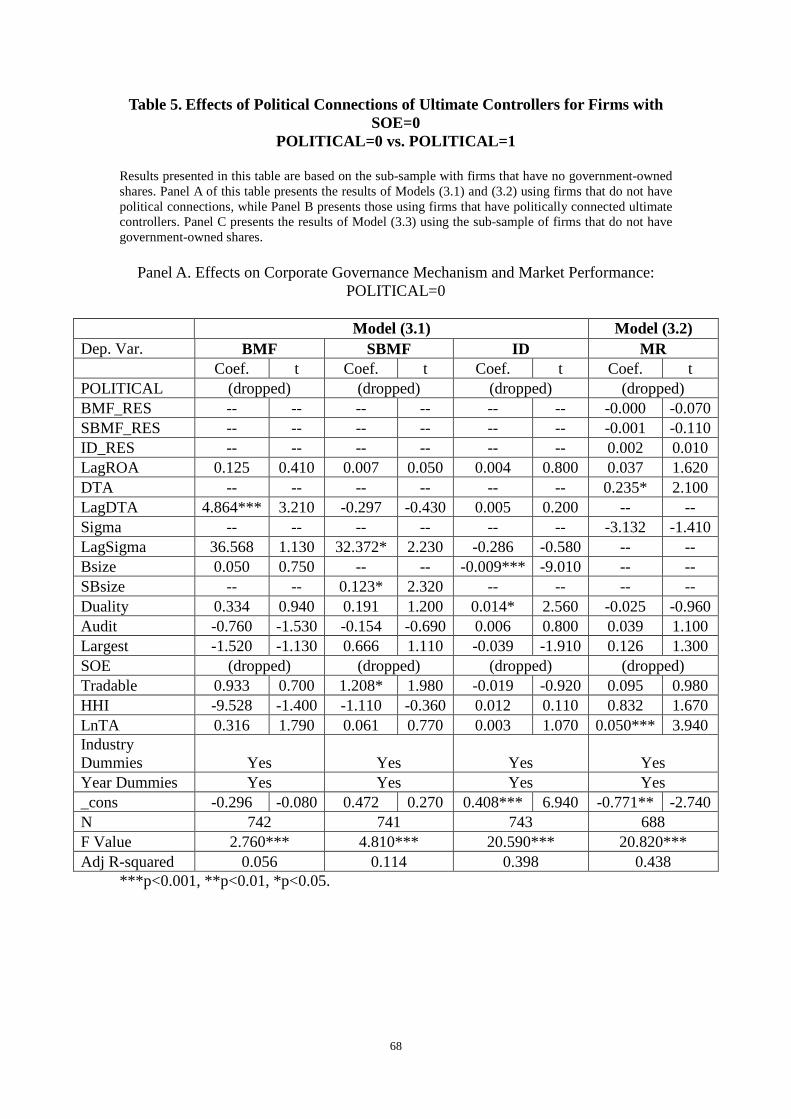
68
Table 5. Effects of Political Connections of Ultimate Controllers for Firms with SOE=0
POLITICAL=0 vs. POLITICAL=1
Results presented in this table are based on the sub-sample with firms that have no government-owned shares. Panel A of this table presents the results of Models (3.1) and (3.2) using firms that do not have political connections, while Panel B presents those using firms that have politically connected ultimate controllers. Panel C presents the results of Model (3.3) using the sub-sample of firms that do not have government-owned shares.
Panel A. Effects on Corporate Governance Mechanism and Market Performance: POLITICAL=0
Model (3.1) Model (3.2) Dep. Var. BMF SBMF ID MR Coef. t Coef. t Coef. t Coef. t POLITICAL (dropped) (dropped) (dropped) (dropped) BMF_RES -- -- -- -- -- -- -0.000 -0.070 SBMF_RES -- -- -- -- -- -- -0.001 -0.110 ID_RES -- -- -- -- -- -- 0.002 0.010 LagROA 0.125 0.410 0.007 0.050 0.004 0.800 0.037 1.620 DTA -- -- -- -- -- -- 0.235* 2.100 LagDTA 4.864*** 3.210 -0.297 -0.430 0.005 0.200 -- -- Sigma -- -- -- -- -- -- -3.132 -1.410 LagSigma 36.568 1.130 32.372* 2.230 -0.286 -0.580 -- -- Bsize 0.050 0.750 -- -- -0.009*** -9.010 -- -- SBsize -- -- 0.123* 2.320 -- -- -- -- Duality 0.334 0.940 0.191 1.200 0.014* 2.560 -0.025 -0.960 Audit -0.760 -1.530 -0.154 -0.690 0.006 0.800 0.039 1.100 Largest -1.520 -1.130 0.666 1.110 -0.039 -1.910 0.126 1.300 SOE (dropped) (dropped) (dropped) (dropped) Tradable 0.933 0.700 1.208* 1.980 -0.019 -0.920 0.095 0.980 HHI -9.528 -1.400 -1.110 -0.360 0.012 0.110 0.832 1.670 LnTA 0.316 1.790 0.061 0.770 0.003 1.070 0.050*** 3.940 Industry Dummies Yes Yes Yes Yes Year Dummies Yes Yes Yes Yes _cons -0.296 -0.080 0.472 0.270 0.408*** 6.940 -0.771** -2.740 N 742 741 743 688 F Value 2.760*** 4.810*** 20.590*** 20.820*** Adj R-squared 0.056 0.114 0.398 0.438
***p<0.001, **p<0.01, *p<0.05.
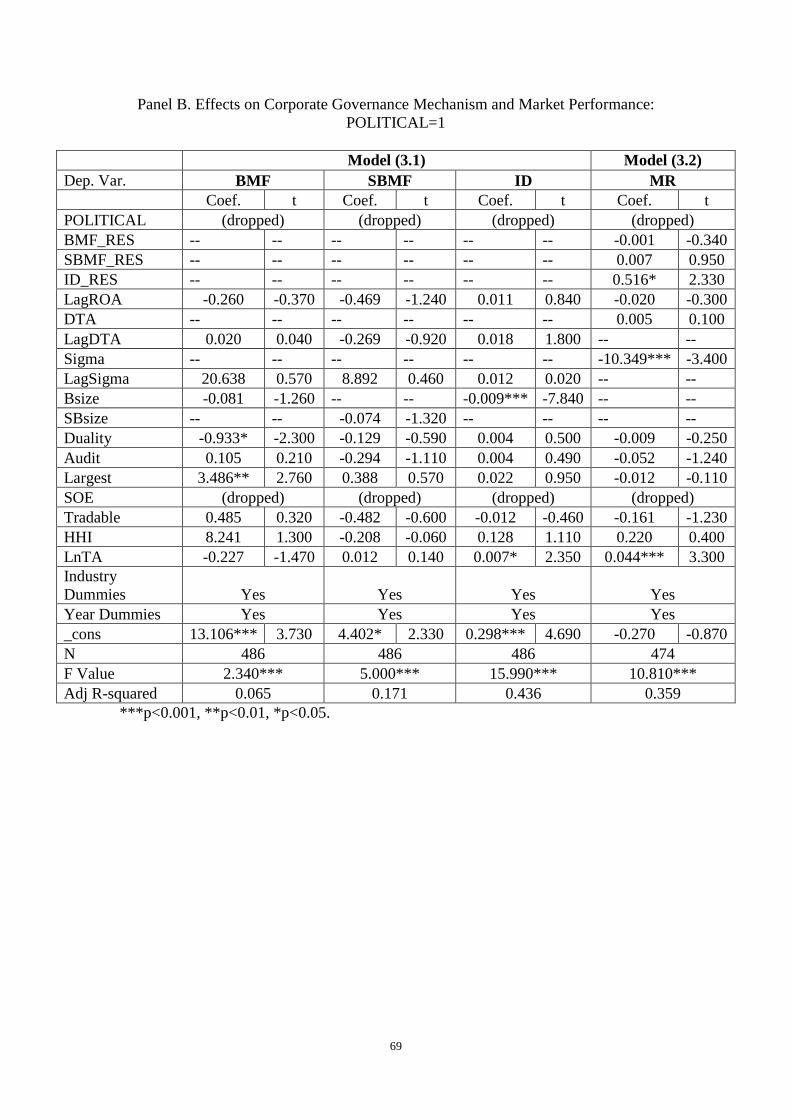
69
Panel B. Effects on Corporate Governance Mechanism and Market Performance: POLITICAL=1
Model (3.1) Model (3.2) Dep. Var. BMF SBMF ID MR Coef. t Coef. t Coef. t Coef. t POLITICAL (dropped) (dropped) (dropped) (dropped) BMF_RES -- -- -- -- -- -- -0.001 -0.340 SBMF_RES -- -- -- -- -- -- 0.007 0.950 ID_RES -- -- -- -- -- -- 0.516* 2.330 LagROA -0.260 -0.370 -0.469 -1.240 0.011 0.840 -0.020 -0.300 DTA -- -- -- -- -- -- 0.005 0.100 LagDTA 0.020 0.040 -0.269 -0.920 0.018 1.800 -- -- Sigma -- -- -- -- -- -- -10.349*** -3.400 LagSigma 20.638 0.570 8.892 0.460 0.012 0.020 -- -- Bsize -0.081 -1.260 -- -- -0.009*** -7.840 -- -- SBsize -- -- -0.074 -1.320 -- -- -- -- Duality -0.933* -2.300 -0.129 -0.590 0.004 0.500 -0.009 -0.250 Audit 0.105 0.210 -0.294 -1.110 0.004 0.490 -0.052 -1.240 Largest 3.486** 2.760 0.388 0.570 0.022 0.950 -0.012 -0.110 SOE (dropped) (dropped) (dropped) (dropped) Tradable 0.485 0.320 -0.482 -0.600 -0.012 -0.460 -0.161 -1.230 HHI 8.241 1.300 -0.208 -0.060 0.128 1.110 0.220 0.400 LnTA -0.227 -1.470 0.012 0.140 0.007* 2.350 0.044*** 3.300 Industry Dummies Yes Yes Yes Yes Year Dummies Yes Yes Yes Yes _cons 13.106*** 3.730 4.402* 2.330 0.298*** 4.690 -0.270 -0.870 N 486 486 486 474 F Value 2.340*** 5.000*** 15.990*** 10.810*** Adj R-squared 0.065 0.171 0.436 0.359
***p<0.001, **p<0.01, *p<0.05.

Panel C. Effects on Executive Compensation: Model (3.3) POLITICAL=0 POLITICAL=1
Dep. Var. Ln(PayTotal) Ln(PayBtop3) Ln(PayMtop3) Ln(PayTotal) Ln(PayBtop3) Ln(PayMtop3) Coef. t Coef. t Coef. t Coef. t Coef. t Coef. t POLITICAL (dropped) (dropped) (dropped) (dropped) (dropped) (dropped) BMF_RES -0.007 -0.880 -0.038 -1.520 0.002 0.190 0.007 0.630 -0.017 -0.620 -0.001 -0.070 SBMF_RES 0.011 0.670 -0.005 -0.090 0.014 0.800 -0.036 -1.660 -0.105* -2.120 -0.024 -1.060 ID_RES 0.778 1.590 2.241 1.440 1.333** 2.630 0.218 0.350 -0.850 -0.580 0.003 0.010 PERF_RES 0.073 0.680 0.541 1.590 0.092 0.830 0.084 0.630 0.360 1.180 0.136 0.980 DTA -0.370 -1.190 0.316 0.320 -0.175 -0.550 -0.116 -0.910 -0.123 -0.430 -0.011 -0.080 Duality 0.123 1.730 0.233 1.030 0.153* 2.070 -0.154 -1.580 0.215 0.960 0.048 0.470 Audit 0.586*** 6.060 0.810* 2.360 0.630*** 6.170 -0.095 -0.820 -0.421 -1.550 -0.062 -0.510 Largest -0.341 -1.300 -0.351 -0.420 -0.834** -3.040 -0.704* -2.290 -0.797 -1.150 -0.988** -3.100 SOE (dropped) (dropped) (dropped) (dropped) (dropped) (dropped) Tradable -0.014 -0.050 -0.731 -0.850 -0.156 -0.570 -0.553 -1.520 0.833 1.020 -0.783* -2.080 HHI 0.168 0.120 -4.673 -1.080 -1.883 -1.330 0.164 0.110 -5.873 -1.710 -1.465 -0.930 LnTA 0.469*** 14.610 0.557*** 5.500 0.410*** 12.330 0.284*** 7.910 0.258** 3.140 0.254*** 6.850 Industry Dummies Yes Yes Yes Yes Yes Yes Year Dummies Yes Yes Yes Yes Yes Yes _cons 4.233*** 6.610 1.526 0.760 4.815*** 7.270 8.734*** 11.820 7.255*** 4.290 8.728*** 11.450 N 677 637 680 460 441 461 F Value 17.350*** 3.750*** 15.990*** 6.310*** 2.580*** 5.790*** Adj R-squared 0.386 0.101 0.365 0.231 0.085 0.213 ***p<0.001, **p<0.01, *p<0.05.
70

71
Table 6. Effects of Political Connections of Ultimate Controllers for Firms with SOE>0
POLITICAL=0 vs. POLITICAL=1
Results presented in this table are based on the sub-sample with firms that have government-owned shares. Panel A of this table presents the results of Models (3.1) and (3.2) using firms that do not have political connections, while Panel B presents those using firms that have politically connected ultimate controllers. Panel C presents the results of Model (3.3) using the sub-sample of firms that have government-owned shares.
Panel A. Effects on Corporate Governance Mechanism and Market Performance: POLITICAL=0
Model (3.1) Model (3.2) Dep. Var. BMF SBMF ID MR Coef. t Coef. t Coef. t Coef. t POLITICAL (dropped) (dropped) (dropped) (dropped) BMF_RES -- -- -- -- -- -- 0.003 1.160 SBMF_RES -- -- -- -- -- -- -0.007 -1.400 ID_RES -- -- -- -- -- -- -0.223 -1.370 LagROA 0.434 0.870 0.369 1.350 0.016* 2.070 0.030 0.770 DTA -- -- -- -- -- -- 0.021 0.270 LagDTA 0.290 0.280 1.071 1.900 -0.008 -0.520 -- -- Sigma -- -- -- -- -- -- -7.434*** -4.060 LagSigma 28.537 1.140 23.699 1.710 0.151 0.390 -- -- Bsize -0.142** -2.620 -- -- -0.010*** -11.750 -- -- SBsize -- -- 0.035 0.830 -- -- -- -- Duality 0.139 0.410 0.306 1.630 -0.006 -1.150 0.034 1.230 Audit -0.038 -0.070 0.669* 2.130 0.029*** 3.240 -0.019 -0.420 Largest -0.456 -0.410 -0.187 -0.300 0.012 0.670 0.123 1.410 SOE 0.793 1.260 -0.108 -0.310 -0.010 -1.040 0.004 0.080 Tradable 0.111 0.090 -0.064 -0.090 -0.047* -2.350 0.022 0.220 HHI 10.874* 2.040 -1.516 -0.510 -0.010 -0.120 0.159 0.380 LnTA 0.224 1.800 -0.014 -0.210 0.004* 1.960 0.032*** 3.210 Industry Dummies Yes Yes Yes Yes Year Dummies Yes Yes Yes Yes _cons 5.019 1.790 3.721* 2.410 0.387*** 8.840 -0.164 -0.730 N 1007 1003 1006 948 F Value 3.420*** 5.010*** 31.410*** 25.880*** Adj R-squared 0.059 0.094 0.440 0.424
***p<0.001, **p<0.01, *p<0.05.

72
Panel B. Effects on Corporate Governance Mechanism and Market Performance: POLITICAL=1
Model (3.1) Model (3.2) Dep. Var. BMF SBMF ID MR Coef. t Coef. t Coef. t Coef. t POLITICAL (dropped) (dropped) (dropped) (dropped) BMF_RES -- -- -- -- -- -- 0.002 1.280 SBMF_RES -- -- -- -- -- -- -0.001 -0.440 ID_RES -- -- -- -- -- -- 0.058 0.630 LagROA -0.823* -2.410 0.029 0.150 0.008 1.360 0.101** 3.120 DTA -- -- -- -- -- -- -0.002 -0.040 LagDTA -0.557 -0.870 -1.339*** -3.620 -0.002 -0.190 -- -- Sigma -- -- -- -- -- -- -5.701*** -4.730 LagSigma 62.928*** 4.080 7.900 0.890 -0.102 -0.370 -- -- Bsize -0.091*** -3.290 -- -- -0.006*** -12.900 -- -- SBsize -- -- 0.057* 2.480 -- -- -- -- Duality -0.149 -0.780 0.020 0.190 0.003 0.840 0.004 0.260 Audit -0.234 -1.110 0.066 0.540 -0.000 -0.070 0.042* 2.330 Largest 0.680 1.030 0.931* 2.460 -0.006 -0.540 0.106 1.880 SOE 0.183 0.380 -0.100 -0.360 -0.004 -0.440 -0.029 -0.690 Tradable 2.263*** 3.350 0.884* 2.280 0.017 1.370 -0.002 -0.030 HHI 6.253* 2.480 1.960 1.350 0.035 0.770 -0.102 -0.470 LnTA 0.292*** 3.790 0.088* 2.000 0.005*** 3.860 0.042*** 6.520 Industry Dummies Yes Yes Yes Yes Year Dummies Yes Yes Yes Yes _cons -0.668 -0.380 1.280 1.260 0.280*** 8.790 -0.436** -2.920 N 2582 2577 2584 2456 F Value 7.780*** 9.040*** 71.260*** 71.820*** Adj R-squared 0.064 0.075 0.414 0.447
***p<0.001, **p<0.01, *p<0.05.
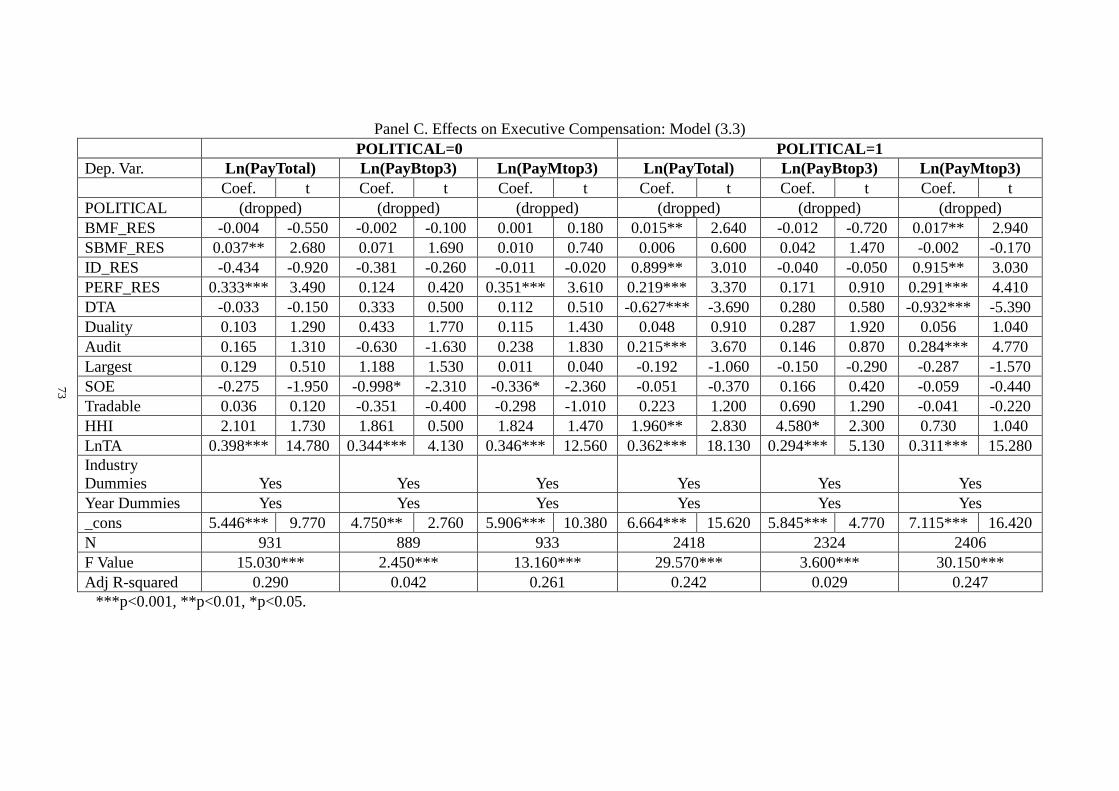
Panel C. Effects on Executive Compensation: Model (3.3) POLITICAL=0 POLITICAL=1 Dep. Var. Ln(PayTotal) Ln(PayBtop3) Ln(PayMtop3) Ln(PayTotal) Ln(PayBtop3) Ln(PayMtop3) Coef. t Coef. t Coef. t Coef. t Coef. t Coef. t POLITICAL (dropped) (dropped) (dropped) (dropped) (dropped) (dropped) BMF_RES -0.004 -0.550 -0.002 -0.100 0.001 0.180 0.015** 2.640 -0.012 -0.720 0.017** 2.940 SBMF_RES 0.037** 2.680 0.071 1.690 0.010 0.740 0.006 0.600 0.042 1.470 -0.002 -0.170 ID_RES -0.434 -0.920 -0.381 -0.260 -0.011 -0.020 0.899** 3.010 -0.040 -0.050 0.915** 3.030 PERF_RES 0.333*** 3.490 0.124 0.420 0.351*** 3.610 0.219*** 3.370 0.171 0.910 0.291*** 4.410 DTA -0.033 -0.150 0.333 0.500 0.112 0.510 -0.627*** -3.690 0.280 0.580 -0.932*** -5.390 Duality 0.103 1.290 0.433 1.770 0.115 1.430 0.048 0.910 0.287 1.920 0.056 1.040 Audit 0.165 1.310 -0.630 -1.630 0.238 1.830 0.215*** 3.670 0.146 0.870 0.284*** 4.770 Largest 0.129 0.510 1.188 1.530 0.011 0.040 -0.192 -1.060 -0.150 -0.290 -0.287 -1.570 SOE -0.275 -1.950 -0.998* -2.310 -0.336* -2.360 -0.051 -0.370 0.166 0.420 -0.059 -0.440 Tradable 0.036 0.120 -0.351 -0.400 -0.298 -1.010 0.223 1.200 0.690 1.290 -0.041 -0.220 HHI 2.101 1.730 1.861 0.500 1.824 1.470 1.960** 2.830 4.580* 2.300 0.730 1.040 LnTA 0.398*** 14.780 0.344*** 4.130 0.346*** 12.560 0.362*** 18.130 0.294*** 5.130 0.311*** 15.280 Industry Dummies Yes Yes Yes Yes Yes Yes Year Dummies Yes Yes Yes Yes Yes Yes _cons 5.446*** 9.770 4.750** 2.760 5.906*** 10.380 6.664*** 15.620 5.845*** 4.770 7.115*** 16.420 N 931 889 933 2418 2324 2406 F Value 15.030*** 2.450*** 13.160*** 29.570*** 3.600*** 30.150*** Adj R-squared 0.290 0.042 0.261 0.242 0.029 0.247
***p<0.001, **p<0.01, *p<0.05.
73

74
Table 7. Summary of the Results from Robustness Tests
SOE=0 SOE>0
PO
LIT
ICA
L=0
ID_RES positively affects Ln(PayMtop3)
at 1% significance level;
SBMF_RES positively affects Ln(PayTotal)
at 1% significance level;
PO
LIT
ICA
L=1
ID_RES positively affects MR at 5%
significance level;
SBMF_RES negatively affects
Ln(PayBtop3) at 5% significance level;
BMF_RES positively affects Ln(PayTotal)
and Ln(PayMtop3) at 1% significance level;
ID_RES positively affects Ln(PayTotal) and
Ln(PayMtop3) at 1% significance level;


![Corporate Governance Manualpaisalo.in/pdf/corporate-governance-en.pdf · [ 1 ] DEFINITIONS Corporate Governance Corporate Governance is the system of internal controls and procedures](https://img.pdfslide.us/doc/110x75/60457b037dc32d128b177c66/corporate-governance-1-definitions-corporate-governance-corporate-governance.jpg)