Embed Size (px)
Citation preview
Pakistan Journal of Commerce and Social Sciences
2017, Vol. 11 (1), 01-34
Pak J Commer Soc Sci
Corporate Governance and Corporate Social
Responsibility: The Case of Small, Medium, and
Large Firms
Sajid Gul (Corresponding author)
Air University School of Management, Islamabad, Pakistan
Email: [email protected]
Faqir Muhammad
Air University School of Management, Islamabad, Pakistan
Email: [email protected]
Abdul Rashid
International Islamic University, Islamabad, Pakistan
Email: [email protected]
Abstract
This paper aims to explore whether and how firm-level governance mechanisms affects
Corporate Social Responsibility (CSR) using a large sample of firms listed at Pakistan
Stock Exchange. Further, the paper investigates the differential effects of corporate
governance (CG) on CSR across small, medium, and large firms. The findings strongly
support the hypothesis that CG alone is not sufficient to induce firms to provide more
CSR information. Rather, we show that both CG and ownership structure matters and
have a vital role to play in firms’ choice of CSR engagement. The results reveal that
better governed firms have higher CSR disclosure when compared with lower CG firms
controlling for the level of insider ownership. Specifically, the results suggest that firms
are more likely to be involved in CSR when insiders’ ownership is at medium level (25%
to 50%) as compared to low (0 to 25%) or high level (>50%). Nonetheless, the estimates
suggest that CSR involvement decreases when the insider ownership goes beyond the
50% level. Finally, the results reveal that there are significant differences in the effects of
CG and other underlying empirical determinants of CSR across different sized firms.
Keywords: corporate social responsibility; corporate governance; insiders’ ownership;
system GMM
1. Introduction
The effectiveness of CG and accountability has been the subjects of heated debate after
the corporate accounting scandals around the world. The term CG, although used
extensively in the literature, generally lacks a well-accepted definition (Ekanayake,
2011). The existing definitions of CG, at best, can be classified into two categories based
on accounting and finance related CG literature, narrow and broad, depending on the
extent to which CG issues are addressed therein. The narrow perspective is orientated
towards only corporate accountability to shareholders. However, CG within the broader
Corporate Governance and Corporate Social Responsibility
2
perspective requires corporate accountability to shareholders and other stakeholders (e.g.,
investors, lenders, employees, customers, suppliers, government auditors). ‘Securities and
Exchange Commission of Pakistan’ [SECP] (2005) defined CG as:
“The mechanism by which the agency problems of corporation stakeholders, including
the shareholders, creditors, management, employees, consumers, and the public at large
are framed and sought to be resolved.”
Along with the acceleration of CG mechanisms, one of the most important corporate
trends of the previous decade is the growth of CSR (Khan et al., 2012). As in Ghazali
(2007), in these days, the main objective of the organizations is not only to make
maximum profit but it also includes an element of CSR and accountability. This is
because the business could not prosper in segregation. Rather, it also significantly
depends on the society to operate efficiently. There are several studies that have
separately explored CSR and CG in different aspects. However, there is relatively less
research on the link between CG and CSR. Ghazali (2007) argues that CSR reporting
means information disclosure on community development, environmental reporting,
products and services, and human resource aspects.
Corporate governance needs to be considered in determining CSR disclosure especially
board composition and ownership structure because CSR reporting is affected by the
motives, values, and choice of those who are involved in organizations decision making
process (Lau et al., 2016). Since, both ownership and board structure significantly differ
not only across firms but also across industries and nations, it is predicted that CSR will
also vary subsequently. In a firm with a high level of ownership concentration, the
incentive should be higher to support the controlling owner entrenchment. Nevertheless,
it will be difficult for management to use CSR to mask their opportunistic behaviors, if an
effective system exists to monitor their decisions. However, Choi et al. (2013) suggest
that in weak governed firms CSR involvement induced by opportunistic managers would
be more prominent in order to fulfill personal objectives by overinvesting in CSR. Hence,
CSR debate continues to flourish without a clear consensus on its meaning or value.
1.1 Research Problem
In principle, CG, ownership structure, CSR may have different strengths of relationship,
depending on the market’s level of legal protection and the extent of concentrated
ownership. However, empirical evidence on this relationship is very limited. Yet, it is
important to know how CG is related to CSR. It is also important to understand how the
level of ownership structure and degrees of ownership concentration affect the
association between CG and CSR.
1.2 Literature Gaps and Contributions of the Study
The role of CG in stakeholders’ value creation has become the subject of great interest
recently. Nonetheless, most of the previous studies follow a fragmented approach,
investigating the link between isolated aspects of governance and CSR. However, it could
be argued that firms choose sets of governance arrangements, which in turn, are analysed
as a whole by investors. Furthermore, it is assumed that CG mechanisms are
Gul et al.
3
complements and can act as substitutes for each other (Cheung et al., 2011). Therefore,
rather focusing on just individual aspects of CG, the current study also employs a
composite measure of CG. In addition, the review of the literature on CG has shown that
the previous existing studies have included either only relatively large firms in their
sample or pooled all listed firms. However, different sized firms have different
characteristics including ownership structure and information asymmetries (Ronnie Lo,
2009). Hence, this study contributes to the literature by classifying the sample firms into
large, medium, and small firms. By doing this, the study provides a novel contribution to
the literature as shown by results that firms of different sizes differ in terms of their CG.
Moreover, the literature review also suggests that there is lack of longitudinal studies on
CG. Thus, we do not have robust evidence on the role of CG in firms’ CSR activities.
Nevertheless, the panel nature of our data enables us to examine the CG-CSR link over a
period of twelve years. Definitely, combining cross sectional variations across time in CG
will yield more reliable and robust estimates. Furthermore, CG measures used in previous
studies are not devised to rank firms on CG quality. However, in this study, firms are
ranked into high CG and low CG on the basis of their median score of CG.
This study also contributes further evidence on the issue whether CSR is a joint function
of the CG and the ownership structure of firms. The previous existing studies on the
association between CG and CSR do not emphasize on the issue on these lines. Hence,
this study presents a novel contribution to the literature by showing that firm’s social
performance varies with the level of its insiders’ ownership, and the pattern differs
relying jointly on CG and insider ownership.
1.3 Significance of the Study
The findings of this study have important implications. For the managers, the empirical
results presented in the paper clarify that the costly exercise of disclosure of CG
information can help in enhancing CSR. Similarly, the regulators may take the results
into consideration when they are going to determine the appropriate levels of disclosure
and compliances of regulations in the future. The results show that the implementation of
CG codes that came into effect from 2002 are effective and have enhanced CG level. The
CG role of mitigating agency conflicts to maximize wealth of shareholder has evolved to
now creating value for not only shareholders but also protecting all other stakeholders’
interests. In Pakistan, the ownership of firms is highly concentrated in families and
business is conducted under a week legal investor-protection regime (Javid & Iqbal,
2010). The separation of ownership and control in Pakistani firms is not as clear as in the
Western countries. Therefore, the empirical findings on the role of CG in CSR activities
based on a sample of Pakistani firms can have significant meanings and implications for
those firms operating in markets in which high concentration in family ownership is
prevalent.
1.4 Theoretical Orientation
For developing and testing the research hypotheses, it is important to establish a
theoretical base. The theoretical foundation of this study is premised primarily on agency,
Corporate Governance and Corporate Social Responsibility
4
stakeholder, and legitimacy theories. Furthermore, most of the results of this study are
supported by these theories. The most prominent is the agency theory as majority of the
CG research evolves from this theory. According to Mees (2015), in the CG literature,
agency theory is commonly used to describe firm managers’ CG decisions. However, due
to the differences in environmental characteristics, the applicability of agency theory in
Pakistan may be different than developed countries. Hence, the risk of expropriation by
the dominant or controlling shareholder is the main agency problem and not the manager-
shareholder conflict (Javid & Iqbal, 2010). As this study investigates the impact of CG on
CSR, CG is the outcome of agency problem (ownership structure). Therefore, the theory
of agency is used in this study to understand the managers’ behaviour. The agency theory
is pertinent as it explains the conditions under which a company is likely to adopt CG
practices.
Contrary to the agency theory, the theory of stakeholder is a broader concept that
considers the interests of diverse constituents comprising interest groups related to
environmental, social, and ethical considerations (Mainardes et al., 2011). Pease and
Macmillan (1993) argue that in the modern concept of CG, a set of legislative, regulatory
and legal market mechanisms are put in place inviting firms to consider all other interest
groups. Under a stakeholder approach, the support of all of their stakeholders would be
required by a company in order to be successful and survive in the long run. Hence,
social pressure is likely to influence the future course of CG, where firms have to focus
their attention on larger stakeholders’ community.
The stewardship theory unlike the agency theory is an alternative theory for researchers,
which states that the agents are trustworthy and good stewards of firms’ resources. This
makes monitoring unnecessary (Hu & Alon, 2014). The legitimacy theory asserts that the
survival of companies depends on the extent to which they operate according to the
bounds and norms of the society. CG can be related to the legitimacy concept because
management has to legitimise its actions in order to be accepted in the society (Frynas &
Stephens, 2015). Through CG information, organisations signal to all their stakeholders
that they are abiding with the terms of the social contract and hence attain the legitimacy
imperative for their continued survival.
Furthermore, both legitimacy and stakeholder theories can be regarded as complementing
each other. In particular, the stakeholder theory provides the basis for legitimacy theory.
Based on the above discussion, we can conclude that there is some degree of consistency,
complementarity, and compatibility of these theories with each other.
2. Literature Review
Jo and Harjoto (2011) find that after controlling for various firm characteristics several
governance mechanisms including board leadership and independence, analyst following,
institutional ownership, and antitakeover provisions appears to have a direct positive
influence on CSR engagement. However, one should note that Jo and Harjoto use only
institutional ownership to study its impact on CSR, whereas Khan et al. (2012) also used
foreign and public ownership and percentage of ownership held by management. The
results provide evidence that foreign and public ownership, presence of audit committee,
Gul et al.
5
and board independence have significant positive effect on CSR disclosures, however
negative in the case of management ownership. Nevertheless, they fail to find any
significant evidence between CEO duality and CSR disclosure. They also document that
the dominance of family ownership on CSR disclosure is alleviated to some extent by
sound CG mechanisms. In contrast to Jo and Harjoto (2011) and Khan et al. (2012),
Ghazali (2012) finds that boards with independent directors are less involved in CSR
activities. The result may imply that for independent directors, CSR engagement is not
the primary concern. However, the result was statistically significant at margin (the 10%
level).
Ghazali (2007) finds evidence that CSR disclosure is significantly higher in firms that are
larger in size and have higher government ownership. However, similar to Khan et al.
(2012), Ghazali finds that high proportion of management ownership and CSR disclosure
is negatively correlated. On the other hand, Said et al. (2009) show that only the presence
of audit committee, ownership concentration, and government ownership significantly
positively impact the extent of CSR disclosures. Their results contradict the findings of
previous studies discussed above that ownership concentration and CSR are negatively
correlated.
The results presented by Giannarakis (2014) indicate that profitability, the board
commitment to CSR, and firm size positively affect the extent of CSR disclosure,
whereas financial leverage and CSR disclosure is inversely related. Rees and Rodionova
(2015) examine whether CG promotes CSR disclosure through its effect on managers’
intention and whether CG mediates the influence of family ownership on social and
environmental improvements. Their results reveal that ESG performance is negatively
affected by closely held equity and family ownership. Nevertheless, after controlling for
CG, closely held equity and ESG score is no longer associated but family ownership
retains a significant inverse relationship.
Branco and Rodrigues (2008) find that company size is a crucial determinant for both
types of disclosure. The factor of media exposure is an important characteristic only for
annual reports while financial leverage has a negative effect on the extent of disclosure
based on the web sites. Finally, profitability is positively significant only to products and
consumers information of annual reports. Reverte (2009) finds evidence that industry
type, firm size, and media exposure are the most crucial determinants of the extent of
CSR disclosure. In addition, the results also reveal that firms with higher CSR ratings
have a less concentrated ownership. Nevertheless, the variable financial leverage does not
seem to explain differences in CSR disclosure, hence contradicting with the findings of
Giannarakis (2014). Mallin and Michelon (2011) investigate whether board reputation
(board diversity, leadership, composition, competence, and structure) affect social
performance of firms. The results suggest that corporate social performance is positively
related to the proportions of independent, community influential and female directors.
Nevertheless, community influential directors with multiple directorships and CEO
duality significantly negatively affect corporate social performance.
Corporate Governance and Corporate Social Responsibility
6
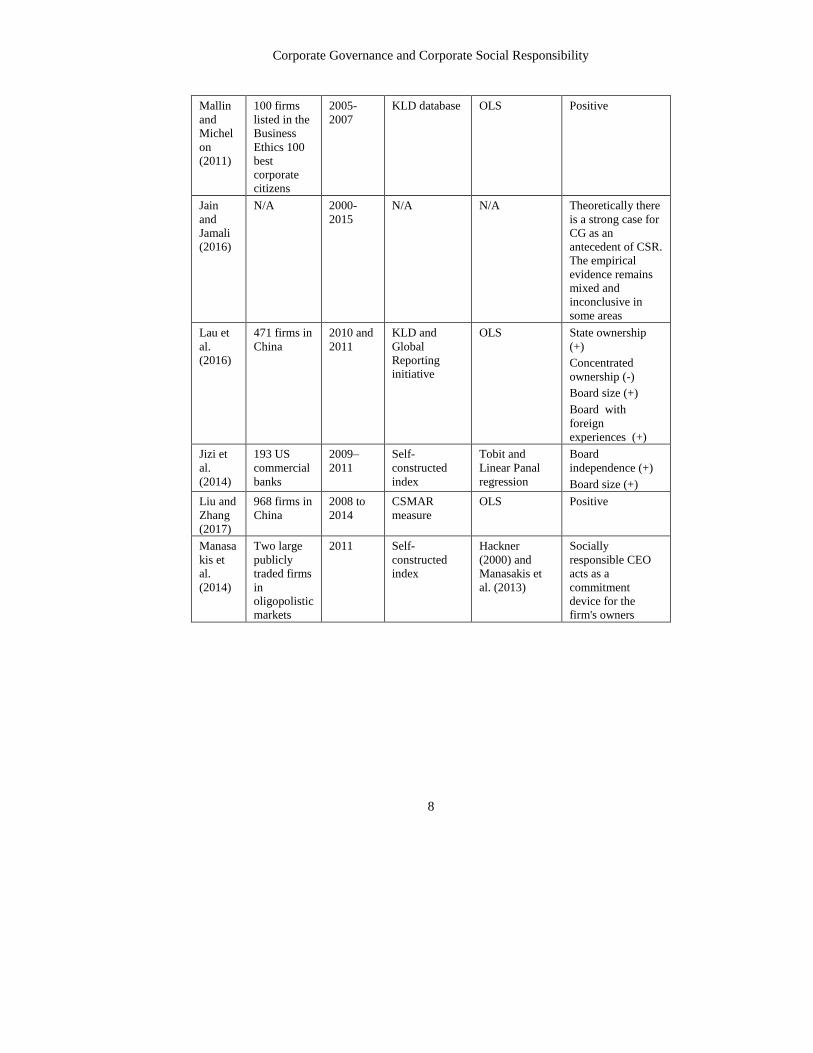
Jain and Jamali (2016) critically review the previous literature on the impact of CG
mechanisms at the institutional, firm, group, and individual levels on CSR. They argue
that theoretically there is a strong case for CG as an antecedent of CSR and promising
patterns are beginning to emerge in the literature. Yet, the empirical evidence remains
mixed and inconclusive in some areas. They recommend that greater scholarly attention
needs to be accorded to disaggregating variables and comprehending how multiple
configurations of CG mechanisms interact and combine to impact firms' CSR behavior.
Lau et al. (2016) provide evidence that state ownership positively affects CSR
performance, whereas concentrated ownership negatively affects CSR. The variable
board composition and composition of TMT is not statistically significant. However,
board size as well as board members having foreign experiences have significant effects
on CSR. Jizi et al. (2014) find that even after controlling for profitability, audit
committee characteristics, size and risk, and board meeting frequency, both size and
independence of the board positively affect disclosure of CSR. However, in contrast to
Khan et al. (2012) who find insignificant link between CEO duality and CSR, Jizi et al.
(2014) find a significant positive association between CEO duality and CSR.
Liu and Zhang (2017) examine the link between CG, CSR, and enterprise value. The
results reveal that supervisory board meetings, state ownership, number of directors, and
managerial shareholding positively affect CSR while ownership by largest shareholders
negatively affects CSR. Moreover, they find that CSR information is not beneficial for
the short-term profit of an enterprise but can increase its long-term value. Manasakis et
al. (2014) show that hiring ‘individually’ socially responsible CEO acts as a commitment
device for the firm's owners and signal to consumers that the missioned CSR activities
will be undertaken. They further show that for consumers as well as firms corporate
social responsibility activities are welfare enhancing.
To some extent our study is closer in spirit to Ghazali (2007) and Rees & Rodionova
(2015). However, they examine the impact of CG on managers’ intention to promote
CSR. They have simply studied the impact of management and/or family ownership on
CSR. We substantially depart from these papers as we investigate how CSR is related to
firms’ state of CG, subject to the various levels of ownership structure and degrees of
ownership concentration, controlling for the impact of external CG and other firm
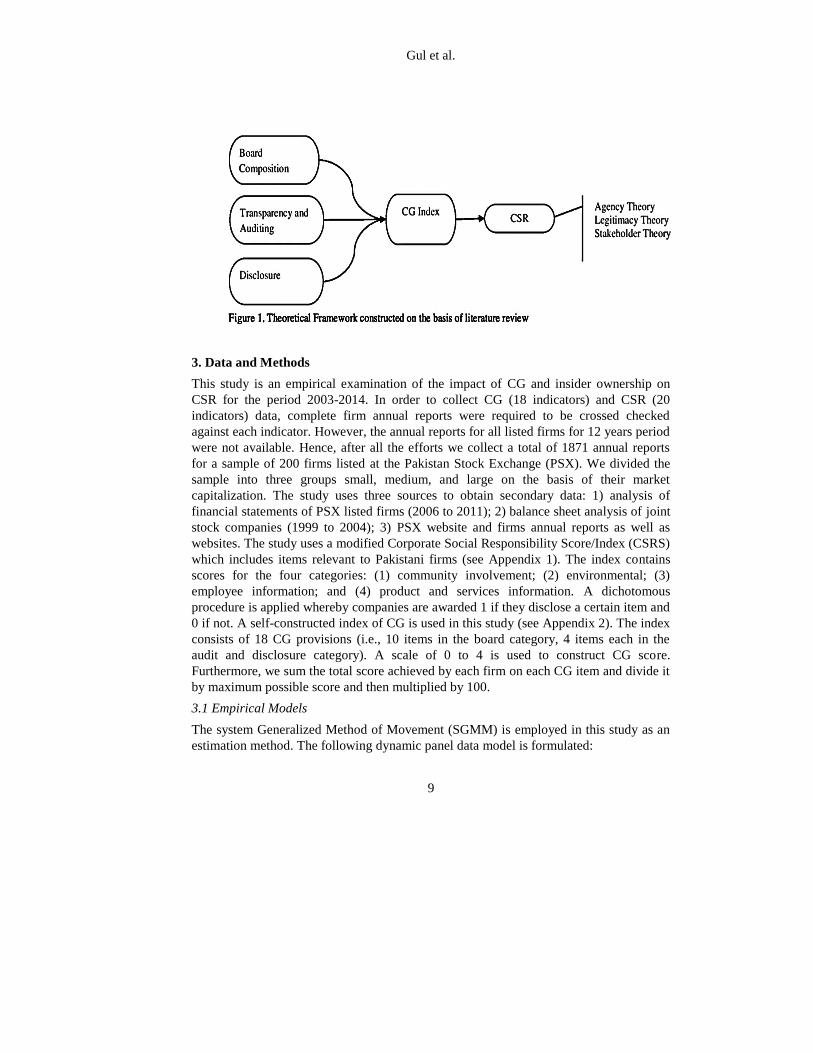
characteristics. Theoretical framework constructed based the review of the existing
literature is presented in Figure 1. The figure shows that CG index is developed based on
board composition, transparency and auditing, and disclosure factors. The figure also
shows that the constructed index is then related to SCR activities as per proposed by the
agency theory, legitimacy theory, and the stakeholder theory. The summary of the
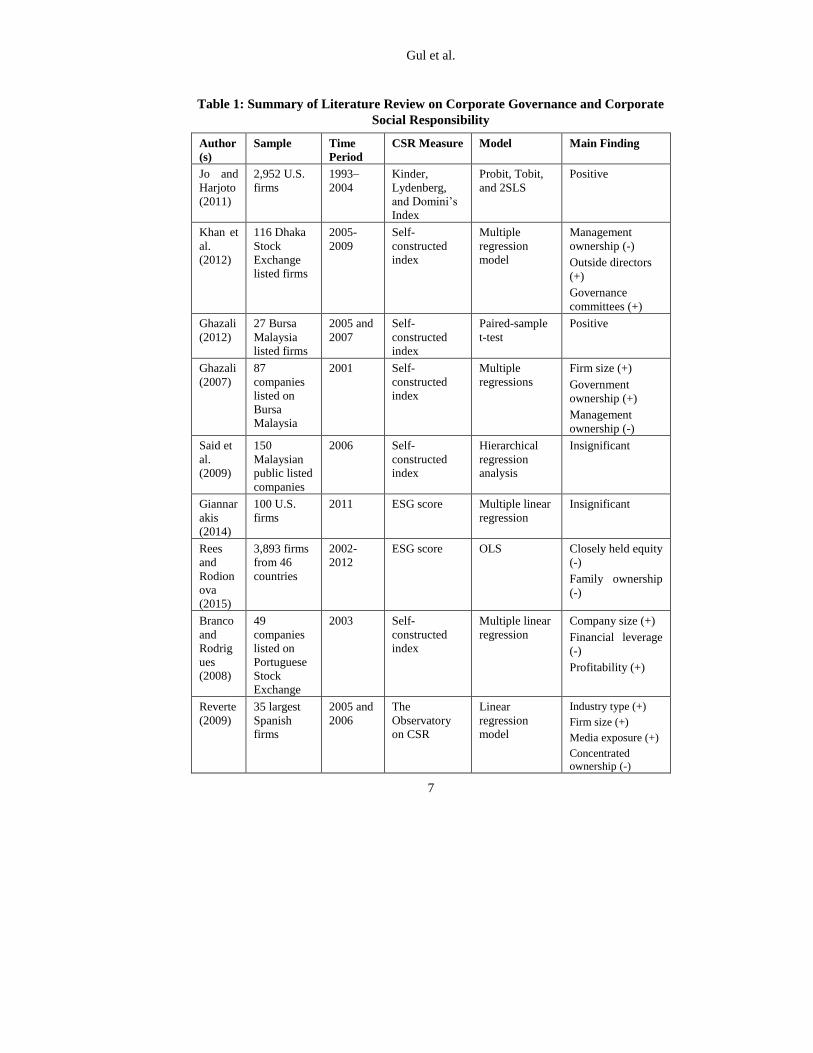
literature review is presented in Table 1.
Gul et al.
7
Table 1: Summary of Literature Review on Corporate Governance and Corporate
Social Responsibility
Author
(s)
Sample Time
Period
CSR Measure Model Main Finding
Jo and
Harjoto
(2011)
2,952 U.S.
firms
1993–
2004
Kinder,
Lydenberg,
and Domini’s
Index
Probit, Tobit,
and 2SLS
Positive
Khan et
al.
(2012)
116 Dhaka
Stock
Exchange
listed firms
2005-
2009
Self-
constructed
index
Multiple
regression
model
Management
ownership (-)
Outside directors
(+)
Governance
committees (+)
Ghazali
(2012)
27 Bursa
Malaysia
listed firms
2005 and
2007
Self-
constructed
index
Paired-sample
t-test
Positive
Ghazali
(2007)
87
companies
listed on
Bursa
Malaysia
2001 Self-
constructed
index
Multiple
regressions
Firm size (+)
Government
ownership (+)
Management
ownership (-)
Said et
al.
(2009)
150
Malaysian
public listed
companies
2006 Self-
constructed
index
Hierarchical
regression
analysis
Insignificant
Giannar
akis
(2014)
100 U.S.
firms
2011 ESG score Multiple linear
regression
Insignificant
Rees
and
Rodion
ova
(2015)
3,893 firms
from 46
countries
2002-
2012
ESG score OLS Closely held equity
(-)
Family ownership
(-)
Branco
and
Rodrig
ues
(2008)
49
companies
listed on
Portuguese
Stock
Exchange
2003 Self-
constructed
index
Multiple linear
regression
Company size (+)
Financial leverage
(-)
Profitability (+)
Reverte
(2009)
35 largest
Spanish
firms
2005 and
2006
The
Observatory
on CSR
Linear
regression
model
Industry type (+)
Firm size (+)
Media exposure (+)
Concentrated
ownership (-)
Corporate Governance and Corporate Social Responsibility
8
Mallin
and
Michel
on
(2011)
100 firms
listed in the
Business
Ethics 100
best
corporate
citizens
2005-
2007
KLD database
OLS Positive
Jain
and
Jamali
(2016)
N/A 2000-
2015
N/A N/A Theoretically there
is a strong case for
CG as an
antecedent of CSR.
The empirical
evidence remains
mixed and
inconclusive in
some areas
Lau et
al.
(2016)
471 firms in
China
2010 and
2011
KLD and
Global
Reporting
initiative
OLS State ownership
(+)
Concentrated
ownership (-)
Board size (+)
Board with
foreign
experiences (+)
Jizi et
al.
(2014)
193 US
commercial
banks
2009–
2011
Self-
constructed
index
Tobit and
Linear Panal
regression
Board
independence (+)
Board size (+)
Liu and
Zhang
(2017)
968 firms in
China
2008 to
2014
CSMAR
measure
OLS Positive
Manasa
kis et
al.
(2014)
Two large
publicly
traded firms
in
oligopolistic
markets
2011 Self-
constructed
index
Hackner
(2000) and
Manasakis et
al. (2013)
Socially
responsible CEO
acts as a
commitment
device for the
firm's owners
Gul et al.
9
3. Data and Methods
This study is an empirical examination of the impact of CG and insider ownership on
CSR for the period 2003-2014. In order to collect CG (18 indicators) and CSR (20
indicators) data, complete firm annual reports were required to be crossed checked
against each indicator. However, the annual reports for all listed firms for 12 years period
were not available. Hence, after all the efforts we collect a total of 1871 annual reports
for a sample of 200 firms listed at the Pakistan Stock Exchange (PSX). We divided the
sample into three groups small, medium, and large on the basis of their market
capitalization. The study uses three sources to obtain secondary data: 1) analysis of
financial statements of PSX listed firms (2006 to 2011); 2) balance sheet analysis of joint
stock companies (1999 to 2004); 3) PSX website and firms annual reports as well as
websites. The study uses a modified Corporate Social Responsibility Score/Index (CSRS)
which includes items relevant to Pakistani firms (see Appendix 1). The index contains
scores for the four categories: (1) community involvement; (2) environmental; (3)
employee information; and (4) product and services information. A dichotomous
procedure is applied whereby companies are awarded 1 if they disclose a certain item and
0 if not. A self-constructed index of CG is used in this study (see Appendix 2). The index
consists of 18 CG provisions (i.e., 10 items in the board category, 4 items each in the
audit and disclosure category). A scale of 0 to 4 is used to construct CG score.
Furthermore, we sum the total score achieved by each firm on each CG item and divide it
by maximum possible score and then multiplied by 100.
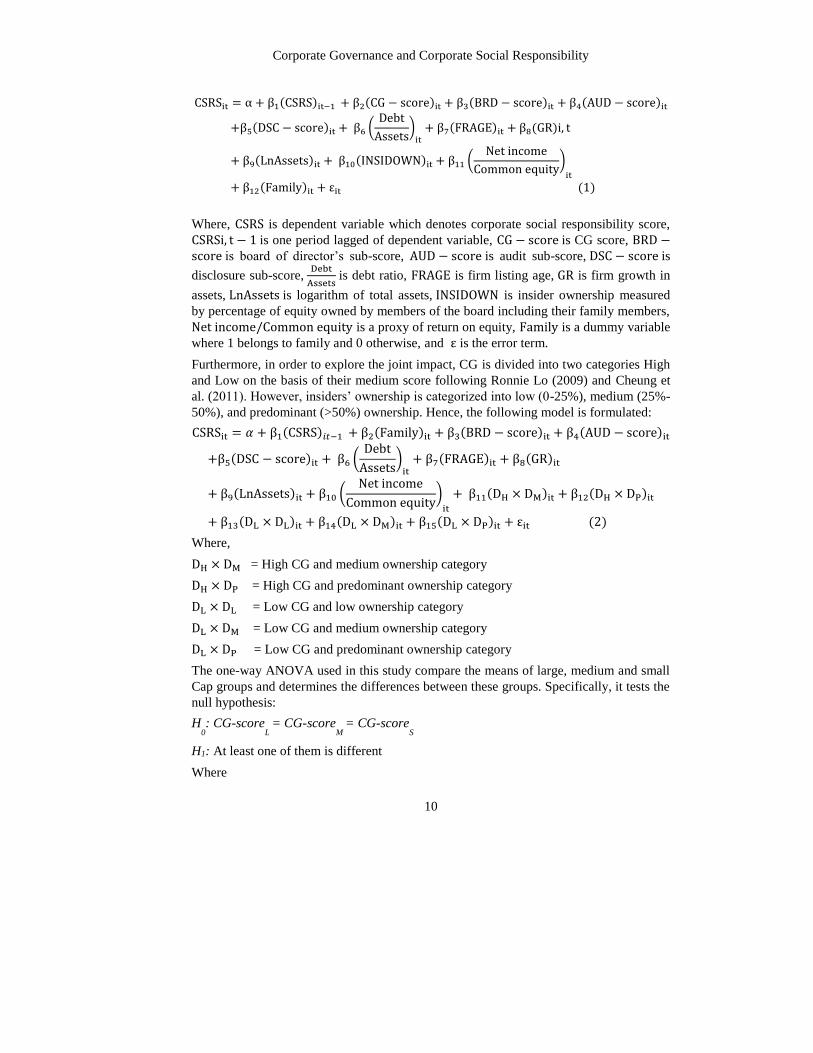
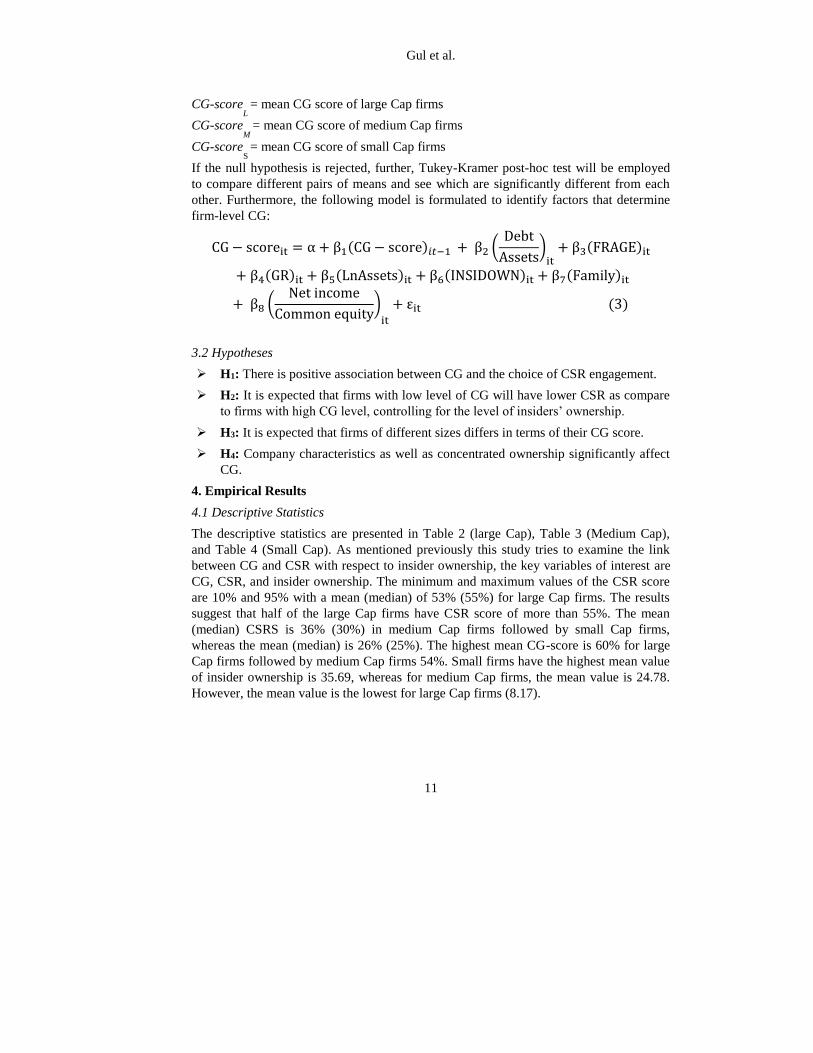
3.1 Empirical Models
The system Generalized Method of Movement (SGMM) is employed in this study as an
estimation method. The following dynamic panel data model is formulated:
Corporate Governance and Corporate Social Responsibility
10
CSRSit = α + β1(CSRS)it−1 + β2(CG − score)it + β3(BRD − score)it + β4(AUD − score)it
+β5(DSC − score)it + β6 (Debt
Assets)
it
+ β7(FRAGE)it + β8(GR)i, t
+ β9(LnAssets)it + β10(INSIDOWN)it + β11 (Net income
Common equity)
it
+ β12(Family)it + εit
(1)
Where, CSRS is dependent variable which denotes corporate social responsibility score,
CSRSi, t − 1 is one period lagged of dependent variable, CG − score is CG score, BRD −score is board of director’s sub-score, AUD − score is audit sub-score, DSC − score is
disclosure sub-score, Debt
Assets is debt ratio, FRAGE is firm listing age, GR is firm growth in
assets, LnAssets is logarithm of total assets, INSIDOWN is insider ownership measured
by percentage of equity owned by members of the board including their family members,
Net income/Common equity is a proxy of return on equity, Family is a dummy variable
where 1 belongs to family and 0 otherwise, and ε is the error term.
Furthermore, in order to explore the joint impact, CG is divided into two categories High
and Low on the basis of their medium score following Ronnie Lo (2009) and Cheung et
al. (2011). However, insiders’ ownership is categorized into low (0-25%), medium (25%-
50%), and predominant (>50%) ownership. Hence, the following model is formulated:
CSRSit = 𝛼 + β1(CSRS)𝑖𝑡−1 + β2(Family)it + β3(BRD − score)it + β4(AUD − score)it
+β5(DSC − score)it + β6 (Debt
Assets)
it+ β7(FRAGE)it + β8(GR)it
+ β9(LnAssets)it + β10 (Net income
Common equity)
it
+ β11(DH × DM)it + β12(DH × DP)it
+ β13(DL × DL)it + β14(DL × DM)it + β15(DL × DP)it + εit (2)
Where,
DH × DM = High CG and medium ownership category
DH × DP = High CG and predominant ownership category
DL × DL = Low CG and low ownership category
DL × DM = Low CG and medium ownership category
DL × DP = Low CG and predominant ownership category
The one-way ANOVA used in this study compare the means of large, medium and small
Cap groups and determines the differences between these groups. Specifically, it tests the
null hypothesis:
H0: CG-score
L = CG-score
M = CG-score
S
H1: At least one of them is different
Where
Gul et al.
11
CG-scoreL
= mean CG score of large Cap firms
CG-scoreM
= mean CG score of medium Cap firms
CG-scoreS
= mean CG score of small Cap firms
If the null hypothesis is rejected, further, Tukey-Kramer post-hoc test will be employed
to compare different pairs of means and see which are significantly different from each
other. Furthermore, the following model is formulated to identify factors that determine
firm-level CG:
CG − scoreit = α + β1(CG − score)𝑖𝑡−1 + β2 (Debt
Assets)
it+ β3(FRAGE)it
+ β4(GR)it + β5(LnAssets)it + β6(INSIDOWN)it + β7(Family)it
+ β8 (Net income
Common equity)
it
+ εit (3)
3.2 Hypotheses
H1: There is positive association between CG and the choice of CSR engagement.
H2: It is expected that firms with low level of CG will have lower CSR as compare
to firms with high CG level, controlling for the level of insiders’ ownership.
H3: It is expected that firms of different sizes differs in terms of their CG score.
H4: Company characteristics as well as concentrated ownership significantly affect
CG.
4. Empirical Results
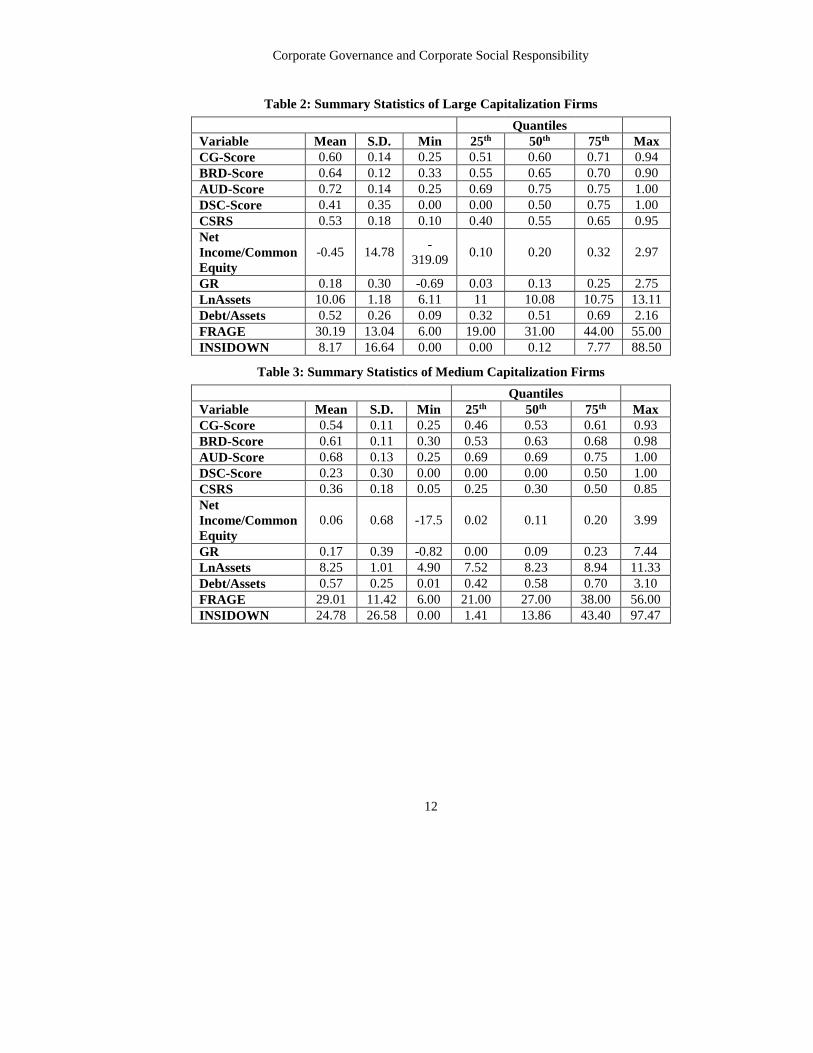
4.1 Descriptive Statistics
The descriptive statistics are presented in Table 2 (large Cap), Table 3 (Medium Cap),
and Table 4 (Small Cap). As mentioned previously this study tries to examine the link
between CG and CSR with respect to insider ownership, the key variables of interest are
CG, CSR, and insider ownership. The minimum and maximum values of the CSR score
are 10% and 95% with a mean (median) of 53% (55%) for large Cap firms. The results
suggest that half of the large Cap firms have CSR score of more than 55%. The mean
(median) CSRS is 36% (30%) in medium Cap firms followed by small Cap firms,
whereas the mean (median) is 26% (25%). The highest mean CG-score is 60% for large
Cap firms followed by medium Cap firms 54%. Small firms have the highest mean value
of insider ownership is 35.69, whereas for medium Cap firms, the mean value is 24.78.
However, the mean value is the lowest for large Cap firms (8.17).
Corporate Governance and Corporate Social Responsibility
12
Table 2: Summary Statistics of Large Capitalization Firms
Quantiles
Variable Mean S.D. Min 25th 50th 75th Max
CG-Score 0.60 0.14 0.25 0.51 0.60 0.71 0.94
BRD-Score 0.64 0.12 0.33 0.55 0.65 0.70 0.90
AUD-Score 0.72 0.14 0.25 0.69 0.75 0.75 1.00
DSC-Score 0.41 0.35 0.00 0.00 0.50 0.75 1.00
CSRS 0.53 0.18 0.10 0.40 0.55 0.65 0.95
Net
Income/Common
Equity
-0.45 14.78 -
319.09 0.10 0.20 0.32 2.97
GR 0.18 0.30 -0.69 0.03 0.13 0.25 2.75
LnAssets 10.06 1.18 6.11 11 10.08 10.75 13.11
Debt/Assets 0.52 0.26 0.09 0.32 0.51 0.69 2.16
FRAGE 30.19 13.04 6.00 19.00 31.00 44.00 55.00
INSIDOWN 8.17 16.64 0.00 0.00 0.12 7.77 88.50
Table 3: Summary Statistics of Medium Capitalization Firms
Quantiles
Variable Mean S.D. Min 25th 50th 75th Max
CG-Score 0.54 0.11 0.25 0.46 0.53 0.61 0.93
BRD-Score 0.61 0.11 0.30 0.53 0.63 0.68 0.98
AUD-Score 0.68 0.13 0.25 0.69 0.69 0.75 1.00
DSC-Score 0.23 0.30 0.00 0.00 0.00 0.50 1.00
CSRS 0.36 0.18 0.05 0.25 0.30 0.50 0.85
Net
Income/Common
Equity
0.06 0.68 -17.5 0.02 0.11 0.20 3.99
GR 0.17 0.39 -0.82 0.00 0.09 0.23 7.44
LnAssets 8.25 1.01 4.90 7.52 8.23 8.94 11.33
Debt/Assets 0.57 0.25 0.01 0.42 0.58 0.70 3.10
FRAGE 29.01 11.42 6.00 21.00 27.00 38.00 56.00
INSIDOWN 24.78 26.58 0.00 1.41 13.86 43.40 97.47
Gul et al.
13
Table 4: Summary Statistics of Small Capitalization Firms
Quantiles
Variable Mean S.D. Min 25th 50th 75th Max
CG-Score 0.48 0.10 0.21 0.42 0.49 0.56 0.75
BRD-Score 0.58 0.12 0.20 0.48 0.58 0.68 0.80
AUD-Score 0.63 0.16 0.25 0.44 0.69 0.75 0.75
DSC-Score 0.12 0.20 0.00 0.00 0.00 0.25 1.00
CSRS 0.26 0.13 0.05 0.15 0.25 0.35 0.80
Net
Income/Common
Equity
0.01 1.06 -10.2 -0.08 0.05 0.15 11.57
GR 0.08 0.25 -0.62 -0.05 0.03 0.17 1.44
LnAssets 7.10 1.14 3.89 6.41 7.13 7.80 11.15
Debt/Assets 0.83 0.89 0.11 0.53 0.66 0.82 12.16
FRAGE 30.98 10.95 7.00 22.00 29.00 44.00 56.00
INSIDOWN 35.69 27.53 0.00 9.05 34.48 59.08 93.11
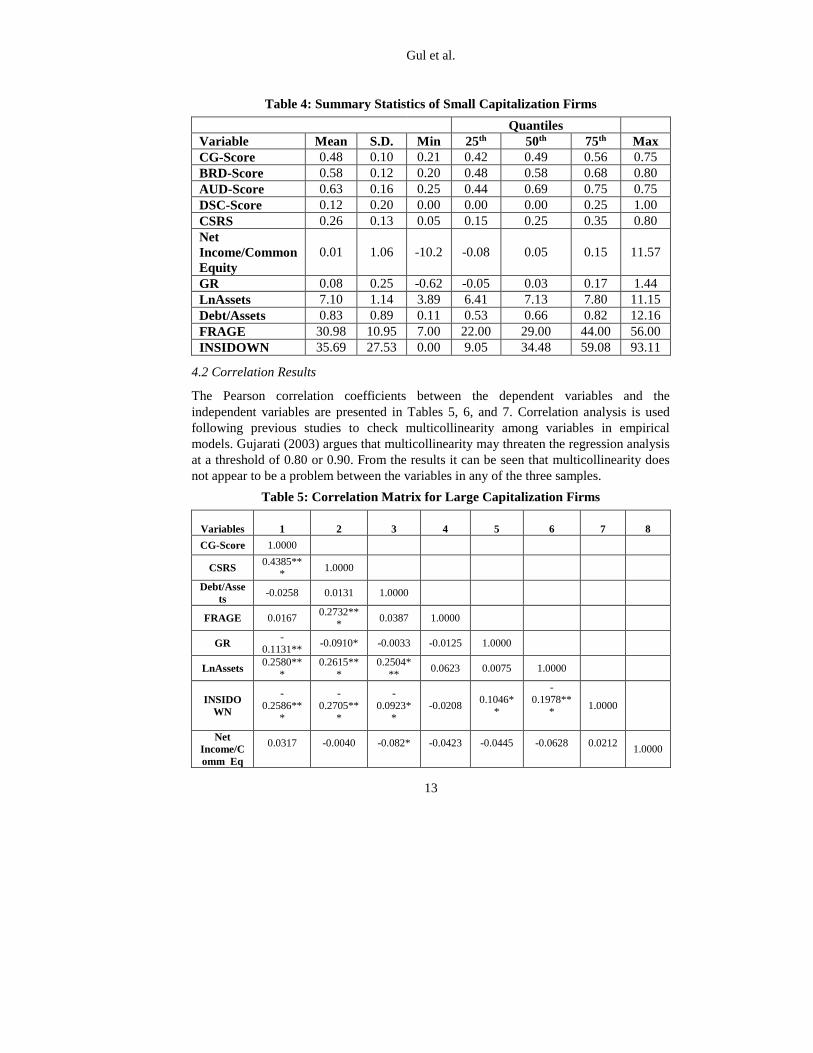
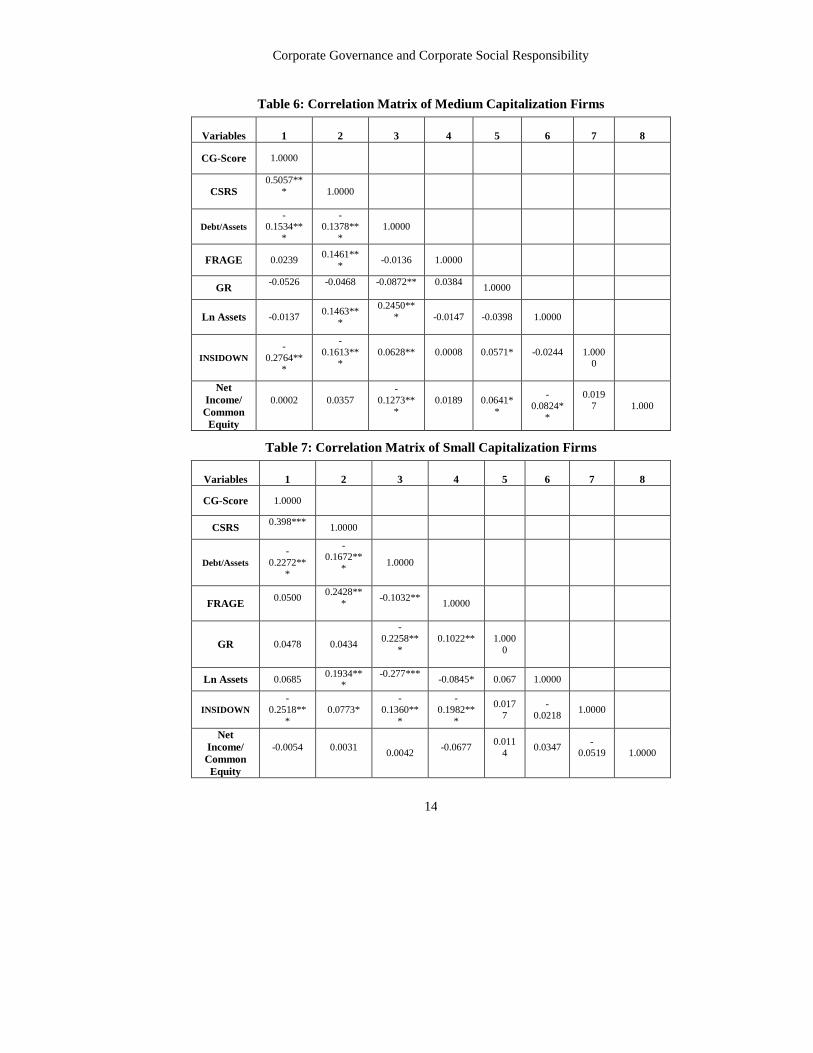
4.2 Correlation Results
The Pearson correlation coefficients between the dependent variables and the
independent variables are presented in Tables 5, 6, and 7. Correlation analysis is used
following previous studies to check multicollinearity among variables in empirical
models. Gujarati (2003) argues that multicollinearity may threaten the regression analysis
at a threshold of 0.80 or 0.90. From the results it can be seen that multicollinearity does
not appear to be a problem between the variables in any of the three samples.
Table 5: Correlation Matrix for Large Capitalization Firms
Variables
1
2
3
4
5
6
7
8
CG-Score 1.0000
CSRS 0.4385**
* 1.0000
Debt/Asse
ts -0.0258 0.0131 1.0000
FRAGE 0.0167 0.2732**
* 0.0387 1.0000
GR -
0.1131** -0.0910* -0.0033 -0.0125 1.0000
LnAssets 0.2580**
*
0.2615**
*
0.2504*
** 0.0623 0.0075 1.0000
INSIDO
WN
-
0.2586**
*
-
0.2705**
*
-
0.0923*
*
-0.0208 0.1046*
*
-
0.1978***
1.0000
Net
Income/C
omm Eq
0.0317
-0.0040
-0.082*
-0.0423
-0.0445
-0.0628
0.0212
1.0000
Corporate Governance and Corporate Social Responsibility
14
Table 6: Correlation Matrix of Medium Capitalization Firms
Variables
1
2
3
4
5
6
7
8
CG-Score 1.0000
CSRS 0.5057**
*
1.0000
Debt/Assets
-0.1534**
*
-0.1378**
*
1.0000
FRAGE 0.0239 0.1461**
* -0.0136 1.0000
GR -0.0526
-0.0468
-0.0872**
0.0384
1.0000
Ln Assets -0.0137 0.1463**
*
0.2450**
*
-0.0147 -0.0398 1.0000
INSIDOWN
-
0.2764***
-
0.1613***
0.0628**
0.0008
0.0571*
-0.0244
1.0000
Net
Income/
Common
Equity
0.0002
0.0357
-
0.1273**
*
0.0189
0.0641*
*
-
0.0824*
*
0.019
7
1.000
Table 7: Correlation Matrix of Small Capitalization Firms
Variables
1
2
3
4
5
6
7
8
CG-Score 1.0000
CSRS 0.398***
1.0000
Debt/Assets
-
0.2272**
*
-0.1672**
*
1.0000
FRAGE 0.0500
0.2428**
*
-0.1032**
1.0000
GR 0.0478 0.0434
-
0.2258**
*
0.1022**
1.000
0
Ln Assets 0.0685 0.1934**
* -0.277***
-0.0845* 0.067 1.0000
INSIDOWN
-
0.2518**
*
0.0773*
-
0.1360**
*
-
0.1982**
*
0.017
7
-
0.0218 1.0000
Net
Income/
Common
Equity
-0.0054
0.0031
0.0042
-0.0677
0.0114
0.0347
-0.0519
1.0000
Gul et al.
15
4.3 GMM Estimation Results: Corporate Governance and Corporate Social
Responsibility
The Hansen J statistic test indicates that the instruments used in the study are valid. In
addition, the autocorrelation test of Arellano–Bond presents no evidence of model
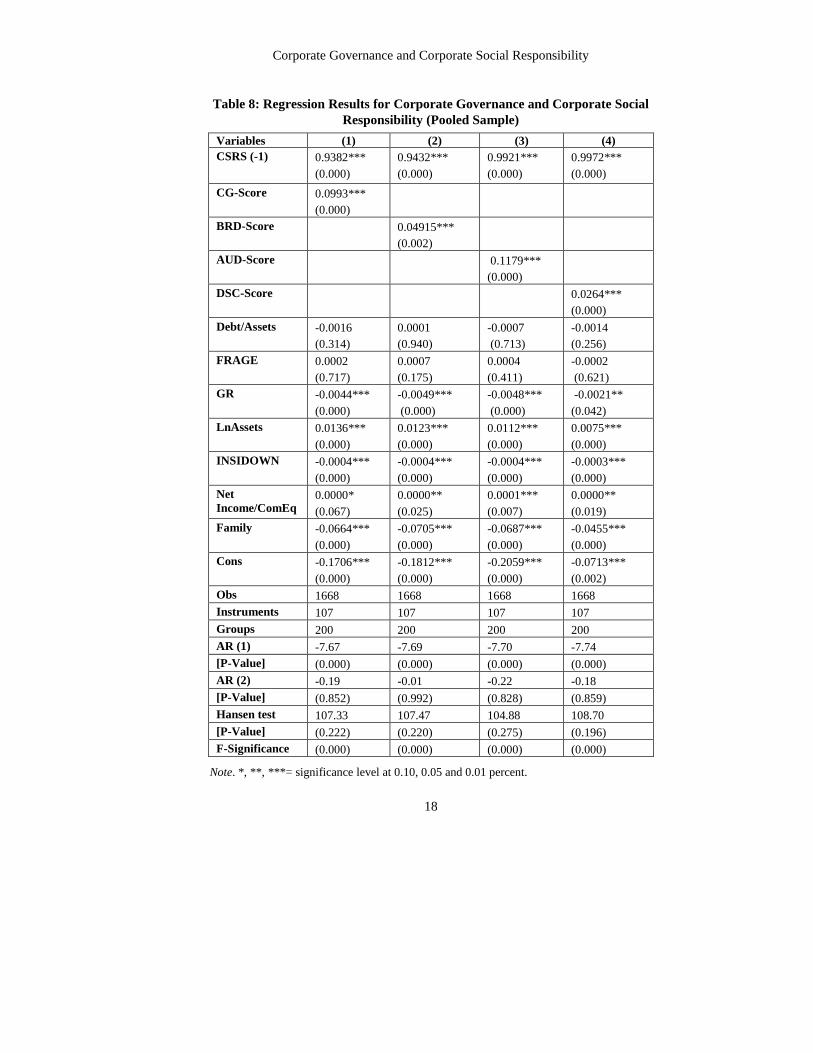
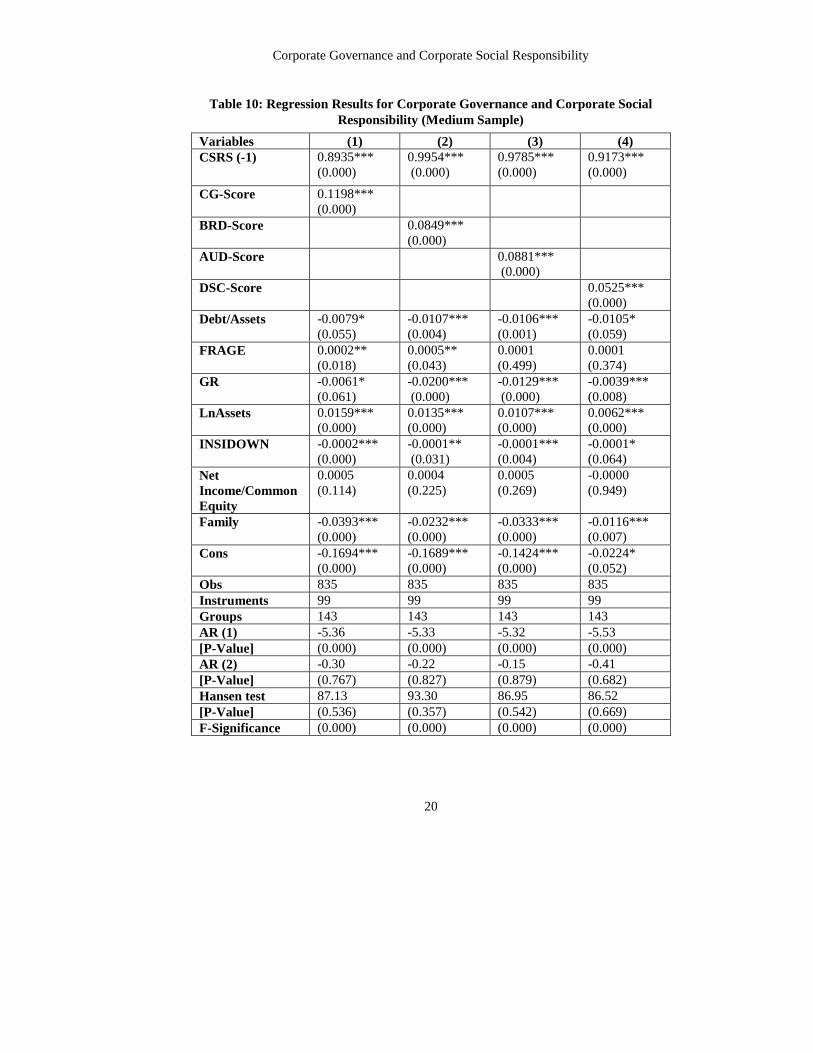
misspecification. The results document that CG enhancement is linked with a significant
increase in CSR in pool, large, medium, and small Cap firms. Specifically, the results
suggest that an increase of one unit in CG − score is associated with an increase of 0.10
in CSRS in pooled regression, 0.09 in large sample firms, 0.12 in medium sample firms,
and 0.06 in small sample firms. Hence, the empirical evidence suggests that CG is an
important determinant of enhancing CSR disclosures in annual reports. Khan et al. (2012)
argue that closely held small companies may be less active in investing in social activities
because there will be relatively low level of public interest and because the costs of such
investment may far outweigh its potential benefits. As previously mentioned, prior
literatures have used isolated aspects of CG rather using a composite measure. Hence,
this paper provides a novel contribution to the literature about the link between CG and
CSR by using a broad measure of 18 CG provisions. Further, the variable board score
used in this study is comprised of 10 CG practices. No single study has used such a broad
measure they either use board independence or board size (e.g., Jo & Harjoto, 2011;
Khan et al., 2012; Ghazali, 2012) as a proxy for board compositions. The results reveal
that board of directors sub-score is significantly positively associated with CSR in all
samples. From the perspective of agency theory, better governed boards are more
interested in the long term sustainability of a company i.e. CSR engagement rather than
focusing on just short-term financial performance targets (Jizi et al., 2014). In addition,
from the Legitimacy theory perspective, better governed boards with higher
independence are helpful in constituting and preserving corporate legitimacy for their
credibility and reputation (Liu and Zhang (2017). Nonetheless, for a company in an
emerging economy like Pakistan in order to preserve its competitiveness a significant
consideration is the financial performance. In order to sustain its financial performance a
firm with better governance would be in a better position which will ultimately influence
its CSR performance. Hence, we conclude that social performance is the result of a
properly designed governance structure.
Moreover, audit and disclosure sub-scores are positive and statistically significantly
related to CSR. The agency theory suggests that audit effectiveness mitigates asymmetric
information between firm insiders and outside investors and stakeholders and in turn
enhancing the reliability of corporate reporting (Jizi et al., 2014). The audit committee
works in collaboration with the board and is recognized as indispensable to the
effectiveness of the board. Nevertheless, it is unlikely that members of the audit
committees understanding about CSR activities is associated to their financial expertise,
however generally they might have a more positive attitude to disclosure. Said et al.
(2009) and Khan et al. (2012) also find similar result however they used a narrow
measure. From the coefficients on BRD − score, AUD − score, and DSC − score in the
Corporate Governance and Corporate Social Responsibility
16
three samples, it can be seen that audit sub-score plays a major role in influencing CSR as
compared to other categories of CG.
The results also suggest that there is a significant negative relation between the debt ratio
and CSR in all sized firms. Hence, the negative association suggests that creditor
stakeholders will apply less pressure to inhibit managers’ prudence over activities of
CSR. This finding is consistent with the findings presented in Branco and Rodrigues
(2008) and Giannarakis (2014). However, Reverte (2009) and Sariannidis (2014) do not
find any statistically significant association. On the other hand, Esa and Ghazali (2012)
find that firms with high leverage ratios enclose more information on CSR. However,
they use web pages as the source of CSR information rather than annual reports.
The results show that firm size (LnAssets) is positive and highly significant in explaining
the likelihood of choosing CSR engagement. Stakeholder groups provide more attention
to larger firms and therefore to exhibit social responsibility such firms would be under
greater public pressure (Ghazali, 2007). The empirical results of prior studies document
that size and the extent of social disclosure have positive correlation (e.g., Ghazali, 2007;
Said et al., 2009; Giannarakis, 2014; Jizi et al., 2014). On the other hand, Rees and
Rodionova (2015) do not find any significant association. The reason may be that they
have used a different proxy to measure firm size and a small sample.
The literature has provided different evidence on the association of profitability with CSR
in the form of a negative, a positive, or an uncertain link. As shown in case of pooled
sample and small Cap firms, ROE and CSR have a significant positive association
confirming the legitimacy theory hypothesize, suggesting that firms with higher financial
performance demonstrate their contribution to society’s well-being and will act in more
socially responsible ways than unprofitable companies because in general it is a costly
decision. Similar result was found by Said et al. (2009) and Jizi et al. (2014).
Nevertheless, the study fails to find any significant evidence between ROE and CSR in
large and medium Cap firms. Said et al. (2009) also find no association between
profitability and CSR disclosure.
The results further document that firms’ involvement in social activities is negatively
affected by high ownership concentration measured by insiders’ ownership. At higher
level of managerial ownership, public accountability will be less concerned for directors,
resulting in low disclosure of CSR (Ghazali, 2007). The result further implies that high
share ownership by executive and non-independent director’s results in less CSR
disclosure. In contrast, Khan et al. (2012) provide evidence that higher management
ownership is associated with increased CSR disclosure in export-oriented industries. The
reason behind this result is the fact that management ownership in export-oriented
industries is very small hence pressures exerted by powerful stakeholder groups as a
principal driver of CSR reporting.
Further, the results reported show that family firms as compared to non-family firms
avoid engagement in CSR. Rees and Rodionova (2015) argue that families oppose CSR
investments as being value destroying. Family firms do not have the reputational pressure
for social and environmental responsibility from the beneficiaries due to their large and
Gul et al.
17
long term ownership stakes and will therefore oppose to excessive investment in CSR
because it may not bring personal benefits. Rees and Rodionova (2015) find that ESG
performance is negatively affected by closely held equity and family ownership.
As compared to younger firms, there will be more CSR involvement and reputation for
older firms due to their deep societal presence and comparatively more legitimacy.
Nevertheless, opposed to this expectation, firm age is found to have insignificant
association with CSR, suggesting that age of the firm does not influence the decision of
CSR disclosure. The reason behind this association is the fact that company age is
measured in this study by the actual listing status i.e. the time span between when a firm
was listed on PSX and the study period. Nonetheless, there are recently listed firms in
Pakistan that were present for a long time even before their listing.
Corporate Governance and Corporate Social Responsibility
18
Table 8: Regression Results for Corporate Governance and Corporate Social
Responsibility (Pooled Sample)
Variables (1) (2) (3) (4)
CSRS (-1)
0.9382***
(0.000)
0.9432***
(0.000)
0.9921***
(0.000)
0.9972***
(0.000)
CG-Score 0.0993***
(0.000)
BRD-Score 0.04915***
(0.002)
AUD-Score 0.1179***
(0.000)
DSC-Score 0.0264***
(0.000)
Debt/Assets -0.0016
(0.314)
0.0001
(0.940)
-0.0007
(0.713)
-0.0014
(0.256)
FRAGE 0.0002
(0.717)
0.0007
(0.175)
0.0004
(0.411)
-0.0002
(0.621)
GR -0.0044***
(0.000)
-0.0049***
(0.000)
-0.0048***
(0.000)
-0.0021**
(0.042)
LnAssets 0.0136***
(0.000)
0.0123***
(0.000)
0.0112***
(0.000)
0.0075***
(0.000)
INSIDOWN -0.0004***
(0.000)
-0.0004***
(0.000)
-0.0004***
(0.000)
-0.0003***
(0.000)
Net
Income/ComEq 0.0000*
(0.067)
0.0000**
(0.025)
0.0001***
(0.007)
0.0000**
(0.019)
Family -0.0664***
(0.000)
-0.0705***
(0.000)
-0.0687***
(0.000)
-0.0455***
(0.000)
Cons -0.1706***
(0.000)
-0.1812***
(0.000)
-0.2059***
(0.000)
-0.0713***
(0.002)
Obs 1668 1668 1668 1668
Instruments 107 107 107 107
Groups 200 200 200 200
AR (1) -7.67 -7.69 -7.70 -7.74
[P-Value] (0.000) (0.000) (0.000) (0.000)
AR (2) -0.19 -0.01 -0.22 -0.18
[P-Value] (0.852) (0.992) (0.828) (0.859)
Hansen test 107.33 107.47 104.88 108.70
[P-Value] (0.222) (0.220) (0.275) (0.196)
F-Significance (0.000) (0.000) (0.000) (0.000)
Note. *, **, ***= significance level at 0.10, 0.05 and 0.01 percent.

Gul et al.
19
Table 9: Regression Results for Corporate Governance and Corporate Social
Responsibility (Large Sample)
Variables (1) (2) (3) (4)
CSRS (-1)
0.08872***
(0.000)
0.9185***
(0.000)
0.8928***
(0.000)
0.8872***
(0.000)
CG-Score 0.0923***
(0.001)
BRD-Score 0.0449**
(0.047)
AUD-Score 0.0968***
(0.000)
DSC-Score 0.0482***
(0.000)
Debt/Assets -0.0196**
(0.026)
-0.0239***
(0.008)
-0.0227***
(0.006)
-0.0238***
(0.009)
FRAGE 0.0004
(0.588)
0.0003
(0.653)
-0.0003
(0.652)
-0.0003
(0.647)
GR -0.0391***
(0.000)
-0.0446***
(0.000)
-0.0378***
(0.000)
-0.0282***
(0.000)
LnAssets 0.0147***
(0.000)
0.01791***
(0.000)
0.0148***
(0.000)
0.0116***
(0.001)
INSIDOWN -0.0018***
(0.000)
-0.0020***
(0.000)
-0.0020***
(0.000)
-0.0019***
(0.000)
Net
Income/Common
Equity
-0.0000
(0.856)
-0.0000
(0.947)
-0.0001
(0.748)
-0.0001
(0.558)
Family -0.0964***
(0.000)
-0.1096***
(0.000)
-0.0959***
(0.000)
-0.01050***
(0.000)
Cons -0.1347***
(0.000)
-0.1532***
(0.000)
-0.1322***
(0.000)
-0.0499
(0.101)
Obs 434 434 434 434
Instruments 47 47 47 47
Groups 70 70 70 70
AR (1) -4.24 -4.26 -4.24 -4.15
[P-Value] (0.000) (0.000) (0.000) (0.000)
AR (2) 0.66 0.95 0.80 0.41
[P-Value] (0.507) (0.340) (0.422) (0.680)
Hansen test 40.88 41.10 40.10 40.35
[P-Value] (0.304) (0.296) (0.334) (0.325)
F-Significance (0.000) (0.000) (0.000) (0.000)
Corporate Governance and Corporate Social Responsibility
20
Table 10: Regression Results for Corporate Governance and Corporate Social
Responsibility (Medium Sample)
Variables (1) (2) (3) (4)
CSRS (-1) 0.8935***
(0.000)
0.9954***
(0.000)
0.9785***
(0.000)
0.9173***
(0.000)
CG-Score 0.1198***
(0.000)
BRD-Score 0.0849***
(0.000)
AUD-Score 0.0881***
(0.000)
DSC-Score 0.0525***
(0.000)
Debt/Assets -0.0079*
(0.055)
-0.0107***
(0.004)
-0.0106***
(0.001)
-0.0105*
(0.059)
FRAGE 0.0002**
(0.018)
0.0005**
(0.043)
0.0001
(0.499)
0.0001
(0.374)
GR -0.0061*
(0.061)
-0.0200***
(0.000)
-0.0129***
(0.000)
-0.0039***
(0.008)
LnAssets 0.0159***
(0.000)
0.0135***
(0.000)
0.0107***
(0.000)
0.0062***
(0.000)
INSIDOWN -0.0002***
(0.000)
-0.0001**
(0.031)
-0.0001***
(0.004)
-0.0001*
(0.064)
Net
Income/Common
Equity
0.0005
(0.114)
0.0004
(0.225)
0.0005
(0.269)
-0.0000
(0.949)
Family -0.0393***
(0.000)
-0.0232***
(0.000)
-0.0333***
(0.000)
-0.0116***
(0.007)
Cons -0.1694***
(0.000)
-0.1689***
(0.000)
-0.1424***
(0.000)
-0.0224*
(0.052)
Obs 835 835 835 835
Instruments 99 99 99 99
Groups 143 143 143 143
AR (1) -5.36 -5.33 -5.32 -5.53
[P-Value] (0.000) (0.000) (0.000) (0.000)
AR (2) -0.30 -0.22 -0.15 -0.41
[P-Value] (0.767) (0.827) (0.879) (0.682)
Hansen test 87.13 93.30 86.95 86.52
[P-Value] (0.536) (0.357) (0.542) (0.669)
F-Significance (0.000) (0.000) (0.000) (0.000)
Gul et al.
21
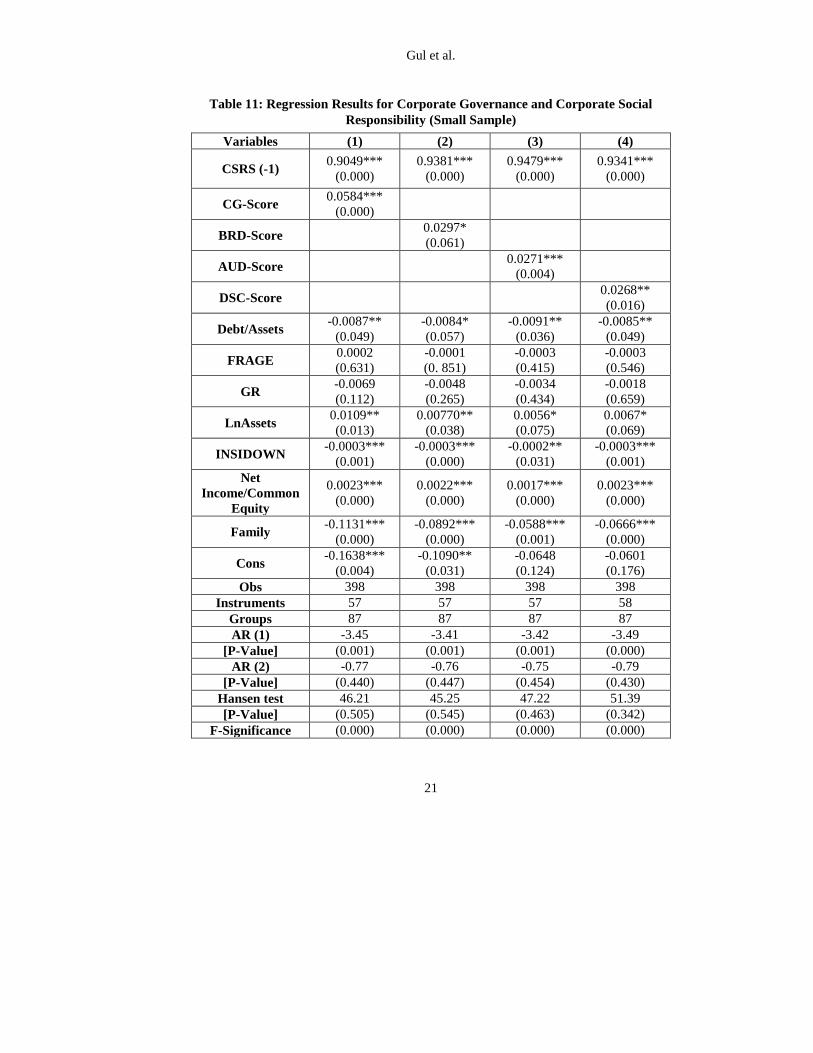
Table 11: Regression Results for Corporate Governance and Corporate Social
Responsibility (Small Sample)
Variables (1) (2) (3) (4)
CSRS (-1) 0.9049***
(0.000)
0.9381***
(0.000)
0.9479***
(0.000)
0.9341***
(0.000)
CG-Score 0.0584***
(0.000)
BRD-Score 0.0297*
(0.061)
AUD-Score 0.0271***
(0.004)
DSC-Score 0.0268**
(0.016)
Debt/Assets -0.0087**
(0.049)
-0.0084*
(0.057)
-0.0091**
(0.036)
-0.0085**
(0.049)
FRAGE 0.0002
(0.631)
-0.0001
(0. 851)
-0.0003
(0.415)
-0.0003
(0.546)
GR -0.0069
(0.112)
-0.0048
(0.265)
-0.0034
(0.434)
-0.0018
(0.659)
LnAssets 0.0109**
(0.013)
0.00770**
(0.038)
0.0056*
(0.075)
0.0067*
(0.069)
INSIDOWN -0.0003***
(0.001)
-0.0003***
(0.000)
-0.0002**
(0.031)
-0.0003***
(0.001)
Net
Income/Common
Equity
0.0023***
(0.000)
0.0022***
(0.000)
0.0017***
(0.000)
0.0023***
(0.000)
Family -0.1131***
(0.000)
-0.0892***
(0.000)
-0.0588***
(0.001)
-0.0666***
(0.000)
Cons -0.1638***
(0.004)
-0.1090**
(0.031)
-0.0648
(0.124)
-0.0601
(0.176)
Obs 398 398 398 398
Instruments 57 57 57 58
Groups 87 87 87 87
AR (1) -3.45 -3.41 -3.42 -3.49
[P-Value] (0.001) (0.001) (0.001) (0.000)
AR (2) -0.77 -0.76 -0.75 -0.79
[P-Value] (0.440) (0.447) (0.454) (0.430)
Hansen test 46.21 45.25 47.22 51.39
[P-Value] (0.505) (0.545) (0.463) (0.342)
F-Significance (0.000) (0.000) (0.000) (0.000)
Corporate Governance and Corporate Social Responsibility
22
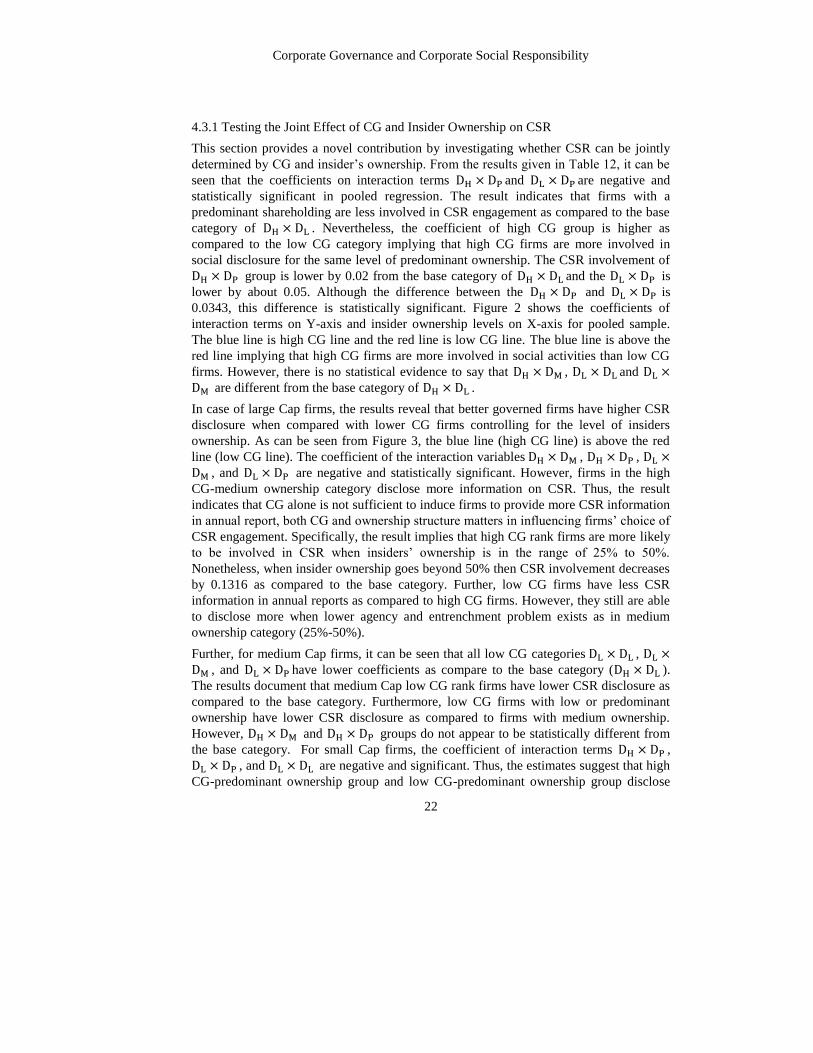
4.3.1 Testing the Joint Effect of CG and Insider Ownership on CSR
This section provides a novel contribution by investigating whether CSR can be jointly
determined by CG and insider’s ownership. From the results given in Table 12, it can be
seen that the coefficients on interaction terms DH × DP and DL × DP are negative and
statistically significant in pooled regression. The result indicates that firms with a
predominant shareholding are less involved in CSR engagement as compared to the base
category of DH × DL . Nevertheless, the coefficient of high CG group is higher as
compared to the low CG category implying that high CG firms are more involved in
social disclosure for the same level of predominant ownership. The CSR involvement of
DH × DP group is lower by 0.02 from the base category of DH × DL and the DL × DP is
lower by about 0.05. Although the difference between the DH × DP and DL × DP is
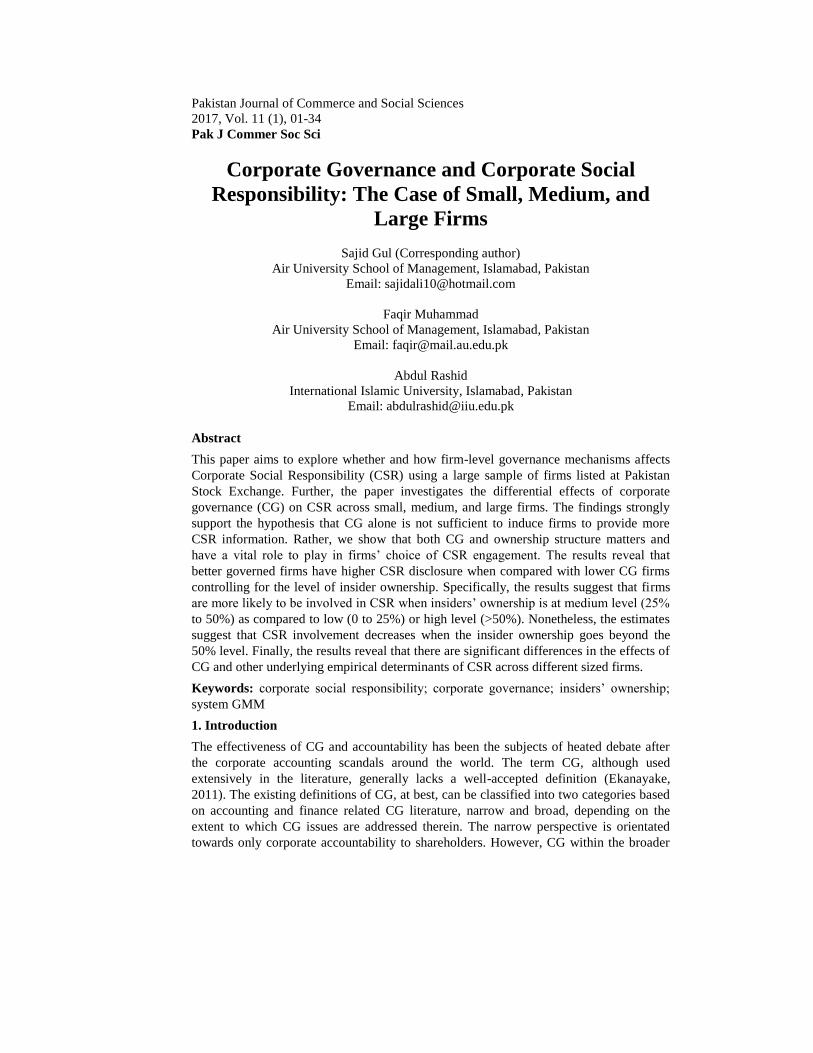
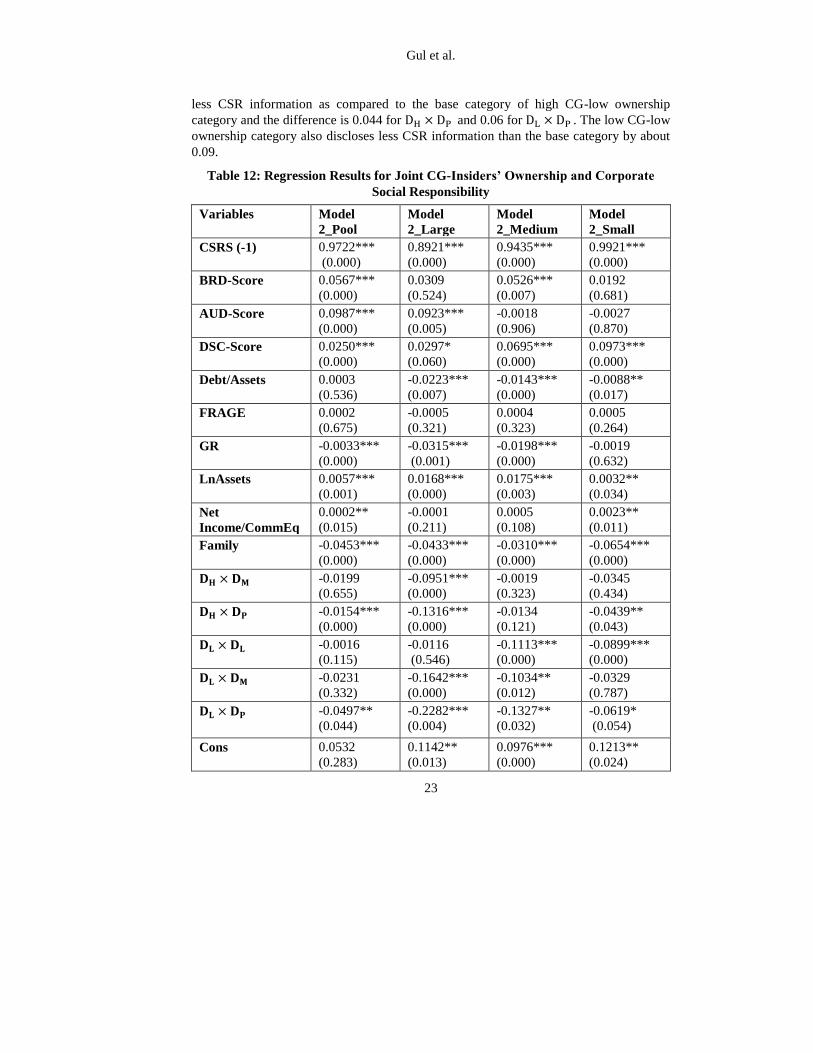
0.0343, this difference is statistically significant. Figure 2 shows the coefficients of
interaction terms on Y-axis and insider ownership levels on X-axis for pooled sample.
The blue line is high CG line and the red line is low CG line. The blue line is above the
red line implying that high CG firms are more involved in social activities than low CG
firms. However, there is no statistical evidence to say that DH × DM , DL × DL and DL ×DM are different from the base category of DH × DL .
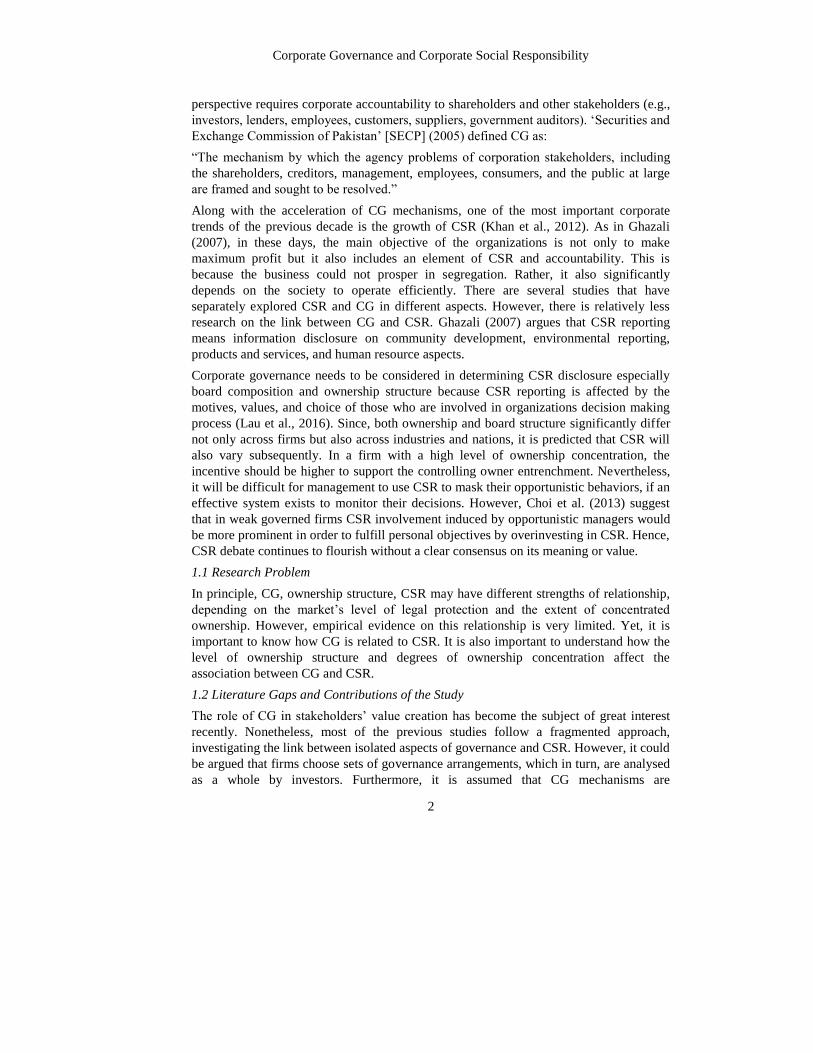
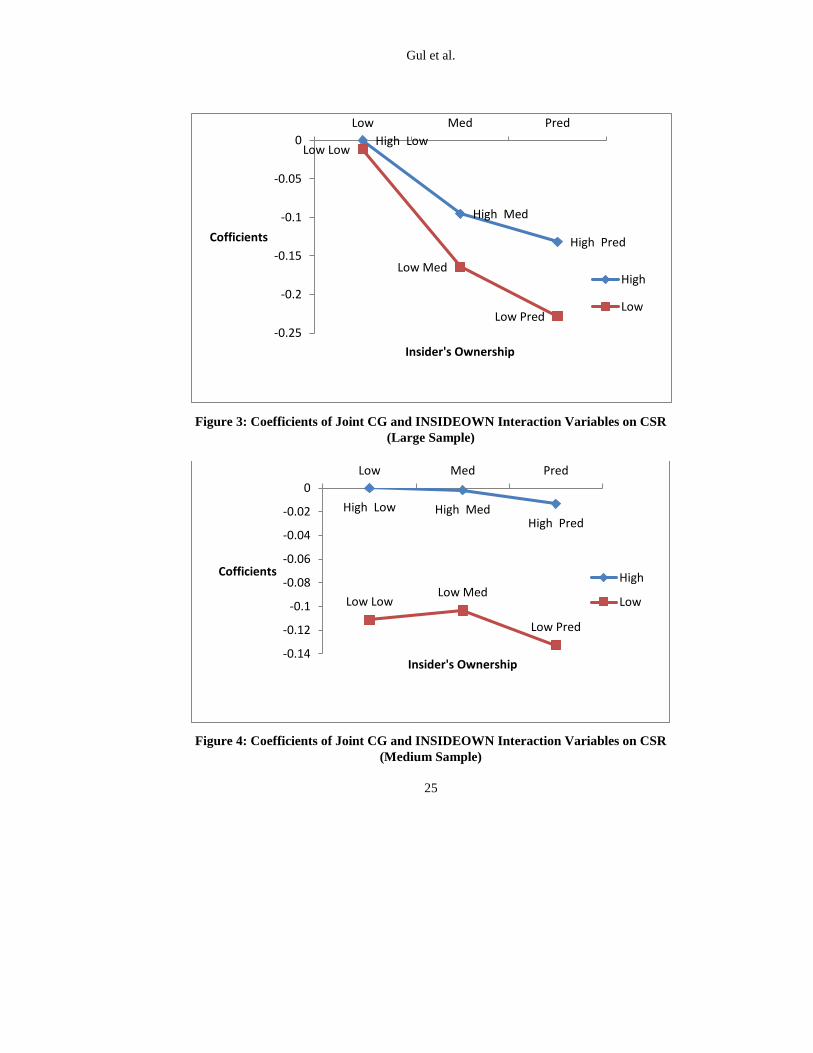
In case of large Cap firms, the results reveal that better governed firms have higher CSR
disclosure when compared with lower CG firms controlling for the level of insiders
ownership. As can be seen from Figure 3, the blue line (high CG line) is above the red
line (low CG line). The coefficient of the interaction variables DH × DM , DH × DP , DL ×DM , and DL × DP are negative and statistically significant. However, firms in the high
CG-medium ownership category disclose more information on CSR. Thus, the result
indicates that CG alone is not sufficient to induce firms to provide more CSR information
in annual report, both CG and ownership structure matters in influencing firms’ choice of
CSR engagement. Specifically, the result implies that high CG rank firms are more likely
to be involved in CSR when insiders’ ownership is in the range of 25% to 50%.
Nonetheless, when insider ownership goes beyond 50% then CSR involvement decreases
by 0.1316 as compared to the base category. Further, low CG firms have less CSR
information in annual reports as compared to high CG firms. However, they still are able
to disclose more when lower agency and entrenchment problem exists as in medium
ownership category (25%-50%).
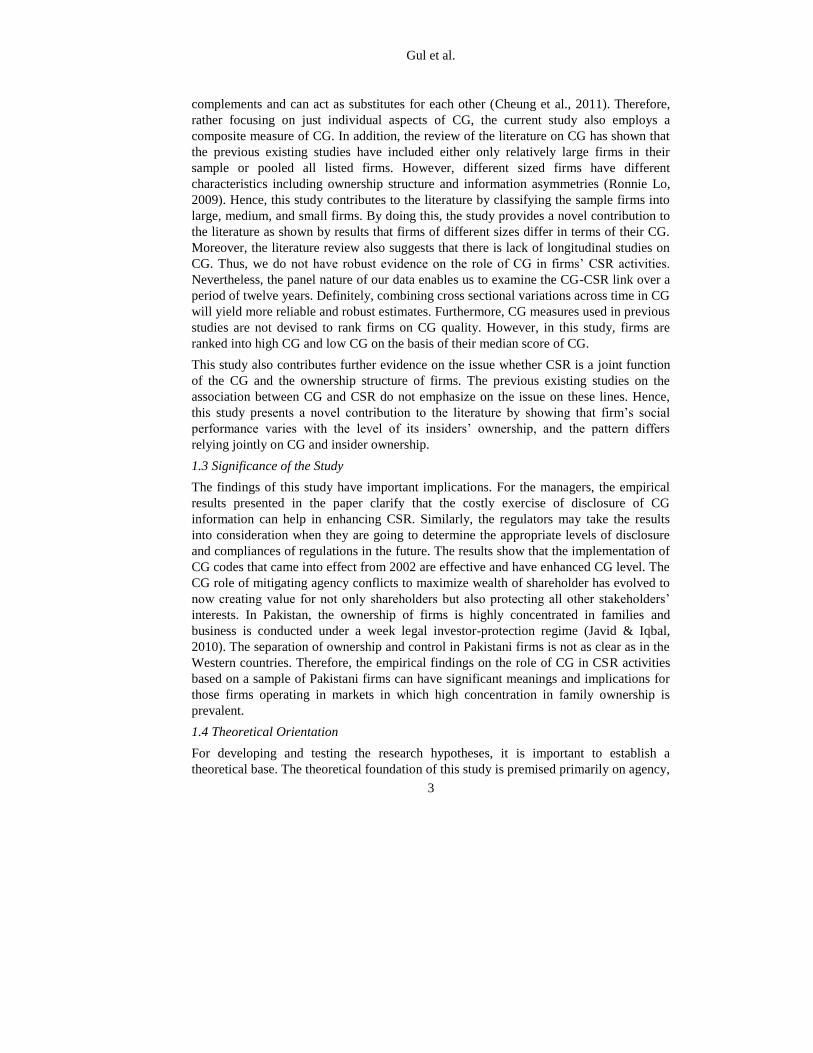
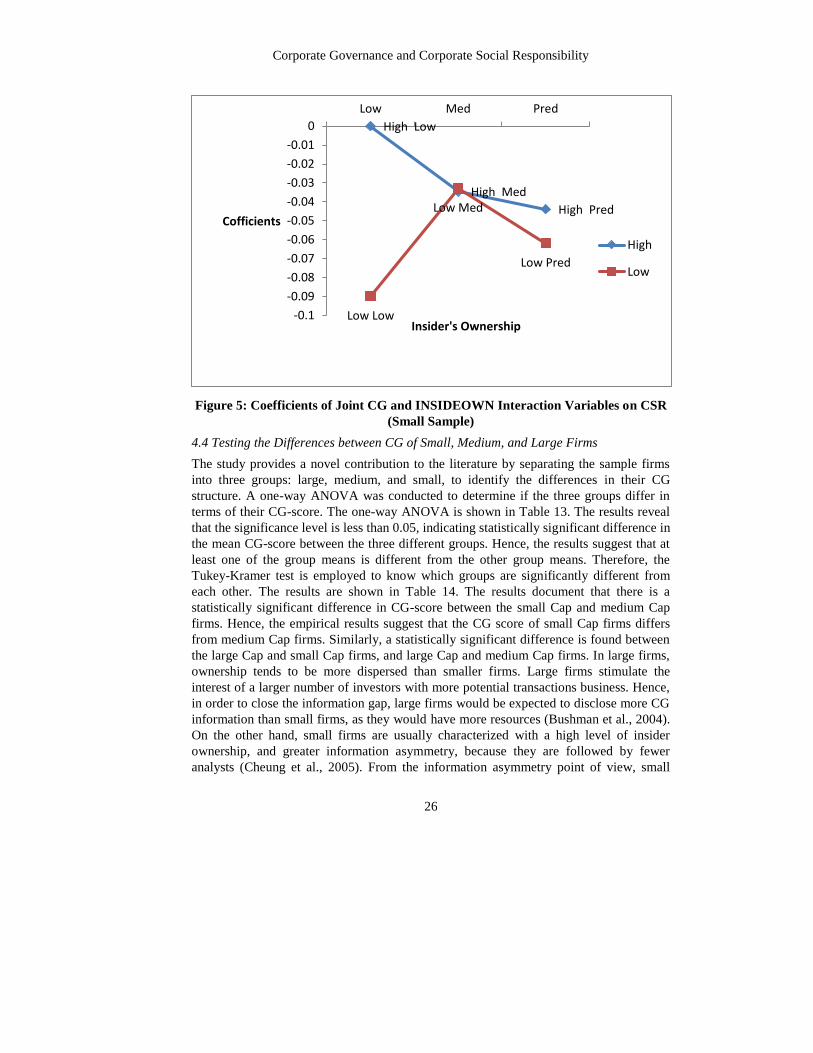
Further, for medium Cap firms, it can be seen that all low CG categories DL × DL , DL ×DM , and DL × DP have lower coefficients as compare to the base category (DH × DL ).
The results document that medium Cap low CG rank firms have lower CSR disclosure as
compared to the base category. Furthermore, low CG firms with low or predominant
ownership have lower CSR disclosure as compared to firms with medium ownership.
However, DH × DM and DH × DP groups do not appear to be statistically different from
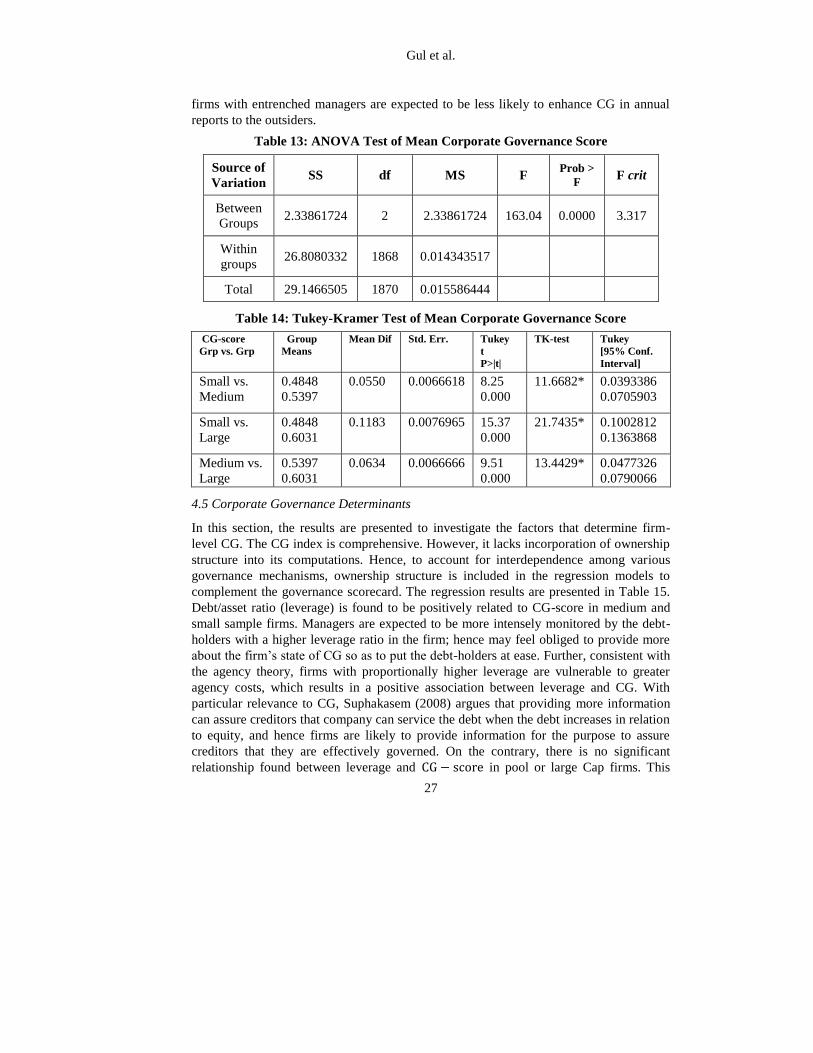
the base category. For small Cap firms, the coefficient of interaction terms DH × DP ,
DL × DP , and DL × DL are negative and significant. Thus, the estimates suggest that high
CG-predominant ownership group and low CG-predominant ownership group disclose
Gul et al.
23
less CSR information as compared to the base category of high CG-low ownership
category and the difference is 0.044 for DH × DP and 0.06 for DL × DP . The low CG-low
ownership category also discloses less CSR information than the base category by about
0.09.
Table 12: Regression Results for Joint CG-Insiders’ Ownership and Corporate
Social Responsibility
Variables Model
2_Pool
Model
2_Large
Model
2_Medium
Model
2_Small
CSRS (-1) 0.9722***
(0.000)
0.8921***
(0.000)
0.9435***
(0.000)
0.9921***
(0.000)
BRD-Score 0.0567***
(0.000)
0.0309
(0.524)
0.0526***
(0.007)
0.0192
(0.681)
AUD-Score 0.0987***
(0.000)
0.0923***
(0.005)
-0.0018
(0.906)
-0.0027
(0.870)
DSC-Score 0.0250***
(0.000)
0.0297*
(0.060)
0.0695***
(0.000)
0.0973***
(0.000)
Debt/Assets 0.0003
(0.536)
-0.0223***
(0.007)
-0.0143***
(0.000)
-0.0088**
(0.017)
FRAGE 0.0002
(0.675)
-0.0005
(0.321)
0.0004
(0.323)
0.0005
(0.264)
GR -0.0033***
(0.000)
-0.0315***
(0.001)
-0.0198***
(0.000)
-0.0019
(0.632)
LnAssets 0.0057***
(0.001)
0.0168***
(0.000)
0.0175***
(0.003)
0.0032**
(0.034)
Net
Income/CommEq
0.0002**
(0.015)
-0.0001
(0.211)
0.0005
(0.108)
0.0023**
(0.011)
Family -0.0453***
(0.000)
-0.0433***
(0.000)
-0.0310***
(0.000)
-0.0654***
(0.000)
𝐃𝐇 × 𝐃𝐌 -0.0199
(0.655)
-0.0951***
(0.000)
-0.0019
(0.323)
-0.0345
(0.434)
𝐃𝐇 × 𝐃𝐏 -0.0154***
(0.000)
-0.1316***
(0.000)
-0.0134
(0.121)
-0.0439**
(0.043)
𝐃𝐋 × 𝐃𝐋 -0.0016
(0.115)
-0.0116
(0.546)
-0.1113***
(0.000)
-0.0899***
(0.000)
𝐃𝐋 × 𝐃𝐌 -0.0231
(0.332)
-0.1642***
(0.000)
-0.1034**
(0.012)
-0.0329
(0.787)
𝐃𝐋 × 𝐃𝐏 -0.0497**
(0.044)
-0.2282***
(0.004)
-0.1327**
(0.032)
-0.0619*
(0.054)
Cons 0.0532
(0.283)
0.1142**
(0.013)
0.0976***
(0.000)
0.1213**
(0.024)
Corporate Governance and Corporate Social Responsibility
24
Obs 1668 398 835 399
Instruments 107 47 97 57
Groups 200 69 143 87
AR (1) -7.62 -4.15 -4.78 -3.28
[P-Value] (0.000) (0.000) (0.000) (0.001)
AR (2) -0.25 0.69 -0.22 -0.68
[P-Value] (0. 803) (0.491) (0.645) (0.496)
Hansen test 106.27 34.58 79.14 33.00
[P-Value] (0. 131) (0.440) (0.546) (0.838)
F-Significance (0.000) (0.000) (0.000) (0.000)
Figure 2: Coefficients of Joint CG and INSIDEOWN Interaction Variables on CSR
(Pooled Sample)
High Low
High MedHigh Pred
Low Low
Low Med
Low Pred-0.06
-0.05
-0.04
-0.03
-0.02
-0.01
0
Low Med Pred
Cofficients
Insider's Ownership
High
Low
Gul et al.
25
Figure 3: Coefficients of Joint CG and INSIDEOWN Interaction Variables on CSR
(Large Sample)
Figure 4: Coefficients of Joint CG and INSIDEOWN Interaction Variables on CSR
(Medium Sample)
High Low
High Med
High Pred
Low Low
Low Med
Low Pred-0.25
-0.2
-0.15
-0.1
-0.05
0
Low Med Pred
Cofficients
Insider's Ownership
High
Low
High Low High MedHigh Pred
Low LowLow Med
Low Pred
-0.14
-0.12
-0.1
-0.08
-0.06
-0.04
-0.02
0
Low Med Pred
Cofficients
Insider's Ownership
High
Low
Corporate Governance and Corporate Social Responsibility
26
Figure 5: Coefficients of Joint CG and INSIDEOWN Interaction Variables on CSR
(Small Sample)
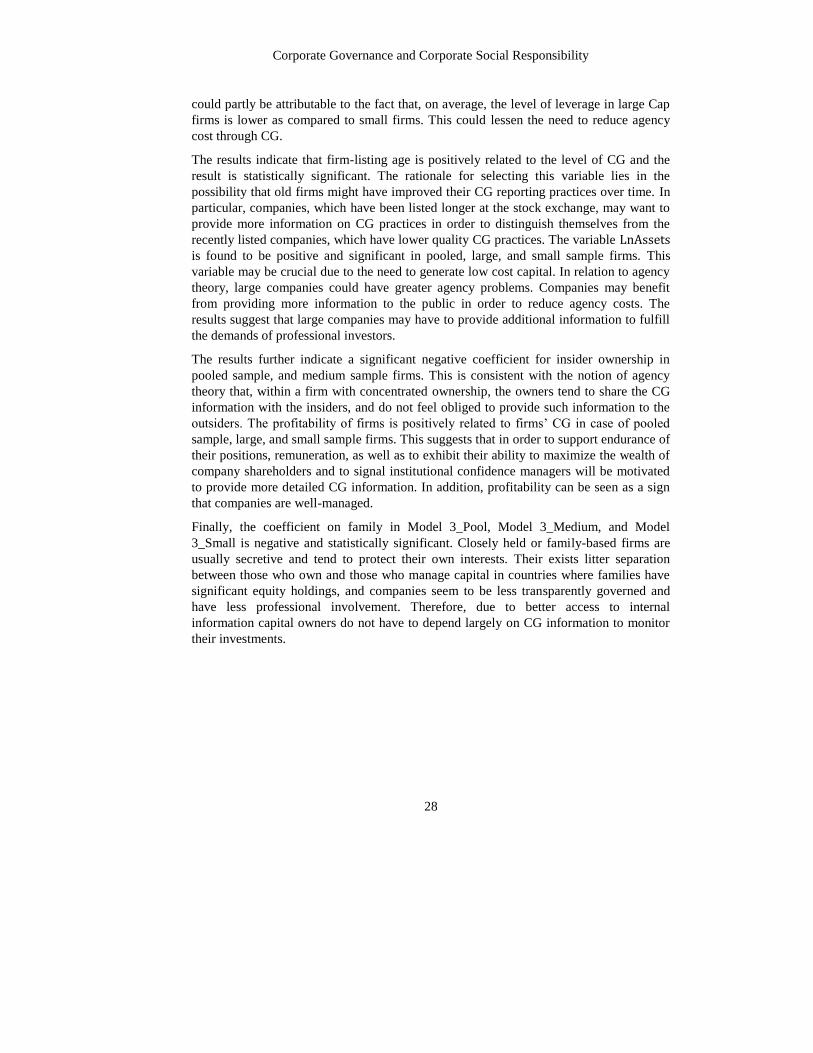
4.4 Testing the Differences between CG of Small, Medium, and Large Firms
The study provides a novel contribution to the literature by separating the sample firms
into three groups: large, medium, and small, to identify the differences in their CG
structure. A one-way ANOVA was conducted to determine if the three groups differ in
terms of their CG-score. The one-way ANOVA is shown in Table 13. The results reveal
that the significance level is less than 0.05, indicating statistically significant difference in
the mean CG-score between the three different groups. Hence, the results suggest that at
least one of the group means is different from the other group means. Therefore, the
Tukey-Kramer test is employed to know which groups are significantly different from
each other. The results are shown in Table 14. The results document that there is a
statistically significant difference in CG-score between the small Cap and medium Cap
firms. Hence, the empirical results suggest that the CG score of small Cap firms differs
from medium Cap firms. Similarly, a statistically significant difference is found between
the large Cap and small Cap firms, and large Cap and medium Cap firms. In large firms,
ownership tends to be more dispersed than smaller firms. Large firms stimulate the
interest of a larger number of investors with more potential transactions business. Hence,
in order to close the information gap, large firms would be expected to disclose more CG
information than small firms, as they would have more resources (Bushman et al., 2004).
On the other hand, small firms are usually characterized with a high level of insider
ownership, and greater information asymmetry, because they are followed by fewer
analysts (Cheung et al., 2005). From the information asymmetry point of view, small
High Low
High Med
High Pred
Low Low
Low Med
Low Pred
-0.1
-0.09
-0.08
-0.07
-0.06
-0.05
-0.04
-0.03
-0.02
-0.01
0
Low Med Pred
Cofficients
Insider's Ownership
High
Low
Gul et al.
27
firms with entrenched managers are expected to be less likely to enhance CG in annual
reports to the outsiders.
Table 13: ANOVA Test of Mean Corporate Governance Score
Source of
Variation SS df MS F
Prob >
F F crit
Between
Groups 2.33861724 2 2.33861724 163.04 0.0000 3.317
Within
groups 26.8080332 1868 0.014343517
Total 29.1466505 1870 0.015586444
Table 14: Tukey-Kramer Test of Mean Corporate Governance Score
CG-score
Grp vs. Grp
Group
Means
Mean Dif Std. Err. Tukey
t
P>|t|
TK-test Tukey
[95% Conf.
Interval]
Small vs.
Medium
0.4848
0.5397
0.0550 0.0066618 8.25
0.000
11.6682* 0.0393386
0.0705903
Small vs.
Large
0.4848
0.6031
0.1183 0.0076965 15.37
0.000
21.7435* 0.1002812
0.1363868
Medium vs.
Large
0.5397
0.6031
0.0634 0.0066666 9.51
0.000
13.4429* 0.0477326
0.0790066
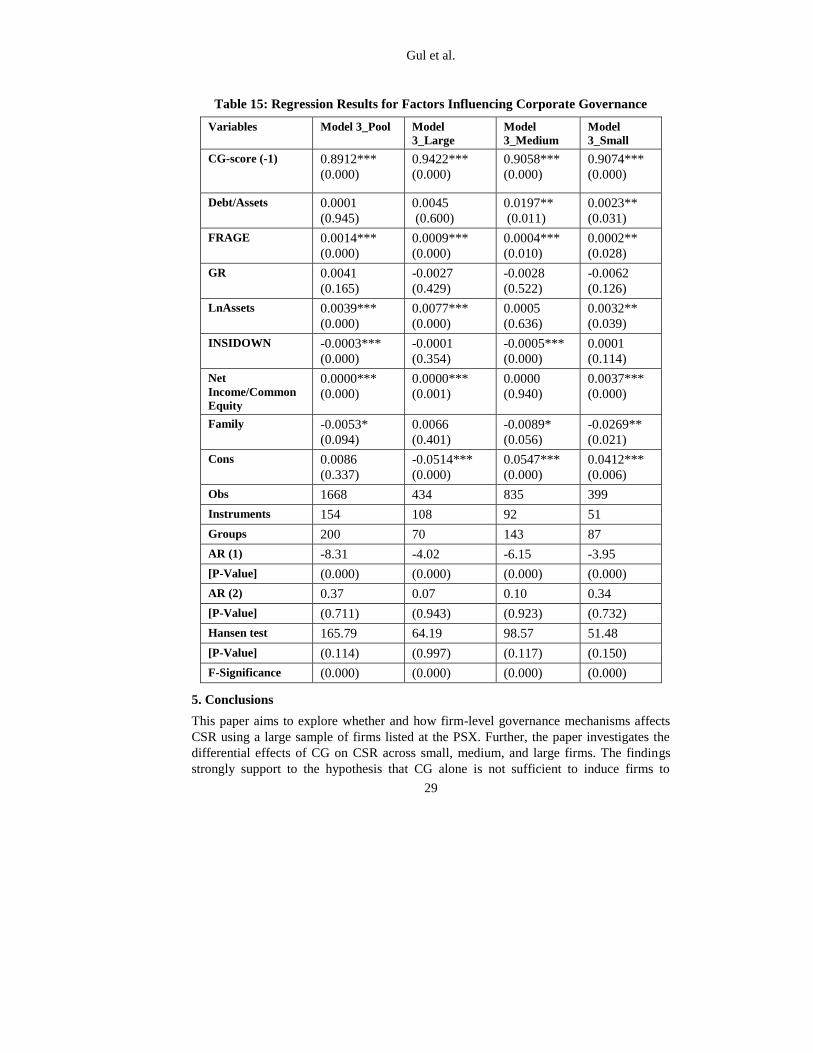
4.5 Corporate Governance Determinants
In this section, the results are presented to investigate the factors that determine firm-
level CG. The CG index is comprehensive. However, it lacks incorporation of ownership
structure into its computations. Hence, to account for interdependence among various
governance mechanisms, ownership structure is included in the regression models to
complement the governance scorecard. The regression results are presented in Table 15.
Debt/asset ratio (leverage) is found to be positively related to CG-score in medium and
small sample firms. Managers are expected to be more intensely monitored by the debt-
holders with a higher leverage ratio in the firm; hence may feel obliged to provide more
about the firm’s state of CG so as to put the debt-holders at ease. Further, consistent with
the agency theory, firms with proportionally higher leverage are vulnerable to greater
agency costs, which results in a positive association between leverage and CG. With
particular relevance to CG, Suphakasem (2008) argues that providing more information
can assure creditors that company can service the debt when the debt increases in relation
to equity, and hence firms are likely to provide information for the purpose to assure
creditors that they are effectively governed. On the contrary, there is no significant
relationship found between leverage and CG − score in pool or large Cap firms. This
Corporate Governance and Corporate Social Responsibility
28
could partly be attributable to the fact that, on average, the level of leverage in large Cap
firms is lower as compared to small firms. This could lessen the need to reduce agency
cost through CG.
The results indicate that firm-listing age is positively related to the level of CG and the
result is statistically significant. The rationale for selecting this variable lies in the
possibility that old firms might have improved their CG reporting practices over time. In
particular, companies, which have been listed longer at the stock exchange, may want to
provide more information on CG practices in order to distinguish themselves from the
recently listed companies, which have lower quality CG practices. The variable LnAssets
is found to be positive and significant in pooled, large, and small sample firms. This
variable may be crucial due to the need to generate low cost capital. In relation to agency
theory, large companies could have greater agency problems. Companies may benefit
from providing more information to the public in order to reduce agency costs. The
results suggest that large companies may have to provide additional information to fulfill
the demands of professional investors.
The results further indicate a significant negative coefficient for insider ownership in
pooled sample, and medium sample firms. This is consistent with the notion of agency
theory that, within a firm with concentrated ownership, the owners tend to share the CG
information with the insiders, and do not feel obliged to provide such information to the
outsiders. The profitability of firms is positively related to firms’ CG in case of pooled
sample, large, and small sample firms. This suggests that in order to support endurance of
their positions, remuneration, as well as to exhibit their ability to maximize the wealth of
company shareholders and to signal institutional confidence managers will be motivated
to provide more detailed CG information. In addition, profitability can be seen as a sign
that companies are well-managed.
Finally, the coefficient on family in Model 3_Pool, Model 3_Medium, and Model
3_Small is negative and statistically significant. Closely held or family-based firms are
usually secretive and tend to protect their own interests. Their exists litter separation
between those who own and those who manage capital in countries where families have
significant equity holdings, and companies seem to be less transparently governed and
have less professional involvement. Therefore, due to better access to internal
information capital owners do not have to depend largely on CG information to monitor
their investments.
Gul et al.
29
Table 15: Regression Results for Factors Influencing Corporate Governance
Variables Model 3_Pool Model
3_Large
Model
3_Medium
Model
3_Small
CG-score (-1)
0.8912***
(0.000)
0.9422***
(0.000)
0.9058***
(0.000)
0.9074***
(0.000)
Debt/Assets 0.0001
(0.945)
0.0045
(0.600)
0.0197**
(0.011)
0.0023**
(0.031)
FRAGE 0.0014***
(0.000)
0.0009***
(0.000)
0.0004***
(0.010)
0.0002**
(0.028)
GR 0.0041
(0.165)
-0.0027
(0.429)
-0.0028
(0.522)
-0.0062
(0.126)
LnAssets 0.0039***
(0.000)
0.0077***
(0.000)
0.0005
(0.636)
0.0032**
(0.039)
INSIDOWN -0.0003***
(0.000)
-0.0001
(0.354)
-0.0005***
(0.000)
0.0001
(0.114)
Net
Income/Common
Equity
0.0000***
(0.000)
0.0000***
(0.001)
0.0000
(0.940)
0.0037***
(0.000)
Family -0.0053*
(0.094)
0.0066
(0.401)
-0.0089*
(0.056)
-0.0269**
(0.021)
Cons 0.0086
(0.337)
-0.0514***
(0.000)
0.0547***
(0.000)
0.0412***
(0.006)
Obs 1668 434 835 399
Instruments 154 108 92 51
Groups 200 70 143 87
AR (1) -8.31 -4.02 -6.15 -3.95
[P-Value] (0.000) (0.000) (0.000) (0.000)
AR (2) 0.37 0.07 0.10 0.34
[P-Value] (0.711) (0.943) (0.923) (0.732)
Hansen test 165.79 64.19 98.57 51.48
[P-Value] (0.114) (0.997) (0.117) (0.150)
F-Significance (0.000) (0.000) (0.000) (0.000)
5. Conclusions
This paper aims to explore whether and how firm-level governance mechanisms affects
CSR using a large sample of firms listed at the PSX. Further, the paper investigates the
differential effects of CG on CSR across small, medium, and large firms. The findings
strongly support to the hypothesis that CG alone is not sufficient to induce firms to
Corporate Governance and Corporate Social Responsibility
30
provide more CSR information. Rather, we show that both CG and ownership structure
matters and have a vital role to play in firms’ choice of CSR engagement. The results
reveal that better governed firms have higher CSR disclosure when compared with lower
CG firms controlling for the level of insider ownership. Specifically, the results suggest
that firms are more likely to be involved in CSR when insiders’ ownership is at medium
level (25% to 50%) as compared to low (0 to 25%) or high level (>50%). Nonetheless,
the estimates suggest that CSR involvement decreases when the insider ownership goes
beyond the 50% level. Finally, the results reveal that there are significant differences in
the effects of CG and other underlying empirical determinants of CSR across different
sized firms.
5.1 Limitations and Avenues for Future Research
Although this paper significantly contributes to the existing literature by providing strong
and robust evidence on the role of CG, ownership structure, and firm size in determining
CSR, it has some limitations. The insider ownership thresholds of 0-25%, 25-50% and
over 50% are arbitrarily selected to proxy for a firm’s propensity to agency problems or
entrenchment problems. Yet, this method of classification has been adopted in prior
studies and is found appropriate in view of the actual position of insider ownership
structure of the sample firms. The scope of the study is limited to public non-financial
listed companies on Pakistan Stock Exchange. Future work could extend the research by
using the financial listed companies or non-listed companies.
This research relies on one source of CG, the company annual reports. Hence, another
avenue for future research is to examine other channels of CG, such as company websites
and regulatory announcements. Examining such channels will help provide a complete
picture about a company's CG. Future research should also be carried to explore the
perceptions of stakeholders’ on CG in Pakistan. The inclusion of new instruments like
CEO tenure, intangible assets, and sustainability of business, capital structure, executive
remuneration, and political regime could result in added edge and worth combinations of
the internal CG mechanisms.
REFERENCES
Branco, M. C., & Rodrigues, L. L. (2008). Factors influencing social responsibility
disclosure by Portuguese companies. Journal of Business Ethics, 83(4), 685-701.
Bushman, R. M., Piotroski J. D., & Smith A. J. (2004). What determines corporate
transparency? Journal of Accounting Research, 42(2), 207-251.
Chen, Z., Cheung, Y. L., Stouraitis, A., & Wong, A. W. S. (2005). Ownership
concentration, firm performance, and dividend policy in Hong Kong. Pacific-Basin
Finance Journal, 13(4), 431– 449.
Cheung, Y. L., Connelly, J. T., Jiang, P., & Limpaphayom, P. (2011). Does corporate
governance predict future performance? Evidence from Hong Kong. Financial
Management, 40(1), 159-197.
Gul et al.
31
Choi, B. B., Lee, D., & Park, Y. (2013). Corporate social responsibility, corporate
governance and earnings quality: Evidence from Korea. Corporate Governance: An
International Review, 21(5), 447-467.
Ekanayake, A. (2011). The role of accounting in corporate governance of banks in a
developing country: evidence from Sri Lanka (Doctoral thesis). Macquarie University,
Australia.
Esa, E., & Ghazali, M. A. N. (2012). Corporate social responsibility and corporate
governance in Malaysian government-linked companies. Corporate Governance, 12(3),
292-305.
Frynas, J. G., & Stephens, S. (2015). Political corporate social responsibility: Reviewing
theories and setting new agendas. International Journal of Management Reviews, 17(4),
483-509.
Ghazali, M. A. N. (2007). Ownership structure and corporate social responsibility
disclosure: Some Malaysian evidence. Corporate Governance: The International Journal
of Business in Society, 7(3), 251-266.
Ghazali, M. A. N. (2012). Corporate social responsibility and corporate governance in
Malaysian government-linked companies. Corporate Governance: The International
Journal of Business in Society, 12(3), 292-305.
Giannarakis, G. (2014). Corporate governance and financial characteristic effects on the
extent of corporate social responsibility disclosure. Social Responsibility Journal, 10(4),
569-590.
Gujarati, D. N. (2003). Basic econometrics, (4th Eds.). New York: McGraw-Hill.
Habbash, M. (2010). The effectiveness of corporate governance and external audit on
constraining earnings management practices in the UK (Doctoral thesis). Durham
University, UK.
Hu, W. H., & Alon, I. (2014). Are Chinese CEOs stewards or agents? Revisiting the
agency-stewardship debate, In Chinmay Pattnaik, Vikas Kumar (Ed.), Emerging Market
Firms in the Global Economy, International Finance Review (pp. 255-277). Emerald
Group Publishing Limited.
Jain, T., & Jamali, D. (2016). Looking inside the black box: the effect of corporate
governance on corporate social responsibility. Corporate Governance: An International
Review, 24(3), 253-273.
Javid, A.Y., & Iqbal, R. (2010). Corporate governance in Pakistan: Corporate valuation,
ownership and financing. PIDE Working Paper No. 57. [Online] Available:
http://www.pide.org.pk/pdf/Working%20Paper/WorkingPaper-57.pdf (November 24th,
2016).
Corporate Governance and Corporate Social Responsibility
32
Jizi, M. I., Salama, A., Dixon, R., & Stratling, R. (2014). Corporate governance and
corporate social responsibility disclosure: Evidence from the US banking sector. Journal
of Business Ethics, 125(4), 601-615.
Jo, H., & Harjoto, M. (2011). Corporate governance and firm value: The impact of
corporate social responsibility. Journal of Business Ethics, 103(3), 351-383.
Khan, A., Muttakin, M. B., & Siddiqui, J. (2012). Corporate governance and corporate
social responsibility disclosures: Evidence from an emerging economy. Journal of
Business Ethics, 114(2), 207-223.
Lau, C., Lu, Y., & Liang, Q. (2016). Corporate social responsibility in China: A
corporate governance approach. Journal of Business Ethics, 136(1), 73-87.
Liu, X., & Zhang, C. (2017). Corporate governance, social responsibility information
disclosure, and enterprise value in China. Journal of Cleaner Production, 142(2), 1075-
1084.
Mainardes, E. W., Alves, H., & Raposo, M. (2011). Stakeholder theory: Issues to resolve.
Management Decision, 49(2), 226-252.
Mallin C. A., & Michelon, G. (2011). Board reputation attributes and corporate social
performance: An empirical investigation of the US Best Corporate Citizens. Accounting
and Business Research, 41(2), 119-144.
Manasakis, C., Mitrokostas, E., & Petrakis, E. (2014). Strategic corporate social
responsibility activities and corporate governance in imperfectly competitive
markets. Managerial and Decision Economics, 35(7), 460-473.
Mees, B. (2015). Corporate governance as a reform movement. Journal of Management
History, 21(2), 194-209.
Pease, G., & McMillan, K. (1993). The independent non-executive director. Longman
Professional, Melbourne.
Rees, W., & Rodionova, T. (2015). The influence of family ownership on corporate
social responsibility: An international analysis of publicly listed companies. Corporate
Governance: An International Review, 23(3), 184-202.
Reverte, C. (2009). Determinants of corporate social responsibility disclosure ratings by
Spanish listed firms. Journal of Business Ethics, 88(2), 351-366.
Ronnie Lo, H. K. (2009). Voluntary corporate governance disclosure, firm valuation and
dividend payout: Evidence from Hong Kong listed firms (Doctoral Thesis). Glasgow
University, UK.
Said, R., Omar, N. & Abdullah, W. N. (2013). Empirical investigations on boards,
business characteristics, human capital and environmental reporting. Social
Responsibility Journal, 9(4), 534-553.
SECP (2005). Manual of corporate governance. [Online] Available:
http://www.nzibo.com/IB2/manual-CG.pdf (October 13th, 2016).
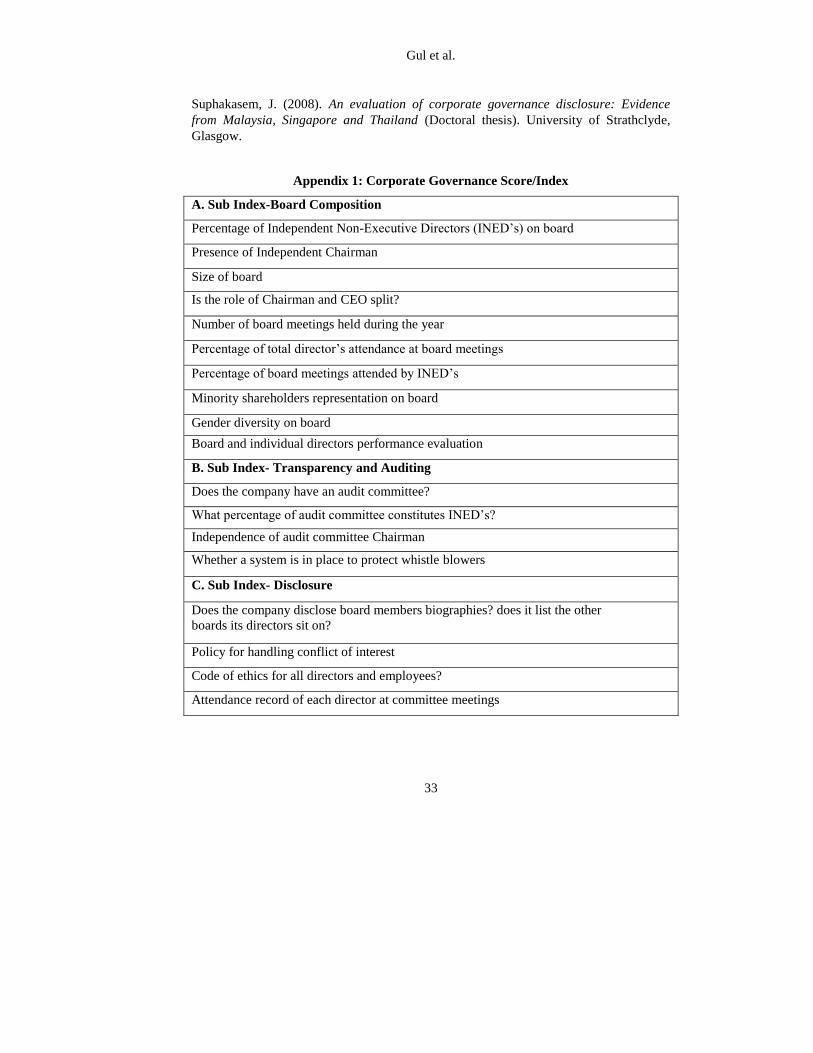
Gul et al.
33
Suphakasem, J. (2008). An evaluation of corporate governance disclosure: Evidence
from Malaysia, Singapore and Thailand (Doctoral thesis). University of Strathclyde,
Glasgow.
Appendix 1: Corporate Governance Score/Index
A. Sub Index-Board Composition
Percentage of Independent Non-Executive Directors (INED’s) on board
Presence of Independent Chairman
Size of board
Is the role of Chairman and CEO split?
Number of board meetings held during the year
Percentage of total director’s attendance at board meetings
Percentage of board meetings attended by INED’s
Minority shareholders representation on board
Gender diversity on board
Board and individual directors performance evaluation
B. Sub Index- Transparency and Auditing
Does the company have an audit committee?
What percentage of audit committee constitutes INED’s?
Independence of audit committee Chairman
Whether a system is in place to protect whistle blowers
C. Sub Index- Disclosure
Does the company disclose board members biographies? does it list the other
boards its directors sit on?
Policy for handling conflict of interest
Code of ethics for all directors and employees?
Attendance record of each director at committee meetings
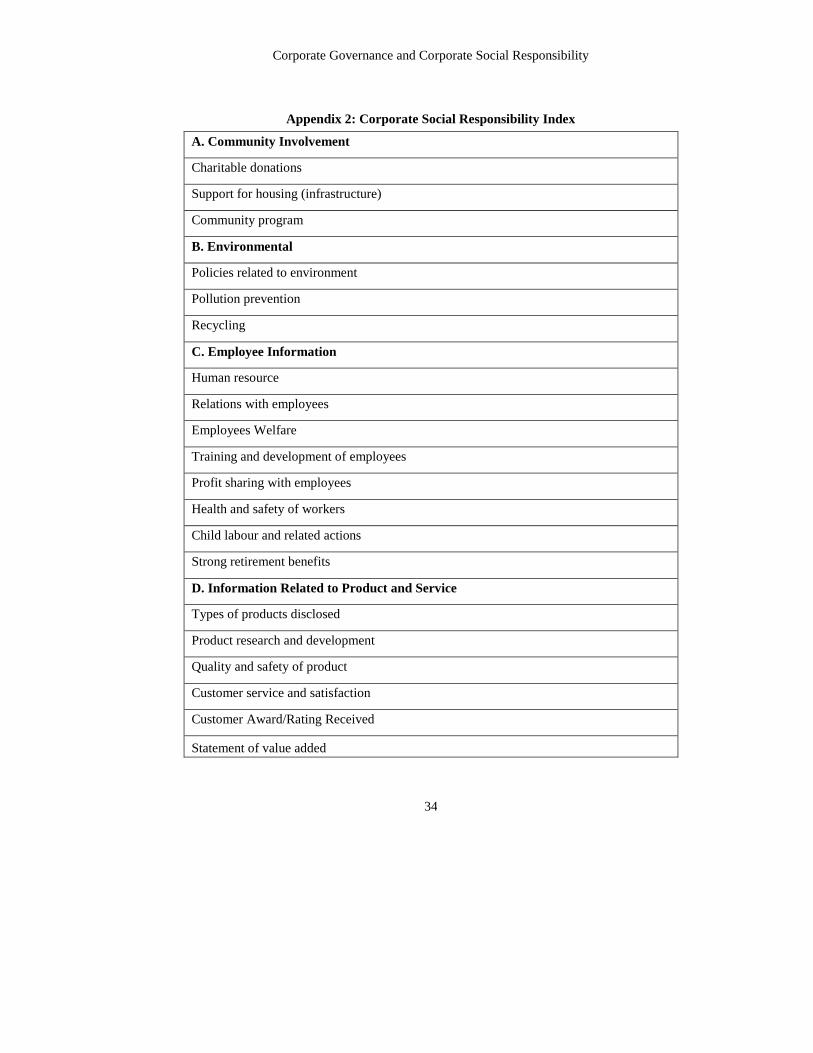
Corporate Governance and Corporate Social Responsibility
34
Appendix 2: Corporate Social Responsibility Index
A. Community Involvement
Charitable donations
Support for housing (infrastructure)
Community program
B. Environmental
Policies related to environment
Pollution prevention
Recycling
C. Employee Information
Human resource
Relations with employees
Employees Welfare
Training and development of employees
Profit sharing with employees
Health and safety of workers
Child labour and related actions
Strong retirement benefits
D. Information Related to Product and Service
Types of products disclosed
Product research and development
Quality and safety of product
Customer service and satisfaction
Customer Award/Rating Received
Statement of value added