Embed Size (px)
Citation preview

Corporate Financing Decisions When
Investors Take the Path of Least Resistance
Malcolm Baker Harvard Business School and NBER
Joshua Coval
Harvard Business School and NBER
Jeremy C. Stein Harvard Economics Department and NBER
First draft: August 2004 This draft: December 2004
We explore the consequences for corporate financial policy that arise when investors exhibit inertial behavior. One implication of investor inertia is that, all else equal, a firm pursuing a strategy of equity-financed growth will prefer a stock-for-stock merger to greenfield investment financed with an SEO. With a merger, acquirer stock is placed in the hands of investors, who, because of inertia, do not resell it all on the open market. If there is downward-sloping demand for acquirer shares, this leads to less price pressure than an SEO, and cheaper equity financing as a result. We develop a simple model to illustrate this idea, and present supporting empirical evidence. Both individual and institutional investors tend to hang on to shares granted them in mergers, with this tendency being much stronger for individuals. Consistent with the model and with this cross-sectional pattern in inertia, acquirers targeting firms with high institutional ownership experience more negative announcement effects and greater announcement volume. Moreover, the results are strongest when the overlap in target and acquirer institutional ownership is low and when the demand curve for the acquirer’s shares appears to be steep. This research is supported by the National Science Foundation and the Division of Research at Harvard Business School. Thanks to Heitor Almeida, Lucian Bebchuk, Jon Bernstein, Rob Daines, Peter DeMarzo, Darrell Duffie, John Friedman, Mark Garmaise, Peter Henry, David Laibson, Ulrike Malmendier, Rich Matthews, Stefan Nagel, Michael Ostrovsky, Jay Ritter, Andrei Shleifer, Ilya Strebulaev, Ivo Welch, Jeff Zwiebel, and seminar participants at Duke, Harvard Business School, the University of Illinois, Stanford, Notre Dame, the University of Texas, McGill, Columbia, the USC conference on Financial Economics and Accounting, and the NBER for helpful comments.

1
I. Introduction
Much of finance theory rests on the assumption that investors continuously monitor their
portfolios and condition their investment decisions on the most recently available information.
Even in models with transaction costs (e.g., Constantinides (1986)) or behavioral biases (e.g.,
Barberis, Shleifer and Vishny (1998), Daniel, Hirshleifer and Subrahmanyam (1998), and Hong
and Stein (1999)), where trade may not be continuous and updating may not be fully rational,
investors still can be thought of as processing new information and re-evaluating the decision of
whether or not to trade on a constant basis.
While this assumption is convenient for modeling purposes, it is also unrealistic. A large
body of existing evidence – which we add to below – suggests that people often behave in a way
that might be characterized as inertial, or as taking the path of least resistance. Inertial behavior
can arise from a variety of sources, including endowment effects (Thaler (1980), Kahneman,
Knetsch and Thaler (1990, 1991)), a tendency to procrastinate in decision making (Akerlof
(1991), O’Donoghue and Rabin (1999)), or the cognitive fixed costs associated with re-
evaluating and re-optimizing an existing portfolio.1
In this paper, we argue that investor inertia may exert a significant influence on financial-
market outcomes. Our particular focus is the consequences of inertia for corporate financial
policy, and the main idea can be illustrated with a simple example. Consider a firm A that needs
to acquire a new physical asset – say a chemical plant – and that has no spare cash or debt
capacity. The firm is faced with two options. First, it can do a seasoned equity offering (SEO)
and use the proceeds to build the chemical plant from scratch. Alternatively, it can engage in a
1 In a famous experiment, Kahneman, Knetsch and Thaler (1990) demonstrate that students who are randomly endowed with a coffee mug subsequently place a much higher reservation price on it than students who are not given a mug, and who are asked to bid on one. They argue that this behavior arises out of loss aversion (Kahneman and Tversky (1979)).

2
stock-for-stock merger with another firm T whose only asset is an exactly identical plant. Of
course, there are a variety of real-side distinctions, such as time-to-build delays, merger premia,
and competitive effects, as well as taxes and transaction costs that might weigh in this decision.
However, setting these considerations aside, the basic question we pose is whether investor
inertia also has an incremental impact on the assessment of the two alternatives.
Note that in the standard corporate-finance framework, there is no meaningful difference
between the two transactions, and hence no reason for firm A to prefer one over the other. In
either case, the firm winds up with the same assets, and the same capital structure. Even if
managers have superior information about the prospects of the acquiring firm as in Myers and
Majluf (1984), this argument still applies: equity-financed investment is equity-financed
investment, so either deal should in principle carry the same information content.
We entertain two departures from the standard framework. First, we assume that there is
a downward-sloping demand curve for firm A’s shares. This downward-sloping demand curve
arises not from asymmetric information, but rather from irreducible differences of opinion
among investors as to the value of A’s pre-existing assets. Second, and crucially, we assume that
some investors in the target firm T are inertial in the following sense: they will not make the
active decision to buy shares in A in an SEO, but if they are granted these shares in a stock-for-
stock merger, they will also not make the active decision to sell them.2
Under these conditions, a stock-for-stock merger will be strictly more attractive to firm A
than SEO-financed greenfield investment. The reason is that with a merger, some firm-A shares
are simply absorbed by the inertial T investors, and thus are not ever floated on the open market. 2 These two assumptions place the model in the broader literature of behavioral corporate finance that considers the impact of less-than-fully-rational investors on corporate investment and financing decisions. Early work in this area includes Fischer and Merton (1984), Morck, Shleifer, and Vishny (1990a), Blanchard, Rhee, and Summers (1993), and Stein (1996). Behavioral papers on the specific topic of mergers include Roll (1986), Shleifer and Vishny (2003), Malmendier and Tate (2003), and Friedman (2004). See Baker, Ruback, and Wurgler (2004) for a survey.

3
With a downward-sloping demand curve for firm-A shares, this implies a smaller negative price
impact, which means that firm A does not have to give up as many new shares in the merger as in
an SEO. Said differently, a stock-for-stock merger changes the default setting for inertial T
investors relative to an SEO – it makes the default one in which they are holders of A shares,
which can be thought of as pushing out the overall demand curve for firm-A stock.3
This way of thinking about equity financing ties in closely with recent empirical work by
Fama and French (2004). They document that although SEOs are relatively rare, total external
equity financing – which in addition to SEOs, can come in the form of stock-for-stock mergers
or stock-based employee compensation – is actually quite substantial for most classes of firms.
For example, over the period from 1999 through 2001, Fama and French find that S&P 100 firms
raised an annual average of only 0.09 percent of assets via SEOs, but 1.05 percent via various
forms of stock-based compensation, and 3.68 percent via mergers. In other words, the volume of
equity finance raised in mergers by these large firms was roughly 40 times that raised in SEOs.
As Fama and French (2004) point out, these stylized facts are not easily reconciled by
standard corporate finance theories, such as the asymmetric-information-based approach of
Myers and Majluf (1984). Myers and Majluf have a good story for the relative scarcity of SEOs
taken in isolation, but they have little to say about why mergers would be a dominant substitute.
Indeed, as noted above, a direct application of Myers-Majluf logic would seem to imply that
stock-for-stock mergers face the same asymmetric-information problems as SEOs.4
3 Madrian and Shea (2001), and Choi, Laibson, Madrian and Metrick (2002, 2003) demonstrate just how powerful the effect of defaults can be in the context of retirement savings decisions. To take just one example, when firms set the default in their 401(k) plans to automatic enrollment, very few workers choose to opt out, resulting in participation rates close to 100 percent. In contrast, if the default is no enrollment, so that a worker has to make an active decision to participate in the plan, participation rates are generally much lower. In a related corporate finance paper, Zhang (2004) argues that the endowment effect can explain IPO underpricing. 4 It is possible to augment the Myers-Majluf model so as to introduce a distinction between mergers and SEOs. Perhaps the terms of a merger have to be negotiated with target management, who are better informed about the value of acquirer assets than the typical outside shareholder, and who thus act as a certifier of acquirer-firm value.

4
In contrast, our theory not only explains why SEOs are relatively less important, it also
provides an affirmative rationale for the use of stock-for-stock mergers in preference to SEOs.5
Of course, as noted above, there are a variety of other real-side factors that might also potentially
drive a wedge between mergers and SEOs. Nevertheless, the Fama-French (2004) facts are
sufficiently striking that, at a minimum, an investigation of the financing-side differences
contributing to this tradeoff would seem warranted.
After fleshing out our idea with the aid of a simple model in Section II, we examine some
of its empirical implications in Section III. We begin by verifying that our premise of investor
inertia is relevant in the context of mergers. Using data on both individuals and institutions, we
look at investors’ propensity to hold on to shares that they are granted in stock-for-stock mergers.
We focus on situations in which a given investor in the target owns none of the acquirer before
the deal, so that it can be inferred that he does not have a high valuation for the acquirer.6 Even
in such cases, target investors have a remarkably high likelihood of owning acquirer shares after
the merger transaction closes. We estimate that roughly 80 percent of individuals behave as
“sleepers”, and simply accept shares they are given in a merger. For institutions, the estimated
fraction of sleepers is significantly smaller, at around 30 percent, but still noteworthy.
Next, we test one of the theory’s central predictions. Given that institutional investors are
less prone to inertia than individuals, our model implies that the announcement return to the
The problem with this story is that it may well be possible for the acquirer to co-opt target management by offering a side payment (e.g., a seat on the board of the combined company) which would compromise their role as a certifier. 5 Our basic line of reasoning suggests that stock-based employee compensation may also be preferred to SEOs. If workers are subject to an endowment effect (so that once granted stock, they are reluctant to sell it, even if they would not have gone out and bought it on their own in the first place) a firm facing a downward-sloping demand curve will prefer to place stock with them than to sell it on the open market. This observation may help to resolve the puzzle of why firms give stock to low-level employees, where incentive effects are likely to be minimal. See, e.g., Bergman and Jenter (2003) and Oyer (2004). 6 As discussed below, the conceptually cleanest case is one in which the acquirer is very large relative to the target, so the post-merger combined company is composed almost entirely of acquirer-firm assets.

5
acquirer in a stock-for-stock deal will be more negative, all else equal, if the target firm has a
higher proportion of institutional shareholders. This is because institutions are expected to dump
more of the acquirer-firm shares they receive back onto the market; individuals, by contrast, tend
to hang on to these shares, thereby mitigating price impact. Using a variety of specifications, we
find robust evidence for this hypothesis. We also provide another clue that these return effects
are due to price pressure, as our model suggests: the acquirer has more trading volume around
the announcement date when the target has a higher proportion of institutional shareholders.
To rule out alternative explanations, we verify some finer predictions of the model. Both
acquirer return and volume effects are largest when the overlap between target and acquirer
institutional ownership is small. Intuitively, non-overlapping institutional owners of the target
are the ones most likely to unload their shares on announcement of a merger, as they have
demonstrated a lack of interest in holding acquirer assets. The results are also stronger when
various proxies suggest that the acquirer’s demand curve is steep. Finally, we show that,
consistent with our model, each of the above results is only present in stock-swap mergers, and
not in cash deals.
II. The Model
A. Investor Beliefs
The model has three dates, labeled 0, 1 and 2. The focus is on the behavior of a potential
acquirer firm A, which will be faced with an investment decision at time 1. As of time 0,
however, the prospect of investment is unanticipated by the market, so A’s stock is priced solely
on the basis of cashflows from assets already in place. These assets in place will yield a
liquidating dividend of D at time 2.
6
Our first crucial assumption is that there are differences of opinion among investors in
firm A as to the expected value of D. In particular, there is a continuum of “A-specialists” who
have values of E(D) uniformly distributed on the interval [F, F + H], where the parameter H can
be interpreted as a measure of the divergence of opinion. And while they are risk-neutral, the A-
specialists are constrained to not invest more than their total wealth of W. To ensure the
existence of interior solutions in what follows, we stipulate that W > F. Finally, maintaining a
short position over the interval from time 0 to time 2 is assumed to be impossible.7
Taken together, these assumptions have the effect of creating a downward-sloping
demand curve for firm-A assets.8 Given this demand curve, the market value of the firm at time
0, P0, is determined by setting P0 equal to the total wealth of those A-specialists with valuations
in excess of P0. In other words, the value of the firm is equal to the wealth of those investors
who are buyers in equilibrium. This condition is equivalent to:
( )00 PHFP HW −+= , or HW
WHFP ++= )(0 . (1)
From (1), along with our assumption that W > F, it follows that P0 always lies between F
and (F + H). The fraction of investors who are long the stock in equilibrium is given by HWHF
++ .
Also, we have the intuitive properties that dWdP0 > 0, and dH
dP0 > 0. The latter is just a version of
Miller’s (1977) insight that, in the presence of a short-sales constraint, prices are increasing in
the heterogeneity of investor opinion. To see the import of the downward-sloping demand curve,
7 Miller (1977) was the first to model the combined effects of differences of opinion and short-sales constraints. Recent treatments include Chen, Hong and Stein (2002), Scheinkman and Xiong (2003), and Hong, Scheinkman and Xiong (2004). 8 We use this formulation to ease the exposition. In fact, any set of assumptions that produces downward-sloping demand is sufficient. And, on this point, the empirical literature is fairly clear. Bagwell (1992) and Hodrick (1999) show that investors have downward-sloping demand in Dutch auction share repurchases. Shleifer (1986), Harris and Gurel (1986) and more recently Kaul, Mehrotra, and Morck (2000), Wurgler and Zhuravskaya (2002), and Greenwood (2004) illustrate the price impact of uninformed demand, by examining index inclusion and rebalancing decisions. Mitchell, Pulvino and Stafford (2004) focus on price pressure in the context of mergers and acquisitions.

7
observe that HWW
dFdP
+=0 < 1. This means that, if W is held constant, the firm’s market value does
not go up one-for-one with an increase in expected cashflows. The intuition is that as the firm
gets larger, shares must be absorbed by investors who are less optimistic. Moreover, dFdHPd 0
2
< 0,
so that an increase in heterogeneity amplifies the downward slope of the demand curve.
Example: Suppose F = 100, H = 100, and W = 300. Then firm A has a market value of
P0 = 150 at time 0. The more optimistic half of the A-specialists (those with valuations between
150 and 200) own all the shares, while the remaining half of the A-specialists (those with
valuations between 100 and 150) sit out of the market.
At time 1, the manager of firm A announces that he has decided to buy a specific asset –
for concreteness, think of it as a chemical plant – and to finance it with an equity issue.9 As in
Myers and Majluf (1984), we assume that the manager acts on behalf of current shareholders.
With the investment decision given, the only remaining consideration is the price of the firm
immediately after the equity issue – the higher this price, the fewer shares must be given up in
the issue, and hence the larger the stake retained by pre-existing shareholders. The acquisition of
the asset can be carried out in one of two ways. The first option is a combination of greenfield
investment and a seasoned equity offering (SEO). That is, firm A raises cash in an SEO, and
uses this cash to build the plant from scratch. The second option is a stock-for-stock merger with
a publicly-traded target firm T whose only asset happens to be the desired type of plant. The
former case is more straightforward, and makes a natural benchmark, so we consider it first. 9 In what follows, we assume that the A-manager is interested in equity-financed growth simply because it represents a positive-NPV investment. However, our results would be similar if instead we assumed that the A-manager was motivated by either: i) a desire to increase the size of his empire; or ii) a belief that his stock was overvalued, as in Stein (1996) or Shleifer and Vishny (2003), for example.

8
B. Greenfield Investment Financed by an SEO
It costs an amount K to build the plant as a greenfield investment. Once built, the plant
increases firm A’s terminal dividend by RG > K. For simplicity, we assume that there is no
disagreement among the A-specialists as to the value added by the plant, so that once it is on the
books, their expectations of terminal cashflow are uniformly distributed on the interval [F + RG,
F + RG + H].
To finance construction of the plant, the SEO must be for enough shares to raise K.
Denote the equilibrium post-SEO market value of the firm at time 1 by P1G. Note than any A-
specialists who were long at time 0 cannot participate in the SEO, since they already have all of
their wealth invested in firm-A shares. Thus the new shares must be absorbed by those A-
specialists who were previously on the sidelines. This group has total wealth of (W – P0), and
has valuations distributed uniformly on the interval [F + RG, P0 + RG].10 Since the market value
of the shares they absorb must equal K, equilibrium requires that
( )GGFPPW PRPK 100
0 −+= −− , (2)
which can be re-written as
KRPP WHGG −+= 01 . (3)
Note that P1G is necessarily less than P0 + RG – the market value of the firm does not go
up by the full amount of the added cashflows RG from the new investment. In other words, the
SEO has a price-pressure effect, the magnitude of which is increasing in the heterogeneity
10 In order for the SEO to be able to raise K, it must be that the total wealth of the previously sidelined A-specialists, (W – P0), weakly exceeds K. This condition can be expressed as W(W – F)/(W + H) ≥ K, and we assume it holds in what follows.

9
parameter H. This reflects the fact that the SEO must be absorbed by the relatively less
optimistic A-specialists, who were sitting out of the market prior to the issue.
Example (continued): As before, keep F = 100, H = 100, and W = 300. Suppose further
that K = 100, and RG = 110. This yields P1G = 226.67, which implies that a 44.12 percent share
in the firm is issued in the SEO (since 0.4412 · 226.67 = 100). The market value of the stake
held by pre-existing firm-A shareholders drops from 150 to 126.67 – the SEO is accompanied by
a negative price impact of 15.56 percent. After the SEO, 83.33 percent of the A-specialists have
long positions.
C. Stock-for-Stock Merger
As an alternative to greenfield investment, firm A can seek to acquire firm T in a stock-
for-stock merger. Firm T’s only asset is a plant similar to that which be built by firm A. In
particular, if A acquires T, its terminal dividend increases by a certain amount RM. The obvious
benchmark case is when RM = RG, so that merger and greenfield investment yield identical
cashflows. But we will also briefly consider the case in which RM < RG, so that there are some
relative diseconomies associated with the merger – for example, the plant is not a perfect fit for
the acquirer, or the target has some other assets which are costly for the acquirer to dispose of.
1. All target shareholders are awake
We make the following assumptions about target shareholders. First, none of them are
among the group of A-specialists. That is, as of time 0, their expectations of firm A’s terminal
dividend are relatively low; without loss of generality one can think of all of them as simply

10
having E(D) = F. Empirically, this implies that, prior to the merger announcement at time 1,
there is no overlap between the investors in firms A and T.11
Second, target shareholders are willing to sell out for an aggregate consideration of K,
which is equal to the cost of greenfield investment for firm A. This is a natural normalization for
our purposes.12 One way to rationalize it is to imagine that the plant is no longer of any use to
the management of firm T, and that besides firm A and firm T, there are many other financially
unconstrained firms in the economy to whom such a plant is worth exactly K. Competition
among these other firms – who would pay in cash instead of shares – not only pins down the cost
of greenfield investment (if the resources to build new plants are in limited supply) but also sets
the reservation value for T’s shareholders when they auction off their firm.13
In a stock-for-stock merger, shares in the newly-created merged firm M are placed
directly into the hands of firm T’s investors. Recall that these T-investors have relatively low
valuations of M – they consider it to be worth only (F + RM) – as compared to the pool of A-
specialists, whose valuations of M all exceed (F + RM). Thus one might expect that the T-
investors would immediately take any shares in M that they receive in a stock-for-stock
exchange, and sell them off in the open market, where these shares would be absorbed by A-
specialists, thereby replicating the outcome in the SEO case.
11 Nothing substantive changes if we allow for partial overlap. 12 In reality, there may be reasons why it is either cheaper or more expensive to acquire the same assets in a merger, as opposed to via greenfield investment. On the one hand, a merger is likely to be cheaper if replacement cost exceeds current operating value. On the other hand, a merger can be more expensive if the acquiring firm needs to pay a premium, say because of free-rider problems. The analysis in the latter case is similar to the situation where RM < RG (discussed in footnote 15 below). Provided the cost differential is not too large, inertia may still lead the acquirer to prefer a stock-swap merger. 13 We do not explicitly model the details of this auction. Perhaps the easiest way to think of it is that the acquisition is negotiated between acquirer and target management, and that the former, knowing the latter’s reservation value of K, makes a take-it-or-leave it offer for this amount.

11
This logic is correct, if all T-investors are aware of the merger, and react to it in a rational
fashion. More precisely, under full rationality, and with RM = RG, the two transactions are
identical: the fraction of the merged firm given to T-investors, is the same as the fraction issued
in the SEO case; and the post-announcement market values, P1M and P1
G, are also the same.
2. Some target shareholders are asleep
However, our primary interest is in exploring the consequences of investor inertia, so we
posit that only a fraction α < 1 of the T-investors are “awake”. These awake T-investors
rationally sell off any shares in M that they receive in the merger. The remaining (1 – α) of the
T-investors are “asleep”, and simply hold on to the shares in M that they are given. Thus for the
sleeping T-investors, the default condition matters: they do not actively seek to buy shares that
are offered in an SEO, but they also do not actively seek to sell shares that are granted to them as
part of a stock-for-stock merger. Or said differently, the sleeping T-investors always take the
path of least resistance, which is simply to do nothing.
In the presence of sleepers, we assume that the awake T-investors are the only ones who
actively evaluate the bid from firm A.14 In doing so, they continue to place a reservation value
of K on their firm’s assets, and recognize that they will immediately resell all shares that they
receive in the stock swap. If we again denote the post-announcement market value of the
merged firm by P1M, the requirement that the bid be satisfactory to the awake T-investors
14 One might imagine that only awake T-investors are ever involved in negotiating the terms of the merger with the acquirer. A friendly merger typically requires approval of a majority of shareholders, which at first glance would seem to imply a lower bound on α of 0.50, to the extent that one needs to be awake to vote. However, to the extent that shares of individual investors are held (and voted) in street name, it is possible that α might fall below 0.50 without preventing a deal from getting done.

12
amounts to saying that the total value of shares issued in the merger, evaluated at P1M, be equal
to K. Note that this condition is exactly the same as the analogous one in the greenfield case.
Where things differ is in the determination of P1M. As a result of the sleeping T-investors
who hang on to their shares, only a fraction α of the shares issued in the merger ever comes on
the market, and hence only this fraction must be absorbed by the pool of previously-sidelined A-
specialists. Thus equations (2) and (3) are modified as follows:
( )GGFPPW PRPK 100
0 −+= −−α , (4)
KRPP WHGG α−+= 01 . (5)
Example (continued): As before, keep F = 100, H = 100, W = 300, K = 100, and RM =
110. Assume that the fraction of sleepers among T-investors is given by α = 0.50. These
parameters yield P1M = 243.31, which implies that a 41.10 percent share of the firm is issued in
the SEO. (Note that the value of the merger bid, evaluated at market prices, is 0.411 · 243.31 =
100.) The market value of the stake held by pre-existing firm-A shareholders drops from 150 to
143.31 – the merger is accompanied by a negative price impact of 4.46 percent. After the
merger, 66.67 percent of the A-specialists have long positions with an aggregate market value of
193.31, and sleeping T-investors have a long position with a market value of 50.
As can be seen, if RM = RG, the initial shareholders in firm A are strictly better off with
the stock-for-stock merger than with greenfield investment financed by an SEO: they give up a
smaller stake in the merged firm, and suffer a smaller adverse price hit upon announcement of

13
the deal.15 Their gains come at the expense of the sleeping T-investors. In the greenfield case,
the sleepers are not harmed by their inertial behavior, because given their low valuations of firm-
A assets, there is never any reason for them to participate in the SEO. In contrast, with a stock-
for-stock merger, the sleepers wind up with shares that – if they were to think about it – they
would consider to be worth less than what they had before the deal. The failure of the sleepers to
unload their stake in the merged firm makes bidding-firm shareholders better off, as it reduces
the quantity that must be absorbed by the A-specialists, and hence the price impact of the merger.
This discussion makes it clear that our results are driven by the interplay of two key
assumptions. First, we require a downward-sloping demand curve for the assets of the acquirer
firm; this downward-sloping demand curve is in turn the product of differences of opinion and a
short-sales constraint. And second, we also require that some non-zero fraction of target-firm
shareholders behave as sleepers, and automatically hang on to any shares that they are granted in
a stock-for-stock merger. If either of these assumptions fails to hold, then for RM = RG, SEO-
financed greenfield investment and the stock-for-stock merger become equivalent transactions.
D. Empirical Implications
The model’s most basic empirical implications can be summarized as follows.
15 More generally, RM may be less than RG (or similarly, KM may be greater than K). In this case, the choice depends on just how optimistic the manager of firm A is. Assuming he owns some stock – or acts on behalf of his initial shareholders – the manager of A prefers a merger if: ((P1
M – K)/P1M)(E(D) + RM) > ((P1
G – K)/P1G)(E(D) + RG),
where E(D) is the manager’s expectation of the cashflow coming from firm A’s original (pre-transaction) assets. If it is the case that ((P1
M – K)/P1M) > ((P1
G – K)/P1G), the manager will have a stronger preference for a merger the
greater is E(D), all else equal. In other words, he will be willing to tolerate a larger shortfall of RM relative to RG. The intuition is that the merger allows the original shareholders to part with a smaller stake, and this is worth more the more optimistic one is about the prospects for firm A’s assets.
14
Proposition 1: Mergers vs. Greenfield Investment
(i) If a firm can acquire approximately the same assets via a merger as through greenfield
capital expenditures, it will prefer the merger. (ii) Moreover, this preference for mergers over
capital expenditures will be more pronounced when the difference of opinion H among
acquiring-firm investors is greater; (iii) when a greater fraction of target shareholders are asleep
(iv) when the scale of the investment project K is larger; and (v) when the firm is financially
constrained.
We have already discussed the intuition for parts (i) through (iv) of the proposition,
which amount to a comparison of equations (3) and (5). As to part (v), which concerns the role
of financial constraints, note that since the model presumes the need for equity financing, and
since downward-sloping demand curves are to some degree problematic for equity financing of
any type, our general predictions should be largely confined to those firms that do not have
sufficient spare cash or debt capacity to avoid an equity issue altogether.16
Although we do not attempt a direct test of Proposition 1, part (i) can be thought of as
consistent with the main message of Fama and French (2004), as discussed above. Part (iii)
could in principle be tested by examining the likelihood of merger announcements across
potential targets with varying levels of sleepiness. However, we expect the power of such a test
to be limited. In most cases only a very small number of firms are likely to have the specific
assets that a given acquirer wants – i.e., bidding firms simply do not have much scope for
16 A firm that considers its stock to be overvalued, and that wants to exploit this overvaluation, can be thought of as “financially constrained” in our sense – issuing equity is essential to any transaction it undertakes. Our model then explains why stock-for-stock mergers are more attractive for such a firm than equity-financed capital expenditures, even when the assets ultimately acquired would be similar in either case. This contrasts with Shleifer and Vishny (2003) who argue that stock-for-stock mergers are motivated by overvaluation, but do not explain why they are any better an outlet for overvalued acquirers than equity-financed capital expenditures.
15
picking targets based on the composition of their shareholder base. Therefore, we focus most of
our empirical effort on tests that are likely to have greater power, such as price and volume
responses to merger announcements. In these tests, it works to our advantage to be able to think
of the identity of the target as being determined primarily by factors outside of our model, such
as the quality of the match with the acquirer.17
We have also done some further comparisons of merger and SEO activity that speak to
part (iv) of the proposition, regarding the effects of project size. Based on a sample of 6,526
SEOs and 2,040 stock-for-stock mergers of public companies over the period 1990-2003, we
find that not only do mergers raise substantially more total equity financing than SEOs ($2,559
billion vs. $968 billion), but that the largest transactions – both in absolute terms and relative to
issuer size – are much more likely to be mergers than SEOs. For example, about 53 percent of
stock-for-stock mergers are for more than $100 million, while only 33 percent of SEOs are.
Alternatively, 23 percent of mergers are for more than 50 percent of the issuer’s market value,
while only 10 percent of SEOs are.18
Again, we stress that these stylized facts do not represent a decisive test of Proposition 1
– they are also consistent with other interpretations, such as mergers having an advantage over
greenfield investment when it comes to big projects where time-to-build considerations are likely
to be important. Nevertheless, they do fit nicely with our idea that, when an issuer facing a
downward-sloping demand curve needs to raise a large amount of equity financing, a merger is a
better vehicle for doing so than an SEO.
17 This approach can be viewed as loosely analogous to the empirical literature that has tested Myers and Majluf (1984) by focusing on price responses to issuance announcements, rather than by attempting to predict individual firms’ debt versus equity choices. 18 The numbers in this paragraph are based on an analysis of transactions in the Thomson Financial mergers and acquisitions and seasoned equity offerings databases.

16
Proposition 2: Merger Announcement Effects
(i) All else equal, an increase in the fraction α of awake target-firm investors strengthens
the adverse impact of a stock-for-stock merger announcement on the price of the bidding firm.
(ii) An increase in the slope of the acquirer’s demand curve – as measured by the degree of
investor heterogeneity H – has a similar effect. (iii) There is an interaction between these two
variables: a steeper acquirer demand curve amplifies the negative stock-price consequences of
awake target-firm investors. Thus, denoting the announcement price impact by ∆P, we have
that: (i) αdPd∆ < 0; (ii) dH
Pd∆ < 0; and (iii) dHdPd
α∆2 < 0.
Proposition 2 follows immediately from inspection of equation (5). Part (i) of the
proposition forms the basis for one of our main empirical tests below. Part (ii) – which does not
involve the wakefulness parameter α, and which holds even in a world with no inertia – is the
subject of a recent paper by Moeller, Schlingemann and Stulz (2004). They use the dispersion of
analyst forecasts as a proxy for H, and find evidence consistent with the hypothesis that dHPd∆ < 0.
Taking a similar approach to measuring H, we also attempt to test part (iii) of the proposition.
Thus, consistent with our theoretical emphasis, our empirical work centers on those effects that
are most directly related to the wakefulness parameter α.
E. Further Issues
1. Merger arbitrage
In the model, the announcement and completion of a merger occur simultaneously, at
time 1. More realistically, there can be a substantial time lag between announcement and

17
completion, and completion may not be a sure thing when the deal is first announced. It is easy
to extend the model to incorporate these features. Neither of the two propositions above is
changed, though the model may now also admit a role for merger arbitrageurs.
To see how such arbitrage might work, imagine that the announcement of a merger
occurs at time 1, but the transaction is not completed until time 1½. Moreover, since completion
is not ensured as of time 1, the stocks of firm T and firm A are not interchangeable immediately
post-announcement – they are no longer certain to both turn into claims on the merged firm M.
In this setting, it is possible that awake T-investors will want to sell their shares in T
immediately, as of time 1. But the previously-sidelined A-specialists may prefer to buy A shares
when their price falls at this time, rather than buying T shares. This is because their primitive
preference is for A assets, and there is a risk that the T shares will not turn into a claim on any A
assets, if the deal falls through. The arbitrageurs can bridge this gap by buying T shares from the
T-investors, and for each share bought, short-selling K/(P1M – K) A shares to the A-specialists.19
If the deal does indeed go through, each side of the arbitrage trade will convert into the same
number of shares in the merged firm M. If not, arbitrageurs will be left with an unhedged
position in T and A shares.
As long as the completion risk is small, the results for prices at time 1 should remain
approximately the same as described above. That is, the adverse impact to A’s stock price will
occur primarily on announcement of the deal, rather than on completion, and will continue to be
a function of the number of sleepers among the T-investors. Intuitively, the more sleepers there
are, the fewer shares of T are unloaded onto the arbitrageurs at time 1, and hence the fewer
19 Note that we are now allowing arbitrageurs to hold short positions between time 1 and time 1½, even though we previously ruled out short-selling by investors over the longer interval from time 1 to time 2. A loose rationalization might be that those players who have the ability to short-sell are unwilling to take long-horizon unhedged short positions because of the fundamental risk involved.

18
shares of A are short-sold by these arbitrageurs into the downward-sloping demand curve of the
A-specialists.
The one thing we gain by explicitly considering the process of merger arbitrage is a more
precise set of predictions about trading volume as of the announcement date.
Proposition 3: Abnormal Trading Volume Around Merger Announcements
(i) All else equal, an increase in the fraction α of awake target-firm investors leads both
to more trading volume in the target around the announcement date; and (ii) to more trading
volume in the acquirer.
Part (i) of the proposition is self-evident: if all target-firm shareholders are asleep, none
of them will sell on announcement of the deal, and there will be no trading volume in the target.
Part (ii) is a bit more subtle, and relies on the merger-arbitrage mechanism: the more shares are
dumped by awake target-firm shareholders, the more the arbitrageurs have to step in and buy,
and hence the more short-selling of the acquirer they end up doing to hedge their positions.20
These predictions for volume are a useful complement to our predictions for acquirer stock
returns in Proposition 2 above. If both Propositions 2 and 3 are borne out in the data, it becomes
more likely that the results for stock returns are driven by the sort of price-pressure effects
envisioned in our model, as opposed to some other confounding factor.
20 An important caveat is that this short-selling will only occur if the terms of the merger involve an exchange ratio that is fixed as of the announcement date. If, instead, the dollar value of the bid is fixed, and the exchange ratio is left to float until completion, the arbitrageurs will not want to short the acquirer. See Mitchell, Pulvino and Stafford (2004) for an analysis of this issue.

19
2. Capital gains taxes
We have not yet addressed the following important question: to what extent can what we
call investor inertia, or sleepiness, be thought of as simply a rational reluctance on the part of
target-firm shareholders to incur capital-gains taxes by selling their shares? In other words,
might we be able to generate all of our results by appealing to nothing more than such taxes?
The basic answer is no. Let us begin with the simplest case, in which all target
shareholders are symmetric with respect to tax considerations – all have the same basis, and all
face the same marginal tax rate on capital gains. It is certainly true that, conditional on doing a
merger, these shareholders will have a preference for receiving the consideration in shares, rather
than in cash, because the former allows them to avoid the capital-gains tax. So the tax-driven
prediction is that a relatively large fraction of mergers should be done on a stock-for-stock, rather
than cash basis.
However, our Proposition 1 is about something logically distinct: a preference on the part
of the acquirer for a stock-for-stock merger over the combination of greenfield investment and an
SEO. And here the tax story does not help, because the greenfield option does not impose a tax
burden on anybody. Thus even in the limit where a merger could be executed in a completely
tax-free fashion, there would still be no tax-related reason to strictly prefer the merger.
In contrast to Proposition 1, Propositions 2 and 3 are about cross-sectional differences in
the degree of sleepiness across target firms. In principle, it is possible that these differences
could be related to tax considerations.21 For example, if institutional investors are always tax
exempt, and individuals are not, this might explain why individuals are more prone to hang on to
21 This does not seem to be the case empirically, however. We show below that the degree of sleepiness does not seem to vary much with proxies for capital-gains-tax exposure. For example, sleepiness is not noticeably more pronounced in target firms that have had large price run-ups over the past few years.
20
their shares after a merger than institutions. But taxes alone cannot generate the sorts of patterns
in acquirer announcement returns predicted by Proposition 2.
To see why, consider a target firm in which all investors are heavily-taxed individuals. It
may be true that these individuals will be reluctant to sell any shares in the acquirer that they get
as part of a merger. But if they are fully rational, and understand this ex ante, they will demand a
greater number of shares in the first place, to compensate them for the fact that they are going to
be forced to hold stock that they do not value highly. So on net, the acquirer is made worse off
as a result of the tax-related friction. As long as everybody is rational, the acquirer must bear the
cost of inefficiently placing shares in the wrong hands. In contrast, if target shareholders are
non-taxable institutions, the shares will ultimately make their way into the right hands, those of
the previously-sidelined A-investors who value them more highly.
Example (continued): As before, keep F = 100, H = 100, W = 300, K = 100, and RM =
110. Consider two cases. In the first, all target shareholders are awake, and there are no taxes.
As we have seen, this yields the same outcome as the SEO, with 44.12 percent of the firm’s
shares being issued to raise 100. In the second case, all target shareholders are again awake, but
there are prohibitive capital-gains taxes, so that target shareholders are forced to hang on to any
acquirer shares they receive in a merger. Target shareholders value the combined post-merger
firm at 210, and have a reservation price of 100. So to get them to sell, they must be given 47.62
percent of the combined firm (100/210 = 0.4762), which is more than in the case with no taxes.
The bottom line is that investor inertia delivers something that capital-gains taxes alone
cannot. When it is granted to them as consideration in a merger, not only are inertial target

21
investors more likely to hang on to a stock that they would otherwise never have bought, but
crucially, they do not have to be compensated for doing so. This latter feature is why acquirers
can benefit from target-investor inertia, as in Proposition 2.
III. Empirical Analysis
Our empirical work is divided into two parts. First, we simply document that the key
premise of our model holds in the data: that is, target investors behave in an inertial fashion
around merger transactions. While we find that both individual and institutional investors
exhibit inertia, it is substantially more pronounced among individuals. Second, using this
distinction between individuals and institutions to create a proxy for the extent of investor
inertia, we test the cross-sectional implications of the model summarized in Propositions 2 and 3.
We show that acquirer announcement returns are more negative in transactions where the target
firm has a greater proportion of institutional (i.e., awake) shareholders, and that acquirer
abnormal trading volume is also greater around such transactions.
A. Data
Our sample of mergers includes 3,054 successfully completed transactions announced
between the second quarter of 1980 and the fourth quarter of 2000. Of these, most of our
analysis will focus on the subset of 1,890 stock-swap deals; the remaining cash deals are used
only as a control sample. We require that each deal involves a public acquirer, with a matched
announcement return available from CRSP. Quarterly observations on institutional ownership
come from the CDA Spectrum Institutional Holdings database, over the period from the first
quarter of 1980 through the fourth quarter of 2002. We track institutional holdings starting in the

22
quarter prior to announcement. Information on individual investor holdings comes from the
records of a discount brokerage firm (this is the Odean (1998) data) and is available only from
1991 to 1996. We also make use of a variety of CRSP and Compustat variables, as well as
analyst forecast data from IBES.
Table 1 presents summary statistics for the mergers in our sample. All variables are
Winsorized at the first and 99th percentiles, both in Table 1 and in the analysis that follows. In
Panel A, we look at target institutional ownership, which is calculated for the quarter prior to the
announcement of a merger and expressed as a percentage of shares outstanding. We also look at
“non-overlapping” target institutional ownership, defined as the fraction of the target owned by
those institutions who own no shares in the acquiring firm.22 As we discuss in more detail
below, non-overlapping institutional ownership is probably the best available proxy for the
wakefulness parameter α.
Panel B gives several deal characteristics. Acquirer and target size are equal to price
times shares outstanding two days prior to announcement. Relative size is equal to target size
expressed as a percentage of total target and acquirer size. Acquirer and target leverage are
equal to interest bearing debt (items 9+34 from Compustat) expressed as a percentage of book
assets (item 6) at the fiscal year end prior to announcement. Acquirer and target market-to-book
are equal to book assets minus book equity (items 216-130+35) plus price times shares
outstanding (from CRSP), all divided by book assets. Same Industry is an indicator variable
equal to one if the target and the acquirer are included in the same Fama and French (1997) 48-
industry grouping.
22 Matvos and Ostrovsky (2004) highlight the importance of overlapping institutional ownership in mergers, and discuss its implications for corporate governance.

23
Panel C presents stock-market data, all taken from CRSP. Acquirer and target
announcement returns are cumulative returns in excess of the value-weighted market over a five-
day window surrounding the announcement of a merger. Acquirer announcement volume is the
average daily volume over a five-day window surrounding the announcement of a merger,
expressed as a percentage of shares outstanding. Normal volume is the average daily volume
over a 60-day window starting 90 trading days before the announcement of a merger.
Finally, Panel D shows two acquirer demand-curve proxies, constructed from data in
CRSP and IBES. Our first proxy follows Scherbina (2002), and Moeller, Schlingemann, and
Stulz (2004), who use dispersion in analyst forecasts as a measure of disagreement about
fundamental value. Our particular measure is the same adopted by Moeller et al in a very similar
context, and is equal to the standard deviation of all outstanding earnings forecasts of long-term
growth. Our second proxy, idiosyncratic risk, is the standard deviation of the residuals from a
regression of acquirer excess returns on the Fama-French factors (RM, SMB, HML), and the
matched 48-industry portfolio return.23
B. Investor Inertia
1. Methodology
If all mergers were announced and completed instantaneously – as in our simple model –
it would be a straightforward matter to measure target investor inertia. Consider a merger in
which we have a set of target investors who have no initial position in the acquirer. By revealed
preference, these “target-only investors” do not place an especially high value on the acquirer. If
these investors were all awake, we would expect them to sell their shares immediately upon
23 All factor and portfolio returns were obtained from Ken French’s website.

24
announcement and simultaneous completion. In contrast, if the target-only investors were
asleep, we would expect them to do nothing. Thus a natural measure of inertia would be the
fraction of target-only investors doing nothing. This would correspond exactly to the key
variable (1 – α) in our model.
In practice, there is a lag between the announcement and completion of a deal. Our aim is
to get a picture of the total selling activity by target-only investors over this interval. Moreover,
the passage of time raises subtle benchmarking issues. For example, suppose that a particular
deal takes a year to close, and that we see ten percent of the target-only investors selling their
shares during the course of this year. Should we draw the conclusion that ten percent are
effectively awake, and responding to the merger? Not necessarily. Even in a year without a
merger, there is a baseline level of turnover. In other words, we expect to see some selling, for
example because of liquidity demand, even if all target investors are completely oblivious to the
fact that a merger has occurred. So, to measure inertia correctly, we need to calculate turnover
above and beyond what would be expected absent a merger.
Figure 1 illustrates our method for calculating investor inertia in a hypothetical merger
transaction. Time from announcement to completion is measured along the X-axis. The merger
is announced at the Y-axis and is completed by the end of the dashed line. At any point in
between, the dashed line represents the fraction of those pre-announcement target investors with
no initial position in the acquirer who continue to hold a long position, either in the target (in the
period prior to completion), or in the acquirer (in the period after completion). For example, the
figure shows that at completion, 32 percent of the original target-only investors are still holding
their positions, which have now converted into shares of the acquirer.
25
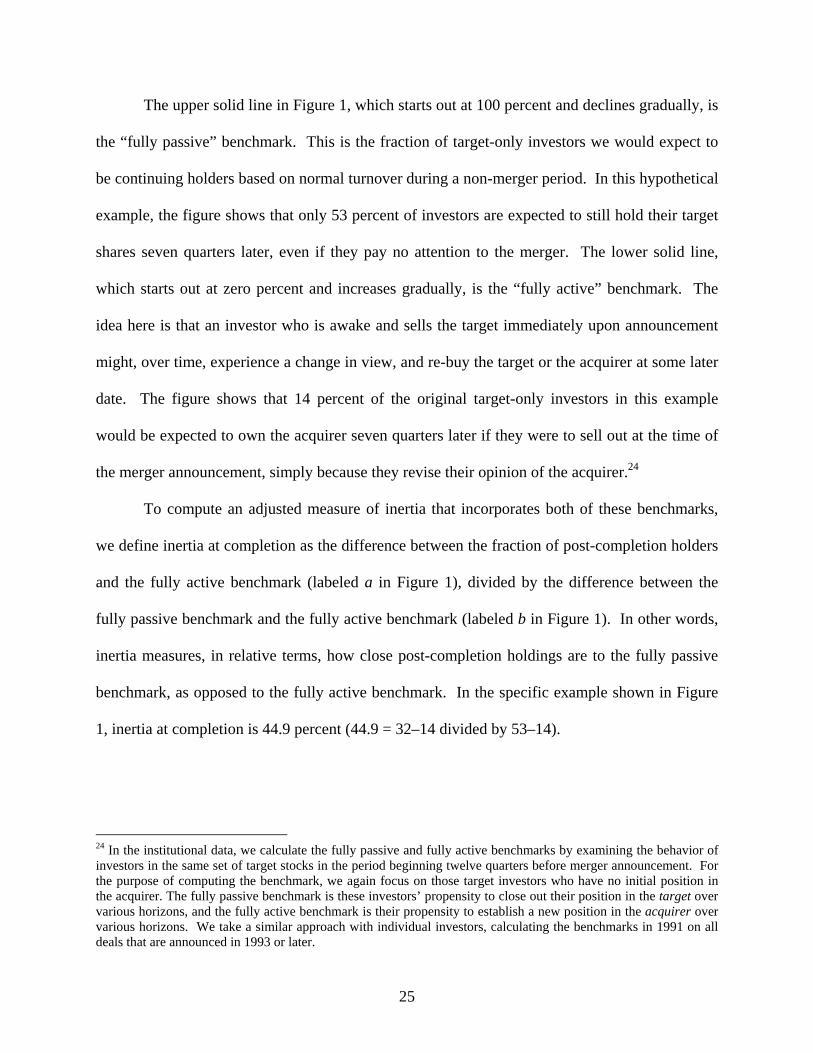
The upper solid line in Figure 1, which starts out at 100 percent and declines gradually, is
the “fully passive” benchmark. This is the fraction of target-only investors we would expect to
be continuing holders based on normal turnover during a non-merger period. In this hypothetical
example, the figure shows that only 53 percent of investors are expected to still hold their target
shares seven quarters later, even if they pay no attention to the merger. The lower solid line,
which starts out at zero percent and increases gradually, is the “fully active” benchmark. The
idea here is that an investor who is awake and sells the target immediately upon announcement
might, over time, experience a change in view, and re-buy the target or the acquirer at some later
date. The figure shows that 14 percent of the original target-only investors in this example
would be expected to own the acquirer seven quarters later if they were to sell out at the time of
the merger announcement, simply because they revise their opinion of the acquirer.24
To compute an adjusted measure of inertia that incorporates both of these benchmarks,
we define inertia at completion as the difference between the fraction of post-completion holders
and the fully active benchmark (labeled a in Figure 1), divided by the difference between the
fully passive benchmark and the fully active benchmark (labeled b in Figure 1). In other words,
inertia measures, in relative terms, how close post-completion holdings are to the fully passive
benchmark, as opposed to the fully active benchmark. In the specific example shown in Figure
1, inertia at completion is 44.9 percent (44.9 = 32–14 divided by 53–14).
24 In the institutional data, we calculate the fully passive and fully active benchmarks by examining the behavior of investors in the same set of target stocks in the period beginning twelve quarters before merger announcement. For the purpose of computing the benchmark, we again focus on those target investors who have no initial position in the acquirer. The fully passive benchmark is these investors’ propensity to close out their position in the target over various horizons, and the fully active benchmark is their propensity to establish a new position in the acquirer over various horizons. We take a similar approach with individual investors, calculating the benchmarks in 1991 on all deals that are announced in 1993 or later.

26
2. Individual investor inertia
Table 2 presents our analysis of inertia among individual investors. This analysis is
restricted to the 305 stock-swap mergers that have at least one target-only investor during the
interval for which we have the brokerage-firm data. For each deal, we begin with all investors,
who, at the month-end prior to the transaction, hold the target but not the acquirer. We then track
the holdings of this set of individuals over the period from announcement to completion. Each
of the first nine columns in the table isolates deals with a fixed length of time to completion (one
month, two months, etc.) and the final column presents aggregated results for all 305 deals.
For example, the first column of Table 2 shows that we have 21 mergers with a time to
completion of one month.25 In these transactions, 11.4 percent of pre-merger individual
investors close out their positions in the target before completion; thus pre-completion holdings
are 88.6 percent (88.6 = 100 – 11.4). Of the remaining 88.6 percent, another 26.3 percent close
out their positions within three months after completion, leaving net post-completion holdings at
65.3 percent (65.3 = 88.6 · (1 – 0.263)) four months after we start tracking the holdings of the
target-only investors in these 21 mergers.
This post-completion figure of 65.3 can then be compared to the fully passive four-month
benchmark of 87.3 percent, which means that, in a typical non-merger-affected, four-month
period for the full set of target stocks, 12.7 percent of individual investors close out their
positions. It can also be compared to the fully active four-month benchmark of 0.3 percent,
which means that in a typical non-merger-affected, four-month period for the full set of target
stocks, only 0.3 percent of individual investors in the target who do not initially have a position
25 Specifically, a merger is considered to have a time to completion of one month if it is announced at any time during one calendar month and completed at any time during the next.
27
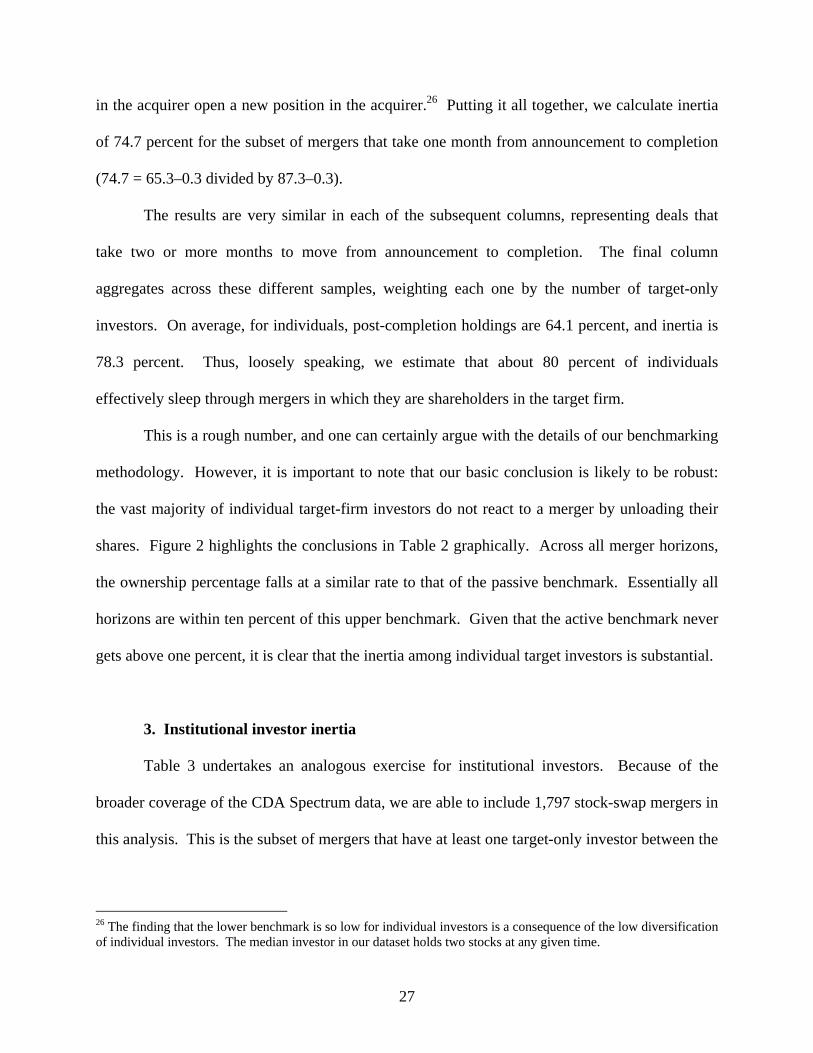
in the acquirer open a new position in the acquirer.26 Putting it all together, we calculate inertia
of 74.7 percent for the subset of mergers that take one month from announcement to completion
(74.7 = 65.3–0.3 divided by 87.3–0.3).
The results are very similar in each of the subsequent columns, representing deals that
take two or more months to move from announcement to completion. The final column
aggregates across these different samples, weighting each one by the number of target-only
investors. On average, for individuals, post-completion holdings are 64.1 percent, and inertia is
78.3 percent. Thus, loosely speaking, we estimate that about 80 percent of individuals
effectively sleep through mergers in which they are shareholders in the target firm.
This is a rough number, and one can certainly argue with the details of our benchmarking
methodology. However, it is important to note that our basic conclusion is likely to be robust:
the vast majority of individual target-firm investors do not react to a merger by unloading their
shares. Figure 2 highlights the conclusions in Table 2 graphically. Across all merger horizons,
the ownership percentage falls at a similar rate to that of the passive benchmark. Essentially all
horizons are within ten percent of this upper benchmark. Given that the active benchmark never
gets above one percent, it is clear that the inertia among individual target investors is substantial.
3. Institutional investor inertia
Table 3 undertakes an analogous exercise for institutional investors. Because of the
broader coverage of the CDA Spectrum data, we are able to include 1,797 stock-swap mergers in
this analysis. This is the subset of mergers that have at least one target-only investor between the
26 The finding that the lower benchmark is so low for individual investors is a consequence of the low diversification of individual investors. The median investor in our dataset holds two stocks at any given time.

28
second quarter of 1980 and the fourth quarter of 2002. Because of the SEC 13-F reporting
requirements, we are forced to look at things on a quarterly, as opposed to monthly basis.
Aggregating across all transactions, we find that 30.0 percent of pre-merger institutional
investors hold on to their positions through completion, substantially less than the corresponding
figure of 64.1 percent for individuals. The baseline rate of turnover is also higher. However, the
first effect dominates and inertia is significantly lower, at 32.3 percent for institutions, as
compared to 78.3 percent for individuals. In contrast to the individual investor turnover in
Figure 2, institutional holdings in Figure 3 decline at significantly faster rate than the passive
benchmark across all merger completion horizons. By the conclusion of most of the mergers, the
institutional holdings lines are all closer to the active benchmark than to the passive one.
Nonetheless, even the institutional holdings are considerably higher than the active benchmark,
suggesting, under the assumptions of the model, that a stock swap is a more attractive way to
raise equity than an SEO regardless of the target’s ownership structure.
Undoubtedly though, institutions are much less passive than individuals. We exploit this
fact in what follows, using the fraction of institutional investors in the target firm as a proxy for
the parameter α in our model. This allows us to undertake direct tests of Propositions 2 and 3.
4. Investor inertia, capital gains taxes, and relative size
Before proceeding to Propositions 2 and 3, we consider whether there is an identifiable
rational component to investor inertia. In particular, capital gains taxes might push investors to
hold on to appreciated stock in a merger and sell stock that has fallen in value. Or, if the target is
large relative to the acquirer, a target investor with no revealed preference for the acquirer may
29
rationally want to hold on to the shares of the merged company, because its value is determined
to a large extent by the prospects of the original target assets.
In Table 4, we present the pre- and post-completion turnover of target-only investors
calculated for subsamples of stock-swap mergers, based on pre-announcement return and relative
size. Panels A and C calculate individual and institutional turnover according to the pre-
announcement return of the target, calculated as the cumulative return over the two-year period
ending one month prior to announcement. Pre-announcement returns appear to be weakly
related to the inertia of individual investors: target investors are somewhat less willing to dump
shares that have appreciated in value by more than 20 percent. However, the differential across
groups is quite modest.27 Even mergers where the target has recently declined in value also
involve considerable inertia; indeed, the inertia statistic of 76.5 percent for this group is close to
the full-sample value of 78.3 percent.
With institutions, there is no evidence to suggest that capital-gains taxes matter for our
measure of inertia. Both raw post-completion holdings and our inertia statistic are at their
highest among those firms with negative pre-announcement returns, the group where tax
considerations would suggest that there should be the least inertia.
Panels B and D split the samples based on the relative size of the target, calculated as the
target’s market capitalization divided by the total market capitalization of the target and acquirer.
Individuals exhibit uniformly high inertia in mergers of widely varying relative size.
Institutions, on the other hand, appear slightly less passive when the target is large, accounting
27 Two effects combine to make the inertia statistic greater among targets with large positive returns. First, post-completion holdings are greater, consistent with a capital-gains tax story. And second, the upper (fully active) benchmark is lower, consistent with the disposition effect (Shefrin and Statman (1985)). Thus, if anything, the modest differences in inertia that we document likely overstate the pure impact of capital-gains-tax considerations.

30
for at least 25 percent of combined firm value. Again, this result goes in the opposite direction
relative to a simple rational story: mergers with large targets represent situations where the
combined firm’s assets ought to appear most attractive to those investors who initially found the
target worth owning, so such deals should be expected to generate more, not less inertia.
C. Acquirer Returns and Volume Around Merger Announcements
Having established the main premise of the model – that investors exhibit inertia – we
now consider its empirical implications. In particular, Tables 5 through 7 present our tests of
Propositions 2 and 3. The first part of Proposition 2 is that target-investor inertia leads to less
negative acquirer announcement returns. A corollary laid out in Proposition 3 is that this effect
works through volume, so that target-investor inertia leads to lower acquirer announcement
volume at the same time. The third part of Proposition 2 is that the impact of target-investor
inertia interacts with the slope of the demand curve for acquirer stock. The steeper is this demand
curve, the greater should be the impact of inertia on acquirer announcement returns.
1. Institutional ownership and acquirer announcement returns
In Panel A of Table 5, we focus on stock-for-stock mergers, and regress acquirer
announcement returns on both target institutional ownership, and non-overlapping target
institutional ownership, as defined above. The first regression uses the raw measure of
institutional ownership as our proxy for investor wakefulness α, and has no other controls, other
than year fixed effects. This univariate specification generates a coefficient of –3.89 on
institutional ownership, which is strongly statistically significant (t-statistic = 4.81), consistent
with Proposition 2. In economic terms, this coefficient implies that a two-standard deviation
31
increase in target institutional ownership reduces the acquirer’s announcement return by 1.82
percentage points, taking it from its unconditional mean value of –2.19 percent down to –4.01
percent.
The next regression again uses the raw measure of institutional ownership, but adds a
variety of controls described in Table 1: acquirer and target market capitalization (both in logs);
acquirer and target leverage; acquirer and target market-to-book; the target announcement return;
and an indicator variable equal to one if the two firms are in the same industry. Many of these
(the size, leverage, market-to-book, and relatedness variables) are commonly used in regressions
to explain acquirer announcement returns.28 We add the target announcement return to the list
because one potential competing explanation for the effect of institutional ownership has to do
with bargaining power. Perhaps institutional blockholders in the target are able to extract a better
price from the acquiring firm, leading to lower acquirer announcement returns; if so, the target
announcement return should control for this effect. However, as it turns out, this variable has a
significant, but positive, relationship with acquirer returns.29
In any case, adding the full battery of controls has only a modest impact on the
coefficient on institutional ownership: it goes from –3.89 to –2.65, and remains statistically
significant, with a t-statistic of 2.23. In this specification, a two-standard-deviation increase in
target institutional ownership reduces the acquirer return by 1.24 percentage points.
The next two columns of Panel A are analogous to the previous two, except that we
replace target institutional ownership with non-overlapping target institutional ownership. This 28 See, e.g., Lang, Stulz, and Walkling (1989) and Morck, Shleifer, and Vishny (1990b). Other typical merger-related controls are not included because of the nature of our sample. The acquirer attitude (see Schwert (2000) for a discussion of hostility) is always friendly in our sample of stock swaps, and by definition the form of payment (see Andrade, Mitchell, and Stafford (2001)) is stock and the accounting treatment is pooling (see Martinez-Jerez (2004)). 29 This is unlikely to be a causal relationship. More plausibly, some mergers are just better than others in which case both acquirer and target returns are high.

32
latter variable is arguably a more precise measure of the wakefulness parameter α in our model,
because we expect an alert target shareholder to be most likely to sell shares in the acquirer if he
did not own any such shares prior to the merger announcement, and hence has not demonstrated
a high valuation for acquirer assets. Interestingly, this redefinition of target institutional
ownership leads to coefficient estimates that are markedly higher in absolute value: they are now
–8.18 and –5.52 in the no-controls and full-controls specifications, respectively. We view this
pattern as particularly supportive of our model, because it is hard to think of alternative
hypotheses which would suggest a similar outcome.
Panel B of Table 5 is an exact replica of Panel A, except that the sample includes cash
mergers instead of stock mergers. This is effectively a placebo check: according to our theory,
target institutional ownership should be irrelevant in cash deals. In contrast, some competing
explanations for the results in Panel A suggest a similar pattern across stock and cash mergers.
For example, if high institutional ownership of the target leads to low bidder returns through
some sort of enhanced-bargaining effect, this should work similarly for both stock and cash
deals. However, as can be seen in Panel B, there is no discernible impact of target institutional
ownership in the cash-merger sample: the coefficient of interest is never close to statistically
significant, and indeed is actually positive in three out of four cases. Thus cash mergers seem to
be fundamentally different from stock mergers on this dimension, consistent with our model.
2. Institutional ownership and acquirer announcement volume
The model makes the ancillary prediction that in stock deals, the impact of shareholder
inertia on acquirer announcement returns works through trading volume, as in Proposition 3. In
particular, target shareholders who are awake sell out on announcement. Merger arbitrageurs buy
33
these shares and short the acquirer, closing their positions when the merger is successfully
completed.30 Examining volume also serves as yet another check on alternative hypotheses
linking target institutional ownership and acquirer returns. Again, if target institutional
ownership affects acquirer returns through a mechanism like bargaining power, we would not
expect it to also influence volume simultaneously.
Table 6 repeats the analysis in Table 5, replacing acquirer returns as the dependent
variable with the average daily turnover in the acquirer over the five-day window surrounding
the merger announcement. We keep all the same right-hand-side variables as before, and also
add “normal” trading volume – defined as the average daily turnover in the acquirer over the 60-
day period starting 90 days before the announcement – as an additional control.
Across all four specifications in the stock-merger sample in Panel A, the results are
uniformly supportive of Proposition 3. The coefficients on raw target institutional ownership are
0.64 and 1.14 in the specifications with and without controls, respectively, and are strongly
statistically significant in both cases. When we use non-overlapping target institutional
ownership instead, the coefficients again rise in absolute value, to 0.85 and 1.71 respectively.
And as before, the implied economic effects are substantial: a two-standard deviation increase in
target institutional ownership increases the average acquirer’s daily turnover during the
announcement period from a mean of 0.99 percent to between 1.26 and 1.49 percent, or by
between 25 and 50 percent. In Panel B, we see that for cash mergers, target institutional
ownership has little apparent effect on turnover, just as it has no effect on returns: the
coefficients are in all cases an order of magnitude smaller than in Panel A, and not statistically
significant. Again, this is just what one would expect based on our model. 30 Empirically, this is similar in spirit to Mitchell, Pulvino, and Stafford (2004), who look at situations where merger arbitrageurs are likely to initiate short positions in the acquiring firm. Here, target institutional ownership is the proxy for the selling pressure that pushes down the price of the acquirer.
34
3. Demand curve interactions
There are two ingredients to our model: inertia among target shareholders, and a
downward-sloping demand curve for acquirer shares. Thus, as formulated in the third part of
Proposition 2, we expect that our results for target institutional ownership will be strongest
among acquirer firms with steeply-sloped demand curves. To operationalize this hypothesis, we
employ two different proxies for the slope of the demand curve. The first aims to measure the
difference of opinion among investors with respect to acquirer value, in the spirit of the
parameter H in the model. Specifically, we follow Moeller, Schlingemann and Stulz (2004), and
calculate the standard deviation of all outstanding analysts’ forecasts for long-run growth.
The second proxy is the non-industry idiosyncratic risk of the acquirer. We compute this
as the standard deviation of the residuals from a regression of acquirer excess returns on the
Fama-French factors (RM, SMB, HML), and the matched 48-industry portfolio return. The
premise here is as follows. In the presence of both differences of opinion and risk aversion, an
increase in idiosyncratic risk makes the demand curve steeper, because it reduces the size of the
position that any one investor with a given valuation is willing to take on. Although this effect is
absent from our model (which, for simplicity, uses wealth constraints instead of risk aversion to
generate the shape of the demand curve) it is formalized in, e.g., Chen, Hong, and Stein (2002).31
Moreover, Wurgler and Zhuravskaya (2002) provide empirical validation for the idea of using
idiosyncratic risk as a proxy for demand-curve slope, showing that the impact of S&P 500 index
inclusion on stock prices is increasing in the idiosyncratic risk of the included firm.
31 In particular, see equation 4 of Chen, Hong, and Stein (2002). This equation demonstrates that the sensitivity of price to supply shocks is larger in absolute value when the risk tolerance of the heterogeneous buyers is small. An increase in idiosyncratic risk has an analogous effect. See also Novy-Marx (2004) for more on the general argument that risk aversion makes demand curves slope downward, and hence creates the appearance of illiquidity.

35
Table 7 presents regressions of acquirer announcement returns (in stock deals only) on
target institutional ownership, our measures of the slope of the demand curve facing the acquirer,
and the product of the two variables. In Panel A, we use the raw measure of institutional
ownership; in Panel B we use non-overlapping institutional ownership. In either case, our theory
suggests that the interaction term should attract a negative coefficient. The first two regressions
in each panel employ dispersion in analyst forecasts as the proxy for the steepness of the
acquirer’s demand curve, while the second two use idiosyncratic risk.
The results in Table 7 provide additional corroboration of the model. The interaction of
the acquirer demand-curve proxies and target institutional ownership is negative in all eight
specifications shown in the table, and significant (at the ten percent level or better) in the four
specifications in Panel A that use raw institutional ownership. In Panel B, with non-overlapping
institutional ownership, the interaction coefficients are generally as big or bigger, but the
standard errors are larger, perhaps because non-overlapping ownership has less cross-sectional
variation.
Moreover, each of the eight specifications implies economically meaningful interaction
effects. The demand-curve proxies are standardized to have zero mean and unit variance. So the
fact that the coefficients on target institutional ownership and on the interaction term are of
roughly the same magnitude in all specifications means that a one-standard-deviation increase in
the steepness of the demand curve roughly doubles the effect of institutional ownership on
acquirer returns.
To sum up, higher target institutional ownership leads to more negative announcement
effects for the acquirer. Our additional tests help to pin down the underlying mechanism.
Institutional holders of the target exhibit less inertia and so are more likely to sell their shares on
36
the announcement of a merger. This leads to more selling pressure in the acquirer and a negative
announcement effect that is most pronounced for those acquiring firms with steeply-sloped
demand curves.
IV. Conclusion
Most people are reluctant to make active decisions. Instead, they tend to follow the path
of least resistance, accepting defaults. This has important implications for corporate finance.
Raising equity in an SEO requires investors to actively buy the shares of the issuing firm. The
default option is to buy no shares. By contrast, raising equity in a stock-swap merger works well
to the extent that target investors do not actively opt out of holding the shares of the acquiring
firm. The default option is to accept the shares of the acquiring firm as consideration for shares
in target. We find that this sort of inertia is a pervasive aspect of investor behavior. Individuals
accept the default roughly 80 percent of the time, and institutions accept it a third of the time.
In a classical stock market with horizontal demand curves, inertial behavior of this kind
would be irrelevant for prices. However, combining inertia with a downward-sloping demand
curve makes the price impact of a stock-swap merger relatively small, and the terms for existing
shareholders better as a result. We test this idea within the sample of stock-swap mergers, using
institutional ownership to proxy for low investor inertia. Consistent with the theory, acquirer
announcement returns are more negative when inertia is low. The broader conclusion for
corporate finance is that, when firms face downward-sloping demand curves – as numerous
studies suggest – inertia makes an SEO less attractive than a stock-swap merger as a way to
support a strategy of rapid, equity-financed growth.

37
V. References
Akerlof, George A., 1991, Procrastination and Obedience, American Economic Review 81: 1-19.
Andrade, Gregor, Mark Mitchell and Erik Stafford, 2001, New Evidence and Perspectives on Mergers, Journal of Economic Perspectives 15: 103-120.
Bagwell, Laurie, 1992, Dutch Auction Repurchases: An Analysis of Shareholder Heterogeneity, Journal of Finance 47: 71-106.
Baker, Malcolm, Richard Ruback, and Jeffrey Wurgler, 2004, Behavioral Corporate Finance: A Survey, forthcoming in Espen Eckbo (ed.), Handbook in Corporate Finance: Empirical Corporate Finance (North Holland).
Barberis, Nicholas, Andrei Shleifer and Robert W. Vishny 1998. A Model of Investor Sentiment, Journal of Financial Economics 49: 307-343.
Bergman, Nittai and Dirk Jenter, 2003, Employee Sentiment and Stock Option Compensation, MIT Working Paper.
Blanchard, Olivier, Chanyong Rhee, and Lawrence Summers, 1990, The Stock Market, Profit, and Investment, Quarterly Journal of Economics 108: 115-136.
Chen, Joseph, Harrison Hong and Jeremy C. Stein, 2002, Breadth of Ownership and Stock Returns, Journal of Financial Economics 66: 171-205.
Choi, James J., David Laibson, Brigitte Madrian and Andrew Metrick, 2002, Defined Contribution Pensions: Plan Rules, Participant Choices, and the Path of Least Resistance, in James Poterba (ed.), Tax Policy and the Economy 16 (MIT Press): 67-114.
Choi, James J., David Laibson, Brigitte Madrian and Andrew Metrick, 2003, For Better or For Worse: Default Effects and 401(k) Savings Behavior, forthcoming in David Wise (ed.), Perspectives in the Economics of Aging (University of Chicago Press).
Constantinides, George M., 1986, Capital Market Equilibrium With Transactions Costs, Journal of Political Economy 94: 842-862.
Daniel, Kent D., David Hirshleifer and Avanidhar Subrahmanyam, 1998, Investor Psychology and Security Market Under- and Over-Reactions, Journal of Finance 53: 1839-1885.
Fama, Eugene F. and Kenneth R. French, 1997, Industry Costs of Equity, Journal of Financial Economics 43: 153-193.
Fama, Eugene F. and Kenneth R. French, 2004, Financing Decisions: Who Issues Stock? Journal of Financial Economics, forthcoming.
Friedman, John, 2004, Stock Market Driven Acquisitions: Theory and Evidence, Harvard Working Paper.
Fischer, Stanley, and Robert C. Merton, 1984, Macroeconomics and Finance: The Role of the Stock Market, Carnegie-Rochester Conference Series on Public Policy 21: 57-108.
Greenwood, Robin, 2004, Short- and Long-term Demand Curves for Stocks: Theory and Evidence on the Dynamics of Arbitrage, Journal of Financial Economics, forthcoming.

38
Harris, Lawrence and Eitan Gurel, 1986, Price and Volume Effects Associated with Changes in the S&P 500 List: New Evidence for the Existence of Price Pressures, Journal of Finance 41: 815-82.
Hodrick, Laurie, 1999, Does Stock Price Elasticity Affect Corporate Financial Decisions?, Journal of Financial Economics 52: 225-256.
Hong, Harrison, José Scheinkman and Wei Xiong, 2004, Asset Float and Speculative Bubbles, Princeton Working Paper.
Hong, Harrison and Jeremy C. Stein, 1999, A Unified Theory of Underreaction, Momentum Trading and Overreaction in Asset Markets, Journal of Finance 54: 2143-2184.
Kahneman, Daniel, Jack L. Knetsch and Richard H. Thaler, 1990, Experimental Tests of the Endowment Effect and the Coase Theorem, Journal of Political Economy 98:1325-1348.
Kahneman, Daniel., Jack L. Knetsch and Richard H. Thaler, 1991, The Endowment Effect, Loss Aversion, and Status Quo Bias, Journal of Economic Perspectives 5: 193-206.
Kahneman, Daniel and Amos Tversky, 1979, Prospect Theory: An Analysis of Decision under Risk, Econometrica 47: 263-91.
Kaul, Aditya, Vikas Mehrotra and Randall Morck, 2000, Demand Curves for Stocks Do Slope Down: New Evidence From an Index Weights Adjustment, Journal of Finance 55: 893-912.
Lang, Larry, René Stulz and Ralph Walkling, 1989, Managerial Performance, Tobin's q, and the Gains from Successful Tender Offers, Journal of Financial Economics 24: 137-154.
Madrian, Brigitte and Dennis Shea, 2001, The Power of Suggestion: Inertia in 401(k) Participation and Savings Behavior, Quarterly Journal of Economics 116: 1149-87.
Malmendier, Ulrike and Geoffrey Tate, 2003, Who Makes Acquisitions? CEO Overconfidence and the Market’s Reaction, Stanford Working Paper.
Matvos, Gregor and Michael Ostrovsky 2004, Cross-Ownership and Returns to Shareholders in Mergers, Harvard Working Paper.
Martinez-Jerez, Francisco de Asis, 2004, Shareholder Value Impact of Accounting Choice in Business Combinations: The Role of Corporate Governance, Harvard Working Paper.
Miller, Edward, 1977, Risk, Uncertainty and Divergence of Opinion, Journal of Finance 32: 1151-1168.
Mitchell, Mark, Todd Pulvino and Erik Stafford, 2004, Price Pressure Around Mergers, Journal of Finance 59: 31-63.
Moeller, Sara B., Frederik P. Schlingemann and René Stulz, 2004, Do Acquirers With More Uncertain Growth Prospects Gain Less From Acquisitions?, Ohio State Working Paper.
Morck, Randall, Andrei Shleifer, and Robert W. Vishny, 1990a, The Stock Market and Investment: Is the Market a Sideshow?, Brookings Papers on Economic Activity 2: 157-215.
Morck, Randall, Andrei Shleifer and Robert W. Vishny, 1990b, Do Managerial Objectives Drive Bad Acquisitions? Journal of Finance 45: 31-48.

39
Myers, Stewart C. and Nicholas S. Majluf, 1984, Corporate Financing and Investment Decisions When Firms Have Information That Investors Do Not Have, Journal of Financial Economics 13: 187-221.
Novy-Marx, Robert, 2004, On the Excess Returns to Illiquidity, University of Chicago Working Paper.
Odean, Terrance, 1998, Are Investors Reluctant to Realize their Losses? Journal of Finance 53: 1775-1795.
O'Donoghue, Ted and Matthew Rabin, 1999, Procrastination in Preparing for Retirement, in Henry Aaron (ed.), Behavioral Dimensions of Retirement Economics (The Brookings Institution): 125-156.
Oyer, Paul, 2004, Why Do Firms Use Incentives That Have No Incentive Effects? Journal of Finance 59: 1619-1649.
Roll, Richard, 1986, The Hubris Hypothesis of Corporate Takeovers, Journal of Business 59: 197-216.
Scheinkman, José and Wei Xiong, 2003, Overconfidence and Speculative Bubbles, Journal of Political Economy 111: 1183-1219.
Scherbina, Anna, 2002, Analyst Disagreement, Forecast Bias and Stock Returns, Harvard Working Paper.
Schwert, G. William, 2000, Hostility in Takeovers: In the Eyes of the Beholder? Journal of Finance 55: 2599-2640.
Shefrin, Hersh and Meir Statman, 1985, The Disposition to Sell Winners Too Early and Ride Losers Too Long: Theory and Evidence, Journal of Finance 40: 777-90.
Shleifer, Andrei, 1986, Do Demand Curves for Stocks Slope Down? Journal of Finance 41: 579-590.
Shleifer, Andrei and Robert W. Vishny, 2003, Stock Market Driven Acquisitions, Journal of Financial Economics 70: 295-311.
Stein, Jeremy C., 1996, Rational Capital Budgeting in an Irrational World, Journal of Business 69: 429-455.
Thaler, Richard H., 1980, Toward a Positive Theory of Consumer Choice, Journal of Economic Behavior and Organization 1: 39-60.
Wurgler, Jeffrey and Ekaterina Zhuravskaya, 2002, Does Arbitrage Flatten Demand Curves for Stocks? Journal of Business 75: 583-608.
Zhang, Donghang, 2004, Why Do IPO Underwriters Allocate Extra Shares When They Expect to Buy Them Back? Journal of Financial and Quantitative Analysis, forthcoming.
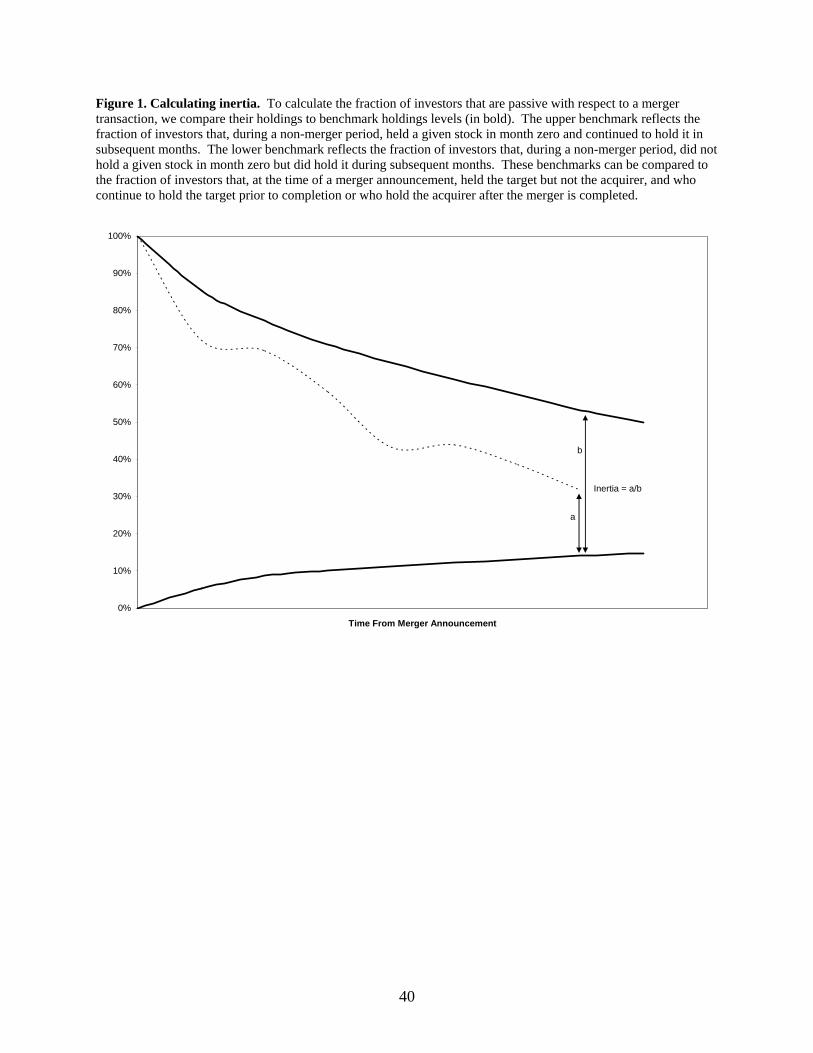
40
Figure 1. Calculating inertia. To calculate the fraction of investors that are passive with respect to a merger transaction, we compare their holdings to benchmark holdings levels (in bold). The upper benchmark reflects the fraction of investors that, during a non-merger period, held a given stock in month zero and continued to hold it in subsequent months. The lower benchmark reflects the fraction of investors that, during a non-merger period, did not hold a given stock in month zero but did hold it during subsequent months. These benchmarks can be compared to the fraction of investors that, at the time of a merger announcement, held the target but not the acquirer, and who continue to hold the target prior to completion or who hold the acquirer after the merger is completed.
0%
10%
20%
30%
40%
50%
60%
70%
80%
90%
100%
Time From Merger Announcement
a
b
Inertia = a/b

41
Figure 2. Turnover around merger announcements: Individual holdings. We identify situations in a database of individual investor holdings at a large discount broker from 1991 to 1996 where the investor has a position in a target but not its acquirer in the month ending prior to the announcement of a stock-swap merger in the Wall Street Journal. The figure includes 305 successful stock-swap mergers that are completed within nine months involving a public acquirer and with at least one matched individual investor with a position in the target but not the acquirer. Each dashed line tracks the percentage of the original individual investors that still has a position in the target at each month end prior to completion and that has a position in the acquirer two full months following the completion of the stock swap. We split the sample, plotting one line for each number of months elapsed between the announcement and completion of a merger. The solid lines benchmark the individual investor holdings. The upper benchmark holdings reflects the corresponding turnover for situations in the individual investor database where an individual owns shares in a target but not its acquirer in 1991 for all deals that are announced in 1993 or later. The lower benchmark starts with the same situations and tracks the purchase of the acquirer shares.
0%
10%
20%
30%
40%
50%
60%
70%
80%
90%
100%
0 1 2 3 4 5 6 7 8 9 10
Months From Merger Announcement
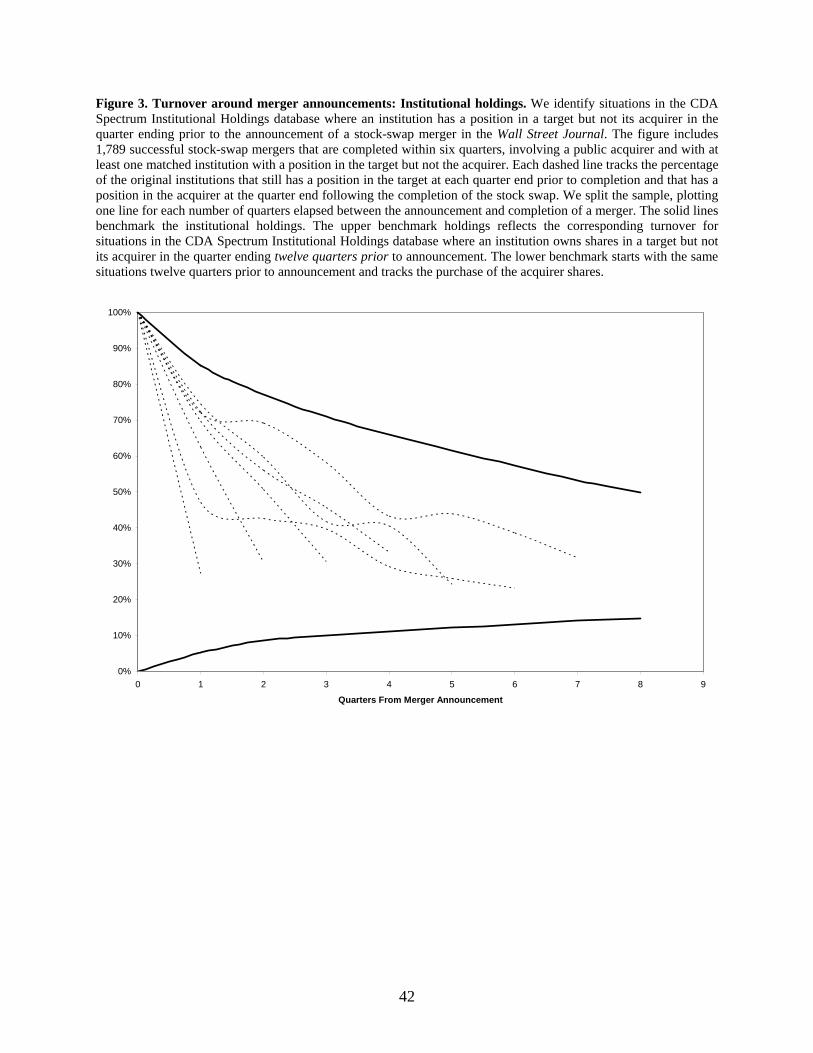
42
Figure 3. Turnover around merger announcements: Institutional holdings. We identify situations in the CDA Spectrum Institutional Holdings database where an institution has a position in a target but not its acquirer in the quarter ending prior to the announcement of a stock-swap merger in the Wall Street Journal. The figure includes 1,789 successful stock-swap mergers that are completed within six quarters, involving a public acquirer and with at least one matched institution with a position in the target but not the acquirer. Each dashed line tracks the percentage of the original institutions that still has a position in the target at each quarter end prior to completion and that has a position in the acquirer at the quarter end following the completion of the stock swap. We split the sample, plotting one line for each number of quarters elapsed between the announcement and completion of a merger. The solid lines benchmark the institutional holdings. The upper benchmark holdings reflects the corresponding turnover for situations in the CDA Spectrum Institutional Holdings database where an institution owns shares in a target but not its acquirer in the quarter ending twelve quarters prior to announcement. The lower benchmark starts with the same situations twelve quarters prior to announcement and tracks the purchase of the acquirer shares.
0%
10%
20%
30%
40%
50%
60%
70%
80%
90%
100%
0 1 2 3 4 5 6 7 8 9
Quarters From Merger Announcement

43
Table 1. Merger summary statistics. The sample includes successful stock-swap and cash mergers with CRSP targets announced between 1980 Q2 and 2000 Q4, involving a CRSP acquirer with a matched announcement return. Institutional ownership is summarized in Panel A. Target institutional ownership (IO) is totaled from the CDA Spectrum Institutional Holdings database for the quarter prior to the announcement of the merger and expressed as a percentage of shares outstanding. Non-overlapping target IO includes only those institutions that own no shares of the acquiring firm. This is expressed as a percentage of both shares outstanding and total target IO. The deal characteristics in Panel B are from CRSP and Compustat. Cash deal is equal to one when the consideration is cash and zero when the consideration is stock. Acquirer and target size are equal to price times shares outstanding from CRSP. Relative size is equal to target size expressed as a percentage of total target and acquirer size. Acquirer and target leverage are equal to interest bearing debt (9+34) from Compustat expressed as a percentage of book assets. Acquirer and target market to book are equal to book assets (6) minus book equity (216-130+35) from Compustat plus price times shares outstanding from CRSP all divided by book assets. Same industry is an indicator variable equal to one if the target and the acquirer are included in the same Fama and French 48-industry grouping. The stock market data in Panel C are from CRSP. The acquirer and target announcement returns are the return in excess of the value-weighted market over a five-day window surrounding the announcement of the merger. The acquirer announcement volume is the average daily volume over a five-day window surrounding the announcement of the merger expressed as a percentage of shares outstanding. Normal volume is the average daily volume over a 60-day window starting 90 trading days before the announcement of the merger and expressed as a percentage of shares outstanding. The acquirer demand curve proxies in Panel D are from CRSP and IBES. The dispersion in analyst forecasts is the standard deviation of all outstanding long-term growth forecasts. Idiosyncratic risk is the standard deviation of the residuals from a regression of acquirer excess returns on the Fama-French Benchmark Factors (Rm, SMB, HML), and the matched 48 industry portfolio return. All factor and portfolio returns were obtained from Ken French’s website. All variables are Winsorized at the first and 99th percentiles. Summary Statistics, 1980Q2-2000Q4
N Mean Median SD Min Max Panel A. Institutional Ownership Target IO (% Total) 3,054 25.91 19.98 22.78 0.00 85.19 Non-Overlapping Target IO (% Total) 3,054 12.88 8.63 13.61 0.00 61.30 Non-Overlapping Target IO (% IO) 2,829 51.01 50.56 30.86 0.00 100.00 Panel B. Deal Characteristics Cash Deal 3,054 0.38 0.00 0.49 0.00 1.00 Acquirer Size ($M) 3,054 7,126 1,083 20,800 5 146,000 Target Size ($M) 3,054 486 103 1,194 0 7,680 Relative Size (%) 3,051 17.64 11.23 18.22 0.00 85.77 Acquirer Leverage (%) 2,860 21.87 19.23 16.66 0.00 78.47 Target Leverage (%) 2,537 21.65 17.15 20.31 0.00 84.93 Acquirer M/B 2,879 2.41 1.29 3.25 0.63 22.04 Target M/B 2,566 2.01 1.30 2.05 0.45 14.01 Same Industry 3,054 0.57 1.00 0.50 0.00 1.00 Panel C. Stock Market Data Acquirer Announcement Return (%) 3,054 -1.15 -0.91 7.27 -24.09 20.82 Target Announcement Return (%) 3,054 18.65 14.71 21.80 -24.50 97.37 Acquirer Announcement Volume (%) 3,020 0.80 0.38 1.14 0.01 6.65 Normal Volume (%) 2,984 0.49 0.29 0.60 0.01 3.53 Panel D. Acquirer Demand Curve Dispersion in Analyst Forecasts (%) 1,628 3.26 2.50 3.06 0.00 60.90 Idiosyncratic Risk (%) 2,900 8.05 6.71 4.66 2.54 27.59

44
Table 2. Turnover around merger announcements: Individual holdings. We identify situations in a database of individual investor holdings at a large discount broker from 1991 to 1996 where the investor has a position in a target but not its acquirer in the month ending prior to the announcement of a stock-swap merger in the Wall Street Journal. The first row shows the number of successful stock-swap mergers, involving a public acquirer and with at least one matched individual investor with a position in the target but not the acquirer. We split the sample according to the number of months elapsed between the announcement and completion of a merger. The following ten rows show percentage turnover in this set of target positions over the nine months following the merger announcement and in the three-month period that the merger is successfully completed. Turnover in the quarter that the merger is completed occurs when one of the original investors still has a position in the target in the month prior to completion but does not have a position in the acquirer three months later. The next two rows compound the pre-completion and completion turnover to compute the percentage of the original investors that still has a position in the target at the month end prior to completion and that has a position in the acquirer three months later. The last two rows benchmark the post-completion holdings. The upper benchmark holdings reflects the corresponding turnover for situations in the individual investor database where an individual owns shares in a target but not its acquirer in 1991 for all deals that are announced in 1993 or later. The lower benchmark starts with the same situations and tracks the purchase of the acquirer shares. The final row reports the difference between post-completion holdings and the lower benchmark expressed as a percentage of the difference between the upper and lower benchmarks.
Total Months to Completion
1 2 3 4 5 6 7 8 9+ All Number of Successful Stock Swaps 21 76 56 44 39 32 12 8 17 305 Announcement+1 Turnover (%) 11.4 16.4 11.0 8.6 9.6 7.4 20.4 10.0 6.5 12.1 Announcement+2 Turnover (%) 7.2 5.5 5.7 7.0 6.4 6.0 1.2 5.0 6.1 Announcement+3 Turnover (%) 4.0 6.3 3.8 5.4 4.1 6.3 1.4 4.4 Announcement+4 Turnover (%) 6.4 5.8 2.3 3.6 4.0 5.2 5.0 Announcement+5 Turnover (%) 1.7 3.2 2.1 2.8 4.4 2.9 Announcement+6 Turnover (%) 3.0 3.2 2.9 7.7 4.8 Announcement+7 Turnover (%) 3.3 4.4 10.1 6.5 Announcement+8 Turnover (%) 1.5 3.7 3.4 Announcement+9 Turnover (%) 3.1 3.1 Completion Turnover (%) 26.3 21.1 11.3 11.5 7.7 5.6 17.1 4.7 6.9 14.0 Pre-Completion Holdings (%) 88.6 77.6 80.8 75.6 74.9 75.2 63.4 71.1 56.4 74.7 Post-Completion Holdings (%) 65.3 61.2 71.6 66.9 69.1 70.9 52.6 67.8 57.2 64.1 Upper Benchmark Holdings (%) 87.3 85.7 83.9 82.3 80.9 79.7 78.4 76.4 70.7 81.7 Lower Benchmark Holdings (%) 0.3 0.3 0.4 0.4 0.4 0.5 0.5 0.5 0.6 0.6 Inertia (%) 74.7 71.3 85.3 81.2 85.3 88.9 66.9 88.7 80.7 78.3

45
Table 3. Turnover around merger announcements: Institutional holdings. We identify situations in the CDA Spectrum Institutional Holdings database where an institution has a position in a target but not its acquirer in the quarter ending prior to the announcement of a stock-swap merger in the Wall Street Journal. The first row shows the number of successful stock-swap mergers, involving a public acquirer and with at least one matched institution with a position in the target but not the acquirer. We split the sample according to the number of quarters elapsed between the announcement and completion of a merger. The following five rows show percentage turnover in this set of target positions over the four quarters following the merger announcement and in the quarter that the merger is successfully completed. Turnover in the quarter that the merger is completed occurs when one of the original institutions still has a position in the target in the quarter prior to completion but does not have a position in the acquirer in the quarter after completion. The next two rows compound the pre-completion and completion turnover to compute the percentage of the original institutions that still has a position in the target at the quarter end prior to completion and that has a position in the acquirer at the quarter end following the completion of the stock swap. The last two rows benchmark the post-completion holdings. The upper benchmark holdings reflects the corresponding turnover for situations in the CDA Spectrum Institutional Holdings database where an institution owns shares in a target but not its acquirer in the quarter ending twelve quarters prior to announcement. The lower benchmark starts with the same situations twelve quarters prior to announcement and tracks the purchase of the acquirer shares. The final row reports the difference between post-completion holdings and the lower benchmark expressed as a percentage of the difference between the upper and lower benchmarks.
Total Quarters to Completion
0 1 2 3 4+ All Number of Successful Stock Swaps 85 862 609 166 75 1,797 Announcement+1 Turnover (%) 37.5 30.3 27.8 36.0 34.4 Announcement+2 Turnover (%) 27.3 22.5 8.3 23.8 Announcement+3 Turnover (%) 18.5 12.9 17.5 Announcement+4 Turnover (%) 11.0 16.7 Completion Turnover (%) 72.7 51.3 39.6 27.2 26.6 43.6 Pre-Completion Holdings (%) 62.5 50.7 45.6 33.8 55.0 Post-Completion Holdings (%) 27.3 30.4 30.6 33.2 23.4 30.0 Upper Benchmark Holdings (%) 85.3 77.2 70.9 66.0 56.9 73.1 Lower Benchmark Holdings (%) 5.2 8.6 10.0 11.1 13.3 9.5 Inertia (%) 27.6 31.8 33.9 40.3 23.2 32.3

46
Table 4. Turnover around merger announcements: Subsamples based on deal characteristics. We repeat the analysis in Tables 2 and 3 for subsamples of stock swaps. See Tables 2 and 3 for details. In the first and the third panels, we split the successful stock-swap mergers, with at least one matched target position, into three groups according the return in the two years ending one month prior to the announcement of the merger in the Wall Street Journal. In the second and fourth panels, we split the sample according to the relative size of the target and acquiring firms. Relative size is equal to the target market capitalization (price times shares outstanding from CRSP) expressed as a percentage of the total market capitalization of the target and the acquirer.
Pre-Completion Post-Completion
Holdings Holdings Upper Lower Inertia Panel A. Individuals, Target 2-Year Pre-Announcement Return <0% 75.2 61.2 79.9 0.2 76.5 0-20% 83.3 71.3 78.9 0.3 90.3 >20% 74.9 65.6 70.1 0.4 93.5 Panel B. Individuals, Relative Size <5% 77.1 62.7 74.8 0.3 83.8 5-25% 73.7 63.7 77.9 0.3 81.7 >25% 74.1 64.5 76.8 0.2 83.9 Panel C. Institutions, Target 2-Year Pre-Announcement Return <0% 53.5 33.1 73.4 9.4 37.0 0-20% 45.3 24.2 69.0 15.3 16.5 >20% 57.0 30.6 74.0 9.2 33.0 Panel D. Institutions, Relative Size <5% 54.6 31.6 74.5 9.2 34.4 5-25% 50.8 33.8 75.3 13.1 33.3 >25% 58.2 27.8 73.4 9.4 28.8
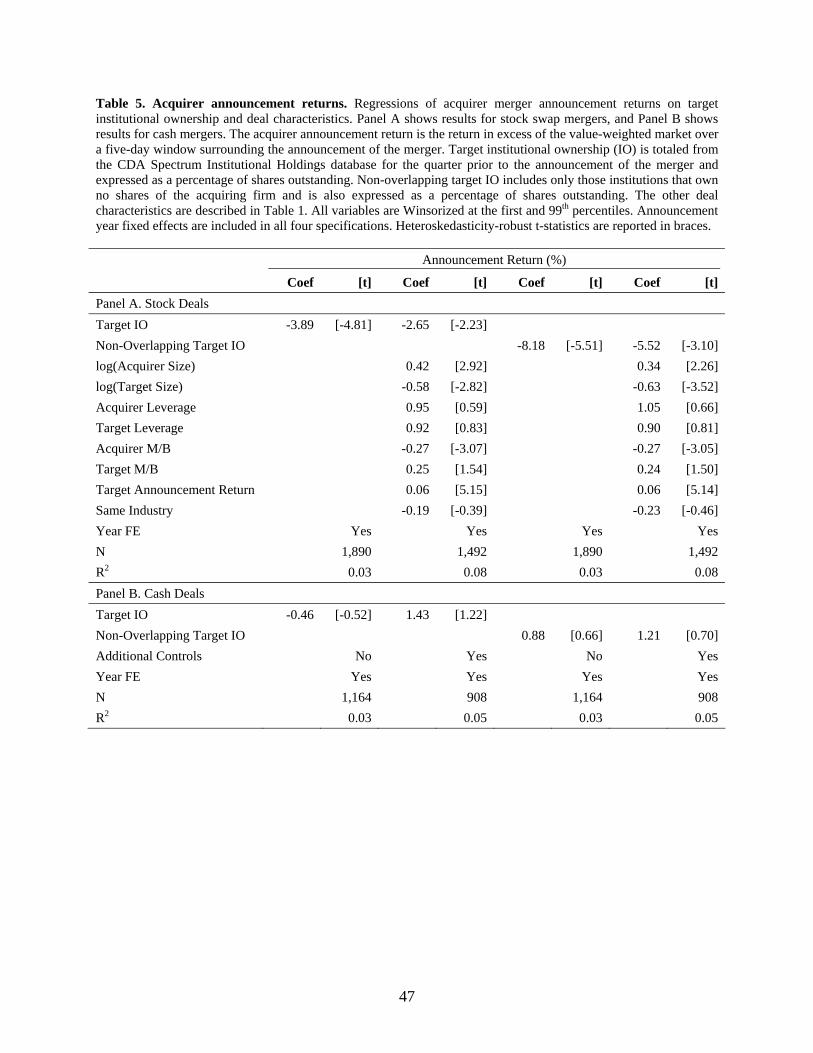
47
Table 5. Acquirer announcement returns. Regressions of acquirer merger announcement returns on target institutional ownership and deal characteristics. Panel A shows results for stock swap mergers, and Panel B shows results for cash mergers. The acquirer announcement return is the return in excess of the value-weighted market over a five-day window surrounding the announcement of the merger. Target institutional ownership (IO) is totaled from the CDA Spectrum Institutional Holdings database for the quarter prior to the announcement of the merger and expressed as a percentage of shares outstanding. Non-overlapping target IO includes only those institutions that own no shares of the acquiring firm and is also expressed as a percentage of shares outstanding. The other deal characteristics are described in Table 1. All variables are Winsorized at the first and 99th percentiles. Announcement year fixed effects are included in all four specifications. Heteroskedasticity-robust t-statistics are reported in braces. Announcement Return (%)
Coef [t] Coef [t] Coef [t] Coef [t] Panel A. Stock Deals Target IO -3.89 [-4.81] -2.65 [-2.23] Non-Overlapping Target IO -8.18 [-5.51] -5.52 [-3.10] log(Acquirer Size) 0.42 [2.92] 0.34 [2.26] log(Target Size) -0.58 [-2.82] -0.63 [-3.52] Acquirer Leverage 0.95 [0.59] 1.05 [0.66] Target Leverage 0.92 [0.83] 0.90 [0.81] Acquirer M/B -0.27 [-3.07] -0.27 [-3.05] Target M/B 0.25 [1.54] 0.24 [1.50] Target Announcement Return 0.06 [5.15] 0.06 [5.14] Same Industry -0.19 [-0.39] -0.23 [-0.46] Year FE Yes Yes Yes Yes N 1,890 1,492 1,890 1,492 R2 0.03 0.08 0.03 0.08 Panel B. Cash Deals Target IO -0.46 [-0.52] 1.43 [1.22] Non-Overlapping Target IO 0.88 [0.66] 1.21 [0.70] Additional Controls No Yes No Yes Year FE Yes Yes Yes Yes N 1,164 908 1,164 908 R2 0.03 0.05 0.03 0.05

48
Table 6. Acquirer announcement volume. Regressions of acquirer merger announcement volume on normal volume, target institutional ownership, and deal characteristics. Panel A shows results for stock swap mergers, and Panel B shows results for cash mergers. The acquirer announcement volume is the average daily volume over a five-day window surrounding the announcement of the merger expressed as a percentage of shares outstanding. Normal volume is the average daily volume over a 60-day window starting 90 trading days before the announcement of the merger and expressed as a percentage of shares outstanding. Target institutional ownership (IO) is totaled from the CDA Spectrum Institutional Holdings database for the quarter prior to the announcement of the merger and expressed as a percentage of shares outstanding. Non-overlapping target IO includes only those institutions that own no shares of the acquiring firm and is also expressed as a percentage of shares outstanding. The other deal characteristics are described in Table 1. All variables are Winsorized at the first and 99th percentiles. Announcement year fixed effects are included in all four specifications. Heteroskedasticity-robust t-statistics are reported in braces. Acquirer Volume (%)
Coef [t] Coef [t] Coef [t] Coef [t] Panel A. Stock Deals Target IO 1.07 [11.01] 0.57 [4.44] Non-Overlapping Target IO 1.71 [7.98] 0.85 [3.63] Normal Volume 1.35 [24.23] 1.28 [18.95] 1.34 [23.65] 1.27 [18.87] log(Acquirer Size) -0.19 [-11.65] -0.18 [-10.93] log(Target Size) 0.21 [10.24] 0.23 [12.47] Acquirer Leverage -0.24 [-1.46] -0.26 [-1.55] Target Leverage 0.23 [1.91] 0.24 [1.95] Acquirer M/B 0.01 [0.62] 0.01 [0.75] Target M/B 0.06 [3.12] 0.06 [3.18] Target Announcement Return 0.55 [4.36] 0.57 [4.54] Same Industry 0.08 [1.60] 0.08 [1.54] Year FE Yes Yes Yes Yes N 1,843 1,481 1,843 1,481 R2 0.58 0.63 0.58 0.63 Panel B. Cash Deals Target IO 0.17 [1.79] 0.06 [0.40] Non-Overlapping Target IO 0.23 [1.40] 0.05 [0.21] Normal Volume 1.00 [9.48] 0.90 [7.94] 1.00 [9.42] 0.90 [7.94] Additional Controls No Yes No Yes Year FE Yes Yes Yes Yes N 1,141 904 1,141 904 R2 0.42 0.40 0.42 0.40

49
Table 7. Acquirer announcement returns: Interactions with proxies for demand-curve slope. Regressions of acquirer merger announcement returns (in stock deals only) on target institutional ownership, acquirer demand curve proxies, interactions between the two, and deal characteristics. The acquirer announcement return is the return in excess of the value-weighted market over a five-day window surrounding the announcement of the merger. In Panel A, target institutional ownership is totaled from the CDA Spectrum Institutional Holdings database for the quarter prior to the announcement of the merger and expressed as a percentage of shares outstanding. In Panel B, non-overlapping target IO includes only those institutions that own no shares of the acquiring firm and is also expressed as a percentage of shares outstanding. The first two regressions in each panel use dispersion in analyst long-term growth forecasts as a proxy for the slope of the acquirer demand curve; the second two regressions use idiosyncratic risk. The dispersion in analyst forecasts is the standard deviation of all outstanding long-term growth forecasts. Idiosyncratic risk is the standard deviation of the residuals from a regression of acquirer excess returns on the Fama-French Benchmark Factors (Rm, SMB, HML), and the matched 48 industry portfolio return. All factor and portfolio returns were obtained from Ken French’s website. The other deal characteristics are described in Table 1. All variables are Winsorized at the first and 99th percentiles. The demand curve variables are standardized to have zero mean and unit variance. Announcement year fixed effects are included in all four specifications. Heteroskedasticity-robust t-statistics are reported in braces. Dispersion in Analyst Long-Term Growth Forecasts Non-Industry Idiosyncratic Risk
Coef [t] Coef [t] Coef [t] Coef [t] Panel A. Target IO Target IO -3.12 [-3.41] -1.99 [-1.44] -3.53 [-4.59] -2.27 [-1.94] Demand Curve (DC) 0.51 [0.99] 0.76 [1.42] 0.40 [1.18] 0.91 [2.15] Target IO * DC -2.71 [-1.94] -2.79 [-1.93] -3.23 [-2.90] -3.11 [-2.64] Additional Controls No Yes No Yes Year FE Yes Yes Yes Yes N 1,208 1,010 1,802 1,470 R2 0.03 0.09 0.04 0.08 Panel B. Non-Overlapping Target IO Non-Overlapping Target IO -7.44 [-4.28] -4.93 [-2.40] -6.77 [-4.89] -4.82 [-2.81] Demand Curve (DC) 0.30 [0.61] 0.54 [1.06] 0.13 [0.40] 0.58 [1.38] Non-Overlapping Target IO * DC -4.99 [-1.70] -5.33 [-1.73] -2.77 [-1.38] -2.71 [-1.30] Additional Controls No Yes No Yes Year FE Yes Yes Yes Yes N 1,208 1,010 1,802 1,470 R2 0.04 0.09 0.03 0.08