Embed Size (px)
Citation preview

Asian Economic and Financial Review, 2016, 6(1): 54-65
† Corresponding author
DOI: 10.18488/journal.aefr/2016.6.1/102.1.54.65
ISSN(e): 2222-6737/ISSN(p): 2305-2147
© 2016 AESS Publications. All Rights Reserved.
54
CORPORATE FAILURE PREDICTION MODELS FOR ADVANCED RESEARCH IN CHINA: IDENTIFYING THE OPTIMAL CUT OFF POINT
Zhen Jia Liu1†
--- Yi Shu Wang2
1PHD at School of Business ,Changzhou University, Changzhou City, Jiangsu Providence, China 2Associate Professor at School of Business ,Changzhou University, Changzhou City, Jiangsu Providence, China
ABSTRACT
The rapid growth of the Chinese economy has resulted in Chinese listed companies entering numerous global supply
chains, and thereby contributing to the globalization of economies. Accurately predicting corporate distress is a
crucial concern for enterprises, managers, investors, creditors, and supervisors. In this study, data from the 2003-
2013 (excluding 2008) was analyzed, and a logistic model was applied to analyze critical factors. We developed
Special Treatment (ST) model to measure distress of companies listed in China. The results indicate that the optimal
cut-off point (one, two, three and fourth quarters before a failure), and the debt ratios (one quarter before a failure)
or unadjusted economic value added (two, three and fourth quarters before a failure) is superior in predicting
corporate failure in China
© 2016 AESS Publications. All Rights Reserved.
Keywords: Corporate failure prediction, China, Cut off point, Economic value added, Special treatment, Distress.
JEL Classification: M40, M41.
Contribution/ Originality
The results indicate that the optimal cut-off point for corporate failure prediction explained that most of the
accuracy in the debt ratios (one quarter before a failure) and unadjusted economic value added (the models range
from the two quarters to the fourth quarters before a failure).
1. INTRODUCTION
For decades, financial distress prediction (FDP) has been a central topic in both practical and academic corporate
finance. From a practical perspective, stockholders, creditors, senior management, and auditors are all interested in
FDP because it greatly influences their decision making. In addition, financial distress also results in serious social
problems, such as unemployment, economic depression, and financial crisis, particularly if several companies run
into financial distress at the same time. An accurate, stable, and practical FDP tool is therefore urgently required, and
several academic researchers have been focusing on developing such a tool (Sun and Li, 2012).
China is the most prominent emerging market and is in the process of financial liberalization from a closed to a
market-oriented and integrated economy. China experienced its first increase in bankruptcy cases starting from 2002
and peaking in 2007 (3207 cases) (Wang and Campbell, 2010c). In June 2007, a distressed firm removal system
based on China’s securities market’s bankruptcy law was implemented, and is expected to exert a substantial
influence on the market.
Asian Economic and Financial Review
ISSN(e): 2222-6737/ISSN(p): 2305-2147
URL: www.aessweb.com
Asian Economic and Financial Review, 2016, 6(1): 54-65
© 2016 AESS Publications. All Rights Reserved.
55
Previous studies have analyzed early warning systems in China. It is widely argued that the majority of studies
on corporate failures thus far have relied too heavily on financial ratios (Li and Sun, 2010; Li et al., 2010b; Wang and
Campbell, 2010c; Li et al., 2011a; Li and Sun, 2011a; Sun et al., 2011a; Li et al., 2011b; Sun et al., 2011b; Li and
Sun, 2011d; Biscontri et al., 2012; Li and Sun, 2012; Sun and Li, 2012; Xiao et al., 2012; Zhou et al., 2012; Zhang et
al., 2013; Dong et al., 2014; Geng et al., 2015). Therefore, using financial ratios to detect distress could be beneficial.
A substantial amount of effort in the academic literature has been devoted to forecasting corporate failure. The
methodologies employed have been based mainly on various statistical models. Bapat and Nagale (2014) indicated
that logistic regression can be used as part of an early warning system to establish a cutoff point or level of
probability (typically, 0.5) that categorizes a corporate as failed1. However, this value is subjective and optimal cut
off points should be determined. If a firm, whose observed status is bankrupt, is classified to be non-bankrupt, such
error is referred as a type I error and the reverse is a type II error. To show the relationship between the cut-off point
and type I and type II errors, we address the following two questions: (1).Do performance outcomes of bankruptcy
prediction models depend on the arbitrary choice of the cut-off point? (2) Procedure to determine the optimal cut-off
point. The two research questions focus on the critical role of the cut-off point as it affects bankruptcy prediction
models. Therefore, in this study, we adopted cut off points to predict corporate failures and identify which point is
superior in comparison to various financial ratios (accuracy).The main contribution of this study to the literature is
that, based on our research, it is the first study to examine the association between cut off points and performance
outcomes of bankruptcy prediction models in China.
By investigating whether cut off points influence a firm’s failure prediction, this study provides provide insight
to the fundamental question concerning the choice of failure prediction models which are critical in the optimal
allocation of resources. The remainder of the paper is organized as follows. Section 2 presents a brief review of the
related literature. Section 3 provides details of the research design and sample selection procedure and develops our
model. Section 4 presents our empirical findings. Section 5 contains a summary and conclusions.
2. LITERATURE REVIEW
Since the late 1960s, numerous studies have focused extensively on methods to predict bankruptcy, and several
models have been developed to predict bankruptcy. Classical statistical techniques influenced the formation of these
models such as logistic (Wang and Campbell, 2010c; Dong et al., 2014);Rough Set (Xiao et al., 2012);Support
Vector Machine (Sun and Li, 2012; Dong et al., 2014);nearest-neighbour support vectors (Li and Sun, 2012);
Linear regression (Zhou et al., 2012);probit regression (Zhou et al., 2012);linear discriminant analysis (Zhou et
al., 2012);k-nearest neighbor methods (Zhou et al., 2012);Decision tree (Zhou et al., 2012);Naïve Bayes
classifiers (Zhou et al., 2012);neural network (Zhou et al., 2012);neural network (Zhou et al., 2012; Dong et al.,
2014);AdaBoost (Zhou et al., 2012);multiple discriminant analysis (Biscontri et al., 2012);case-based reasoning
Support vector machine (Li and Sun, 2011a);technique for order performance by the similarity to ideal solution (Li
et al., 2011b);genetic algorithm (Sun et al., 2011b); random subspace binary logit (Li et al., 2011a);principal
component analysis (Li and Sun, 2011d);AdaBoost (Sun et al., 2011a); single attribute test (Sun et al., 2011a);
decision tree (Sun et al., 2011a);hybrid case-based reasoning (Li and Sun, 2010);classification and regression tree
1The cut-off value is 0.5. It means that if the estimated probability calculated as above is greater than 0.5 the company would be predicted as bankrupt.

Asian Economic and Financial Review, 2016, 6(1): 54-65
© 2016 AESS Publications. All Rights Reserved.
56
(Li et al., 2010b);proportional hazards model (Bhattacharjee and Han, 2014):Datamining (Zhang et al., 2013;
Geng et al., 2015).
In reference to these statistical techniques associated with business failures in public companies in China, Zhu
(2012) suggested that financial ratios (liquidity, profitability, operational efficiency, growth, structural factors, and
cash flow) were effective variables to predict and explain corporate failures. The application of these traditional
accounting tools for measuring corporate performance has been questioned, for various reasons. The tools are suitable
for analyzing historical data, but not for future decision-making (Rappaport, 1995). Several studies have considered
EVA(economic value added) to be a crucial tool for measuring performance (Sharma and Kumar, 2010; Ismail, 2011;
Haddad, 2012; Parvaei and Farhadi, 2013) and managers worldwide have adopted it as a corporate strategy (Sharma
and Kumar, 2010). Thus, companies would face bankruptcy, which explains a direct correlation exists between
bankruptcy and companies that apply the EVA (Timo and Virtanen, 2001; Pasaribu, 2008; Anvarkhatibi et al., 2013)
3. METHODOLOGY
Financial ratios were used to predict financial distress in China by using data from the RESSET database (2003-
2007;2009-2013). The study comprised 3485 samples, and financial companies were excluded. A logistic model
was adopted to analyze the data. The variables and research model of the current study are presented in the following
sections.
Dependent variables: Corporate Failures (ST model)
A financially distressed company is defined as a company with negative net profit for 2 consecutive years (Sun
and Li, 2011). The abnormal financial status of these companies is also the main criterion for ST for Chinese
companies listed on the Chinese Stock Exchange. The value of the dummy variable was 1 for distress, and 0 was the
contrary the variable………………………. ……………………………… (1)
Independent variables: financial ratios2
Zhu (2012) suggested that financial ratios (liquidity, profitability, operational efficiency, growth, structural
factors, and cash flow) were effective variables to predict and explain corporate failures in China. Therefore, in this
study, we adopted debt-to-asset、current ratios、quick ratios、accounts receivable turnover、inventory turnover
ratios、growth of net assets、cash to current liabilities.EVA can be used to detect corporate failure (Timo and
Virtanen, 2001; Pasaribu, 2008; Anvarkhatibi et al., 2013).
Control variables: macroeconomic factors3
Xie et al. (2011) indicated that macroeconomic indicators were useful to explain the interaction between the
environment and corporate problems. The macroeconomic variables in this study were incorporated into the model,
and the macroeconomic shock channels that contributed to corporate failures were identified. In this study, we used
correlation coefficients4 between net profit and the macroeconomic indicators (GDP, M2, Consumer Price Index
(CPI), real interest rate, and the RMB: USD exchange rate) to measure the sensitivity of companies to
macroeconomic changes, and all macroeconomic variables and profit data were semi-annual.
Empirical model5
2Zhu (2012). stated healthy firms had higher current ratios , quick ratios, accounts receivable turnover, inventory turnover ratios, growth of net assets, cash to current
liabilities, cash to total liabilities, and non-healthy firms had higher debt-to-asset ratio
3AREMOS database
4Xie, Luo and Yu (2011).
5To shorten the tables, we omitted the solution because this paper has 720 empirical models. One financial ratio is the independent variable (ranging from failure prior
to Q-1 to Q-4), and one prediction models is the dependent variable; five control variables are used in each logistical model.

Asian Economic and Financial Review, 2016, 6(1): 54-65
© 2016 AESS Publications. All Rights Reserved.
57
The study used the logistic method. The proxy variables are as follows: itDAR was debt compared with assets in
year t; itCR was current assets compared with current liabilities in year t; itQR was quick assets compared with
current liabilities in year t; itART was sales compared with average accounts receivable in year t; itINVT was cost
of sales compared with average accounts payable in year t; itGE was change in equity in year t; itCCL was cash
compared with to current liabilities in year t; itUAEVA is the unadjusted economic value added6compared with the
outstanding shares in year t; itAEVA is the adjusted economic value (added join adjusted items) 7compared with the
outstanding shares in year t; itEDAEVA represents the adjusted economic value added (join adjusted items and
economic deprecation adjusted items8compared with the outstanding shares in year t. itNIGDP was the correlation
coefficients between net profit and the GDP in year t; itNIM was the correlation coefficients between net profit and
the money supply (M2)in year t ; itNICPI was the correlation coefficients between net profit and the CPI in year t ;
itNIRI was the correlation coefficients between net profit and the real interest rate in year t; itNIEX was the
correlation coefficients between net profit and the RMB:USD exchange rate in year t
Performance Measures9
Lu and Chang (2009) proposed an early warning model for the quarters (1Q, 2Q, 3Q, and 4Q) prior to the event
of corporate distress that used financial ratios. If a bankrupt firm is classified as bankrupt, then it is considered TP. By
contrast, if a non-bankrupt firm is classified as non-bankrupt, then it is considered TN. Any non-bankrupt firm that is
classified as bankrupt produces a FP and any bankrupt firm that is classified as a non-bankrupt firm produces an FN
(Divsalar et al., 2011).
Robustness-Test
We test the predictive ability of our model both in and out of sample. We also repeat the same analyses out‐of‐
sample to tackle a possible sample specific issue and get more robust and general results.
4. RESULTS
4.1. Descriptive Statistics
Table 2 shows that the proportion of long-term debt at 30.17% shows it to be financial conservative. Current
ratios, quick ratios and Equity growth10
show that public firms in China are doing well. Conversely, the mean of the
6Huang and Liu (2010).
7Ibid.
8Ibid.
9“FN” is a type I error (If a firm, whose observed status is bankrupt, is classified to be non-bankrupt);“FP” is a type II error (If a firm, whose observed status is non-
bankrupt, is classified to be bankrupt)。
10Equity growth at 2.76%

Asian Economic and Financial Review, 2016, 6(1): 54-65
© 2016 AESS Publications. All Rights Reserved.
58
EVA is positive, showing that the public firms in China have a considerable ability to be profitable or to manage
funds efficiently. In particular, the adjusted EVA (join accounting adjusted items and economic deprecation adjusted
items) is the highest, and the adjusted EVA (join adjusted items) is the lowest. The aforementioned economic factors,
the sensitivity of companies to macroeconomic changes, money supply (M2) is higher than other economic factors.
4.2. Empirical Test11
Banks with cut-off points12
above 0.5 were classified as bankrupt banks and banks under 0.5 were classified as
successful banks. The comparisons of predicted and actual bankruptcy classifications are shown in Tables 3-
10.Because the financial crisis of 2008 might have restructured the global financial market; we separated data from
before 2008 and after 2008 to obtain the accuracy of the logistic model.
Table 3-10 presents the classification ability of the logit models applied at cut-off point range from 0.1 to 0.9 in
terms of classification rate, Type I and Type II error, and also the wrong classified cases for each group firms13
.As
indicated in Table 3 (one quarter before a failure, and before 2008), debt to asset shad the optimal cut-off point (the
accuracy of the logistic model was 33.18%) when the cut-off point was 0.8 employed to predict corporate failure. As
indicated in Table 4 (one quarter before a failure, and after 2008), debt to assets had the optimal cut-off point (the
accuracy of the logistic model was 25.79%) when the cut-off point was 0.9 employed to predict corporate failure. The
empirical results show that the debt to assets exhibited greater accuracy (%) than that of the other financial ratios (one
quarter before a failure).The debt to assets likely reflects an enterprise’s financial conservative and can be employed
to prevent distress. Thus, the accuracy of corporate failure prediction has been increased. Compared to Table 3 and
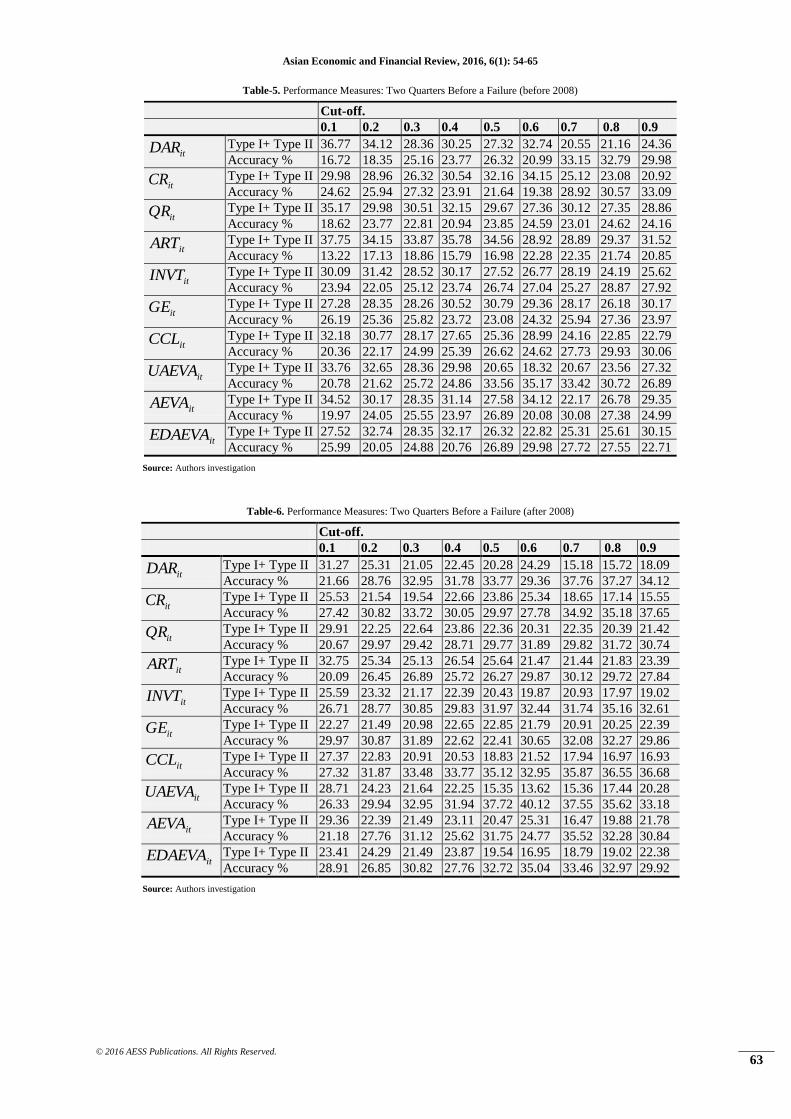
Table 4, as indicated in Table 5 (two quarters before a failure, and before 2008), unadjusted economic value added
had the optimal cut-off point (the accuracy of the logistic model was 35.17%) when the cut-off point was 0.6
employed to predict corporate failure. As indicated in Table 6(two quarters before a failure, and after 2008),
unadjusted economic value added had the optimal cut-off point (the accuracy of the logistic model was 40.12%) when
the cut-off point as 0.6 employed to predict corporate failure.
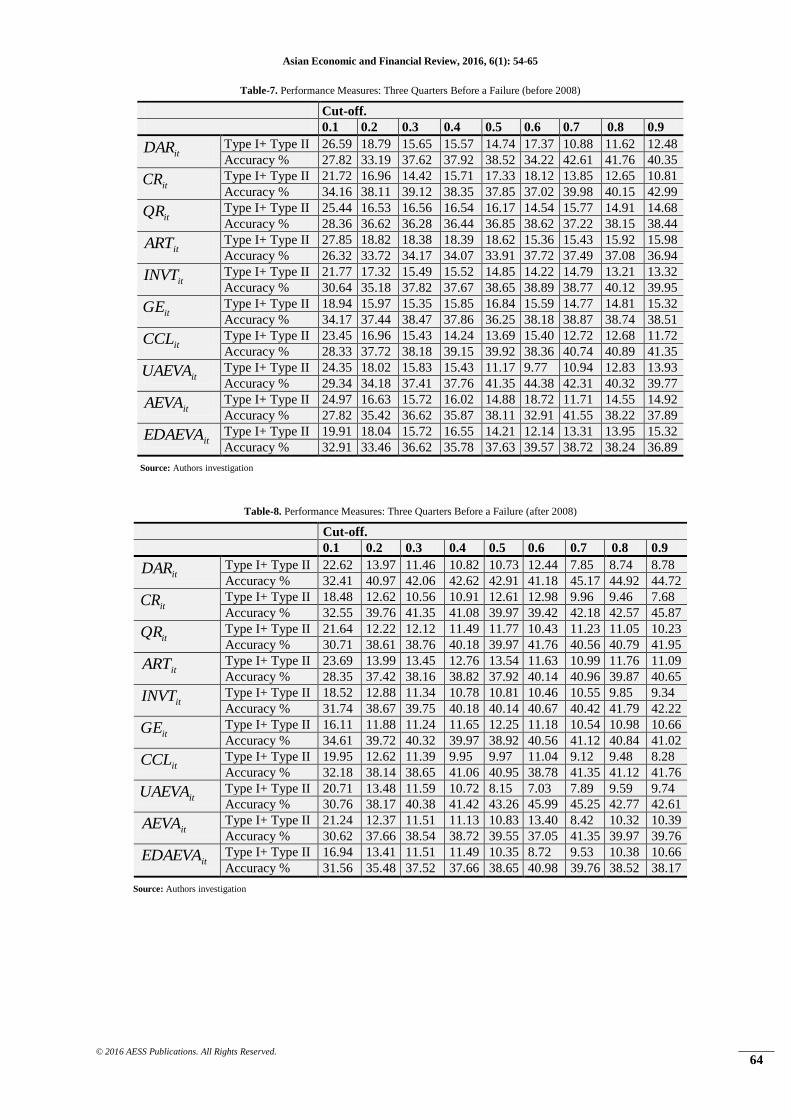
As indicated in Table 7 (three quarters before a failure, and before 2008), unadjusted economic value added had
the optimal cut-off point (the accuracy of the logistic model was 44.38%) when the cut-off point was 0.6 employed to
predict corporate failure. As indicated in Table 8 (three quarters before a failure, and after 2008), unadjusted
economic value added had the optimal cut-off point (the accuracy of the logistic model was 45.99%) when the cut-off
point was 0.6 employed to predict corporate failure. As indicated in Table 9 (fourth quarters before a failure, and
before 2008), unadjusted economic value added had the optimal cut-off point (the accuracy of the logistic model was
50.12%) when the cut-off point was 0.6 employed to predict corporate failure. As indicated in Table 10 (fourth
quarters before a failure, and after 2008), unadjusted economic value added had the optimal cut-off point (the
accuracy of the logistic model was 54.42%) when the cut-off point was 0.6 employed to predict corporate failure. The
empirical results show that the unadjusted economic value added exhibited greater accuracy (%) than that of the other
financial ratios (ranging from failure prior to Q-2 to Q-4). The economic value added likely reflects an enterprise’s
real economic value and can be employed to prevent the inefficient management of funds (i.e., income excess capital
cost) to ensure that corporations do not waste resources. Thus, the accuracy of corporate failure prediction has been
increased.
11The rate of errors (Type I or II) is calculated as the number of firms that are misclassified over number of firms in the group. As a cut-off point moves toward 1, the
type I error increases. In contrast, type II error decreases as the cut-off point increases. Because the fitted probability as generated using the logistic model can be zero or
greater than one, the rate of type I errors can be far less than one. The rate of type II error can also be tilted above zero, even if the cut-off point is chosen to be one.
12Erdogan (2008).
13An appropriate cut off point should minimize the cost of misclassification (e.g., minimize the sum of type-I errors and type II errors)
Asian Economic and Financial Review, 2016, 6(1): 54-65
© 2016 AESS Publications. All Rights Reserved.
59
Results from variance inflation factors to explain variables for correlation; the result lies between 1.687 and
1.893 (Variance Inflation Factors <10)14
.There is no correlation problem. We repeat the same analyses out‐of‐sample
to tackle a possible sample specific issue and get general robust results15
. Overall, the analysis of the prediction model
show that all measures of predictive ability, there are differences between these models. The significance in
difference provides strong evidences in the best prediction trends regarding corporate failure in China. Thus, the debts
to assets or the unadjusted economic value added could be the optimal index for predicting corporate failure in China
5. CONCLUSION
This study used data from 2003-2013(excluding 2008), and a logistic model to analyze the factors that influence
financial early warning systems in China. We developed Special Treatment model to measure distress of companies
and presented the classification ability of the logit models applied at cut-off point range from 0.1 to 0.9 in terms of
classification rate. The results indicate that the optimal cut-off point (e.g., an appropriate cut-off point should
minimize the sum of type I errors and type II errors) and the proposed logistic model for corporate failure prediction
explained that most of the accuracy in the debt ratios (one quarter before a failure) and unadjusted economic value
added (the models range from the two quarters to the fourth quarters before a failure). Thus, debt ratios or unadjusted
economic value added may be the optimal index to detect corporate failure in China.
China will adopt the International Financial Reporting Standards. Thus, using the logit models, to study how the
adoption of these standards will affect accounting numbers to predict bankruptcy and to judge the capacity of the
IFRS to produce more relevant accounting numbers. This model should be tested in various industries in China to
determine whether these financial factors indicate corporate failures equally effectively, if not, alternative models
should be developed.
REFERENCES
Anvarkhatibi, S., R. Mohammadi and J. Mohammadi, 2013. Investigation of the effect of the value added, earning quality and
leverage ratio on bankruptcy in organizations accepted in Tehran’s stock market. Journal of Natural and Social Sciences,
2(2): 223-229.
Bapat, V. and A. Nagale, 2014. Comparison of bankruptcy prediction models: Evidence from India. Accounting and Finance
Research, 3(4): 91-98.
Bhattacharjee, A. and J. Han, 2014. Financial distress of Chinese firms: Microeconomic, macroeconomic and institutional
influences. China Economic Review, 30: 244-262.
Biscontri, R.G., G.M. Chen and O.M. Rui, 2012. Anempirical analysis on the prediction of Chinese financially distressed listed
companies. Journal of Modern Accounting and Auditing, 8(5): 593-615.
Divsalar, M., M.R. Javid, A.H. Gandomi, J.B. Soofi and M.V. Mahmood, 2011. Hybridgenetic programming-based search
algorithms for enterprise bankruptcy prediction. Applied Artificial Intelligence, 25(8): 669-692.
Dong, Y.X., Z. Xiao and X. Xiao, 2014. Default prediction for real estate companies with imbalanced dataset. Journal of
Information Processing Systems, 10(2): 314-333.
Erdogan, B.E., 2008. Bankruptcy prediction of Turkish commercial banks using financial ratios. Applied Mathematical Sciences,
60(2): 2973-2982.
Geng, R., I. Bose and X. Chen, 2015. Prediction of financial distress: An empirical study of listed Chinese companies using data
mining. European Journal of Operational Research, 241(1): 236-247.
14In order to shorten the tables, we omit the solution
15We adopted 1(in sample) to1 (out of sample)
Asian Economic and Financial Review, 2016, 6(1): 54-65
© 2016 AESS Publications. All Rights Reserved.
60
Haddad, F.S., 2012. Therelationship between economic value added and stock returns: Evidence from Jordanian banks.
International Research Journal of Finance and Economics, 89: 6-15.
Huang, D.T. and Z.C. Liu, 2010. Boardcomposition and corporate value in Taiwan high technology firms. International Journal of
Organizational Innovation, 2(4): 126-138.
Ismail, I., 2011. Companyperformance in Malaysia after the 1997economic crisis: Using economic value added (EVA) as a
predictor. African Journal of Business Management, 5(7): 3012-3018.
Li, H., H. Adeli, J. Sun and J.G. Han, 2011b. Hybridizing principles of TOPSIS with case-based reasoning for business failure
prediction. Computers and Operations Research, 38(2): 409-419.
Li, H., Y.C. Lee, Y.C. Zhou and J. Sun, 2011a. The random subspace binary logit (RSBL) model for bankruptcy prediction.
Knowledge Based Systems, 24(8): 1380-1388.
Li, H. and J. Sun, 2010. Business failure prediction using hybrid2 case-based reasoning (H2CBR). Computers and Operations
Research, 37(1): 137-151.
Li, H. and J. Sun, 2011a. On performance of case based reasoning in Chinese business failure prediction from sensitivity,
specificity, positive and negative values. Applied Soft Computing, 11: 460-467.
Li, H. and J. Sun, 2011d. Empiricalresearch of hybridizing principal component analysis with multivariate discriminant analysis
and logistic regression for business failure prediction. Expert Systems with Applications, 38(5): 6244-6253.
Li, H. and J. Sun, 2012. Forecasting business failure: The use of nearest-neighbour support vectors and correcting imbalanced
samples evidence from the Chinese hotel industry. Tourism Manage, 33(3): 622-634.
Li, H., J. Sun and J. Wu, 2010b. Predicting business failure using classification and regression tree: An empirical comparison with
popular classical statistical methods and top classification mining methods. Expert Systems with Applications, 37(8):
5895-5904.
Lu, Y.C. and S.L. Chang, 2009. Corporategovernance and quality of financial information on the prediction power of financial
distress of listed companies in Taiwan. International Research Journal of Finance and Economics, 32: 114-139.
Parvaei, A. and S. Farhadi, 2013. The ability of explaining and predicting of economic value added (EVA) versus net income (NI),
residual income (RI) &free cash flow (FCF) in Tehran stock exchange (TSE). International Journal of Economics and
Finance, 5(2): 67-78.
Pasaribu, R.B., 2008. Financialdistress prediction in Indonesia stock exchange case study of trade industry public company.
Journal of Economics Business and Accounting, 11(2): 153-172.
Rappaport, A., 1995. Creatingshareholder value: The new standard for business n performance. New York: The Free Press.
Sharma, A.K. and S. Kumar, 2010. Economic value added (EVA)-literature reviewand relevant issues. International Journal of
Economics and Finance, 2(2): 200-220.
Sun, J., K.Y. He and H. Li, 2011b. SFFS-PC-NN optimized by genetic algorithm for dynamic prediction of financial distress with
longitudinal data streams. Knowledge Based Systems, 24(7): 1013-1023.
Sun, J., M.Y. Jia and H. Li, 2011a. AdaBoostensemble for financial distress prediction: An empirical comparison with data from
Chinese listed companies. Expert Systems with Applications, 38(8): 9305-9312.
Sun, J. and H. Li, 2011. Dynamic financial distress prediction using instance selection for the disposal of concept drift. Expert
Systems with Applications, 38(3): 2566-2576.
Sun, J. and H. Li, 2012. Financialdistress prediction using support vector machines: Ensemble vs. Individual. Applied Soft
Computing, 12(8): 2254-2265.
Timo, S. and I. Virtanen, 2001. Economic value added: A simulation analysis of the trendy, owner-oriented management tool.
Acta Wasaensia, No.90.
Wang, Y. and M. Campbell, 2010c. Financialratios and the prediction of bankruptcy: The ohlson model applied to Chinese
publicly traded companies. Journal of Organizational Leadership and Business, 1(5): 68-83.

Asian Economic and Financial Review, 2016, 6(1): 54-65
© 2016 AESS Publications. All Rights Reserved.
61
Xiao, Z., X. Yang, Y. Yang and X. Dang, 2012. Theprediction for listed companies’ financial distress by using multiple prediction
methods with rough set and Dempster–Shafer evidence theory. Knowledge Based Systems, 26: 196-206.
Xie, C., C. Luo and X. Yu, 2011. Financial distress prediction based on SVM and MDA methods: The case of Chinese listed
companies. Quality Quantity, 45(3): 671-686.
Zhang, L., L.l. Zhang, W. Teng and Y. Chen, 2013. Based on information fusion technique with data mining in the application of
finance early-warning. Procedia Computer Science, 17: 695-703.
Zhou, L., K.K. Lai and J. Yen, 2012. Empiricalmodels based on features ranking techniques for corporate financial distress
prediction. Computers and Mathematics with Applications, 64(8): 2484-2496.
Zhu, X., 2012. Internalfactors associated with business failures of public companies in China-from a financial analytical
perspective. International Journal of Business and Social Science, 3(9): 49-59.
Table-1. Confusion matrix
Predicted class
Bankrupt Non-bankrupt
Actual Class Bankrupt TP FN
Non-bankrupt FP TN
Source: Authors investigation
Accuracy (%) = 100
TNFNFPTP
TNTP……………………………………… (2)
Table-2. Descriptive statistics (%;US dollars)
Max Min Avg
itDAR
56.75 28.36 30.17
itCR
235.72 76.35 125.62
itQR
218.32 69.77 108.23
itART
48.27 12.55 27.55
itINVT
45.72 20.65 27.78
itGE
10.65 0.86 2.76
itCCL
158.32 86.77 108.65
itUAEVA
2.36 -0.35 0.89
itAEVA
2.17 -1.36 0.32
itEDAEVA 1.89 0.36 1.07
itNIGDP 0.345 0.126 0.256
itNIM 0.667 0.456 0.552
itNICPI 0.442 0.231 0.328
itNIRI 0.387 0.168 0.226
itNIEX 0.552 0.342 0.421
Source: Authors investigation

Asian Economic and Financial Review, 2016, 6(1): 54-65
© 2016 AESS Publications. All Rights Reserved.
62
Table-3. Performance Measures: One Quarter Before a Failure (before 2008)
Cut-off.
0.1 0.2 0.3 0.4 0.5 0.6 0.7 0.8 0.9
itDAR Type I+ Type II 27.55 17.76 23.28 14.36 19.55 10.37 11.36 9.96 12.33
Accuracy % 21.99 24.15 22.18 24.97 23.76 30.55 28.77 33.18 26.75
itCR Type I+ Type II 33.15 27.35 33.77 28.15 34.17 27.66 36.61 27.46 20.55
Accuracy % 20.12 22.55 19.95 20.96 19.26 21.19 17.35 22.41 28.32
itQR Type I+ Type II 19.99 20.35 22.17 19.56 17.67 18.36 15.32 17.78 22.35
Accuracy % 23.77 23.02 22.55 23.92 25.02 24.15 25.38 24.93 21.36
itART Type I+ Type II 20.35 19.97 22.34 28.17 15.32 10.36 10.05 12.36 11.47
Accuracy % 23.22 24.71 19.75 16.72 29.72 32.42 32.79 30.72 31.85
itINVT Type I+ Type II 30.55 32.27 28.32 27.51 30.26 22.13 24.15 20.36 25.17
Accuracy % 20.35 19.52 23.27 24.31 21.18 28.37 27.42 29.77 26.39
itGE Type I+ Type II 32.17 30.56 25.37 26.18 24.32 20.55 25.88 24.99 28.56
Accuracy % 18.31 21.09 25.72 24.38 26.37 28.32 25.41 26.14 22.05
itCCL Type I+ Type II 27.79 32.17 27.58 30.06 28.37 24.15 22.08 25.77 26.72
Accuracy % 21.12 15.64 21.36 18.32 19.35 24.33 26.27 23.42 22.17
itUAEVA Type I+ Type II 28.18 29.35 24.36 25.51 29.98 20.17 26.62 25.33 24.78
Accuracy % 23.77 22.18 27.72 25.99 21.96 29.09 25.18 26.32 27.14
itAEVA Type I+ Type II 30.55 33.18 27.79 30.54 26.18 23.15 22.94 25.98 27.23
Accuracy % 21.95 17.82 22.75 22.04 23.99 25.76 26.92 24.37 22.94
itEDAEVA Type I+ Type II 34.16 35.17 29.95 28.55 25.36 20.87 19.92 24.77 27.15
Accuracy % 21.18 20.02 24.74 25.36 26.12 29.14 29.97 26.77 25.98
Source: Authors investigation
Table-4. Performance Measures (%): One Quarter Before a Failure (after 2008)
Cut-off.
0.1 0.2 0.3 0.4 0.5 0.6 0.7 0.8 0.9
itDAR Type I+ Type II 29.32 27.89 33.16 27.72 29.46 24.17 21.18 19.98 15.11
Accuracy % 19.87 22.04 16.55 22.15 18.72 23.63 23.84 24.59 25.79
itCR Type I+ Type II 27.76 28.35 29.55 28.15 27.81 26.32 27.78 28.12 25.55
Accuracy % 19.07 17.49 17.06 18.66 18.31 19.38 18.92 18.79 20.16
itQR Type I+ Type II 33.17 33.42 32.55 29.98 27.36 25.17 25.55 22.19 24.38
Accuracy % 17.98 17.86 18.36 20.79 21.08 23.99 23.72 24.18 24.05
itART Type I+ Type II 27.74 29.38 32.17 25.67 24.35 26.19 18.35 22.65 21.06
Accuracy % 16.98 14.32 10.65 17.94 18.33 17.02 23.78 19.93 20.97
itINVT Type I+ Type II 28.72 29.55 26.18 32.19 29.94 24.17 22.99 25.36 20.77
Accuracy % 18.35 17.91 19.37 14.21 17.63 20.96 22.74 19.96 24.32
itGE Type I+ Type II 28.55 29.92 30.16 29.99 31.52 27.66 24.55 26.32 25.18
Accuracy % 16.87 16.05 14.77 15.92 13.86 17.99 19.95 18.91 19.07
itCCL Type I+ Type II 30.12 32.52 29.81 30.72 27.58 28.11 26.33 23.18 25.37
Accuracy % 14.65 12.08 14.82 14.06 15.42 15.02 17.93 20.51 18.16
itUAEVA Type I+ Type II 27.57 29.78 25.18 26.37 25.68 26.32 20.17 26.18 23.11
Accuracy % 18.32 16.18 20.66 19.54 20.12 19.65 25.05 19.97 22.07
itAEVA Type I+ Type II 29.67 32.07 29.16 29.97 28.32 30.15 25.18 23.97 30.27
Accuracy % 16.28 12.87 16.55 16.04 17.88 15.86 20.38 22.09 15.76
itEDAEVA Type I+ Type II 32.16 34.18 30.18 29.36 32.56 24.82 26.31 20.98 24.36
Accuracy % 14.74 12.18 15.79 16.37 14.36 21.16 19.98 25.52 21.37
Source: Authors investigation
Asian Economic and Financial Review, 2016, 6(1): 54-65
© 2016 AESS Publications. All Rights Reserved.
63
Table-5. Performance Measures: Two Quarters Before a Failure (before 2008)
Cut-off.
0.1 0.2 0.3 0.4 0.5 0.6 0.7 0.8 0.9
itDAR Type I+ Type II 36.77 34.12 28.36 30.25 27.32 32.74 20.55 21.16 24.36
Accuracy % 16.72 18.35 25.16 23.77 26.32 20.99 33.15 32.79 29.98
itCR Type I+ Type II 29.98 28.96 26.32 30.54 32.16 34.15 25.12 23.08 20.92
Accuracy % 24.62 25.94 27.32 23.91 21.64 19.38 28.92 30.57 33.09
itQR Type I+ Type II 35.17 29.98 30.51 32.15 29.67 27.36 30.12 27.35 28.86
Accuracy % 18.62 23.77 22.81 20.94 23.85 24.59 23.01 24.62 24.16
itART Type I+ Type II 37.75 34.15 33.87 35.78 34.56 28.92 28.89 29.37 31.52
Accuracy % 13.22 17.13 18.86 15.79 16.98 22.28 22.35 21.74 20.85
itINVT Type I+ Type II 30.09 31.42 28.52 30.17 27.52 26.77 28.19 24.19 25.62
Accuracy % 23.94 22.05 25.12 23.74 26.74 27.04 25.27 28.87 27.92
itGE Type I+ Type II 27.28 28.35 28.26 30.52 30.79 29.36 28.17 26.18 30.17
Accuracy % 26.19 25.36 25.82 23.72 23.08 24.32 25.94 27.36 23.97
itCCL Type I+ Type II 32.18 30.77 28.17 27.65 25.36 28.99 24.16 22.85 22.79
Accuracy % 20.36 22.17 24.99 25.39 26.62 24.62 27.73 29.93 30.06
itUAEVA Type I+ Type II 33.76 32.65 28.36 29.98 20.65 18.32 20.67 23.56 27.32
Accuracy % 20.78 21.62 25.72 24.86 33.56 35.17 33.42 30.72 26.89
itAEVA Type I+ Type II 34.52 30.17 28.35 31.14 27.58 34.12 22.17 26.78 29.35
Accuracy % 19.97 24.05 25.55 23.97 26.89 20.08 30.08 27.38 24.99
itEDAEVA Type I+ Type II 27.52 32.74 28.35 32.17 26.32 22.82 25.31 25.61 30.15
Accuracy % 25.99 20.05 24.88 20.76 26.89 29.98 27.72 27.55 22.71
Source: Authors investigation
Table-6. Performance Measures: Two Quarters Before a Failure (after 2008)
Cut-off.
0.1 0.2 0.3 0.4 0.5 0.6 0.7 0.8 0.9
itDAR Type I+ Type II 31.27 25.31 21.05 22.45 20.28 24.29 15.18 15.72 18.09
Accuracy % 21.66 28.76 32.95 31.78 33.77 29.36 37.76 37.27 34.12
itCR Type I+ Type II 25.53 21.54 19.54 22.66 23.86 25.34 18.65 17.14 15.55
Accuracy % 27.42 30.82 33.72 30.05 29.97 27.78 34.92 35.18 37.65
itQR Type I+ Type II 29.91 22.25 22.64 23.86 22.36 20.31 22.35 20.39 21.42
Accuracy % 20.67 29.97 29.42 28.71 29.77 31.89 29.82 31.72 30.74
itART Type I+ Type II 32.75 25.34 25.13 26.54 25.64 21.47 21.44 21.83 23.39
Accuracy % 20.09 26.45 26.89 25.72 26.27 29.87 30.12 29.72 27.84
itINVT Type I+ Type II 25.59 23.32 21.17 22.39 20.43 19.87 20.93 17.97 19.02
Accuracy % 26.71 28.77 30.85 29.83 31.97 32.44 31.74 35.16 32.61
itGE Type I+ Type II 22.27 21.49 20.98 22.65 22.85 21.79 20.91 20.25 22.39
Accuracy % 29.97 30.87 31.89 22.62 22.41 30.65 32.08 32.27 29.86
itCCL Type I+ Type II 27.37 22.83 20.91 20.53 18.83 21.52 17.94 16.97 16.93
Accuracy % 27.32 31.87 33.48 33.77 35.12 32.95 35.87 36.55 36.68
itUAEVA Type I+ Type II 28.71 24.23 21.64 22.25 15.35 13.62 15.36 17.44 20.28
Accuracy % 26.33 29.94 32.95 31.94 37.72 40.12 37.55 35.62 33.18
itAEVA Type I+ Type II 29.36 22.39 21.49 23.11 20.47 25.31 16.47 19.88 21.78
Accuracy % 21.18 27.76 31.12 25.62 31.75 24.77 35.52 32.28 30.84
itEDAEVA Type I+ Type II 23.41 24.29 21.49 23.87 19.54 16.95 18.79 19.02 22.38
Accuracy % 28.91 26.85 30.82 27.76 32.72 35.04 33.46 32.97 29.92
Source: Authors investigation
Asian Economic and Financial Review, 2016, 6(1): 54-65
© 2016 AESS Publications. All Rights Reserved.
64
Table-7. Performance Measures: Three Quarters Before a Failure (before 2008)
Cut-off.
0.1 0.2 0.3 0.4 0.5 0.6 0.7 0.8 0.9
itDAR Type I+ Type II 26.59 18.79 15.65 15.57 14.74 17.37 10.88 11.62 12.48
Accuracy % 27.82 33.19 37.62 37.92 38.52 34.22 42.61 41.76 40.35
itCR Type I+ Type II 21.72 16.96 14.42 15.71 17.33 18.12 13.85 12.65 10.81
Accuracy % 34.16 38.11 39.12 38.35 37.85 37.02 39.98 40.15 42.99
itQR Type I+ Type II 25.44 16.53 16.56 16.54 16.17 14.54 15.77 14.91 14.68
Accuracy % 28.36 36.62 36.28 36.44 36.85 38.62 37.22 38.15 38.44
itART Type I+ Type II 27.85 18.82 18.38 18.39 18.62 15.36 15.43 15.92 15.98
Accuracy % 26.32 33.72 34.17 34.07 33.91 37.72 37.49 37.08 36.94
itINVT Type I+ Type II 21.77 17.32 15.49 15.52 14.85 14.22 14.79 13.21 13.32
Accuracy % 30.64 35.18 37.82 37.67 38.65 38.89 38.77 40.12 39.95
itGE Type I+ Type II 18.94 15.97 15.35 15.85 16.84 15.59 14.77 14.81 15.32
Accuracy % 34.17 37.44 38.47 37.86 36.25 38.18 38.87 38.74 38.51
itCCL Type I+ Type II 23.45 16.96 15.43 14.24 13.69 15.40 12.72 12.68 11.72
Accuracy % 28.33 37.72 38.18 39.15 39.92 38.36 40.74 40.89 41.35
itUAEVA Type I+ Type II 24.35 18.02 15.83 15.43 11.17 9.77 10.94 12.83 13.93
Accuracy % 29.34 34.18 37.41 37.76 41.35 44.38 42.31 40.32 39.77
itAEVA Type I+ Type II 24.97 16.63 15.72 16.02 14.88 18.72 11.71 14.55 14.92
Accuracy % 27.82 35.42 36.62 35.87 38.11 32.91 41.55 38.22 37.89
itEDAEVA Type I+ Type II 19.91 18.04 15.72 16.55 14.21 12.14 13.31 13.95 15.32
Accuracy % 32.91 33.46 36.62 35.78 37.63 39.57 38.72 38.24 36.89
Source: Authors investigation
Table-8. Performance Measures: Three Quarters Before a Failure (after 2008)
Cut-off.
0.1 0.2 0.3 0.4 0.5 0.6 0.7 0.8 0.9
itDAR Type I+ Type II 22.62 13.97 11.46 10.82 10.73 12.44 7.85 8.74 8.78
Accuracy % 32.41 40.97 42.06 42.62 42.91 41.18 45.17 44.92 44.72
itCR Type I+ Type II 18.48 12.62 10.56 10.91 12.61 12.98 9.96 9.46 7.68
Accuracy % 32.55 39.76 41.35 41.08 39.97 39.42 42.18 42.57 45.87
itQR Type I+ Type II 21.64 12.22 12.12 11.49 11.77 10.43 11.23 11.05 10.23
Accuracy % 30.71 38.61 38.76 40.18 39.97 41.76 40.56 40.79 41.95
itART Type I+ Type II 23.69 13.99 13.45 12.76 13.54 11.63 10.99 11.76 11.09
Accuracy % 28.35 37.42 38.16 38.82 37.92 40.14 40.96 39.87 40.65
itINVT Type I+ Type II 18.52 12.88 11.34 10.78 10.81 10.46 10.55 9.85 9.34
Accuracy % 31.74 38.67 39.75 40.18 40.14 40.67 40.42 41.79 42.22
itGE Type I+ Type II 16.11 11.88 11.24 11.65 12.25 11.18 10.54 10.98 10.66
Accuracy % 34.61 39.72 40.32 39.97 38.92 40.56 41.12 40.84 41.02
itCCL Type I+ Type II 19.95 12.62 11.39 9.95 9.97 11.04 9.12 9.48 8.28
Accuracy % 32.18 38.14 38.65 41.06 40.95 38.78 41.35 41.12 41.76
itUAEVA Type I+ Type II 20.71 13.48 11.59 10.72 8.15 7.03 7.89 9.59 9.74
Accuracy % 30.76 38.17 40.38 41.42 43.26 45.99 45.25 42.77 42.61
itAEVA Type I+ Type II 21.24 12.37 11.51 11.13 10.83 13.40 8.42 10.32 10.39
Accuracy % 30.62 37.66 38.54 38.72 39.55 37.05 41.35 39.97 39.76
itEDAEVA Type I+ Type II 16.94 13.41 11.51 11.49 10.35 8.72 9.53 10.38 10.66
Accuracy % 31.56 35.48 37.52 37.66 38.65 40.98 39.76 38.52 38.17
Source: Authors investigation

Asian Economic and Financial Review, 2016, 6(1): 54-65
© 2016 AESS Publications. All Rights Reserved.
65
Table-9. Performance Measures: Fourth Quarters Before a Failure (before 2008)
Cut-off.
0.1 0.2 0.3 0.4 0.5 0.6 0.7 0.8 0.9
itDAR Type I+ Type II 19.24 10.78 8.45 7.54 7.83 8.93 5.76 6.71 6.34
Accuracy % 34.62 42.18 44.86 45.72 45.24 44.62 48.72 46.11 46.62
itCR Type I+ Type II 15.72 9.48 7.74 7.67 9.19 9.32 7.22 5.61 7.21
Accuracy % 39.76 46.28 48.26 48.07 46.62 46.42 48.76 49.05 48.92
itQR Type I+ Type II 18.41 9.11 8.87 8.08 8.58 7.56 7.31 8.33 8.98
Accuracy % 38.12 46.72 47.24 47.99 47.56 48.44 48.66 47.72 47.06
itART Type I+ Type II 20.65 10.42 9.85 8.88 9.86 8.36 7.93 7.86 8.83
Accuracy % 34.18 43.75 44.36 45.92 44.18 46.92 47.55 47.78 46.19
itINVT Type I+ Type II 15.76 9.61 8.31 7.51 7.89 7.52 7.62 7.49 6.71
Accuracy % 39.27 44.18 45.77 47.62 46.82 47.42 47.18 47.76 48.82
itGE Type I+ Type II 13.71 8.86 8.24 8.11 8.93 8.41 7.62 7.58 8.28
Accuracy % 40.76 46.65 47.35 47.62 46.18 46.96 47.93 48.17 47.18
itCCL Type I+ Type II 16.97 9.48 8.35 6.94 7.28 7.94 6.01 7.23 6.64
Accuracy % 38.17 44.82 45.78 47.87 46.55 46.06 48.35 46.72 48.07
itUAEVA Type I+ Type II 17.62 10.04 8.57 7.47 5.96 5.08 5.79 7.31 6.97
Accuracy % 39.76 45.12 46.82 47.45 49.67 50.12 49.76 47.72 48.32
itAEVA Type I+ Type II 18.07 9.22 8.44 7.75 7.95 9.62 6.15 7.82 7.47
Accuracy % 37.04 45.12 45.68 47.28 46.77 44.87 48.55 46.92 47.52
itEDAEVA Type I+ Type II 14.41 9.93 8.44 8.08 7.55 6.28 6.92 7.86 7.58
Accuracy % 39.72 43.78 44.55 44.72 45.82 47.74 46.99 45.16 45.72
Source: Authors investigation
Table-10. Performance Measures: Fourth Quarters Before a Failure (after 2008)
Cut-off.
0.1 0.2 0.3 0.4 0.5 0.6 0.7 0.8 0.9
itDAR Type I+ Type II 16.75 8.47 6.23 5.58 5.73 6.44 4.49 5.32 4.95
Accuracy % 40.35 47.16 48.75 50.76 49.97 48.28 52.07 51.08 51.36
itCR Type I+ Type II 13.69 7.85 5.72 5.62 6.72 6.71 5.51 5.67 4.47
Accuracy % 43.19 48.55 50.89 51.36 49.62 49.76 51.78 51.17 52.28
itQR Type I+ Type II 16.67 6.81 6.54 5.89 6.28 5.46 6.71 6.47 5.59
Accuracy % 40.05 49.52 49.78 51.48 50.38 52.02 49.62 50.19 51.77
itART Type I+ Type II 17.98 7.78 7.26 6.47 7.27 6.34 5.99 6.82 5.95
Accuracy % 39.24 48.16 48.66 49.87 48.47 50.07 51.18 49.76 51.42
itINVT Type I+ Type II 13.73 7.18 6.13 5.48 5.78 5.43 5.19 5.87 5.77
Accuracy % 42.55 49.72 50.64 51.89 51.18 52.08 52.28 51.06 51.32
itGE Type I+ Type II 11.94 6.64 6.08 5.91 6.53 6.69 5.78 6.43 5.77
Accuracy % 43.72 49.86 51.08 51.44 49.97 49.72 51.67 50.08 51.86
itCCL Type I+ Type II 14.78 7.08 6.16 5.76 5.39 5.73 5.11 4.73 5.69
Accuracy % 42.36 48.54 49.82 50.72 51.35 50.87 51.82 52.15 51.04
itUAEVA Type I+ Type II 15.34 7.49 6.32 5.45 4.38 3.69 4.51 5.75 5.37
Accuracy % 44.35 50.36 51.52 52.71 53.92 54.42 53.72 52.44 52.82
itAEVA Type I+ Type II 15.74 6.89 6.23 5.66 5.82 6.93 4.76 6.11 5.72
Accuracy % 39.91 47.96 48.45 51.12 49.92 47.52 51.78 48.77 50.93
itEDAEVA Type I+ Type II 12.55 7.41 6.23 5.89 5.53 4.55 5.29 6.14 5.77
Accuracy % 42.37 46.35 48.62 49.72 50.17 51.62 50.37 48.96 49.92
Source: Authors investigation
Views and opinions expressed in this article are the views and opinions of the authors, Asian Economic and Financial Review shall not
be responsible or answerable for any loss, damage or liability etc. caused in relation to/arising out of the use of the content.


![[ITU-ML5G-PS-036] Radio Link Failure Prediction](https://img.pdfslide.us/doc/110x75/6267997e6cfd3e6d654ad1f8/itu-ml5g-ps-036-radio-link-failure-prediction.jpg)