Embed Size (px)
Citation preview

Corporate Entrepreneurship and Organisational
Performance in the Information and
Communications Technology Industry
Thokozani Nkosi
A research report submitted to the Faculty of Commerce, Law and
Management, University of the Witwatersrand, in partial fulfilment of the
requirements for the degree of Master of Management in Entrepreneurship
and New Venture Creation
Johannesburg, 2011
(July 2011)

ABSTRACT
Corporate Entrepreneurship (CE) has long been recognised as a potentially viable
means for promoting and sustaining corporate competitiveness (Covin & Miles 1999).
Turbulence and rapidly changing knowledge - especially in the Information and
Communications Technology sector (ICT) - has forced companies to become more
entrepreneurial in order to capitalise on new business opportunities and to create value.
The research study was quantitative and data was collected through an online survey,
which used closed-ended questionnaires. The questionnaires entail assessing the degree
of CE in an organisation in relation to its performance. The analysis had 114 samples of
companies in the ICT sector.
The study indicated that there is a strong positive association between level of CE and
company performance. Companies that sustain their businesses and are able to prosper
are likely to have a high level of CE.
The most important contribution of this study is the testing of CE theories in the South
African context. The ICT managers can contribute to entrenching CE by being the
champions in creating the environment that stimulates entrepreneurial behaviour.

DECLARATION
I, Thokozani Nkosi, declare that this research report is my own work, except as
indicated in the references and acknowledgements. It is submitted in partial
fulfilment of the requirements for the degree of Master of Management in
Entrepreneurship and New Venture Creation in the University of the
Witwatersrand, Johannesburg. It has not been submitted before for any degree
or examination in this, or any other, university.
-------------------------------------------------------------
Thokozani Nkosi
Signed at Wits Business School, JHB
On the …………………………….. day of ………………………… 2011

ACKNOWLEDGEMENTS
I wish gratefully to acknowledge valuable contributions and input from the
following people and institutions. Without their assistance this study would not
have been possible:
Supervisor Dr Jose Barreira for his intellectual perspective and input on
the subject matter;
Lecturers from the Faculty of Commerce, Law and Management at Wits
Business School (WBS) for their willingness to assist and give sound
advice;
My classmates for their support and encouragement;
My wife and children for their assistance, patience, sacrifice and loyal
support;
My mother and brothers for their endless support and encouragement;
My late father for his strong belief in, and emphasis on, education and
self empowerment;
Respondents for sacrifices made and expert advice;
Bmicompanydata and ITWEB for their database used to make this
possible.
TO GOD BE THE GLORY!

TABLE OF CONTENTS
ABSTRACT ..................................................................................... 2
DECLARATION ............................................................................... 3
ACKNOWLEDGEMENTS ................................................................ 4
CHAPTER 1: INTRODUCTION ..................................................... 8
1.1 PURPOSE OF THE STUDY ............................................................................ 8
1.2 PROBLEM STATEMENT ................................................................................ 9
1.3 SIGNIFICANCE OF THE STUDY .................................................................... 10
1.4 DELIMITATIONS OF THE STUDY................................................................... 11
1.5 DEFINITION OF TERMS .............................................................................. 12
1.6 ASSUMPTIONS ......................................................................................... 13
2 CHAPTER 2: LITERATURE REVIEW ............................. 14
2.1 INTRODUCTION ........................................................................................ 14
2.2 CORPORATE ENTREPRENEURSHIP DEFINITION ........................................... 15
2.3 CORPORATE ENTREPRENEURSHIP............................................................. 17
2.4 DIMENSIONS OF CORPORATE ENTREPRENEURSHIP ..................................... 20 2.4.1 RISK TAKING ........................................................................................................ 21 2.4.2 INNOVATION ......................................................................................................... 23 2.4.3 PRO-ACTIVENESS ................................................................................................. 25 2.4.4 ENTREPRENEURIAL CULTURE ................................................................................ 27
2.5 WHY ORGANISATIONS NEED CORPORATE ENTREPRENEURSHIP ................... 29
2.6 CORPORATE ENTREPRENEURSHIP BARRIERS AND TRIGGERS ...................... 33
2.7 ORGANISATIONAL PERFORMANCE ............................................................. 37
2.8 CONCLUSION OF LITERATURE REVIEW ....................................................... 40
CHAPTER 3: RESEARCH METHODOLOGY ............................. 41
3.1 RESEARCH METHODOLOGY/PARADIGM ...................................................... 42
3.2 RESEARCH DESIGN .................................................................................. 42
3.3 POPULATION AND SAMPLE......................................................................... 43 3.3.1 POPULATION ........................................................................................................ 43 3.3.2 SAMPLE AND SAMPLING METHOD ........................................................................... 43
3.4 THE RESEARCH INSTRUMENT .................................................................... 44
3.5 PROCEDURE FOR DATA COLLECTION .......................................................... 46
3.6 DATA ANALYSIS AND INTERPRETATION ....................................................... 46

3.6.1 DESCRIPTIVE STATISTICS ......................................................................... 47
3.6.2 ANALYSIS OF VARIANCE (ANOVA) ............................................................ 48
3.6.3 MULTIVARIATE ANOVA ............................................................................ 49
3.6.4 DEGREE OF ASYMMETRY (SKEWNESS) ...................................................... 50
3.6.5 CHI-SQUARE TEST ................................................................................... 51
3.6.6 SCHEFFE TEST ......................................................................................... 51
3.6.7 PERFORMANCE ........................................................................................ 52
3.6.8 BOX & WHISKER PLOT ............................................................................. 53
3.7 LIMITATIONS OF THE STUDY ....................................................................... 53
3.8 VALIDITY AND RELIABILITY ........................................................................ 54
3.9 VALIDITY ................................................................................................. 55
3.10 RELIABILITY ............................................................................................. 56
CHAPTER 4: PRESENTATION OF RESULTS ........................... 56
4.1 INTRODUCTION ........................................................................................ 56
4.2 DEMOGRAPHIC PROFILE OF COMPANIES ..................................................... 58
4.2.1 COMPANY SIZE ........................................................................................ 58
4.2.2 COMPANY AGE ........................................................................................ 59
4.3 THE INDEPENDENT VARIABLES USED IN THE RESEARCH: METRIC SCALES ....... 59
4.4 THE DEPENDENT VARIABLES USED IN THE RESEARCH: NON-METRIC SCALES .. 60
4.5 RESULTS PERTAINING TO THE MULTIVARIATE HYPOTHESIS ........................... 66
4.6 RESULTS PERTAINING TO THE UNIVARIATE HYPOTHESES .............................. 67
4.7 SUMMARY OF THE RESULTS ...................................................................... 72
CHAPTER 5: DISCUSSION OF THE RESULTS ......................... 73
5.1 INTRODUCTION ........................................................................................ 73
5.2 DEMOGRAPHIC PROFILE OF COMPANIES ..................................................... 73
5.4 MULTIVARIATE TEST ................................................................................. 76
5.5 DISCUSSION PERTAINING TO HYPOTHESIS H1A ........................................... 76
5.6 DISCUSSION PERTAINING TO HYPOTHESIS H1B ........................................... 79
5.7 DISCUSSION PERTAINING TO HYPOTHESIS H1C .......................................... 82
5.8 DISCUSSION PERTAINING TO HYPOTHESIS H1D .......................................... 84
5.9 CONCLUSION ........................................................................................... 86
CHAPTER 6: CONCLUSIONS AND RECOMMENDATIONS ....... 88
6.1 INTRODUCTION ........................................................................................ 88
6.2 CONCLUSIONS OF THE STUDY ................................................................... 88

6.3 RECOMMENDATIONS ................................................................................ 89
6.4 SUGGESTIONS FOR FURTHER RESEARCH ................................................... 90
REFERENCES .............................................................................. 91
APPENDIX A ................................................................................. 97
APPENDIX B ............................................................................... 105
APPENDIX C ............................................................................... 106

CHAPTER 1: INTRODUCTION
1.1 Purpose of the study
The purpose of this research study is to find the link between Corporate
Entrepreneurship (CE) and organisational performance in Information and
Communication Technology (ICT) companies operating in South Africa.
Organisations in the ICT industry require sustainable business performance and
this may be achievable through innovation, risk taking, pro-activeness and
entrepreneurially orientated behaviour (Miller 1983; Covin and Miles 1995;
Moreno and Casillas 2008; Wiklund 2009; Wakkee, Elfring, & Monaghan 2010).
The research investigates the relationship between corporate entrepreneurship
(innovation, risk taking, pro-activeness, and entrepreneurial culture) and
company performance. The company performance is evaluated based on
financial and non-financial measures.
Finally, the results give a solid conclusion on how these two constructs
(corporate entrepreneurship and company performance) relate to each other.
The recommendations to senior executives, directors and management are
depicted and they are aimed at giving direction and guidelines on which parts of
corporate activities ICT companies need to focus on in order to become more
entrepreneurially orientated. Entrepreneurial behaviours and attitudes are key
determinants of the ability of large companies to survive and prosper in
turbulent environments (Lumpkin and Dess 1996).

1.2 Problem statement
Corporate Entrepreneurship (CE) has long been recognised as a potentially
viable means for promoting and sustaining corporate competitiveness (Covin &
Miles 1999). As ICT in South Africa is facing rapid technological changes,
corporates need a strategy for competitive advantage and sustainability.
Entrepreneurial behaviour by management and employees could lead to
competitive advantage and sustainability (Zahra and Miles 1995; Landstrom,
Crijns, Lavern, and Smallbone 2008).
However, the link between corporate entrepreneurship and organisational
performance in the ICT environment is unclear from previous research. Thus, if
entrepreneurship is to be used by ICT companies as a strategy for survival, it is
critical that this link be empirically investigated in the context of this industry.
Very little in-depth research regarding Corporate Entrepreneurship has been
undertaken in the ICT context. Few studies have empirically researched this
relationship in the South African context, especially in the ICT sector.

1.3 Significance of the study
The study fills a gap as there have been very few studies of the relationship
between corporate Entrepreneurship and organisation performance in
Information and Communications Technology in the South African context.
The study will provide guidance to ICT companies operating in South Africa on
which factors to focus on in order to entrench entrepreneurial behaviour within
the organisation. The study results could be used by management to instil
entrepreneurship in the corporate environment. Organisations could also use
this empirical research study to promote an entrepreneurial culture to
employees. This could impact organisational performance and business
sustainability.
The Information and Communications Technology industry will be able to
benchmark their degree of entrepreneurship against other market players
through the results analysis of this research. Company managers could utilise
this study to encourage their staff to be involved in calculated risk-taking by
encouraging bold actions and trying out new ideas. In this way, managers will
act as shock absorbers when subordinates’ new ideas fail.
The study will add value to the South African Information and Communications
Technology industry’s operation and future growth by outlining the basic key
requirements for companies to practise corporate entrepreneurship and improve
their performance.

1.4 Delimitations of the study
The study focuses on the relationship between Corporate Entrepreneurship and
company performance in the South African Information and Communications
Technology industry (ICT). The company size, ranging from small to large as
defined by DTI, is used and the focus is on ICT companies operating in South
Africa.
The research study targets respondents at management level (such as
directors, executives and senior managers) because they have information on
the organisational performance trends, corporate entrepreneurship dimensions
and performance measures. The study only requires one response per
company.
The online survey intends to capture responses all over South Africa and this
has been made easier by sending emails using the Surveymonkey website. The
study uses both listed and non-listed companies. The sampling frame only
includes ICT companies on the ITWEB site and bmicompanydata database.
The research methodology used is:
Quantitative;
Cross-sectional study;
Using Descriptive data and Multivariate inferential stats;
Using Convenience sample – because of easy access to the ICT data.

1.5 Definition of terms
Certain terms will be used repeatedly in the study and thus need to be defined.
Corporate Entrepreneurship (CE): is the entrepreneurial behaviour inside
established mid-sized and large organisations (Morris, Kuratko and Covin
2008). Zahra and Garvis (2000) define Corporate Entrepreneurship as the sum
of a company’s efforts aimed at innovation, pro-activeness and risk taking.
Lumpkin and Dess (1996) have noted that CE can be used to enhance
company performance by promoting product and process innovation. At any
rate, corporate entrepreneurship allows an incumbent company to make full use
of its resources to capture new opportunities (Yiu and Lau 2008).
Intrapreneurship: is a concept used to explain entrepreneurial activities in
existing organisations (Agca, Topal, and Kaya 2009). They emphasise that,
tthrough intrapreneurship, companies also maintain and increase their
sustainable competitive capabilities, which are fostered by different areas of
organisational performance.
Entrepreneurial orientation (EO): Covin, Green and Slevin (2006) described
entrepreneurial orientation as the presence of a firm’s strategy - oriented
towards innovation and growth through their capacity to assume relevant risks.
Lumpkin and Dess (1996) define EO as the process, practices and decision-
making activities that lead to new entry, innovation, risk taking, pro-activeness
and entrepreneurial behaviour. EO leads to autonomy and competitive
aggressiveness.
Terms such as Corporate Entrepreneurship or Intrapreneurship and firm-level
entrepreneurial orientation have been used for describing the entrepreneurial
activities of an organisation (Agca, Topal, and Kaya 2009).

Although these terms are being used interchangeably, this study is using the
definition of CE based on the Zahra and Garvis explanation.
1.6 Assumptions
The study assumes that respondents have an understanding of the construct
Corporate Entrepreneurship. It assumes respondents have a meaningful
understanding of the words entrepreneurial culture. The knowledge around
entrepreneurial behaviour by the organisation is assumed to be understood by
executives, directors and senior management.
The study also assumes that the potential respondents understand the
company performance trends and performance measures such as Return On
Assets, Return On Investments, Sales Growth, Market Value Growth, Return
On Equity, Return On Sales and Operating Profit.

2 Chapter 2: Literature review
2.1 Introduction
In this study, the literature review outlines the structure and contents of the
previous research studies around Corporate Entrepreneurship. This chapter
gives a definition of corporate entrepreneurship based on the previous
researchers. The characteristics and elements of CE will be explained broadly.
The corporate entrepreneurship triggers and inhibitors are discussed as they
can either enable, or discourage, CE in an organisation.
The existing literature on entrepreneurship has implicitly stated that Corporate
Entrepreneurship and company performance are positively related to each other
(Moreno and Casillas 2008). Currently, there has not been a consensus on the
direct definition of corporate entrepreneurship. Different definitions of CE are
extracted from the previous research documents. As the field of study grows,
relevant topics consulted in this subject often fall under the following headings:
Entrepreneurial orientation, Strategic entrepreneurship, corporate business
venturing, Conceptualising CE, Contextualising CE, Entrepreneurial
environments and sustaining entrepreneurship. In this study, corporate
entrepreneurship and intrapreneurship are being used interchangeably.
In South Africa there has not been much research done to test empirically the
relationship between corporate entrepreneurship and company performance in
the Information and Communication Industry (ICT). The research uses the ICT
industry to collect data information. In this section, the literature review is
divided into sub-headings:
Corporate entrepreneurship definition;

Corporate entrepreneurship;
Dimensions of Corporate Entrepreneurship;
Why organisations need CE;
Corporate Entrepreneurship barriers and triggers;
Organisational Performance.
The key definition of Corporate Entrepreneurship includes innovation, venture
creation, business venturing, risk taking, pro-activeness, opportunity recognition
and market development (Miller, 1983; Morris et al 2008; Wang 2008).
2.2 Corporate Entrepreneurship Definition
Corporate Entrepreneurship (CE) has long been recognised as a potentially
viable means for promoting and sustaining corporate competitiveness (Covin
and Miles, 1999). Corporate Entrepreneurship is a term used to describe
entrepreneurial behaviour inside established mid-sized and large organisations
(Morris et al 2008). CE refers to a scenario where the entire company, rather
than individuals, acts entrepreneurially (Covin and Miles, 1999).
Zahra and Garvis (2000) define Corporate Entrepreneurship as the sum of a
company’s efforts aimed at innovation, pro-activeness and risk taking. These
efforts offer an important means of revitalising and renewing established
companies and improving their performance.
Agca et al (2009) classified intrapreneurship as two approaches:
entrepreneurial orientation and corporate entrepreneurship. In the literature,
researchers and academics have used different terms to define entrepreneurial

efforts in organisations and the differences in terminology in defining
entrepreneurial activities still continue (Agca et al 2009).
Agca et al (2009); Dess et al (1999) and Lumpkin and Dess (1996) define CE
as a process in which individuals in an existing organisation seek for the
opportunities by, developing and venturing into new businesses.
Vozikis, Bruton, Prasad and Merikas (1999) defined corporate entrepreneurship
as additional value creation. This additional value creation occurs within the
established organisation. The value can be realised through adding new
products and services. Moreover, this could be achieved by improving the
current products and optimisation of processes.
Ireland et al (2009), state that Entrepreneurial Orientation is an organisational
state or quality that is defined in terms of several behavioural dimensions.
These dimensions are found on most levels of the structure of an organisation.
Management should be in a state to drive and align the organisational
behaviour to their strategic objectives. Miller (1983); Covin and Slevin (1991)
define Entrepreneurial Orientation (EO) as the presence of organisational
behaviour reflecting risk-taking, pro-activeness, and innovativeness. The
intensity of EO in an organisation can be associated to the overall company
performance over a certain period of time. The increase in performance does
not often happen overnight, but rather over a long period.

2.3 Corporate Entrepreneurship
Corporate entrepreneurship has been studied by different authors before
(Sebora, and Theerapatvong 2009; Ireland et al 2009; Zahra and Covin, 1995;
Lumpkin and Dess 1996; Venter et al 2008). Most of these studies were
attempting empirically to test the influence of corporate entrepreneurship on
company performance and sustainability. Sebora and Theerapatvong (2009)
have suggested that large companies tend to experience difficulties in
employing corporate entrepreneurship in their management and employees;
and this is often caused by a bureaucratic environment.
According to Sebora and Theerapatvong (2009), companies need continuous
innovation, risk taking, and pro-activeness in order to stay competitive. The
presence of Corporate Entrepreneurship among company managers leads to
positive outcomes (Ireland et al 2009). Top managers need to have an
entrepreneurial strategy and be able to cascade this through different levels
within the company.
Corporate Entrepreneurship may be viewed broadly as consisting of two types
of phenomena and processes: firstly, the birth of new business within existing
organisations - whether through internal innovation or joint ventures/alliances;
and, secondly, the transformation of organisations through strategic renewal, for
example the creation of new wealth through a combination of resources (Dess,
et al 1999).
Wiklund (1999) has studied the impact of corporate entrepreneurship on
company performance and the findings showed a positive relationship. In
Wiklund (1999), the survey results showed a strong relationship over time,
which meant that the corporate entrepreneurship is effective within the
organisation over a certain period. Zahra and Garvis (2000) found that

corporate entrepreneurship is positively associated with company performance.
In the study by Zahra and Garvis (2000), it was found that one corporate
entrepreneurship dimension - innovation - had a more positive relationship with
company performance, especially in a company that is international. The
company that innovates a lot tends to be more entrepreneurially- oriented than
the one that does it seldom (Zahra and Garvis 2000). These companies have a
culture that allows individuals within the organisation to act autonomously and
to be able to suggest new ideas that can lead to efficiency of operations.
Through intrapreneurship, companies also maintain and increase their
sustainable competitive capabilities, which are fostered by different areas of
organisational performance (Agca et al 2009). Ireland et al (2009) believe that a
corporate entrepreneurship strategy is manifested through the presence of
three elements, which are: entrepreneurial strategic vision, a pro-
entrepreneurship organisational architecture and entrepreneurial processes and
behaviour.
Corporate entrepreneurship is an important predictor of company growth
(Venter et al 2008). Lumpkin and Dess (1996) also found that EO is a key
element for organisational success and improved performance. Many
organisations attribute their success to an Entrepreneurial Orientation (Lumpkin
et al 2009). They stated that organisations that rely on an EO to create new
value and growth must make an effort to foster entrepreneurial behaviour. The
entrepreneurial behaviour allows teams to operate outside an organisation’s
existing norms.
Entrepreneurial orientation, company rejuvenation and strategic renewal form
part of corporate entrepreneurship (Miles et al 2009). Corporate
entrepreneurship can be used to improve competitive advantage and to
reposition the company in the market (Lumpkin & Dess 1996; Ireland et al
2009).
Ireland et al (2009) stated that Entrepreneurial Orientation is an organisational
state or quality that is defined in terms of several behavioural dimensions. Miller
(1983), Covin and Slevin (1991) defined Entrepreneurial Orientation as the
presence of organisational behaviour reflecting risk taking, pro-activeness and
innovativeness. The company that embraces corporate entrepreneurship is said
to be entrepreneurially- orientated. An EO keeps companies alert by exposing
them to new technologies, making them aware of marketplace trends and
helping them to evaluate new possibilities (Lumpkin et al 2009).
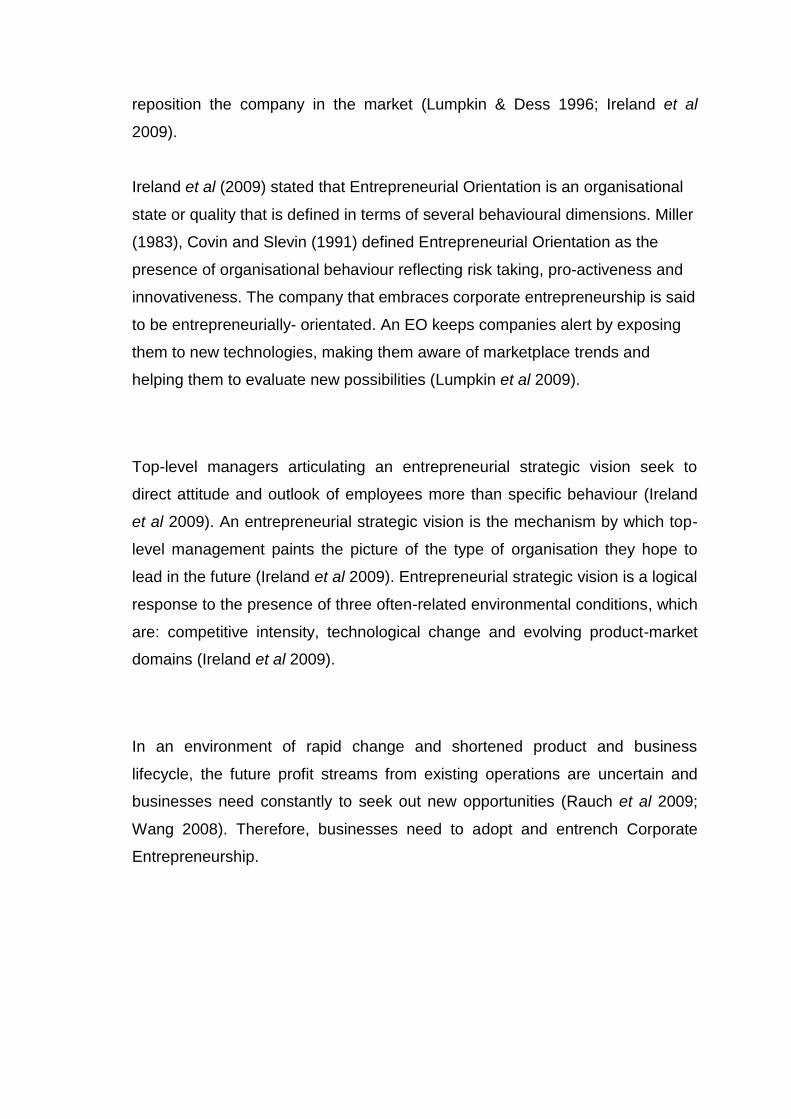
Top-level managers articulating an entrepreneurial strategic vision seek to
direct attitude and outlook of employees more than specific behaviour (Ireland
et al 2009). An entrepreneurial strategic vision is the mechanism by which top-
level management paints the picture of the type of organisation they hope to
lead in the future (Ireland et al 2009). Entrepreneurial strategic vision is a logical
response to the presence of three often-related environmental conditions, which
are: competitive intensity, technological change and evolving product-market
domains (Ireland et al 2009).
In an environment of rapid change and shortened product and business
lifecycle, the future profit streams from existing operations are uncertain and
businesses need constantly to seek out new opportunities (Rauch et al 2009;
Wang 2008). Therefore, businesses need to adopt and entrench Corporate
Entrepreneurship.

2.4 Dimensions of Corporate Entrepreneurship
The Corporate Entrepreneurship dimensions include activities such as
innovation, risk taking, pro-activeness, new product development, new business
venturing, autonomy, competitive aggressiveness, self-renewal and strategic
renewal (Miller 1983; Lumpkin and Dess 1996; Wiklund 1999; Covin and Miles
1999; Zahra and Garvis 2000; Ireland et al 2009; Agca et al 2009).
Miller (1983) suggested that a company’s degree of entrepreneurship could be
seen by the extent to which they innovate, take risks and act proactively. The
company that is entrepreneurially-orientated is seen to be practising corporate
entrepreneurship, which includes the aforementioned characteristics (Miller
1983). Self-renewal or strategic renewal is widely defined as the periodic
transformation of organisations through the renewal of key ideas and resources
on which organisations are built (Zahra and Covin 2005). Self-renewal activities
include redefinition of a company’s vision, mission, business concept;
reorganisation of activities and the introduction of system-wide changes for
innovation (Agca et al 2009). The articulation of the vision and strategic
direction by management at all levels in the organisation are crucial, especially
when the company implements some changes to their way of doing business.
Venturing activities emphasise the creation of new businesses by entering new
foreign markets and expanding in existing ones (Zahra and Garvis 2000).
According to Zahra and Garvis (2000) venturing can increase a company’s
knowledge base, which increases the innovativeness of a company’s products
and strategy. This study only focuses on four dimensions of corporate
entrepreneurship, which are: innovation, risk taking, pro-activeness, and
entrepreneurial culture.

According to Covin and Miles (1999), innovation is at the centre of a network
that encompasses the constructs of corporate entrepreneurship. Therefore the
label entrepreneurial should be applied to companies that are innovative.
Having said that, they also believe that some element must exist in conjunction
with innovation in order for a company to claim an entrepreneurial orientation;
and such elements are sustainable high performance, or improving competitive
position. Lumpkin et al (2009) have studied autonomy as the key characteristic
of Entrepreneurial Orientation and they concluded that this element can help the
organisation to foster corporate entrepreneurship. These authors have
considered autonomy as a driver that encourages innovation, promotes the
launching of entrepreneurial ventures and increases the competitiveness and
effectiveness of the company.
2.4.1 Risk taking
Risk taking involves taking bold actions by venturing into the unknown,
borrowing heavily and/or committing significant resources to ventures in
uncertain environments (Wang 2008; Lumpkin et al 2009; Rauch et al 2009).
Zahra and Garvis (2000) define risk taking as a company’s disposition to
support innovative projects, even when the payoff from these activities is
uncertain. Subsequently these activities can enhance the company’s ability to
recognise and exploit market opportunities ahead of its competitors.
Autonomy within the entrepreneurial organisation allows individuals to act freely
and be able to explore new ideas (Lumpkin et al 2009) that can create
competitive advantage. This type of behaviour by individuals within the firm
brings about the possibility of acting on potential ideas for the future growth of
the firm. The behaviour of managers by insisting on following the tried-and-
tested paths or tending to support only projects with expected returns that are
certain, have a negative relation to performance as compared to taking bold

actions by entering the unknown business environment (Lumpkin and Dess
1996). Thus, the support by senior management within the organisation allows
for individuals to take calculated risks.
Entrepreneurial firms are risk-tolerant and this characteristic often stimulates
them to eliminate the kind of traditional authoritarian structures that inhibit
collaborative learning (Wang 2008). These firms allow individuals and teams to
act independently and exercise their creativity by taking risks in coming up with
new ideas (Lumpkin and Dess 1996). According to Miller (1983) and Wang
(2008) risk-tolerant and innovative firms’ managers encourage new ways of
thinking - tolerating mistakes and rewarding individuals with new ideas that
contribute to innovation and business improvement. The culture of allowing
individuals to making mistakes when trying new ways of improving business
performance promotes a sense of open-mindedness (Moreno and Casillas
2008).
The above discussion leads to the following hypothesis:
H1a: Risk taking is positively related to company performance

2.4.2 Innovation
Innovativeness reflects a firm's tendency to engage in, and support, new ideas,
uniqueness, experimentation and creative processes that may result in new
products, services, or technological processes (Clark 2010; Lumpkin and Dess
1996). Innovative firms have capabilities to monitor the market changes and
respond quickly, thus capitalising on emerging opportunities (Wiklund, 1999).
According to Huse et al (2005), firms operating in turbulent environments are
often characterised by rapid and frequent new product creation and high levels
of research and development. Such environments appear to play a crucial role
in influencing corporate entrepreneurship in an organisation. Environmental
changes stimulate firms to innovate by introducing new technologies, new
products, service and processes to take advantage of opportunities arising from
the dynamic environment (Huse et al 2005). Environmental change can cause
the firm to search for new means to remain competitive, which foster process
innovation activities. Innovation keeps firms ahead of their competitors, thereby
gaining a competitive advantage that leads to improved financial results
(Wiklund, 1999).
Zahra and Garvis (2000) define innovation as the firm’s ability to create new
products and successfully introduce them to the market. Innovation also revises
the firm’s knowledge base, allowing it to develop new competitive approaches,
which can be exploited in new foreign markets to achieve growth and
profitability (Zahra and Garvis, 2000). Clark (2010) found that companies that
are clearly innovators based their focus on new innovations, the number of new
innovations and levels of investment in new innovations.
Venter et al (2008) state that: “At the centre of entrepreneurship is
innovativeness”. An organisation that innovates is classified as being

entrepreneurial. Entrepreneurial activities influence a company’s commitment to
innovation (Miller 1983; Lumpkin and Dess 1996) by offering innovative
products and processes. According to Huse et al (2005), innovation has
become a source of international competitive advantage.
Zahra and Garvis (2000) stated that innovation can also lead to the
development of key capabilities that can improve a firm’s performance. They
also put emphasis on the fact that innovation generates products, goods,
processes, services and systems that can be used to meet customer needs and
build a strong market position. Thus innovation can improve the firm’s
profitability and fuel its growth. Better profitability and sustainability are also
realised from continuous innovation by the entrepreneurial organisation. Huse
et al (2005) stated that innovation can be distinguished in three ways: the
development of new products and services, the adoption of new technologies
with an intention to improve production methods, the establishment of novel
organisational structures and administrative systems.
Innovation involves reinventing products in a profitable manner (Venter et al
2008). The level of entrepreneurial behaviour by the organisation allows the
company constantly to evaluate the potential possible business opportunities
that will bring growth and sustainable business (Lumpkin and Dess 1996).
Innovation can be forced by industrial factors (fast technology changes in the
industry, customer demands), environmental dynamism (new processes,
technology) and international activities such as international diversification
(Huse et al 2005). According to Lumpkin and Dess (1996), a level of
expenditure and a number of resources dedicated to research and development
represent a firm’s involvement in innovation activities. Innovation stimulates
firms to behave entrepreneurially. According to Venter et al (2008, most
technological firms use innovation to achieve objectives such as:

Maximum profits;
Gaining market share;
Creating niche markets;
Adding value for stakeholders.
The above discussion leads to the following hypothesis:
H1b: Innovation is positively related to company performance
2.4.3 Pro-activeness
Pro-activeness shows a firm’s aggressive pursuit of market opportunities and a
strong emphasis on wanting to be among the very first to implement innovation
in its industry (Rauch et al 2009). Pro-activeness is an opportunity-seeking,
forward-looking perspective characterised by the introduction of new products
and services ahead of the competitors and acting in anticipation of future
demand (Lumpkin and Dess 1996; Rauch et al 2009). Miller (1983) defines pro-
activeness as an indication of a company’s determination to pursue promising
opportunities, rather than merely responding to competitors’ moves. According
to Lumpkin and Dess (1996), pro-activeness refers to how a firm relates to
market opportunities in the process of new entry. They added that pro-
activeness involves pursuing opportunities and the will to respond aggressively
to competitors.
Wiklund (1999) stated that pro-activeness gives firms the ability to present new
products or services to the market ahead of competitors, which also gives them
a competitive advantage. Pro-active firms have a greater tendency to lead than
to follow in the development of new procedures and technologies and the
introduction of new products and services (Lumpkin and Dess 1996). An

entrepreneurial firm instils flexibility and grants individuals and teams the
freedom to exercise their creativity to champion new ideas (Wang 2008). These
activities by the firm’s team enable the firm to be more pro-active in introducing
new products. Pro-activeness suggests an emphasis on initiating activities. It is
closely related to innovativeness. For example, new product innovation is part
of innovativeness but also forms part of pro-activeness by the firm (Lumpkin
and Dess 1996).
According to Lumpkin and Dess (1996), the importance of being a first-mover or
pioneer has been frequently emphasised in the entrepreneurial process since
Schumpeter. Proactive firms are likely to be first-movers when they face threats
and/or opportunities in their environment (Agca et al 2009). In the business
world, proactive firms tend to be leaders, rather than followers of other
corporations (Lumpkin and Dess, 1996).
According to Zahra and Garvis (2000), proactive corporate entrepreneurship,
such as first entry, can improve a firm’s performance. The first entrants tend to
exploit opportunities before their rivals and enjoy significant strategic advantage
in the markets (Zahra and Garvis, 2000). Consequently, pro-activeness can be
conducive to a company’s performance improvement.
The above discussion leads to the following hypothesis:
H1c: Pro-activeness is positively related to company performance

2.4.4 Entrepreneurial culture
Entrepreneurial culture is a pattern of basic assumptions invented and designed
to assist people to learn to cope with the problems of external adaptation and
internal integration (Morris et al 2008; Covin and Miles 1999).
Rauch et al (2009) suggested that the influence of corporate entrepreneurship
on business performance may vary as a function of cultural norms. Venter et al
(2008) differentiate between entrepreneurial culture and corporate culture. In
their differentiation they define corporate entrepreneurship culture as the polar
opposite of a conservative corporate culture. The corporate culture is one which
celebrates caution and conformity, convention, protocol, rules and procedures
(Venter et al 2008). “The culture that allows individuals to bring new ideas and
tolerate risk is a key element of sustainable business performance” (Wang
2008). Entrepreneurial culture stimulates innovation, flexibility and performance
(Lumpkin and Dess 1996). Entrepreneurship should be encouraged in an
organisation by creating an appropriate entrepreneurial culture and fostering an
entrepreneurial climate (Venter et al 2008).
Entrepreneurially- oriented companies establish clear and meaningful core
values and ensure they are shared within the organisation (Morris et al 2008).
Entrepreneurial organisations are guided by their vision. Firms successful at a
sustained form of corporate entrepreneurship tend to have cultures and
systems supportive of innovation (Covin and Miles 1999).
An entrepreneurial organisation empowers its people and gives them freedom
to decide and act by devolving decision-making authority (Morris et al 2008;
Wang 2008). They found that culture is an important controlling instrument for
corporate entrepreneurship, because it provides a space for taking risks and a
certain degree of immunity from failure.

A favourable company culture encourages employees to try out new ideas,
even if they fail. The belief is that mistakes can be learned from. .
Entrepreneurship culture encourages learning through information sharing,
commitment and accountability (Morris et al 2008). As innovation is a key
element of corporate entrepreneurship, it can be influenced by cultural factors
and/or differences in the market structures of different countries (Huse et al
(2005).
Zahra, et al (1999) believed that the culture that reinforces communication and
sharing of knowledge within the organisation is a crucial element of success in
encouraging the implementing of new ideas. Sub-cultures exist in an
organisation, with each culture having its dominant values and assumptions
(Zahra et al 1999). They concluded that understanding the key values of these
cultures and recognising the key powerful elements within them can lead to
successful innovations. Entrepreneurial firms are more prone to having a
market-driven culture by constantly updating, improving and changing business
processes, products and services that eventually create more value for
customers (Agca at al 2009).
As mentioned earlier, core values are critical for the entrepreneurial culture to
be successful. A meaningful level of entrepreneurship cannot be sustained
over time unless entrepreneurship is reflected in the core values of the firm
(Morris et al 2008; Zahra et al 1999). Culture has many elements, but there are
some aspects that are more conducive to entrepreneurial culture than others.
The following are the elements that form part of the entrepreneurial culture
(Morris et al 2008):
Focus on people and empowerment;

Value creation through innovation and change;
Attention to the basics;
Hands-on management;
Doing the right thing;
Freedom to grow and fail;
Commitment and personal responsibility;
Emphasis on the future and a sense of urgency.
According to Morris et al (2008) these core values are embedded in the life-
blood of the entrepreneurial organisation. They found that employees in the
entrepreneurial firm strive for major achievement and always want their
organisation to prosper. Based on the above discussion, the following
hypothesis is formed:
H1d: Entrepreneurial Culture is positively related to company
performance.
2.5 Why organisations need Corporate Entrepreneurship
Some of the challenges facing South Africa are to develop sustainable
economic growth, to improve its international competitiveness and to build the
country’s capacity for innovation, especially in the Information and
Communication Technology sector because there is fast technological
development in this sector. Venter et al (2008) mentioned that, throughout the
world, environmental change is accelerating at national, industrial and
organisational levels. So this means that, in order for South Africa to sustain
economic growth, corporate entrepreneurship at organisational and/or industrial
level should be encouraged and entrenched.

Emerging global markets and rapid technological developments make strong
demands on the ability of companies to develop and utilise their resources
(Huse et al 2005). By being involved in corporate entrepreneurship, companies
can absorb these pressures and prosper. It has been said that corporate
entrepreneurship has a positive impact on a company’s performance (Covin
and Miles 1995; Moreno and Casillas 2008; Wiklund 2009; Wakkee et al 2010).
This view implies that organisations that practise entrepreneurship are able to
increase their results, which can then lead to an increase in the South African
Gross Domestic Production (GDP). Increased performance at the industrial
level positions the country more competitively in relation to other countries.
Innovation is imperative as part of corporate entrepreneurship and is pertinent
in South Africa, especially in the e-business arena. E-business is seen as
information exchanges, commercial or administrative transactions between
individuals, businesses and government that take place via Information and
Communication Technology (ICT) based computer-mediated networks. Ireland,
et al (2009), state that corporate entrepreneurship can be used to improve
competitive advantage and to reposition the company in the market. For
companies to realise more output and growth, they need to instil
entrepreneurship in their business environment. Entrepreneurial activities help
companies to develop new businesses that create revenue streams and these
activities also enhance the company’s success by promoting product and
process innovation (Zahra et al 1999). According to Miller (1983), these
Corporate Entrepreneurship activities embody risk taking, pro-activeness and
radical product innovations.
Previous studies have theorised that the incidence of entrepreneurial
behaviours in a company will be positively associated with organisational
profitability and growth (Miller 1983; Zahra and Covin 1995; Lumpkin and Dess
1996; Wiklund, 1999; Venter et al 2008; Ireland et al 2009; Kreiser and Davis
2010). These authors have proven that the high level of entrepreneurial

behaviour within an organisation leads to high levels of performance and
profitability. Most of these studies had emphasised key elements which needed
to be entrenched in entrepreneurial companies in order for them to be classified
as entrepreneurial.
The study by Agca et al (2009) has confirmed that intrapreneurship activities
have a positive and significant impact on profitability in terms of innovation and
risk taking. According to Wang (2008), entrepreneurial behaviour is a key
ingredient for a company’s success. Entrepreneurial behaviour tends to be
associated with higher growth and this behaviour is a result of innovation, risk
taking and pro-activeness (Moreno and Casillas 2008).
Covin and Miles (1999) put corporate entrepreneurship as the spark and
catalyst that is intended to place firms on the path to competitive superiority and
to keep them in competitive advantageous positions. Through corporate
entrepreneurship, firms are able to rejuvenate, redefine and reposition
themselves (Miller 1983; Covin & Miles 1999; Miles et al 2009).
Through intrapreneurship, firms also maintain and increase their sustainable
competitive capabilities, which are fostered by different areas of organisational
performance (Agca et al 2009). The level of top management involvement in
ensuring information flow and aligning different divisions in strategic directions
allows them to foster intrapreneurship with great understanding. Entrepreneurial
firms that are first-movers incur the greatest business and financial risk and
spend the most on innovative activities, but are always rewarded in the
marketplace (Dess et al 1999). On the other hand, some firms may enjoy long-
term benefits from imitation strategy rather than from a high level of
innovativeness (Dess et al 1999).

Through intrapreneurship, companies are able re-engineer internal processes
and procedures to secure efficiencies. In this way, they become more
competitive (Venter et al 2008). Organisations that take entrepreneurship
seriously are seen to perform better and able to sustain their businesses. In the
study by Barrett & Weinstein (1998), the Cronbach’s Alpha of 0.84 was found
when evaluating the level of Corporate Entrepreneurship (CE) and company
performance. Based on their findings, there is a strong relationship between CE
and company performance. In contrast to that, Lumpkin and Dess (1996) argue
that examining Entrepreneurial Orientation does not give a true picture of the
relationship between CE and company performance if the external
environmental factors are not investigated.
Lumpkin and Dess (1996) also found a company could more easily adapt to
fast-changing business environments if it embraced Corporate
Entrepreneurship or entrepreneurial behaviour. Wang (2008) stated that an
entrepreneurial company is one that engages in product-market innovation,
undertakes some risky ventures and is first to come up with proactive
innovation, beating the competitors (pro-active). Such characteristics indicate
that the company has a certain degree of corporate entrepreneurship. Wang
(2008) added that these characteristics are associated with improved firm
performance in today’s business environment, where product and business
model life-cycles are shortened. The future profits stream from existing
operations, but are uncertain. Businesses need constantly to seek out new
opportunities that will give them a competitive advantage and lead to
sustainability. Based on the results findings of the study by Agca et al (2009), it
is suggested that intrapreneurship activities in existing organisations generally
improve firm performance in financial and non-financial dimensions. Wiklund
(1999) found that firms that practise Corporate Entrepreneurship perform better.
These firms position themselves in the market and are ready to act in a
turbulent environment. According to the conclusion by Lumpkin et al (2009),
these companies emphasise a conceptualisation of Corporate Entrepreneurship
with clearly defined sub- dimensions. .

The above discussion leads to the formulation of the following hypothesis:
H1: Corporate Entrepreneurship dimensions are positively related to
company performance in the ICT industry.
2.6 Corporate Entrepreneurship Barriers and Triggers
Intensifying global competition, corporate downsizing rapid technological
progress and many other factors have heightened the need for organisations to
become more entrepreneurial in order to survive and prosper (Dess et al 1999;
Huse et al 2005; Venter et al 2008). Companies operating in this type of
environment have to be more innovative so that they can absorb these
pressures.
The environment in which the organisations operate can be a source of
corporate entrepreneurship (Huse et al 2005). Because the environment is
complex and volatile, long-term competitiveness requires organisations to be
open to signals regarding current and future conditions of the environment and
to apply this knowledge to change their own behaviour and position themselves
in the market. Previous studies have found that environmental dynamism
encourages entrepreneurial behaviour and innovation (Huse et al 2005; Miller
1983). Environmental dynamism stimulates firms to take advantage of new
opportunities created by change. Corporate entrepreneurship can be triggered
by strong entrepreneurial characteristics, such as leadership, good planning
systems, a customer-driven orientation, efficient operation and hands-on
management (Morris and Jones, 1999).

Corporate entrepreneurship is the main driver of innovation, risk taking and pro-
activeness and can be triggered by different activities and actions within, and
outside, the organisation (Miller 1983; Dess et al. 1999). Tang, Tang, Marino,
Zhang and Li (2009) have argued that ever increasing levels of entrepreneurial
behaviour (innovation, risk taking, and pro-activeness) can lead to worsening
company performance. Based on their research findings, the relationship
between EO and company performance is curvilinear. They found that, over a
certain period, a continuous increase in the level of corporate entrepreneurship
negatively impacted on company performance.
Coaching and entrepreneurial self efficacy are some of the triggers of
intrapreneurship (Wakkee et al 2010). They said that coaching by managers
might be important in improving employees’ entrepreneurial behaviour (Wakkee
et al 2010) because, through coaching, managers provide their employees with
access to resources and expertise. Stimulating intrapreneurship is a difficult
task and it is not something that can be achieved overnight. Rather, becoming
more entrepreneurial should be considered to be a learning process (Wakkee et
al 2010).
Entrepreneurial self-efficacy is an important variable, which explains both the
strength of entrepreneurial intentions and the likelihood of translating these
intentions into entrepreneurial activities (Wakkee et al 2010). Both management
coaching and entrepreneurial self-efficacy are found to be positively related to
entrepreneurial behaviour (Wakkee et al 2010). It was concluded that
organisational and individual variables are crucial predictors of entrepreneurial
behaviour. These variables tend to trigger entrepreneurial behaviour in an
organisation.
Dess at al (1999) suggested that successful corporate entrepreneurship may
hinge on the firm’s ability to combine structural approaches that focus on

efficiencies and processes and fit with strategic approaches, quality and
effectiveness. They mentioned that organisations that put emphasis on reducing
the internal boundaries play a critical role in successful corporate
entrepreneurship. A barrier-free organisation has been touted as critical in the
building of an entrepreneurial environment. Fewer layers of management,
interdisciplinary work groups, empowerment of first line managers, supervisors,
open communication vertically and laterally and accountability are typical
features of an organisation that embraces corporate entrepreneurship (Lumpkin
and Dess 1996).
Larger companies should have an edge in innovation and fostering
entrepreneurial behaviour, because they can afford engineers, staff, modern
facilities and the latest technology equipment (Barrett and Weinstein 1998;
Morris et al 2008). So access to financial resources offers firms the flexibility to
invest in research and development and to become more innovative (Clark
2010). External supports from other institutions help smaller firms with scarce
resources to invest in innovation (Clark 2010). So, according to Barrett and
Weinstein (1998), larger firms are more entrepreneurial than smaller firms due
to access to resources. The availability of such resources tends to trigger
corporate entrepreneurship.
The traditional hierarchy-driven organisational models make it difficult to foster
corporate entrepreneurship in an organisation (Dess et al 1999). They
emphasise that such models tend to create clearly-defined boundaries that limit
flexibility and choke communication. Moreover, these organisations often suffer
from political issues arising from different levels in the structure. Such politics
make it difficult for information to flow freely within an organisation.
According to Sebora and Theerapatvong (2009); Morris et al (2008),
bureaucratic structures constrain entrepreneurial behaviour in an organisation.

Dess et al (1999); Morris et al (2008) state that hierarchical levels in traditional
structures which assign responsibility for entrepreneurial activities to managers,
without delegating adequate amounts of authority, also represent constraints
on entrepreneurship behaviour. Moreover, Clark (2010) recommends that
organisations need to review existing policies and programmes to support and
facilitate entrepreneurial and innovative growth.
A culture that is averse to risk and/or process-driven is almost, by definition,
discouraging employees from acting in an entrepreneurial manner (Morris et al
2008). Due to the presence of this type of culture, a firm will tend to possess a
lower level of intrapreneurship. Budgeting systems, with no room for failure,
impose a threat on risk taking because there are no funds for experimental
projects (Morris et al 2008). In addition to budgeting systems, other obstacles
such as structure, strategic direction, policies and procedures, people and
culture tend to become barriers when attempting to introduce intrapreneurship
into a firm. Culture has been noted as a key element in fostering entrepreneurial
activities in an organisation and companies that practise entrepreneurship are
more successful than the ones that don’t (Lumpkin and Dess 1996; Morris et al
2008; Venter et al 2008). The lack of involvement by senior managers in driving
and articulating the vision, mission and aligning these with strategic direction
also put constraints on intrapreneurship in an organisation (Morris et al 2008;
Venter et al 2008). In the study of entrepreneurship in established organisations
(Morris and Jones, 1999), obstacles such as policies, procedures, personnel
restrictions, red-tape, limitations to amount of rewards and limited managerial
autonomy were identified as leading obstacles that impede entrepreneurial
behaviour.

2.7 Organisational Performance
Organisational performance in a fast and changing environment requires an
entrepreneurial approach. Huse et al (2005) state that emerging global markets
and rapid technological developments make strong demands on the ability of
companies to develop and utilise their resources in order to meet their customer
demands. These firms are flexible to environmental dynamics, which allows
them to identify new opportunities caused by disequilibrium (Huse et al 2005).
In addition to corporate entrepreneurship, the age of firms influences their
growth and profitability. Thus, the company performance increased relative to
company age. Companies that have been in the market for a longer tenure tend
to have more experience and knowledge about the industry compared to new
entrants. Such advantages position them at a level where they can innovate
better. In contrast to that, smaller companies are more flexible and can easily
adapt to market changes, which then gives them a better advantage when
coping with environmental changes (Steffens et al 2009).
Sebora and Theerapatvong (2010) say there is a possibility that firm size might
affect the relationship between organisational performance and entrepreneurial
attitude. Large organisations use rigid rules and procedures to administer their
operations, which in turn could impede entrepreneurial behaviour by employees
and which could lead to less innovation (Morris et al 2008).
Corporate entrepreneurship dimensions, such as innovation, risk taking and
pro-activeness, have a positive influence on company performance (Miller 1983;
Lumpkin and Dess 1996). The presence of these entrepreneurial dimensions
means the organisation is acting entrepreneurially. Higher growth tends to be
associated with firms that support entrepreneurial behaviour (Moreno and

Casillas 2008). Thus, growth tends to be considered a logical consequence of
the innovative, pro-active and risk taking behaviour of the firm. Although Zahra
and Covin (1995); and Lumpkin and Dess (1996) have found a positive
relationship between EO and performance, other authors (Tang et al 2009)
have argued that this relationship tends to be curvilinear over a certain period if
the organisation continues to increase its level of entrepreneurship.
There are numerous non-financial rewards for innovation, such as increased
employee motivation, staff retention and creating a positive organisational
culture. Adaptive firms typically have higher overheads, measured as a
percentage of sales, than repetitive firms. Company growth and profitability are
relevant measures of firm performance in the domain of corporate
entrepreneurship (Steffens et al 2009). On other hand, they argued that
company growth does not always lead to profitability as the relationship
between these two variables can be negative or neutral. The company can
show an increase in growth, whilst profits are reduced. This could be as a
result of various causes including company expansion, purchase of new assets,
and increase in sales or operations costs. In contrast to Steffens et al (2009),
other authors (Rutherford et al 2008) used multiple measures of performance,
which included financial and non-financial measures such as Return On Assets
(ROA), Profit, Sales and Return On Equity (ROE). It typically takes eight years
for a new venture to reach profitability and about ten years before its Return On
Investment (ROI) equals that of mainstream business activities (Rutherford et al
2008). Ruach et al (2009) considered and recommended financial measures
such as Sales growth and Return On Investments (ROI) to assess business
performance. Entrepreneurship research and practice place emphasis on
company growth as a measure of entrepreneurial success (Steffens et al 2009).
Steffens et al (2009) argue that changes in assets are not recommended as a
measure of growth as this measure is more relevant for companies which are
capital-intensive. It is not an appropriate measure for a service sector, which is

less capital-intensive than the manufacturing sector. In this study, both service
and manufacturing companies are part of the sampling frame. Thus, the other
measures of performance were added to evaluate the organisational
performance.
Organisational Performance was measured in terms of growth. Thus, in this
study Sales performance, Return On Assets (ROA), employment growth,
Return on Sales, Return On Equity (ROE), Return On Investment (ROI), and
Operating profit were used to measure organisational performance. The study
used both financial and non-financial measures to capture the essence of
entrepreneurial business performance. The respondents were asked to
consider the performance of the organisation over a period of five years.
According to Winklund (1999), it is possible to increase sales without acquiring
additional resources, by simply outsourcing the increased business volume. In
this case, only sales growth will increase, thus sales growth has a high
generality. Steffens et al (2009) have argued that sales growth does not always
lead to profitability at all times, due to the ever-changing relationship between
these two variables.
Sales and employees have a different flexibility, with sales changing more
rapidly with demand than does the number of employees. The company can
either outsource/sub-contract other divisions which could result in fewer
employees, or they could hire more employees. Both of these actions by the
firm could mean positive or negative performance. Thus, changes in the number
of employees are not directly related to company performance.

2.8 Conclusion of Literature Review
Based on previous studies, the overall evaluation of corporate entrepreneurship
is that the firms involved in entrepreneurial endeavours see more increased
growth and profitability levels than firms that do not attempt to engage in
intrapreneurship activities (Agca et al 2009). Thus it can be said that the
intensity of intrapreneurship in a firm is positively related to the level of
organisational growth and profitability. Wiklund (1999) found that there is a
positive relationship between Entrepreneurial Orientation and performance. A
number of other studies have found that there is a positive relationship between
a firm’s Corporate Entrepreneurship activities and their long-term organisational
performance (Zahra and Covin 1995; Covin and Miles 1999; Wiklund 1999).
Entrepreneurial firms must foster organisational learning in order to maximise
the effect of Entrepreneurial Orientation on company performance (Wang
2008). Organisational learning has been explained as knowledge acquisition in
the former view and value acquisition in the latter. According to Sebora and
Theerapatvong (2009), an entrepreneurial mindset is encouraged by and
related to management support. Management support indicates a willingness to
support entrepreneurial behaviour within the organisation. Corporate
Entrepreneurship is important for organisational survival, growth, profitability
and renewal (Sebora and Theerapatvong 2009; Covin and Miles 1999; Lumpkin
and Dess 1996).
The hypotheses of the study are as follows:
H1: Corporate Entrepreneurship dimensions (innovation, risk taking, pro-
activeness, and entrepreneurial culture) are positively related to company
performance.
H1a: Innovation is positively related to company performance.
H1b: Pro-activeness is positively related to company performance.

H1c: Risk taking is positively related to company performance
H1d: Entrepreneurial culture is positively related to company performance
CHAPTER 3: Research methodology
This chapter describes the research methodology utilised in this study. The
research methodology specifies how the study was conducted to reach the
stated objective. The main objective of this study is to evaluate the impact of
corporate entrepreneurship on company performance in ICT companies in
South Africa. The study assesses the level of corporate entrepreneurship in
relation to company performance in the Information and Communication
Technology (ICT) sector.
The methodology explains how the relationship between various constructs -
such as innovation, risk taking, pro-activeness, entrepreneurial culture and
overall company performance (financial and non-financial measures) - was
evaluated. The research methodology describes the method used to address
the following hypothesis:
H1: Corporate Entrepreneurship dimensions (innovation, risk taking, pro-
activeness, and entrepreneurial culture) are positively related to company
performance.
H1a: Innovation is positively related to company performance.
H1b: Pro-activeness is positively related to company performance.
H1c: Risk taking is positively related to company performance.
H1d: Entrepreneurial culture is positively related to company performance

3.1 Research methodology/Paradigm
This is a quantitative research study, which deals with the statistical analysis for
the useable sets of completed questionnaires from respondents. A quantitative
approach is one in which the investigator primarily uses post-positivist claims for
developing knowledge. It employs strategies of inquiry - such as experiments
and surveys - and collects data on predetermined instruments that yield
statistical data (Creswell 2003). The use of online questionnaires was deemed
appropriate for this research study because that was the only feasible way of
eliciting responses from respondents throughout the country.
The research study used a database which has listed and non-listed ICT
companies in South Africa. This study is a descriptive study of corporate
entrepreneurship in South Africa. A cross-sectional survey was used to
determine how corporate entrepreneurship influences company performance in
the Information and Communication Technology industry. The research
structure includes the target population, sampling method, instruments used for
data collection and procedures for data collection.
3.2 Research Design
The study adopted on-line survey-type questionnaires. These were self-
administered questionnaires and respondents had no time pressures to
complete them by a deadline. The reasoning behind using on-line

questionnaires was to reach as many respondents as possible in all regions in
South Africa.
3.3 Population and sample
3.3.1 Population
The population of this research study consisted of all Information and
Communication Technology (ICT) companies operating in South Africa. Each
company was represented by one individual employee in this research study.
The target population only included permanent employees. The targeted
population included managers/leaders/supervisors/executives in each company.
Both listed and non-listed companies were used..
The population from Information Technology and Telecommunications
companies ranges from web designers, cellular phone assembling, computer
networking, data services, cabling, to cellular network providers. The target
population was deemed relevant for this study, especially when looking at the
turbulence and dynamism experienced by the companies in this industry
recently.
3.3.2 Sample and sampling method
The non-probability sampling method was used in this study. Non-probability
sampling is appropriate when there are time constraints for the research study
(Cooper & Schindler, 2008). The convenience samples type of non-probability

samples were used in this study. The sampling method was targeted at
Information and Communication Technology companies operating in South
Africa. Company sizes ranged from small to large organisations and this was
based on their number of employees, as defined by the Department of Trade
and Industry (DTI).
The sampling frame consisted of one permanent, management-level employee
per company. The sample size of n=114 companies was deemed to be
appropriate for this research study. The research had only 114 valid usable
responses, one email address bounced. 153 did not respond. This puts the
response rate at 42.7%. Telephone calls were made to numerous respondents
to encourage them to complete the online surveys. Refer to Appendix B for a
response snapshot.
Company data was obtained from the ITWEB website and bmicompanydata.
Responses from 114 companies were received, thus ensuring that the data
analysis could be generalised across the ICT industry. Refer to Appendix C for
names of companies that participated. The company size used included all
sizes of firms ranging from micro to large, as described by the South African
Department of Trade and Industry.
3.4 The research instrument
The empirical investigation took place through a cross-sectional survey. The
research employed quantitative, closed-ended questionnaires. Closed-ended
questionnaires ask respondents to select a response/s from a series of pre-
designated choices (Kalaf et al 2008). These were self-administered
questionnaires sent by email through the surveymonkey website.

The research questions were structured to enquire about the presence of
entrepreneurial behaviour among Information and Communications Technology
(ICT) companies in South Africa. The questionnaires used the 5-point Likert
scale, which has been used in previous studies (Monsen and Boss 2009;
Wakkee et al 2010). These questionnaires used forced-answer types of
questions. The covering letter and actual instrument are as depicted in
Appendix A.
A pilot test was conducted to detect weakness in design and instrumentation.
The pilot test was sent to Vodacom management and errors in the survey, such
as “allow one answer per column”, were corrected. Prior to that, the
questionnaires had been verified by Wits Business School’s research
methodology lecturer and the research supervisor.
The advantages of using self-administered surveys are;
Allows contact with inaccessible participants;
Incentives may be used to increase response rate;
Allows participants time to think about questions;
Perceived as more anonymous;
Participants who cannot be reached by phone are accessible
Expanded geographical area without an increase in cost.
The shortcomings of this type of communication method are incorrect e-mail
addresses and lack of interview intervention available for explanation.
Moreover, low response rates may be experienced when using this method.

3.5 Procedure for data collection
The ITWEB website and bmicompanydata databases were used to obtain
contacts in the Information and Communications Technology industry in South
Africa.
The questionnaires were sent through weblink (www.surveymonkey.co.za) to
ICT managers, directors, CEOs and supervisors. The collection of data was
obtained by the 5-point Likert scale and closed-ended questions. The scale
represented each of the five constructs in the model: innovation, risk taking,
pro-activeness, entrepreneurial culture and company performance. Company
demographic measures were used as the control variables.
The five point Likert scale placing 5 as the highest score and 1 as the lowest
score, was utilised. The frequencies of positive responses to each item, as well
as the mean and standard deviation of scale totals, were calculated. The
research only used primary data. The primary data source was extracted from
respondents answering the on-line survey sent through the surveymonkey
website. Weekly email reminders were sent to those who had not responded
after a certain time. Numerous follow-up phone calls were made to encourage
people to respond to the on-line survey.
3.6 Data analysis and interpretation
The research used statistical analysis (Barrett & Weinstein, 1998) to evaluate
the relationship between the dependent variable of company performance and
several independent variables (innovation, risk taking, pro-activeness and
entrepreneurial culture).

During the data analysis stage, data collected is converted into a format that
can be used to address the research problem. Data preparation is the process
of extracting data from questionnaires so that these can be read and
manipulated by computer software. During this process, data is validated,
edited and then cleaned. Since nominal, ordinal and interval data were used in
this study, various descriptive and inferential statistical analyses could be
performed.
Descriptive statistics are used to describe data and inferential statistics are
used to determine significant levels of relationships between independent and
dependent variables. The following table is a summary of the permissible
descriptive and inferential relevant statistical test used in the study of nominal,
ordinal and interval data.
Table A
Measurement Scale Statistics
Nominal Scales Frequency distribution, Mode
Ordinal Scales Frequency distribution, Median, Mean,
Standard Deviation, Coefficient of
Variation, Correlation analysis, One-way
ANOVA, Chi-Square test
Interval Scales Frequency distribution, Median, Mean,
Standard Deviation, Skewness, Coefficient
of Variation, Correlation Analysis,
Confirmatory Factor Analysis, Multiple
regression
Source: Saunders et al 1997: Pg 310
3.6.1 Descriptive Statistics
Descriptive statistics describe the characteristics of the respondents, as
indicated in Table A. Descriptive statistics use frequencies, means, modes,
medians, standard deviation and coefficients of variation to summarise the
characteristics of large sets of data. The following statistics were used:

Frequencies: frequencies refer to the actual number or percentage of
responses to a certain question. These may be represented by way of
bar charts or tables.
Mean: is a sum of the values for all the observations of a variable divided
by the number of observations. It measures the central, or average,
response of respondents.
Mode: The observation that occurs most frequently
Median: The middle value when the data is arranged from smallest to
largest.
Coefficient of Variation: provides a relative measure of the dispersion
in the data relative to the mean. Dispersion refers to the degree of
variation in the data (numerical spread of the data).
In this research study, the frequency distribution was calculated to assess the
percentage of responses to multiple performance ordinal variables used.
3.6.2 Analysis of Variance (ANOVA)
Analysis of Variance (ANOVA) is the most common approach to test differences
among means. ANOVA computes a measure of the variance between the
means of each group and a measure of variance within the groups. The study
used ANOVA to calculate the effect of single variables on dependent variables.
The level of significance was observed.
ANOVA tests the null hypothesis that the means of several populations are
equal. One-way analysis variance uses single-factor, fixed-mode effects models
to compare the effects of one treatment on a continuous dependent variable
(Cooper and Schindler 2008). ANOVA requires assumptions that the mean
groups or factor levels being studied represent populations whose outcome
measures:
Are randomly and independently obtained;
Are normally distributed; and

Have equal variance.
ANOVA calculates both the F-ratio and P-value. A p-value of 0.05 or less is
considered significant. If the null hypothesis is true, there should be no
difference between the sample means. The ratio should be close to 1. If the
sample means are not equal, the numerator should manifest this difference and
the F-ratio should be greater than 1. To calculate the F-ratio, the sum of the
squared deviation for the numerator and denominator are divided by their
respective degrees of freedom. The F-ratio determines the size of the ratio
necessary to reject the null hypothesis for a particular sample size and level of
significance (Cooper and Schindler 2008; Evans 2010).
3.6.3 Multivariate ANOVA
Multivariate analysis of variance is a commonly used multivariate technique.
MANOVA is similar to ANOVA, but with several dependent variables. Thus
ANOVA tests for the difference in means between two or more groups, while
MANOVA tests differences among samples of employees, customers, etc.
MANOVA could be used to test hypotheses. Instead of a univariate F-value, the
multivariate F-value (Wilks λ) is obtained, based on a comparison of the error
variance / covariance matrix. Testing multiple dependent variables is
accomplished by creating new dependent variables that maximise group
differences. These artificial dependent variables are linear combinations of the
measured dependent variables. The multivariate test was done in this research
study to compare the means between multiple performance groups with regard
to the degree of relationship between CE dimensions (innovation, pro-
activeness, risk taking) and entrepreneurial culture. The Wilks Lambda and
confidence levels were obtained. Multivariate analysis comprises a set of
techniques dedicated to the analysis of data sets with more than one variable.

Before using MANOVA to test for significant differences, the following
assumptions should be met:
The distribution must be normal.
Linearity among all pairs of dependent variables.
Homogeneity of variances – dependent variables exhibit equal levels of
variance across the range of predictor variables.
Homogeneity of variances and covariance – since there are multiple
dependent variables, it is also required that their intercorrelations
(covariance) are homogeneous across all the cells of the design.
3.6.4 Degree of Asymmetry (Skewness)
Descriptive statistics tools results measure the degree of asymmetry of
distribution around its mean. Histograms of sample data can take on a variety of
different shapes. The distribution that has its modal value in the middle and
falling away from the centre in roughly the same fashion on either side is said to
be symmetrical. The asymmetrical, or skewed, distribution is concentrated on
one side and the distribution tails off to the other (Evans 2010). Distributions
that tail off to the right are said to be positively skewed and those that tail off to
the left are said to be negatively skewed. Comparing measures of central
tendency can sometimes reveal information about the shape of a distribution. In
a perfectly symmetrical unimodal distribution, the mean, median and mode
would all be the same. For a highly negatively skewed unimodal distribution, the
mean<median<mode, while for a highly positively skewed distribution,
mode<median<mean. Unimodal refers to the distribution with only one pick.

3.6.5 Chi-Square Test
A common problem in business is to determine whether two categorical
variables are independent. Probably the most widely used non-parametric test
of significance is the Chi-Square test. It is particularly useful in tests involving
nominal data, but can be used for higher scales (Cooper and Schindler 2008).
The Chi-Square technique can be used to test for significant differences
between the observed distribution of data among categories and the expected
distribution, based on the null hypothesis. This study used the Chi-Square to
test the significance between the observed nominal data and performance
categories. The Chi-square statistic is the primary statistic used for computing
the statistical significance of the cross-tabulation table. Chi-square is used to
test for statistical independence; that is, to see if the two variables are
independent.
3.6.6 Scheffe test
Post hoc tests are designed for situations in which the researcher has already
obtained a significant omnibus F-test, with a factor that consists of three or
more means. Additional exploration of the differences among the means is
required to provide specific information on which means are significantly
different from each other. The Scheffe test procedure is perhaps the most
popular of the post hoc procedures. It is flexible and conservative and is robust
to violations of assumptions.
Scheffe’s procedure corrects alpha for all pair-wise, or simple, comparison of
means. It also allows for complex comparisons of means. The Scheffe test is
customarily used with unequal sample sizes, although it can be used with equal
sample sizes. Scheffe test is a parametric multi-comparison procedure, which

tests the hypothesis that the means of each pair are equal. In this research
study, the Scheffe test was performed to compare the means between the three
performance groups and their significance levels.
3.6.7 Performance
As performance was measured by multiple ordinal variables and in order to
analyse these variables in relation to CE dimensions, three performance
categories (Poor, Moderate and High) were developed to make it more practical
for presentation and analyses. A logical test was done to check the overall
company performance. The percentage numbers of 1s and 2s were counted for
each company - these were regarded as Poor performance. The percentage
number 3s was manipulated and these were regarded as Moderate
performance. The number of 4s and 5s were manipulated and these were
regarded as High performance. Thereafter the following calculation was done:
If the number of 1s and 2s had a high percentage compared to a
percentage of 3s and a percentage of 4s and 5s, then the company was
considered to be a Poor performing company.
If the number of 4s and 5s had a high percentage compared to the
percentage of 3s and the percentage of 1s and 2s, then the company
was considered to be a High performing company.
Companies with a high percentage of 3s, compared to the
aforementioned groups of performance, were considered to be Moderate
performing companies.
The difference between Poor and Moderate performance was not significant in
terms of percentages. So these two groups of performance were then
combined into a Poor/Moderate performance category. Throughout the data
analysis in this research study, the two performance categories of High and
Poor/Moderate were used. The t-test was done to compare the means of these

performance groups to investigate if they are significant. Previously, the means
between three performance groups were compared to test for any significant
differences.
3.6.8 Box & Whisker Plot
Statistics assume that the data points are clustered around some central value.
The Box-Whisker plot graphically displays the five key statistics of a data set:
the minimum, first quartile, median, third quartile and maximum. These key
statistics are very useful in identifying the shape of a distribution and outliers in
the data. A Box-Whisker plot summarises each variable by three components:
1. Central line to indicate central tendency or location;
2. A box to indicate the variability around this central tendency;
3. Whiskers around the box to indicate the range of the variable.
The Box-Whisker plots were calculated to find the level of innovation, pro-
activeness, risk taking and entrepreneurial culture in relation to the two
performance groups. The aforementioned key statistics were graphically shown.
3.7 Limitations of the study
The research study was limited to executives and management staff of ICT
companies operating in South Africa.
From previous research, there are other variables which can impact
organisational performance, such as company structure, marketing strategy,
policies, operations processes, environmental dynamism, international activities
and company size (Huse et al 2005). This study only focussed on the four

dimensions of corporate entrepreneurship: risk taking, innovation, pro-
activeness and entrepreneurial culture (Miller 1983).
Performance, as a dependent variable, was measured in terms of sales growth,
return on investment, return on assets, return on sales, return on equity and
employment growth. The other measures, such as net profit, revenue growth,
etc were not used. The results from this study should not be generalised to
other ICT firms not operating in South Africa.
Multiple regression was not employed in this survey as the interval data was not
used through-out (some questionnaires captured the ordinal data). Further
empirical studies are recommended in this field in the future, because the report
only evaluates one management level employee per firm. One could argue that
the relationship between performance and entrepreneurial behaviour in a
company cannot be measured or evaluated from questions asked of one
employee. Future studies may include variables such as company structure,
environmental heterogeneity and company strategy (Mazzarol and Reboud
2006). A longitudinal study could be done to get a better insight on how
corporate entrepreneurship leads to increased company performance.
3.8 Validity and Reliability
The pre-existing scales of CE used by previous researchers (Tang et al Li 2008;
Yiu and Lau 2008; Agca et al 2009) were used to ensure construct validity. The
measures of CE used were checked for reliability by using the estimations of
Cronbach’s alpha (Nunnally 1978). Factor analysis was performed to ensure
that the data measured what it was designed to measure. In other words, it was
used to check validity (Cooper and Schindler 2008).

The pilot test was used to check validity, reliability and possible errors. The
research questions were then adjusted accordingly. Pre-testing allowed for the
identification and removal of problems and/or errors. A 5-point Likert scale was
used throughout to ensure consistency in the study. Multi-collinearity at, or
greater than, 0.8 (meaning two independent variables are showing similar
results) was tested to check for any possible inter-correlation between the
independent variables, which could result in inflated probability values (Cooper
and Schindler 2008 and Kreiser et al 2010). Inflated p-values could result in an
incorrect conclusion.
3.9 Validity
The extent to which a particular measure is free from both systematic and
random error indicates the validity of measure. The internal validity is the extent
to which the measuring instruments provide adequate coverage of the topic
under study. Internal validity ensures that the study is drawing the appropriate
conclusions from the data at hand. Validity is essential in confirming a
measurement model. Multiple components of validity can be identified:
Convergent validity: if an instrument is measuring what it is supposed
to measure, it should relate positively to other measures of the same
construct. In other words, they should be converging on the same trait or
share a high proportion of variance in common. Confirmatory factor
analysis is a way to estimate the relevant amount of convergent validity
among items measured.
Discriminant validity: is the extent to which a variable or construct is
distinct from other variables or constructs.
Face validity: is established when the measurement items are
conceptually consistent with the definition of a variable. This type of
validity has to be established prior to any theoretical testing. Face validity

was achieved through a thorough literature review and by developing
and using theoretical definitions and validated measurement instruments.
3.10 Reliability
Reliability is concerned with the accuracy and precision of the measurement
procedure. Cronbach’s Alpha coefficient was used as a measure of internal
reliability of the corporate entrepreneurship sub-scales used in the study.
Cronbach’s Alpha is a measure of internal reliability for multi-item summated
scales (Cooper and Schindler 2008). Its values range from 0 to 1, where the
higher the score, the more reliable the scale. Nunnaly (1978) recommended
that the minimal acceptable reliability for research should be in a range of 0.5 to
0.6, while higher values, such as 0.8, generally indicate that the measure is
highly reliable.
CHAPTER 4: PRESENTATION OF RESULTS
4.1 Introduction
In this chapter, results of the research study are presented. Tables are included
for ease of presentation and comparison of the results. A total of 114 usable
responses were achieved.
This chapter includes the presentation of all data analysis that was obtained.
The results of the research are structured as follows: firstly, the demographic
profile of the companies used in the research is described. Thereafter the
psychometric properties of the CE scales are presented, using descriptive stats
e.g. measures of central tendency - means, medians, measures of variability -
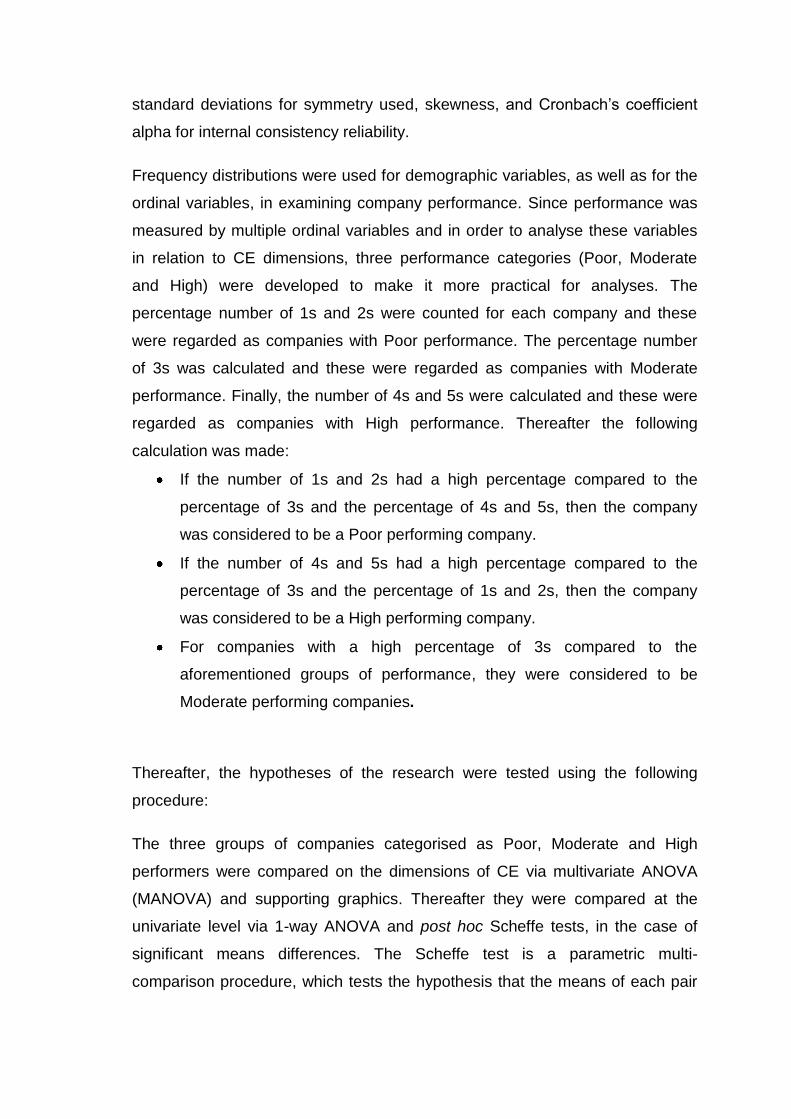
standard deviations for symmetry used, skewness, and Cronbach’s coefficient
alpha for internal consistency reliability.
Frequency distributions were used for demographic variables, as well as for the
ordinal variables, in examining company performance. Since performance was
measured by multiple ordinal variables and in order to analyse these variables
in relation to CE dimensions, three performance categories (Poor, Moderate
and High) were developed to make it more practical for analyses. The
percentage number of 1s and 2s were counted for each company and these
were regarded as companies with Poor performance. The percentage number
of 3s was calculated and these were regarded as companies with Moderate
performance. Finally, the number of 4s and 5s were calculated and these were
regarded as companies with High performance. Thereafter the following
calculation was made:
If the number of 1s and 2s had a high percentage compared to the
percentage of 3s and the percentage of 4s and 5s, then the company
was considered to be a Poor performing company.
If the number of 4s and 5s had a high percentage compared to the
percentage of 3s and the percentage of 1s and 2s, then the company
was considered to be a High performing company.
For companies with a high percentage of 3s compared to the
aforementioned groups of performance, they were considered to be
Moderate performing companies.
Thereafter, the hypotheses of the research were tested using the following
procedure:
The three groups of companies categorised as Poor, Moderate and High
performers were compared on the dimensions of CE via multivariate ANOVA
(MANOVA) and supporting graphics. Thereafter they were compared at the
univariate level via 1-way ANOVA and post hoc Scheffe tests, in the case of
significant means differences. The Scheffe test is a parametric multi-
comparison procedure, which tests the hypothesis that the means of each pair

are equal. Then t-tests were used to compare the means of the scales of CE of
the High performing companies versus the companies with Moderate Poor
performance. The Box and Whisker plots were used to support the t-test
findings.
4.2 Demographic profile of companies
Company demographics were measured by asking the respondents their
company size and company age (i.e. the length of time the company has been
operating). The company size and tenure of the company (company age) in the
industry were captured as control variables and used to describe the sample of
companies in this research study.
4.2.1 Company Size
The company size was determined by the number of employees. The
responses were categorised into four response categories. Table 1 below
shows observed data from the sample results. It shows the count of company
by size.
Table 1: Count of companies by size
Count Percent
Micro 4 3.5
Small 16 14.0
Medium 29 25.4
Large 65 57.0
Total 114 100

4.2.2 Company Age
Companies were also categorised according to their age, measured by the
number of years they’ve been in business. Respondents’ answers were
categorised into four categories. Table 2 below shows observed data from the
sample results. It is a table of company age and performance. It shows the
count of companies by years in operation.
Table 2: Count of companies by years in operation
Count Percent
0-5 years 13 11.4
6-10 years 24 21.1
11-14 years 24 21.1
15 years or more 53 46.5
Total 114 100
4.3 The independent variables used in the research: metric
scales
Table 3: Summary statistics for the central tendency and variability of the metric scales of the research
Valid N
Mean
Median
Minimum
Maximum
Std.Dev.
Skewness
Innovation 114 4.13 4.25 2.38 5.00 0.59 -0.52
Pro-activeness 114 3.86 3.90 2.10 5.00 0.54 -0.47
Risk Taking 114 3.67 3.67 1.00 5.00 0.74 -1.08
Entrepreneurial Culture
114 3.87 3.89 1.44 5.00 0.61 -0.75

The four scales of CE were measured using a 5-point Likert-type scale, where
high scores reflect high values on the construct. As the mean and median
values of the scales are all greater than the scale midpoint value of 3, it appears
that the mean entrepreneurship scores of the companies tend to range from
somewhat higher than neutral, towards positive or high.
The reliability of the scales used in the research. The study by Barrette and
Weinstein (1998) found the Cronbach’s alpha of 0.84 when testing the level of
CE dimensions in relation to company performance. In this study, Chronbach’s
alpha is not far from the Barrette and Weistein results.
The internal consistency reliabilities of the metric scales used in the research
were all high, with values for Cronbach’s coefficient Alpha of 0.80-0.88 (see
Table 4)
Table 4: Cronbach’s Coefficient Alpha
Cronbach’s Alpha
Innovation 0.8
Pro-activeness 0.81
Risk taking 0.84
Entrepreneurial Culture 0.88
4.4 The dependent variables used in the research: non-metric
scales
Unlike the metric scales used to measure the independent variables of CE, the
scales used to measure the dependent variable of performance are non-metric
and specifically ordinal. Thus, only frequency distributions in the form of tables

and graphs are used to describe the variables in the performance levels of the
companies. The construct of company performance was formed from financial
and non-financial measures. Eight performance measures were used to
capture the level of company performance. For each of the eight measures, the
categories used to measure performance are shown in Table 5.
Table 5
% Performance Change Category
Less than 0% (negative growth) 1
0-10% 2 11-40% 3 41-80% 4 81% or more 5
Since performance was measured by multiple variables and in order to analyse
these variables in relation to CE dimensions, three performance categories
(Poor, Moderate and High) were developed to make it more practical for
presentation and analyses. A logical test was done to check the overall
company performance. The percentage number of 1s and 2s was counted for
each company and these were regarded as Poor performers. The percentage
number of 3s was calculated and these were regarded as Moderate performers.
Finally, the number of 4s and 5s was calculated and these were regarded as
High performers. Thereafter, the following calculation was made:
If the number of 1s and 2s had a high percentage compared to the
percentage of 3s and the percentage of 4s and 5s, then the company
was considered to be a Poor performing company.
If the number of 4s and 5s had a high percentage compared to the
percentage of 3s and the percentage of 1s and 2s, then the company
was considered to be a High performing company.
For companies with a high percentage of 3s, compared to the
aforementioned groups of performance, these were considered to be
Moderate performing companies.

4.4.1 Sales Growth
a) The following table 6 shows the observed data results with different
performance categories and number of respondents in each category.
The frequency distribution table below was constructed from the
responses using the question “To what extent has the Sales Growth
changed over a 5-year period”.
Table 6
Count Cumulative Count
Percent Cumulative Percentage
0-10% 17 17 14.91 14.91
11-40% 48 65 42.11 57.02
41-80% 27 92 23.68 80.70
81% or more 22 114 19.30 100
4.3.2 Market Value Growth
The following table shows the observed data results with different performance
categories and percentage of respondents in each category. The frequency
distribution table below was constructed from the responses using the question
“To what extent has the Market Growth increased compared to competitors over
a 5-year period”.
Table 7
Count Cumulative Count
Percent Cumulative Percentage
0-10% 31 31 27.19 27.19
11-40% 41 72 35.96 63.16
41-80% 27 99 23.68 86.84
81% or more 15 114 13.16 100

4.3.3 Employment Rate
The following tables show the observed data results with different performance
categories and percentage of respondents in each category. The frequency
distribution table below was constructed from the responses using the question
“To what extent has the company employment rate increased over a 5-year
period”.
Table 8
Count Cumulative Count
Percent Cumulative Percentage
Less than 0% (negative growth) 5 5 4.39 4.39
0-10% 27 32 23.68 28.07
11-40% 43 75 37.72 65.79
41-80% 25 100 21.93 87.72
81% or more 14 114 12.28 100
4.3.4 Return on Investment
The following tables show the observed data results with different performance
categories and percentage of respondents in each category. The frequency
distribution table below was constructed from the responses using the question
“To what extent has the Return on Investment increased over a 5-year period”.
Table 9
Count Cumulative Count
Percent Cumulative Percentage
0-10% 17 17 14.91 14.91
11-40% 40 57 35.09 50
41-80% 36 93 31.58 81.58
81% or more 21 114 18.42 100

4.3.5 Return on Equity
The following tables show the observed data results with different performance
categories and percentage of respondents in each category. The frequency
distribution table below was constructed from the responses using the question
“To what extent has the Return on Equity increased over a 5-year period”.
Table 10
Count Cumulative Count
Percent Cumulative Percentage
0-10% 20 20 17.54 17.54
11-40% 36 56 31.58 49.12
41-80% 41 97 35.96 85.09
81% or more 17 114 14.91 100
4.3.6 Return on Assets
The following tables show the observed data results with different performance
categories and percentage of respondents in each category. The frequency
distribution table below was constructed from the responses using the question
“To what extent has the Return on Assets increased over a 5-year period”.
Table 11
Count Cumulative Count
Percent Cumulative Percentage
Less than 0% (negative growth)
1 1 0.88 0.88
0-10% 17 18 14.91 15.79
11-40% 35 53 30.70 46.49
41-80% 44 97 38.60 85.09
81% or more 17 114
14.91228 100

4.3.7 Return on Sales
The following tables show the observed data results with different performance
categories and percentage of respondents in each category. The frequency
distribution table below was constructed from the responses using the question
“To what extent has the Return on Sales increased over a 5-year period”.
Table 12
Count Cumulative Count
Percent Cumulative Percentage
0-10% 23 23 20.18 20.18
11-40% 41 64 35.96 56.14
41-80% 35 99 30.70 86.84
81% or more
15 114 13.16 100.00
4.3.8 Operations Profit
The following tables show the observed data results with different performance
categories and percentage of respondents in each category. The frequency
distribution table below was constructed from the responses using the question
“To what extent have the operations profit increased over a 5-year period”.
Table 13
Count
Cumulative Count
Percent Cumulative Percentage
Less than 0% (negative growth)
3 3 2.63 2.63
0-10% 14 17 12.28 14.91
11-40% 37 54 32.46 47.37
41-80% 35 89 30.70 78.07
81% or more 25 114 21.93 100

4.5 Results pertaining to the multivariate hypothesis
H1a: Innovation is positively related to company performance.
H1b: Pro-activeness is positively related to company performance.
H1c: Risk taking is positively related to company performance.
H1d: Entrepreneurial culture is positively related to company performance.
In order to test whether there is a relationship between the dimensions of CE
and performance, company performance was used to group the 114 companies
into three categories. These groups were then compared on all four CE
dimensions simultaneously. This multivariate comparison is an overall
comparison, at the 5% level of significance, that controls the experiment-wise
compounding of the Type 1 error that would have occurred had four univariate
comparisons been carried out using a 5% level of significance.
Figure 1: Multivariate comparison of the means of the four CE dimensions
across the three company performance categories

4.6 Results pertaining to the univariate hypotheses
H1a: Innovation is positively related to company performance.
H1b: Pro-activeness is positively related to company performance.
H1c: Risk taking is positively related to company performance.
H1d: Entrepreneurial culture is positively related to company performance.
As the three groups of companies differed significantly in the four dimensions of
CE considered simultaneously, while controlling the experiment-wise Type 1
error, it was then necessary to compare the three groups of companies at the
univariate level - i.e. on each of the four CE dimensions separately. This
analysis entailed four univariate analyses of variance (ANOVAs) (see Table 14).
All of the four 1-way ANOVA tests are significant, showing means differences.
Table 14
Analysis of Variance Marked effects are significant at p < .05000
SS Effect
df Effect
MS Effect
SS Error
df Error
MS Error
F p
Innovation 8.71 2 4.35 30.07 111 0.27 16.08 0.00
Pro-activeness 5.39 2 2.70 27.11 111 0.24 11.04 0.00
Risk Taking 10.35 2 5.18 50.81 111 0.46 11.31 0.00
Entrepreneurial Culture
4.07 2 2.03 38.00 111 0.34 5.94 0.00
However, in order to establish the source of the significant difference between
the means of the companies, a post hoc test of means was used. Specifically,
the Scheffe test was performed to compare the means of the different
performance groups relevant to each independent variable.

Table 15
Scheffe Test; Variable: Innovation
Marked differences are significant at p < .05000
Performance {1} M=3.69 {2} M=3.98 {3} M=4.38
Poor {1} 0.130651 0.000004
Moderate {2} 0.130651 0.002148
High {3} 0.000004 0.002148
Tables 16
Scheffe Test; Variable: Pro-activeness
Marked differences are significant at p < .05000
Performance {1} M=3.48 {2} M=3.78 {3} M=4.05
Poor {1} 0.100443 0.000079
Moderate {2} 0.100443 0.041132
High {3} 0.000079 0.041132
Table 17
Scheffe Test; Variable: Risk taking
Marked differences are significant at p < .05000
Performance {1} M=3.16 {2} M=3.52 {3} M=3.94
Poor {1} 0.154830 0.000086
Moderate {2} 0.154830 0.021605
High {3} 0.000086 0.021605
Table 18
Scheffe Test; Variable: Entrepreneurial Culture
Marked differences are significant at p < .05000
Performance {1} M=3.52 {2} M=3.81 {3} M=4.03
Poor {1} 0.207841 0.004353
Moderate {2} 0.207841 0.245050
High {3} 0.004353 0.245050

The Scheffe test for entrepreneurial culture shows significant differences
between the means of Poor and High performing companies, but not between
Moderate and High performing companies; and Moderate and Poor performing
companies (see Table 18). The Scheffe test for three dimensions of CE
(innovation, pro-activeness and risk taking) shows significant differences
between the means of the three CE scales between Poor and High performing
companies; and between Moderate and High performing companies, but not
between Moderate and High performing companies. For this reason, the
companies with Poor and Moderate performances were grouped into a single
category and compared against the High performance companies on each one
of the four CE dimensions. This was achieved via four univariate t-tests, tested
directionally to assess a positive relation between CE dimensions and
performance.
All four t-tests satisfied the conditions for homogeneity of variance between the
groups and, moreover, revealed significant means differences (Table 19). When
the values of p are considered for directional t-tests, all four t-tests (innovation,
pro-activeness and risk taking are significant at the 0.1% level of significance;
and the fourth, EC, is significant at the 1% level). Moreover, the pair-wise
means are consistently higher for High performance companies than for
Moderate or Poor companies (Figure 2). There is, thus, support for Hypotheses
1a-1d.
Figure 2
4.44.1 3.9 4.03.9
3.73.4
3.7
1.0
1.5
2.0
2.5
3.0
3.5
4.0
4.5
5.0
Innovation Proactiveness Risk Taking Entrepreneurial Culture
Me
an
Mean - High Mean - Poor/Moderate

Table 19
The Box and Whisker Plot
The Box and Whisker Plot was plotted to check for the range of the minimum,
first quartile, median, second quartile and maximum values. The outliers were
checked through this method. Box-Whisker Plots were depicted to show the
level of innovation amongst the two performance groups.
Box & Whisker Plot: Innovation
Mean
Mean±SE
Mean±1.96*SE
High Poor/Moderate
Performance category
1.0
1.5
2.0
2.5
3.0
3.5
4.0
4.5
5.0
Inn
ova
tio
n
Figure 3: Box & Whisker Plot, Innovation

Box & Whisker Plot: Proactiveness
Mean
Mean±SE
Mean±1.96*SE
High Poor/Moderate
Performance category
3.4
3.5
3.6
3.7
3.8
3.9
4.0
4.1
4.2P
roa
ctive
ne
ss
Figure 4: Box & Whisker Plot, Pro-activeness
Box & Whisker Plot: Risk Taking
Mean
Mean±SE
Mean±1.96*SE
High Poor/Moderate
Performance category
3.0
3.2
3.4
3.6
3.8
4.0
4.2
Ris
k T
akin
g
Figure 5: Box & Whisker Plot, Risk Taking

Box & Whisker Plot: Entrepreneurial Culture
Mean Mean±SE Mean±1.96*SE
High Poor/Moderate
Performance category
3.5
3.6
3.7
3.8
3.9
4.0
4.1
4.2
Entr
epre
neurial C
ulture
Figure 6: Box & Whisker Plot, Entrepreneurial Culture
4.7 Summary of the results
The presentation of results has depicted the following:
The means between the multiple groups (ANOVA test);
The means of multiple independent variables compare to the
performance groups (Multivariate test);
The level of CE dimension among the different performance groups (Box
& Whisker Plot, t-test);
Comparison of the means of the deferent performance group to each
independent variable (Scheffe test);
The factor analysis results.

CHAPTER 5: DISCUSSION OF THE RESULTS
5.1 Introduction
This section presents a discussion of the results findings of the research study
undertaken. The results from the previous chapter are now discussed in detail.
The research results are compared to the theoretical premise examined in the
in-depth literature consulted on the subject.
The discussion of research results deals with the comparison between the
theoretical premise drawn from the literature and the research findings obtained
from responses. The association between different constructs is discussed and
explained in detailed. The association between these variables is also
compared to previous research findings. The hypothesis test and comparison to
theoretical findings are discussed. The results of this study add to the growing
literature on CE in a number of ways.
5.2 Demographic profile of companies
The demographic profiles in the study were measured by asking the
respondents their company size and company age (tenure of existence).
The company size in relation to company performance is as shown in Table 1.
The table shows observed data from the sample results. It shows four
classifications of company size. 65 of the responded companies were large and
only 4 companies were micro companies, with the remaining number falling into
other classifications.

The company age in relation to company performance is as shown in Table 2.
The table shows observed data from the sample results. It shows four
classifications of company age. From the observed data, it shows 53 companies
which had more than 15 years of operation and about 13 companies had 5 or
less number of years in existence.
5.3 Discussion pertaining to Performance
As per previous discussion, company performance was measured in terms of
Poor, Moderate and High categories. The frequency distribution was used to
assess company performance in relation to multiple dependent variables. The
tables used show the percentage of companies in a particular category.
Table 6 - sales growth shows that 42% of companies had performance sales
growth between 11%-40% in a 5 year period. None of the companies observed
had a negative growth.
Market value growth as shown in Table 7 had about 36% of companies which
reported market growth of 11%-40%, compared to competitors, in a 5 year
period. Again, none of these companies had experienced a negative market
growth.
Employment rate, as shown in Table 8, had the highest percentage of
companies in the category 11%-40%, which has 37.7%. This shows that most
companies had an 11%-40% percentage increase in employment in the past 5
years. The reduction in employment of approximately 4.4% is noticeable.
The return on investment, as shown in Table 9, had the highest responses in
category 11%-40%, which is 35%. These companies had an 11%-40% return
on investment for the past 5 year period. Negative returns were not experienced
by any of the companies that responded.

The return on equity, as shown in Table 10, had the highest percentage (36%)
of companies in the category 41%-80%. 17.5% of responses had 0%-10%
return on equity for the past 5 year period
The return on assets, as shown in Table 11, had the highest percentage
(38.6%) in the category 41%-80%. These companies had experienced the
return on assets which ranges between 41%-80% in the past 5 year period.
About 0.9% of companies showed negative figures on return on assets.
The return on sales, as shown in Table 12, had the highest percentage (36%) of
responses in category 11%-40%. These companies had experienced 11%-40%
return on sales for the past 5 year period. About 13.2% of companies had
experienced 81% or more in return on sales. None of the respondents reported
a negative return on sales.
The operating profit, as shown in Table 13, had the highest companies (32.5%)
in category 11%-40%. These companies had operating profit ranging between
11%-40% for the past 5 year period. It is also observed that about 30% of the
companies reported the operating profit was between 41%-80% in the past 5
year period.
Other researchers used company growth and profitability to measure company
performance, but Steffens et al (2009) stated that company growth does not
always lead to profitability and this relationship can be negative or neutral. To
them, company expansion could be costly due to the acquisition of new assets
and operations resources. Rauch et al (2009) used sales growth and return on
investments to assess business performance and the results were in line with
this research finding. Wiklund (1999) mentioned that it is possible for an
organisation to achieve an increase in sales growth without additional resources
by rather outsourcing the sales department. In such cases, sales growth can be
impacted negatively or positively, depending on the cost involved. Rutherford et
al (2008) had used multiple performance measures, which included ROA, ROE,
Profit and Sales, but they concluded that it takes about eight years for an
organisation to reach profitability and about ten years to realise return on
investments and equity. This could be a reason why this study didn’t show

significant change in these figures in a 5 year period. Steffens et al (2009)
found that successful firms will achieve high performance in both sales growth
and profitability.
5.4 Multivariate Test
The multivariate test was conducted to test the means of multiple independent
variables, compared to different groups of dependent variables. All four
hypotheses were tested. Figure 1 shows the results obtained after running a
multivariate test. The following hypothesis was tested: The CE dimensions are
positively related to company performance.
A significant difference between the four CE dimensions and performance
groups was clear when running a multivariate test. The p value (p=0.00003)
obtained is significant at 95% confidence level. From this, the null hypothesis is
rejected. This empirical test confirms that there is an association between CE
dimensions and company performance. Corporate entrepreneurship dimensions
such as innovation, risk taking and pro-activeness have a positive influence on
company performance (Miller 1983). This is in line with what Ireland et al (2009)
found in their study of CE.
5.5 Discussion pertaining to Hypothesis H1a
H1a: Innovation is positively related to company performance
The first hypothesis to be tested is to assess empirically the association
between innovation and company performance. The ANOVA test was
performed and the results are as shown in Table 14. When comparing the
means of different groups, the results show a significant difference between the
groups, rather than within the groups. The significance level of p<0.05 is
achieved and this allows the rejection of the null hypothesis.

The Scheffe test was performed to compare the means of different performance
groups, relevant to each independent variable. Table 15 results show that there
is no significant difference between Poor and Moderate performance found at
p<0.05. Hence these two were combined into a Poor/Moderate performance
category.
The T-test is about comparing the means of two groups. The two performance
groups are High performance and Poor/Moderate performance. Regarding
innovation, as shown in Table 19, there is a significant difference between the
means of these two groups. Innovation means for high performance = 4.4 and
for Poor/Moderate performance = 3.9. These two performance groups are
significant at p<0.05 for all variables.
The Box & Whisker plot, shown in Figure 3, was calculated to get the level of
innovation in relation to the two performance groups. The significant difference
between the two performance groups was clear when the mean level of
innovation was examined. High performance companies, as a group, obtained
the mean=4.4; lower limit=4.3 – upper limit = 4.5; 95% confidence level, while
Poor/Moderate companies, as a group, obtained the mean=3.9; lower limit=3.7
– upper limit=4; 95% confidence level. Based on this result, companies with a
high level of innovation are able to achieve high performance.
The observed results from the Box-Whisker Plot depicts that high innovation
leads to high performance and organisations with lower innovation have
Poor/Moderate performance. The aforementioned results, when testing
innovation in relation to company performance, shows that this association is
significant at p<0.05. The results lead to the rejection of the null hypothesis
(Ho). So hypothesis H1a: “Innovation is positively related to company
performance” is accepted. There was no overlapping observed on the Box &
Whisker Plots and there is a clear separation between High and Poor/Moderate
performing companies. This shows that these groups are significantly different.
The Multivariate test also shows significance at p< 0.05, which indicates that

there is a positive association between level of innovation and company
performance.
In contrast to this finding, Tang et al (2008) found that too much emphasis on
corporate entrepreneurship could lead to poor results. In their study they found
that firms with too much entrepreneurial orientation are engaging themselves in
high risk taking projects, which end up inhibiting the company’s growth. Most
previous researchers (Zahra and Covin 1995; Lumpkin and Dess 1996; Huse et
al 2005; Sebora, and Theerapatvong 2009; Ireland et al 2009) have found that
innovation leads to high organisational performance. Zahra and Garvis (2000)
found that innovative companies are able to perform well, even when they
encounter a turbulent environment. This turbulent environment tends to trigger
more demand for innovation and this, in turn, leads to high performance. Zahra
and Covin (1995) found a positive relation between CE and company
performance, particularly in a hostile environment. This type of environment
requires flexibility and a focus on research and development by the firm in order
to sustain its operation. According to Lumpkin and Dess (1996), the
involvement of companies in research and development stimulates innovation
and this allows the organisation to act entrepreneurially.
Innovation was found to be significantly important for the organisation to act
entrepreneurially and to improve its performance. Steffens et al (2009) and Yiu
and Lau (2008) found a positive relationship between innovation and company
performance. In their study, performance was measured in terms of growth and
profitability. Agca et al (2009) reached the same conclusion: that
entrepreneurial behavior leads to improved company performance. Clark (2010)
did a research study on innovation and found that companies which take
innovation seriously and implement their new ideas are able to prosper and
perform better. Innovative firms are those that invest heavily in innovation,
research and development, as well as new product development. They have
leaders with clear vision, who are able to integrate innovation and creativity into

the business strategy. These firms are said to be entrepreneurially oriented.
According to Wang (2008), EO is a key ingredient for a firm’s success. The t-
test done in this research supports the statement that high innovation has a
positive relationship with high performance.
5.6 Discussion pertaining to Hypothesis H1b
H1b: Pro-activeness is positively related to company performance
The 2nd hypothesis to be tested involves empirically assessing the association
between pro-activeness and company performance. The ANOVA test was
applied and the results are as shown in Table 14. When comparing the means
of different groups, the results show significant difference between the groups,
rather than within the groups. The significant level of p<0.05 is achieved and
this allows the rejection of the null hypothesis.
The Scheffe test was performed to compare the means of different performance
groups relevant to each independent variable. With regard to pro-activeness
means - as shown in Table 16 - the significant difference between Poor and
High performance; and between Moderate and High was found at 95%
confidence level (p<0.05). There is no significant difference between Poor and
Moderate performance found at p<0.05, hence these two were combined into a
Poor/Moderate performance category.
The T-test is about comparing the means of two groups. The two performance
groups are High performance and Poor/Moderate performance. Regarding
innovation, as shown in Table 19, there is a significant difference between the
means of these two groups. Pro-activeness means for high performance = 4.1
and for Poor/Moderate performance = 3.7. These two performance groups are
significantly different at p<0.05 for all variables.

The Box & Whisker Plot, shown in Figure 4, was calculated to get the level of
pro-activeness in relation to the two performance groups. The significant
difference between the two performance groups was clear when the means
level of pro-activeness was examined. High performance companies, as a
group, obtained the mean=4.1; lower limit=3.9 – upper limit = 4.2; 95%
confidence level; while Poor/Moderate companies, as a group, obtained the
mean=3.7; lower limit=3.5 – upper limit=3.8; 95% confidence level. Based on
this result, companies with a high level of pro-activeness are able to achieve
high performance.
The observed results of the Box-Whisker Plot depict that high pro-activeness
leads to high performance and organisations with lower innovation have
Poor/Moderate performance. The aforementioned results, when testing pro-
activeness in relation to company performance, show that this association is
significant at p<0.05. The results lead to the rejection of the null hypothesis
(Ho). So hypothesis H1b: “Pro-activeness is positively related to company
performance” is accepted. No overlapping was observed on the Box &
Whisker Plots and there is a significant separation between High and
Poor/Moderate performing companies. This shows that these groups are
significantly different. The Multivariate test supports this hypothesis at the
significant level of p< 0.05.
Previous researchers (Miller 1983; Zahra and Covin 1995; Lumpkin and Dess
1996; Yiu and Lau 2008) also found the relationship between CE and company
performance to be positive. Miller (1983) stated that the firm’s ability to be a first
mover gives it an opportunity to exploit future opportunities ahead of
competitors. A company’s aggressiveness in pursuit of market opportunities
offers the firm an opportunity to improve its performance (Rauch et al 2009).
According to Zahra and Garvis (2000), pro-activeness by a firm leads to better
company performance and this is in line with the findings from this research
study. This study measured pro-activeness in terms of companies taking the

lead in introducing new technology, new market identification, proactive sales,
the ability to see potential business changes and future customer demands.
Kreiser and Davis (2010) found that companies that experience high levels of
CE are those operating in dynamic environments. Their study results show that
companies in a stable environment tend to experience low levels of CE and this
could be as a result of less demand from customers. In the ICT sector, the
environmental dynamism is very high due to fast-changing electronic devices,
computer software, requirements for fast data throughput and overall
technological changes. This type of environment forces firms to be proactive in
introducing new products, so that they capture better market share and gain
competitive advantage over their rivals. From the results of this study, one
could define pro-activeness as the phenomenon to out-perform rivals and gain
market share.
Miller (1983) defined three CE dimensions (innovation, pro-activeness, and risk-
taking) as the key ingredients in performance. A company that possesses these
three CE dimensions is considered to be entrepreneurial. Pro-activeness was
found to be positively associated with company financial performance and the
strength of this relationship tended to grow over time (Miller 1983; Zahra and
Covin 1995; Zahra and Garvis 2000). The current study results corroborate prior
results by Zahra and Covin, showing a positive concurrent relationship between
CE and company performance.

5.7 Discussion pertaining to Hypothesis H1C
H1c: Risk taking is positively related to company performance
The 3rd test is empirically to assess the association between innovation and
company performance. The ANOVA test was used to test the means
differences and the results are as shown in Table 14. When comparing the
means of different groups, the results show significant difference between the
groups, rather than within the groups. The significant level of p<0.05 is achieved
and this allows the rejection of the null hypothesis.
The Scheffe test was performed to compare the means of different performance
groups relevant to each independent variable. With regard to risk taking means,
as shown in Table 17, the significant difference between Poor and High
performance; and between Moderate and High was found at p<0.05. There was
no significant difference between Poor and Moderate performance found at
p<0.05. Hence these two were combined into a Poor/Moderate performance
category.
The T-test is used to compare the means of two groups. The two performance
groups are High performance and Poor/Moderate performance. Regarding risk
taking, as shown in Table 19, there is a significant difference between the
means of these two groups. Risk taking means for High performance = 3.9 and
for Poor/Moderate performance = 3.4. These is a significant difference between
these groups at p<0.05 for all variables.
The Box & Whisker Plot shown in Figure 5 was calculated to identify the level of
risk taking in relation to the two performance groups. A significant difference
between the two performance groups was clear when the means level of risk
taking was examined. High performance companies, as a group, obtained the
mean = 3.9; lower limit = 3.8 – upper limit = 4.1; 95% confidence level; while
Poor/Moderate companies, as a group, obtained the mean=3.4; lower limit=3.2

– upper limit=3.6; 95% confidence level. Based on this result, companies with a
high level of risk taking are able to achieve high performance.
The results observed from the Box-Whisker Plot depicts that high innovation
leads to high performance and organisations with lower risk taking have
Poor/Moderate performance. The aforementioned results, when testing risk
taking in relation to company performance, shows that this association is
significant at p<0.05. The results lead to the rejection of the null hypothesis
(Ho). So hypothesis H1c: “Risk taking is positively related to company
performance” is accepted. No overlapping was observed in the Box & Whisker
Plots and there is a clear separation between High and Poor/Moderate
performing companies. This shows that these groups are significantly different.
Risk taking is about taking bold action with regard to introducing new products,
risk projects and other activities with uncertain returns (Wang 2008; Lumpkin et
al 2009). Therefore, companies that embrace these elements are likely to
achieve good performance. Zahra and Garvis (2000) found that the
organisational support for risk taking, especially by top management, can help
the organisation to prosper in future. Autonomy within the organisation makes it
easy for employees to take risks in bringing new ideas and performance-
enhancing projects to the table.
Risk taking allows managers to tolerate risk and implement the culture of not
punishing employees who try and fail (Moreno and Casillas 2008). This was
found to be a crucial element in stimulating risk taking in a firm (Zahra and
Covin 1995). This finding is supported by the current study. In this study, risk
taking was measured by asking the respondents questions such as: Does
organisation commit significant resources to venture with uncertain returns, is
business growth driven by new innovation which can bring potential business
failures, does the company take bold action in venturing into unknown business
territory; and rewarding individuals by taking calculated risks?
These questionnaires have led to the empirical testing of risk taking in relation
to company performance and the association has been found to be positive.

Moreno and Casillas (2008) found that risk taking has a positive association
with company performance and this is in line with this research study findings.
Miller 1983; Wiklund 1999;Tang et al (2008) had achieved the same relationship
in their study, when evaluating risk taking against organisational performance
(both in terms of financial measures and/or non financial measures), although
their study also indicated that too much risk taking could inhibit company growth
capabilities.
5.8 Discussion pertaining to Hypothesis H1d
H1d: Entrepreneurial culture is positively related to company performance
The 4th hypothesis to be tested involves empirically assessing the association
between entrepreneurial culture and company performance. The ANOVA test
was applied to test the means differences and the results are as shown in Table
14. When comparing the means of different groups, the results show the
significant differences between the groups, rather than within the groups. The
significant level of p<0.05 is achieved and this allows the rejection of the null
hypothesis.
The Scheffe test was performed to compare the means of different performance
groups relevant to each independent variable. With regard to entrepreneurial
culture means, as shown in Table 18, the significant difference between Poor
and High performance; and between Moderate and High performance was
found at p<0.05. There was no significant difference between Poor and
Moderate performance found at p<0.05, hence these two were combined into a
Poor/Moderate performance category.

The T-test is used to compare the means of two groups. The two performance
groups are High performance and Poor/Moderate performance. Regarding
entrepreneurial culture, as shown in Table 19, there is a significant difference
between the means of these two groups. Entrepreneurial culture means for
High performance=4, and for Poor/Moderate performance=3.7. These are
significant at p<0.05.
The Box & Whisker Plot, shown in Figure 6, was calculated to ascertain the
level of entrepreneurial culture in relation to the two performance groups. The
significant difference between the two performance groups was clear when the
means level of innovation was examined. High performance companies, as a
group, obtained the mean=4; lower limit=3.9 – upper limit = 4.2; 95%
confidence level, while Poor/Moderate companies, as a group, obtained the
mean=3.7; lower limit=3.5 – upper limit=3.9; 95% confidence level. Based on
this result, companies with a high level of innovation are able to achieve high
performance.
The results observed from the Box-Whisker Plot depicts that high
entrepreneurial culture leads to high performance and organisations with lower
entrepreneurial culture have Poor/Moderate performance. The aforementioned
results, when testing entrepreneurial culture in relation to company
performance, shows that this association is significant at p<0.05. The results
lead to the rejection of the null hypothesis (Ho). So hypothesis H1d:
“Entrepreneurial culture is positively related to company performance” is
accepted. As no overlapping is observed on the Box & Whisker Plots and there
is a clear separation between High and Poor/Moderate performing companies,
this shows that these groups are significantly different.
Based on this research study findings, entrepreneurial culture has a positive
association with company performance in the ICT industry. The culture that

allows individuals to bring new ideas and tolerates risk is a key element for
sustainable business performance (Wang 2008). Entrepreneurial culture has
been found to stimulate innovation, flexibility and high performance (Lumpkin
and Dess 1996). Entrepreneurship should be encouraged in an organisation by
creating an appropriate entrepreneurial culture and fostering an entrepreneurial
climate (Venter et al 2008). In this way, firms are able to embrace
entrepreneurial behaviour. This study has added its findings to the literature
review on previous studies by proving that entrepreneurial culture has a positive
association with company performance. Kreiser et al (2010) have concluded
from their study results that there is an important link between culture and
entrepreneurial activities. They found that this link leads to company growth and
improves financial returns. Zahra et al (1999) believed that the culture that
reinforces communication and sharing of knowledge within an organisation is a
crucial element for success and encourages the introduction of new ideas. They
found entrepreneurial culture to be an internal organisational variable that has a
positive influence on company performance.
5.9 Conclusion
This chapter deals with the findings of the research study. The demographic
data analysis was performed and captured. During data collection, the response
rate of 42.7% was achieved and the analysis was based on it.
Descriptive analysis was used to describe the data by comparing and
discussing the means of the constructs. Factor analysis was used to determine
whether the number of factors, and factor loadings of measured variables,
conformed to what would be expected on the basis of CE theory. The CE
construct showed acceptable construct reliability.

The findings strongly support the concept of corporate entrepreneurship in an
organisation. The research findings confirm that the CE dimensions studied
here are crucial for the organisation to enhance its performance and to enable it
to sustain its degree of entrepreneurial orientation. In addition to the CE
dimensions of innovation, pro-activeness and risk taking, the entrepreneurial
culture has been identified as a significant element of CE. Thus, an
organisation needs to embrace entrepreneurial culture in order to stimulate
corporate entrepreneurial behaviour. In this study, the hypothesis test has
shown a positive relationship between CE dimensions and company
performance.
Finally, the findings of this research study are consistent with the findings
reported by previous authors (Covin and Miles 1999; Wiklund 1999; Yiu and
Lau 2008; Agca et al 2009; Rauch et al 2009).

CHAPTER 6: CONCLUSIONS AND RECOMMENDATIONS
6.1 Introduction
This chapter summarises the main points that emerged from the research
study, which investigated the relationship between corporate entrepreneurship
and company performance. The study investigated the extent to which CE
dimensions affect a company’s performance in the ICT sector.
6.2 Conclusions of the study
In conclusion, to argue that firms must learn to act entrepreneurially is no longer
a novelty and the reasons they could benefit from doing so are generally well
known. The current research results suggest that companies need to focus on
identifying and implementing appropriate intrapreneurship elements, which
could be useful in the pursuit of CE effectiveness.
The study has investigated the relationship between CE and company
performance in the South African context. A company’s entrepreneurial
behaviour has been emphasised as the key construct in enhancing business
performance (Zahra and Covin 1995; Yiu and Lau 2008). Corporate
entrepreneurship has been studied previously and most of these studies
indicate that firms which embrace CE are able to realise improved performance.
The empirical study used descriptive statistics and inferential statistics to test
empirically the relationship between CE dimensions and company performance.
Performance was measured in terms of financial and non-financial variable

measures. The findings have indicated that all CE dimensions studied in this
research have a positive relationship with company performance. The degree
and level of CE employed by an organisation determines the level of
performance - whether Poor, Moderate or High. The findings are in support of
previous research studies by (Miller 1983, Steffens, et al 2009; Moreno and
Casillas 2008; Lumpkin and Dess1996). This research study has not found the
Curvilinear graph (Tang et al 2009) when testing the relationship between CE
dimensions and company performance.
6.3 Recommendations
The study has built a snapshot of how an entrepreneurial organisation should
act and operate. There has not been significant research around the
relationship between CE and company performance in the South African
context. Hence it will be recommended for ICT companies in South Africa to
consider introducing and implementing some CE dimensions into their
businesses.
Since the ICT sector is a fast-growing one, it may be advantageous for a
company first to look at efficient means of being more pro-active, innovative and
able to take bold action in implementing new projects in an uncertain
environment with the intention of capturing new markets. The finding of this
study has shown that a high level of CE leads to high performance. The
importance of the entrepreneurial culture has not really been emphasised much
before, but it is clear to see that it is an important aspect for an entrepreneurial
organisation. Without it, employees with a sense of innovation, risk taking and
pro-activeness will experience difficulties.

6.4 Suggestions for further research
Future research should attempt to capture the temporal aspects of corporate
entrepreneurship by including multiple measures of the same performance
(multiple indicator of company performance). Most literature supports the notion
that CE is related to company performance, but the performance measures
used at any given point could lead to a different conclusion.
Although the dimensions of CE which have been discussed are clear about
what companies should focus on, what is less clear is what managers need to
do to assure the success of their firm’s entrepreneurial activity. This is an
aspect that researchers should address.
A longitudinal study on CE, in relation to company performance, would be
interesting as it could give a curvilinear graphical presentation. The reason for
this is that very little is mentioned in current literature about the time-frame for
an organisation to realise the outcome of CE. Future research could investigate
the average time-frame taken by organisation before the results of CE are
noticed.
Certain elements of CE (organisational structure, strategy changes, policies and
procedure, etc.) require sufficient time to be more effective and efficient. Thus it
would be interesting to see research done around this aspect in relation to
entrepreneurial behaviour. Such research would probably have to be a
longitudinal study, which would test the relationship between CE and company
performance, but using entrepreneurial culture as a moderating factor.

References
Agca, V. Topal, Y. and Kaya, H. (2009) Linking Intrapreneurship activities to
multidimensional firm performance in Turkish manufacturing firms: an empirical
study, International Entrepreneurship and Management Journal, 1-19
Barrett, H. and Weinstein, A. (1998) The Effect of Market Orientation and
Organisational Flexibility on Corporate Entrepreneurship, Entrepreneurship
Theory and Practice, 23(1), 57-70
Clark, N. D. (2010) Innovation Management in SMMEs: Active Innovators in
New Zealand, Journal of Small Business and Entrepreneurship, 23 (4), 601-619
Cooper, D. R. Schindler, P. S. (2008) Business Research Methods, tenth
edition, McGraw-Hill, New York
Covin, J. G. and Miles, J. P. (1999) Corporate Entrepreneurship and the pursuit
of competitive advantage, Entrepreneurship Theory and Practice, 23(3), 47-63
Creswell, J. W. (2003) Research Design, Qualitative, Quantitative, and Mixed
Methods Approaches, 2nd edition, SAGE Publications, London
Dess, G. G. Lumpkin, G. T. and McGee, J. E. (1999) Linking Corporate
Entrepreneurship to strategy, Structure, and Process: Suggested Research
directions, Entrepreneurship Theory and Practice, 23(3), 85-102
De Waal, A. A. (2007) The characteristics of a high performance organisation,
Business Strategy Series, 8(3), 175-185
Evans, J. R. (2010) Statistics, Data Analysis, and Decision Modeling, fourth
edition, Pearson Education, New Jersey

Fini, R. Grimaldi, R. Marzorcchi, G. L. and Sobrero, M. (2010) The
Determinants of Corporate Entrepreneurial Intention within Small and Newly
Established Firms, Entrepreneurship theory and Practice, 34(6), 1-28
Huse, M. Neubaum, D. O. and Gabrielsson, J. () Corporate Innovation and
Competitive Environment, International Entrepreneurship and Management
Journal, 1(3), 313-333
Ireland, D.R. Covin, J. G. and Kuratko, D. F. (2009) Conceptualizing Corporate
Entrepreneurship Strategy, Entrepreneurship theory and Practice, 33(1), 19-46
Kalof, L. Dan, A. and Dietz, T. (2008) Essentials of Social Research, first
edition, McGraw-Hill education, New York
Kreiser, P. M. and Davis, J. (2010) Entrepreneurial Orientation and Firm
Performance: The unique impact of innovativeness, Pro-activeness, and Risk-
taking, Journal of Small business and Entrepreneurship, 23(1), 39-51
Kreiser, P. M. Marino, L. D. Dickson, P. and Weaver, K. M. (2010) Cultural
Influences on Entrepreneurial Orientation: The impact of National Culture on
Risk taking and Pro-activeness in SMEs, Entrepreneurship Theory and
Practice, 34(5), 959-983
Kuratko, D. F. Hornsby, J.S. and Bishop, J. (2005) Manager’s corporate
entrepreneurial actions and job satisfaction. International Entrepreneurship and
Management Journal, 1(3), 275-291
Kuratko, D. F. and Audretsch, D. B. (2009) Strategic Entrepreneurship:
Exploring Different Perspectives of an Emerging Concept, Entrepreneurship
and Theory in Practice, 33(1), 1-17

Landstrom, H. Crijns, H. laveren, E and Smallbone, D. (2008) Entrepreneurship,
Sustainable Growth and Performance, 20th edition, Edward Elgar Publishing
limited, UK
Lumpkin, G. T. and Dess, G. G. (1996) Clarifying the entrepreneurial orientation
construct and linking it to performance, Academy of Management Review,
21(1), 135-72
Lumpkin, G. T. Cogliser, C. C. and Schneider, D. R (2009) Understanding and
Measuring Autonomy: An Entrepreneurial Orientation Perspective,
Entrepreneurship and Theory in Practice, 33(1), 47-69
Mazzarol, T. and Reboud, S. (2006) The Strategic decision making of
entrepreneurs within small high innovator firms, International Entrepreneurship
and Management Journal, 2(2), 261-280
Miles, M. P. Munilla, L. S. and Darroch, J. (2008) Sustainable Corporate
Entrepreneurship, International Entrepreneurship and Management Journal,
5(1), 65-76
Miller, D. (1983) The correlates of Entrepreneurship in three types of firms,
Management Science, 29:770-791
Monsen, E. and Boss, R. W. (2009) The Impact of Strategic Entrepreneurship
inside the Organisation: Examining Job Stress and Employee Retention,
Entrepreneurship and Theory in Practice, 33(1), 71-104
Moreno, A. and Casillas, J. C. (2008) Entrepreneurial Orientation and Growth of
SMEs: A Casual Model, Entrepreneurship and Theory in Practice, 32(3), 507-
528

Morris, M. H. and Jones, F. F. (1999) Entrepreneurship in Established
Organisation: The case of the public sector, Entrepreneurship and Theory in
Practice, 24(1), 71-91
Morris, M.H. and Kuratko, D.F (2002) Corporate Entrepreneurship, Orlando,
Florida, Hartcourt College Publishers
Morris, M.H. Kuratko, D.F. and Covin, J.G. (2008), Corporate Entrepreneurship
and Innovation, 2nd edition, South-Western CENGAGE Learning, USA
Nunnally, J. C. (1978) Psychometric theory, New York, McGraw-Hill
Obamuyi, T. M. (2010) Firms' Performance and Lending Constraints in Nigeria,
Journal of Entrepreneurship, 19(2), 179-190
Rauch, A. Wiklund, J. Lumpkin, G. T. and Frese. M. (2009) Entrepreneurial
Orientation and Business Performance: An Assessment of Past Research and
Suggestions for the Future, Entrepreneurship theory and Practice, 33(3), 761-
787
Rutherford, M. W. Kuratko, D. F. and Holt, D. T (2008) Examining the Link
between Familiness and Performance: Can the F-PEC Untangle the Family
Business Theory Jungle? Entrepreneurship and Theory in Practice, 32(6),
1089- 1109
Saunders, M. Lewis, P. and Thornhill, A. (1997) Research methods for business
students, 4th edition, London, Financial Times Publishing
Sebora, T. C and Theerapatvong, T. (2009) Corporate entrepreneurship: a test
of external and internal influences on managers’ idea generation, risk taking,
and pro-activeness, International Entrepreneurship and Management Journal,
5(1), 1-20

Shepherd, D. A. Patzelt, H. and Haynie, J. M. (2010) Entrepreneurial spirals:
Deviation-Amplifying loops of an Entrepreneurial mindset and Organisational
Culture, Entrepreneurship and Theory in Practice, 32(1) 59-82
Steffens, P. Davidsson, P. and Fitzsimmons, J. (2009) Performance
Configurations overtime: Implications for Growth- and Profit Oriented Strategies,
Entrepreneurship and Theory in Practice, 33(1), 125-148
Tang, J. Tang, Z. Marino, D. L. Zhang, Y. and Li, Q. (2008), Exploring an
Inverted U-Shape Relationship between Entrepreneurial Orientation and
Performance in Chinese Ventures, Entrepreneurship and Theory in Practice,
32(1), 219-239
Venter, A. Rwigema, H. and Urban, B. (2008) Entrepreneurship: theory in
practice, 2nd edition, Oxford University Press Southern Africa (Pty) Ltd, Cape
Town
Vozikis, G. S. Bruton, G. D. Prasad, D. and Merikas, A. A. (1999) Linking
Corporate Entrepreneurship to Financial Theory Through Additional Value
Creation, Entrepreneurship Theory and Practice, 24(2), 33-43
Wakkee, I. Elfring, T. and Monaghan, S. (2010) Creating Entrepreneurial
employees in Traditional service sectors, International Entrepreneurship and
Management Journal, 6(1), 1-21
Wang, C. L. (2008) Entrepreneurial Orientation, Learning Orientation, and Firm
Performance, Entrepreneurship and Theory in Practice, 32(4), 635-654
Wiklund, J. (1999) The sustainability of the entrepreneurial orientation-
performance relationship, Entrepreneurship Theory and Practice, 24(1), 37-48
Yiu, D. W. and Lau, C. (2008) Corporate Entrepreneurship as Resource Capital
Configuration in Emerging Market Firms, Entrepreneurship theory and Practice,
32(1), 37-57

Zahra, S.A. and Covin, G. (1995) Contextual influences on the corporate
entrepreneurship-performance relationship: a longitudinal analysis, Journal of
Business Venturing, 10(2), 43-58
Zahra, A. S. and Garvis, M. D. (1998) International Corporate Entrepreneurship
and Firm performance: The moderating Effect of International Environmental
Hostility, Journal of Business Venturing, 15(1), 469-492
Zahra, S. A. Nielsen, A. P. and Bogner, W. C. (1999) Corporate
entrepreneurship knowledge, and competence development, Entrepreneurship
Theory and Practice, 23(3), 169-189
Zhao, Y. Li Y. Lee, S. H. and Chen, L. B. (2011) Entrepreneurial Orientation,
Organisational Learning, and Performance: Evidence from China,
Entrepreneurship and Theory in Practice, 35(2), 293-317

APPENDIX A
Cover letter

Research Questionnaires:
Demographics
a) What is the company name?
Company name
b) What is the company size (Firm Size)?
Micro (less than 5 employees)
Small (5 to 50 employees)
Medium ( 51 to 200 employees)
Large (201 or more employees)
c) How long has the organisation been operating (Firm Age)?
0-5 years
6-10 years
11-15years
15years or more
Performance
Performance will be evaluated using ordinary data captured with the below questionnaires.
b) To what extent has the Sales Growth changed over a 5-year period
Less than 0% (negative
growth)
0-10%
11-40%
41-80%
81% or more
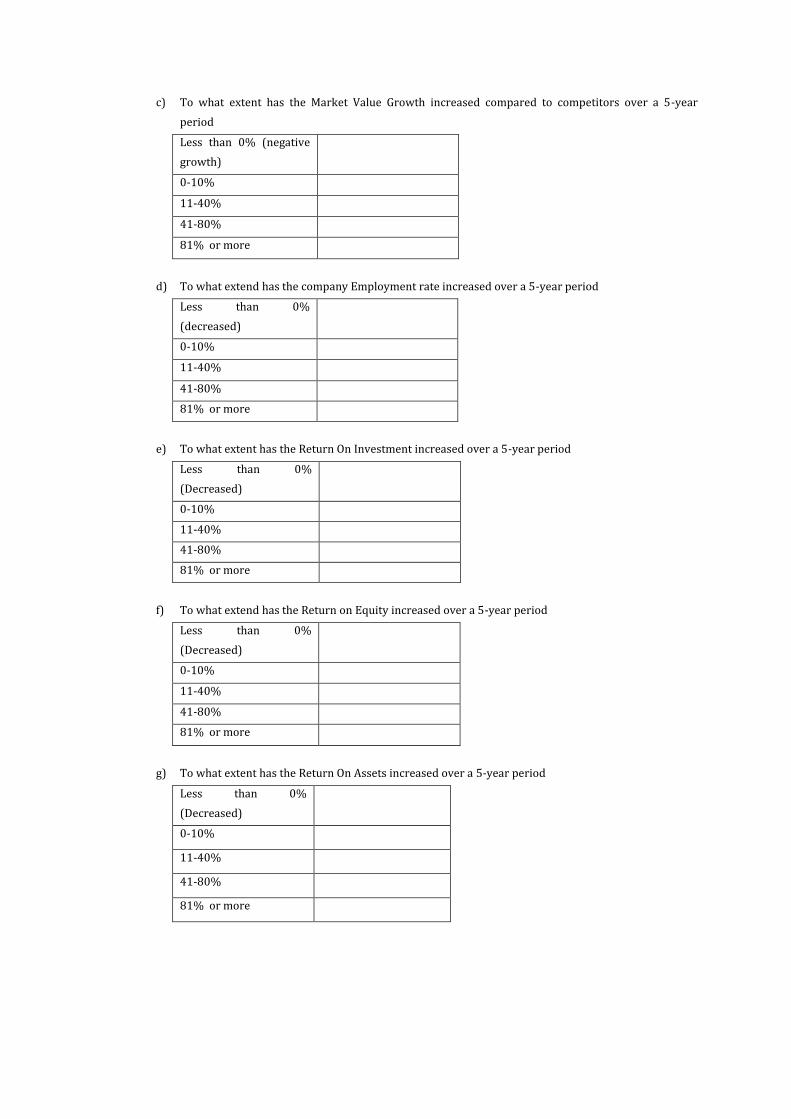
c) To what extent has the Market Value Growth increased compared to competitors over a 5-year
period
Less than 0% (negative
growth)
0-10%
11-40%
41-80%
81% or more
d) To what extend has the company Employment rate increased over a 5-year period
Less than 0%
(decreased)
0-10%
11-40%
41-80%
81% or more
e) To what extent has the Return On Investment increased over a 5-year period
Less than 0%
(Decreased)
0-10%
11-40%
41-80%
81% or more
f) To what extend has the Return on Equity increased over a 5-year period
Less than 0%
(Decreased)
0-10%
11-40%
41-80%
81% or more
g) To what extent has the Return On Assets increased over a 5-year period
Less than 0%
(Decreased)
0-10%
11-40%
41-80%
81% or more

h) To what extent has the Return On Sales (ROS) increased over a 5-year period
Less than 0%
(Decreased)
0-10%
11-40%
41-80%
81% or more
i) To what extent has the Operating Profit increased over a 5-year period
Less than 0%
(Decreased)
0-10%
11-40%
41-80%
81% or more
Innovation
To what extent do you agree or disagree with the following statements? (1 strongly disagree - 5 strongly
agree)
a) Organisation has emphasis on introducing new Technology
Strongly
disagree
Neither
agree/disagree
Strongly
agree
1 2 3 4 5
b) The company has strong focus on Research and Development activities
Strongly
disagree
Neither
agree/disagree
Strongly
agree
1 2 3 4 5
c) Organisation invests heavily on new product development
Strongly
disagree
Neither
agree/disagree
Strongly
agree
1 2 3 4 5
d) Organisation is open to outside ideas that can lead to new business opportunity
Strongly
disagree
Neither
agree/disagree
Strongly
agree
1 2 3 4 5

e) Innovation and creativity are part of the business strategy
Strongly
disagree
Neither
agree/disagree
Strongly
agree
1 2 3 4 5
f) Employees are encouraged to come up with new ideas
Strongly
disagree
Neither
agree/disagree
Strongly
agree
1 2 3 4 5
g) CEO and Leaders are involved in fostering innovation
Strongly
disagree
Neither
agree/disagree
Strongly
agree
1 2 3 4 5
h) There is a reward system for creative and innovative individuals
Strongly
disagree
Neither
agree/disagree
Strongly
agree
1 2 3 4 5
Pro-activeness
To what extent do you agree or disagree with the following statements? (1 strongly disagree - 5 strongly
agree)
a) The organisation is leading in introducing new technology
Strongly
disagree
Neither
agree/disagree
Strongly
agree
1 2 3 4 5
b) Organisation is leading in new market identification
Strongly
disagree
Neither
agree/disagree
Strongly
agree
1 2 3 4 5
c) The proactive individuals in the system are being rewarded
Strongly
disagree
Neither
agree/disagree
Strongly
agree
1 2 3 4 5

d) Organisation always strives for market share through proactive sales
Strongly
disagree
Neither
agree/disagree
Strongly
agree
1 2 3 4 5
e) Organisation always strive to introduce new product or services ahead of competitors
Strongly
disagree
Neither
agree/disagree
Strongly
agree
1 2 3 4 5
f) Organisation always foresees potential environmental changes and future demands ahead of
the competitors
Strongly
disagree
Neither
agree/disagree
Strongly
agree
1 2 3 4 5
g) The organisation shows a great deal of tolerance for high risk projects and rewards
individuals for taking calculated risks. I would split this item into two
Strongly
disagree
Neither
agree/disagree
Strongly
agree
1 2 3 4 5
h) Employees are encouraged to take action on their new ideas
Strongly
disagree
Neither
agree/disagree
Strongly
agree
1 2 3 4 5
i) Organisation structure supports proactive division through a recognition system
Strongly
disagree
Neither
agree/disagree
Strongly
agree
1 2 3 4 5

Risk taking
To what extent do you agree or disagree with the following statements? (1 strongly disagree - 5 strongly
agree)
a) The organisation Research and Design division has a culture of introducing new products in the
complex market
Strongly
disagree
Neither
agree/disagree
Strongly
agree
1 2 3 4 5
b) Organisation commits significant resources to ventures in uncertain conditions
Strongly
disagree
Neither
agree/disagree
Strongly
agree
1 2 3 4 5
c) Business growth is driven by new Innovations which brings potential customer business
failures
Strongly
disagree
Neither
agree/disagree
Strongly
agree
1 2 3 4 5
d) The organisation takes bold actions by venturing in the unknown business environments
Strongly
disagree
Neither
agree/disagree
Strongly
agree
1 2 3 4 5
e) The organisation shows a great deal of tolerance for high risk projects and rewards individuals
for taking calculated risks.
Strongly
disagree
Neither
agree/disagree
Strongly
agree
1 2 3 4 5
f) The organisation strives to be the first in the market with new services while the future remains
unknown.
Strongly
disagree
Neither
agree/disagree
Strongly
agree
1 2 3 4 5

Entrepreneurial Culture
To what extent do you agree or disagree with the following statements? (1 strongly disagree - 5 strongly
agree)
a) The company has a culture that encourages new ideas
Strongly
disagree
Neither
agree/disagree
Strongly
agree
1 2 3 4 5
b) The organisational creates an environment that support entrepreneurship
Strongly
disagree
Neither
agree/disagree
Strongly
agree
1 2 3 4 5
c) The company empowers its employees to decide and act
Strongly
disagree
Neither
agree/disagree
Strongly
agree
1 2 3 4 5
d) Management support influences corporate entrepreneurship in the organisation
Strongly
disagree
Neither
agree/disagree
Strongly
agree
1 2 3 4 5
e) Organisation emphasizes accountability and commitment
Strongly
disagree
Neither
agree/disagree
Strongly
agree
1 2 3 4 5
f) Organisation encourages freedom to grow and sometimes fail (no punishment for failure)
Strongly
disagree
Neither
agree/disagree
Strongly
agree
1 2 3 4 5
g) Organisation embraces entrepreneurial behaviour
Strongly
disagree
Neither
agree/disagree
Strongly
agree
1 2 3 4 5
h) Senior Managements in the organisation are entrepreneurial role models
Strongly
disagree
Neither
agree/disagree
Strongly
agree
1 2 3 4 5

i) The goal of the Entrepreneurial culture is to have entrepreneurship as the life-blood of the
organisation.
Strongly
disagree
Neither
agree/disagree
Strongly
agree
1 2 3 4 5
APPENDIX B
Respondents’ Snapshot

APPENDIX C
Responded Companies
Company Name Company Name Company Name Software AG SS Telecoms Ericsson Sub-Sahara Ltd Voxtelecom Duxbury Networking Aircom International SABC Lenovo Platinum producing organisation Tradepage Curasoftware Tradepage Samsung Networkers MSB Fujitsu Gijima XON Deloitte Morvest Magix Vodacom SA DigiPos Detecon International Praxis Alcatel-Lucent MWEB Business WhichVoIP.co.za HansaWorld Compuways Oracle Corporation
Eaton Ovations Technologies (Pty) Ltd MigrationWare
BulkSMS Sentient Communications Global Pact Trading 3 (Pty) Ltd T/A Orange Business Services
Attachmate Neotel Coral Matrix Ascent Technology IBM SA tappanselectrical Excelintegration KYOCERA MITA SA Dimension Data Reagola IT Telfree Alacrity Technologies (Pty) Ltd. 4most Nashua Communications EMSS Misys PROTEA TECHNOLOGY GTL LIMITED
NET2BE F5 Corporate Communications Motorola
Bitrate NetApp Schuller Aspect Software PCB Technologies Multichoice Technical Operations (Pty) Ltd Xlink Communication Huge Telecom GlobeTOM Talk Fusion ZTE The Lusito Group Rackspace Hosting 4G Technology Executive Business Solutions Inala Technologies Opentext NSN Puleng Technologies Toshiba Boniswa T-Systems Phoenixsoftware Nasp Xiotech Stortech Telkom Axiz Comztek MTN SA Panviva SA AvePoint Hyland Software, Incorporated Digiform Nokia Maxxor Business Solutions
Misys Netsurit Biodata IT South Africa Pty Ltd Atio Corporation Michelangelo Technology Transnet Feright Rail Zensar Technologies bSOLVe 8ta Azuro Business Solutions O-Tel HUAWEI Cell C Aquatelecoms R and S Consulting Upper Edge BITanium Consulting Datacentrix AlanDick Africa Bnck