Embed Size (px)
Citation preview
ReseaRch aRticle
Abstract: 0 We investigate the effect of product diversity and geographic diversity on the performance of
sMes, using an integration of the upper echelons literature with the product and geographic diversification literature.
0 We propose an inverted U shaped relationship between product (geographic) diversification (PD/GD) and the performance of SMEs. We also propose that effect of PD and GD is con-tingent on one another and the TMT experience.
0 We find that both PD and GD have an inverted U shaped relationship with the SME perform-ance. Further, PD and GD interact positively to enhance each other’s value in affecting firm performance. TMT experience also enhances the value of PD and GD for firm performance.
Keywords: Product diversification · Geographic diversification · Top management teams · SMEs · Performance · Germany
Manag int Rev (2010) 50:35–56DOI 10.1007/s11575-009-0025-4
Corporate Diversification, TMT Experience, and PerformanceEvidence from German SMEs
Deeksha A. Singh · Ajai S. Gaur · Florian P. Schmid
Received: 18.05.2007 / Revised: 14.09.2008 / Accepted: 18.11.2008 / Published online: 22.01.2010© Gabler-Verlag 2010
PhD Cand. D. A. SinghDepartment of Business Policy, National University of singapore, singapore
Ass. Prof. A. S. GaurDepartment of Management and Global Business Rutgers University, Newark, New Jersey, Usae-mail: [email protected]
Dr. F. P. Schmidsenior consultantRoland Berger strategy consultants, Munich, Germany
36 D. A. Singh et al.
Introduction
Diversification-performance relationship is a widely explored research question in stra-tegic management and international business. Over the years, scholars have accumulated empirical findings as well as theoretical arguments for varying nature of diversification-performance relationship, both across time and countries (Khanna and Rivkin 2001; lu and Beamish 2004; Mayer and Whittington 2003). In spite of a vast body of literature investigating the impact of product and geographic diversification on firm performance, there are still many unanswered questions, keeping scholars interested in continuing with this line of inquiry (Chakrabarti et al. 2007; Mayer and Whittington 2003; Wiersema and Bowen 2008).
There are two dimensions on which the diversification-performance research has advanced in recent years. First, scholars have attempted to establish the cross-country validity (lu and Beamish 2004; Mayer and Whittington 2003) of the theoretical argu-ments and empirical findings obtained mainly in the US context. These cross-country investigations have revealed many interesting findings (e.g. Lu and Beamish 2004) and advanced the theory development (Khanna and Rivkin 2001). Second, scholars have shifted focus from simply investigating the diversification-performance relationship, to identifying the contingency factors on which this relationship may be dependent (chakra-barti et al. 2007).
We design the current study on the above two dimensions, utilizing a novel empiri-cal context, and identifying important contingency factors for diversification-perform-ance relationship. Using a unique panel database of small and medium sized enterprises (SMEs) in Germany, we investigate how the product diversification (PD) and geographic diversification (GD) individually and jointly affect the performance of SMEs. We further argue that, given the top management team (tMt) plays a very crucial role in the case of sMes (autio 2000; Oviatt and McDougall 1994; Reuber and Fischer 1997, 2002), the relationship between product/geographic diversification and performance should be contingent upon the TMT experience. We develop our arguments utilizing the literature on PD (Mayer and Whittington 2003), GD (lu and Beamish 2004; tallman and li 1996), and the upper echelons perspective (Finkelstein and Hambrick 1996; hambrick and Mason 1984).
In our study design, we follow the principal of replicative extension (Singh et al. 2003), by using the existing methodological frameworks, while extending it to a new empirical context, and establishing the importance of new contingency factors. In doing so, this study contributes to the literature in three ways. First, we contribute to the PD and GD literature by providing empirical findings for German SMEs, a context largely unexplored in literature. Second, we establish how PD and GD might affect each other’s value for firm performance. Much of the extant literature conceptualizes the costs and benefits of PD and GD on standalone basis, without due consideration to how one might affect the other (see Hitt et al. 1997; tallman and li 1996 for exception). Given that the decisions about PD and GD are often taken simultaneously, or because of each other, it is important to investigate their joint effects. Third, we theorize TMT experience as an important con-tingency variable affecting the diversification performance relationship for SMEs. Even though some studies acknowledge that diversification performance relationship may vary
37Corporate Diversification, TMT Experience, and Performance
across time due to learning effects (Grant et al. 1988), tMt experience as a contingency factor has been largely ignored in the diversification literature.
We test our arguments using a sample of 565 German sMes, as observed over an eight-year period. We collected this information through two extensive surveys of SMEs oper-ating in Germany, conducted in 2003 and 2007. Our panel data estimation shows that both PD and GD have an inverted U shaped relationship with the SME performance. Further, PD and GD interact positively to enhance each other’s value in affecting firm perform-ance. TMT experience also enhances the value of PD and GD for firm performance.
Theory and Hypotheses
Product Diversification
there have been several reviews of literature on PD – performance relationship (Datta et al. 1991; Palich et al. 2000). Scholars have documented the gains and costs associated with PD, as well as contingency factors that affect the gains and costs of PD. Firms diver-sify for several reasons, such as scope economies and increased market power (Markides and Williamson 1996), more efficient utilization of existing resources and capabilities (Barney 1997), reducing risk and variability in performance, and securing against future uncertainties (lubatkin and chatterjee 1994). A single business firm is not capable of exploiting the synergies that may be available across a portfolio of businesses (lubatkin and chatterjee 1994). Multi-business firms, on the other hand, benefit from asset amorti-zation across multiple activities, diffusion of product and process technology across dif-ferent units, and the learning curve efficiencies (Barney 1997; Markides and Williamson 1996).
PD is likely to be beneficial as long as it is within the scope of firm’s existing resources and capabilities (chi 1994). Beyond a point, there may not be any additional gains from PD, as firms’ resources reach the saturation point in generating rent (Tallman and Li 1996). Along with the gains, PD also brings additional internal governance costs (Jones and hill 1988). These costs arise due to increased complexity in managing diverse opera-tions and increased information processing requirements on the firm management (Grant et al. 1988). There are several other costs that highly diversified firms have to incur, such as those arising due to increased shirking on part of the managers, inefficiencies in inter-nal capital allocation, and increased bureaucracy (Nayyar 1992). Thus with an increase in PD, the gains increase until a point, after which marginal gains from PD become very small. Costs, on the other hand, increase rapidly at higher levels of PD. The net effect of costs and benefits suggest that PD may be beneficial only until a point, after which addi-tional PD may reduce firm performance (Palich et al. 2000; tallman and li 1996).
The above arguments have been developed and tested primarily on large firms coming from the US and Europe. A few studies that have looked at the PD – performance relation-ship for sMes (Qian 2002), have not elaborated how the gains and costs of PD vary in the case of SMEs. The resource configuration of SMEs is often quite different from that of large firms. SMEs often do not possess established brand or unique products, have limited marketing and research and development budgets, managerial talent, market reputation,
38 D. A. Singh et al.
and have limited access to external sources of finance (Jarillo 1989; Vesper 1990). SMEs, therefore, diversify into other areas, not from a position of strength, but to strengthen their position (Gaur and Kumar 2008). As SMEs diversify, they gain in terms of external visibility and reputation, making it easier for them to access loans from banks as well as others sources of external finance. With improvement in visibility and reputation, SMEs can also attract more qualified and experienced managers. These additional resources, obtained as a result of diversification are likely to enhance SMEs’ performance.
There is, however, a limit to the gains in visibility and reputation for SMEs. Beyond a point, the marginal increase in visibility and reputation is not of much help, as the costs of diversification start mounting up. The increased complexity and governance problems are particularly damaging for sMes as they do not have much past experience or capability in handling the complexities involved in managing a highly diversified organization (Qian 2002). As a result, PD is likely to enhance the performance of SMEs up to a certain point, beyond which, further PD reduces an SME’s performance. Accordingly we hypothesize:
Hypothesis 1: There is an inverted U shaped relationship between product diversification and an SME’s performance.
Geographic Diversification
like the PD-performance relationship, GD-performance relationship has also been very extensively studied. Extant research on GD-performance relationship can be classified into three categories. The first category comprises research that focuses on establishing the relationship between GD and firm performance without much attention to the con-tingency factors (e.g. Geringer et al. 1989; tallman and li 1996). The second category comprises research that focuses primarily on the contingency conditions affecting GD-performance relationship (e.g. Hitt et al. 1997; Kotabe et al. 2002). The third category comprises research that explores the relationship in different empirical settings (e.g. capar and Kotabe 2003; Nachum 2004).
Overview of the literature for the past thirty years reveals mixed results. Scholars have found a positive (Delios and Beamish 1999; Hitt et al. 2006), negative (Denis et al. 2002; Geringer et al. 2000), inverted “U” shaped (Geringer et al. 1989; Hitt et al. 1997), “U” shaped (lu and Beamish 2001), “S” shaped (Contractor et al. 2003; lu and Beam-ish 2004), as well as no relationship (Dess et al. 1995) between GD and firm perform-ance. Given the range of time-periods, country coverage, and types of firms studied, it is quite natural to have different results across studies. We argue that rather than debating about the nature of the GD-performance relationship, it is more critical to identify reasons behind a particular type of relationship.
as has been the case with PD literature, much of the theory development in GD litera-ture has been done keeping in mind the large firms. The main theoretical perspective used to explain GD and its consequences, relies on the thesis that multinational enterprises (MNEs) possess ownership specific advantages, which allow them to compensate for the costs and risks associated with operating in foreign markets (caves 1971). Dunning (1993) combined the arguments of some of the other theoretical perspectives to propose the Oli framework for explaining firm internationalization. Both, proprietary assets approach as
39Corporate Diversification, TMT Experience, and Performance
well as the OLI framework is not adequate to explain the GD-performance relationship for sMes due to the emphasis on market failure and internalization incentives of the proprietary assets as critical conditions of international diversification. Large firms often enjoy considerable domestic market share and proprietary assets before they internation-alize. In addition, their internationalization often follows the stages model (Johanson and Vahlne 1977), in that they gradually increase their internationalization passing through different stages. The same is not always true for SMEs, which have limited resources and capabilities (Jarillo 1989; Vesper 1990). Scholars have also suggested that SMEs do not always follow the stages model of internationalization as they skip some of the stages in the internationalization process (Oviatt and McDougall 1994; Reuber and Fischer 1997). As a result, the cost-benefit analysis of internationalization done on the large firms may not hold for SMEs.
in order to understand the gains and losses from GD for sMes, we need to look at the motives SMEs have for GD. Zacharakis (1997) summarizes the motives for sMe internationalization. These include maturing domestic markets (Namiki 1988), increasing foreign competition within the domestic market (Robinson and Pearce 1984), and avail-ability of easy opportunities in foreign markets. Because of their weaker resource endow-ments, sMes are particularly prone to the competition from foreign players in the home markets (Robinson and Pearce 1984). SMEs, therefore internationalize to overcome the disadvantages they face if they operate only in the domestic markets (Gaur and Kumar 2008).
Scholars have identified three distinct stages of internationalization: Early, growth, and mature (Contractor et al. 2003; lu and Beamish 2004). In the early stages of internation-alization, MNes face several challenges, such as learning, coordination, and set-up costs, unfamiliarity hazards, and higher transaction costs due to lack of experience in manag-ing agents at a distance. The internationalization process of SMEs typically begins with exports or entry into familiar markets (McDougall et al. 1994). The commitment and the risks associated with these activities are limited, given the limited scope of international activities. As an example, the country coverage for German SMEs covered in our sample varied from one to thirteen, with 75% of the firms operating in three or less countries, and 90% of the firms operating in five or less countries. Consistent with Rugman and Verbeke (2005), most of the internationalization activities of the German sMes are limited to the neighboring countries of the european Union, which is essentially an extension of the domestic German market, with little additional challenges. This means that the challenges of early phase of internationalization, which have been conceptualized for large MNes, may be limited for SMEs.
At the same time, the limited international activities help SMEs in several ways. First, SMEs typically operate in niche markets, with limited scope for growth. International markets complement their domestic markets, providing much needed avenues for growth (McDougall et al. 1994). Second, operating in foreign markets allows SMEs to better manage the demand and supply fluctuations that firms face when operating in a single geographic market (Kim et al. 1993). SMEs can procure better quality and cheaper raw material, and sell in the markets that give maximum premium on their products (Gupta 1989). As a result, SMEs experience less fluctuation in performance, which helps in enhancing the long-term firm profitability. Third, going international provides SMEs with
40 D. A. Singh et al.
an opportunity to understand and learn the global best practices, and competitors’ strate-gies (Gupta 1989). Such learning is likely to be beneficial not just in future internation-alization activities, but also in domestic operations, giving sMes competitive advantage over their domestic counterparts (Gaur and Kumar 2008). Thus, in the early stages of GD, the gains are likely to be more than the costs for SMEs.
as sMes increase their GD, the gains are likely to increase, but at the same time, the costs also increase, and at a much faster rate than the increase in gains. This is because extensive global operations entail high level of governance costs, as well as greater mana-gerial information processing demands (Hitt et al. 1997; Jones and hill 1988). SMEs lack the resources, experience, and expertise needed for managing the complexities arising due to extensive global operations (Hitt et al. 1997). While the costs increase, SMEs may also not be able to make full use of the benefits that come with a high level of GD, because of their limited resource endowments. For example, an SME, supplying auto components to a big automaker, may not have financial resources and technical expertise to become a supplier to other auto makers. The net result is a reduction in the performance of SMEs if they indulge in high level of GD. These arguments suggest that SMEs benefit from GD only to a certain extent, after which their performance suffers with an increase in the GD. accordingly,
Hypothesis 2: There is an inverted U shaped relationship between geographic diversifica-tion and an SME’s performance.
Joint Effect of Product Diversification and Geographic Diversification
One of the main reasons for firms to diversify in different product categories and geo-graphic markets is to satisfy their growth objectives. The PD and GD decisions are often made keeping in mind the long-term implications of these decisions for the firm (Tallman and li 1996; Qian 1997). Given the importance of these decisions, it is surprising that not much research has been done to explore the joint impact of PD and GD for firm perform-ance. The only study we found on SMEs (Qian 2002), relied on the literature on large firms to conceptualize the joint effect of PD and GD for SME performance. The studies done on large firms report a negative (Tallman and Li 1996) as well as positive (Hitt et al. 1997; Kim et al. 1993) joint effect of PD and GD on firm performance.
As we have argued earlier, SMEs differ from large firms in a number of ways, making it important to develop distinct theoretical arguments for SMEs. The GD for SMEs, espe-cially those coming from the european Union, may not be much different from their PD, in terms of the additional complexities associated with the higher level of diversification. For European Union SMEs with limited GD, the international market is a mere extension of domestic market due to common currency and free trade area. The experience, SMEs obtain in managing diverse operations in domestic markets, helps them when they inter-nationalize in a limited way. In a similar manner, the experience SMEs obtain in interna-tional markets, helps them in managing the complexities associated with limited PD (hitt et al. 1997; Kim et al. 1993). This leads us to the following hypothesis:
41Corporate Diversification, TMT Experience, and Performance
Hypothesis 3: Product diversification and geographic diversification positively interact such that for a given level of product (geographic) diversification, SMEs with higher level of geographic (product) diversification perform better than SMEs with lower level of geographic (product) diversification.
Moderating Role of tMt experience
Research on upper echelons perspective (Finkelstein and Hambrick 1996; hambrick and Mason 1984) suggests that the tMt is the brain center of an organization, and the effec-tiveness of any strategy depends on how well the tMt formulates and implements a particular strategy. The cost-benefit analysis of PD and GD presented earlier suggests lack of experience and expertise as important factors responsible for the costs associated with PD and GD. PD and GD bring more governance complexities and higher informa-tion processing requirements for the managers (Grant et al. 1988; Reuber and Fischer 1997, 2002).
experienced top executives help in multiple ways, such as bringing knowledge of opportunities, threats, competitive conditions, and regulations in the environment, as well as in developing goodwill and a good reputation with a firm’s suppliers and customers (Kor 2003). Knowledge and experience of the industry aids managers in detecting and assessing emerging opportunities, outlining proper strategies, and introducing new prod-ucts and services strategically (castanias and helfat 2001). New developments in tech-nology, competition, government regulations as well as other environmental conditions are connected to prior industry conditions (Oster 1999). Finally, a manager’s experience brings with itself capabilities to maximize the productivity of other resources available to a firm (Penrose 1959, p. 5), as well as to make the best use of the opportunities available in the external environment. Path dependencies in resource accumulation and capability development make the prior experience of a tMt important for an sMe, as sMes do not have much prior organizational history to rely upon.
SMEs with more experienced TMTs may find it easier to manage the complexity asso-ciated with a higher level of PD and GD, reducing the costs associated with PD and GD. at the same time, greater tMt experience may help in achieving better synergies in an SME’s operations across different products and geographic boundaries, enhancing the gains from PD and GD. There is already some evidence of the positive effect of TMT experience in enhancing the value of various firm strategies. For example, studies looking at the internationalization of SMEs have shown the importance of experientially-acquired tacit knowledge in affecting internationalization outcomes (athanassiou and Nigh 1999; 2000; Eriksson et al. 1997) and in reducing the uncertainty about the external environ-ment for sMes (lu 2002). Other scholars have also found that the TMT experience in SMEs is positively related to an SME’s propensity to develop foreign strategic partners and to the pace of internationalization (Reuber and Fischer 1997). Along similar lines, we expect that a greater experience of the tMt should positively moderate the relationship between PD/GD and the performance of SMEs.
42 D. A. Singh et al.
Hypothesis 4a: tMt experience positively moderates the relationship between product diversification and SME performance such that for a given level of prod-uct diversification, SMEs with higher TMT experience perform better.
Hypothesis 4b: tMt experience positively moderates the relationship between geo-graphic diversification and SME performance such that for a given level of geographic diversification, SMEs with higher TMT experience per-form better.
Methods
sample
Our sample comprises small and medium-sized unlisted German manufacturing enter-prises. There are several aspects of German context that make it unique as well as inter-esting. For example, the manufacturing sector in Germany is dominated by engineering related industries in general and automotive firms in particular. Dominance of engineer-ing related industries makes the TMT quite important for these firms. This is evident from the fact that half of the firms in our sample had a CEO with a Ph D degree. Germany is also an important member of European Union, which makes it easy for firms to manufac-ture and distribute their products across all the member countries. As a result, firms do not face the challenges faced during the initial stages of internationalization and even a small level of GD is likely to be beneficial.
the German context is also different from other eU countries as well as the Us con-text, in that many firms in Germany with a small number of employees have high market shares in their niche-market and are sometimes even industry and/or technology leaders. This makes it important to identify the right population for a study on SMEs.
To identify what is an SME in the German context, we first worked with the definition provide by the Commission of the European Union, which identifies all firms with less than 250 employees as SMEs. This contrasts with the US government’s definition, which considers firms with a number of employees of 500 or less as an SME. Faced with this difference in definitions, we interviewed senior executives from banks and consulting firms such as Deutsche Bank Corporate Finance, Roland Berger Strategy Consultants, Bain and Company, Sannwald Jaenecke and Cie., HVB Consult GmbH to develop a bet-ter understanding of SMEs in the German context. In our interviews, a general consensus emerged which identified two conditions that could be used to identify a firm as an SME: (1) The turnover of the firm should not be more than one billion Euros, and, (2) the firm should not be listed on any stock exchange.
Based on the above criteria, we compiled a list of 3,978 SMEs from information from various industry associations such as Verband Deutscher automobil industrie (an association of German automobile manufacturers and supporting companies), www.marktplatz-mittelstand.de, and organizations such as sannwald Jaenecke and cie and Hypovereinsbank Munich. In making this compilation, we obtained the contact informa-tion of ceOs and/or board members through the directories of these associations as well as through an extensive search on the internet. It is worthwhile to mention here that there
43Corporate Diversification, TMT Experience, and Performance
are a total of 106,398 manufacturing enterprises in Germany, according to the Institut für Mittelstandsforschung Bonn. Of these, 8,088 are listed firms which we do not include in our study. Ninety percent of the remaining firms are micro and very small enterprises with less than 10 full time employees. These are also not included in our research. This leaves us with a population of about 9,800 industrial enterprises which we could target for our surveys. Of the possible 9,800 firms, we could obtain addresses for 40% or 3,978 firms.
Data collection
We obtained data using a questionnaire targeted at the board members or the CEO of the firm. We chose the TMT as respondent, since this group is likely to have rich and accurate information, due to its central control function within the organization.
We conducted the survey in two rounds, with multiple waves in each round. We admin-istered the first round of surveys in three months beginning September 2004. In the first round, we asked respondents to provide information for five years, inclusive from 1999 to 2003. We sent the questionnaires to all the 3,978 firms in the first round. Three weeks later, 213 companies replied with completed questionnaires. We sent a follow-up to the non-respondents in October 2004, resulting in another 258 responses. A third wave of reminders to the non-respondents in November yielded another 234 responses. Thus we obtained a total of 705 completed questionnaires, for a response rate of 17.72%. Some questionnaires had a large amount of missing data, especially regarding the financial information of the firm. After removing the questionnaires with incomplete information, we were left with 565 usable questionnaires. This response rate of 14.2% is well within the range of 10−15% suggested for mail-in surveys (Yu and Cooper 1983).
We administered the second round of surveys over two months, beginning June 2007. In the second round we targeted only those firms that had responded in the first round, and asked them to provide information for three years, inclusive from 2004 to 2006. We received 160 responses within the first four weeks, after which we sent a reminder. This resulted in another 148 responses in next five weeks. We had to discard 19 of these responses due to missing data on key variables, resulting in the final sample of 289 firms for the 2004–2006 time period. Once we aggregated responses from the two rounds of surveys, we had an unbalanced panel of 3,692 firm year observations.
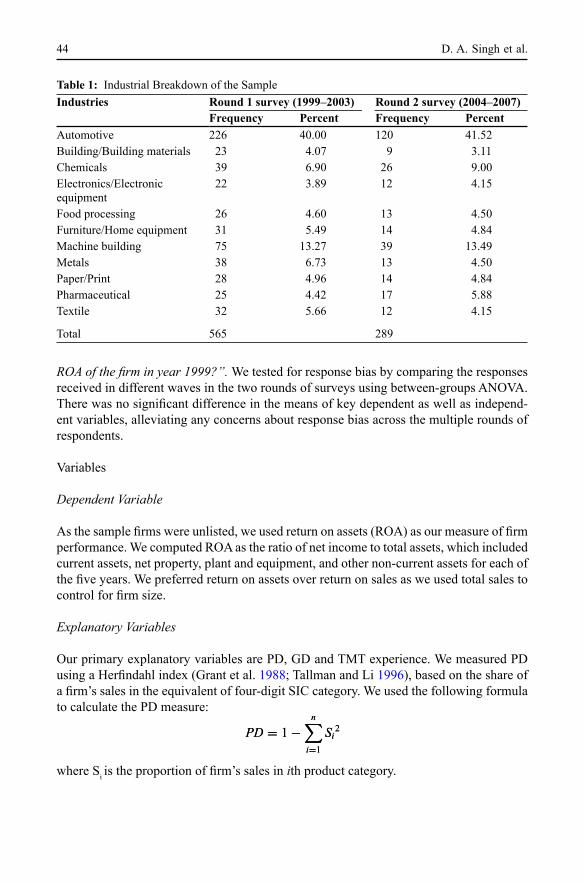
Our sample comprised manufacturing firms from ten different industries. These include automotive, chemicals, building material, electronics, food processing, home equipment, machine building, metals, paper, pharmaceutical and textile. None of these firms were foreign owned or subsidiaries of foreign firms. Table 1 presents the industrial breakdown of our sample. There was a strong presence of automotive firms in our sample (41%), which is somewhat representative of the German context given the dominant presence of world class automotive firms such as Mercedes, BMW, Audi, Prosche, Volkswagen, Opel etc in Germany. The presence of these large automotive firms has led to the emergence of several smaller firms that support the large firms. This can be gauged by the fact that the automotive sector in Germany employs more than 1.1 million people. The German automotive supply industry alone generated revenues of 75.4 billion Euros in 2007.
The questions we included in the survey, asked the respondents factual information on the key variables. For example, a typical question read as following: “What is the
44 D. A. Singh et al.
ROA of the firm in year 1999?”. We tested for response bias by comparing the responses received in different waves in the two rounds of surveys using between-groups ANOVA. There was no significant difference in the means of key dependent as well as independ-ent variables, alleviating any concerns about response bias across the multiple rounds of respondents.
Variables
Dependent Variable
As the sample firms were unlisted, we used return on assets (ROA) as our measure of firm performance. We computed ROA as the ratio of net income to total assets, which included current assets, net property, plant and equipment, and other non-current assets for each of the five years. We preferred return on assets over return on sales as we used total sales to control for firm size.
Explanatory Variables
Our primary explanatory variables are PD, GD and TMT experience. We measured PD using a Herfindahl index (Grant et al. 1988; tallman and li 1996), based on the share of a firm’s sales in the equivalent of four-digit SIC category. We used the following formula to calculate the PD measure:
where si is the proportion of firm’s sales in ith product category.
PD = 1−n
i=1
Si2PD = 1−
n
i=1
Si2
Table 1: industrial Breakdown of the sampleIndustries Round 1 survey (1999–2003) Round 2 survey (2004–2007)
Frequency Percent Frequency Percentautomotive 226 40.00 120 41.52Building/Building materials 23 4.07 9 3.11chemicals 39 6.90 26 9.00electronics/electronic equipment
22 3.89 12 4.15
Food processing 26 4.60 13 4.50Furniture/Home equipment 31 5.49 14 4.84Machine building 75 13.27 39 13.49Metals 38 6.73 13 4.50Paper/Print 28 4.96 14 4.84Pharmaceutical 25 4.42 17 5.88textile 32 5.66 12 4.15
total 565 289
45Corporate Diversification, TMT Experience, and Performance
We measure GD by the ratio of foreign sales to total sales. Use of foreign sales to total sales as a measure of the GD is consistent with majority of previous studies (capar and Kotabe 2003; tallman and li 1996). We measured TMT experience by the average number of years for which the TMT members have worked in a particular industry. We use a year-count measure of experience as it captures the breadth of industry specific experience that the TMT members have.
Control Variables
We controlled for the size of the firms ( Sales), the age of the firms ( Age), their capital structure ( Leverage), technological capabilities ( R&D), advertising capabilities ( Adver-tising) and industry effects ( Automotive).
We used firm size to control for economies and diseconomies of scale at the corporate level. We measured a firm’s size by the natural logarithm of its total sales. We meas-ured the age of the firm by the total number of years since its inception to the year of observation. We controlled for the capital structure of the firm using the debt to equity ratio, which can affect corporate financial performance. We also controlled for techno-logical and advertising capabilities of a firm as these two are important resources affect-ing firm performance. We measured technological capability as the ratio of total research and development expenditure to total sales. Advertising capability was the ratio of total investments in marketing to total sales. In our sample, there were a large number of firms operating in the automotive sector. Accordingly, we defined an industry dummy which took a value of 1 for automotive sector, and 0 otherwise.
Modelling Procedure
We examined the effect of PD, GD and tMt experience on sMe performance using a firm-year unit of analysis over the eight-year period from 1999−2006. With firm-year records for performance analysis, we used General Linear Square (GLS) Random-Effects models to test the hypotheses. GLS models provide corrections for the presence of autocor-relation and heteroscedasticity in pooled time series data (Kmenta 1986). This methodol-ogy allows researchers to examine variations among cross-sectional units simultaneously with variations within individual units over time (hsiao 1995). It assumes that regression parameters do not change over time and do not differ between various cross-sectional units, enhancing the reliability of the coefficient estimates.
We use random effects estimation since the environmental uncertainty variable is static over time. However, an important assumption of random effects estimation is that unobserved heterogeneity is uncorrelated with independent variables. We tested for the validity of this assumption by comparing the coefficients of random effects models and fixed-effects models using the Hausman test without the environmental uncertainty vari-able (Baltagi 1995). The Hausman test examines the null hypothesis that the coefficients estimated by the random effects estimator are the same as the ones estimated by the fixed effects estimator. The results indicated that there was no systematic difference between the coefficients from the two models (Prob > chi2 = 0.856). Therefore, the random effects estimation is appropriate in our analyses.
46 D. A. Singh et al.
Results
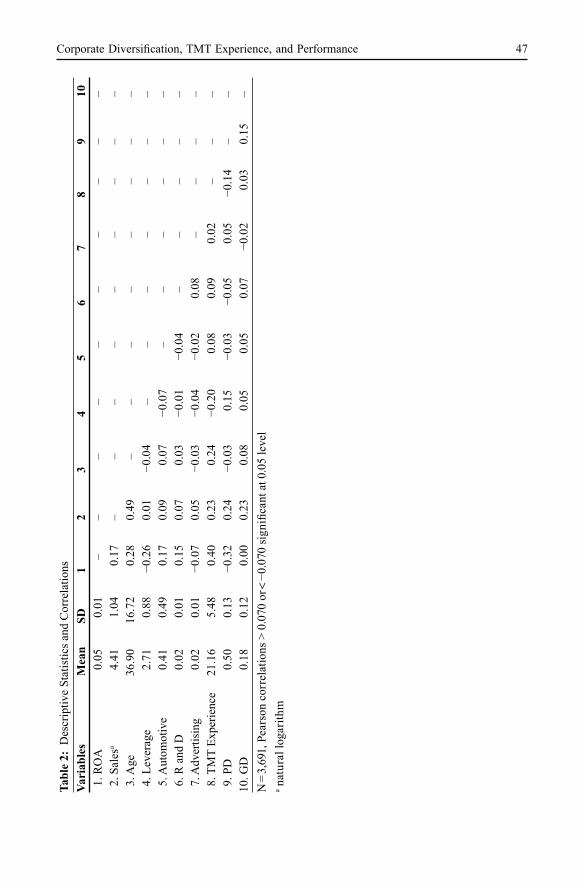
table 2 provides descriptive statistics and correlations. Forty one percent of the firms were from the automotive sector. The average age of these firms was 37 years. The mean value of PD was 0.50, while the mean value of foreign sales to total sales (GD) was 0.18. None of the correlations were high enough to warrant any suspicion of multicollinearity.
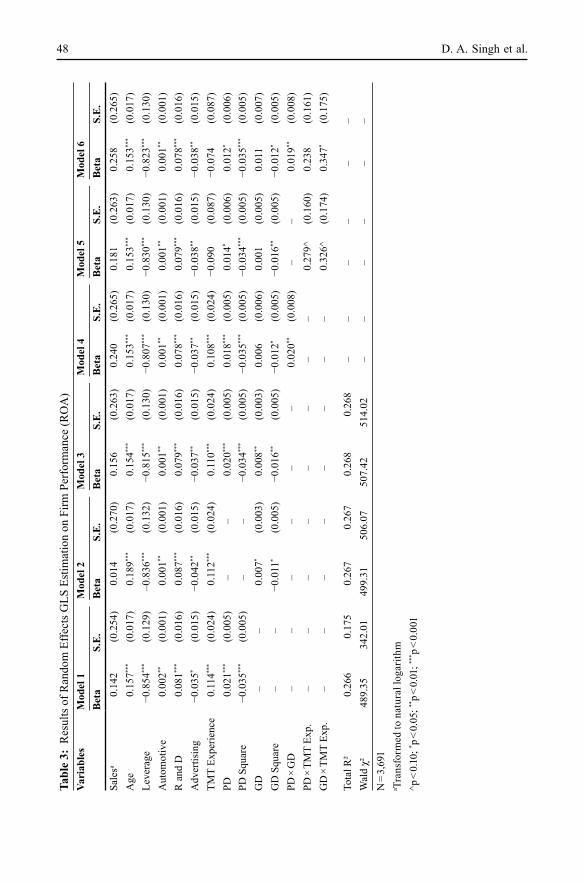
table 3 provides the results of GLS random effects estimation for different models. We built the models in a hierarchical manner to assess the stability of the results. In Model 1, we entered all the control variables, along with the linear and square term of PD. In Model 2, we replaced the linear and square terms of PD with the corresponding terms of GD. Model 3 had both PD and GD along with their square terms. In Model 4, we introduced interaction between PD and GD. In Model 5, we introduced the interactions between PD/GD and TMT experience. Finally, in Model 6, we introduced all the effects at once.
as indicated in table 3, model fit improved for each model in which we introduced a new variable or interaction effect. Model 1 shows that automotive industry dummy, age, and R&D intensity had a positive impact on firm performance whereas firm leverage and advertising intensity had a negative impact. Size of the firm as measured by logarithmic of sales was not significant. TMT experience, however, had a positive effect on SME performance. These effects remain consistent across different models.
hypothesis 1 predicted an inverted U shaped relationship between PD and sMe performance. In Model 2, the linear term of PD was positive and significant (Model 1: β = 0.021, p < 0.001), while the square term was negative and significant (Model 1: β = −0.035, p < 0.001). This suggests that performance improves with an increase in PD until a certain point, after which any further increase in PD leads to deterioration in per-formance. This effect remains the same in Model 3, when we introduce the GD variables. Hypothesis 1 is supported. Hypothesis 2 predicted an inverted U shaped relationship between GD and SME performance. In Model 1, the linear term of GD was positive and significant (Model 2: β = 0.007, p < 0.05), while the square term was negative and sig-nificant (Model 2: β = −0.011, p < 0.05). This suggests that performance improves with an increase in GD until a certain point, after which any further increase in GD leads to dete-rioration in performance. This effect remains the same in Model 3, when we introduce the PD variables. Hypothesis 2 is supported. Hypothesis 3 predicted a positive interaction effect between PD and GD. In Model 4, the coefficient for the interaction between PD and GD is positive and significant (Model 4: β = 0.020, p < 0.01). Hypothesis 3 is supported.
Hypothesis 4a and 4b predicted a positive interaction effect between PD and TMT experience, and GD and TMT experience respectively. We model these effects in Model 5. The coefficient of interaction between PD and TMT experience is positive and sig-nificant (Model 5: β = 0.279, p < 0.10). Likewise, the coefficient of interaction between GD and TMT experience is positive and significant (Model 5: β = 0.326, p < 0.10). Thus Hypothesis 4a and 4b are supported. In Model 6, when we introduce all the variables, the direction of all the hypothesized effects remains the same, though the significance changes a bit, possibly because of high level of correlation between the main effects and the interaction effects.
47Corporate Diversification, TMT Experience, and PerformanceTa
ble
2: D
escr
iptiv
e st
atis
tics a
nd c
orre
latio
nsVa
riab
les
Mea
nSD
12
34
56
78
910
1. R
OA
0.05
0.01
––
––
––
––
––
2. S
ales
a4.
411.
040.
17–
––
––
––
––
3. A
ge36
.90
16.7
20.
280.
49–
––
––
––
– 4
. Lev
erag
e2.
710.
88−0
.26
0.01
−0.0
4–
––
––
––
5. A
utom
otiv
e 0.
410.
490.
170.
090.
07−0
.07
––
––
––
6. R
and
D
0.02
0.01
0.15
0.07
0.03
−0.0
1−0
.04
––
––
– 7
. Adv
ertis
ing
0.02
0.01
−0.0
70.
05−0
.03
−0.0
4−0
.02
0.08
––
––
8. T
MT
Expe
rienc
e21
.16
5.48
0.40
0.23
0.24
−0.2
00.
080.
090.
02–
––
9. P
D0.
500.
13−0
.32
0.24
−0.0
30.
15−0
.03
−0.0
50.
05−0
.14
––
10. G
D0.
180.
120.
000.
230.
080.
050.
050.
07−0
.02
0.03
0.15
–N
= 3 ,
691,
Pea
rson
cor
rela
tions
> 0
.070
or <
−0.
070
sign
ifica
nt a
t 0.0
5 le
vel
a nat
ural
loga
rithm
48 D. A. Singh et al.Ta
ble
3: R
esul
ts o
f Ran
dom
Effe
cts G
LS E
stim
atio
n on
Firm
Per
form
ance
(RO
A)
Vari
able
sM
odel
1M
odel
2M
odel
3M
odel
4M
odel
5M
odel
6B
eta
S.E
.B
eta
S.E
.B
eta
S.E
.B
eta
S.E
.B
eta
S.E
.B
eta
S.E
.sa
lesa
0.14
2(0
.254
)0.
014
(0.2
70)
0.15
6(0
.263
)0.
240
(0.2
65)
0.18
1(0
.263
)0.
258
(0.2
65)
age
0.15
7***
(0.0
17)
0.18
9***
(0.0
17)
0.15
4***
(0.0
17)
0.15
3***
(0.0
17)
0.15
3***
(0.0
17)
0.15
3***
(0.0
17)
leve
rage
−0.8
54**
*(0
.129
)–0
.836
***
(0.1
32)
−0.8
15**
*(0
.130
)−0
.807
***
(0.1
30)
−0.8
30**
*(0
.130
)−0
.823
***
(0.1
30)
aut
omot
ive
0.00
2**(0
.001
)0.
001**
(0.0
01)
0.00
1**(0
.001
)0.
001**
(0.0
01)
0.00
1**(0
.001
)0.
001**
(0.0
01)
R a
nd D
0.08
1***
(0.0
16)
0.08
7***
(0.0
16)
0.07
9***
(0.0
16)
0.07
8***
(0.0
16)
0.07
9***
(0.0
16)
0.07
8***
(0.0
16)
adv
ertis
ing
−0.0
35*
(0.0
15)
−0.0
42**
(0.0
15)
−0.0
37**
(0.0
15)
−0.0
37**
(0.0
15)
−0.0
38**
(0.0
15)
−0.0
38**
(0.0
15)
tMt
expe
rienc
e0.
114**
*(0
.024
)0.
112**
*(0
.024
)0.
110**
*(0
.024
)0.
108**
*(0
.024
)−0
.090
(0.0
87)
−0.0
74(0
.087
)PD
0.02
1***
(0.0
05)
––
0.02
0***
(0.0
05)
0.01
8***
(0.0
05)
0.01
4*(0
.006
)0.
012*
(0.0
06)
PD S
quar
e−0
.035
***
(0.0
05)
––
−0.0
34**
*(0
.005
)−0
.035
***
(0.0
05)
−0.0
34**
*(0
.005
)−0
.035
***
(0.0
05)
GD
––
0.00
7*(0
.003
)0.
008**
(0.0
03)
0.00
6(0
.006
)0.
001
(0.0
05)
0.01
1(0
.007
)G
D S
quar
e–
–−0
.011
*(0
.005
)−0
.016
**(0
.005
)−0
.012
*(0
.005
)−0
.016
**(0
.005
)−0
.012
*(0
.005
)PD
× G
D–
––
––
–0.
020**
(0.0
08)
––
0.01
9**(0
.008
)PD
× T
MT
Exp.
––
––
––
––
0.27
9^(0
.160
)0.
238
(0.1
61)
GD
× T
MT
Exp.
––
––
––
––
0.32
6^(0
.174
)0.
347*
(0.1
75)
tota
l R²
0.26
60.
175
0.26
70.
267
0.26
80.
268
––
––
––
Wal
d χ²
489.
3534
2.01
499.
3150
6.07
507.
4251
4.02
––
––
––
N =
3,69
1a t
rans
form
ed to
nat
ural
loga
rithm
^p <
0.10
; * p <
0.05
; **p <
0.01
; *** p
< 0.
001
49Corporate Diversification, TMT Experience, and Performance
Robustness tests
We assessed the robustness of our results using alternate operationalization of our GD variable. We measured GD by a simple count of number of foreign countries in which an sMe operated (lu and Beamish 2004). Our results were consistent for the alternate definition of GD. We also created multiple subsamples from our data base and performed separate analyses on each subsample. We divided the firms into the automotive and non-automotive samples. Next we divided the firms based on whether we had information for all the eight-years (1999–2006) or only first five years (1999–2003). Finally we per-formed separate analyses on firms obtained in the first round and the second round of surveys. The results were qualitatively the same across these different subsamples.
Discussion and conclusion
We investigated the effect of PD and GD on the performance of German SMEs. Ground-ing our arguments in the diversification literature and extending the same for SMEs, we argued for an inverted U shaped relationship between PD/GD and SME performance. We also proposed that PD and GD positively interact with each other to affect the sMe performance. Further, we utilized the upper echelons literature to suggest that the effect of corporate diversification on performance is contingent on the TMT experience.
Our results support our predictions. PD and GD have a curvilinear relationship with the performance of sMes such that performance increases with an increase in the PD/GD up to a certain point, after which any further increase in PD/GD results in a reduction in the performance of SMEs. A higher level of PD enhances the positive value of GD for the performance of SMEs and vice-versa. Finally, the value of PD and GD for SME performance is more if the sMe has a more experienced tMt than if the sMe has a less experienced TMT.
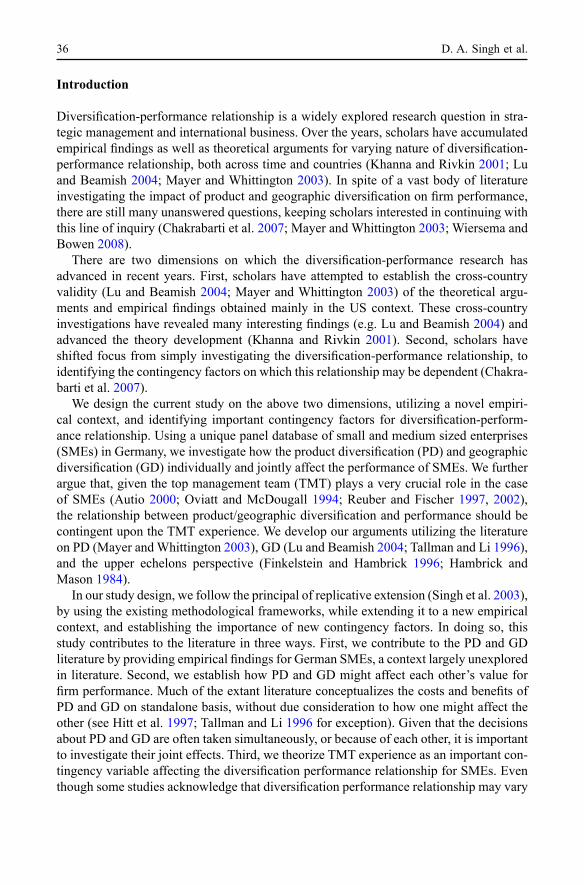
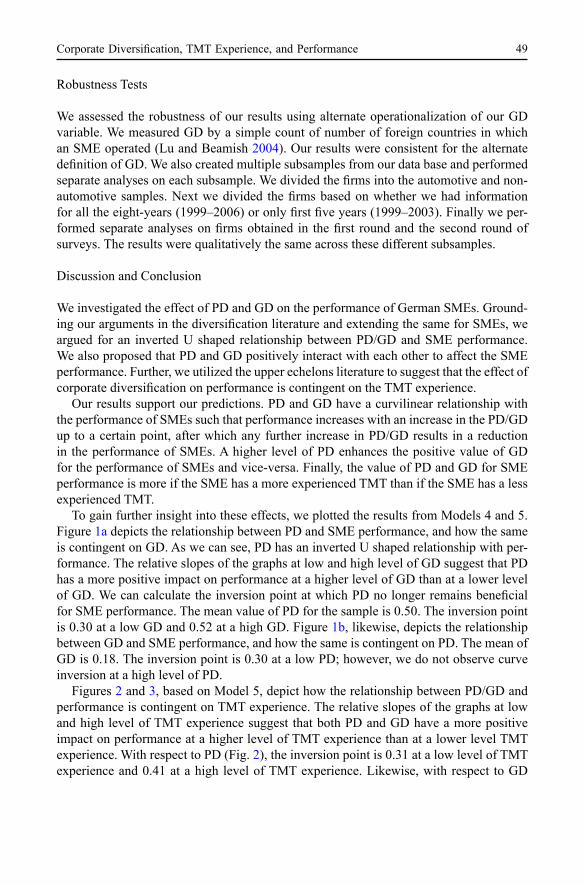
To gain further insight into these effects, we plotted the results from Models 4 and 5. Figure 1a depicts the relationship between PD and sMe performance, and how the same is contingent on GD. As we can see, PD has an inverted U shaped relationship with per-formance. The relative slopes of the graphs at low and high level of GD suggest that PD has a more positive impact on performance at a higher level of GD than at a lower level of GD. We can calculate the inversion point at which PD no longer remains beneficial for SME performance. The mean value of PD for the sample is 0.50. The inversion point is 0.30 at a low GD and 0.52 at a high GD. Figure 1b, likewise, depicts the relationship between GD and SME performance, and how the same is contingent on PD. The mean of GD is 0.18. The inversion point is 0.30 at a low PD; however, we do not observe curve inversion at a high level of PD.
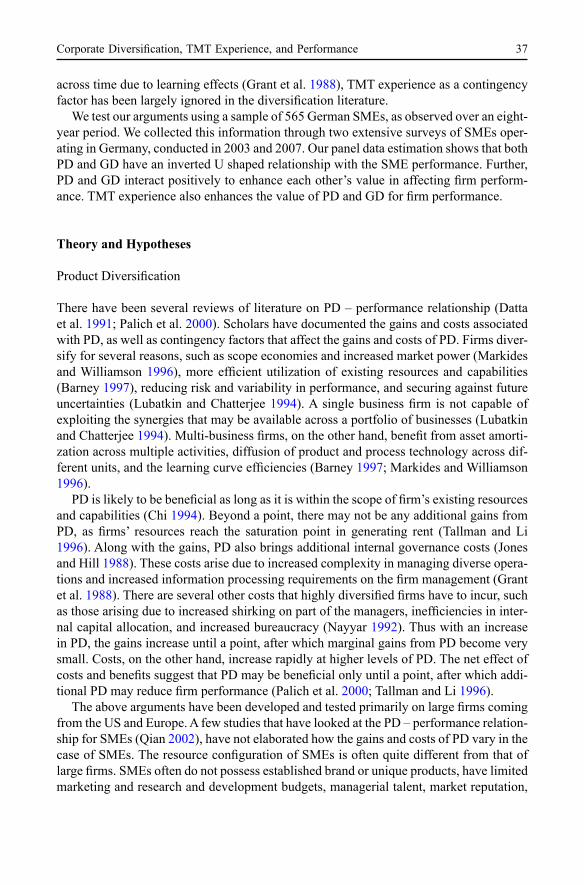
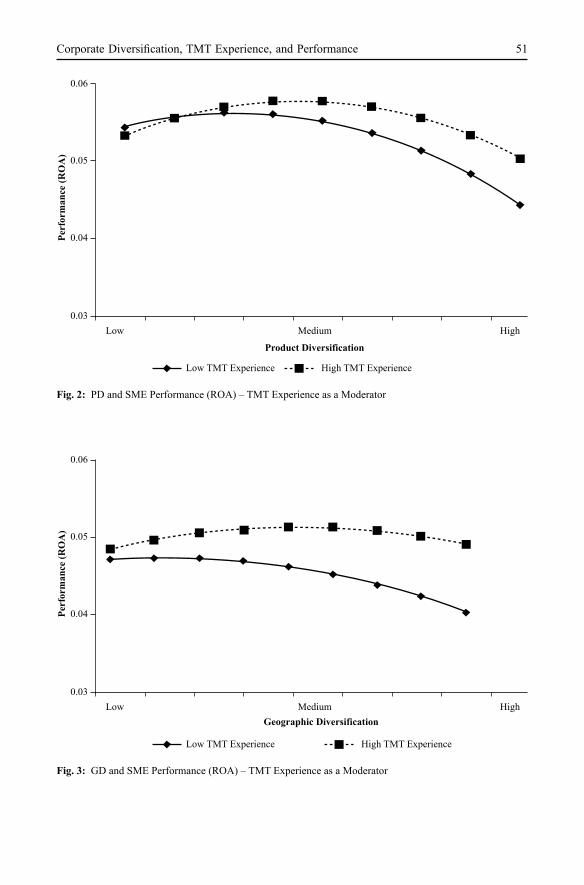
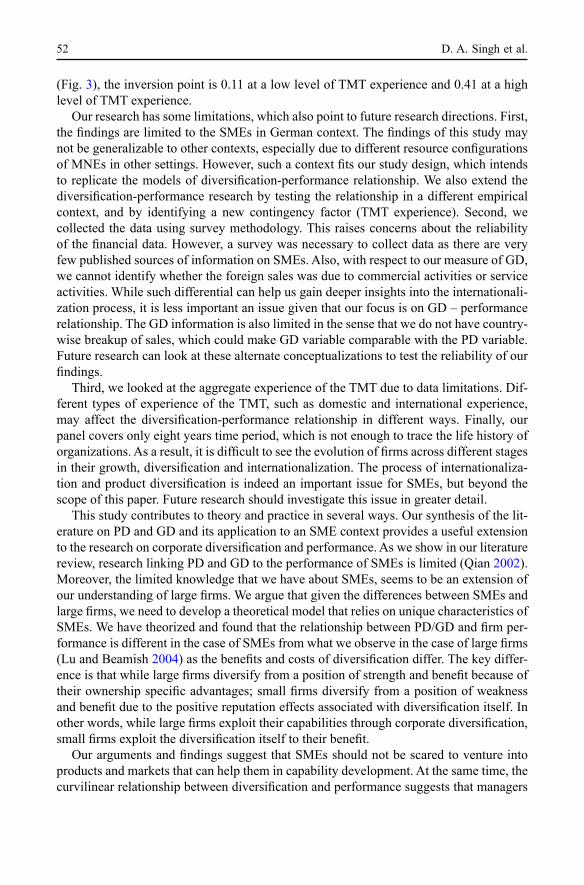
Figures 2 and 3, based on Model 5, depict how the relationship between PD/GD and performance is contingent on TMT experience. The relative slopes of the graphs at low and high level of tMt experience suggest that both PD and GD have a more positive impact on performance at a higher level of tMt experience than at a lower level tMt experience. With respect to PD (Fig. 2), the inversion point is 0.31 at a low level of TMT experience and 0.41 at a high level of TMT experience. Likewise, with respect to GD
50 D. A. Singh et al.
Fig. 1b: GD and sMe Performance (ROa) – PD as a Moderator
Fig. 1a: PD and sMe Performance (ROa) – GD as a Moderator
0.06
0.05
0.04
0.03
Low Medium
Low Geographic Diversification High Geographic Diversification
Product Diversification
High
Perf
orm
ance
(RO
A)
51Corporate Diversification, TMT Experience, and Performance
Fig. 2: PD and sMe Performance (ROa) – tMt experience as a Moderator
Fig. 3: GD and sMe Performance (ROa) – tMt experience as a Moderator
0.06
0.05
0.04
0.03Low Medium
Low TMT Experience High TMT Experience
Geographic DiversificationHigh
Perf
orm
ance
(RO
A)
52 D. A. Singh et al.
(Fig. 3), the inversion point is 0.11 at a low level of TMT experience and 0.41 at a high level of TMT experience.
Our research has some limitations, which also point to future research directions. First, the findings are limited to the SMEs in German context. The findings of this study may not be generalizable to other contexts, especially due to different resource configurations of MNEs in other settings. However, such a context fits our study design, which intends to replicate the models of diversification-performance relationship. We also extend the diversification-performance research by testing the relationship in a different empirical context, and by identifying a new contingency factor (TMT experience). Second, we collected the data using survey methodology. This raises concerns about the reliability of the financial data. However, a survey was necessary to collect data as there are very few published sources of information on SMEs. Also, with respect to our measure of GD, we cannot identify whether the foreign sales was due to commercial activities or service activities. While such differential can help us gain deeper insights into the internationali-zation process, it is less important an issue given that our focus is on GD – performance relationship. The GD information is also limited in the sense that we do not have country-wise breakup of sales, which could make GD variable comparable with the PD variable. Future research can look at these alternate conceptualizations to test the reliability of our findings.
Third, we looked at the aggregate experience of the TMT due to data limitations. Dif-ferent types of experience of the tMt, such as domestic and international experience, may affect the diversification-performance relationship in different ways. Finally, our panel covers only eight years time period, which is not enough to trace the life history of organizations. As a result, it is difficult to see the evolution of firms across different stages in their growth, diversification and internationalization. The process of internationaliza-tion and product diversification is indeed an important issue for SMEs, but beyond the scope of this paper. Future research should investigate this issue in greater detail.
This study contributes to theory and practice in several ways. Our synthesis of the lit-erature on PD and GD and its application to an sMe context provides a useful extension to the research on corporate diversification and performance. As we show in our literature review, research linking PD and GD to the performance of sMes is limited (Qian 2002). Moreover, the limited knowledge that we have about sMes, seems to be an extension of our understanding of large firms. We argue that given the differences between SMEs and large firms, we need to develop a theoretical model that relies on unique characteristics of SMEs. We have theorized and found that the relationship between PD/GD and firm per-formance is different in the case of SMEs from what we observe in the case of large firms (lu and Beamish 2004) as the benefits and costs of diversification differ. The key differ-ence is that while large firms diversify from a position of strength and benefit because of their ownership specific advantages; small firms diversify from a position of weakness and benefit due to the positive reputation effects associated with diversification itself. In other words, while large firms exploit their capabilities through corporate diversification, small firms exploit the diversification itself to their benefit.
Our arguments and findings suggest that SMEs should not be scared to venture into products and markets that can help them in capability development. At the same time, the curvilinear relationship between diversification and performance suggests that managers
53Corporate Diversification, TMT Experience, and Performance
of small and medium sized enterprises should be careful not to over diversify their organi-zations. Even though, PD/GD is a source of strength for SMEs, there are diseconomies associated with excessive diversification. In their pursuit of growth, SME managers may get overwhelmed by the opportunities available in the external environment. It is impor-tant for sMe managers to keep a balance between the domestic and international activi-ties as well as between the core and other businesses. The positive interaction between PD and GD also suggests that managers can transfer the experience and capabilities devel-oped in one type of diversification across the other, and thereby limit the negative effects of over diversification.
We also bring together the diversification literature and upper echelon literatures to identify TMT experience as a contingency factor in affecting diversification-performance relationship. The significant positive effect of TMT experience conforms to the notion that TMT plays an important role in the successful implementation of a given strategy (Fin-kelstein and hambrick 1996). Reuber and Fischer (1997) found that firms that have more experienced TMT have a greater propensity to achieve a greater level of GD. Extending their work, we show that firms with more experienced TMT also benefit more from GD as well as PD. SMEs can limit the negative consequences associated with a high level of diversification to some extent by having a more experienced top management team. How-ever, a more experienced TMT can only shift the inflexion point, but cannot eliminate the negative effects of over diversification.
to conclude, we found an inverted U shaped relationship between PD/GD and the performance of SMEs. The PD and GD positively interact with each other to enhance SME performance. We also found that TMT experience positively moderates the diver-sification – performance relationship. In doing so, we integrate the literature on product diversification, geographic diversification and upper echelons perspective and apply it to the context of SMEs. Together, our theory and findings help advance the diversification-performance literature as well as entrepreneurship literature.
Acknowledgements: the authors thank andrew Delios, aiB 2008 participants, the editors and two anonymous reviewers for their insightful comments.
References
Athanassiou, N. A., & Nigh, D. (1999). The impact of U.S. company internationalization on top management team advice networks: A tacit knowledge perspective. Strategic Management Journal, 20, 83–92.
Athanassiou, N. A., & Nigh, D. (2000). Internationalization, tacit knowledge and the top manage-ment team of MNCs. Journal of International Business Studies, 31(3), 471–488.
Autio, E. (2000). Creative tension: The significance of Ben Oviatt’s and Patricia Mcdougall’s arti-cle ‘Toward a Theory of International New Ventures’. Journal of International Business Stud-ies, 36, 9–19.
Barney, J. B. (1997). Gaining and Sustaining Competitive Advantage. Reading, Ma: addison-Wesley.
Baltagi, B. (1995). The Econometrics of Panel Data. New York: Wiley.
54 D. A. Singh et al.
Capar, N., & Kotabe, M. (2003). The Relationship between International Diversification and Per-formance in Service Firms. Journal of International Business Studies, 34(4), 345–355.
Castanias, R. P., & Helfat, C. E. (2001). The managerial rents model: Theory and empirical analy-sis. Journal of Management, 27(6), 661–678.
Caves, R. E. (1971). Industrial corporations: The industrial economics of foreign investment. Eco-nomica, 38, 1–27.
Chakrabarti, A., Singh, K., & Mahmood, I. (2007). Diversification and performance: Evidence from East Asian firms. Strategic Management Journal, 28, 101–120.
Chi, T. (1994). Trading in strategic resources: Necessary conditions, transaction cost problems, and choice of exchange structure. Strategic Management Journal, 2, 327–343.
Contractor, F. J., Kundu, S. K., & Hsu, C. C. (2003). A three-stage theory of international expan-sion: The link between multinationality and performance in the service sector. Journal of In-ternational Business Studies, 34(1), 5–19.
Delios, A., & Beamish, P. W. (1999). Geographic scope, product diversification and the corporate performance of Japanese firms. Strategic Management Journal, 20, 711–727.
Datta, D. K., Rajagopalan, N., & Rasheed, A. (1991). Diversification and performance: Critical review and future directions. Journal of Management Studies, 28, 529–558.
Denis, D. J., Denis, D. K., & Yost, K. (2002). Global diversification, industrial diversification, and firm value. Journal of Finance, 57, 1951–1979.
Dess, G. D., Gupta, A., Hennart, J., & Hill, C. W. L. (1995). Conducting and integrating strategy research at the international, corporate and business levels: Issues and directions. Journal of Management, 21, 357–393.
Dunning, J. H. (1993). Multinational enterprises and the global economy. Reading, Ma: addison- Wesley.
Eriksson, K., Johanson, J., Majkgard, A., & Sharma, D. (1997). Experiential knowledge and cost in the internationalization process. Journal of International Business Studies, 28, 337–360.
Finkelstein, S., & Hambrick, D. C. (1996). Strategic leadership: Top executives and their effects on organizations. New York: West Publishing Company.
Gaur, A. S., & Kumar, V. (2008). International diversification, business group affiliation and firm performance: Empirical evidence from India. British Journal of Management, 20, 172–186.
Geringer, J. M., Beamish, P. W., & Dacosta, R. C. (1989). Diversification strategy and international-ization: Implications for MNE performance. Strategic Management Journal, 10(2), 109–119.
Geringer, J. M., Tallman, S., & Olsen, D. M. (2000). Product and geographic diversification among Japanese multinational firms. Strategic Management Journal, 21, 51–80.
Grant, R. M., Jammine, A. P., & Thomas, H. (1988). Diversity, diversification and profitability among British manufacturing companies, 1972–1984. Academy of Management Journal, 31, 771–801.
Gupta, U. (1989, December 5). Talking strategy: Small firms aren’t waiting to grow up to go abroad. Wall Street Journal, Tuesday, Section 2, P. 2, Column 3.
Hambrick, D. C., & Mason, P. A. (1984). Upper echelons: The organization as a reflection of its top managers. Academy of Management Review, 9(2), 193–206.
Hsiao, C. (1995). Panel analysis for metric data. In G. Arminger et al. (Eds), Handbook of statistical modeling for social and behavior science. New York, Ny: Plenum Press.
Hitt, M. A., Bierman, L., Uhlenbruck, K., & Shimizu, K. (2006). The importance of resources in the internationalization of professional service firms: The good, the bad, and the ugly. Academy of Management Journal, 49, 1137–1157.
hitt, M. A., Hoskisson, R. E., & Kim, H. (1997). International diversification: Effects on innovation and firm performance in product diversified firms. Academy of Management Journal, 40(4), 767–798.
Jarillo, J. C. (1989). Entrepreneurship and growth: The strategic use of external resources. Journal of Business Venturing, 4(4), 133–147.
55Corporate Diversification, TMT Experience, and Performance
Johanson, J., & Vahlne, J. E. (1977). The internationalization process of the firm: A model of knowl-edge development and increasing foreign market commitment. Journal of International Busi-ness Studies, 8, 35–40.
Jones, G. R., & Hill, C. W. L. (1988). Transaction cost analysis of strategy-structure choice. Strate-gic Management Journal, 9, 159–172.
Khanna, T., & Rivkin, J. W. (2001). Estimating the performance effects of business groups in emerging markets. Strategic Management Journal, 22, 45–74.
Kim, W. C., Hwang, P., & Burgers, W. P. (1993). Multinationals’ diversification and the risk-return tradeoff. Strategic Management Journal, 14, 275–286.
Kmenta, J. (1986). Elements of econometrics. New York: Macmillan 1986.Kor, Y. Y. (2003). Experience-based top management competence and sustained growth. Organiza-
tion Science, 14(6), 707–719.Kotabe, M., Srinivasan, S. S., & Aulakh, P. S. (2002). Multinationality and firm performance:
The moderating role of R&D and marketing capabilities. Journal of International Business Studies, 33(1), 79–97.
Lu, J. W. (2002). Intra- and inter-organizational imitative behavior: Institutional influences on Japa-nese firms’ entry mode choice. Journal of International Business Studies, 33(1), 19–38.
Lu, J. W., & Beamish, P. W. (2001). The internationalization and performance of SMEs. Strategic Management Journal, 22, 565–586.
lu, J. W., & Beamish, P. W. (2004). International diversification and firm performance: The S-Curve hypothesis. Academy of Management Journal, 47(4), 598–609.
Lubatkin, M., & Chatterjee, S. (1994). Extending modern portfolio theory into the domain of corpo-rate diversification: Does it apply? Academy of Management Journal, 37(1), 109–136.
Markides, C. C., & Williamson, P. J. (1996). Corporate diversification and organizational struc-tures: A resource based view. Academy of Management Journal, 39, 340–367.
Mayer, M., & Whittington, R. (2003) Diversification in context: A cross-national and cross-tempo-ral extension. Strategic Management Journal, 24, 773–781.
Mcdougall, P. P., Shane, S., & Oviatt, B. M. (1994). Explaining the formation of international new ventures: The limits of theories from international business research. Journal of Business Ven-turing, 9(6), 469–487.
Nachum, L. (2004). Geographic and industrial diversification of developing country firms. Journal of Management Studies, 41(2), 273–294.
Namiki, N. (1988). Export strategy for small business. Journal of Small Business Management, 26(2), 32–37.
Nayyar, P. (1992) The measurement of corporate diversification strategy: Evidence from large U.S. service firms. Strategic Management Journal, 13(3), 219–235.
Oster, S. M. (1999). Modern Competitive Analysis. New York: Oxford University Press.Oviatt, B., & Mcdougall, P. (1994). Toward a theory of international new ventures. Journal of In-
ternational Business Studies, 25(1), 45–64.Palich, L. E., Cardinal, L. B., & Miller, C. C. (2000). Curvilinearity in the diversification-perform-
ance linkage: An examination of over three decades of research. Strategic Management Jour-nal, 21(2), 155–174.
Penrose, E. T. (1959). The theory of the growth of the firm. New York: Wiley.Qian, G. (1997). Assessing product-market diversification of U.S. firms. Management International
Review, 37, 127–149.Qian, G. (2002). Multinationality, product diversification, and profitability of emerging U.S. small-
and medium-sized enterprises. Journal of Business Venturing, 17, 611–633.Reuber, A. R., & Fischer, E. (1997). The influence of the management team’s international experi-
ence on the internationalization behaviors of SMEs. Journal of International Business Studies, 28(4), 807–825.
56 D. A. Singh et al.
Reuber, A. R., & Fischer, E. (2002). Foreign sales and small firm growth: The moderating role of the management team. Entrepreneurship Theory and Practice, 27(1), 29–45.
Robinson, R. B., & Pearce, J. A. (1984). Research thrusts in small business strategic planning. Academy of Management Review, 9, 128–137.
Rugman, A. M., & Verbeke, A. (2005). Towards a theory of regional multinationals: A transaction cost economics approach. Management International Review, 1, 5–17.
Singh, K., Ang, S. H., & Leong, S. M. (2003) Increasing replication for knowledge accumulation in strategy research. Journal of Management, 29, 533–549.
tallman., S., & Li, J. T. (1996). Effects of international diversity and product diversity on the per-formance of multinational firms. Academy of Management Journal, 39, 179–196.
Vesper, K. H. (1990). New Venture Strategies, Revised Edition. englewood cliffs, NJ: Prentice Hall.
Wiersama, M. F., & Bowen, H. P. (2008). Corporate diversification: The impact of foreign competi-tion, industry globalization, and product diversification. Strategic Management Journal, 29, 115–132.
Yu, J., & Cooper, H. A. (1983). Quantitative review of research design effects on response rates to questionnaires. Journal of Marketing Research, 20, 36–44.
Zacharakis, A. L. (1997). Foreign markets: A transaction cost perspective. Entrepreneurship Theory & Practice, 21(3), 23–39.


![Session 4a Ndpl Ajai Nirula[1]](https://img.pdfslide.us/doc/110x75/55264cbc550346636f8b4c4c/session-4a-ndpl-ajai-nirula1.jpg)