Embed Size (px)
Citation preview
Corporación América Airports
Corporate PresentationSeptember 2018
Disclaimer
This presentation has been prepared and issued by Corporación América Airports S.A. (“CAAP”, “Corporación América Airports” or the “Company”) solely for your information. By attending
the meeting and viewing this presentation, you agree to be bound by the following limitations. For the avoidance of doubt, references to the Company shall be deemed to include any
successor thereto.
This presentation does not constitute or form part of any offer or invitation to sell or issue, or any solicitation of any offer to purchase or subscribe for any common shares or any other
securities of the Company, nor shall it or any part of it, nor the fact of its distribution, form part of or be relied on in connection with any contract or investment decision relating thereto. This
presentation does not constitute a recommendation regarding the securities of the Company.
This document and its contents are confidential and may not be further copied, distributed or passed on, directly or indirectly, to any other person or published or reproduced directly or
indirectly, in whole or in part, by any medium or in any form for any purpose.
Neither this document nor any part or copy of it may be taken or transmitted into or distributed in or into, directly or indirectly, the United States, its territories or possessions or Canada. Any
failure to comply with these restrictions may constitute a violation of US or Canadian securities laws, respectively. The distribution of this document in jurisdictions other than U.S. or Canada
may also be restricted by law, and persons into whose possession this document comes should inform themselves about, and observe, any such restrictions.
This document is not an offer of securities for sale in the United States or elsewhere. The Company’s common shares have not been registered under the United States Securities Act of 1933
(the “Securities Act”) and may not be offered or sold in the United States unless they are registered under the Securities Act or pursuant to an exemption from, or in a transaction not subject
to, the registration requirements of the Securities Act.
The information in this presentation has not been legally verified by the Company, its advisers or any other person and may be subject to updating, completion, revision and amendment and
such information may change materially. This presentation speaks at the date hereof. No representation or warranty, express or implied, is or will be made by or on behalf of the Company, its
advisers or any of their respective directors, officers or employees, or any other person as to the accuracy, completeness or fairness of the information or opinions contained in this
presentation and any reliance you place on them will be at your sole risk. In particular the market data has been obtained by the Company from third party sources. Whilst the Company has
compiled and extracted the market data, it can provide no assurances of the accuracy and completeness of such information and take no responsibility for such data. The Company is under
no obligation to update or keep current the information contained in this presentation and any opinions expressed in it are subject to change without notice. None of the Company, its advisers
or any of their respective members, directors, officers or employees nor any other person accepts any liability whatsoever for any loss howsoever arising from any use of this presentation or
its contents or otherwise arising in connection therewith.
Statements, beliefs and opinions contained in this presentation, particularly those regarding the possible or assumed future or other performance of the Company, industry growth or other
trend projections, are or may be forward looking statements, beliefs or opinions and reflect the Company’s current expectations and projections about future events and are subject to risks
and uncertainties that may cause actual results to differ materially. By their nature, forward-looking statements involve a number of risks, uncertainties and assumptions that could cause
actual results or events to differ materially from those expressed or implied by the forward-looking statements. These risks, uncertainties and assumptions could adversely affect the outcome
and financial effects of the plans and events described herein. These risks and uncertainties include, among other factors, changing business or other market conditions and the prospects for
growth anticipated by the management of the Company. These and other factors could adversely affect the outcome and financial effects of the plans and events described herein. As a result,
there can be no assurance that projected results or developments will be attained and you are cautioned not to place undue reliance on such forward-looking statements. The Company, its
advisers and each of their respective directors, officers and employees disclaim any obligation to update the Company's view of such risks and uncertainties or to publicly announce the result
of any revision to the forward-looking statements made herein, except where it would be required to do so under applicable law.
By attending the presentation to which this document relates you will be taken to have represented, warranted and undertaken that: (i) you have read and agree to comply with the contents of
this notice, including, without limitation, the obligation to keep this presentation and its contents confidential and (ii) you will not at any time have any discussion, correspondence or contact
concerning the information in this presentation with any of the directors or employees of the Company or its subsidiaries nor with any of its suppliers, customers or partners without the prior
written consent of the Company.
1
Today’s Presenters
2
Raúl Francos
CFO
Martín Eurnekian
CEO
Gimena Albanesi
Investor Relations
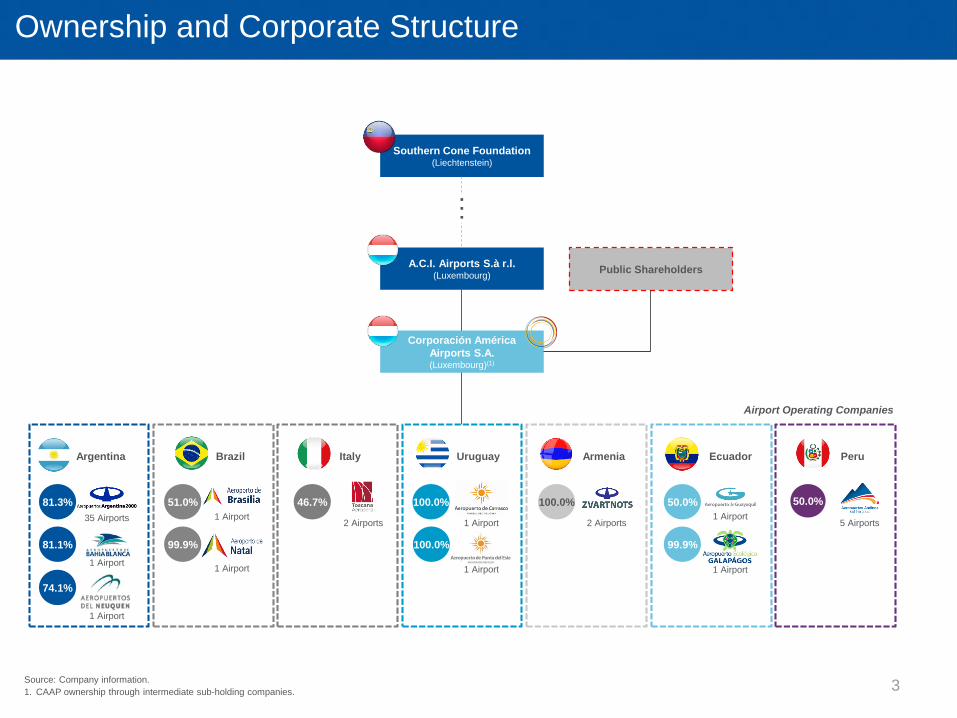
Ownership and Corporate Structure
Southern Cone Foundation(Liechtenstein)
A.C.I. Airports S.à r.l.(Luxembourg)
Corporación América
Airports S.A.(Luxembourg)(1)
Airport Operating Companies
Public Shareholders
…Argentina
35 Airports
1 Airport
1 Airport
81.3%81.3%
74.1%
Brazil
1 Airport
1 Airport
51.0%
99.9%
Italy
2 Airports
46.7%
Uruguay
1 Airport
1 Airport
100.0%
100.0%
Ecuador
1 Airport
1 Airport
50.0%
99.9%
Peru
5 Airports
50.0%100.0%
Armenia
2 Airports
81.1%
Source: Company information.
1. CAAP ownership through intermediate sub-holding companies.3
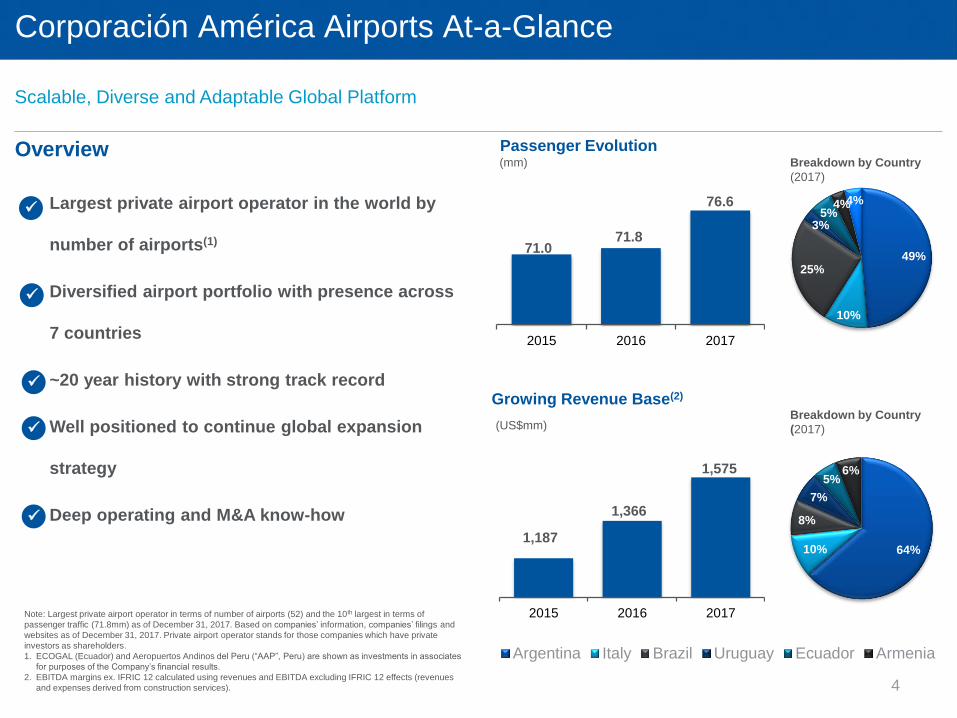
64%10%
8%
7%
5%6%
Argentina Italy Brazil Uruguay Ecuador Armenia
Scalable, Diverse and Adaptable Global Platform
Corporación América Airports At-a-Glance
• Largest private airport operator in the world by
number of airports(1)
• Diversified airport portfolio with presence across
7 countries
• ~20 year history with strong track record
• Well positioned to continue global expansion
strategy
• Deep operating and M&A know-how
Overview
Growing Revenue Base(2)
Passenger Evolution(mm)
(US$mm)Breakdown by Country
(2017)
Breakdown by Country
(2017)
Note: Largest private airport operator in terms of number of airports (52) and the 10th largest in terms of
passenger traffic (71.8mm) as of December 31, 2017. Based on companies’ information, companies’ filings and
websites as of December 31, 2017. Private airport operator stands for those companies which have private
investors as shareholders.
1. ECOGAL (Ecuador) and Aeropuertos Andinos del Peru (“AAP”, Peru) are shown as investments in associates
for purposes of the Company’s financial results.
2. EBITDA margins ex. IFRIC 12 calculated using revenues and EBITDA excluding IFRIC 12 effects (revenues
and expenses derived from construction services). 4
71.071.8
76.6
62.0 62.6 63.1 63.7 64.2 64.8 65.3 65.9 66.4 67.0 67.5 68.1 68.6 69.2 69.7 70.3 70.8 71.4 71.9 72.5 73.0 73.6 74.1 74.7 75.2 75.8 76.3 76.9 77.4 78.0 78.5 79.1 79.6
2015 2016 2017
49%
10%
25%
3%5%
4%4%
1,187
1,366
1,575
1,000.0 1,001.2 1,002.4 1,003.6 1,004.8 1,006.0 1,007.2 1,008.5 1,009.7 1,010.9 1,012.1 1,013.3 1,014.5 1,015.7 1,016.9 1,018.1 1,019.3 1,020.5 1,021.7 1,023.0 1,024.2 1,025.4 1,026.6 1,027.8 1,029.0 1,030.2 1,031.4 1,032.6 1,033.8 1,035.0 1,036.2 1,037.4 1,038.7 1,039.9 1,041.1 1,042.3 1,043.5 1,044.7 1,045.9 1,047.1 1,048.3 1,049.5 1,050.7 1,051.9 1,053.1 1,054.4 1,055.6 1,056.8 1,058.0 1,059.2 1,060.4 1,061.6 1,062.8 1,064.0 1,065.2 1,066.4 1,067.6 1,068.9 1,070.1 1,071.3 1,072.5 1,073.7 1,074.9 1,076.1 1,077.3 1,078.5 1,079.7 1,080.9 1,082.1 1,083.3 1,084.6 1,085.8 1,087.0 1,088.2 1,089.4 1,090.6 1,091.8 1,093.0 1,094.2 1,095.4 1,096.6 1,097.8 1,099.0 1,100.3 1,101.5 1,102.7 1,103.9 1,105.1 1,106.3 1,107.5 1,108.7 1,109.9 1,111.1 1,112.3 1,113.5 1,114.8 1,116.0 1,117.2 1,118.4 1,119.6 1,120.8 1,122.0 1,123.2 1,124.4 1,125.6 1,126.8 1,128.0 1,129.2 1,130.5 1,131.7 1,132.9 1,134.1 1,135.3 1,136.5 1,137.7 1,138.9 1,140.1 1,141.3 1,142.5 1,143.7 1,145.0 1,146.2 1,147.4 1,148.6 1,149.8 1,151.0 1,152.2 1,153.4 1,154.6 1,155.8 1,157.0 1,158.2 1,159.4 1,160.7 1,161.9 1,163.1 1,164.3 1,165.5 1,166.7 1,167.9 1,169.1 1,170.3 1,171.5 1,172.7 1,173.9 1,175.1 1,176.4 1,177.6 1,178.8 1,180.0 1,181.2 1,182.4 1,183.6 1,184.8 1,186.0 1,187.2 1,188.4 1,189.6 1,190.9 1,192.1 1,193.3 1,194.5 1,195.7 1,196.9 1,198.1 1,199.3 1,200.5 1,201.7 1,202.9 1,204.1 1,205.3 1,206.6 1,207.8 1,209.0 1,210.2 1,211.4 1,212.6 1,213.8 1,215.0 1,216.2 1,217.4 1,218.6 1,219.8 1,221.0 1,222.3 1,223.5 1,224.7 1,225.9 1,227.1 1,228.3 1,229.5 1,230.7 1,231.9 1,233.1 1,234.3 1,235.5 1,236.8 1,238.0 1,239.2 1,240.4 1,241.6 1,242.8 1,244.0 1,245.2 1,246.4 1,247.6 1,248.8 1,250.0 1,251.2 1,252.5 1,253.7 1,254.9 1,256.1 1,257.3 1,258.5 1,259.7 1,260.9 1,262.1 1,263.3 1,264.5 1,265.7 1,267.0 1,268.2 1,269.4 1,270.6 1,271.8 1,273.0 1,274.2 1,275.4 1,276.6 1,277.8 1,279.0 1,280.2 1,281.4 1,282.7 1,283.9 1,285.1 1,286.3 1,287.5 1,288.7 1,289.9 1,291.1 1,292.3 1,293.5 1,294.7 1,295.9 1,297.1 1,298.4 1,299.6 1,300.8 1,302.0 1,303.2 1,304.4 1,305.6 1,306.8 1,308.0 1,309.2 1,310.4 1,311.6 1,312.9 1,314.1 1,315.3 1,316.5 1,317.7 1,318.9 1,320.1 1,321.3 1,322.5 1,323.7 1,324.9 1,326.1 1,327.3 1,328.6 1,329.8 1,331.0 1,332.2 1,333.4 1,334.6 1,335.8 1,337.0 1,338.2 1,339.4 1,340.6 1,341.8 1,343.0 1,344.3 1,345.5 1,346.7 1,347.9 1,349.1 1,350.3 1,351.5 1,352.7 1,353.9 1,355.1 1,356.3 1,357.5 1,358.8 1,360.0 1,361.2 1,362.4 1,363.6 1,364.8 1,366.0 1,367.2 1,368.4 1,369.6 1,370.8 1,372.0 1,373.2 1,374.5 1,375.7 1,376.9 1,378.1 1,379.3 1,380.5 1,381.7 1,382.9 1,384.1 1,385.3 1,386.5 1,387.7 1,389.0 1,390.2 1,391.4 1,392.6 1,393.8 1,395.0 1,396.2 1,397.4 1,398.6 1,399.8 1,401.0 1,402.2 1,403.4 1,404.7 1,405.9 1,407.1 1,408.3 1,409.5 1,410.7 1,411.9 1,413.1 1,414.3 1,415.5 1,416.7 1,417.9 1,419.1 1,420.4 1,421.6 1,422.8 1,424.0 1,425.2 1,426.4 1,427.6 1,428.8 1,430.0 1,431.2 1,432.4 1,433.6 1,434.9 1,436.1 1,437.3 1,438.5 1,439.7 1,440.9 1,442.1 1,443.3 1,444.5 1,445.7 1,446.9 1,448.1 1,449.3 1,450.6 1,451.8 1,453.0 1,454.2 1,455.4 1,456.6 1,457.8 1,459.0 1,460.2 1,461.4 1,462.6 1,463.8 1,465.0 1,466.3 1,467.5 1,468.7 1,469.9 1,471.1 1,472.3 1,473.5 1,474.7 1,475.9 1,477.1 1,478.3 1,479.5 1,480.8 1,482.0 1,483.2 1,484.4 1,485.6 1,486.8 1,488.0 1,489.2 1,490.4 1,491.6 1,492.8 1,494.0 1,495.2 1,496.5 1,497.7 1,498.9 1,500.1 1,501.3 1,502.5 1,503.7 1,504.9 1,506.1 1,507.3 1,508.5 1,509.7 1,511.0 1,512.2 1,513.4 1,514.6 1,515.8 1,517.0 1,518.2 1,519.4 1,520.6 1,521.8 1,523.0 1,524.2 1,525.4 1,526.7 1,527.9 1,529.1 1,530.3 1,531.5 1,532.7 1,533.9 1,535.1 1,536.3 1,537.5 1,538.7 1,539.9 1,541.1 1,542.4 1,543.6 1,544.8 1,546.0 1,547.2 1,548.4 1,549.6 1,550.8 1,552.0 1,553.2 1,554.4 1,555.6 1,556.9 1,558.1 1,559.3 1,560.5 1,561.7 1,562.9 1,564.1 1,565.3 1,566.5 1,567.7 1,568.9 1,570.1 1,571.3 1,572.6 1,573.8 1,575.0 1,576.2 1,577.4 1,578.6 1,579.8 1,581.0 1,582.2 1,583.4 1,584.6 1,585.8 1,587.0 1,588.3 1,589.5 1,590.7 1,591.9 1,593.1 1,594.3 1,595.5 1,596.7 1,597.9 1,599.1 1,600.3 1,601.5 1,602.8 1,604.0
2015 2016 2017
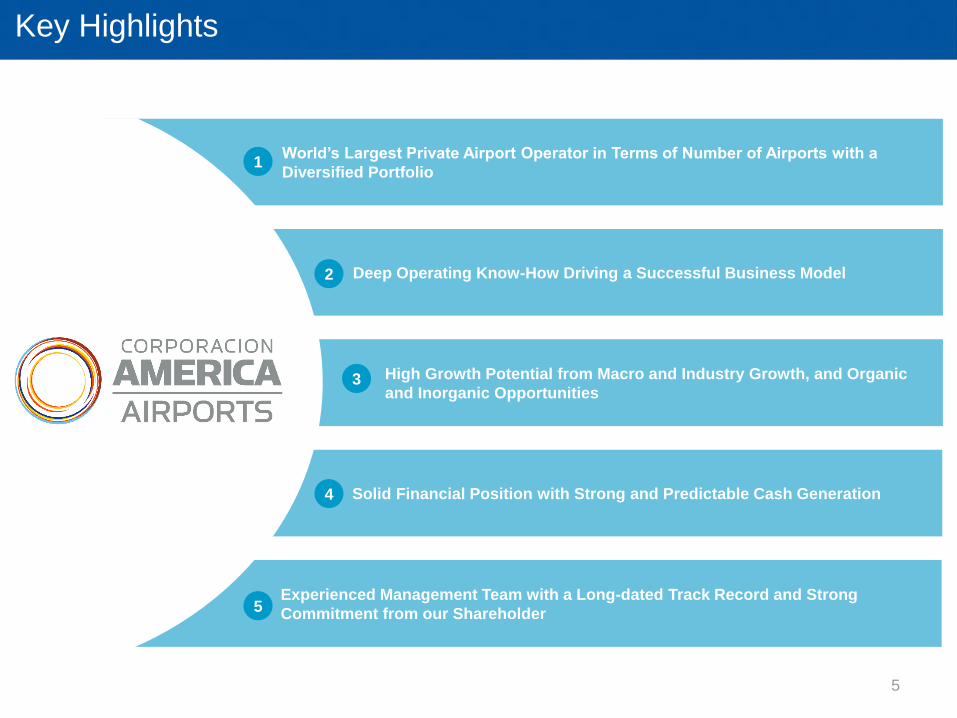
Key Highlights
Solid Financial Position with Strong and Predictable Cash Generation
3. Investment Highlights
World’s Largest Private Airport Operator in Terms of Number of Airports with a
Diversified Portfolio
Deep Operating Know-How Driving a Successful Business Model
High Growth Potential from Macro and Industry Growth, and Organic
and Inorganic Opportunities
Experienced Management Team with a Long-dated Track Record and Strong
Commitment from our Shareholder
1
5
4
2
3
5
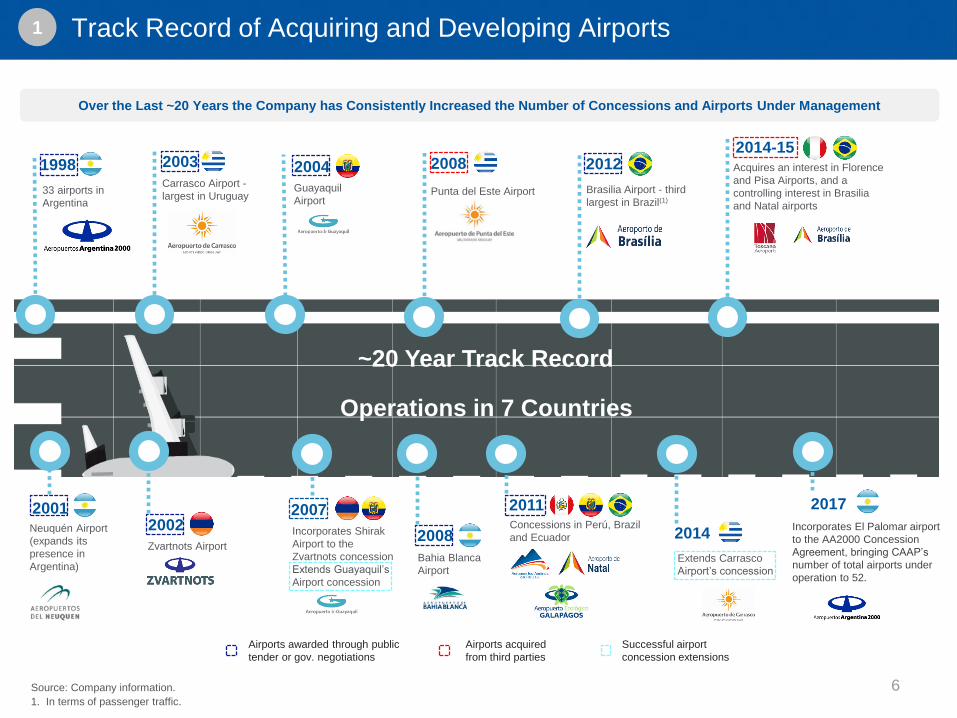
33 airports in
Argentina
1998
2002
20082003
2008
2011
2012
Concessions in Perú, Brazil
and Ecuador
Extends Carrasco
Airport’s concession
2017
2014
2001
Zvartnots Airport
Punta del Este AirportCarrasco Airport -
largest in UruguayBrasilia Airport - third
largest in Brazil(1)
Bahia Blanca
Airport
~20 Year Track Record
Operations in 7 Countries
Neuquén Airport
(expands its
presence in
Argentina)
2014-15Acquires an interest in Florence
and Pisa Airports, and a
controlling interest in Brasilia
and Natal airports
Airports awarded through public
tender or gov. negotiations
Airports acquired
from third parties
2007
2004
Guayaquil
Airport
Track Record of Acquiring and Developing Airports1
Incorporates Shirak
Airport to the
Zvartnots concession
Extends Guayaquil’s
Airport concession
Source: Company information.
1. In terms of passenger traffic.
Over the Last ~20 Years the Company has Consistently Increased the Number of Concessions and Airports Under Management
Successful airport
concession extensions
Incorporates El Palomar airport
to the AA2000 Concession
Agreement, bringing CAAP’s
number of total airports under
operation to 52.
6
NY008MZK / 938652_1.wor
URUGUAYURUGUAYURUGUAYURUGUAYURUGUAYURUGUAYURUGUAYURUGUAYURUGUAYURUGUAYURUGUAYURUGUAYURUGUAYURUGUAYURUGUAYURUGUAYURUGUAYURUGUAYURUGUAYURUGUAYURUGUAYURUGUAYURUGUAYURUGUAYURUGUAYURUGUAYURUGUAYURUGUAYURUGUAYURUGUAYURUGUAYURUGUAYURUGUAYURUGUAYURUGUAYURUGUAYURUGUAYURUGUAYURUGUAYURUGUAYURUGUAYURUGUAYURUGUAYURUGUAYURUGUAYURUGUAYURUGUAYURUGUAYURUGUAY
ARMENIAARMENIAARMENIAARMENIAARMENIAARMENIAARMENIAARMENIAARMENIAARMENIAARMENIAARMENIAARMENIAARMENIAARMENIAARMENIAARMENIAARMENIAARMENIAARMENIAARMENIAARMENIAARMENIAARMENIAARMENIAARMENIAARMENIAARMENIAARMENIAARMENIAARMENIAARMENIAARMENIAARMENIAARMENIAARMENIAARMENIAARMENIAARMENIAARMENIAARMENIAARMENIAARMENIAARMENIAARMENIAARMENIAARMENIAARMENIAARMENIA
PERUPERUPERUPERUPERUPERUPERUPERUPERUPERUPERUPERUPERUPERUPERUPERUPERUPERUPERUPERUPERUPERUPERUPERUPERUPERUPERUPERUPERUPERUPERUPERUPERUPERUPERUPERUPERUPERUPERUPERUPERUPERUPERUPERUPERUPERUPERUPERUPERU
ECUADORECUADORECUADORECUADORECUADORECUADORECUADORECUADORECUADORECUADORECUADORECUADORECUADORECUADORECUADORECUADORECUADORECUADORECUADORECUADORECUADORECUADORECUADORECUADORECUADORECUADORECUADORECUADORECUADORECUADORECUADORECUADORECUADORECUADORECUADORECUADORECUADORECUADORECUADORECUADORECUADORECUADORECUADORECUADORECUADORECUADORECUADORECUADORECUADOR
ITALYITALYITALYITALYITALYITALYITALYITALYITALYITALYITALYITALYITALYITALYITALYITALYITALYITALYITALYITALYITALYITALYITALYITALYITALYITALYITALYITALYITALYITALYITALYITALYITALYITALYITALYITALYITALYITALYITALYITALYITALYITALYITALYITALYITALYITALYITALYITALYITALY
BRAZILBRAZILBRAZILBRAZILBRAZILBRAZILBRAZILBRAZILBRAZILBRAZILBRAZILBRAZILBRAZILBRAZILBRAZILBRAZILBRAZILBRAZILBRAZILBRAZILBRAZILBRAZILBRAZILBRAZILBRAZILBRAZILBRAZILBRAZILBRAZILBRAZILBRAZILBRAZILBRAZILBRAZILBRAZILBRAZILBRAZILBRAZILBRAZILBRAZILBRAZILBRAZILBRAZILBRAZILBRAZILBRAZILBRAZILBRAZILBRAZIL
ARGENTINAARGENTINAARGENTINAARGENTINAARGENTINAARGENTINAARGENTINAARGENTINAARGENTINAARGENTINAARGENTINAARGENTINAARGENTINAARGENTINAARGENTINAARGENTINAARGENTINAARGENTINAARGENTINAARGENTINAARGENTINAARGENTINAARGENTINAARGENTINAARGENTINAARGENTINAARGENTINAARGENTINAARGENTINAARGENTINAARGENTINAARGENTINAARGENTINAARGENTINAARGENTINAARGENTINAARGENTINAARGENTINAARGENTINAARGENTINAARGENTINAARGENTINAARGENTINAARGENTINAARGENTINAARGENTINAARGENTINAARGENTINAARGENTINA
Airports(2)
Passengers(2)
Revenue
Adj. EBITDA
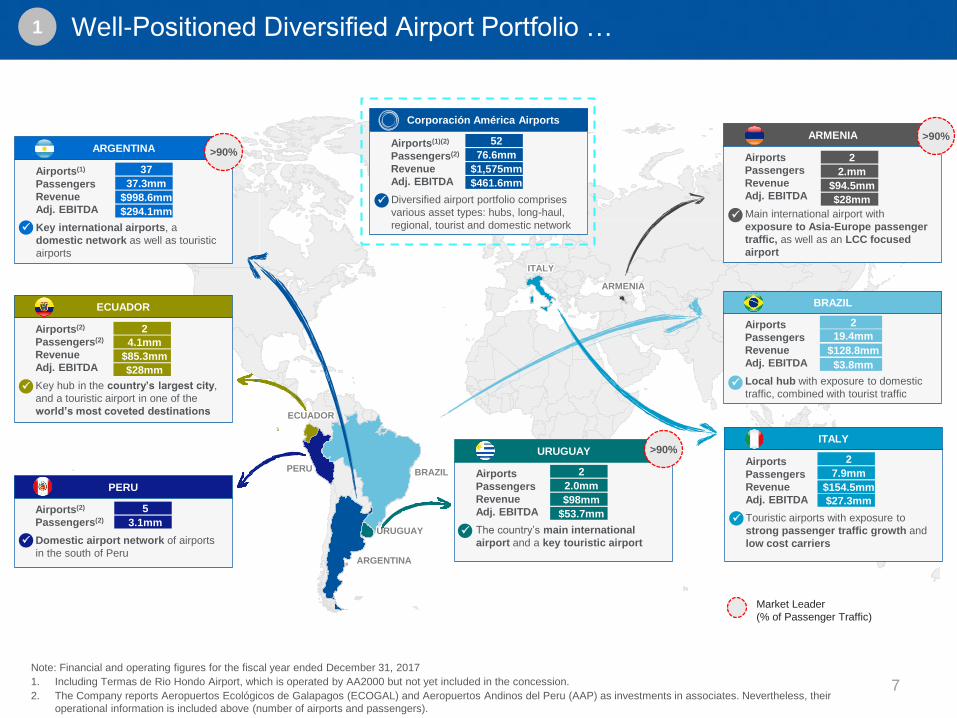
• Key hub in the country’s largest city,
and a touristic airport in one of the
world’s most coveted destinations
ECUADOR
2
4.1mm
$85.3mm
$28mm
Airports(2)
Passengers(2)
• Domestic airport network of airports
in the south of Peru
PERU
5
3.1mm
Market Leader
(% of Passenger Traffic)
1 Well-Positioned Diversified Airport Portfolio …
Airports(1)
Passengers
Revenue
Adj. EBITDA
• Key international airports, a
domestic network as well as touristic
airports
ARGENTINA
37
37.3mm
$998.6mm
$294.1mm
>90%
Airports
Passengers
Revenue
Adj. EBITDA
• The country’s main international
airport and a key touristic airport
URUGUAY
2
2.0mm
$98mm
$53.7mm
>90%
Airports(1)(2)
Passengers(2)
Revenue
Adj. EBITDA
• Diversified airport portfolio comprises
various asset types: hubs, long-haul,
regional, tourist and domestic network
Corporación América Airports
52
76.6mm
$1,575mm
$461.6mm
Airports
Passengers
Revenue
Adj. EBITDA
• Local hub with exposure to domestic
traffic, combined with tourist traffic
BRAZIL
2
19.4mm
$128.8mm
$3.8mm
Airports
Passengers
Revenue
Adj. EBITDA
• Main international airport with
exposure to Asia-Europe passenger
traffic, as well as an LCC focused
airport
ARMENIA
2
2.mm
$94.5mm
$28mm
>90%
Airports
Passengers
Revenue
Adj. EBITDA
• Touristic airports with exposure to
strong passenger traffic growth and
low cost carriers
ITALY
2
7.9mm
$154.5mm
$27.3mm
Note: Financial and operating figures for the fiscal year ended December 31, 2017
1. Including Termas de Rio Hondo Airport, which is operated by AA2000 but not yet included in the concession.
2. The Company reports Aeropuertos Ecológicos de Galapagos (ECOGAL) and Aeropuertos Andinos del Peru (AAP) as investments in associates. Nevertheless, their
operational information is included above (number of airports and passengers).
7
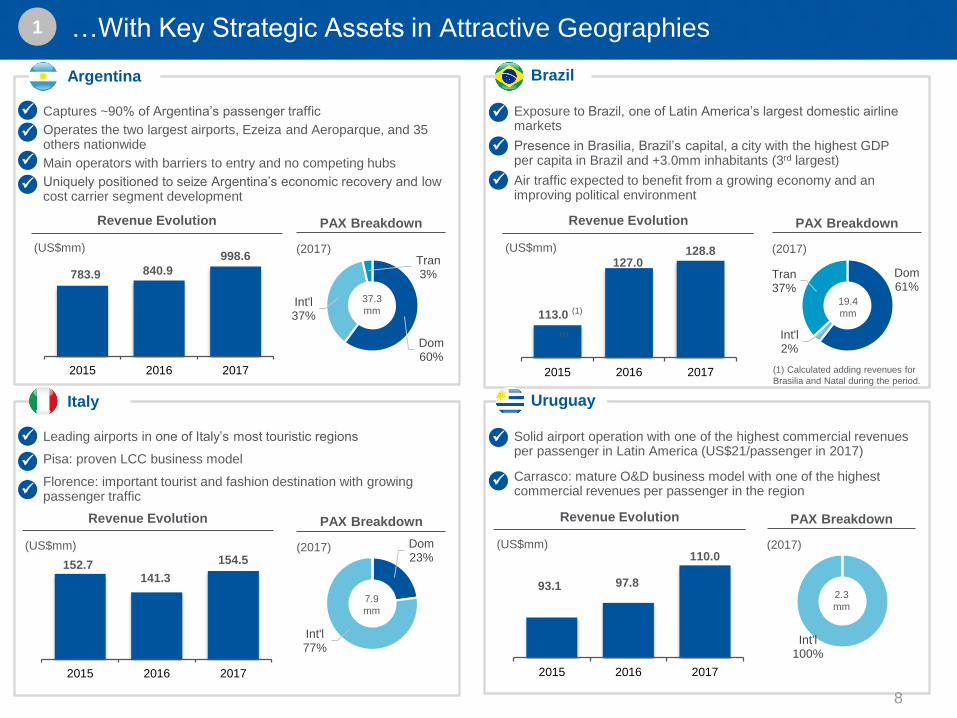
113.0
127.0128.8
2015 2016 2017
Revenue Evolution
• Exposure to Brazil, one of Latin America’s largest domestic airline markets
• Presence in Brasilia, Brazil’s capital, a city with the highest GDP per capita in Brazil and +3.0mm inhabitants (3rd largest)
• Air traffic expected to benefit from a growing economy and an improving political environment
Revenue Evolution
1 …With Key Strategic Assets in Attractive Geographies
Argentina Brazil
(US$mm) (US$mm)
(1) Calculated adding revenues for
Brasilia and Natal during the period.
(1)
• Captures ~90% of Argentina’s passenger traffic
• Operates the two largest airports, Ezeiza and Aeroparque, and 35 others nationwide
• Main operators with barriers to entry and no competing hubs
• Uniquely positioned to seize Argentina’s economic recovery and low cost carrier segment development
783.9 840.9
998.6
2015 2016 2017
• Leading airports in one of Italy’s most touristic regions
• Pisa: proven LCC business model
• Florence: important tourist and fashion destination with growing passenger traffic
Italy Uruguay
(US$mm)
Revenue Evolution
• Solid airport operation with one of the highest commercial revenues per passenger in Latin America (US$21/passenger in 2017)
• Carrasco: mature O&D business model with one of the highest commercial revenues per passenger in the region
PAX Breakdown
(2017)
152.7141.3
154.5
2015 2016 2017
(US$mm)
Revenue Evolution
93.1 97.8
110.0
2015 2016 2017
Dom60%
Int'l37%
Tran3%
(1)
PAX Breakdown
(2017)
Dom61%
Int'l2%
Tran37%
PAX Breakdown
(2017)
Int'l100%
PAX Breakdown
(2017) Dom23%
Int'l77%
37.3
mm19.4
mm
2.3
mm7.9
mm
8
Source: Company information.
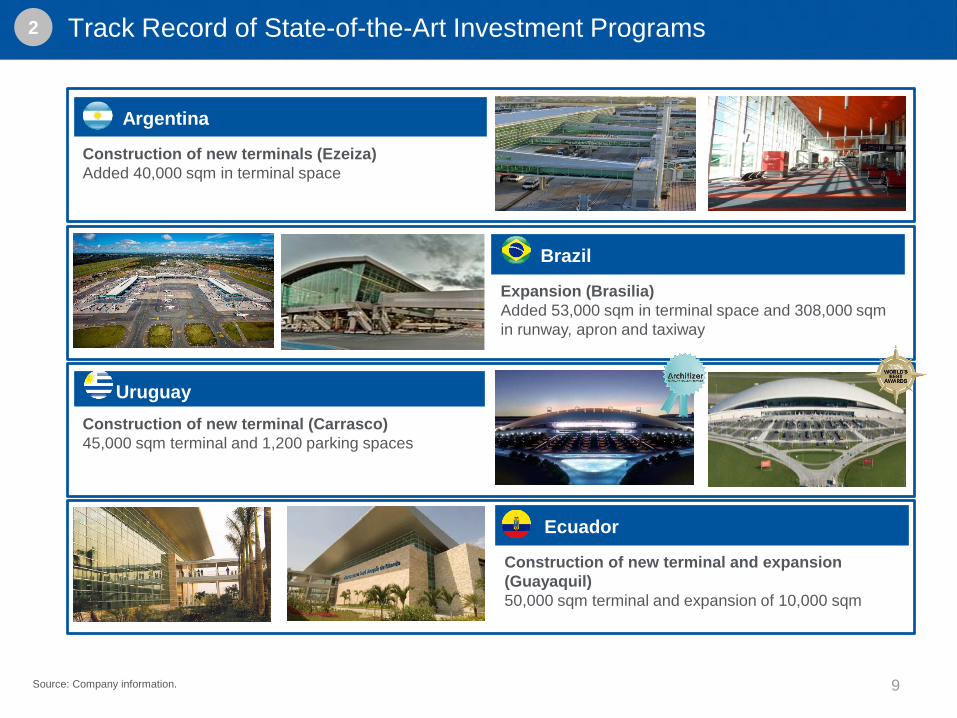
Track Record of State-of-the-Art Investment Programs
9
2
Argentina
Construction of new terminals (Ezeiza)
Added 40,000 sqm in terminal space
Uruguay
Construction of new terminal (Carrasco)
45,000 sqm terminal and 1,200 parking spaces
Brazil
Expansion (Brasilia)
Added 53,000 sqm in terminal space and 308,000 sqm
in runway, apron and taxiway
Ecuador
Construction of new terminal and expansion
(Guayaquil)
50,000 sqm terminal and expansion of 10,000 sqm
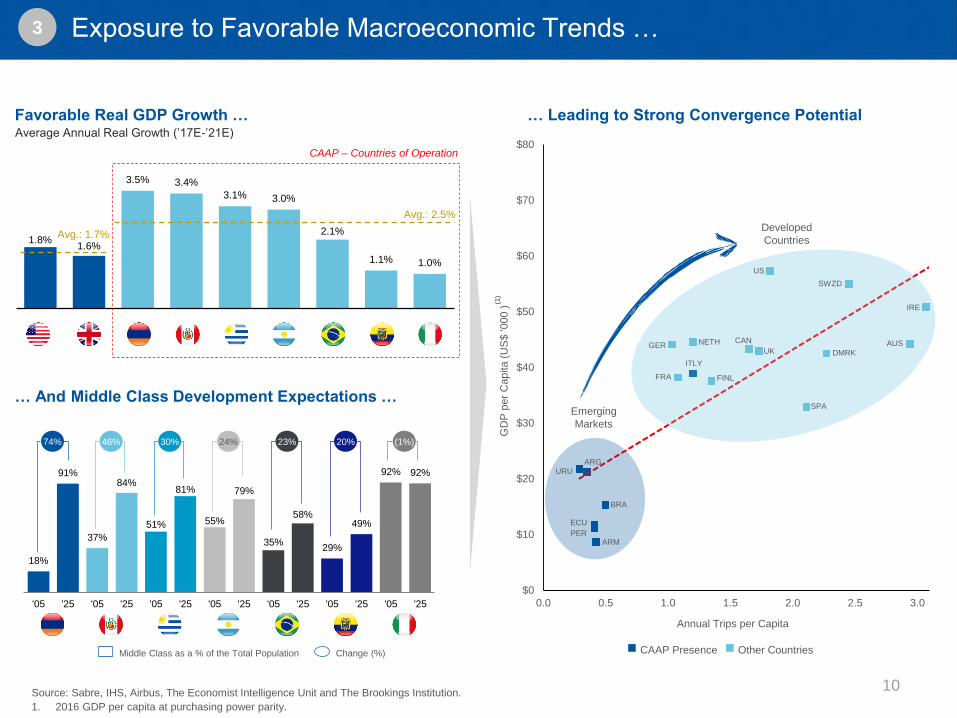
1.8% 1.6%
3.5% 3.4%
3.1% 3.0%
2.1%
1.1% 1.0%
US GB AM PE UY AR BR EC IT
Source: Sabre, IHS, Airbus, The Economist Intelligence Unit and The Brookings Institution.
1. 2016 GDP per capita at purchasing power parity.
3
Favorable Real GDP Growth …
… And Middle Class Development Expectations …
Average Annual Real Growth (’17E-’21E)
… Leading to Strong Convergence Potential
Avg.: 2.5%
Avg.: 1.7%
Exposure to Favorable Macroeconomic Trends …
18%
91%
37%
84%
51%
81%
55%
79%
35%
58%
29%
49%
92% 92%
'05 '25 '05 '25 '05 '25 '05 '25 '05 '25 '05 '25 '05 '25
Change (%)Middle Class as a % of the Total Population
74% 46% 30% 24% 23% 20% (1%)
CAAP – Countries of Operation
$0
$10
$20
$30
$40
$50
$60
$70
$80
0.0 0.5 1.0 1.5 2.0 2.5 3.0
GD
P p
er
Capita (
US
$ '000 )
Annual Trips per Capita
Emerging
Markets
Developed
Countries
URUARG
PERARM
GER
FRA
CAN
UK
US
AUS
IRE
ITLY
BRA
ECU
DMRK
SWZD
FINL
NETH
SPA
(1)
CAAP Presence Other Countries
10
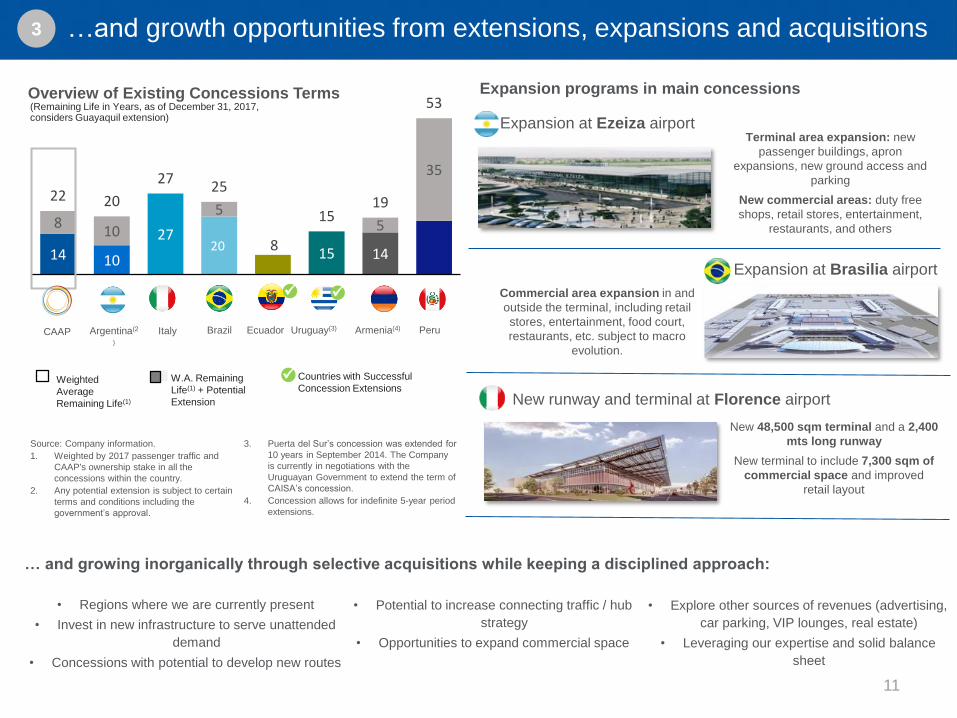
3 …and growth opportunities from extensions, expansions and acquisitions
14 10
2715 14
810
55
35
22 20
2725
8
1519
53
20
CAAP Argentina(2
)
Italy Uruguay(3)Brazil Ecuador
Armenia(4) Peru
Overview of Existing Concessions Terms(Remaining Life in Years, as of December 31, 2017, considers Guayaquil extension)
W.A. Remaining
Life(1) + Potential
Extension
Weighted
Average
Remaining Life(1)
Countries with Successful
Concession Extensions
Expansion programs in main concessions
Terminal area expansion: new
passenger buildings, apron
expansions, new ground access and
parking
New commercial areas: duty free
shops, retail stores, entertainment,
restaurants, and others
Commercial area expansion in and
outside the terminal, including retail
stores, entertainment, food court,
restaurants, etc. subject to macro
evolution.
New 48,500 sqm terminal and a 2,400
mts long runway
New terminal to include 7,300 sqm of
commercial space and improved
retail layout
… and growing inorganically through selective acquisitions while keeping a disciplined approach:
• Regions where we are currently present
• Invest in new infrastructure to serve unattended
demand
• Concessions with potential to develop new routes
• Explore other sources of revenues (advertising,
car parking, VIP lounges, real estate)
• Leveraging our expertise and solid balance
sheet
• Potential to increase connecting traffic / hub
strategy
• Opportunities to expand commercial space
Source: Company information.
1. Weighted by 2017 passenger traffic and
CAAP's ownership stake in all the
concessions within the country.
2. Any potential extension is subject to certain
terms and conditions including the
government’s approval.
3. Puerta del Sur’s concession was extended for
10 years in September 2014. The Company
is currently in negotiations with the
Uruguayan Government to extend the term of
CAISA’s concession.
4. Concession allows for indefinite 5-year period
extensions.
Expansion at Ezeiza airport
Expansion at Brasilia airport
New runway and terminal at Florence airport
11
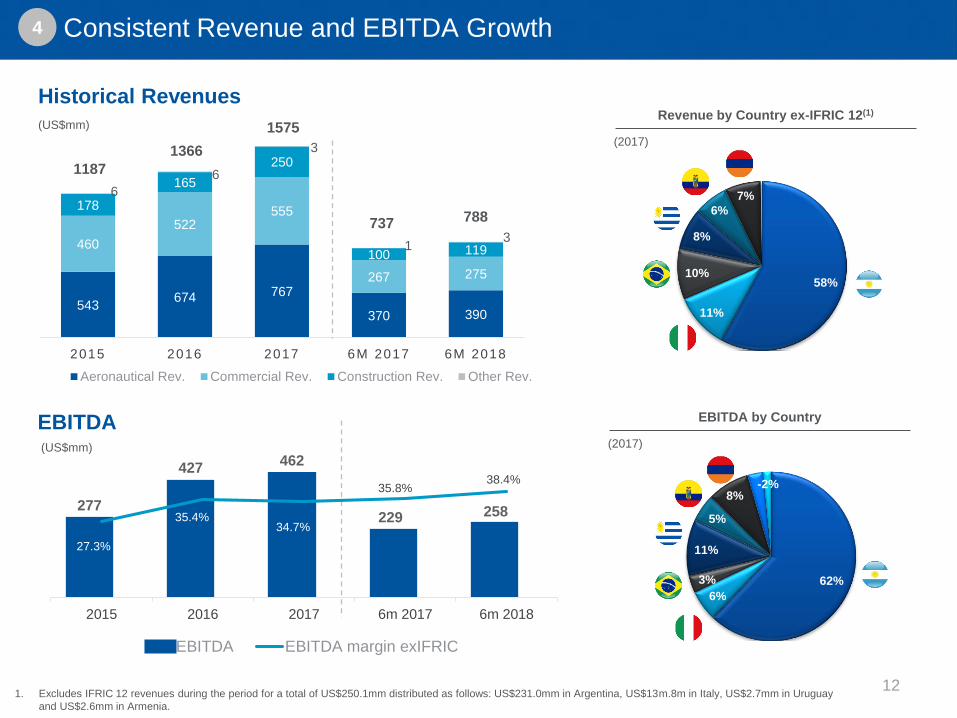
62%
6%
3%
11%
5%
8%-2%
Historical Revenues
4 Consistent Revenue and EBITDA Growth
Revenue by Country ex-IFRIC 12(1)
(US$mm)
(2017)
12
58%
11%
10%
8%
6%
7%
543674 767
370 390
460
522555
267 275
178
165
250
100 119
6
6
3
13
2015 2016 2017 6M 2017 6M 2018
Aeronautical Rev. Commercial Rev. Construction Rev. Other Rev.
EBITDA by Country
(2017)
1. Excludes IFRIC 12 revenues during the period for a total of US$250.1mm distributed as follows: US$231.0mm in Argentina, US$13m.8m in Italy, US$2.7mm in Uruguay
and US$2.6mm in Armenia.
EBITDA(US$mm)
277
427462
229 258
27.3%
35.4%34.7%
35.8%38.4%
2015 2016 2017 6m 2017 6m 2018
EBITDA EBITDA margin exIFRIC
1187
737
1575
1366
788
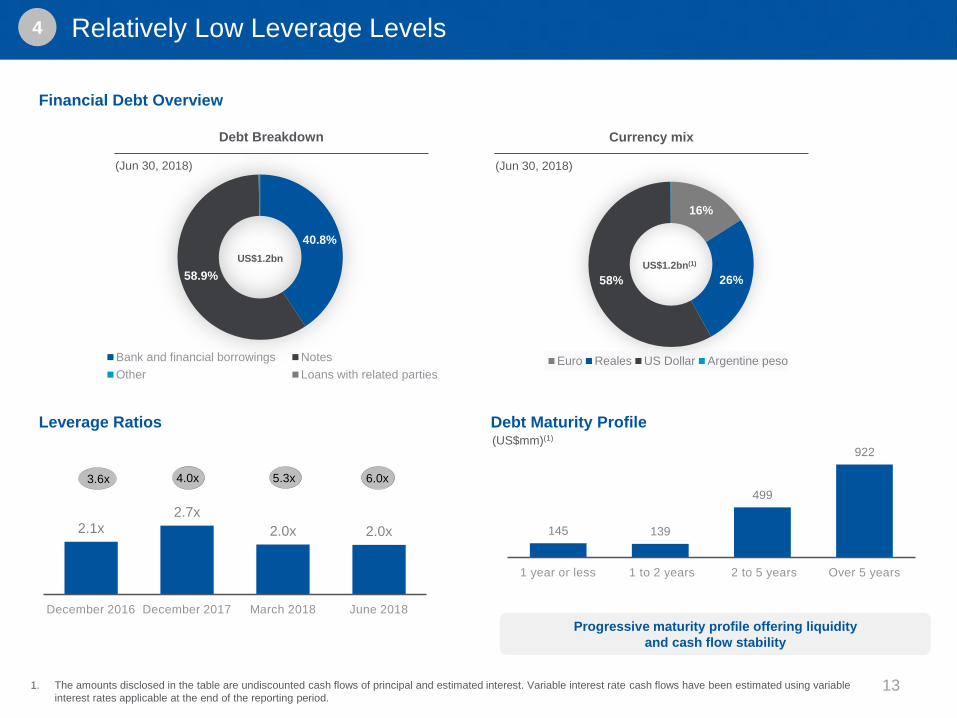
16%
26%58%
Euro Reales US Dollar Argentine peso
40.8%
58.9%
Bank and financial borrowings Notes
Other Loans with related parties
4
Debt Maturity ProfileLeverage Ratios(US$mm)(1)
Progressive maturity profile offering liquidity
and cash flow stability
Relatively Low Leverage Levels
Financial Debt Overview
Debt Breakdown
(Jun 30, 2018)
1. The amounts disclosed in the table are undiscounted cash flows of principal and estimated interest. Variable interest rate cash flows have been estimated using variable
interest rates applicable at the end of the reporting period.13
2.1x2.7x
2.0x 2.0x
December 2016 December 2017 March 2018 June 2018
3.6x 4.0x 5.3x 6.0x
145 139
499
922
1 year or less 1 to 2 years 2 to 5 years Over 5 years
US$1.2bnUS$1.2bn(1)
Currency mix
(Jun 30, 2018)
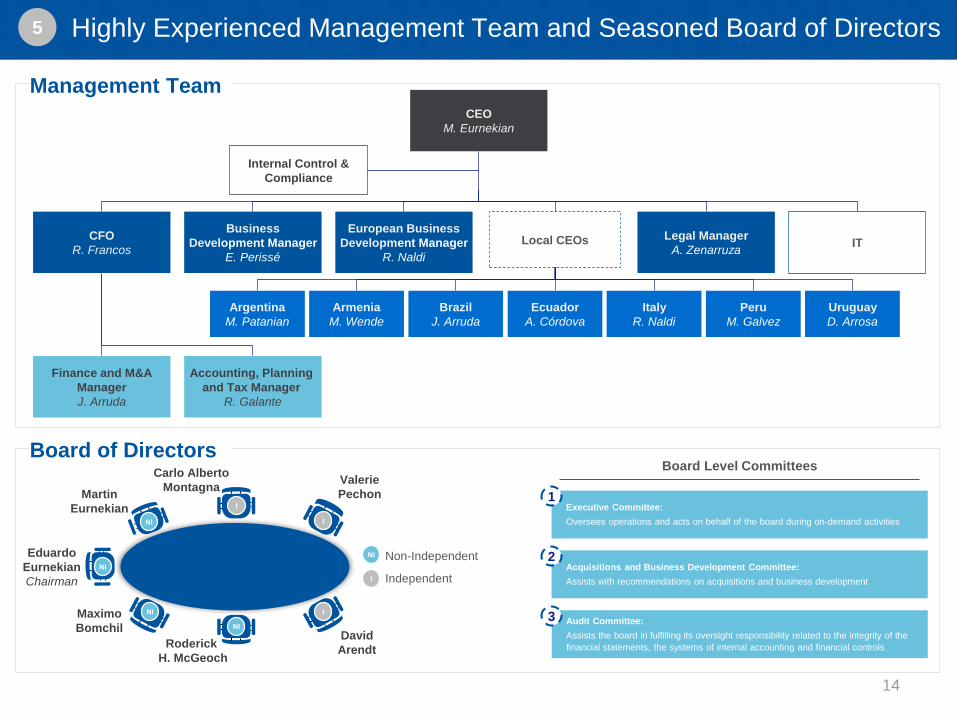
5 Highly Experienced Management Team and Seasoned Board of Directors
Board of Directors
NI
I
Non-Independent
IndependentNI
NI
NI
NI
I
I
I
Eduardo
Eurnekian
Chairman
Carlo Alberto
MontagnaValerie
PechonMartin
Eurnekian
Maximo
BomchilDavid
Arendt
Board Level Committees
Executive Committee:
Oversees operations and acts on behalf of the board during on-demand activities
Audit Committee:
Assists the board in fulfilling its oversight responsibility related to the integrity of the
financial statements, the systems of internal accounting and financial controls
Acquisitions and Business Development Committee:
Assists with recommendations on acquisitions and business development
1
2
3
Roderick
H. McGeoch
Management Team
CEO
M. Eurnekian
CFO
R. Francos
Business
Development Manager
E. Perissé
European Business
Development Manager
R. Naldi
Local CEOs Legal Manager
A. ZenarruzaIT
Ecuador
A. Córdova
Italy
R. Naldi
Peru
M. Galvez
Uruguay
D. Arrosa
Argentina
M. Patanian
Armenia
M. Wende
Brazil
J. Arruda
Finance and M&A
Manager
J. Arruda
Accounting, Planning
and Tax Manager
R. Galante
Internal Control &
Compliance
14
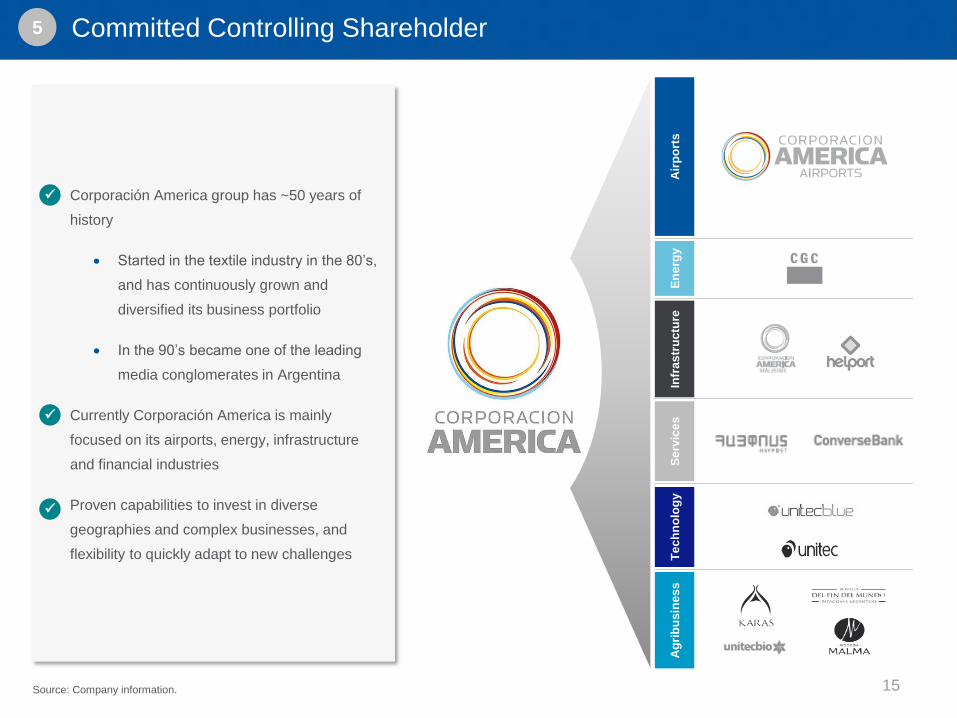
5
Source: Company information.
Corporación America group has ~50 years of
history
Started in the textile industry in the 80’s,
and has continuously grown and
diversified its business portfolio
In the 90’s became one of the leading
media conglomerates in Argentina
Currently Corporación America is mainly
focused on its airports, energy, infrastructure
and financial industries
Proven capabilities to invest in diverse
geographies and complex businesses, and
flexibility to quickly adapt to new challenges
Committed Controlling Shareholder
Air
po
rts
En
erg
yA
gri
bu
sin
es
sS
erv
ice
sIn
fras
tru
ctu
reT
ec
hn
olo
gy
15
Supplemental information
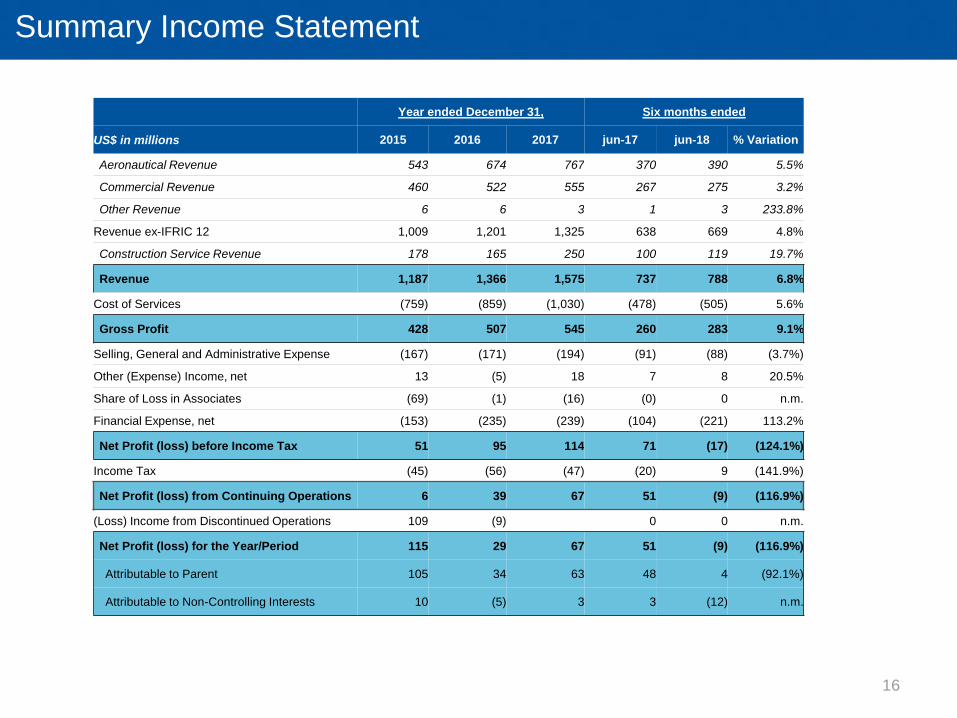
Summary Income Statement
16
Year ended December 31, Six months ended
US$ in millions 2015 2016 2017 jun-17 jun-18 % Variation
Aeronautical Revenue 543 674 767 370 390 5.5%
Commercial Revenue 460 522 555 267 275 3.2%
Other Revenue 6 6 3 1 3 233.8%
Revenue ex-IFRIC 12 1,009 1,201 1,325 638 669 4.8%
Construction Service Revenue 178 165 250 100 119 19.7%
Revenue 1,187 1,366 1,575 737 788 6.8%
Cost of Services (759) (859) (1,030) (478) (505) 5.6%
Gross Profit 428 507 545 260 283 9.1%
Selling, General and Administrative Expense (167) (171) (194) (91) (88) (3.7%)
Other (Expense) Income, net 13 (5) 18 7 8 20.5%
Share of Loss in Associates (69) (1) (16) (0) 0 n.m.
Financial Expense, net (153) (235) (239) (104) (221) 113.2%
Net Profit (loss) before Income Tax 51 95 114 71 (17) (124.1%)
Income Tax (45) (56) (47) (20) 9 (141.9%)
Net Profit (loss) from Continuing Operations 6 39 67 51 (9) (116.9%)
(Loss) Income from Discontinued Operations 109 (9) 0 0 n.m.
Net Profit (loss) for the Year/Period 115 29 67 51 (9) (116.9%)
Attributable to Parent 105 34 63 48 4 (92.1%)
Attributable to Non-Controlling Interests 10 (5) 3 3 (12) n.m.
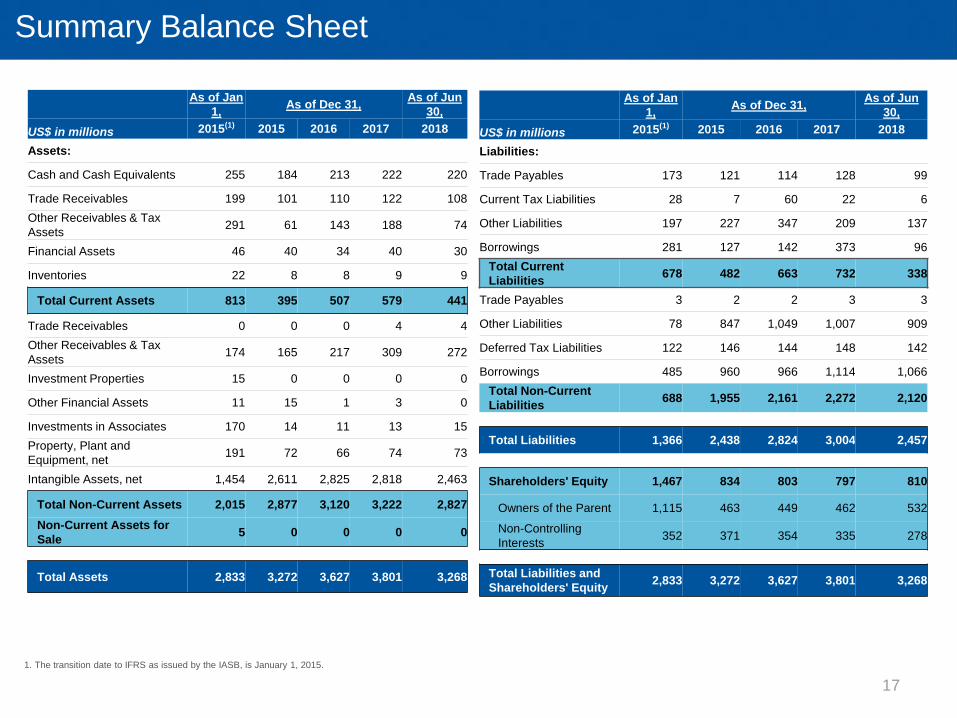
Summary Balance Sheet
1. The transition date to IFRS as issued by the IASB, is January 1, 2015.
17
As of Jan
1,As of Dec 31,
As of Jun
30,
US$ in millions 2015(1) 2015 2016 2017 2018
Assets:
Cash and Cash Equivalents 255 184 213 222 220
Trade Receivables 199 101 110 122 108
Other Receivables & Tax
Assets291 61 143 188 74
Financial Assets 46 40 34 40 30
Inventories 22 8 8 9 9
Total Current Assets 813 395 507 579 441
Trade Receivables 0 0 0 4 4
Other Receivables & Tax
Assets174 165 217 309 272
Investment Properties 15 0 0 0 0
Other Financial Assets 11 15 1 3 0
Investments in Associates 170 14 11 13 15
Property, Plant and
Equipment, net191 72 66 74 73
Intangible Assets, net 1,454 2,611 2,825 2,818 2,463
Total Non-Current Assets 2,015 2,877 3,120 3,222 2,827
Non-Current Assets for
Sale5 0 0 0 0
Total Assets 2,833 3,272 3,627 3,801 3,268
As of Jan
1,As of Dec 31,
As of Jun
30,
US$ in millions 2015(1) 2015 2016 2017 2018
Liabilities:
Trade Payables 173 121 114 128 99
Current Tax Liabilities 28 7 60 22 6
Other Liabilities 197 227 347 209 137
Borrowings 281 127 142 373 96
Total Current
Liabilities678 482 663 732 338
Trade Payables 3 2 2 3 3
Other Liabilities 78 847 1,049 1,007 909
Deferred Tax Liabilities 122 146 144 148 142
Borrowings 485 960 966 1,114 1,066
Total Non-Current
Liabilities688 1,955 2,161 2,272 2,120
Total Liabilities 1,366 2,438 2,824 3,004 2,457
Shareholders' Equity 1,467 834 803 797 810
Owners of the Parent 1,115 463 449 462 532
Non-Controlling
Interests352 371 354 335 278
Total Liabilities and
Shareholders' Equity2,833 3,272 3,627 3,801 3,268
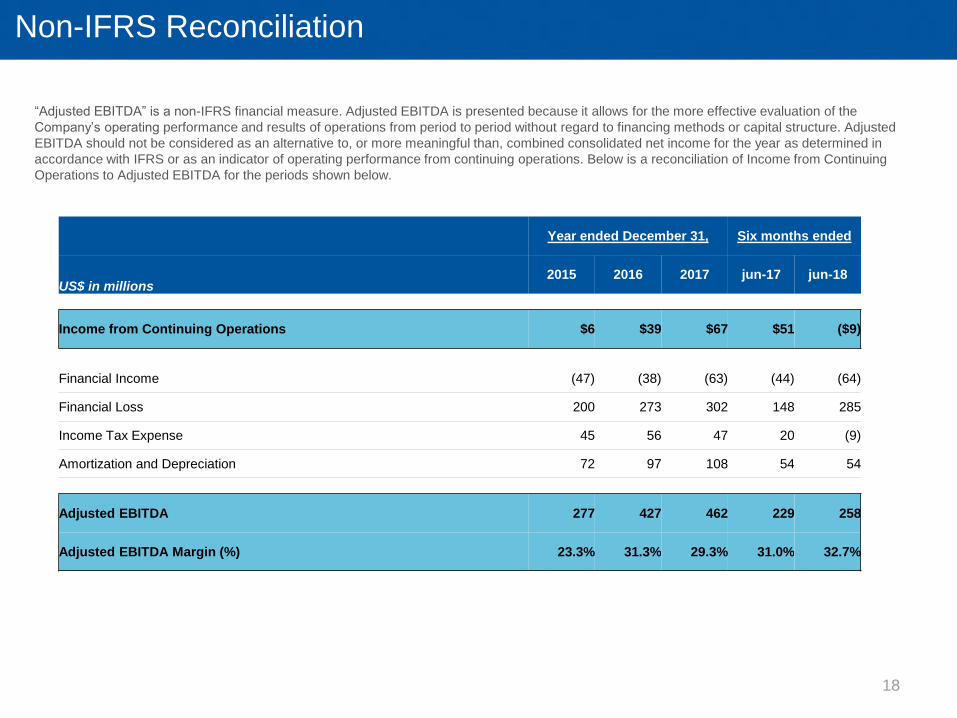
Non-IFRS Reconciliation
“Adjusted EBITDA” is a non-IFRS financial measure. Adjusted EBITDA is presented because it allows for the more effective evaluation of the
Company’s operating performance and results of operations from period to period without regard to financing methods or capital structure. Adjusted
EBITDA should not be considered as an alternative to, or more meaningful than, combined consolidated net income for the year as determined in
accordance with IFRS or as an indicator of operating performance from continuing operations. Below is a reconciliation of Income from Continuing
Operations to Adjusted EBITDA for the periods shown below.
18
Year ended December 31, Six months ended
US$ in millions2015 2016 2017 jun-17 jun-18
Income from Continuing Operations $6 $39 $67 $51 ($9)
Financial Income (47) (38) (63) (44) (64)
Financial Loss 200 273 302 148 285
Income Tax Expense 45 56 47 20 (9)
Amortization and Depreciation 72 97 108 54 54
Adjusted EBITDA 277 427 462 229 258
Adjusted EBITDA Margin (%) 23.3% 31.3% 29.3% 31.0% 32.7%

Continuous evaluation of new routes and
new frequencies
Maintain close contacts and relationships
with major airlines
Proper coordination among airports with
common routes
Seek to obtain other sources of revenues
from airlines (e.g.: cargo facilities,
maintenance centers)
Airlines and Routes
Deep Operating Know-How Driving a Successful Business Model2
Source: Company information.
Detailed analysis of airport capacity needs to determine
optimal terminal and taxi-way areas
Constant evaluation of expansion opportunities and
requirements due to passenger growth
Permanent evaluation of scheduled maintenance
investment requirements (e.g.: runway, terminal, etc.)
Unique know-how of in-house team experts in design and
execution of new projects
Efficient Capital Investment Planning
Work closely with airlines to reduce MCT and
time-on-the-ground
Ensure facilities provide flexibility and capabilities
to meet airline demands (e.g.: cargo, catering,
training facilities)
Operations OptimizationExperienced Government
Affairs
Track record of negotiating, acquiring
and renewing concessions across
geographies
Long-standing relationships with
governments and regulatory
authorities
Working together to develop and
maintain concession agreements
Partnerships that create opportunities
for concession renewals
Commercial Revenues
Established long standing relationships with
key commercial tenants (Dufry, JCD, IMC)
Continuous evaluation of the mix of stores
(category, retail vs food & beverage, land side
vs airside) to maximize revenues
Analysis of potential new developments and
expansions of new commercial areas to
increase offering throughout several airports
Constant evaluation to increase other sources
of revenues such as advertising, VIP lounges,
car parking, real state, hotels, among others
19
Source: Company information.
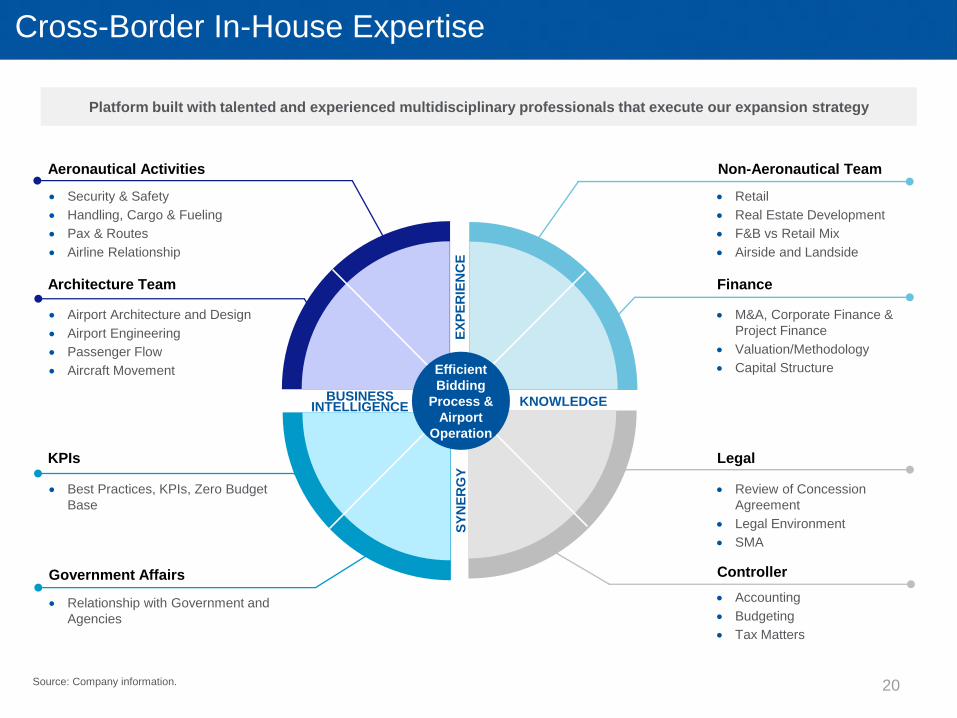
Platform built with talented and experienced multidisciplinary professionals that execute our expansion strategy
Architecture Team
KPIs
Government Affairs Controller
Legal
Finance
Non-Aeronautical TeamAeronautical Activities
Security & Safety
Handling, Cargo & Fueling
Pax & Routes
Airline Relationship
Best Practices, KPIs, Zero Budget
Base
Retail
Real Estate Development
F&B vs Retail Mix
Airside and Landside
M&A, Corporate Finance &
Project Finance
Valuation/Methodology
Capital Structure
Relationship with Government and
Agencies
Review of Concession
Agreement
Legal Environment
SMA
Accounting
Budgeting
Tax Matters
BUSINESSINTELLIGENCE KNOWLEDGE
EX
PE
RIE
NC
ES
YN
ER
GY
Efficient
Bidding
Process &
Airport
Operation
Airport Architecture and Design
Airport Engineering
Passenger Flow
Aircraft Movement
Cross-Border In-House Expertise
20