Embed Size (px)
Citation preview
CORONAVIRUS DASHBOARD FOR ENERGY DEMAND UPDATE #22
March 11, 2020
Concerns have become elevated, as WHO is now characterizing the situation as “pandemic”; in fact, number of coronavirus cases continues to climb in Europe in spite of Italy going into shutdown mode; but on a positive note, Chinese traffic activity is normalizing, and Hubei province is closing down its makeshift hospitals
News from China is getting better, but other parts of the world are facing elevated uncertainties; the reach of the coronavirus outbreak has become global, and the WHO has decided to characterize the situation as a pandemic.
Platts Analytics will soon publish updated oil demand forecast based on the latest assessment of this pandemic situation.
Latest highway traffic data from China point to a strengthening on a year-on-year basis, boding well for oil demand in the transport sector.
Efforts to bring migrant workers to their places of work are intensifying, as various provinces have implemented “point-to-point” chartered bus services designed to send workers directly to their final destinations.
Hubei province, the epicenter of the coronavirus outbreak, is getting ready to emerge from lockdown; all of its makeshift hospitals have now been closed; electricity demand in the region, while down substantially on a Y/Y basis, is showing resilience.
Chinese oil refining margins have seen a major boost from a drop in crude prices.
As market participants in the polyolefins space are taking a wait and see attitude, price movements have been limited.
Given declines in crude prices, naphtha feedstock demand in Asia is expected to increase at the expense of LPG during March.
LNG demand in China has been stabilizing; while industrial demand is up, heating demand is down.
While South Korea is no longer reporting major increases in coronavirus cases, concerns have become elevated in Europe, and Italy has essentially gone into a nationwide shutdown, replicating what China did in early February.
Italian electricity demand remains resilient for now, but it is expected to reflect this development soon.
European economic policymakers have reacted, as the Bank of England instituted a surprise 50 basis point interest rate cut; the focus now turns to the European Central Bank, which will hold its governing council meeting on Thursday.
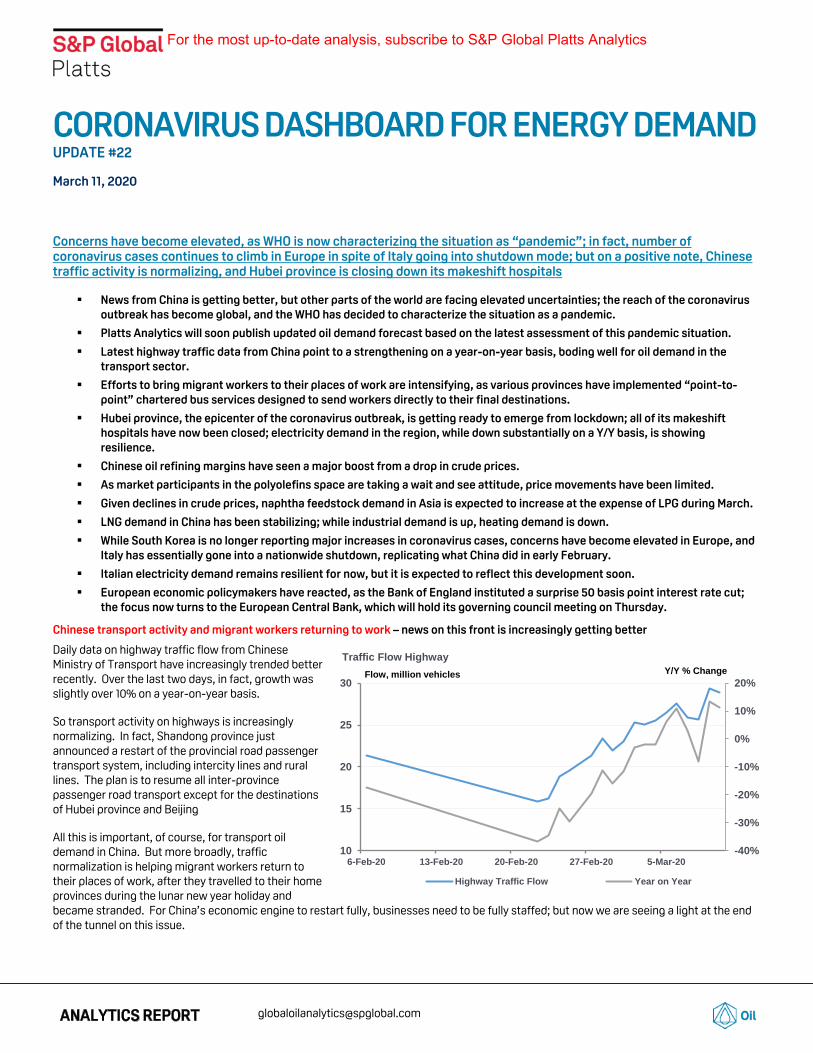
Chinese transport activity and migrant workers returning to work – news on this front is increasingly getting better
Daily data on highway traffic flow from Chinese Ministry of Transport have increasingly trended better recently. Over the last two days, in fact, growth was slightly over 10% on a year-on-year basis.
So transport activity on highways is increasingly normalizing. In fact, Shandong province just announced a restart of the provincial road passenger transport system, including intercity lines and rural lines. The plan is to resume all inter-province passenger road transport except for the destinations of Hubei province and Beijing
All this is important, of course, for transport oil demand in China. But more broadly, traffic normalization is helping migrant workers return to their places of work, after they travelled to their home provinces during the lunar new year holiday and became stranded. For China’s economic engine to restart fully, businesses need to be fully staffed; but now we are seeing a light at the end of the tunnel on this issue.
-40%
-30%
-20%
-10%
0%
10%
20%
10
15
20
25
30
6-Feb-20 13-Feb-20 20-Feb-20 27-Feb-20 5-Mar-20
Traffic Flow Highway
Highway Traffic Flow Year on Year
Flow, million vehicles Y/Y % Change
For the most up-to-date analysis, subscribe to S&P Global Platts Analytics
CORONAVIRUS DASHBOARD MARCH 11, 2020
© 2020 S&P Global Platts, a division of S&P Global Inc. All rights reserved. 2
In fact, there were many positive headlines on this front in recent Chinese news:
As of March 6, Sichuan, Zhejiang, Shandong, Fujian, and 23 other provinces have implemented the "point-to-point" one-station direct chartered bus service, which is designed to bring migrant workers directly to their final destinations.
According to Ministry of transport, this is expected to complete the transportation of migrant workers back to their posts in early April.
Up to 78 million migrant workers have returned to work, accounting for 60 percent of this year's return. 70% of migrant workers from Guangdong and Zhejiang provinces returned to work, and 60 percent of migrant workers from Jiangsu province returned to work, according to Ministry of Human Resources and Social Affairs.
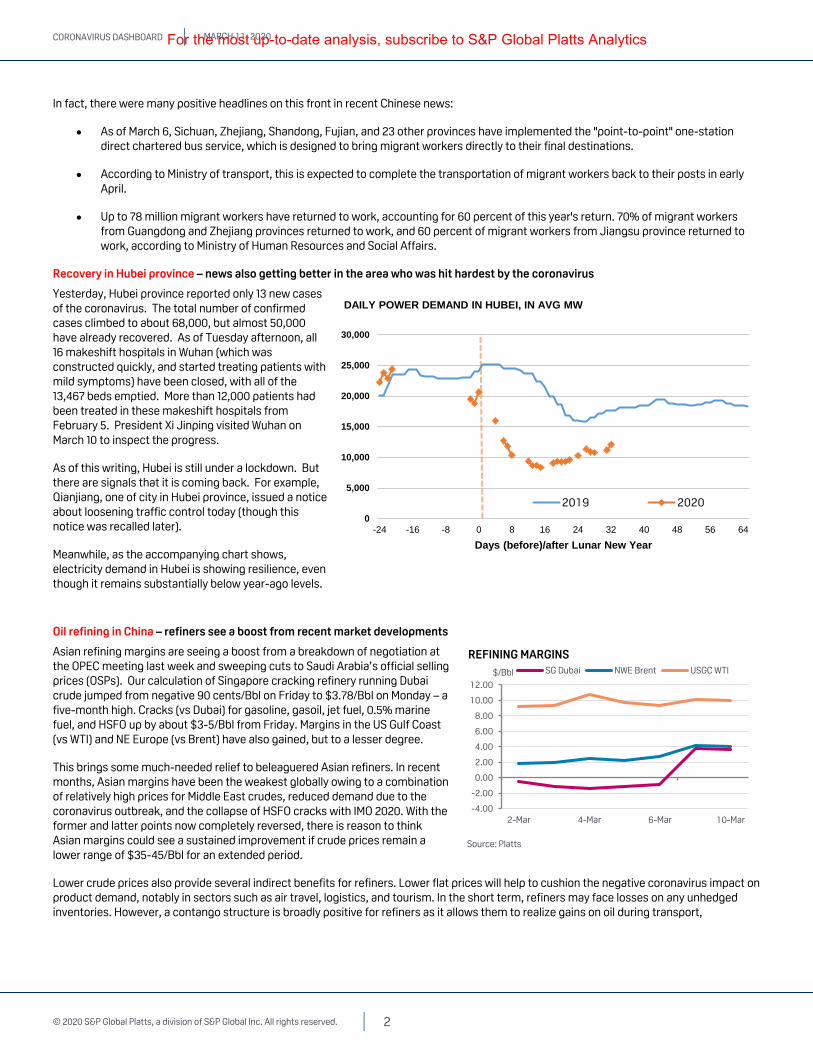
Recovery in Hubei province – news also getting better in the area who was hit hardest by the coronavirus
Yesterday, Hubei province reported only 13 new cases of the coronavirus. The total number of confirmed cases climbed to about 68,000, but almost 50,000 have already recovered. As of Tuesday afternoon, all 16 makeshift hospitals in Wuhan (which was constructed quickly, and started treating patients with mild symptoms) have been closed, with all of the 13,467 beds emptied. More than 12,000 patients had been treated in these makeshift hospitals from February 5. President Xi Jinping visited Wuhan on March 10 to inspect the progress.
As of this writing, Hubei is still under a lockdown. But there are signals that it is coming back. For example, Qianjiang, one of city in Hubei province, issued a notice about loosening traffic control today (though this notice was recalled later).
Meanwhile, as the accompanying chart shows, electricity demand in Hubei is showing resilience, even though it remains substantially below year-ago levels.
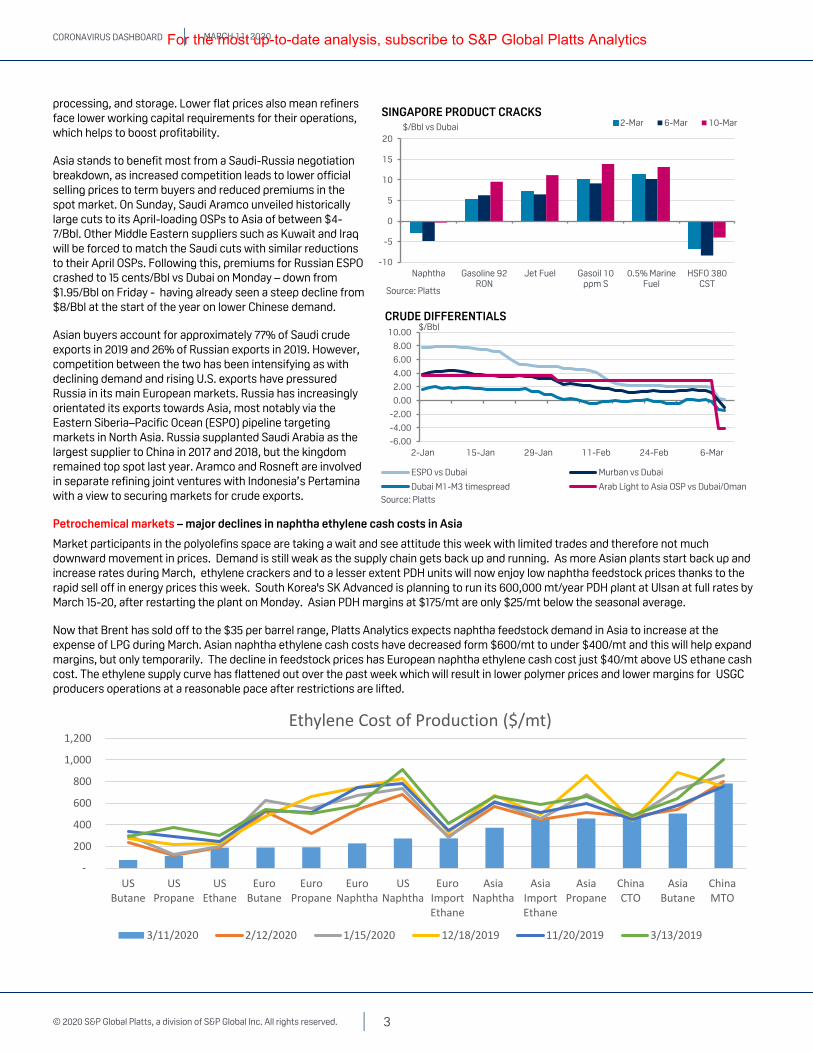
Oil refining in China – refiners see a boost from recent market developments
Asian refining margins are seeing a boost from a breakdown of negotiation at the OPEC meeting last week and sweeping cuts to Saudi Arabia’s official selling prices (OSPs). Our calculation of Singapore cracking refinery running Dubai crude jumped from negative 90 cents/Bbl on Friday to $3.78/Bbl on Monday – a five-month high. Cracks (vs Dubai) for gasoline, gasoil, jet fuel, 0.5% marine fuel, and HSFO up by about $3-5/Bbl from Friday. Margins in the US Gulf Coast (vs WTI) and NE Europe (vs Brent) have also gained, but to a lesser degree.
This brings some much-needed relief to beleaguered Asian refiners. In recent months, Asian margins have been the weakest globally owing to a combination of relatively high prices for Middle East crudes, reduced demand due to the coronavirus outbreak, and the collapse of HSFO cracks with IMO 2020. With the former and latter points now completely reversed, there is reason to think Asian margins could see a sustained improvement if crude prices remain a lower range of $35-45/Bbl for an extended period.
Lower crude prices also provide several indirect benefits for refiners. Lower flat prices will help to cushion the negative coronavirus impact on product demand, notably in sectors such as air travel, logistics, and tourism. In the short term, refiners may face losses on any unhedged inventories. However, a contango structure is broadly positive for refiners as it allows them to realize gains on oil during transport,
0
5,000
10,000
15,000
20,000
25,000
30,000
-24 -16 -8 0 8 16 24 32 40 48 56 64
Days (before)/after Lunar New Year
DAILY POWER DEMAND IN HUBEI, IN AVG MW
2019 2020
-4.00
-2.00
0.00
2.00
4.00
6.00
8.00
10.00
12.00
2-Mar 4-Mar 6-Mar 10-Mar
$/Bbl
REFINING MARGINS
SG Dubai NWE Brent USGC WTI
Source: Platts
For the most up-to-date analysis, subscribe to S&P Global Platts Analytics
CORONAVIRUS DASHBOARD MARCH 11, 2020
© 2020 S&P Global Platts, a division of S&P Global Inc. All rights reserved. 3
processing, and storage. Lower flat prices also mean refiners face lower working capital requirements for their operations, which helps to boost profitability.
Asia stands to benefit most from a Saudi-Russia negotiation breakdown, as increased competition leads to lower official selling prices to term buyers and reduced premiums in the spot market. On Sunday, Saudi Aramco unveiled historically large cuts to its April-loading OSPs to Asia of between $4-7/Bbl. Other Middle Eastern suppliers such as Kuwait and Iraq will be forced to match the Saudi cuts with similar reductions to their April OSPs. Following this, premiums for Russian ESPO crashed to 15 cents/Bbl vs Dubai on Monday – down from $1.95/Bbl on Friday - having already seen a steep decline from $8/Bbl at the start of the year on lower Chinese demand.
Asian buyers account for approximately 77% of Saudi crude exports in 2019 and 26% of Russian exports in 2019. However, competition between the two has been intensifying as with declining demand and rising U.S. exports have pressured Russia in its main European markets. Russia has increasingly orientated its exports towards Asia, most notably via the Eastern Siberia–Pacific Ocean (ESPO) pipeline targeting markets in North Asia. Russia supplanted Saudi Arabia as the largest supplier to China in 2017 and 2018, but the kingdom remained top spot last year. Aramco and Rosneft are involved in separate refining joint ventures with Indonesia’s Pertamina with a view to securing markets for crude exports.
Petrochemical markets – major declines in naphtha ethylene cash costs in Asia
Market participants in the polyolefins space are taking a wait and see attitude this week with limited trades and therefore not much downward movement in prices. Demand is still weak as the supply chain gets back up and running. As more Asian plants start back up and increase rates during March, ethylene crackers and to a lesser extent PDH units will now enjoy low naphtha feedstock prices thanks to the rapid sell off in energy prices this week. South Korea's SK Advanced is planning to run its 600,000 mt/year PDH plant at Ulsan at full rates by March 15-20, after restarting the plant on Monday. Asian PDH margins at $175/mt are only $25/mt below the seasonal average.
Now that Brent has sold off to the $35 per barrel range, Platts Analytics expects naphtha feedstock demand in Asia to increase at the expense of LPG during March. Asian naphtha ethylene cash costs have decreased form $600/mt to under $400/mt and this will help expand margins, but only temporarily. The decline in feedstock prices has European naphtha ethylene cash cost just $40/mt above US ethane cash cost. The ethylene supply curve has flattened out over the past week which will result in lower polymer prices and lower margins for USGC producers operations at a reasonable pace after restrictions are lifted.
-10
-5
0
5
10
15
20
Naphtha Gasoline 92RON
Jet Fuel Gasoil 10ppm S
0.5% MarineFuel
HSFO 380CST
$/Bbl vs Dubai
SINGAPORE PRODUCT CRACKS2-Mar 6-Mar 10-Mar
Source: Platts
-6.00
-4.00
-2.00
0.00
2.00
4.00
6.00
8.00
10.00
2-Jan 15-Jan 29-Jan 11-Feb 24-Feb 6-Mar
$/BblCRUDE DIFFERENTIALS
ESPO vs Dubai Murban vs Dubai
Dubai M1-M3 timespread Arab Light to Asia OSP vs Dubai/Oman
Source: Platts
-
200
400
600
800
1,000
1,200
USButane
USPropane
USEthane
EuroButane
EuroPropane
EuroNaphtha
USNaphtha
EuroImportEthane
AsiaNaphtha
AsiaImportEthane
AsiaPropane
ChinaCTO
AsiaButane
ChinaMTO
Ethylene Cost of Production ($/mt)
3/11/2020 2/12/2020 1/15/2020 12/18/2019 11/20/2019 3/13/2019
For the most up-to-date analysis, subscribe to S&P Global Platts Analytics
CORONAVIRUS DASHBOARD MARCH 11, 2020
© 2020 S&P Global Platts, a division of S&P Global Inc. All rights reserved. 4
Chinese LNG – demand holding more or less steady
Demand in China is showing signs of stabilizing after initially seeing signs of picking up over the past several weeks. This is likely due to converging fundamentals as industrial activity picks up while temperature related demand declines. Deliveries in the Shanghai region have held steady between 70-85 Mcm/d on a rolling 30-day moving average basis but have failed to break above year-ago levels for any sustained period of time so far this year.
This showcases the impact that not only coronavirus has had on the region but also weather, as temperatures have remained significantly above normal from January through February. Warming temperatures as we enter the spring shoulder season are also having an impact on regional demand. However, South Korean and Taiwanese imports continue to show signs of resilience even as the reported number of cases increasing in recent periods.
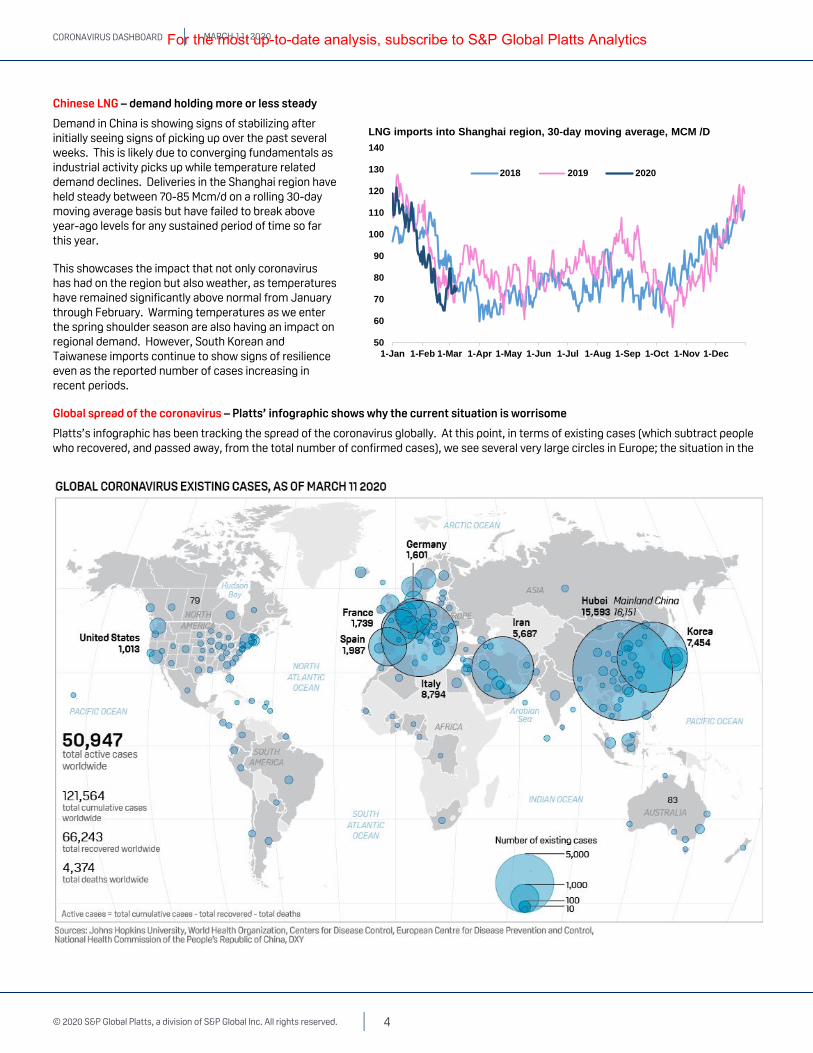
Global spread of the coronavirus – Platts’ infographic shows why the current situation is worrisome
Platts’s infographic has been tracking the spread of the coronavirus globally. At this point, in terms of existing cases (which subtract people who recovered, and passed away, from the total number of confirmed cases), we see several very large circles in Europe; the situation in the
50
60
70
80
90
100
110
120
130
140
1-Jan 1-Feb 1-Mar 1-Apr 1-May 1-Jun 1-Jul 1-Aug 1-Sep 1-Oct 1-Nov 1-Dec
2018 2019 2020
LNG imports into Shanghai region, 30-day moving average, MCM /D
For the most up-to-date analysis, subscribe to S&P Global Platts Analytics
CORONAVIRUS DASHBOARD MARCH 11, 2020
© 2020 S&P Global Platts, a division of S&P Global Inc. All rights reserved. 5
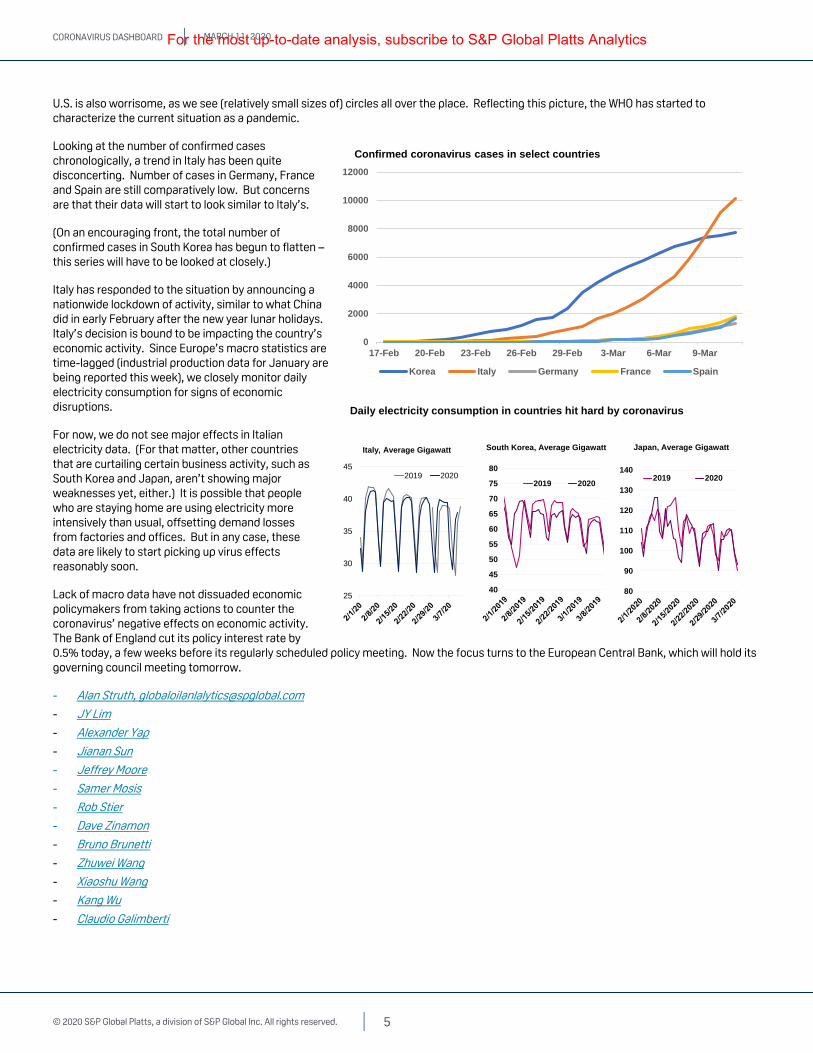
U.S. is also worrisome, as we see (relatively small sizes of) circles all over the place. Reflecting this picture, the WHO has started to characterize the current situation as a pandemic.
Looking at the number of confirmed cases chronologically, a trend in Italy has been quite disconcerting. Number of cases in Germany, France and Spain are still comparatively low. But concerns are that their data will start to look similar to Italy’s.
(On an encouraging front, the total number of confirmed cases in South Korea has begun to flatten – this series will have to be looked at closely.)
Italy has responded to the situation by announcing a nationwide lockdown of activity, similar to what China did in early February after the new year lunar holidays. Italy’s decision is bound to be impacting the country’s economic activity. Since Europe’s macro statistics are time-lagged (industrial production data for January are being reported this week), we closely monitor daily electricity consumption for signs of economic disruptions.
For now, we do not see major effects in Italian electricity data. (For that matter, other countries that are curtailing certain business activity, such as South Korea and Japan, aren’t showing major weaknesses yet, either.) It is possible that people who are staying home are using electricity more intensively than usual, offsetting demand losses from factories and offices. But in any case, these data are likely to start picking up virus effects reasonably soon.
Lack of macro data have not dissuaded economic policymakers from taking actions to counter the coronavirus’ negative effects on economic activity. The Bank of England cut its policy interest rate by 0.5% today, a few weeks before its regularly scheduled policy meeting. Now the focus turns to the European Central Bank, which will hold its governing council meeting tomorrow.
- Alan Struth, [email protected]
- JY Lim
- Alexander Yap
- Jianan Sun
- Jeffrey Moore
- Samer Mosis
- Rob Stier
- Dave Zinamon
- Bruno Brunetti
- Zhuwei Wang
- Xiaoshu Wang
- Kang Wu
- Claudio Galimberti
0
2000
4000
6000
8000
10000
12000
17-Feb 20-Feb 23-Feb 26-Feb 29-Feb 3-Mar 6-Mar 9-Mar
Korea Italy Germany France Spain
Confirmed coronavirus cases in select countries
Daily electricity consumption in countries hit hard by coronavirus
40
45
50
55
60
65
70
75
80
2019 2020
South Korea, Average Gigawatt
80
90
100
110
120
130
1402019 2020
Japan, Average Gigawatt
25
30
35
40
452019 2020
Italy, Average Gigawatt
For the most up-to-date analysis, subscribe to S&P Global Platts Analytics

CORONAVIRUS DASHBOARD MARCH 11, 2020
© 2020 S&P Global Platts, a division of S&P Global Inc. All rights reserved. 6
© 2020 S&P Global Platts, a division of S&P Global Inc. All rights reserved.
The names “S&P Global Platts” and “Platts” and the S&P Global Platts logo are trademarks of S&P Global Inc. Permission for any commercial use of the S&P Global Platts logo must be granted in writing by S&P Global Inc.
You may view or otherwise use the information, prices, indices, assessments and other related information, graphs, tables and images (“Data”) in this publication only for your personal use or, if you or your company has a license for the Data from S&P Global Platts and you are an authorized user, for your company’s internal business use only. You may not publish, reproduce, extract, distribute, retransmit, resell, create any derivative work from and/or otherwise provide access to the Data or any portion thereof to any person (either within or outside your company, including as part of or via any internal electronic system or intranet), firm or entity, including any subsidiary, parent, or other entity that is affiliated with your company, without S&P Global Platts’ prior written consent or as otherwise authorized under license from S&P Global Platts. Any use or distribution of the Data beyond the express uses authorized in this paragraph above is subject to the payment of additional fees to S&P Global Platts.
S&P Global Platts, its affiliates and all of their third-party licensors disclaim any and all warranties, express or implied, including, but not limited to, any warranties of merchantability or fitness for a particular purpose or use as to the Data, or the results obtained by its use or as to the performance thereof. Data in this publication includes independent and verifiable data collected from actual market participants. Any user
of the Data should not rely on any information and/or assessment contained therein in making any investment, trading, risk management or other decision. S&P Global Platts, its affiliates and their third-party licensors do not guarantee the adequacy, accuracy, timeliness and/or completeness of the Data or any component thereof or any communications (whether written, oral, electronic or in other format), and shall not be subject to any damages or liability, including but not limited to any indirect, special, incidental, punitive or consequential damages (including but not limited to, loss of profits, trading losses and loss of goodwill).
ICE index data and NYMEX futures data used herein are provided under S&P Global Platts’ commercial licensing agreements with ICE and with NYMEX. You acknowledge that the ICE index data and NYMEX futures data herein are confidential and are proprietary trade secrets and data of ICE and NYMEX or its licensors/suppliers, and you shall use best efforts to prevent the unauthorized publication, disclosure or copying of the ICE index data and/or NYMEX futures data.
Permission is granted for those registered with the Copyright Clearance Center (CCC) to copy material herein for internal reference or personal use only, provided that appropriate payment is made to the CCC, 222 Rosewood Drive, Danvers, MA 01923, phone +1-978-750-8400. Reproduction in any other form, or for any other purpose, is forbidden without the express prior permission of S&P Global Inc. For article reprints contact: The YGS Group, phone +1-717-505-9701 x105 (800-501-9571 from the U.S.).
For all other queries or requests pursuant to this notice, please contact S&P Global Inc. via email at [email protected].
For the most up-to-date analysis, subscribe to S&P Global Platts Analytics