Embed Size (px)
Citation preview

Page 1 of 16
Next release: To be announced
Release date: 15 February 2021
Contact: David Roberts [email protected] +44 (0)1633 455443
Article
Coronavirus and the impact on the UK travel and tourism industryAnalysis of how industries related to travel and tourism in the UK have been affected by the coronavirus (COVID-19) pandemic, using data on business performance and the labour market.
Table of contents
1. Main points
2. Introduction to travel and tourism analysis
3. Demand for travel and tourism during the coronavirus pandemic
4. Impacts on businesses in travel and tourism industries
5. Impact on the labour market in travel and tourism industries
6. Employment in travel and tourism by local authority
7. List of industries used in this analysis
Page 2 of 16
1 . Main points
Monthly air passenger arrivals to the UK fell from 6,804,900 in February 2020 to 112,300 in April 2020, a fall of 98.3%.
Greater London saw the largest fall in room occupancy of any English region from 2019 to 2020, with just 20% of rooms occupied in July 2020 compared with 90% in the same month in 2019.
Accommodation and travel agency businesses saw the sharpest decline in turnover during the first national lockdown, falling to 9.3% of their February levels in May 2020.
The proportion of businesses in travel and tourism industries trading peaked at 85% in October 2020, before declining in response to increasing restrictions in November.
In the three months to June 2020, employment in accommodation for visitors fell by 21.5% compared with the same three months of 2019.
In travel and tourism industries overall, the number of people aged 16 to 24 years saw the largest fall in employment of any age group between Quarter 3 (July to Sept) 2019 and Quarter 3 2020.
2 . Introduction to travel and tourism analysis
The travel and tourism industries contributed . Since then, the 6.7% of all gross value added in the UK in 2018coronavirus (COVID-19) pandemic has impacted the sector heavily in 2020 and into 2021, with government restrictions both in the UK and worldwide preventing tourism for large periods of time. Within the UK, unnecessary
, before a . The travel was first discouraged on 16 March nationwide lockdown was announced on 23 MarchForeign and Commonwealth Office advised against all non-essential overseas travel . As restrictions on 17 Marchwere gradually relaxed with the , followed by the implementation of opening of non-essential retail on 15 June
, operation in these industries became easier, although varying devolved quarantine-free travel corridors in Julyand regional restrictions have led to differing impacts on businesses. Travel was again impacted by the second and third English lockdowns in November 2020 and January 2021 and travel corridors were suspended on 18 January 2021.
Throughout this analysis the definition of travel and tourism industries is consistent with the compilation of the . Some industries have been combined or omitted for statistical disclosure reasons. A Tourism Satellite Account
list of the industries and categories used is available in .Section 7
3 . Demand for travel and tourism during the coronavirus pandemic
Passenger numbers
Official data on visits to the UK by overseas residents up to Quarter 2 (Apr to June) 2020 can be found in . According to these estimates, in Quarter 2 2020 Overseas travel and tourism, provisional: April to June 2020
overseas residents made 96% fewer visits and spent 97% less than in Quarter 2 2019.
Data from the Civil Aviation Authority show how international passenger traffic at UK airports fell to 1.9% of its , recovering to a peak of 36.7% in August before falling again in response to February 2020 levels in April
increased restrictions. Domestic air passenger traffic followed a similar pattern, although fell at a slower pace after the peak in August, as more international restrictions were imposed. Notably, the two types of passenger traffic have performed similarly in 2020, relative to their levels in February 2020, while in 2019 international passenger traffic was far more seasonal.

Page 3 of 16
Figure 1: Domestic and international air passenger traffic fell to less than 2% of its February 2020 levels in April 2020
Air passenger traffic, non-seasonally adjusted, indexed to February 2020
Source: Civil Aviation Authority
Data from the Home Office, taken from the Advanced Passenger Information provided by airlines allows us to alone, and to distinguish between all arrivals and British national arrivals. International passenger identify arrivals
arrivals fell from 6.8 million in February 2020 to 112,300 in April, of which 56.5% were British nationals, an increase of 5.6 percentage points on the proportion in February. British nationals, as a proportion of all arrivals to the UK, fell to a low of 33.6% in June before rising again to 57.0% in August as national restrictions relaxed further.
Data released by GetLink, the operator of EuroTunnel, show how traffic through the tunnel has changed this year.
In April 2020, only 19,862 passenger vehicles travelled, compared with 227,393 in the same month in 2019, a decrease of 91.3%. This includes cars, motorcycles, vehicles with trailers, caravans, camper vans and coaches.
After the partial relaxation of restrictions in both the UK and France, passenger traffic rose to a peak of 267,942 in August, a decrease of 28.2% from the same month in 2019. In comparison with air passenger traffic, this is a proportionately stronger recovery, likely the result of cars representing a large component of traffic in EuroTunnel’s operations, enabling easier social distancing between passengers through remaining in their vehicles.

Page 4 of 16
1.
Figure 2: After an initial decline, passenger vehicle traffic on EuroTunnel responded strongly to the easing of restrictions
Volume of passenger vehicles
Source: Getlink (Eurotunnel)
Notes:
"Passenger vehicles"; includes cars, motorcycles, vehicles with trailers, caravans, camper vans and coaches.
Hotel occupancy in England
VisitEngland carry out a monthly survey of . Occupancy in every English occupancy in hospitality businessesregion declined sharply at the start of the pandemic, with room occupancy in the West Midlands at just 17% of available rooms in open accommodation businesses in April 2020, compared with 71% the previous year.
The recovery for different regions has been at different rates. Greater London saw the weakest recovery of hotel room occupancy of any English region in the summer of 2020, with just 20% of rooms occupied in July 2020 compared with 90% in the same month the previous year. This was in contrast to 2019 when Greater London had the highest occupancy rate in every month except for August.
This is a notable reversal and suggests that the loss of international tourism has been felt most severely in the capital.

Page 5 of 16
Figure 3: The South West of England saw the highest rates of occupancy, in accommodation businesses that were open, in 2020
Percentage of available rooms occupied, monthly
Source: VisitEngland
In the South West of England, occupancy increased from 19% in April 2020 to 72% in August. No other English region exceeded 58% occupancy after March 2020, indicating that this region experienced closer to a “normal” summer season than any other in 2020, and is likely to have been the result of a relative increase in domestic tourism.
Among all English regions, there was a notable decrease of around 10 percentage points in the regions where tiered restrictions were put in place in October, with all decreasing further in response to the English lockdown in November. In the South West, room occupancy fell by 37 percentage points between September and November 2020. In the same months of 2019, the decline was 11 percentage points.
More about coronavirus
Find the latest on .coronavirus (COVID-19) in the UK from the ONS and other sources.Explore the latest coronavirus data
All ONS analysis, summarised in our .coronavirus roundupView .all coronavirus dataFind out how we are .working safely in our studies and surveys
Page 6 of 16
4 . Impacts on businesses in travel and tourism industries
Business turnover
Data from the Monthly Business Survey show that there have been differing impacts of the coronavirus (COVID-19) between industries. Turnover in travel and tourism businesses fell to its lowest level in 2020 in May, at just 26.0% of February levels, compared with 73.6% in all other industries. Accommodation and travel agency businesses saw the sharpest decline in turnover during the first national lockdown, falling to 9.3% of their February levels in May.
In every sub-industry except exhibitions and conferences, there was a response to relaxing restrictions in the summer, with the turnover in food and beverage serving industries peaking at 90.0% of February levels in August. In this industry, we have previously reported on the impact of the Eat Out to Help Out scheme on consumer
.behaviour
Exhibitions and conferences have shown a different pattern of seasonality in previous years’ data, tending to see highest turnover in the autumn and spring. This sub-industry did see some recovery in the autumn, to 35.7% of February levels in November, up from 18.1% in August, the only sub-industry not to see a decline in turnover in response to the national lockdown in November.

Page 7 of 16
1.
2.
Figure 4: Turnover for travel and tourism businesses fell to 26.0% of February levels in May 2020
Turnover by industry, indexed (February 2020 = 100), non-seasonally adjusted, UK
Source: Office for National Statistics - Monthly Business Survey
Notes:
“Total travel and tourism” is the sum of the lower level industries.
“Other industries” is all businesses not included in "Total travel and tourism".
Trading status
Data from the measures the impact of COVID-19 and the end of the EU Business Impacts of Coronavirus Surveytransition period on UK businesses and the economy. The first wave with comparable estimates took place in June 2020.
The proportion of businesses currently trading increased in most travel and tourism industries in July and August, with the proportion of accommodation and travel agency businesses increasing from 43% trading in early July 2020 to 98% in late August, before declining to 51% in November in response to national lockdown restrictions. By mid-January 2021, this proportion had declined further, with only 37% of accommodation business trading, likely the result of both seasonality and new government restrictions.

Page 8 of 16
1.
2.
3.
4.
5.
Figure 5: The proportion of businesses currently trading in travel and tourism industries peaked at 85% in October 2020
The percentage of businesses currently trading, broken down by industry, weighted by count, UK, 15 June 2020 to 24 January 2021
Source: Office for National Statistics - Business Impact of Coronavirus Survey
Notes:
Final weighted results, Wave 7 to Wave 22 of the Office for National Statistics’ (ONS’) Business Impact of Coronavirus (COVID-19) Survey (BICS).
For presentational purposes, currently trading categories have been combined.
Exhibition and conferences has been removed for disclosure purposes, but its total is included in "Total travel and tourism total".
“Total travel and tourism” is the sum of the lower level industries.
“Other industries” is all businesses not included in "Total travel and tourism".

Page 9 of 16
5 . Impact on the labour market in travel and tourism industries
The impact of the coronavirus (COVID-19) pandemic on employment in the travel and tourism industry can be investigated using data from the Labour Force Survey (LFS). LFS responses are weighted to official population estimates and projections that do not currently reflect the impact of the coronavirus pandemic. This analysis uses changes in levels of employment and should be interpreted with caution. For more information on how labour market data sources are affected by the coronavirus (COVID-19) pandemic, see the article published on 6 May
, which details some of the challenges that we have faced in producing estimates at this time. In addition, 2020industry breakdowns using the LFS should also be interpreted with caution, as they are based on respondents’ views about the business for which they work. This may not be the same as the industry in which businesses are classified in estimates of the national accounts.
The number of people reporting their main job as being in the travel and tourism industry during Quarter 3 (July to Sept) 2020 was 10.8% lower than in the same quarter of 2019. Over the same period, employment in other industries increased by 0.1%. (Figure 6).
Page 10 of 16
1.
2.
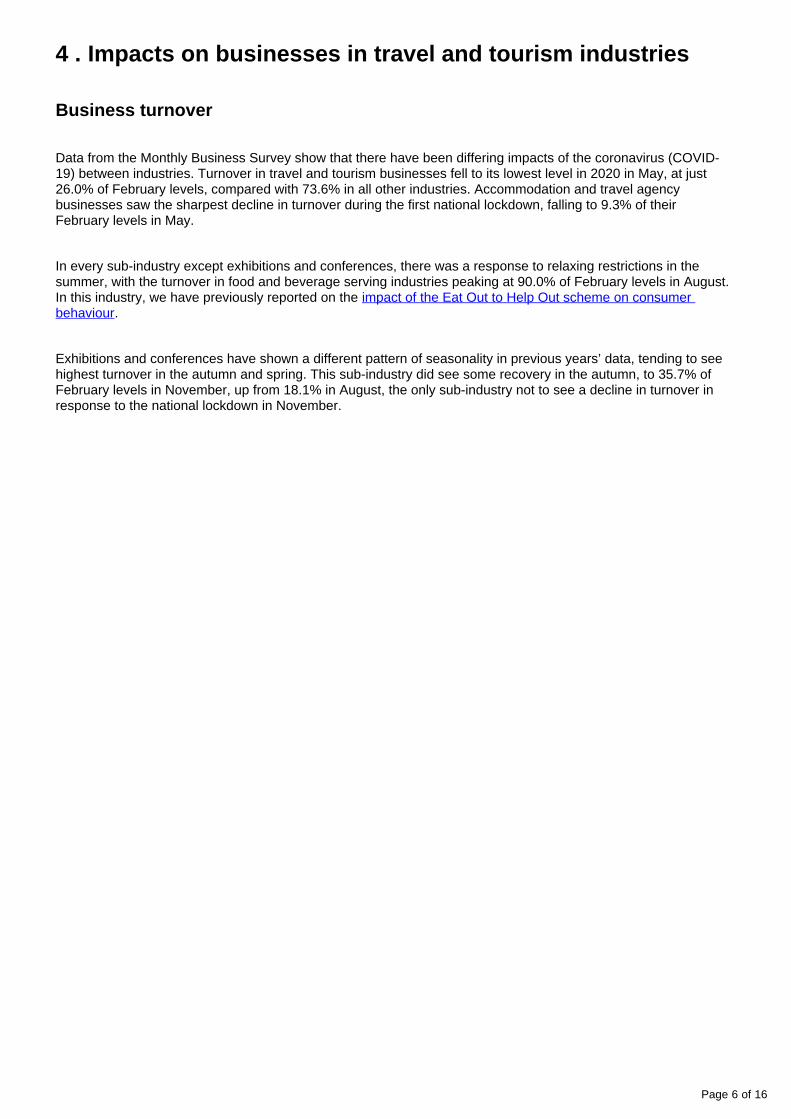
Figure 6: Quarter 2 (Apr to June) 2020, employment in accommodation for visitors fell by 21.5% compared with the same three months of 2019
Percentage change in number of people employed by industry of main job, quarter on same quarter of previous year, non-seasonally adjusted, UK
Source: Office for National Statistics - Labour Force Survey
Notes:
“Total travel and tourism” is the sum of the lower level industries.
“Other industries” is all employment not included in Total travel and tourism.
Of the industries within travel and tourism, accommodation for visitors saw the largest percentage fall in employment (negative 21.5%). Food and beverage serving activities saw smaller percentage falls, but this industry made up 40% of employment in travel and tourism in the three months to March 2020.
Breaking down changes in employment between 2019 and 2020, travel and tourism industries subtracted from overall employment growth in the first three quarters of 2020 (Figure 7).
Page 11 of 16
1.
2.
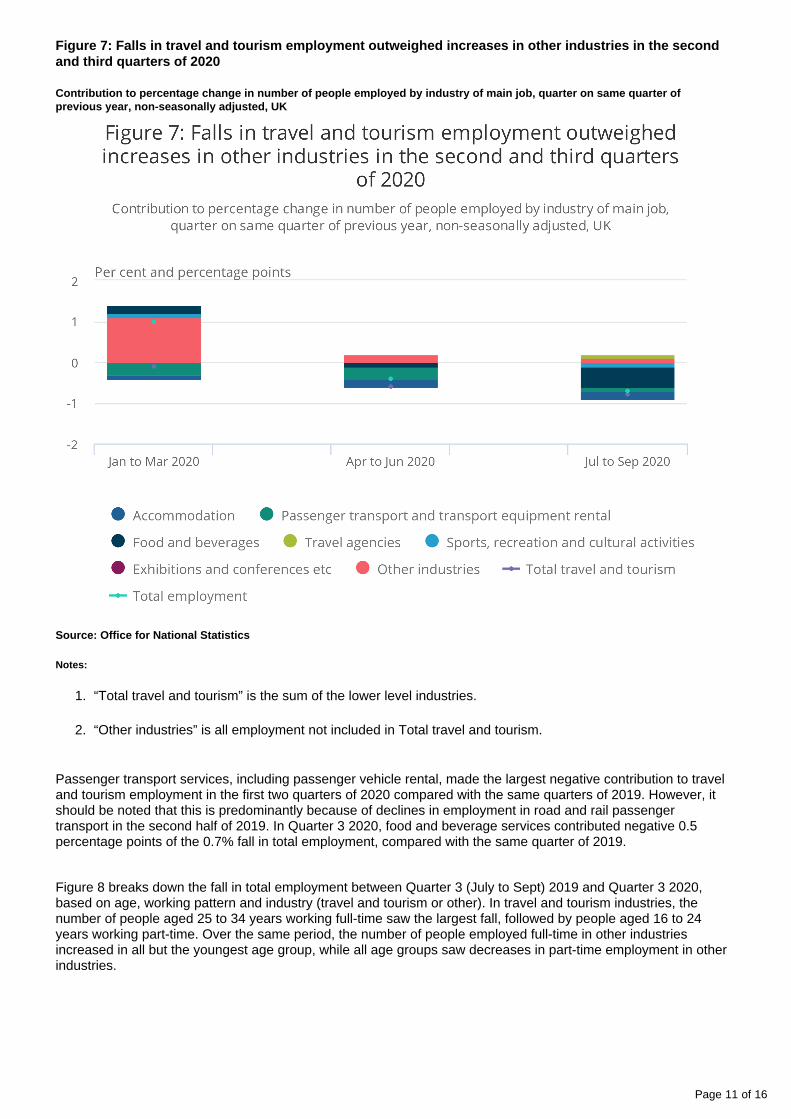
Figure 7: Falls in travel and tourism employment outweighed increases in other industries in the second and third quarters of 2020
Contribution to percentage change in number of people employed by industry of main job, quarter on same quarter of previous year, non-seasonally adjusted, UK
Source: Office for National Statistics
Notes:
“Total travel and tourism” is the sum of the lower level industries.
“Other industries” is all employment not included in Total travel and tourism.
Passenger transport services, including passenger vehicle rental, made the largest negative contribution to travel and tourism employment in the first two quarters of 2020 compared with the same quarters of 2019. However, it should be noted that this is predominantly because of declines in employment in road and rail passenger transport in the second half of 2019. In Quarter 3 2020, food and beverage services contributed negative 0.5 percentage points of the 0.7% fall in total employment, compared with the same quarter of 2019.
Figure 8 breaks down the fall in total employment between Quarter 3 (July to Sept) 2019 and Quarter 3 2020, based on age, working pattern and industry (travel and tourism or other). In travel and tourism industries, the number of people aged 25 to 34 years working full-time saw the largest fall, followed by people aged 16 to 24 years working part-time. Over the same period, the number of people employed full-time in other industries increased in all but the youngest age group, while all age groups saw decreases in part-time employment in other industries.

Page 12 of 16
1.
2.
Figure 8: The largest fall in employment was in people aged 25 to 34 years working full-time in travel and tourism industries
Contribution to percentage change in number of people employed by industry of main job, age and working pattern, between Quarter 3 (July to Sept) 2019 and Quarter 3 2020, non-seasonally adjusted, UK
Source: Office for National Statistics - Labour Force Survey
Notes:
“Total travel and tourism” is the sum of the lower level industries.
“Other industries” is all employment not included in Total travel and tourism.
As well as seeing larger declines in employment relative to other industries, travel and tourism industries have also tended to have higher rates of people on full or partial . Even as restrictions eased over the furlough leavesummer of 2020, the percentage of the workforce on furlough leave in most travel and tourism industries was higher than in other industries, before increasing again in November in response to further lockdown measures.

Page 13 of 16
1.
2.
3.
4.
5.
Figure 9: Most travel and tourism industries had a higher percentage of people on furlough leave, and were more responsive to changes in lockdown restrictions
Percentage of workforce on full or partial furlough leave, weighted by employment, UK, 1 June 2020 to 10 January 2021
Source: Office for National Statistics - Business Impact of Coronavirus Survey
Notes:
Final weighted results, Wave 7 to Wave 22 of the Office for National Statistics’ (ONS’) Business Impacts of Coronavirus Survey (BICS); businesses not permanently stopped trading
Businesses were asked for their experiences for the reference period. However, for questions regarding the last two weeks, businesses may respond from the point of completion of the questionnaire.
Exhibition and conferences has been removed for disclosure purposes, but its total is included in "Total travel and tourism"
“Total travel and tourism” is the sum of the lower level industries
“Other industries” is all employment not included in Total travel and tourism
6 . Employment in travel and tourism by local authority
While comparable sub-regional data on the impact of the coronavirus (COVID-19) on travel and tourism industries are not yet available, Business Register and Employment Survey (BRES) data can provide an indicator of where these impacts will be felt strongest, by showing the relative weight of the travel and tourism industry in different areas, in terms of employment in 2019. Data from the Inter-Departmental Business Register (IDBR) produced similar results.

Page 14 of 16
Figure 10: Employment in travel and tourism industries tends to be more concentrated in coastal areas
Percentage of employment in local authority in travel and tourism industries, 2019, Great Britain
Download the data
.xlsx
In 2019, the local authorities with the highest proportions of local employment in the travel and tourism industries could generally be found in coastal regions, particularly in the west of Great Britain. Those with the lowest proportions tended to be located across the Pennines in the north of England, and in the East Midlands. The Isles of Scilly had the highest proportion of any local authority, with 46% of the workforce employed in the travel and tourism industry.
7 . List of industries used in this analysis
Table 1: List of industries used in this analysis

Page 15 of 16
Tourism industriesSIC 2007
Description
Accommodation for visitors 55100 Short term accommodation activities
55201 Holiday centres and villages
55202 Youth hostels
55209 Other holiday and other short stay accommodation (not including holiday centres and villages or youth hostels) n.e.c.
55300 Camping grounds, recreational vehicle parks
55900 Other accommodation
Exhibitions and conferences etc
68202 Letting and operating of conference and exhibition centres
82301 Activities of exhibition and fair organisers
82302 Activities of conference organisers
Food and beverage serving activities
56101 Licensed restaurants
56102 Unlicensed restaurants and cafes
56103 Take away food shops and mobile food stands
56210 Event catering activities
56290 Other food service activities
56300 Beverage serving activities
Passenger transport 49100 Passenger rail transport, interurban
49311 Urban, suburban or metropolitan area passenger railway transportation by underground, metro and similar systems
49319 Urban, suburban or metropolitan area passenger land transport other than railway transportation by underground, metro and similar systems
49320 Taxi operation
49390 Other passenger land transport
50100 Sea and coastal passenger water transport
50300 Inland passenger water transport
51101 Scheduled passenger air transport
51102 Non-scheduled passenger air transport
Transport equipment rental 77110 Renting and leasing of cars and light motor vehicles
77341 Renting and leasing of passenger water transport equipment
77351 Renting and leasing of passenger air transport equipment
Travel agencies and other reservation service activities
79110 Travel agency activities
79120 Tour operator activities
79901 Activities of tourist guides
79909 Other reservation service and related activities (not including activities of tourist guides)
Cultural activities 90010 Performing arts
90020 Support activities to performing arts
90030 Artistic creation

Page 16 of 16
1.
90040 Operation of arts facilities
91020 Museums activities
91030 Operation of historical sites and buildings
91040 Botanical and zoological gardens and activities
Sports and Recreational activities
77210 Renting and leasing of recreational and sports goods
92000 Gambling and betting activities
93110 Operation of sports facilities
93199 Other sports activities
93210 Activities of amusement parks and theme parks
93290 Other amusement and recreation activities n.e.c.
Source: Office for National Statistics
Notes
n.e.c is not elsewhere classified.