Embed Size (px)
Citation preview
Coronal Responses to Explosive Events
Adria C. Updike
Smith College / Harvard-Smithsonian Center for Astrophysics
Amy Winebarger and Kathy Reeves, Center for Astrophysics
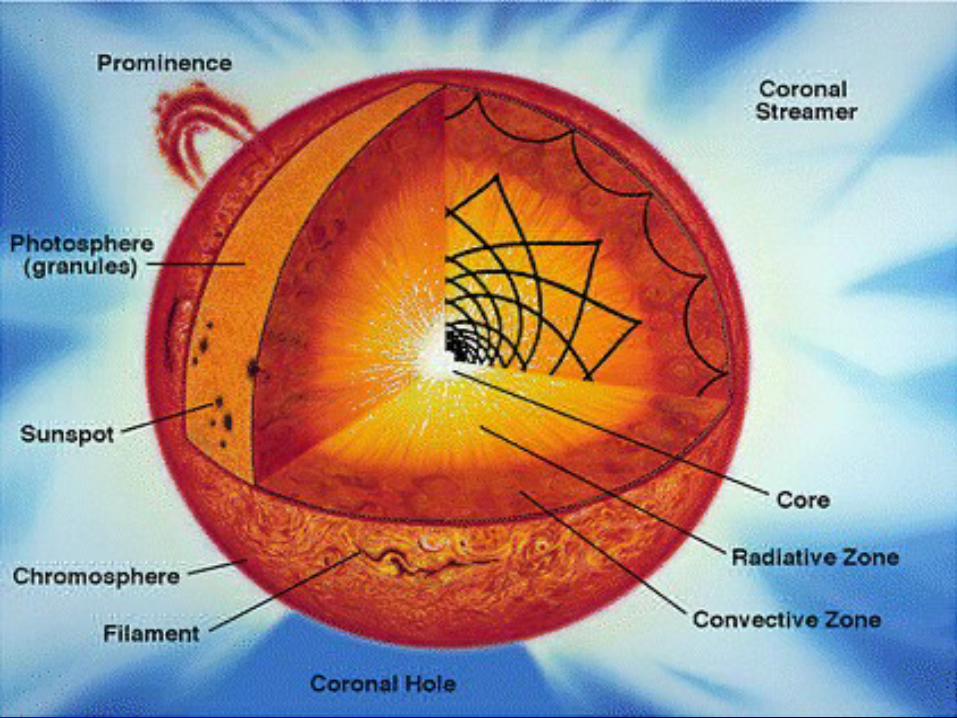
MDI photosphere
T = 5800 K
EIT 304 Å
T = 60000 – 80000 K
EIT 195Å
T = 1.5 million K
EIT 171Å
T = 1 million K
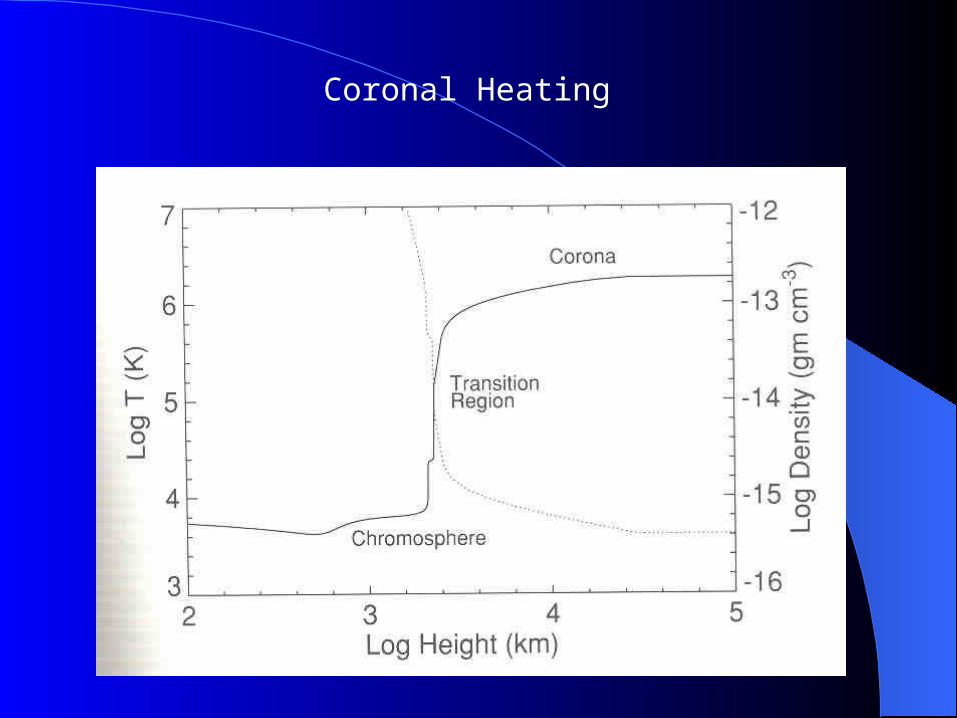
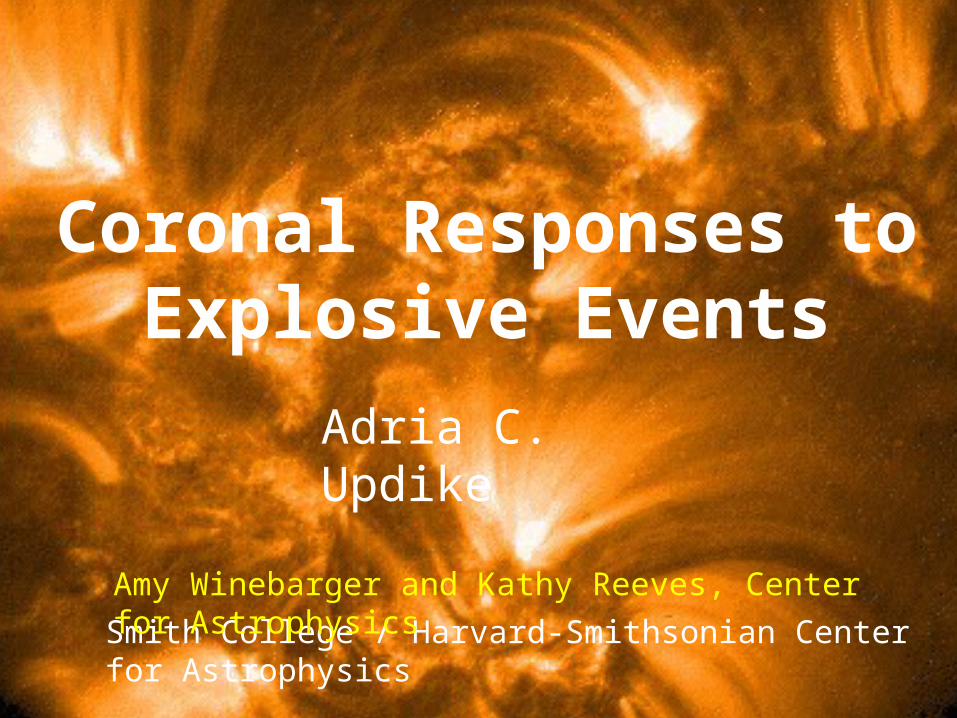
Coronal Heating
insert graphic from mariska book
Coronal Heating
Solar Surface = 5800 K
Chromosphere = 25000 K
Transition Region
Corona = 106 K
Ruled out:
Radiation
Convection
Coronal Heating
Insert magnetic reconnection graphic
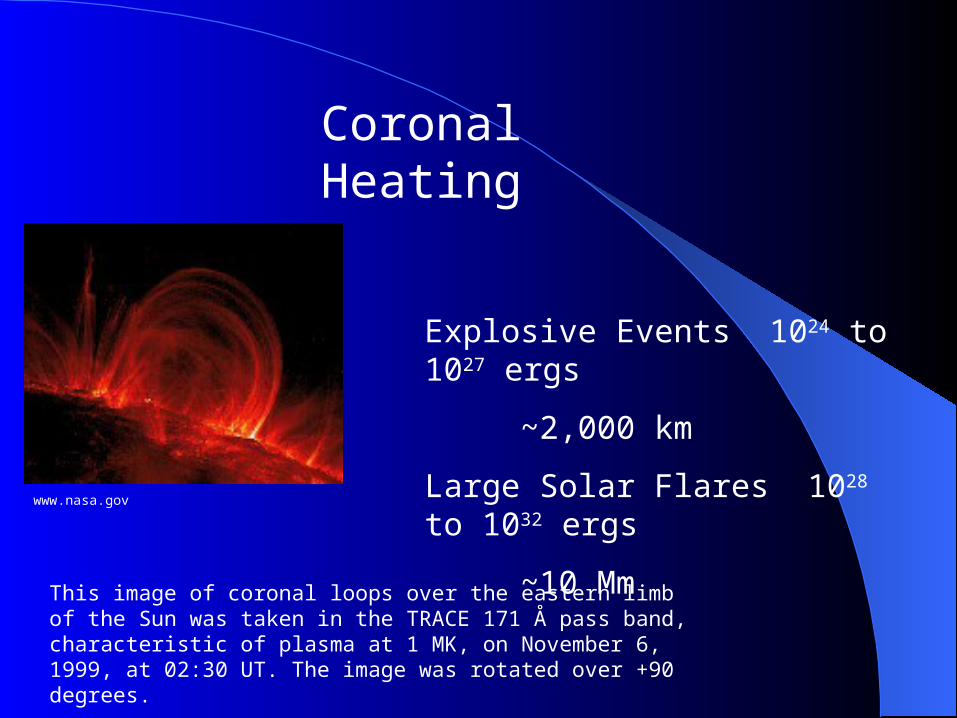
Explosive Events 1024 to 1027 ergs
~2,000 km
Large Solar Flares 1028 to 1032 ergs
~10 Mm
This image of coronal loops over the eastern limb of the Sun was taken in the TRACE 171 Å pass band, characteristic of plasma at 1 MK, on November 6, 1999, at 02:30 UT. The image was rotated over +90 degrees.
www.nasa.gov
Explosive Events
1024 to 1027 ergs
~2,000 km
occur in Transition Region at 100,000 K
heated to coronal temperatures?
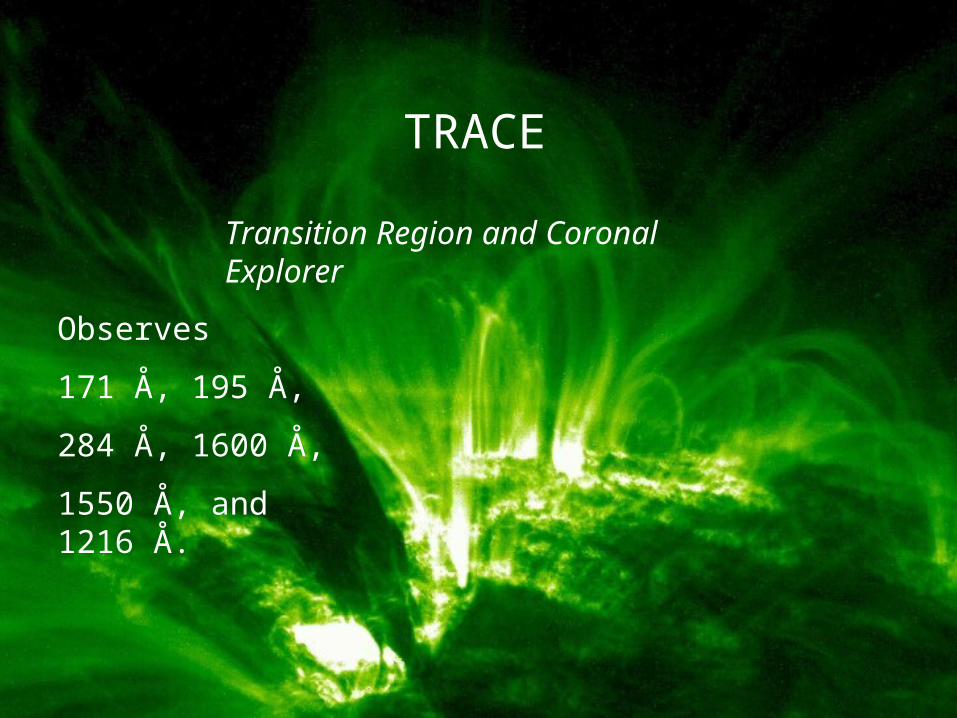
TRACE
Transition Region and Coronal Explorer
Observes
171 Å, 195 Å,
284 Å, 1600 Å,
1550 Å, and 1216 Å.
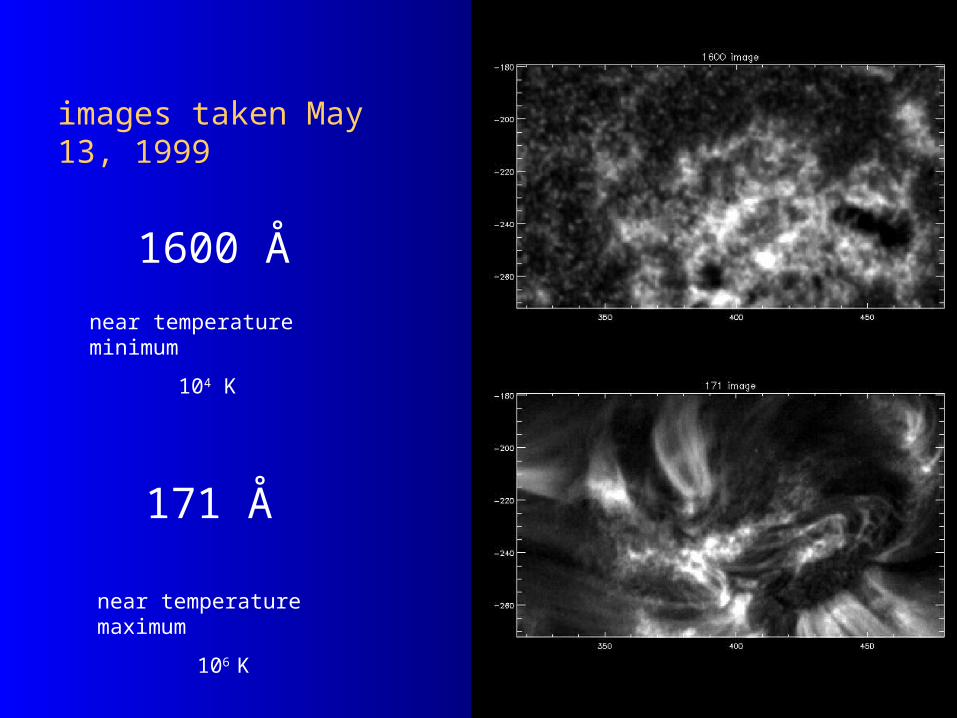
images taken May 13, 1999
1600 Å
171 Å
near temperature minimum
104 K
near temperature maximum
106 K
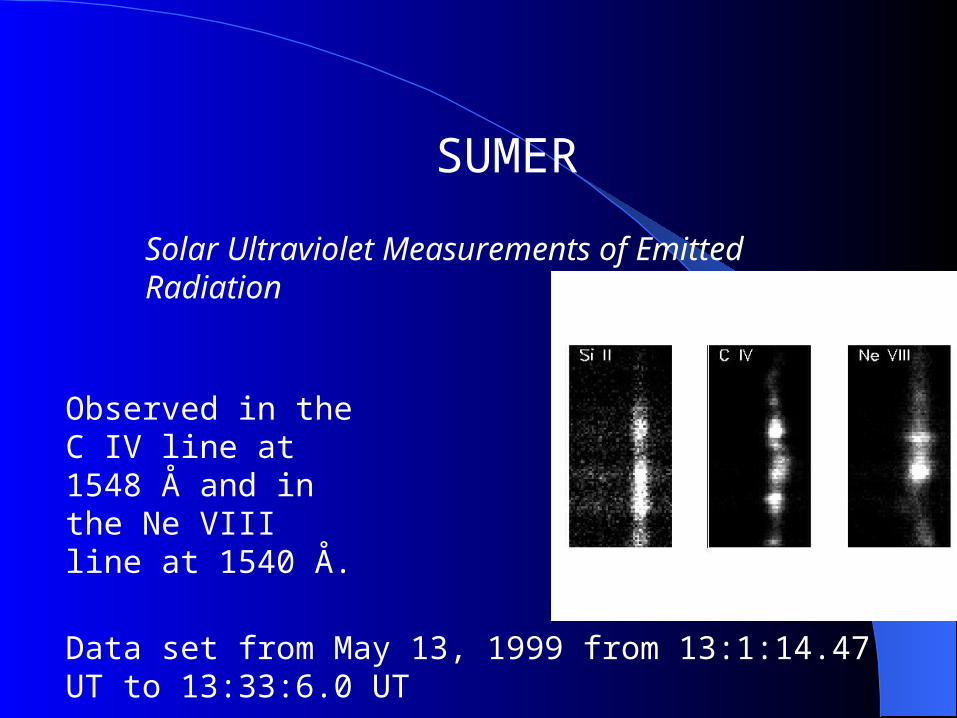
SUMER
Solar Ultraviolet Measurements of Emitted Radiation
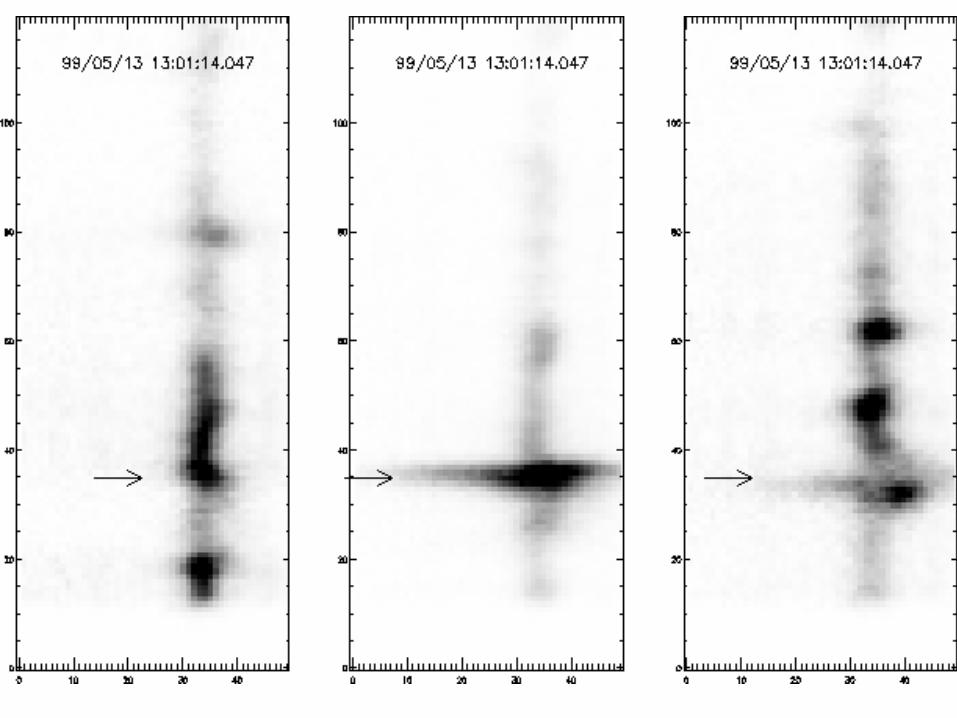
Insert SUMER spectra from movie
Observed in the C IV line at 1548 Å and in the Ne VIII line at 1540 Å.
Data set from May 13, 1999 from 13:1:14.47 UT to 13:33:6.0 UT
Insert SUMER spectra
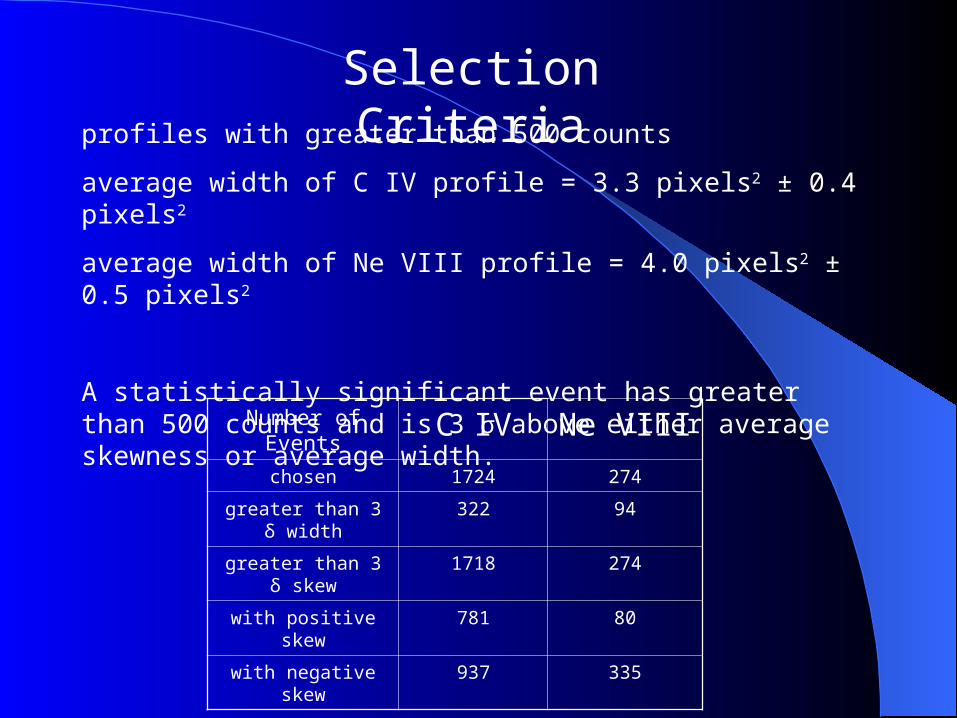
Selection Criteriaprofiles with greater than 500 counts
average width of C IV profile = 3.3 pixels2 ± 0.4 pixels2
average width of Ne VIII profile = 4.0 pixels2 ± 0.5 pixels2
A statistically significant event has greater than 500 counts and is 3 σ above either average skewness or average width.
Number of Events C IV Ne VIIIchosen 1724 274
greater than 3 δ width 322 94
greater than 3 δ skew 1718 274
with positive skew 781 80
with negative skew 937 335
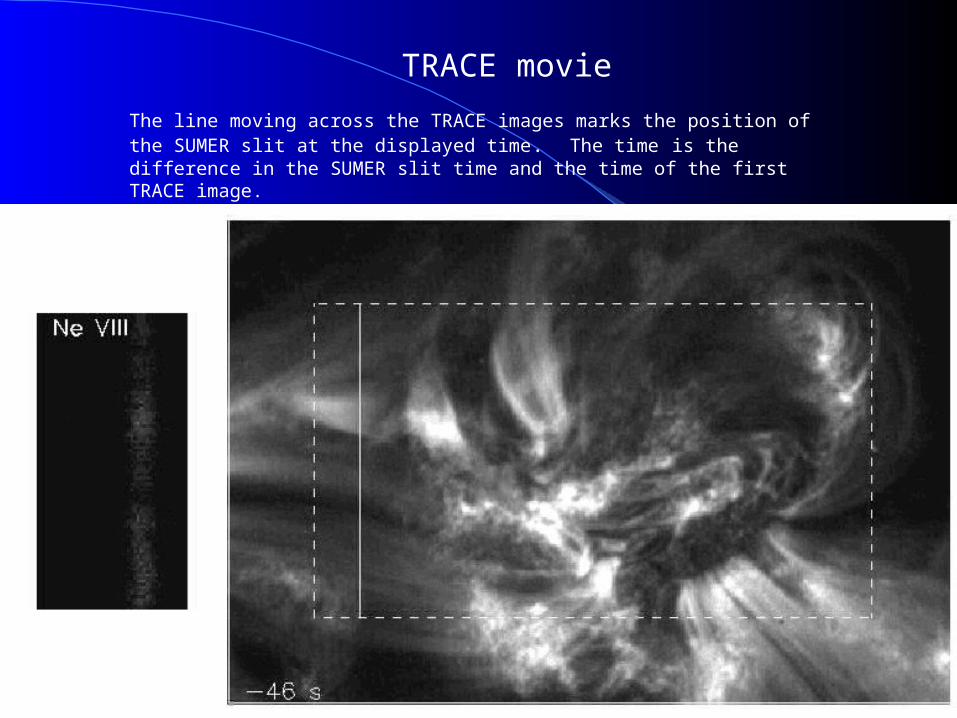
TRACE movie
The line moving across the TRACE images marks the position of the SUMER slit at the displayed time. The time is the difference in the SUMER slit time and the time of the first TRACE image.
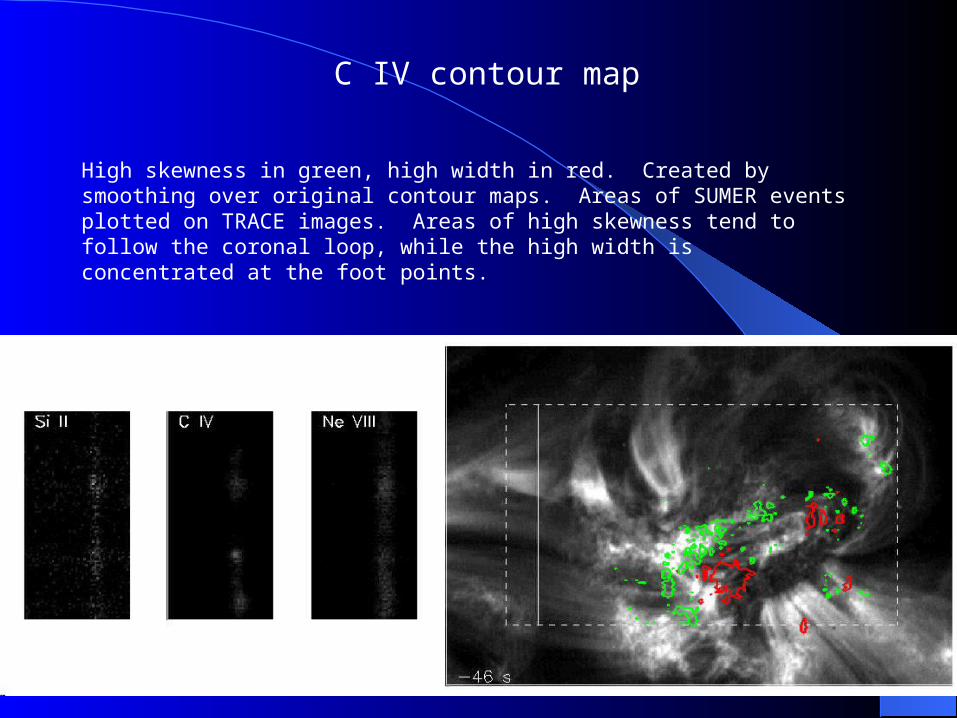
C IV contour map
High skewness in green, high width in red. Created by smoothing over original contour maps. Areas of SUMER events plotted on TRACE images. Areas of high skewness tend to follow the coronal loop, while the high width is concentrated at the foot points.
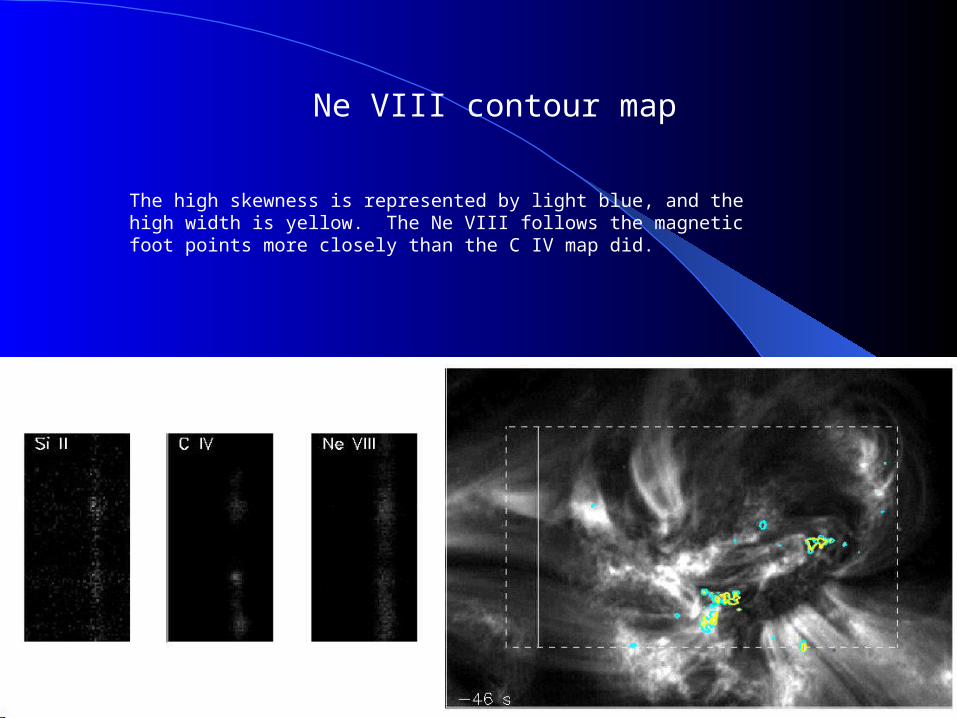
Ne VIII contour map
The high skewness is represented by light blue, and the high width is yellow. The Ne VIII follows the magnetic foot points more closely than the C IV map did.
Light Curves
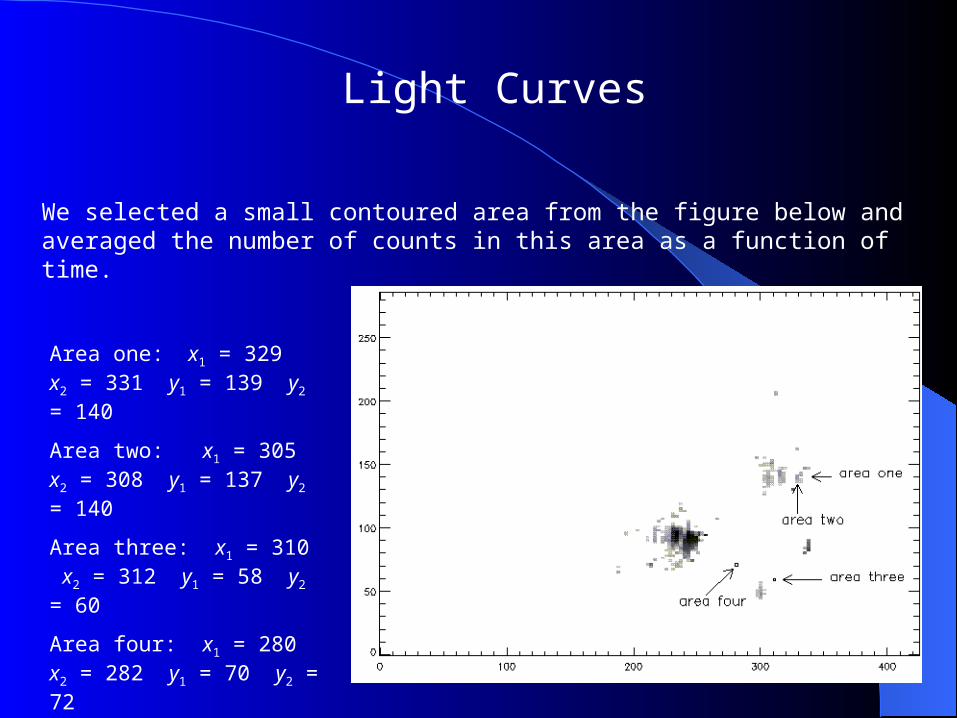
We selected a small contoured area from the figure below and averaged the number of counts in this area as a function of time.
Area one: x1 = 329 x2 = 331 y1 = 139 y2 = 140
Area two: x1 = 305 x2 = 308 y1 = 137 y2 = 140
Area three: x1 = 310 x2 = 312 y1 = 58 y2 = 60
Area four: x1 = 280 x2 = 282 y1 = 70 y2 = 72
Light Curves
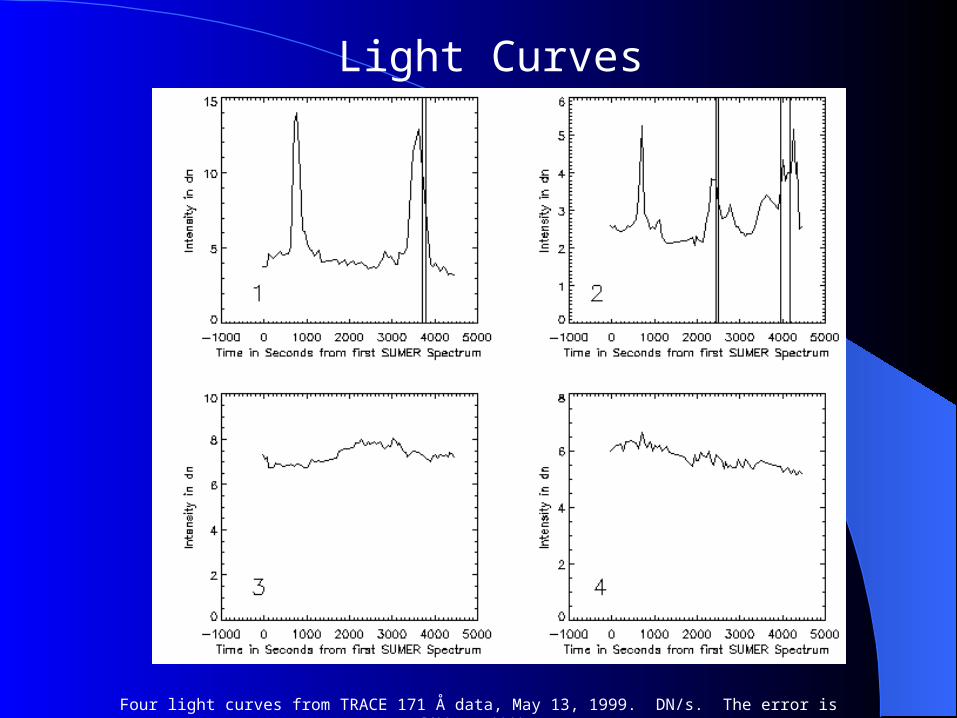
Four light curves from TRACE 171 Å data, May 13, 1999. DN/s. The error is DN/sqrt(11).
Light Curves
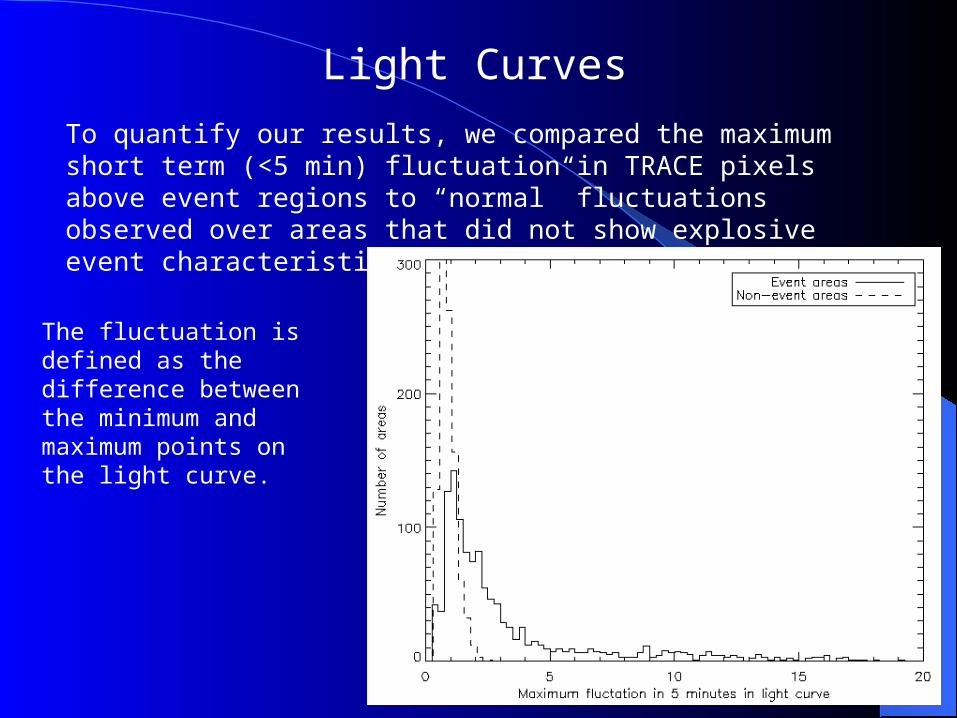
To quantify our results, we compared the maximum short term (<5 min) fluctuation in TRACE pixels above event regions to “normal” fluctuations observed over areas that did not show explosive event characteristics during the SUMER scan.
The fluctuation is defined as the difference between the minimum and maximum points on the light curve.
Global Birthrate
slit
sun o
A
A NR
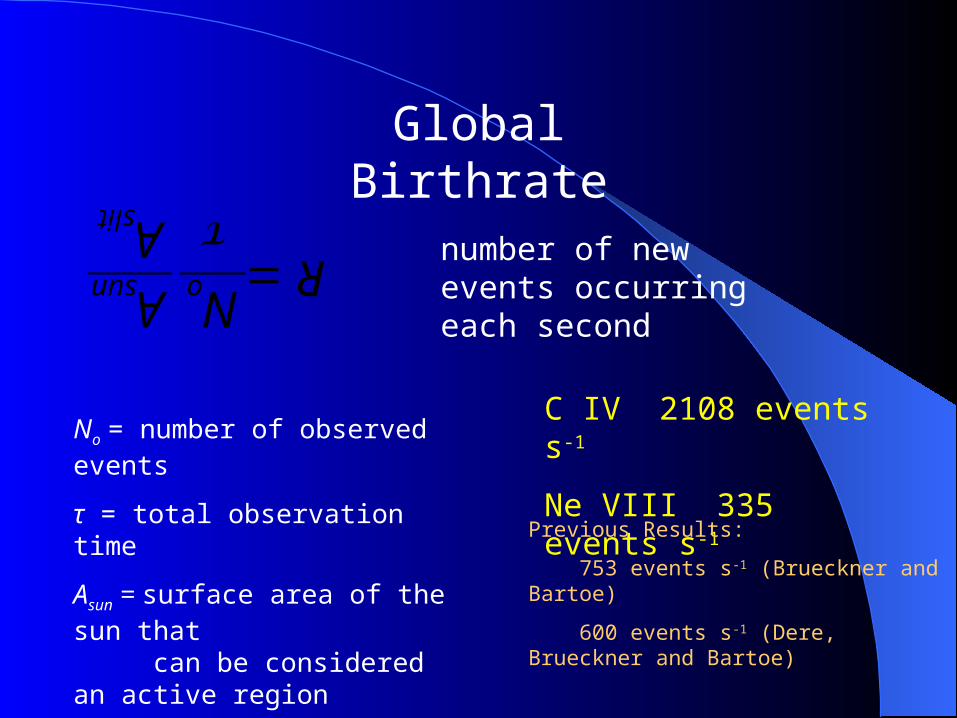
number of new events
occurring each second
No = number of observed events
τ = total observation time
Asun = surface area of the sun that can be considered an active region
Aslit = deprojected area of SUMER slit on sun
C IV 2108 events s-1
Ne VIII 335 events s-1
Previous Results:
753 events s-1 (Brueckner and Bartoe)
600 events s-1 (Dere, Brueckner and Bartoe)
ConclusionsWe found that the typical fluctuation for both events and non-events is ~ 1.5 DN/s. However, while the non-events became nearly non-existant after a fluctuation of 2.5 DN/s, the events continued out to more than 20 DN/s.
This indicates a great amount of activity taking place in the regions identified as events. By constraining our time scale to 5 minutes, we determined that 35% of our events had greater than 3 σ above non-events.
We witnessed a coronal response in TRACE to an explosive event in SUMER 35% of the time.
Explosive events can contribute 10% of the energy required to heat the solar corona.
It is not clear whether the explosive events are directly related to the coronal response, or if they are both separate responses to reconnection.


![John Updike (1932-2009) “A & P” John Updike (1932-2009) “A & P” ENGL 2030: Experience of Literature— Fiction [Lavery]](https://img.pdfslide.us/doc/110x75/56649c745503460f94926e34/john-updike-1932-2009-a-p-john-updike-1932-2009-a-p-engl.jpg)