Embed Size (px)
Citation preview

Coronal Mass Ejection Rates over 4 Solar Cycles
David Webb- Data Assistance by Tom Kuchar -
ISR, Boston College
ISR Talk
BC
9 November 2017

OUTLINE
2
A) Coronal Mass Ejections (CMEs): What are they and why are they important?
B1) Observations of CMEs now extend over last 4 solar cycles.- LASCO observed entire SC 23 and continues to observe through SC 24- Addition of g-b Mauna Loa Mk CME counts to fill “coronagraph gap” in CME rates
from 1989-1996- Can determine rates from both LASCO and STEREO coronagraphs & from the Solar
Mass Ejection Imager (SMEI; 2003-2011) and the SECCHI HIs (since 2006) in heliosp.- Visual counts made by observers (“manual”)- Rates from IDs by “automatic” programs SEEDS, CACTus, CORIMP, ARTEMIS - However, there is a large spread in these CME rates
B2) Occurrence rate of CMEs observed in white light.- In the past, CME rates tracked solar activity, i.e., the SunSpot No. (SSN), in both
phase & amplitude- But SC 23 had an unusually long decline and flat minimum,- And the CME and SSN rates diverged in SC 24 - I will discuss these rate estimates
C) Determination of a basal rate of CMEs at SC minima.
D) How do double-cycle peaks and hemispherical offsets affect the CME rates?
DWebb ISR Nov2017 3
A) CMEs: What are They &Why Are They Important?
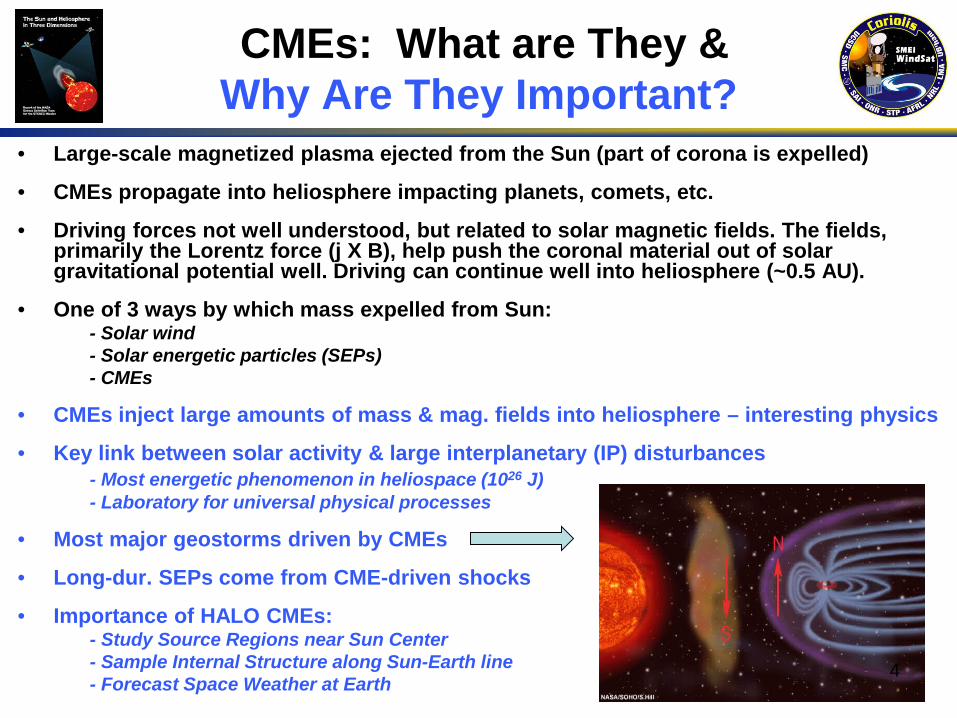
CMEs: What are They &Why Are They Important?
• Large-scale magnetized plasma ejected from the Sun (part of corona is expelled)
• CMEs propagate into heliosphere impacting planets, comets, etc.
• Driving forces not well understood, but related to solar magnetic fields. The fields, primarily the Lorentz force (j X B), help push the coronal material out of solar gravitational potential well. Driving can continue well into heliosphere (~0.5 AU).
• One of 3 ways by which mass expelled from Sun: - Solar wind- Solar energetic particles (SEPs)- CMEs
• CMEs inject large amounts of mass & mag. fields into heliosphere – interesting physics
• Key link between solar activity & large interplanetary (IP) disturbances- Most energetic phenomenon in heliospace (1026 J)- Laboratory for universal physical processes
• Most major geostorms driven by CMEs
• Long-dur. SEPs come from CME-driven shocks
• Importance of HALO CMEs: - Study Source Regions near Sun Center- Sample Internal Structure along Sun-Earth line- Forecast Space Weather at Earth
4

Robbrecht et al., ApJ (2009)
B) Annual CME & SSN Rates Well Correlated (r~0.9) in SCs 21-23
SC 23SC 20.5-22.5

6
• In the past occurrence rate of CMEs observed in white light tracked SC in both phase & amplitude.- CME and SSN rates diverged late in SC 23 & in SC 24 similar CME rates but
lower SSN rates- First noted by Luhmann et al. (2011) & Petrie (ApJ, 2013) suggested divergence
related to weak solar polar mag fields during the extended SC 23/24 min. & SC 24
• Selection Effects in CME Catalogs- Typically, CMEs identified & classified in coronagraph data by visual inspection
resulting in “manual” CME catalogs inherently subjective & depend on instru. characteristics
- Recently augmented by “automatic” catalogs of CMEs. Auto methods more objective, but results inconsistent with each other & with manual catalogs
- Wang & Colaninno (ApJL, 2014) eliminating so-called “very poor events” from (CDAW) LASCO catalog results in lower CME rates, esp. since 2005 & better CC.
- Others suggest eliminating “narrow” CMEs has same effect - Wang & Colaninno also pointed out that an increase in the LASCO data cadence
since 2010 caused an increase in the auto catalogs CME rate!
• In this study we exclude all CMEs with widths < 20° when using CME catalogs. - Also our CME rate data corrected for periods of missing data & smoothed
CME CME-SSN Correlations & Selection Effects

7DWebb ISR Nov2017
LASCO CME-MF Rates, SC 23-24
• Smoothed plots of LASCO CME and total solar mag. flux from Wilcox Solar Obs. for SCs 23 & 24. The SSN & total fluxes are similar SSN is a good proxy for total mag. flux.
• Note manual (CDAW) and auto (SEEDS and CACTus) CME rates vary during maxima- Note there is significant total flux at cycle minima.
23 24

DWebb ISR Nov2017 8
Annual CME-SSN SC 24:Much Steeper Slope!
• Comparison plot of LASCO CME vs SSN rates compared to previous rates from Webb & Howard (JGR, 1994) & Robbrecht et al. (ApJ, 2009).
• Indeed the slope is much steeper more CMEs per unit SSN this cycle.
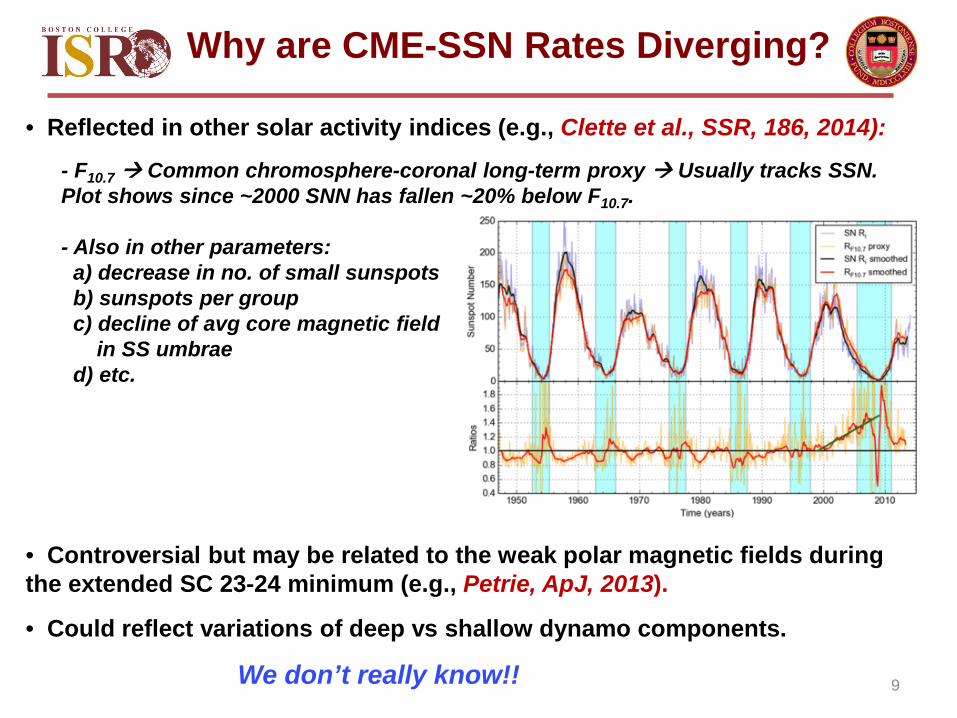
• Reflected in other solar activity indices (e.g., Clette et al., SSR, 186, 2014):
- F10.7 Common chromosphere-coronal long-term proxy Usually tracks SSN. Plot shows since ~2000 SNN has fallen ~20% below F10.7.
- Also in other parameters: a) decrease in no. of small sunspots b) sunspots per group c) decline of avg core magnetic field
in SS umbrae d) etc.
• Controversial but may be related to the weak polar magnetic fields during the extended SC 23-24 minimum (e.g., Petrie, ApJ, 2013).
• Could reflect variations of deep vs shallow dynamo components.
We don’t really know!! 9
Why are CME-SSN Rates Diverging?
CME-MF Rates: SC 23-24 Min. SC 24
10DWebb ISR Nov2017
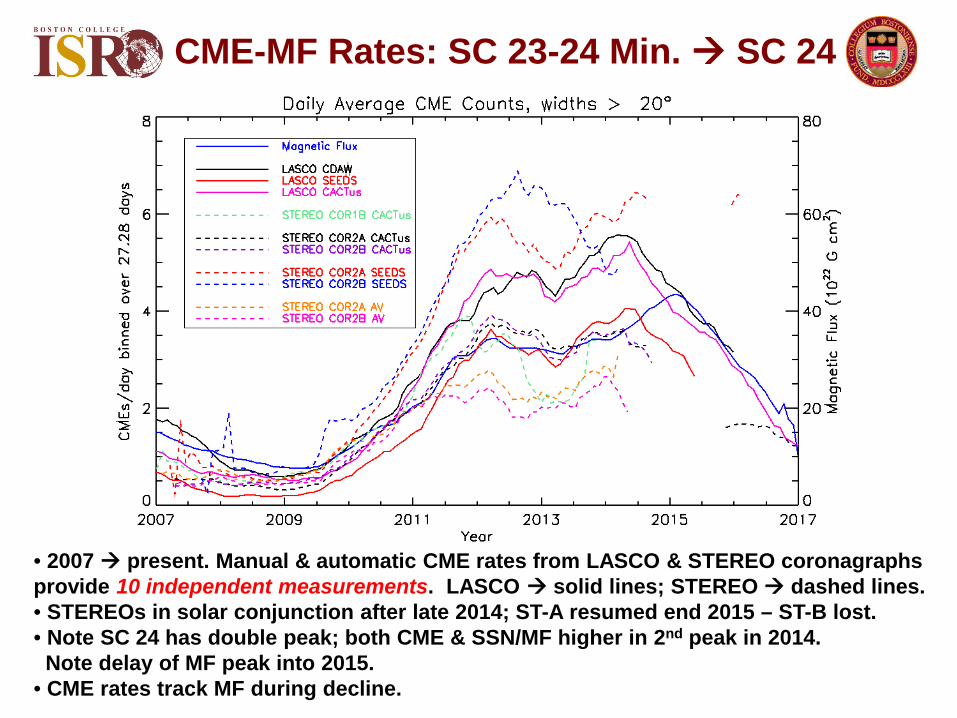
• 2007 present. Manual & automatic CME rates from LASCO & STEREO coronagraphs provide 10 independent measurements. LASCO solid lines; STEREO dashed lines. • STEREOs in solar conjunction after late 2014; ST-A resumed end 2015 – ST-B lost. • Note SC 24 has double peak; both CME & SSN/MF higher in 2nd peak in 2014.
Note delay of MF peak into 2015. • CME rates track MF during decline.
DWebb ISR Nov2017 11
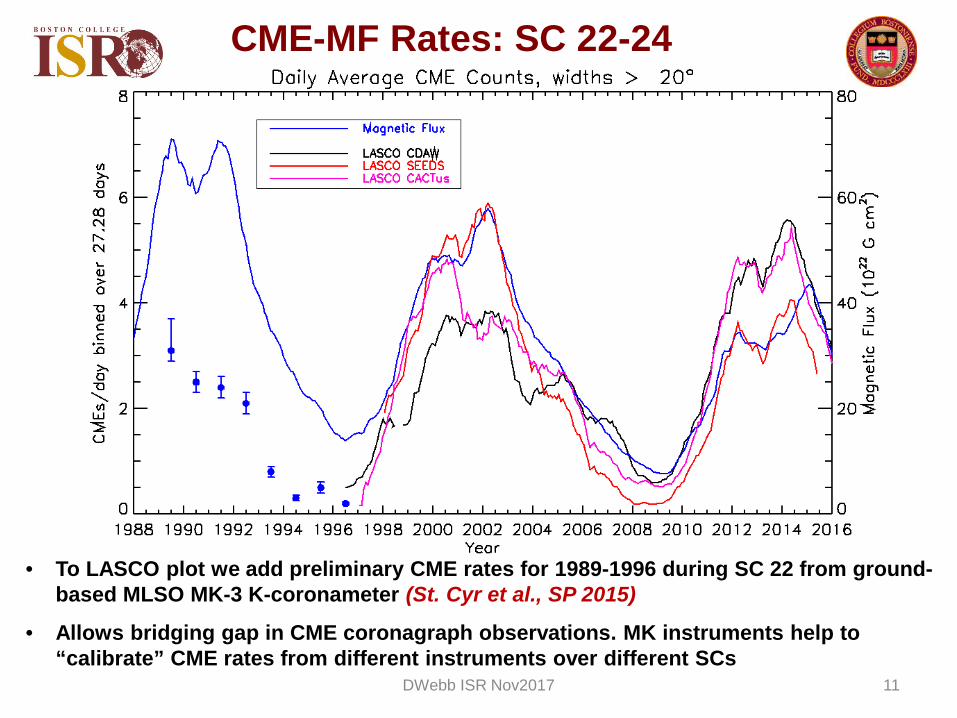
• To LASCO plot we add preliminary CME rates for 1989-1996 during SC 22 from ground-based MLSO MK-3 K-coronameter (St. Cyr et al., SP 2015)
• Allows bridging gap in CME coronagraph observations. MK instruments help to “calibrate” CME rates from different instruments over different SCs
CME-MF Rates: SC 22-24

12DWebb ISR Nov2017
SC Max-Min CME-SSN/MF Rates
CME Rate SSN Total Mag.SC No. Year (CMEs/day) Rate6 Flux (1022 Mx)Minimum (Webb et al., 2017)20/21 1976 0.3 18 1721/22 1986 0.3 16 2022/23 1996 0.7; 0.81 11 1423/24 2009 0.5; 0.72 2 8
Maximum (work in progress)21 1979-80 2.5 231 6622 1989-90 (3.7)3 206 6623 2001-02 4.44 182 5824 2014 3.85 117 36 [44]
----------------------------------------------------------------------------------------------------1 = LASCO C2 - St. Cyr et al. (2000); S. Yashiro (2014, p.c.)2 = Avg COR-2A & 2B; LASCO C2 (S. Yashiro, 2014, p.c.)3 = SMM max value under review4 = Avg of 3 LASCO meas.5 = Avg of 8 meas. excluding COR2 SEEDS6 = Avg monthly SSN (V2; SILSO, ROB, Belgium)
DWebb ISR Nov2017 13
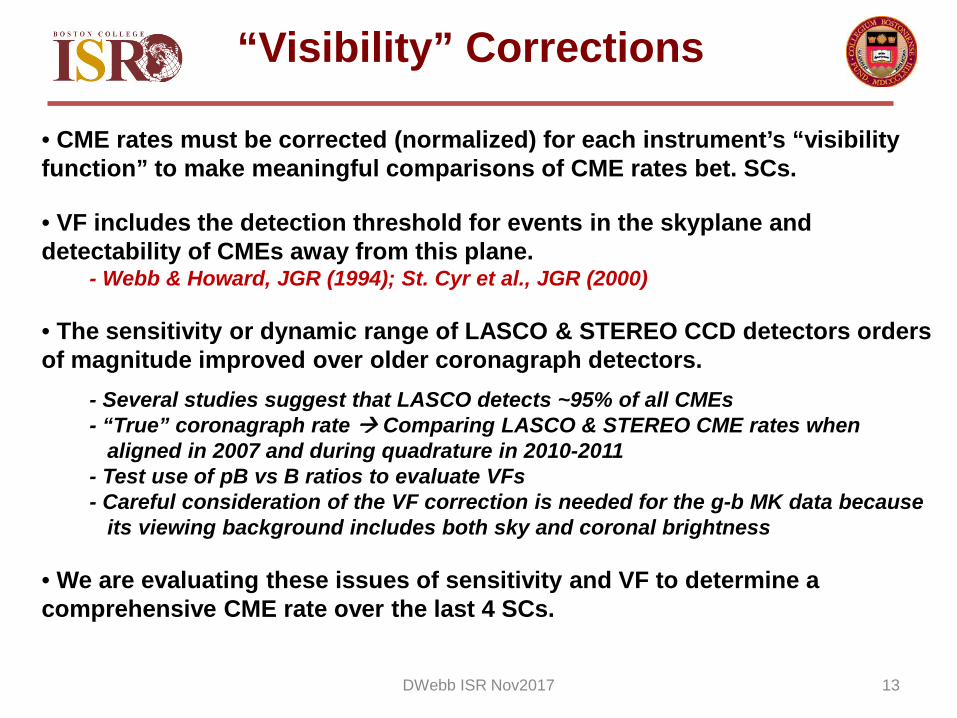
• CME rates must be corrected (normalized) for each instrument’s “visibility function” to make meaningful comparisons of CME rates bet. SCs.
• VF includes the detection threshold for events in the skyplane and detectability of CMEs away from this plane.
- Webb & Howard, JGR (1994); St. Cyr et al., JGR (2000)
• The sensitivity or dynamic range of LASCO & STEREO CCD detectors orders of magnitude improved over older coronagraph detectors.
- Several studies suggest that LASCO detects ~95% of all CMEs - “True” coronagraph rate Comparing LASCO & STEREO CME rates when
aligned in 2007 and during quadrature in 2010-2011 - Test use of pB vs B ratios to evaluate VFs - Careful consideration of the VF correction is needed for the g-b MK data because
its viewing background includes both sky and coronal brightness
• We are evaluating these issues of sensitivity and VF to determine a comprehensive CME rate over the last 4 SCs.
“Visibility” Corrections
DWebb ISR Nov2017 14
C) Is There a Basal Rate of CMEs at Solar Cycle Minima?
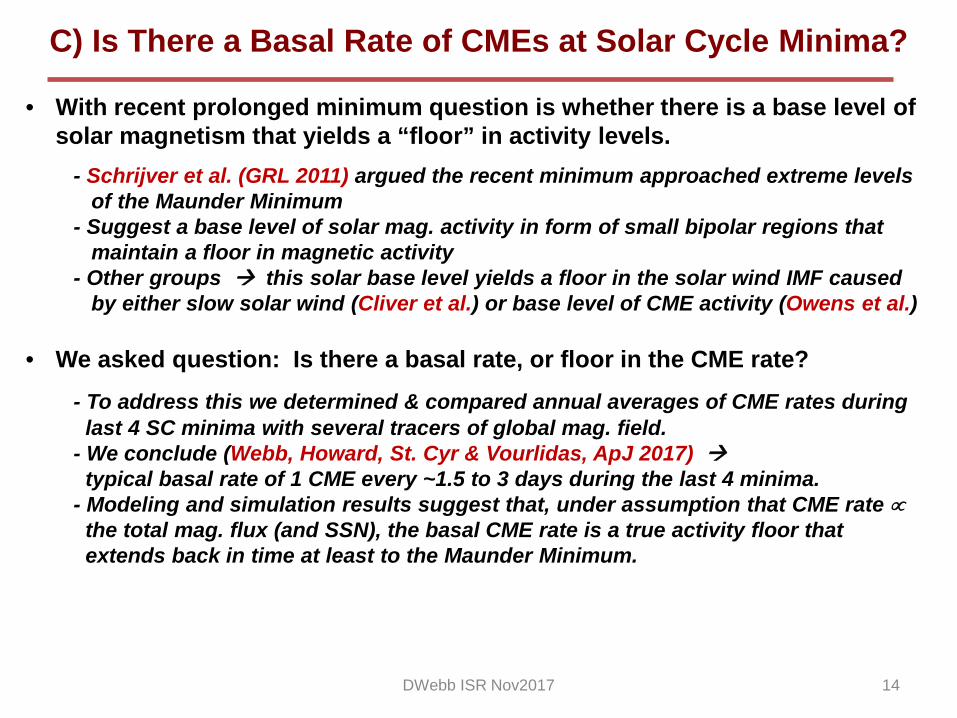
• With recent prolonged minimum question is whether there is a base level of solar magnetism that yields a “floor” in activity levels.
- Schrijver et al. (GRL 2011) argued the recent minimum approached extreme levels of the Maunder Minimum
- Suggest a base level of solar mag. activity in form of small bipolar regions that maintain a floor in magnetic activity
- Other groups this solar base level yields a floor in the solar wind IMF caused by either slow solar wind (Cliver et al.) or base level of CME activity (Owens et al.)
• We asked question: Is there a basal rate, or floor in the CME rate?- To address this we determined & compared annual averages of CME rates during
last 4 SC minima with several tracers of global mag. field. - We conclude (Webb, Howard, St. Cyr & Vourlidas, ApJ 2017)
typical basal rate of 1 CME every ~1.5 to 3 days during the last 4 minima. - Modeling and simulation results suggest that, under assumption that CME rate ∝
the total mag. flux (and SSN), the basal CME rate is a true activity floor that extends back in time at least to the Maunder Minimum.

DWebb ISR Nov2017 15
CME Rate SC No. Year (CMEs/day)
20/21 1976 0.3 21/22 1986 0.3 22/23 1996 0.7; 0.823/24 2009 0.5; 0.7
• From our previous table basal rate of 1 CME every ~1.5 to 3 days during the last 4 minima.
- The VF-corrected CME rates in 1976 and 1986 are similar to each other & therates in 1996 and 2009 are also similar to each other
- But the recent rates are ~ twice those in 1976 and 1986. Those rates (Webb and Howard, 1994) required large correction factors
- The more recent higher rates also likely reflect the superior performances ofLASCO and STEREO coronagraphs which require only small corrections
1) Data Rates at SC Minima
DWebb ISR Nov2017 16
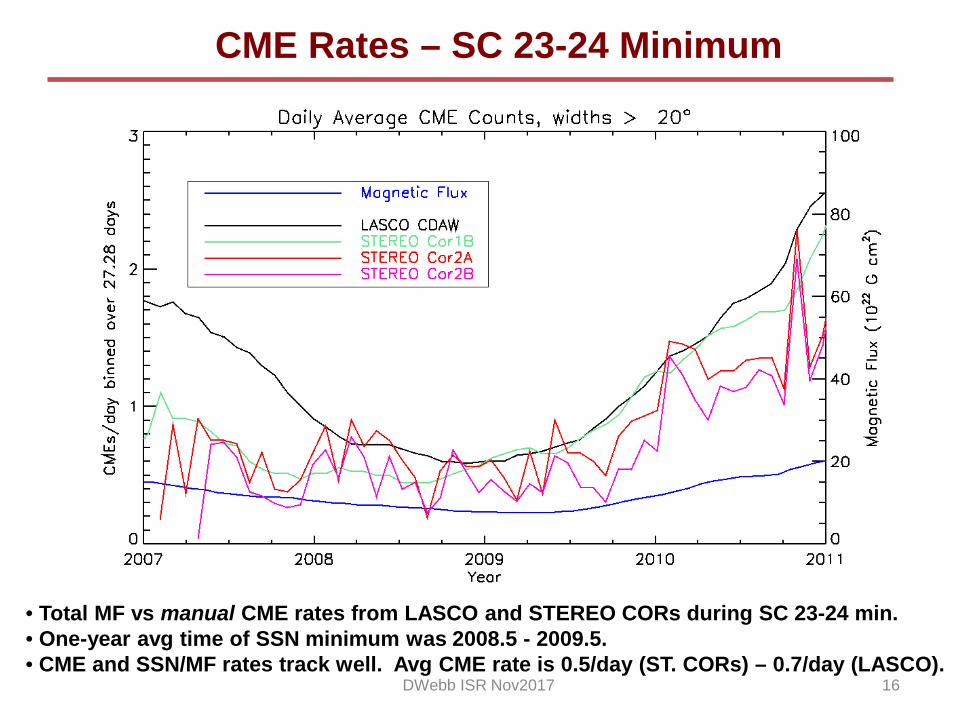
CME Rates – SC 23-24 Minimum
• Total MF vs manual CME rates from LASCO and STEREO CORs during SC 23-24 min.• One-year avg time of SSN minimum was 2008.5 - 2009.5. • CME and SSN/MF rates track well. Avg CME rate is 0.5/day (ST. CORs) – 0.7/day (LASCO).
DWebb ISR Nov2017 17
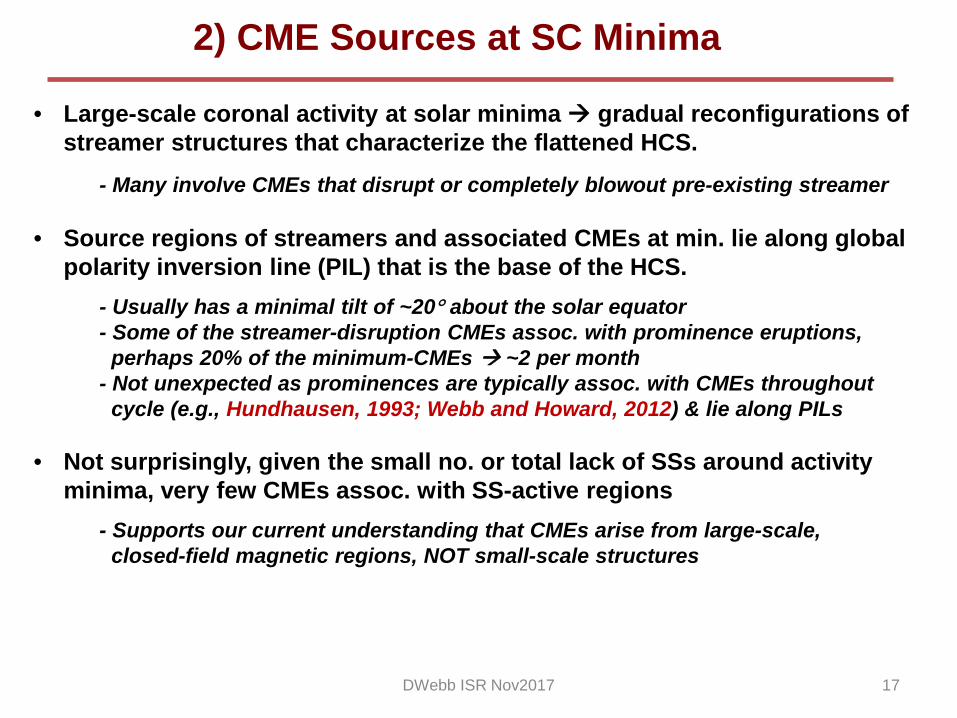
• Large-scale coronal activity at solar minima gradual reconfigurations of streamer structures that characterize the flattened HCS.
- Many involve CMEs that disrupt or completely blowout pre-existing streamer
• Source regions of streamers and associated CMEs at min. lie along global polarity inversion line (PIL) that is the base of the HCS.
- Usually has a minimal tilt of ~20° about the solar equator - Some of the streamer-disruption CMEs assoc. with prominence eruptions,
perhaps 20% of the minimum-CMEs ~2 per month - Not unexpected as prominences are typically assoc. with CMEs throughout
cycle (e.g., Hundhausen, 1993; Webb and Howard, 2012) & lie along PILs
• Not surprisingly, given the small no. or total lack of SSs around activity minima, very few CMEs assoc. with SS-active regions
- Supports our current understanding that CMEs arise from large-scale, closed-field magnetic regions, NOT small-scale structures
2) CME Sources at SC Minima
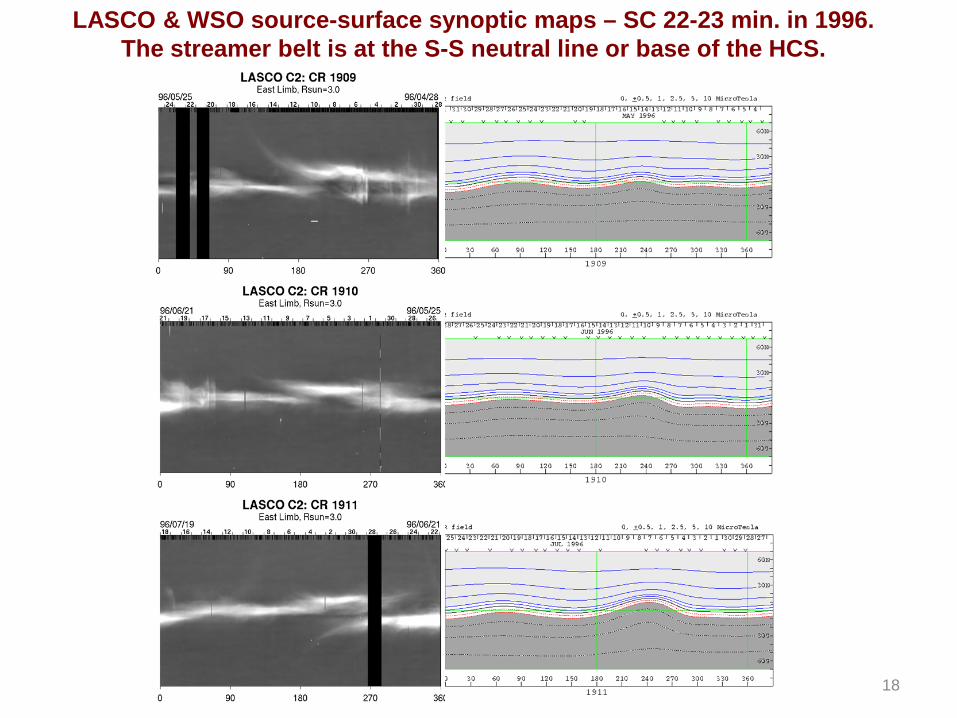
DWebb ISR Nov2017 18
LASCO & WSO source-surface synoptic maps – SC 22-23 min. in 1996.The streamer belt is at the S-S neutral line or base of the HCS.
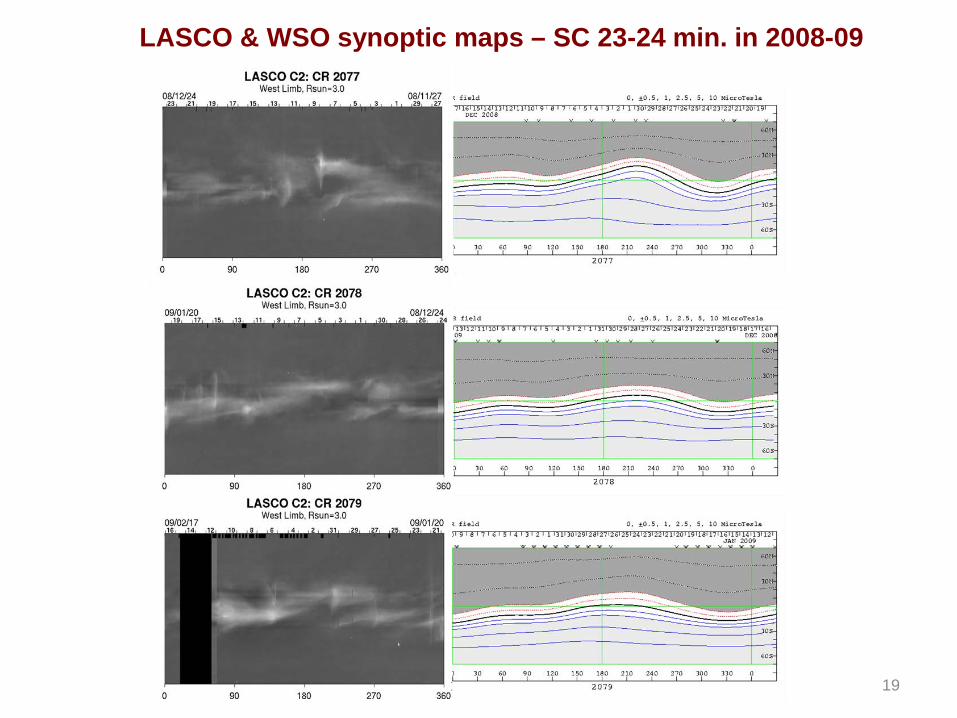
DWebb ISR Nov2017 19
LASCO & WSO synoptic maps – SC 23-24 min. in 2008-09

• Early models used potential-field extrapolations:- First approx. of Sun’s open flux & coupled to heliospheric models like WSA- But allow no free energy or currents, so underestimate total flux
• Global MHD models have advanced & even account for plasma thermodynamics.
- But they depend on potential-field extrapolations & can’t simulate long-term evolution
• Schrijver et al. (GRL 2011) used a flux-transport model (Schrijver et al., ApJ 2002) to estimate the total surface mag. flux back to the 1600s.
- Their total mag. flux est. in 2008-2009 agrees with ours & they suggest this is lowest SC minimum flux since Maunder Minimum
• Improving models difficult because of complex mag. topology. Van Ballegooijen, Mackay, Yeates group developed pragmatic approach using nonlinear, force-free models of local structures initialized with a flux-rope structure in corona.
- Yeates (2014) used this model to simulate continuous mag.-field evolution in global solar corona over 15 years; 1996-2012
- Model allows for buildup & transport of free mag. energy, electric currents, and mag. helicity. - Helicity tends to concentrate in FR structures overlying PILs. When too much helicity
accumulates, the FRs “erupt” & are ejected out of simulation domain
• Large-scale coronal activity at SC minima appears as gradual reconfigurations (& CMEs) of streamer structures that characterize the flattened HCS.
- This ejection activity likely related to a minimum threshold for magnetic energy dissipation and/or the ejection of magnetic helicity from the Sun.
3) Models of Coronal Magnetic Field Evolution

Flux Transport w/ Magneto-Friction Model and CME Rates
Resulting modeled FR distributions:- Latitude–time distributions of (a) flux
ropes and (b) FR eruptions
- (c) Yeates (2014) FR eruptions (black) vs LASCO CDAW CME rates / 3 (red)
- These sim. results are in remarkable agreement with overall shape of LASCO CME rate distribution
- Rates similar to actual CME rates at last 2 minima and support idea of a base level of activity
DWebb ISR Nov2017 22
D) How do double-cycle peaks and hemispherical offsets affect the CME rates?

23
Hemisphere Offset Effect
Some cycles show strong offset or lag in hemispherical activity. - At maximum usually assoc. with polarity reversals & reflected in solar activity,
esp. CMEs & filament eruptions, and at high latitudes - NH activity has led that in S, with N polar field reversing first. In this cycle (24) N
first reversed in mid-2012 and S about two years later - Note recent cycle double peaks related to the hemispherical offsets
SILSO ROB,Belgium

24DWebb ISR Nov2017Webb & Howard (JGR, 1994)
CME – SSN/MF Double Peaks & Offsets
• SCs 22-24 have clear double peaks in SSN/MF rates
• Also double peaks in CME rate. CME peaks lag SSN/MF peaks by months to ~ 1 year
• Lag related to two main sources of CMEs: Emerging flux & ARs (SSN) & Polar Crown filaments move poleward and erupt around time of polarity reversal
DWebb ISR Nov2017
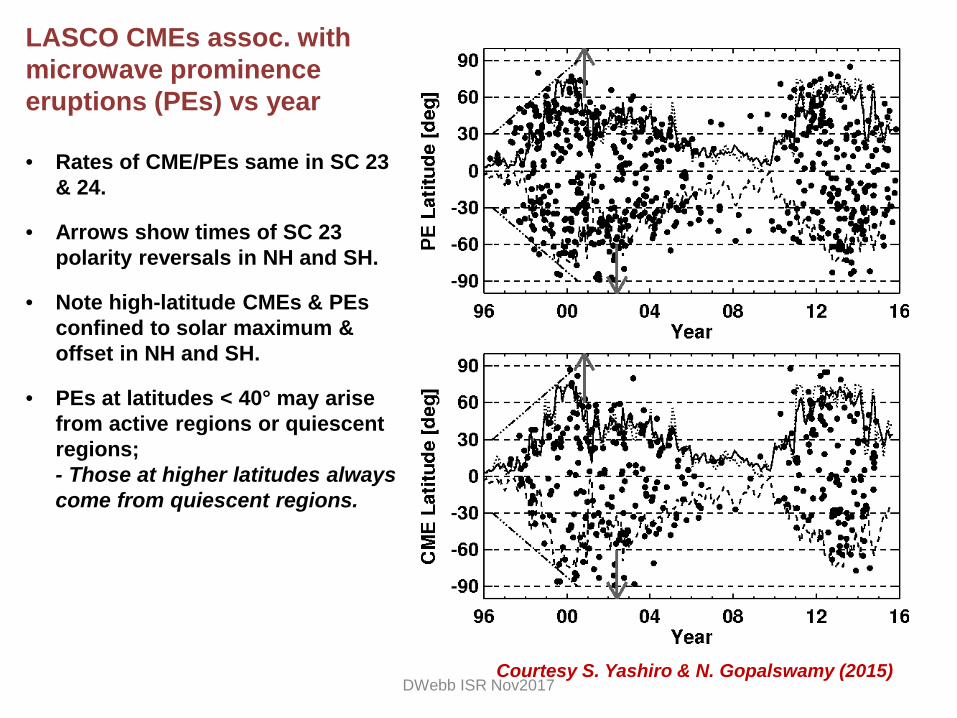
LASCO CMEs assoc. with microwave prominence eruptions (PEs) vs year
• Rates of CME/PEs same in SC 23 & 24.
• Arrows show times of SC 23 polarity reversals in NH and SH.
• Note high-latitude CMEs & PEs confined to solar maximum & offset in NH and SH.
• PEs at latitudes < 40° may arise from active regions or quiescent regions; - Those at higher latitudes always come from quiescent regions.
Courtesy S. Yashiro & N. Gopalswamy (2015)

26DWebb ISR Nov2017
• CMEs are an important aspect of solar activity & space weather.
• Into SC 23 CME rate continued to track SSN in both phase & amplitude: - Late SC 23 & SC 24 rates diverged more CMEs per unit SSN - Other activity indices also show discrepancies with SSN - Related to weak polar magnetic fields during extended SC 23/24 min.- Correlation of CME and SSN rates varies over different SC phases
likely because there are two solar sources of CMEs
• Observations of CMEs now extend over ~ 4 SCs.- MLSO observations used to fill “coronagraph gap” from 1989-1996- Have CME rates for 4 SC minima (0.3 - 0.8/day) and maxima (2.5 - 4.7/day)- LASCO SC 23/24 rates higher than earlier coronagraphs due to increased
sensitivity
• CMEs never cease during a SC but maintain a base level of 1 CME every 1.5 – 3 days at minima.
• CME & SSN/MF rates both reveal double-cycle peaks.- CME peaks lag SSN/MF peaks by ~1/2 year to over a year - Related to offset or lag between hemispheres & different sources of CMEs
CONCLUSIONS
Thanks for your attention.
David F. Webb
1-617-552-6135
Data Sources & Analyses:
Tom Kuchar; ISR, Boston CollegeChris St. Cyr, Hong Xie, Laura Balmaceda, Nat Gopalswamy; NASA GSFC
Bram Bourgoignie; SIDC & Royal Obs., BelgiumJon Bannick, Phil Hess, Jie Zhang; George Mason Univ.
Seiji Yashiro; Catholic University of AmericaAngelos Vourlidas; JHU/APL
27DWebb ISR Nov2017