Embed Size (px)
Citation preview
FRONTAL, CORONAL AND SAGFITAL PLANE VECTORCARDIO-GRAPHY WITH A TWO-CHANNEL SCALAR
ELECTROCARDIOGRAPHBY
E. J. FISCHMANN
with an appendix byD. BROWN
From the Cardiology Department, Green Lane Hospital, Auckland and the Department of Physics,Auckland University College, New Zealand.
Received April 15, 1954
A method of three-dimensional vectorcardiography will be described. It appears to yield muchof the information supplied by the cathode-ray vectorcardiograph, without being as cumbersomeand costly. It uses scalar leads, but is free of those inaccuracies (Graybiel and White, 1952) ofGrant and Estes' (1951) method, which are caused by asynchronous recording of leads and by theproximity of electrodes to the heart.
METHOD OF RECORDINGAn Elmquvist Junior electrocardiograph with two galvanometers and a second amplifier was
used. Calibration was either one and a half times or twice the usual (1 mV= 1 cm.) paper speedapproximately 5 cm. per sec. A " cube " reference system was used, with a modification (Grishmanet al, 1951) of Duchosal and Sulzer's (1949) lead placement and, except that the polarity of thesagittal lead was reversed for sagittal plane recording, with the lead connections advocated byShillingford and Brigden (1951).
Leads were called X (transverse), Y (caudo-cranial), and Z (postero-anterior). Y and X wererecorded synchronously to determine frontal, Z and X coronal, Y and Z sagittal plane vectors.The frontal plane was " viewed " from the front, the coronal from below, the sagittal from theleft. Thus " viewed " in each plane the first-named lead appeared as the " vertical," the second asthe" horizontal "componentlead (Fig. lA, B and Fig. 2: cornerinsets). "Vertical "leads appearedin the upper, " horizontal " leads in the lower tracing of each cardiograph. In the main paper theorientation of vectors was stated in terms of the Einthoven convention (as viewed by the observer00 right, 900 bottom, 1800 left, -90° top of the page; quadrants numbered counterclockwise,commencing with the 00 to 900 quadrant). In the appendix, to facilitate mathematical treat-ment, the notation traditional in physics was used (900 top, -900 bottom; quadrants clockwisenumbered, commencing with what would be the fourth quadrant of the former notation).
Lead-pair records in three planes were obtained from each of 100 subjects without, and 147subjects with clinical and/or electrocardiographic evidence of heart disease.
CONSTRUCTION OF THE FRONTAL, CORONAL, AND SAGITTAL PLANE PROJECTIONS OF SPATIALINSTANTANEOUS VECTORS
Frontal plane. The heart's electromotive force, having direction as well as magnitude, is a yectorquantity and can be described by a directed line called the spatial instantaneous vector. Its frontal planeprojection is the frontal plane instantaneous vector Ef. At a given instant, y and x, the potential differences
351
on 18 May 2018 by guest. P
rotected by copyright.http://heart.bm
j.com/
Br H
eart J: first published as 10.1136/hrt.16.4.351 on 1 October 1954. D
ownloaded from
FISCHMANN AND BROWN
ECGlCICCiECIQ I E CA II........
.. ...... ..........
x
DL....... .... ....~~~~~~~~...SF....
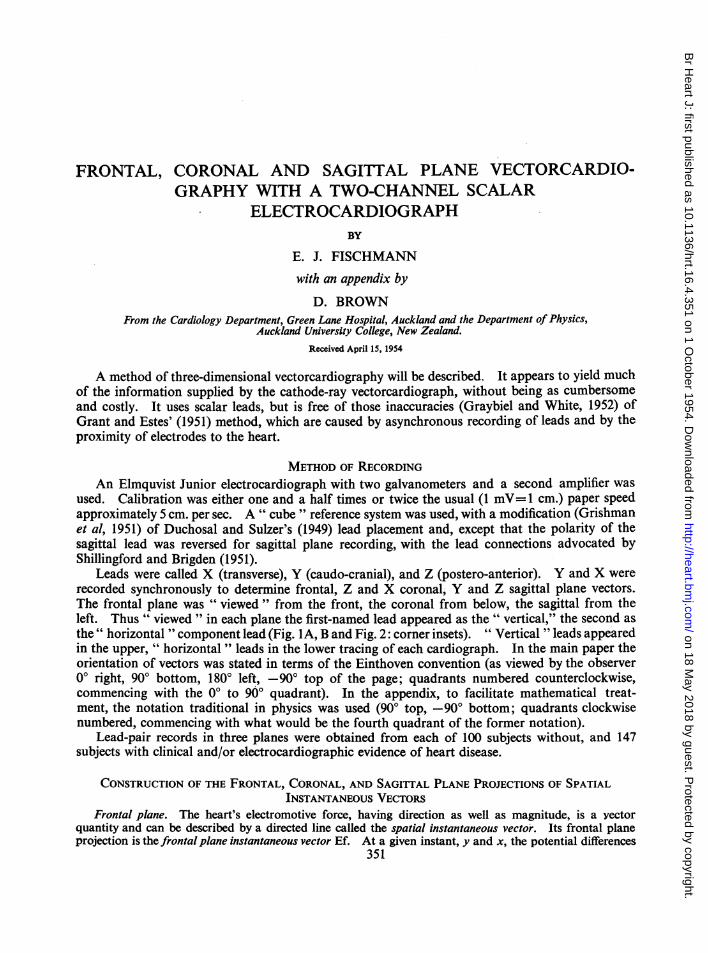
. ............ . ...... vve...... ....._i...FIG. 1.-(A) Caudo-cranial lead Y, transverse lead X, and frontal
plane instantaneous vector Ef; y and x, the synchronous poten-tial differences in the two leads, are " vertical" and " hori-zontal" components of Ef. (B) Postero-anterior lead Z isthe " vertical"; X the " horizontal " lead in the coronal; Y the" vertical " Z the " horizontal " lead in the sagittal plane.Summation y+x=Ef: (C) By electronic vectorcardiograph.
(D) By setting x off from end of y and joining free onset tofree end. (E) On scalar ECG strip: y and x at 0104 sec.,recorded as vertical deflections. (F) Clockwise tilted lowerlead component x (dotted line) set off from end of synchro-nous upper lead component; Ef joins free onset to free end.Time marks 1/10 and 1/50 sec.
along leads Y and X are vertical and horizontal components of Ef (Fig. lA). Therefore, if y and xare known, Ef can be determined. Determining a resultant vector from its components is known as thesummation of components. According to the " parallelogram law " the sum is the diagonal of a parallelo-gram of which the components are sides. The cathode-ray vectorcardiograph performs the summation,according to this law, ofcomponents supplied by two cardiograph channels. In contrast to the conventionalelectrocardiograph, which records vertical movement alone, the beam of the cathode-ray vectorcardiographwill also travel horizontally or obliquely. If one of its channels gave a vertical deflection y, and the other ahorizontal deflection x, the two channels together applied would produce a deflection corresponding to Ef,the parallelogram diagonal (Fig. 1C).
If leads Y and X are simultaneously recorded with a two-channel conventional electrocardiograph,
352
on 18 May 2018 by guest. P
rotected by copyright.http://heart.bm
j.com/
Br H
eart J: first published as 10.1136/hrt.16.4.351 on 1 October 1954. D
ownloaded from
VECTORCARDIOGRAPHY WITH A SCALAR ELECTROCARDIOGRAPH
beam or (string) excursions at a given instant will equal y and x in magnitude, but not in direction. Asvertical movement alone is possible, the horizontal x (lower lead) component will also appear verticallyorientated (Fig. lE). It must therefore be tilted by 900. With the present lead connections the tilt must beclockwise (Fig. 1F). Summation ofy and of clockwise tilted x will then give Ef. The components x and ymust be taken from synchronous points of the two tracings.A simplified method of vector summation, commonly used in vector algebra (Henrici and Turner, 1903;
Rutherford, 1951) was found more convenient for the present purpose than parallelogram construction,although in essence identical with the latter (cf. Fig. IC and D). Expressed in the terms here used, if x isset offfrom the distal end ofy, Efis the straight line directedfromfree onset tofree end (Fig. ID). Three waysof using this principle in the construction of cardiac instantaneous vectors are offered in the following.
(1) Drawing on the cardiogram strip, or visually with the aid of the coordinate system formed by thetime and voltage lines, the clockwise tilted lower lead deflection x is transferred to the distal end of y. Efis the straight line connecting free onset with free end (Fig. lE, F).
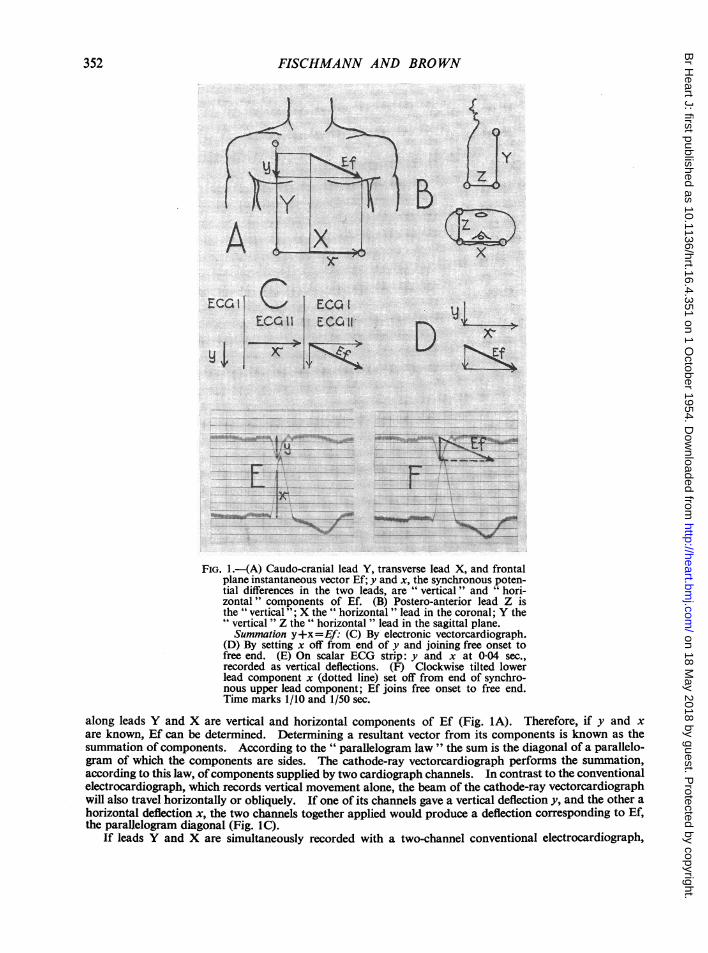
(2) Main Fig. 2 shows a " biaxial " modification of Wenkebach and Winterberg's (1927) triaxial diagramFRONTAL U L
Head A0 ; -9 oc
RF \+ 0 r iblHE0I}+6,
Baock 0 FoolCOkONAL t SAGITTA L
FIG. 2.-Biaxial chart, for the summation of vectors enclosing a right angle (after Wenkebach and Winterberg).UL axis of upper, LL of lower lead of a lead-pair. Positive half of axes corresponds to upward, negative half todownward component lead deflection; grading of axes to electrocardiographic amplitude in mm. Right upperinset: 4 quadrants and 12 sectors of reference system. Remaining three insets: topography of up- or down-ward component lead deflections in three planes.
353
on 18 May 2018 by guest. P
rotected by copyright.http://heart.bm
j.com/
Br H
eart J: first published as 10.1136/hrt.16.4.351 on 1 October 1954. D
ownloaded from
FISCHMANN AND BROWN
for the estimation of frontal plane vectors from standard leads. In Fig. IE at 004 sec., y is -6, x is 14 mm.To determine Ef at 0-04 sec., -6 is found on the vertical axis of the diagram. The terminus of Ef is 14units to the right of this point. It lies on the fifteenth of the concentric circles; the length of Ef is there-fore 15 mm. Its direction read at the border of the figure is 22.50.
(3) For approximate determination of direction, without magnitude, the quadrant containing Ef can bedetermined. The quadrant in question is that enclosed by the upper and the clockwise tilted lower leadcomponent. Thus in Fig. 4B in each of 6 frontal plane lead pairs, y at the instant corresponding to thetallest peak, points towards 900; clockwise tilted x, points towards 00; the two enclose the first quadrant.To define orientation of Ef further, each quadrant can then be divided into three 300" sectors " (Holzmann,1945; Graettinger et.al., 1951; Lepeschkin, 1951) and for the present purpose sectors within each quadrantwere lettered a, b, c, in clockwise order (Fig. 2, right upper inset).
In any quadrant, if the ratio of component y to component x is 6/10 or roughly 2/3, Ef diverges fromthe X axis, if it is 10/6 from the Y axis, by 300. This may be confirmed from main Fig. 2. Thus if thedifference between the two components is less than 1/3, Ef is in sector b (Fig. 4B, third and fourthrecords); if greater than 1/3, Ef is in the sector adjoining the axis of the lead with the taller component. Inthe first two records of Fig. 4B Ef is in sector a, adjoining the X axis; in the last two records Ef is insector c, adjoining the Y axis.
Frontal and Sagittal Planes. Replacing leads Y and X by Z and X, or Y and Z (Fig. IB), the coronaland sagittal plane projections of the spatial vector may be similarly determined by any of the methodsdescribed.
CONSTRUCTION OF THE VECTOR LooPFrom the Component Lead Record. "Monocardiogram " (Mann, 1920), "vector loop " (Schellong
et. al., 1937) and " vectorcardiogram " (Wilson et al., 1938) are synonyms denoting a curve that connectsthe ends of consecutive vectors within a cardiac cycle. Visualization of a few consecutive vectors will conveythe orientation of a vectorloop and suggest its approximate shape (Fig. 6). If several vectors are drawn,it is preferable that they shall commence from a common point of origin. If tilted lower lead componentsare set off, not from the distal ends of synchronous upper lead components, but at the level of the end-pointsfrom an arbitrarily chosen common vertical line, vectors will commence from the crossing of this line withthe upper lead isoelectric line.
From the Enlarged Component Lead Image. Theloops in Fig. 5 and 6 were obtained with a drawinginstrument (Fischmann, 1953), using photographically fourfold enlarged lead-pairs, mechanical translationof vertical shift into drawing board movement, of horizontal shift into movement of a marking point; and ascanning table larger than, but in principle similar to, that of Shillingford and Brigden (1951). The drawinginstrument was used only to check the results of the visual method.
FEATURES OF THE Loop OBVIOUS FROM COMPONENT LEADS, WITHOUT GEOMETRICCONSTRUCTION OF THE LooP
Descriptive criteria in common use are orientation of the QRS loop; its width; orientation of"initial " and "terminal" vectors; direction of loop inscription; speed of inscription; minorirregularities of contour; failure of QRS loop to close; T loop orientation. Inspection of a com-ponent lead pair often reveals these eight criteria, without construction of single vectors, directlyas does the electronic vectorcardiogram. This was suggested by a threefold approach: (1) geo-metric construction of lead-pair patterns from fictitious loops (summed up in Fig. 3); (2) plottingvector loops from the magnified lead-pair image with a drawing instrument (Fig. 5 and 6); (3)mathematical demonstration (Appendix).
Orientation of QRS Loop. Component lead QRS is called monophasic if the amplitude of smaller wavesdoes not exceed one-half that of the main deflection, and diphasic if one other wave exceeds one-half that ofthe main deflection.
Records were made of 741 lead-pairs. In 347 lead-pairs one lead showed a mono-, the other a di-phasicQRS complex. Loops corresponding to such lead-pairs are " axial," pointed at one of the four poles ofthe biaxial reference system (Fig. 3). The instantaneous vector corresponding to the peak of the mono-
354
on 18 May 2018 by guest. P
rotected by copyright.http://heart.bm
j.com/
Br H
eart J: first published as 10.1136/hrt.16.4.351 on 1 October 1954. D
ownloaded from
VECTORCARDIOGRAPHY WITH A SCALAR ELECTROCARDIOGRAPH
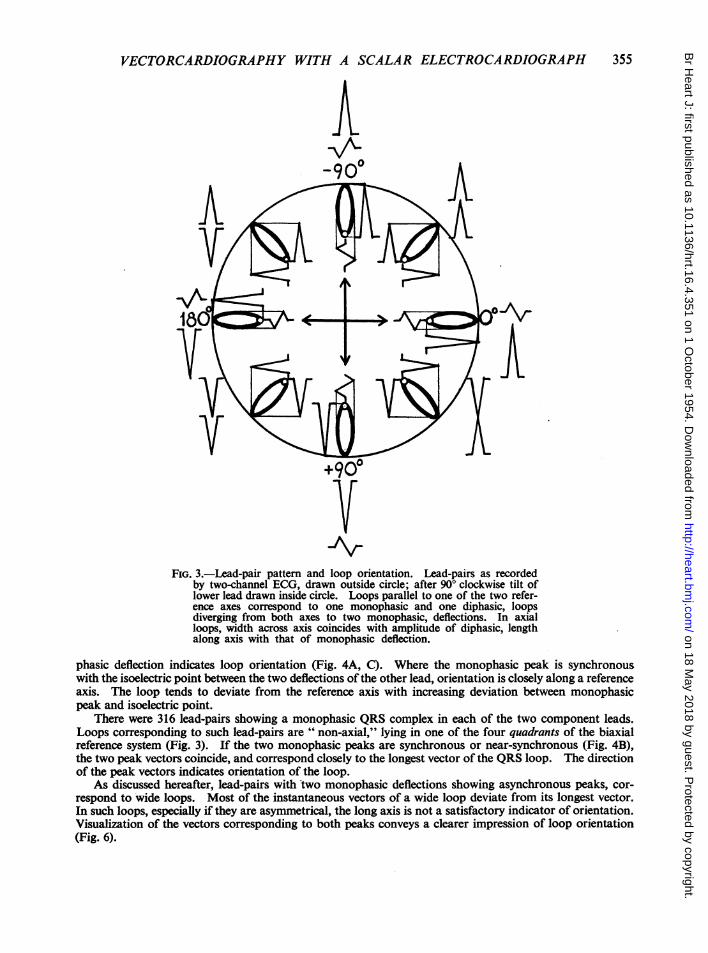
_ArFIG. 3.-Lead-pair pattern and loop orientation. Lead-pairs as recorded
by two-channel ECG, drawn outside circle; after 90° clockwise tilt oflower lead drawn inside circle. Loops parallel to one of the two refer-ence axes correspond to one monophasic and one diphasic, loopsdiverging from both axes to two monophasic, deflections. In axialloops, width across axis coincides with amplitude of diphasic, lengthalong axis with that of monophasic deflection.
phasic deflection indicates loop orientation (Fig. 4A, C). Where the monophasic peak is synchronouswith the isoelectric point between the two deflections of the other lead, orientation is closely along a referenceaxis. The loop tends to deviate from the reference axis with increasing deviation between monophasicpeak and isoelectric point.
There were 316 lead-pairs showing a monophasic QRS complex in each of the two component leads.Loops corresponding to such lead-pairs are " non-axial," lying in one of the four quadrants of the biaxialreference system (Fig. 3). If the two monophasic peaks are synchronous or near-synchronous (Fig. 4B),the two peak vectors coincide, and correspond closely to the longest vector of the QRS loop. The directionof the peak vectors indicates orientation of the loop.
As discussed hereafter, lead-pairs with two monophasic deflections showing asynchronous peaks, cor-respond to wide loops. Most of the instantaneous vectors of a wide loop deviate from its longest vector.In such loops, especially if they are asymmetrical, the long axis is not a satisfactory indicator of orientation.Visualization of the vectors corresponding to both peaks conveys a clearer impression of loop orientation(Fig. 6).
355
on 18 May 2018 by guest. P
rotected by copyright.http://heart.bm
j.com/
Br H
eart J: first published as 10.1136/hrt.16.4.351 on 1 October 1954. D
ownloaded from
356 FISCHMANN AND BROWN
In the two preceding groups 78 lead-pairs could not be included, as they showed diphasic QRS in bothleads, or triphasic QRS in at least one lead, or more complicated patterns. Construction or visualizationof several vectors allows reconstruction of such loops. Direct prediction without vector construction ispossible from some of these rarer lead-pair patterns, and will be discussed elsewhere.A~. .^.................. -------^................_W_ .<W .................
.-....... ..-..._,,
*. =::-'' .....:.: :'::-...
By .w ~~~~~~~~~~~~~~~~~~~~~~~~~~~~~~~~~~~...S~~~~~~ . .. .... ...... ..... ...... .... .......-. =--t::
_ 4 e w s j wn__w................. ............_.-.iLW S =4~~~~.._.............. ................w_. .~_ ..,..............................................
n r£ - - _ _ _ wtz -'zt- __ -w4 I -- ---_-__ _--------_
. . . . . . .
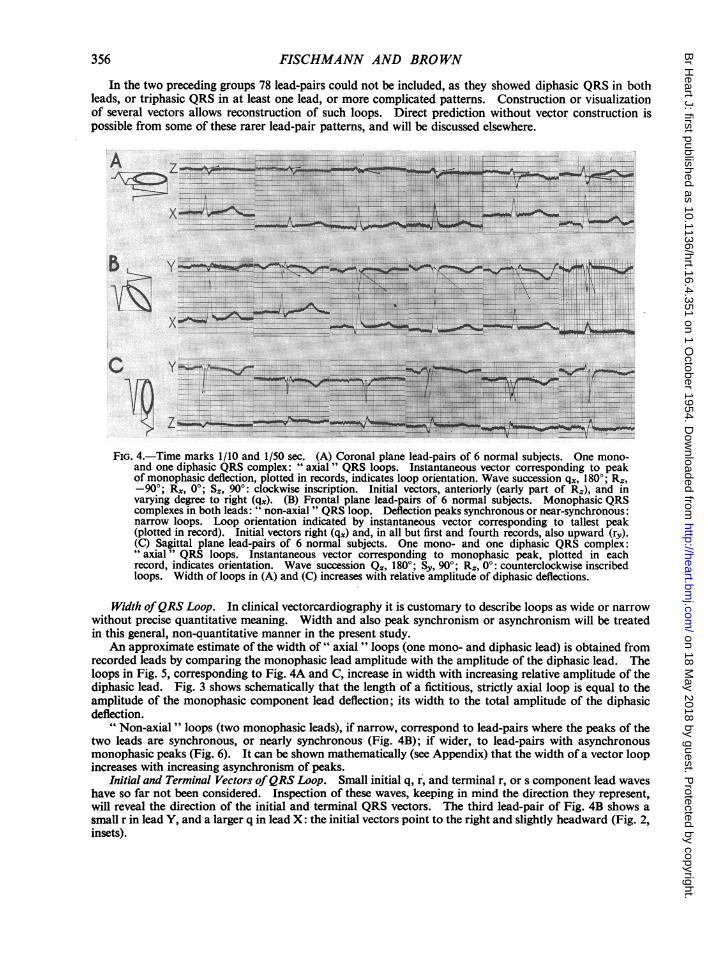
FIG. 4. Time marks 1/10 and 1/50 sec. (A) Coronal plane lead-pairs of 6 normal subjects. One mono-and one diphasic QRS complex: " axial " QRS loops. Instantaneous vector corresponding to peakof monophasic deflection, plotted in records, indicates loop orientation. Wave succession q,, 1800;X Rz,-900; Rx, 00; %*, 900: clockwise inscription. Initial vectors, anteriorly (early part of Re), and invarying degree to right (qx). (B) Frontal plane lead-pairs of 6 normal subjects. Monophasic QRScomplexes in both leads: " non-axial " QRS loop. Deflection peaks synchronous or near-synchronous:narrow loops. Loop orientation indicated by instantaneous vector corresponding to tallest peak(plotted in record). Initial vectors right (qx) and, in all but first and fourth records, also upward (ry).(C) Sagittal plane lead-pairs of 6 normal subjects. One mono- and one diphasic QRS complex:" axial" QRS loops. Instantaneous vector corresponding to monophasic peak, plotted in eachrecord, indicates orientation. Wave succession Qz, 1800; 5S,, 900; Rz, 00: counterclockwise inscribedloops. Width of loops in (A) and (C) increases with relative amplitude of diphasic deflections.
Width ofQRS Loop. In clinical vectorcardiography it is customary to describe 1oops as wide or narrowwithout precise quantitative meaning. Width and also peak synchronism or asynchronism will be treatedin this general, non-quantitative manner in the present study.
An approximate estimate of the width of" axial " loops (one mono- and diphasic lead) is obtained fromrecorded leads by comparing the monophasic lead amplitude with the amplitude of the diphasic lead. Theloops in Fig. 5, corresponding to Fig. 4A and C, increase in width with increasing relative amplitude of thediphasic lead. Fig. 3 shows schematically that the length of a fictitious, strictly axial 1oop is equal to theamplitude of the monophasic component lead deflection; its width to the total amplitude of the diphasicdeflection.
" Non-axial " loops (two monophasic leads), if narrow, correspond to lead-pairs where the peaks of thetwo leads are synchronous, or nearly synchronous (Fig. 4B); if wider, to lead-pairs with asynchronousmonophasic peaks (Fig. 6). It can be shown mathematically (see Appendix) that the width of a vector loopincreases with increasing asynchronism of peaks.
Initial and Terminal Vectors ofQRS Loop. Small initial q, r, and terminal r, or s component lead waveshave so far not been considered. Inspection of these waves, keeping in mind the direction they represent,will reveal the direction of the initial and terminal QRS vectors. The third lead-pair of Fig. 4B shows asmall r in lead Y, and a larger q in lead X: the initial vectors point to the right and slightly headward (Fig. 2,insets).
on 18 May 2018 by guest. P
rotected by copyright.http://heart.bm
j.com/
Br H
eart J: first published as 10.1136/hrt.16.4.351 on 1 October 1954. D
ownloaded from
VECTORCARDIOGRAPHY WITH A SCALAR ELECTROCARDIOGRAPH
A f
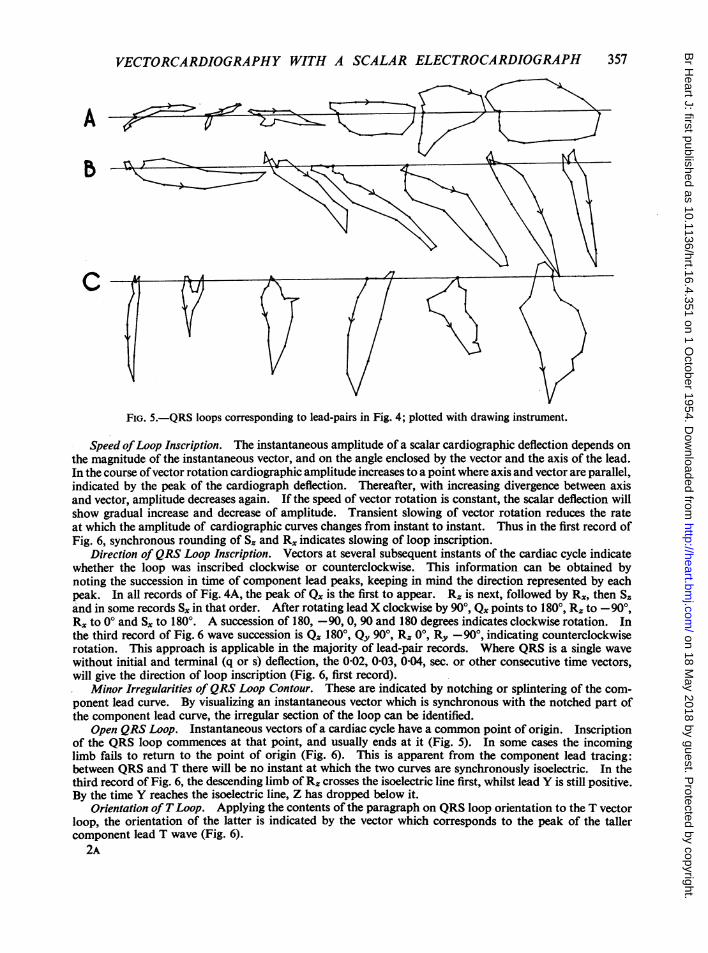
FIG. 5.-QRS loops corresponding to lead-pairs in Fig. 4; plotted with drawing instrument.
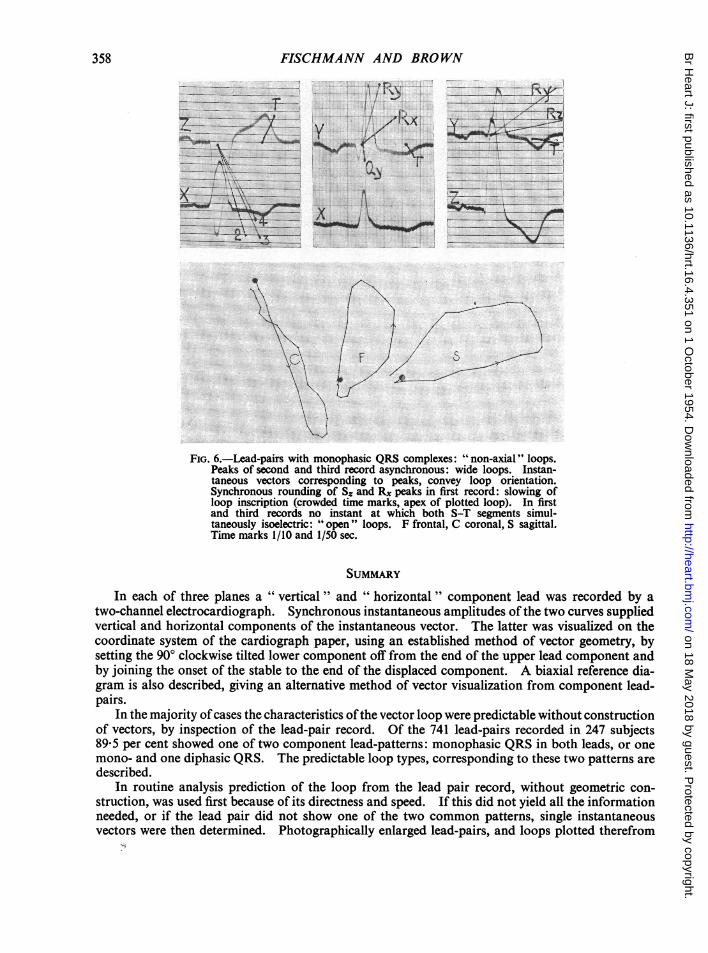
Speed ofLoop Inscription. The instantaneous amplitude of a scalar cardiographic deflection depends onthe magnitude of the instantaneous vector, and on the angle enclosed by the vector and the axis of the lead.In the course ofvector rotation cardiographic amplitude increases to a point where axis and vector are parallel,indicated by the peak of the cardiograph deflection. Thereafter, with increasing divergence between axisand vector, amplitude decreases again. If the speed of vector rotation is constant, the scalar deflection willshow gradual increase and decrease of amplitude. Transient slowing of vector rotation reduces the rateat which the amplitude of cardiographic curves changes from instant to instant. Thus in the first record ofFig. 6, synchronous rounding of S. and Rx indicates slowing of loop inscription.
Direction of QRS Loop Inscription. Vectors at several subsequent instants of the cardiac cycle indicatewhether the loop was inscribed clockwise or counterclockwise. This information can be obtained bynoting the succession in time of component lead peaks, keeping in mind the direction represented by eachpeak. In all records of Fig. 4A, the peak of Q. is the first to appear. Rx is next, followed by Rx, then S.and in some records S. in that order. After rotating lead X clockwise by 900, Q, points to 1800, R, to -90°,Rx to 00 and S,x to 180°. A succession of 180, -90, 0, 90 and 180 degrees indicates clockwise rotation. Inthe third record of Fig. 6 wave succession is Q. 1800, Qy 900, R, 00, Ry -900, indicating counterclockwiserotation. This approach is applicable in the majority of lead-pair records. Where QRS is a single wavewithout initial and terminal (q or s) deflection, the 0-02, 0 03, 0 04, sec. or other consecutive time vectors,will give the direction of loop inscription (Fig. 6, first record).
Minor Irregularities of QRS Loop Contour. These are indicated by notching or splintering of the com-ponent lead curve. By visualizing an instantaneous vector which is synchronous with the notched part ofthe component lead curve, the irregular section of the loop can be identified.
Open QRS Loop. Instantaneous vectors of a cardiac cycle have a common point of origin. Inscriptionof the QRS loop commences at that point, and usually ends at it (Fig. 5). In some cases the incominglimb fails to return to the point of origin (Fig. 6). This is apparent from the component lead tracing:between QRS and T there will be no instant at which the two curves are synchronously isoelectric. In thethird record of Fig. 6, the descending limb of R, crosses the isoelectric line first, whilst lead Y is still positive.By the time Y reaches the isoelectric line, Z has dropped below it.
Orientation of TLoop. Applying the contents of the paragraph on QRS loop orientation to the T vectorloop, the orientation of the latter is indicated by the vector which corresponds to the peak of the tallercomponent lead T wave (Fig. 6).
2A
357
on 18 May 2018 by guest. P
rotected by copyright.http://heart.bm
j.com/
Br H
eart J: first published as 10.1136/hrt.16.4.351 on 1 October 1954. D
ownloaded from
358FISCHMANN AND BROWNA eRh--4h-- - s 7e-- S 7Fr -v----e 1w lZ- - - *------Z---Ze -S l| j- hlSh- -- - t..
---t-"---------.. _-- ----.-.---- -<---------r------ -------- ,, t
FIG. 6.-Lead-pairs with monophasic QRS complexes: " non-axial" loops.Peaks of second and third record asynchronous: wide loops. Instan-taneous vectors corresponding to peaks, convey loop orientation.Synchronous rounding of S. and RX peaks in first record: slowing ofloop inscription (crowded time marks, apex of plotted loop). In firstand third records no instant at which both S-T segments simul-taneously isoelectric: " open " loops. F frontal, C coronal, S sagittal.Time marks 1/10 and 1/50 sec.
SUMMARY
In each of three planes a " vertical" and " horizontal " component lead was recorded by atwo-channel electrocardiograph. Synchronous instantaneous amplitudes of the two curves suppliedvertical and horizontal components of the instantaneous vector. The latter was visualized on thecoordinate system of the cardiograph paper, using an established method of vector geometry, bysetting the 900 clockwise tilted lower component off from the end of the upper lead component andby joining the onset of the stable to the end of the displaced component. A biaxial reference dia-gram is also described, giving an alternative method of vector visualization from component lead-pairs.
In the majority ofcases the characteristics ofthe vector loop were predictable without constructionof vectors, by inspection of the lead-pair record. Of the 741 lead-pairs recorded in 247 subjects89-5 per cent showed one of two component lead-patterns: monophasic QRS in both leads, or onemono- and one diphasic QRS. The predictable loop types, corresponding to these two patterns aredescribed.
In routine analysis prediction of the loop from the lead pair record, without geometric con-struction, was used first because of its directness and speed. If this did not yield all the informationneeded, or if the lead pair did not show one of the two common patterns, single instantaneousvectors were then determined. Photographically enlarged lead-pairs, and loops plotted therefrom
..... ._. ...... ..... . . .... s . ...... _... ..... ..... .... _ .. ..... . . _ . ..... . .7 - ._-t;;; _ f e. _. P _. _ ._.>,. P .... _ .e_ . ._
4- !.. 4
! .*.l ----- __._ _ _ +_ ...... _ . ........ . __ij d#t h _ W.--blS.____ \ t__ __-- --- _!
..W#= '''""--7--'S, a_ ------ _._*_ ----- -- ___ ^,_> fi -- __ _-- --------- -- t -- ---- ----..... .... _ § ..... SL .... 4 .
., 3. . ....... ...358
on 18 May 2018 by guest. P
rotected by copyright.http://heart.bm
j.com/
Br H
eart J: first published as 10.1136/hrt.16.4.351 on 1 October 1954. D
ownloaded from
VECTORCARDIOGRAPHY WITH A SCALAR ELECTROCARDIOGRAPH
with a drawing instrument, were finally used for purposes of the present inquiry, not as a clinicalmethod. These techniques in their totality supplied a method, the accuracy of which was adaptableto the purpose of study.
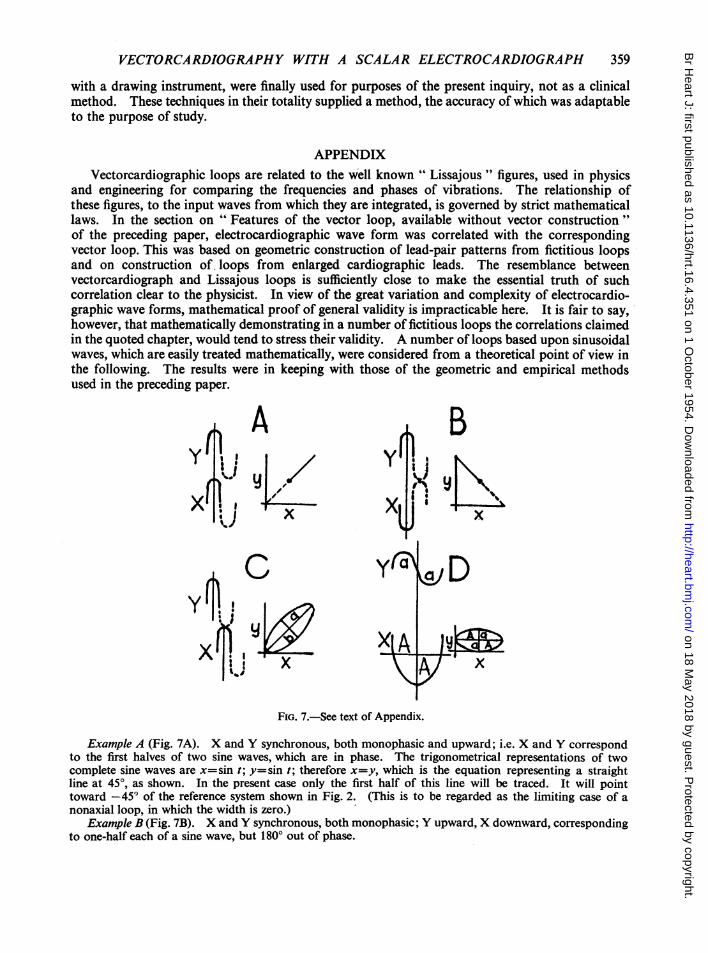
APPENDIXVectorcardiographic loops are related to the well known " Lissajous" figures, used in physics
and engineering for comparing the frequencies and phases of vibrations. The relationship ofthese figures, to the input waves from which they are integrated, is governed by strict mathematicallaws. In the section on " Features of the vector loop, available without vector construction"of the preceding paper, electrocardiographic wave form was correlated with the correspondingvector loop. This was based on geometric construction of lead-pair patterns from fictitious loopsand on construction of, loops from enlarged cardiographic leads. The resemblance betweenvectorcardiograph and Lissajous loops is sufficiently close to make the essential truth of suchcorrelation clear to the physicist. In view of the great variation and complexity of electrocardio-graphic wave forms, mathematical proof of general validity is impracticable here. It is fair to say,however, that mathematically demonstrating in a number of fictitious loops the correlations claimedin the quoted chapter, would tend to stress their validity. A number of loops based upon sinusoidalwaves, which are easily treated mathematically, were considered from a theoretical point of view inthe following. The results were in keeping with those of the geometric and empirical methodsused in the preceding paper.
A/AX
X 0g M xX YC
FIG. 7.-See text of Appendix.
Example A (Fig. 7A). X and Y synchronous, both monophasic and upward; i.e. X and Y correspondto the first halves of two sine waves, which are in phase. The trigonometrical representations of twocomplete sine waves are x=sin t; y=sin t; therefore x=y, which is the equation representing a straightline at 450, as shown. In the present case only the first half of this line will be traced. It will pointtoward -45° of the reference system shown in Fig. 2. (This is to be regarded as the limiting case of anonaxial loop, in which the width is zero.)
Example B (Fig. 7B). X and Y synchronous, both monophasic; Y upward, X downward, correspondingto one-half each of a sine wave, but 1800 out of phase.
359
on 18 May 2018 by guest. P
rotected by copyright.http://heart.bm
j.com/
Br H
eart J: first published as 10.1136/hrt.16.4.351 on 1 October 1954. D
ownloaded from
FISCHMANN AND BROWN
y=sin t; x= -sin t; therefore x= -y. This is the equation of a straight line at -45°, as shown.Only the first half of this line will be traced. It will point toward -135° of the reference system in Fig. 2(Another infinitely narrow nonaxial loop).
Example C (Fig. 7C). X and Y both monophasic and upward; asynchronous, e.g. suppose Y to beahead ofX by an interval of time E.
y=sin (t+e); x=sin texpanding the equation for y,
y=sin t cos e+cos t sin e
And re-writing the expression for x as 1-x2=cos t,
then y=x cosE+Vl1x2 sin E
(1-x2)sin2 E=(y-X COS 6)2or y2+x2-2yxcos E=sin2 C.
This is an equation representing an ellipse as shown, the principal axes a and b being at 450 and -45° to
the X axis respectively. The lengths of the axes are in a ratio given by: b2 1-COSe; whence a=tanE
a2 1 +cos C a 2numerically. The eccentricity therefore depends on the time interval 6. Nearly synchronous pulses havesmall values of e and hence narrow ellipses. The ellipse here is traced in a clockwise direction and in thecase chosen only its first half will be inscribed. The waves are out of phase at zero level: the loop willremain " open." In a strictly similar way, we can show that ifY is lagging behind X by an interval of time,the ellipse is similar in appearance but is described in a counterclockwise direction.Example D (Fig. 7D). X monophasic downward, Y diphasic. The peak of the monophasic lead is
taken as synchronous with the isoelectric centre between the two peaks of the diphasic curve. In the previousexamples it was assumed for simplicity that the amplitudes of the X and Y curves were equal, but now wewill make a more general assumption, viz., let A= amplitude of monophasic wave; a= amplitude of diphasicwave, where a is less than A. (With the sinusoidal form which we are assuming for the waves, an amplitude Awill imply a total pulse-height 2A for the monophasic wave.) y=a sin t; x=A cos t; since sin 2t+cos2 t= 1;y2 x2i+A2= 1, which is the equation describing an axial ellipse or loop as shown, with the longer axis of the
loop horizontal. In an exactly similar way we can see that if the monophasic and diphasic waves are inter-changed, the resulting loop will have its longer axis vertical instead of horizontal.
Expressed in the terms used in the preceding paper: A lead-pair with two synchronous monophasicupward deflections corresponds to a narrow nonaxial loop in the fourth quadrant (A). A lead-pair withsynchronous upward monophasic upper lead, and downward monophasic lower lead deflections, correspondsto a narrow nonaxial loop in the third quadrant (B). A lead-pair with two asynchronous monophasicupward deflections corresponds to a wide non-axial loop in the fourth quadrant. Width increases withasynchronism. Direction of inscription depends on peak succession (C). A lead-pair with upper leaddiphasic, and lower lead downward monophasic deflection, corresponds to an axial loop, orientated toward1800 (D).
REFERENCES
Duchosal, P. W., and Sulzer, R. (1949) La Vectocadiographie. Basle.Fischmann, E. J. To be published.Graettinger, J. S., Packard, J. M., and Graybiel, A. (1951). Amer. J. Med., 11, 3.Grant, R. P., and Estes, E. H., Jr. (1951). Spatial Vector Electrocardiography. Philadelphia.Graybiel, A., and White, P. D. (1952). Electrocardiography in Practice. Philadelphia.Grishman, A., Borun, E. E., and Jaffe, H. L. (1951). Amer. Heart J., 41, 483.Henrici, O., and Turner, G. C. (1903). Vectors and Rotors. London.Holzmann, M. (1945). Klinische Electrokardiographie. Zurich.Lepeschkin, E. (1951). Modern Electrocardiography, Vol. 1. Baltimore.Mann, H. (1920). Arch. intern. Med., 25, 283.Rutherford, D. E. (1951). Vector Methods. Edinburgh.Shillingford, J., and Brigden, W. (1951). Brit. Heart J., 13, 233.Wenkebach and Winterberg (1927). Quoted from Holzmann (1945), p. 60.Wilson, F. N., and Johnston, F. D. (1938). Amer. Heart J., 16, 14.
360
on 18 May 2018 by guest. P
rotected by copyright.http://heart.bm
j.com/
Br H
eart J: first published as 10.1136/hrt.16.4.351 on 1 October 1954. D
ownloaded from


![MSK CT PROTOCOL[2] - jefferson.edu · AC joint. SHOULDER Coronal Imaging Plane Coronal Imaging Plane •Prescribe coronal plane off of axial images parallel to supraspinatus muscle](https://img.pdfslide.us/doc/110x75/5d645f8588c9930e728b6075/msk-ct-protocol2-ac-joint-shoulder-coronal-imaging-plane-coronal-imaging.jpg)