Embed Size (px)
Citation preview

A Cornoarison of Current CoIlection/Samoling Techniaues for Waterborne Ra . don Analysis
James F. Burkhart, University of Colorado a t Colorado Springs; Gray, D.,United States Environmental Protection Agency, Montgomery Alabama; Martin, R.D., DMA-RADTECH Inc., Allentown, PA; Warrick, B., University of Colorado at Colorado Springs.
As the US Radon industry matures* and the USEPA contemplates a Maximum Contaminant Level (MCL) for waterborne radon activity, much concern exists regarding appropriate sampling techniques and their ability to attain reproducible and reliable samples for either the analytical laboratory or in-sib analysis.
The authors have examined eighteen (18) different sampling methodologies, each one using two different types and amounts of scintillant. Sampling variables included:
1. Basin immersion without scintillant. - 2. Spigot collection.
3. Various syringe methods.
4. PlastidGlass collection vehicles.
5. Different types of lids.
6. Two different cocktail types/amounts.
Samplina methods were performed In a geologically s t ab l e aqui fe r with a consistent concentration of approximately 2100 pCUL.
All environmental sampling was performed by personnel at the University of Colorado a t Colorado Springs (UCCS). Sample analysis was performed using liquid scintil lation methodology a t the USEPA's National Air and Radiation Environmental Laboratory (NAREL), in Montgomery, Alabama, the DMA Analysis Group at DMA-RADTECH, INC. in Allentown, Pennsylvania, and the Radon Measurement Laboratory at UCCS.
In order to eliminate measurement errors generated by different analytical techniques, quality control samples of a known Rn-222 concentration were prepared and analyzed.
Waterborne radon has historically been measured via the Lucas Cell (Lucas 1964) and through
liquid scintillation techniques (Richard and Gesell, 1977). Recent studies have examined, and
made recommendations concerning the laboratory techniques (Vitz, 199 1) and the water- to-fluur
ratios (Lowry, 1991). What has not been decided are the appropriate field sampling techniques
which would, on the one hand, allow current analytical technology to be used but, on the other
hand, would minimize sample degndation.
Current policies of federal environmental offices and individual state health and environment
offices trend toward the use of liquid scintillation technology for analytical purposes (NJDEP
Laboratory -cation Program: 199 1, USEPA Document 520/5-83-027).
The goal of this paper is neither to discuss nor debate the analytical technologies, but to provide
data relevant to a discussion on the merits of the most commonly used sampling techniques and to
suggest specific recommendations as to the appropriateness of these sample collection methods.
If indeed the USEPA confirms the w a t e r h e radon Maximum Contaminant Level (MU) of 300
PC&, very careful attention to sampling methodology detail will be necessary to accurately
measure environmental samples, especially those samples at or near the Ma.
The objective of this study was to identify which methodologies for the measurement of
waterborne radon are the most accurate and reproducible . While it will be shown that the on-site
stabilization of the environmental sample with scintillant produces results with the lowest bias and
highest radon concentrations (for a given water source), transport of the chemically hazardous
material (the scindllant) may not always be permissible in the private sector. For this reason, we
discuss alternate collection methods which generate results of reasonable bias (albeit lower reported
radon concentrations for the same water source.)

Since the intent of this study is to cornpait various sampling techniques, it seemed desirable to
hold steady any variables which could confound these comparisons. Among these variables is, of
course, the possible variation of the radon concentration of the water source during the sampling
time. Also, we wanted to be sure that the radon values measured in the lab later were not affected
by systematic errors created by the lab handling, transfer and measuring techniques.
The first of these potential problems (the variation of radon levels during sampling) was handled
by:
1. Using a relatively deep well (3 10 feet total depth).
2. Using a well in which the pump was submerged and had sufficient head space (60 feet .
of water above the pump.)
3. Sampling only after the water holding tank had been completely cleansed of "old"
water. We determined that the holding tank was only a fifty gallon tank. We purged the
tank for 25 minutes with a flow rate of 10 gallons per minute so that we turned the
contents of the tank over approximately 5 times before sampling.
4. The aquifer chosen was in a geological formation known as an extended radon source
and not one made up of point sources (The Morrison Formation). Many wells in this part
of Colorado, called Black Forest, had been tested and the radon concentration had
uniformly been reported around 2000 pCi11.
5. The sampling experiment was completed two times, once on May 13,1991 and a
second time on May 23,1991. In both cases, the average radon reported by the labs for
the so-called EPA method, in which the water is extracted from a funnel (connected to the
. spigot) and injected into the scindllant, was essentially identical ( 2120 +/- 59 pCi/L the
first run and 2108 +/- 69 pCfl the second run.) Both runs used glass vials with foil lined
caps.
6. On the first run, on May 13, 1991, methodology #1, the first water sampling of the
day (in which the water was extracted from a funnel and injected into a glass vial with a
septum top) was repeated at the end of the experiment as methodology #16.The radon
concentrations were 1947+/- 42 p C i for method #1 and 2138 +/- 22pCi for method
#16.
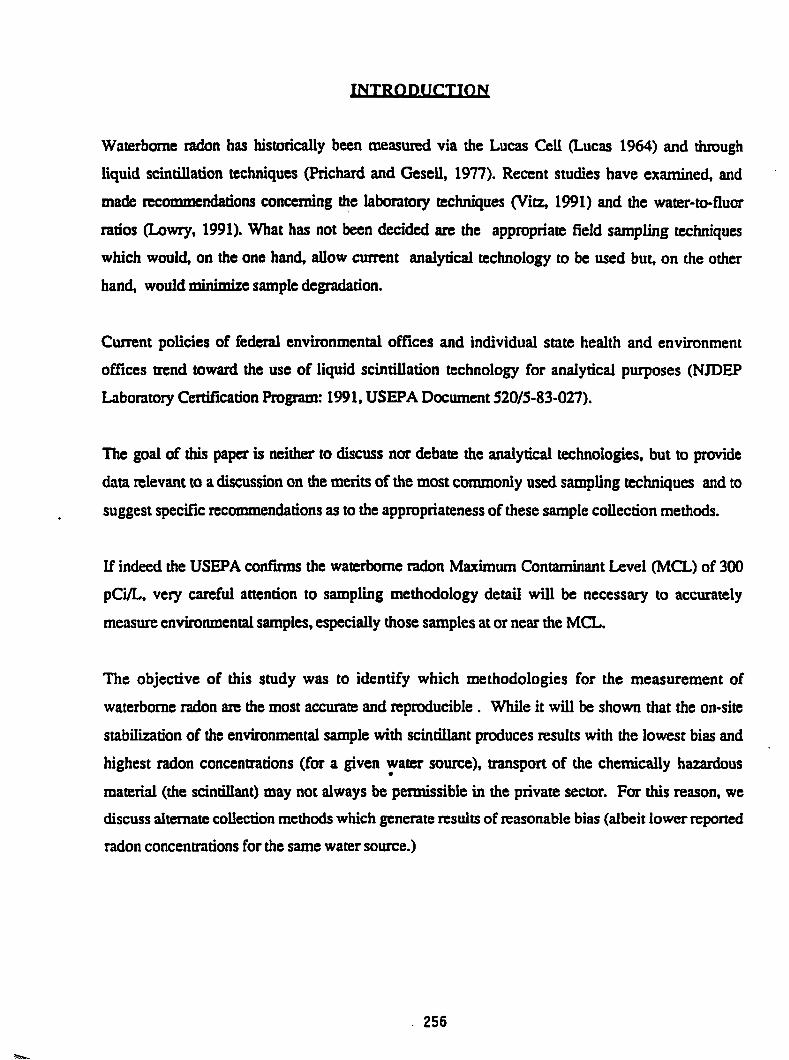
7. On the second run. May 23,199 1, the water extractions for each method were spaced
during the sampling rime so that any variations in source radon would be averaged over.
It happens that this technique allowed us to have confidence in the statistics
and the resultant conclusions. As an example of how this sampling technique was
employed, consider the following: at time = 0,3 vials would be filled using method #I,
one vial for each of the three labs who were doing the method. At time = 1 minute, 3
vials, using method #2, would be filled. This would continue until all of the methods
were finished. Then, we would start on method #1 again, with a second three vials.
When all of the methods were finished, we would begin the sequence, a final time, with
method #l. Each lab would then receive 3 vials of each method and each of the vials
would have been filled at different times during the run. If the radon in the source varied
during the run time, that variation would decrease the precision of that methodology. Of
course, there was a potential for a great deal of variation. The fact that it did not happen
confirmed oar hypothesis that, indeed, the source term was more or less constant.
The second problem (systematic errors in the labs) was handled by requiring each lab to treat every
vial, regardless of sampling technique, the same. Each lab used its own equipment, scintillant and
operating procedures. Also, each vial was identified by a number only. The sampling technique
was not revealed to the laboratories or their lab personnel.
AH water samples were measured using liquid scintillation. The USEPA uses a Beckman
liquid scintillation counter. DMA uses eight Beckman LS 5000TD liquid scintillation counters, and Ã
UCCS uses a singular Bechan LS 100. All labs count for 20 minutes.
The cocktail used by UCCS and the USEPA was Dupont NEN Research Products NEF-957A
mineral oil scintillator in lOmL concentrations. DMA used Packard Optiflour-0 in 5 mL
concentrations. If the water was not already injected into the scintillant (as was proper for some of
the methods) all laboratories introduced 10 mL of the environmental sample to their own scintillan~
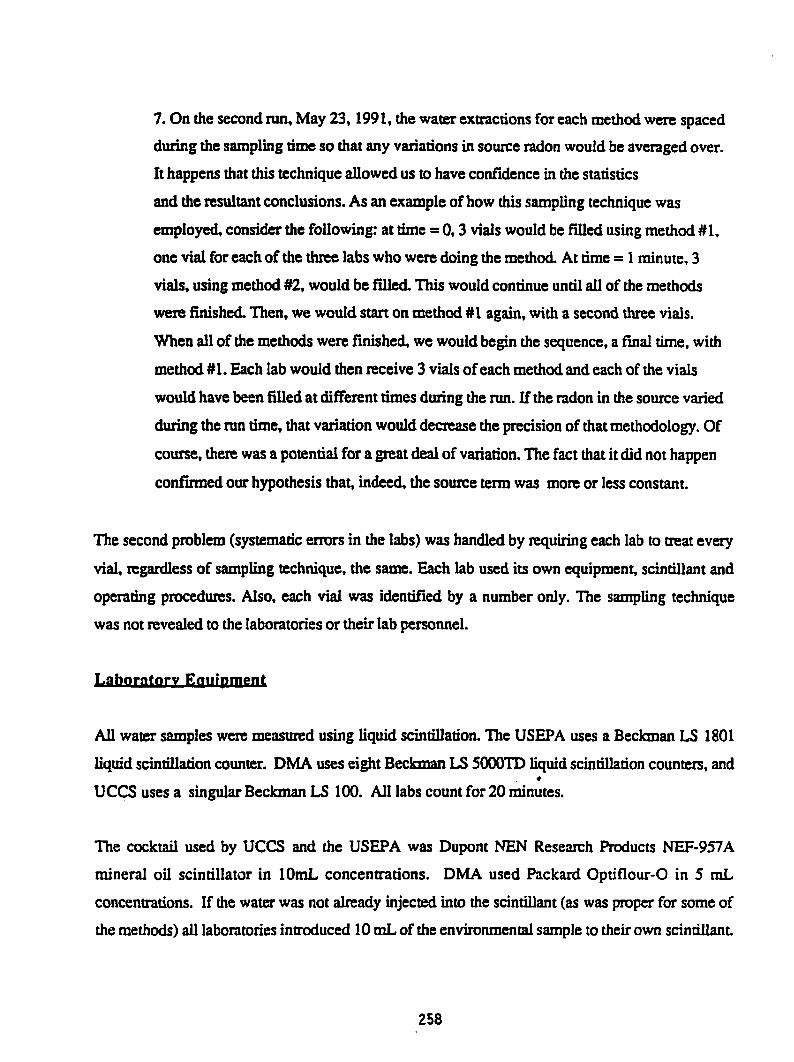
Eighteen (18) different methodologies were investigated, representing the major sampling
techniques currently used in industry. Table 1. represents the sample methodologies used on the
first run, May 13,1991, and includes: sample container type, transfer method* cocktail content and
type, sample container closure type, and collection method. Method#16 is a repeat of method #I.
Â
Table 1: various methodologies employed on first run. May 13. 1991
M & Q u C O ~ ~ ~ T ~ 1 a - f 1 g - i 5 2 a - f g 2 g - i g 3 a - f 5 3 g - i g 4 a - f g 4 g - i g 5 a - f 5 5 g - i g 6 a - i g 7 a - i 5 8 a - i 9 a - i
g
1 0 a - i 8~
l l a - i 8~ 6
12a - i g 1 3 a - i 5 1 4 a - i 15a - i
P P
16a- f S 16g- i g
- --
Closure T m Collection Method 10 mL/ NEN s T/ Hose & Funnel 5 mL/OFO s T/ Hose & Funnel
10 mL/ NEN s T/ Pail 5 &OF0 s T/ Pail
10 nnU NEN s S/ Hose & Funnel 5 mL/OFO s S/ Hose & Funnel
lOmL/NEN c T/ Hose & Funnel 5 mU OF0 c T/ Hose & Funnel
10 rnL/ NEN f T/ Hose & Funnel 5 mIJ OF0 f T/ Hose & Funnel
s Pail f Pail c Pail
Hose Spigot
s Spigot f Spigot c Spigot P Spigot P Pail
10 mL/ NEN s T/ Hose & Funnel 5 d O F 0 s T/ Hose & Funnel
---------- - ------------------------ KEX --------- ---- --------------------
Containers g - .Z mL (Fisher) Boro-silicate glass vial
scMb!t NEN - New England Nuclear
p - 25 mL Plastic Kimble vial (Dupont) Mineral Oil 8p - 8 oz Plastic bottles with plastic screw Ud OF0 - Packard Optiflour - 0 osures f C w m f e r Device f - Foil lined lids T - Tygon tubing syringe c - Poly cone lids S - Steel needle syringe s - Septum lids p - Plastic caps without lining
Methods 1 a - f were perfomied using a hose and funnel attached to the spigot. The water was
allowed to flow continuously at a non-turbulent rate. A plastic syringe and tygon tubing were used
to extract 12 mL. of water from the inverted funnel, the syringe was inverted, the excess 2 mL.
expelled, and the remaining 10 mL. of water were then injected under 10 rnL. of mineral oil. The
septum lid was replaced and the vial quickly shaken. Methods 1 g - i were performed identically to
methods 1 a - f except that the cocktail used was 5 mL. of OptiFlour - 0.
Methods 2 a - f used a plastic pail placed under the spigot. The pail was completely filled, the
spigot was placed under the surface of the water, and the flow reduced to a nonturbulent rate. A
plastic syringe with tygon tubing was then used to extract 12 mL. of water from the pail. The
syringe was inverted and the excess 2 mL. expelled. The remaining 10 rnL of water were then
injected under the 10 mL. of mineral oil, the septum lid was replaced, and the vial quickly shaken.
Methods 2 g - i were performed in the same manner except 5 mL. of Opti-Flour - 0 were used.
Methods 3 a - i were performed in the same manner as methods 1 a - i except that samples were
drawn through an 18 gauge steel needle instead of the tygon tubing.
Methods 4 a - i were performed in the same manner as methods 1 a - i except poly-cone plastic lids
were used in place of septum lids.
As in methods 4 a - i, methods 5 a - i employed the same methodology as number 1 except foil
lined lids were used.
Methods 6 a - i used a plastic pail filled from the spigot. The water was allowed to overflow the
pail and the flow was reduced to a nonturbulent rate at which time 25 mL. glass vials (bottom
down) and septum tops were submerged in the pail and allowed to fill completely. The vials were
then carefully sealed and removed from the pail with minimum agitation of the water.
Methods 7 a - i were performed in the same manner as 6 a - i except that foil lined lids were used.
Methods 8 a - i also used the same method as numbers 6 a - i except that poly-cone plastic lids
260
were used.
In methods 9 a - i, 8 oz. common lab specimen plastic bottles with plastic screw lids were filled
with a plastic hose immersed beneath the surface of the water. The lids were replaced, and the
vials squeezed lightly to remove any excess air.
Methods 10 a - i were the same as methods 9 a - i except the bottles were filled directly from the
spigot
In methods 11 a - i, 25 mL. glass vials were filled directly from the spigot, and the septum lids
replaced to insure that no air bubbles were present.
Methods 12 a - i were performed in the same manner as methods 11 a - i except foil lined lids were
used.
Methods 13 a - i also were performed as methods 1 1 a - i except poly-cone plastic lids were used.
Methods 14 a - i used 25 mL. plastic vials which were filled from the spigot and sealed with plastic
caps without linings.
Methods 15 a - i also used 25mL plastic vials and caps. In this method, a pail was filled from the
spigot and the water was allowed to overflow at a nonturbulent rate. The vials (bottoms down)
and caps were submerged in the pail and the vials were quickly sealed under water with no air
bubbles present.
Methods 16 a - i were identical to methods 1 a - i.
1e Co-rn the S- 23. 199k
Table 2 shows the 13 methodologies used on the second run. May 23. 1991. Many of these
methods are repeats of methods used earlier, but the sampling times were staggered (as explained
in the special precautions section above). The new methods were:
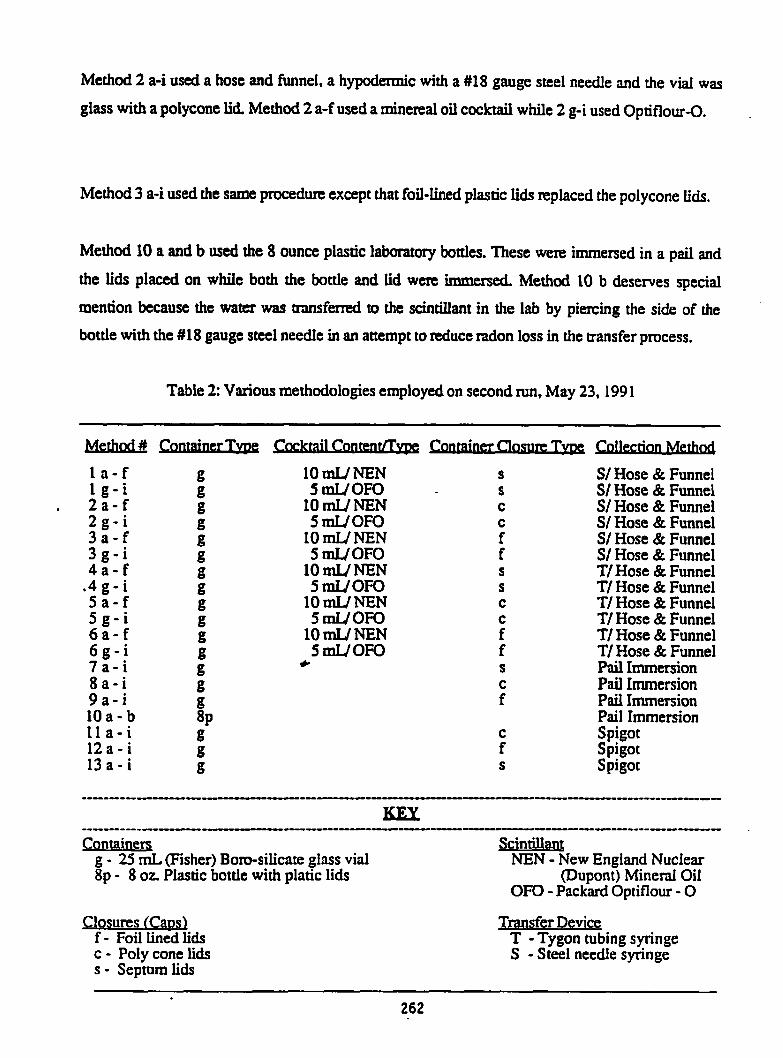
Method 2 a-i used a hose and funnel, a hypodermic with a #18 gauge steel needle and the vial was
glass with a polycone lid. Method 2 a-f used a minereal oil cocktail while 2 g-i used Optiflour-0.
Method 3 a-i used the same procedure except that foil-lined plastic lids replaced the polycone lids.
Method 10 a and b used the 8 ounce plastic laboratory bottles. These were immersed in a pail and
the lids placed on while both the bottle and lid were immersed. Method 10 b deserves special
mention because the water was transferred to the scindllam in the lab by piercing the side of the
bottle with the #18 gauge steel needle in an attempt to reduce radon loss in the transfer process.
Table 2: Various methodologies employed on second run. May 23. 199 1
Method^ l a - f 1 g - i . 2 a - f 2 g - i 3 a - f 3 g - i 4 a - f
. 4 g - i 5 a - f 5 g - i 6 a - f 6 g - i 7 a - i 8 a - i 9 a - i 10a- b l l a - i 1 2 a - i 13a - i
lOmL/NEN s S I Hose & Funnel 5 mL/ OF0 s Sf Hose & Funnel
l O W N E N c S I Hose & Funnel 5 W O F O c Sf Hose & Funnel
10 W NEN f S I Hose & Funnel 5 W O F O f Sf Hose & Funnel
10 W NEN s T/ Hose & Funnel 5mL/OFO s TI Hose & Funnel
10 mU NEN c TI Hose & Funnel 5 mUOF0 c TI Hose & Funnel
10 mU NEN f T/ Hose & Funnel
*Â 5 W O F O f TI Hose & Funnel
s Pail Immersion c Pail Immersion f Pail Immersion
Pail Immersion c Spigot f Spigot s Spigot
Con tainen Scintilla~q g - 25 mL (Fisher) Boro-silicate glass vial NEN - New England Nuclear 8p - 8 oz. Plastic bottle with platic lids (Dupont) Mineral Oil
OF0 - Packard Optiflour - 0
Closures (Cam] f - Foil lined lids c - Poly cone lids s - Septum lids
Transfer Device T - Tygon tubing syringe S - S tee1 needle syringe
RlmlIxs
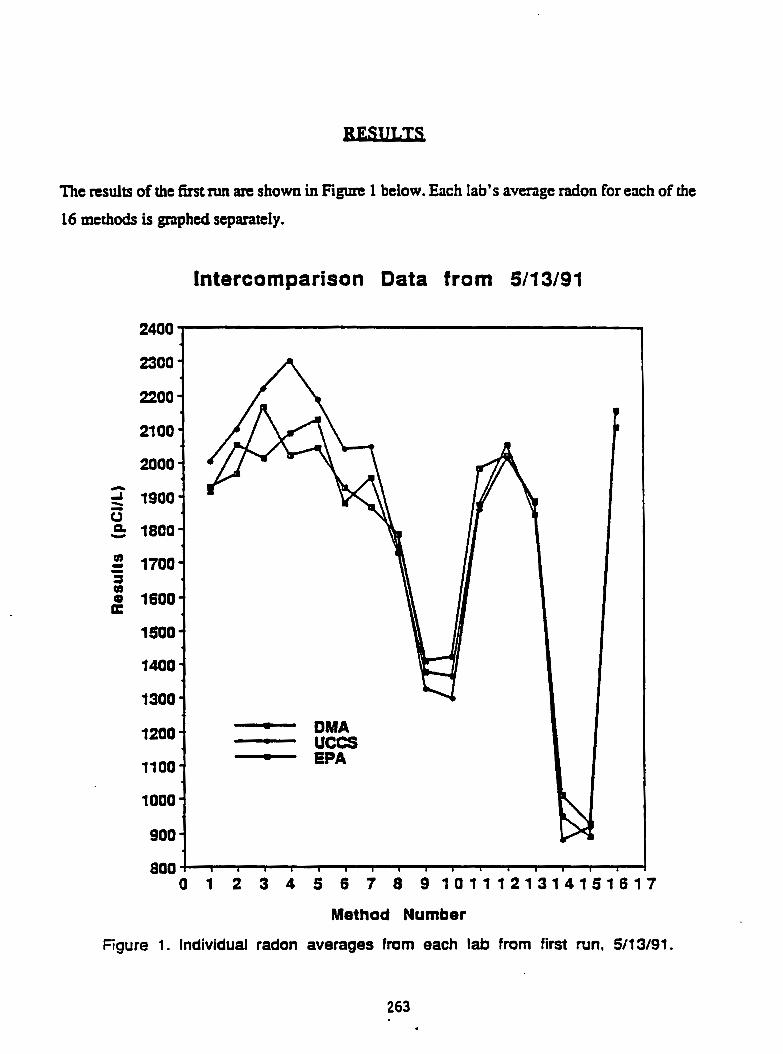
The results of the first run are shown in Figure 1 below. Each lab's average radon for each of the
16 methods is graphed separatciy.
Method Number
Figure 1. Individual radon averages from each lab from first run. 5/13/91.
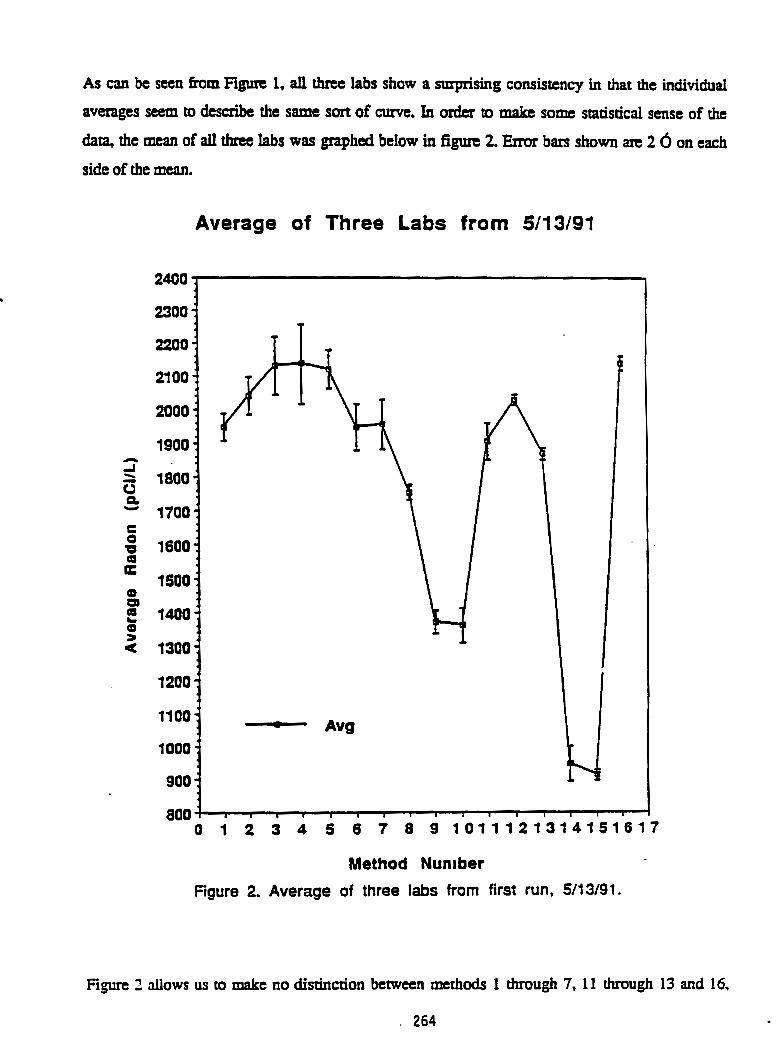
As can be seen from Rgtm 1. all three labs show a surprising consistency in that the individual
averages seem to describe the same sort of curve. In order to makc some statistical sense of the
data, the mean of all three labs was graphed. below in f i g m 2. Error bass shown are 2 6 on each
side of the mean.
Average of Three Labs from 5/13/91
2400 4
Method Number
Figure 2. Average of three labs from first run. 511 3/91.
Figure 2 allows us to make no distinction between methods 1 through 7. 11 through 13 and 16.
. 264
although it would appear that the immersion methods (methods 6,7 and 8) do not do as well as do
the methods which exract the water from the funnel or bucket for immediate injection into the
scintillant (methods 2-5). Also, filling the vial directly from the spigot appears to not give as high
an average radon concentration as do methods 2-5. Clearly, methods 9 and 10, filling 8 ounce
plastic bodes either with a plastic tube attached to the spigot or directly from the spigot itself for
later transfer to the scintillant in the lab, give very poor results. Methods 14 and 15, filling the 25
ml Kimblc plastic vials either from a spigot or immersion in a pail for later transfer to the
scintillam. give the worse results.
Method 16, which is a repeat of method 1, would indicate that the radon concentration at the end of
the test period was near the radon concentration at the beginning of the test period.
Two unanswered questions remained, however. (1) Was the increase in reported radon
concentrations during the period in which the first three maeasurement. were taken a real increase
in the actual radon in the water (caused, for example, by an incomplete flushing of the holding
tank) or were we looking at small variations caused by the different methodologies? (2) Were the
fluctuations in radon concentrations during the test period the result of the effectiveness of the
different methodologies or was the radon concentration of the water actually changing that much
over the few minutes we tested?
We also decided to retest methodology 9 and 10, using the large plastic bottles, only we would
immerse the 8 ounce bottles in a basin and (in one case) extract the water through the side of the
plastic bottle with a needle and syringe instead of opening the top of the bottle. As will be seen
later, the plastic bottle performed poorly regardless of how they were filled or how the water was
extracted from them in the lab.
The second run occurred on May 23, 1991 at the same location. In order to reduce the uncertainty
we had concerning the possible radon fluctuations during the testing period, each method was
employed at three different rime periods with only three samples (one for each lab) being taken
each time. Later, each lab was given three samples of each method, but each one would have been
taken at a different time, with the other methods interspersed between them. Any radon fluctuation
in the water would then show up by biasing many different methods. Such a bias would be seen as
a decrease in precision (because of the wide spread of data points for any one method).
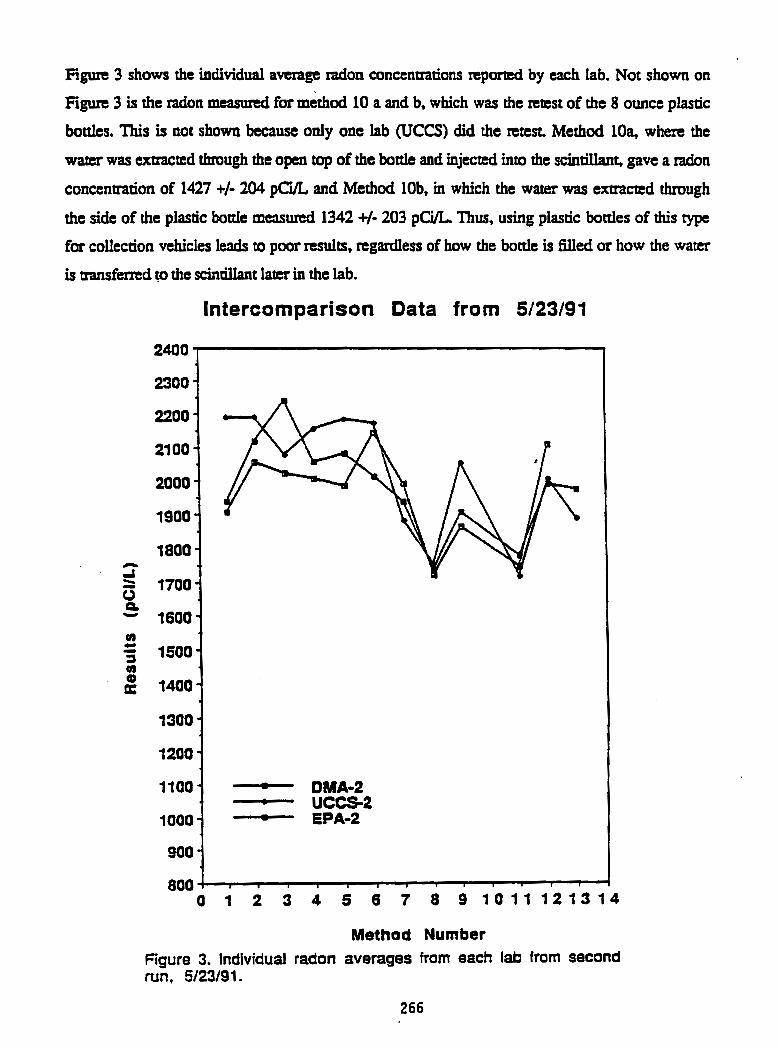
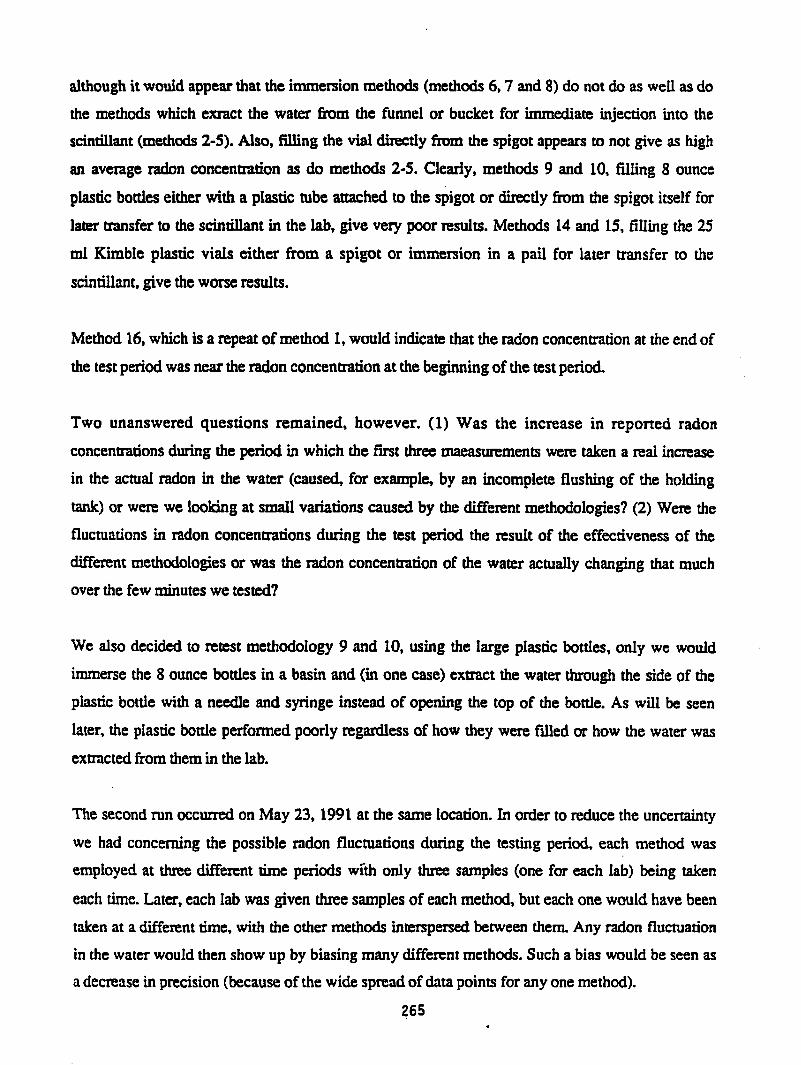
Figure 3 shows the iadividual average radon concenuations m p w d by each Iab. Not shown on - .-
Figure 3 is the radon measured for method 10 a and b, which was the retest of the 8 ounce plastic
bottles. This is not shown because only one lab (UCCS) did the retest. Method 10% where the
water was extracted through the open top of the bottle and injected into the scinollant. gave a radon -
concentration of 1427 +/- 204 p C i i and Method 10b. in which the water was extracted through
the side of the plastic bottle measured 1342 +/- 203 pG/L. Thus, using plastic bottles of this type
fm collection vehicles leads to poor results, r c g ~ e s s of how the bottle is fXed or how the water
is transferred to the scinrillant later in the lab.
Intercomparison Data from 5/23/91
2400 -1
Method Number figure 3. Individual radon averages from each lab from second run. 5/23/91.

Figure 4 gives (he average radon concentration found by combining all of the three labs dam The
26 error bars are shown.
Average of Three Labs from 5/23/91
2400,
800 ! I . . a . v . I I I I I I
0 1 2 3 4 5 8 7 8 9 1 0 1 1 1 2 1 3 1 4
Method Number Figure 4. Average of three labs from second run, 5/23/91
For some of these data points, the spread in data is less than (he disona between the points and
one might infer that the differences in qoned radon concentrations arc now indeed showing a
difference in the effectiveness of the methodologies.
In order to make such inferences, Student-t tests were performed comparing the various
methodologies to method 2, die so-called EPA method. This method performed well in both runs
in that it gave consistently high results with a good precision. The Student-t distribution tests the
significance of the difference between two sample means when the number of samples are small.
Making the assumption that the two samples being compared come from populations that can be
approximated closely with a normal distribution and the assumption that these two populations
have equal standard deviations, the criterion which we use to test the hypothesis that the average of
each of the following methodologies is less than the average of the EPA methodology will be set at
the 97.5 % confidence level requiring a t value of 2.365 or higher (for 9-2, or 7 degrees of
freedom.)
1) There is no difference among the various hose and funnel methods, regardless of the type of lid
used on the vial or whether a steel needle or tygon tubing is used Thus, methods 1 through 6 give
similar results. For example when comparing method 1 to the EPA method (method 2), a t value of
1.389 was calculated.
2) Immersing the vial into a pail and filling with water for later transfer into the scindllant is not as
good a method as method #2 (at the 97.5% confidence level). For example, a t value of 3.21 was
calculated for method 7 (where the glass vial has a septum lid), a t value of 11.79 was calculated
for method 8 (where the glass vial has a poly-cone lid) and a t value of 3.21 was found for the foil
lined lid of method 9. Of the three lids used in the immersion method, the ply-cone lid performed
noticably worse and the foil lined cap noticably better than the average of the three.
3) Although methods 11 and 13, which are filling the glass vial from the spigot using a poly-cone
lid and a septum lid respectively, are not as good as method 2 (with t values of 10.75 and 4.05),
filling from the spigot into a vial which is then covered by a foil lid works as well as does method
2 (with a t value of 1.98.)
Although the t distribution test was never perfbnned on the data from run 1 (because of our
questions concerning its accuracy), it can now be seen that these conclusions using the Student-t
distnibution are confmed qualitatively by examining Figure 2.

The following conclusions were derived as a result of this investigation, and are listed in order of
importance:
No difference was observed in the results of the waterborne radon assay when the
collection of the environmental sample was made by either the funnel or the basin method
in those collection vehicles which contained the liquid scintillant stabilizing fluid
Using the USEPA hose andfunnel method and a stabilizing scintillant, no differences
were observed when injecting the environmental sample under the fluid using various
closure types (Poly-cone lid, septum lid, foil lined lid).
Using the USEPA hose and funnel method, no difference was observed when injecting
the sample under the scindllant fluid using either a steel 18 gauge needle or a flexible
tygon tubing substitute secured to the luer tip of the syringe.
Using statistical t tests, the immersion methodologies without scintillant resulted in
slightly lower results than the USEPA funnel method with injection under the scintillant.
In collection procedures where no scintillant was used, the investigators found a small
difference between the samples using the septum lid and the foil lined plaitic lid.
The investigators found significant radon concentration losses when environmental
samples were capped with poly-cone lids. The radon is believed to have diffused into the
head-space occupied by the cone.
In comparison with the USEPA hose andfunnel method, the spigot methodology
produced noticeably lower results except when in combination with a glass vial and foil
lined cap.
If no scindllant is added to the collection vehicle, under no circumstances is the poly vial
with the poly-cone lid or the standard 802 collection vial appropriate for maintaining
environmental sample integrity.
269
No appreciable difference between the spigot and the immersion methods were found,
except that significant radon concentration losses were determined when implemented in
conceit with poly-cone lids or plastic vials.
The investigators believe that stringent rules for sample collection and preparation need to be
understood andenforced by those involved in radionuclide analysis, but that latitudes must be
available for the experienced technician.
Clearly the most reproducible and consistent method for acquiring an environmental waterborne
radon sample is to quickly introduce the sample to a stabilizing scindllant This technique is
impractical for the commercial radon testing industry because the Federal Consumer Product Safety
Commission forbids the distribution of potentially hazardous chemicals to the general public.
Those chemicals are: tolulenes, mineral oils, flours, and other long-chain alcholbenzenes used in
commercially available scintillation cocktails. Although some latitude is given to universities and
the USEPA, the commercial sector would be prohibited from its use.
The use of plastic vehicles is inappropriate as the radon is hydrophobic, and therefore is attracted to
the first matrix layer of the high-density-poly-ethelene (HDPE) vial and to the head space occupied
by the poly-cone.
Therefore, in light of these restraints and constraints on the commercial industry, the investigators
recommend that the most practical collection method (that is, when the scintillant cannot be sent to
the collection site) may be:
The use of a basin, submerging the vial and cap to assure no air entrainment in concept
with a glass vial and either a septum lid or a foil lined cap.
The use of a hose and funnel method with the same collection devices and closure method
as above.

Lowry, J.D. Measuring Low Radon Levels in Drinking Water Supplies. Research and Technology 149-153: 1991.
Lucas, H.F. A fast and accurate survey technique for both radon-222 and radium-226. In: Adams, J.A.S., and Low&r, W.M. The natural radiation environment; Chicago, IL:
University of Chicago Press: 1964:s 15-329.
NJDEP Laboratory Certification Program: 1991, USEPA Document 52015-83-027.
Mchard, H.M. and Gesell, T.F. Rapid measurements of Rn-222 concentrations in water with a commercial liquid scintillation counter. Health Phys. 33577-581: 1977.
Vitz, E. Toward a Standard Method for Determining Waterborne Radon. Health Phys. 60:817- 829: 1991.