Embed Size (px)
DESCRIPTION
Corn Situation and Outlook. Historical Perspective and Outlook for 2005. Corn Production, Ending Stocks, and Price, 1992-2005. U.S. Corn Ending Stocks and Price, 1992-2005. U.S. & Foreign Corn Ending Stocks 1996-2004. Supply/Demand Projections:2005/2006. - PowerPoint PPT Presentation
Citation preview
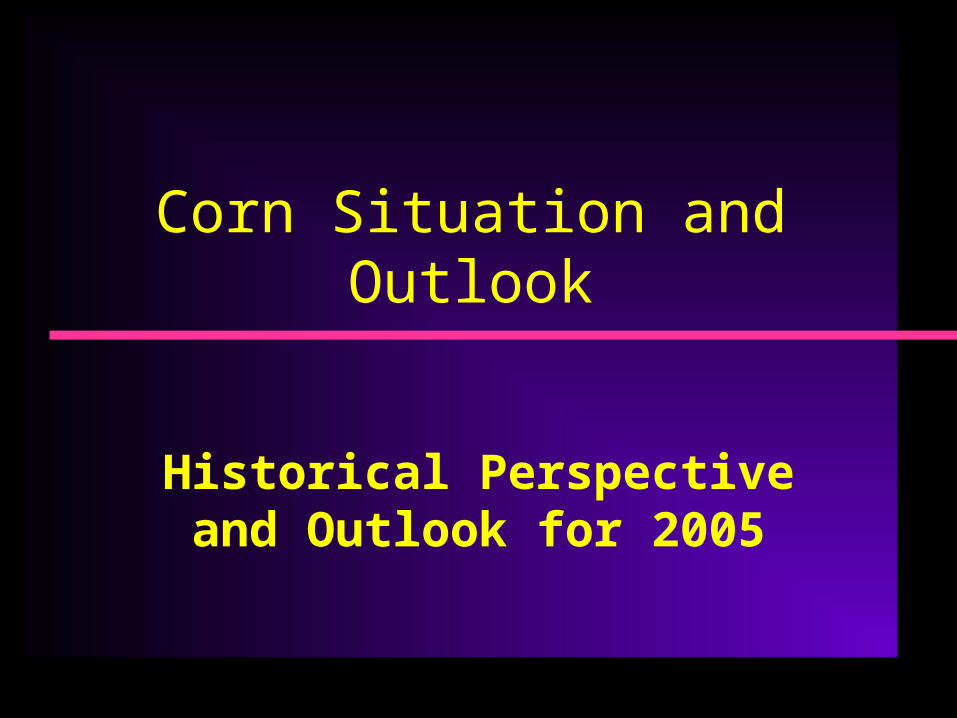
Corn Situation and Outlook
Historical Perspective and Outlook for 2005
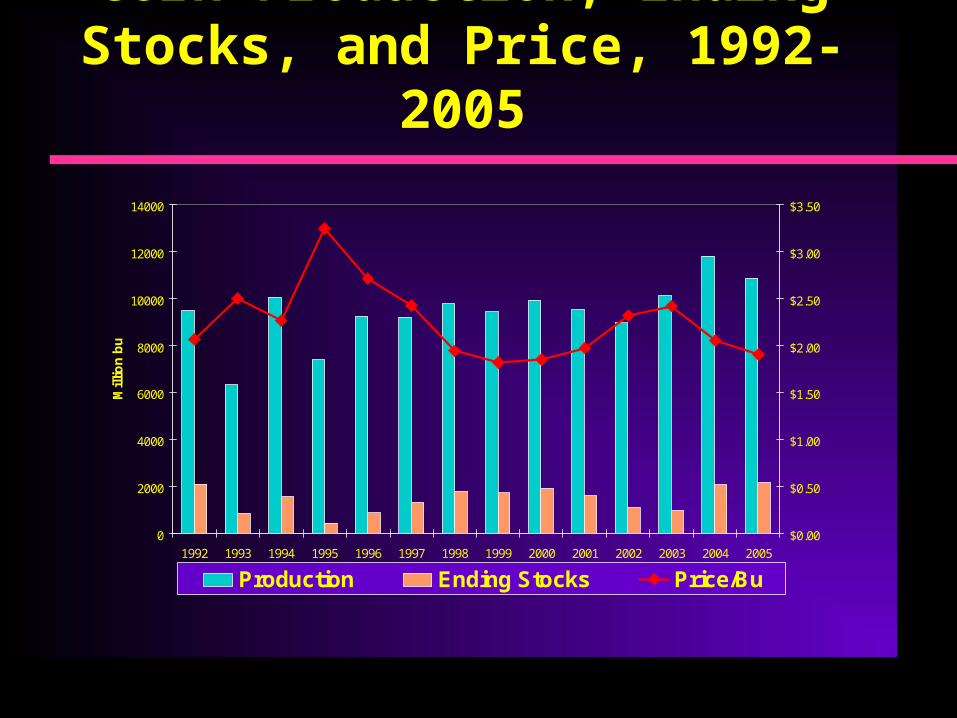
Corn Production, Ending Stocks, and Price, 1992-2005
0
2000
4000
6000
8000
10000
12000
14000
1992 1993 1994 1995 1996 1997 1998 1999 2000 2001 2002 2003 2004 2005
Mill
ion
bu
$0.00
$0.50
$1.00
$1.50
$2.00
$2.50
$3.00
$3.50
Production Ending Stocks Price/Bu

U.S. Corn Ending Stocks and Price, 1992-2005
0
500
1000
1500
2000
2500
1992 1993 1994 1995 1996 1997 1998 1999 2000 2001 2002 2003 2004 2005
Mill
ion
bu
$1.50
$1.70
$1.90
$2.10
$2.30
$2.50
$2.70
$2.90
$3.10
$3.30
$3.50
Ending Stocks Price/Bu
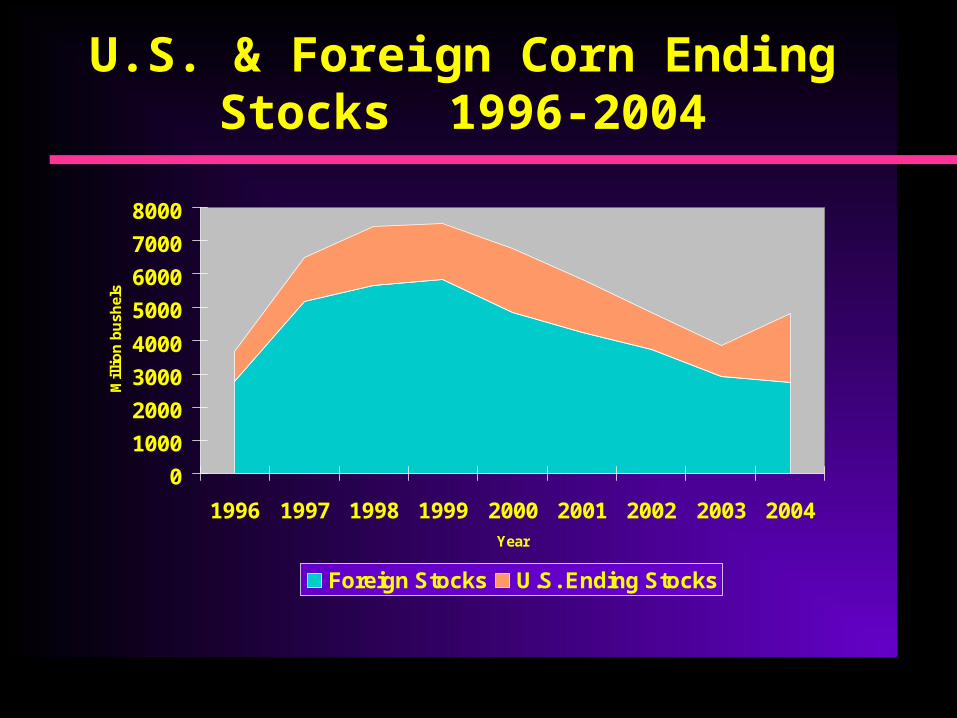
U.S. & Foreign Corn Ending Stocks 1996-2004
010002000300040005000600070008000
1996 1997 1998 1999 2000 2001 2002 2003 2004Year
Mill
ion
bush
els
Foreign Stocks U.S. Ending Stocks
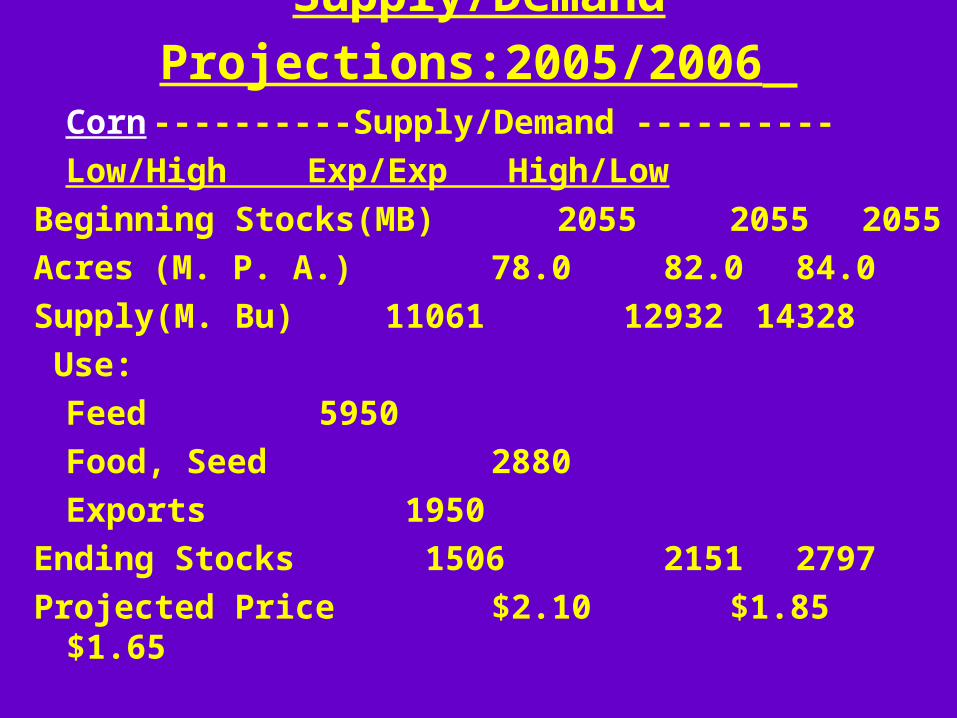
Supply/Demand Projections:2005/2006 Corn ----------Supply/Demand ----------Low/High Exp/Exp High/Low
Beginning Stocks(MB) 2055 2055 2055Acres (M. P. A.) 78.0 82.0 84.0Supply(M. Bu) 11061 12932 14328 Use:
Feed 5950 Food, Seed 2880 Exports 1950
Ending Stocks 1506 2151 2797Projected Price $2.10 $1.85 $1.65
Wheat Situation and Outlook
Historical Perspective and Outlook for 2005

Wheat Production, Ending Stocks, and Price, 1993-2005
0
500
1000
1500
2000
2500
3000
1993 1994 1995 1996 1997 1998 1999 2000 2001 2002 2003 2004 2005
Mill
ion
Bu
$0.00
$0.50
$1.00
$1.50
$2.00
$2.50
$3.00
$3.50
$4.00
$4.50
$5.00
Production Ending Stocks Price/Bu

U.S. Wheat Ending Stocks and Price, 1993-2005
0
200
400
600
800
1000
1993 1994 1995 1996 1997 1998 1999 2000 2001 2002 2003 2004 2005
Mill
ion
Bu
$2.00
$2.50
$3.00
$3.50
$4.00
$4.50
$5.00
Ending Stocks Price/Bu
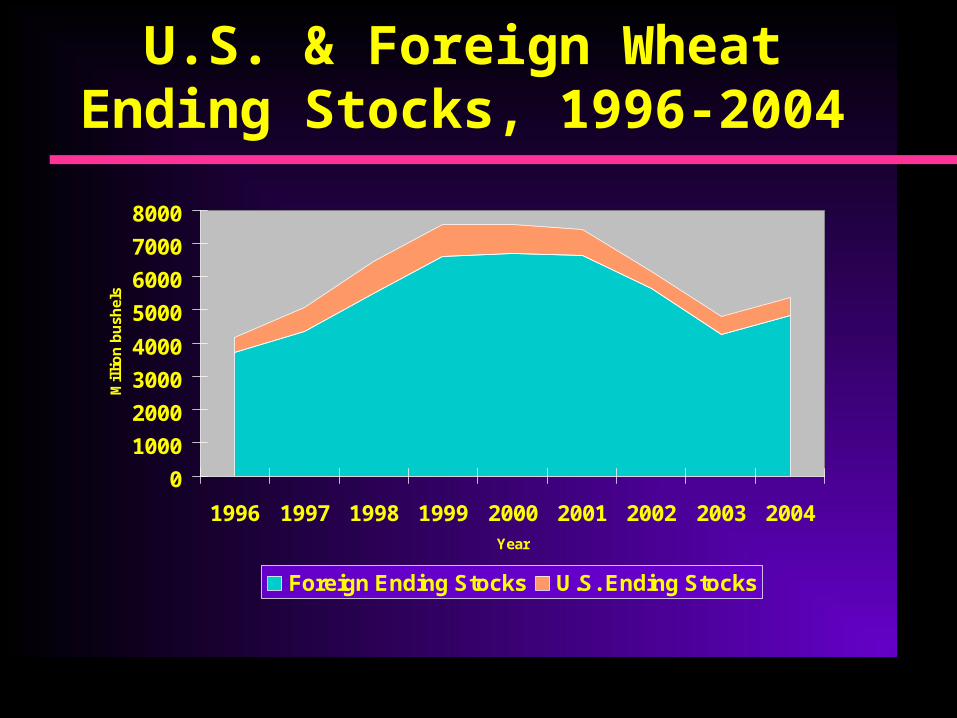
U.S. & Foreign Wheat Ending Stocks, 1996-2004
010002000300040005000600070008000
1996 1997 1998 1999 2000 2001 2002 2003 2004Year
Mill
ion
bush
els
Foreign Ending Stocks U.S. Ending Stocks
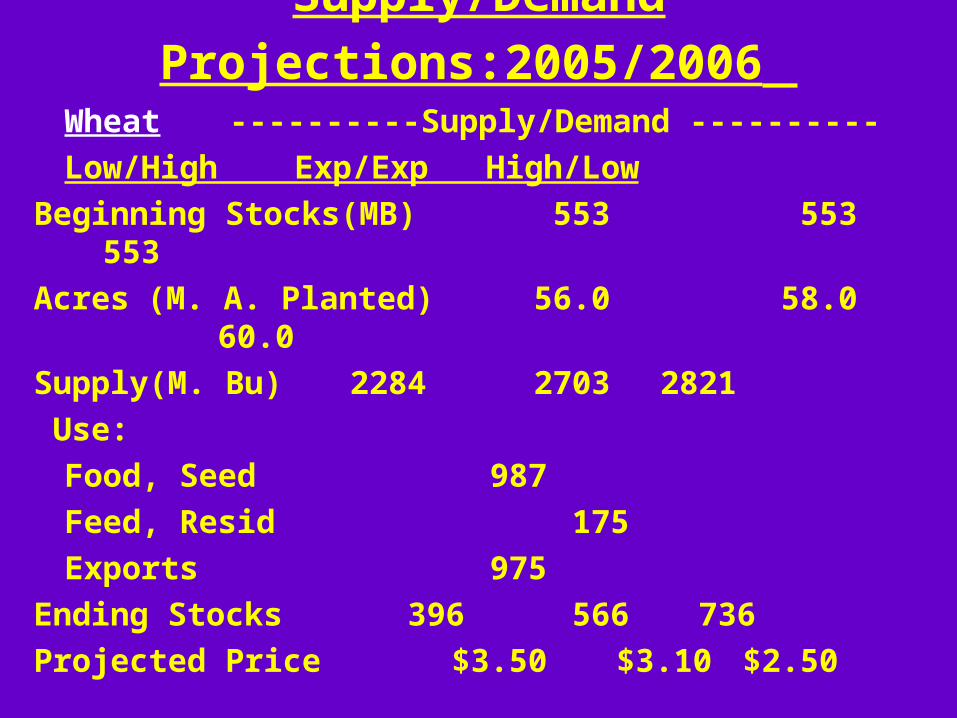
Supply/Demand Projections:2005/2006 Wheat ----------Supply/Demand ----------Low/High Exp/Exp High/Low
Beginning Stocks(MB) 553 553 553Acres (M. A. Planted) 56.0 58.0 60.0Supply(M. Bu) 2284 2703 2821 Use:
Food, Seed 987 Feed, Resid 175 Exports 975
Ending Stocks 396 566 736Projected Price $3.50 $3.10 $2.50

Soybean Situation and Outlook
Historical Perspective and Outlook for 2005

Soybean Production, Ending Stocks, and Price, 1993-2005
0
500
1000
1500
2000
2500
3000
3500
1993 1994 1995 1996 1997 1998 1999 2000 2001 2002 2003 2004 2005
Mill
ion
Bu
$0.00
$1.00
$2.00
$3.00
$4.00
$5.00
$6.00
$7.00
$8.00
Production Ending Stocks Price/Bu

U.S. Soybean Ending Stocks and Price, 1993-2005
0
50
100
150
200
250
300
350
400
450
1993 1994 1995 1996 1997 1998 1999 2000 2001 2002 2003 2004 2005
Mill
ion
Bu
$4.00
$4.50
$5.00
$5.50
$6.00
$6.50
$7.00
$7.50
$8.00
Ending Stocks Price/Bu

U.S. & Foreign Soybean Ending Stocks, 1996-2004
0
500
1000
1500
2000
2500
1996 1997 1998 1999 2000 2001 2002 2003 2004Year
Mill
ion
Bus
hels
Foreign Ending Stocks U.S. Ending Stocks

U.S. & Foreign Soybean Meal Ending Stocks, 1997-2004
0
1
2
3
4
5
6
1998 1999 2000 2001 2002 2003 2004Year
Mill
ion
Met
ric T
ons
Foreign Ending Stocks U.S. Ending Stocks

U.S. & Foreign Soybean Oil Ending Stocks, 1997-2004
011223344
1998 1999 2000 2001 2002 2003 2004Year
Mill
ion
Met
ric T
ons
Foreign Ending Stocks U.S. Ending Stocks

Supply/Demand Projections:2005/2006 Soybeans ----------Supply/Demand ----------Low/High Exp/Exp High/Low
Beginning Stocks(MB) 410 410 410Acres (M. P. A.) 71.0 73.0 75.0Supply(M. Bu) 2777 3283 3544 Use:
Crushing 1695 Exports 1060 Seed, Feed 148
Ending Stocks 266 380 494Projected Price $5.90 $4.80 $4.10
Grain Sorghum Situation and Outlook
Historical Perspective and Outlook for 2005
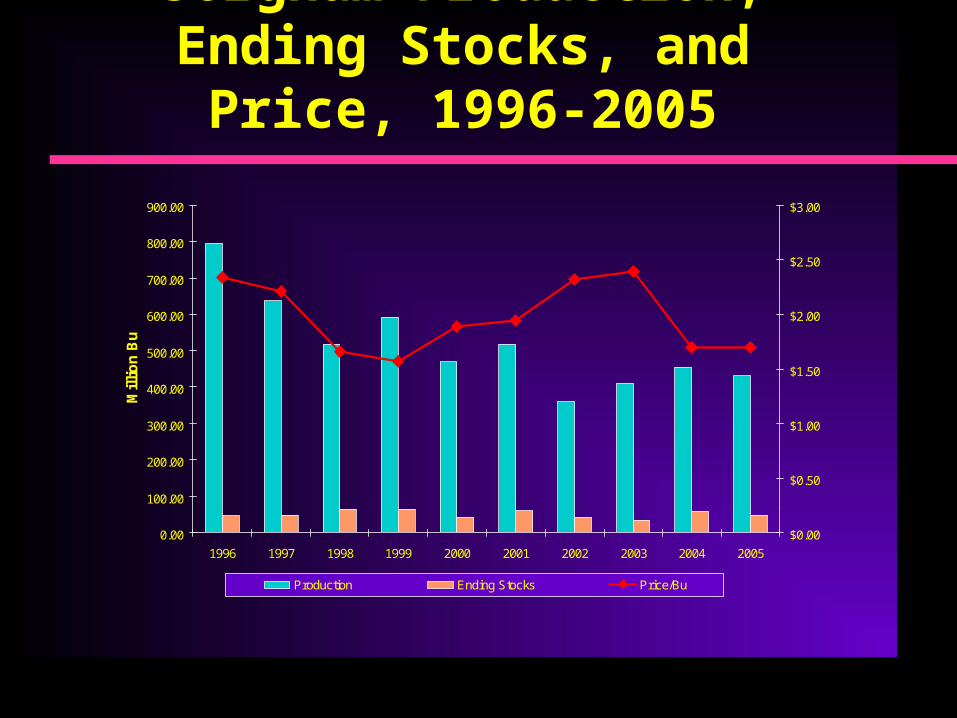
Sorghum Production, Ending Stocks, and Price, 1996-2005
0.00
100.00
200.00
300.00
400.00
500.00
600.00
700.00
800.00
900.00
1996 1997 1998 1999 2000 2001 2002 2003 2004 2005
Mill
ion
Bu
$0.00
$0.50
$1.00
$1.50
$2.00
$2.50
$3.00
Production Ending Stocks Price/Bu

U.S. Sorghum Ending Stocks and Price, 1996-2005
0.00
10.00
20.00
30.00
40.00
50.00
60.00
70.00
1996 1997 1998 1999 2000 2001 2002 2003 2004 2005
Mill
ion
Bu
$1.50
$1.75
$2.00
$2.25
$2.50
$2.75
$3.00
Ending Stocks Price/Bu

Supply/Demand Projections:2004/2005Sorghum ----------Supply/Demand ----------Low/High Exp/Exp High/Low
Beginning Stocks(MB) 58.0 58.0 58.0Acres (M. P. A.) 7.0 8.0 9.0Supply(M. Bu) 391.0 479.0 591.0 Use:
Food & Seed 50 Exports 175 Feed 205
Ending Stocks 32.0 49.0 66.5Projected Price $2.10 $1.90 $1.80
Cotton Situation and Outlook
Historical Perspective and Outlook for 2005
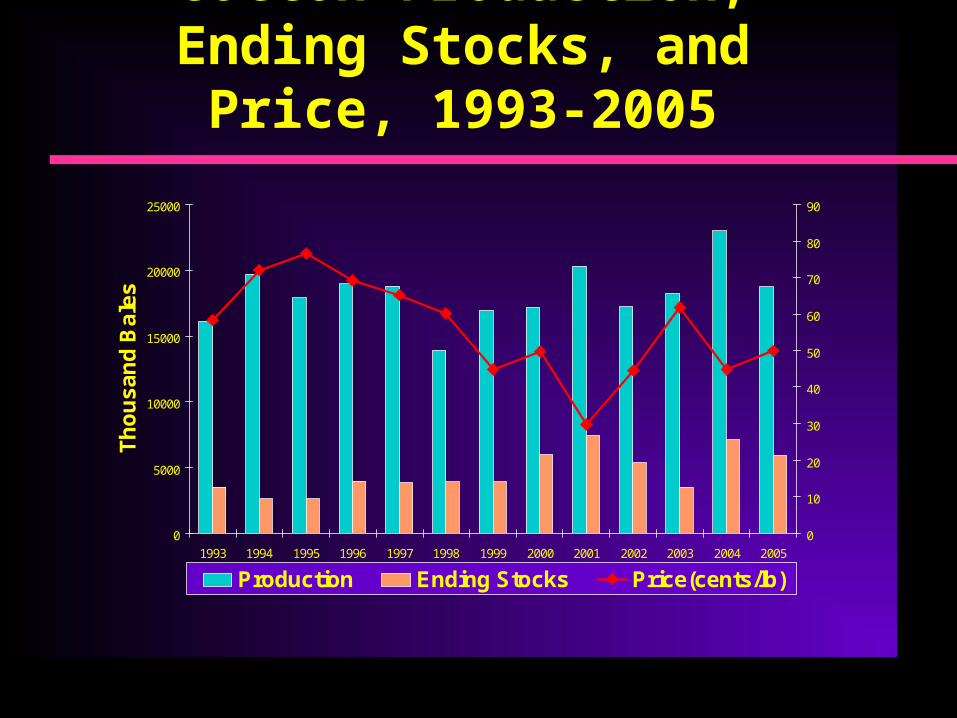
Cotton Production, Ending Stocks, and Price, 1993-2005
0
5000
10000
15000
20000
25000
1993 1994 1995 1996 1997 1998 1999 2000 2001 2002 2003 2004 2005
Thou
sand
Bal
es
0
10
20
30
40
50
60
70
80
90
Production Ending Stocks Price(cents/lb)
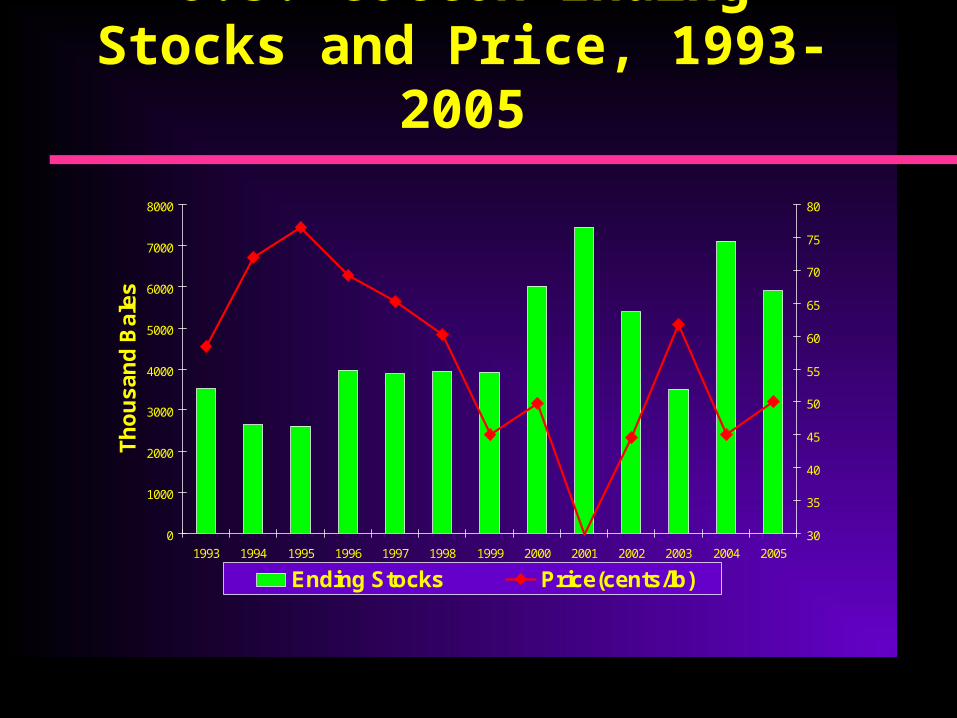
U.S. Cotton Ending Stocks and Price, 1993-2005
0
1000
2000
3000
4000
5000
6000
7000
8000
1993 1994 1995 1996 1997 1998 1999 2000 2001 2002 2003 2004 2005
Thou
sand
Bal
es
30
35
40
45
50
55
60
65
70
75
80
Ending Stocks Price(cents/lb)
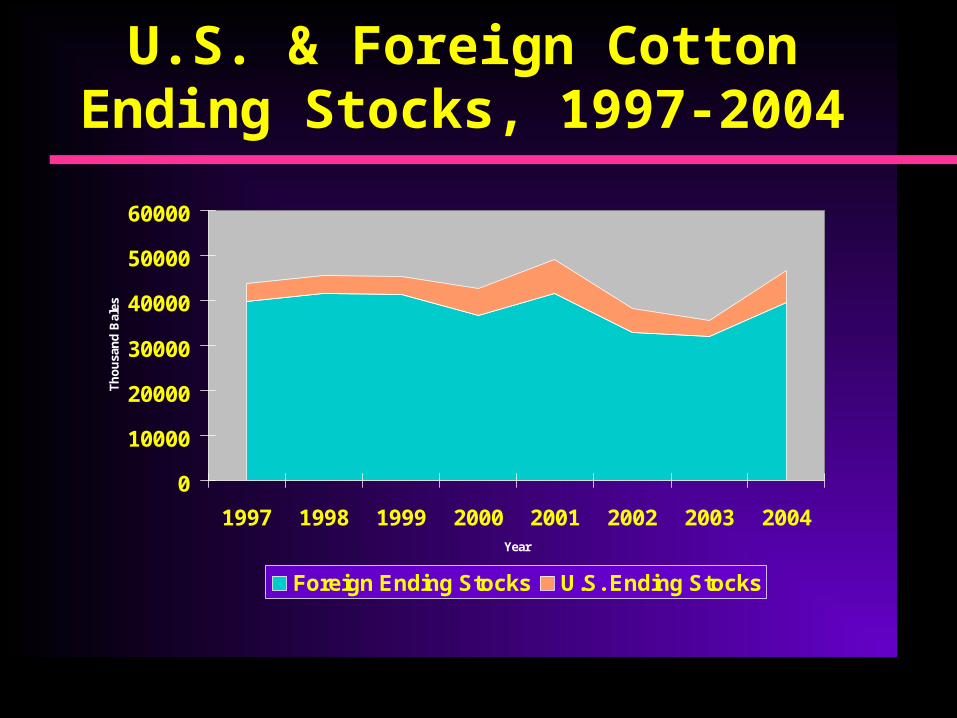
U.S. & Foreign Cotton Ending Stocks, 1997-2004
0
10000
20000
30000
40000
50000
60000
1997 1998 1999 2000 2001 2002 2003 2004Year
Thou
sand
Bal
es
Foreign Ending Stocks U.S. Ending Stocks
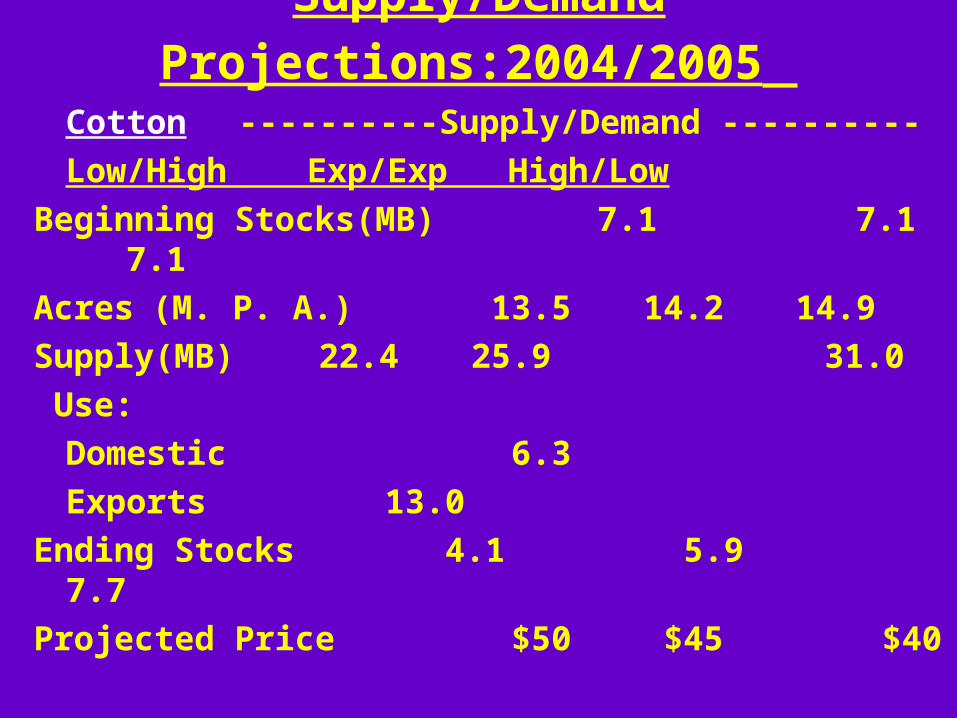
Supply/Demand Projections:2004/2005 Cotton ----------Supply/Demand ----------Low/High Exp/Exp High/Low
Beginning Stocks(MB) 7.1 7.1 7.1Acres (M. P. A.) 13.5 14.2 14.9 Supply(MB) 22.4 25.9 31.0 Use:
Domestic 6.3 Exports 13.0
Ending Stocks 4.1 5.9 7.7Projected Price $50 $45 $40
What Could Change The Outlook?
South America Plant Mix Non-Farm Economic Conditions in U.S.,
World – Oil Supplies, War Exchange Rates China Weather