Embed Size (px)
Citation preview

Corn Seeding Densities and Transgenic Traits:Economics and Farmer Behavior
Paul D. MitchellAg & Applied Economics, UW-Madison
Wisconsin Crop Management ConferenceJanuary 12-14, 2010

Corn Yields Continue to Increase
0
20
40
60
80
100
120
140
160
180
1865 1875 1885 1895 1905 1915 1925 1935 1945 1955 1965 1975 1985 1995 2005
Year
Ave
rag
e Y
ield
(b
u/a
c)
US
WI

2009 Had Record Corn Yields
Even with weird 2009 weather
WI corn yield a record of 153 bu/ac
US corn yield a record of 165.2 bu/ac
Caused the recent price drops on CBOT
80
90
100
110
120
130
140
150
160
170
1990 1992 1994 1996 1998 2000 2002 2004 2006 2008 2010
Year
Ave
rag
e Y
ield
(b
u/a
c)
WI
US

Corn Yields Continue to Increase
Genetics has been a major source of corn yield growth over the years Improved management also important
Breeding for better performance under higher planting densities is part of this
Hybrid turnover is faster than ever before 7-8 years used to be typical, now 3-4 years
New transgenic traits are part of this yield increase (CB-Bt, RW Bt, RR Corn, Stacks)

% Acres Planted in Transgenic % Acres Planted in Transgenic Varieties 2000-2009Varieties 2000-2009
0
10
20
30
40
50
60
70
80
90
100
2000 2002 2004 2006 2008 2010
Year
% P
lan
ted
Acr
es
WI Soy
WI Corn
US Soy
US Corn
Source: http://www.ers.usda.gov/data/biotechcrops/Source: http://www.ers.usda.gov/data/biotechcrops/

Corn Seed Prices Have Also Increased
0.00
20.00
40.00
60.00
80.00
100.00
120.00
2000 2002 2004 2006 2008 2010
Year
See
d C
ost
($/
ac)
IA
N IL
Source: State University Cost of Production Budgets

Corn Seeding Densities: Questions Addressed Today Corn Seeding Densities
Quick review of recommendations Look at farmer survey data
What seeding densities have WI and Midwestern farmers actually been using?
What about the new transgenic traits? Do corn and seed corn prices affect
seeding densities?

Popular Farm Press
“Plant More Corn Per Acre” (Successful Farming)
http://www.agriculture.com/ag/story.jhtml?storyid=/templatedata/ag/story/data/1174493858157.xml
Interview and quote many Corn Belt agronomist, including Joe Lauer
Extension agronomists believe that optimal stand count in Corn Belt is 28,000-32,000
State averages are lower for almost all states
Corn Stand CountsIncreasing, but still not high enough
22000
23000
24000
25000
26000
27000
28000
29000
IL IN IA OH
Ave
rag
e P
lan
t P
op
ula
tio
n
2002
2006
Source: “Plant more corn per acre” based on USDA-NASS data

WI Recommendations
Lauer and Stanger (2008) “Guidelines for Managing Corn Seed Costs”
http://corn.agronomy.wisc.edu/AA/pdfs/A044.pdf Lauer (2009) “Getting a Handle on Corn Seed Costs”
http://corn.agronomy.wisc.edu/AA/pdfs/A073.pdf Data from field trials to develop decision aid similar to
new Nitrogen Recommendations Optimal seeding density depends on the ratio of seed
corn price to corn price Corn Borer Bt and conventional corn have different
optimal planting densities

Lauer and Stanger: Lauer and Stanger: http://corn.agronomy.wisc.edu/AA/pdfs/A044.pdf

Lauer and Stanger: Lauer and Stanger: http://corn.agronomy.wisc.edu/AA/pdfs/A044.pdf

Seed Price ----------------------------------- Corn Price ($/bu) -----------------------------------
$/80Kbag
$/1Kseeds
$1.00 $1.75 $2.50 $3.25 $4.00 $4.75 $5.50 $6.25 $7.00
$40 $0.50 0.50 0.29 0.20 0.15 0.13 0.11 0.09 0.08 0.07
$80 $1.00 1.00 0.57 0.40 0.31 0.25 0.21 0.18 0.16 0.14
$120 $1.50 1.50 0.86 0.60 0.46 0.38 0.32 0.27 0.24 0.21
$160 $2.00 2.00 1.14 0.80 0.62 0.50 0.42 0.36 0.32 0.29
$200 $2.50 2.50 1.43 1.00 0.77 0.63 0.53 0.45 0.40 0.36
$240 $3.00 3.00 1.71 1.20 0.92 0.75 0.63 0.55 0.48 0.43
$280 $3.50 3.50 2.00 1.40 1.08 0.88 0.74 0.64 0.56 0.50
$320 $4.00 4.00 2.29 1.60 1.23 1.00 0.84 0.73 0.64 0.57
$360 $4.50 4.50 2.57 1.80 1.38 1.13 0.95 0.82 0.72 0.64
$400 $5.00 5.00 2.86 2.00 1.54 1.25 1.05 0.91 0.80 0.71
Lauer: Lauer: http://corn.agronomy.wisc.edu/AA/pdfs/A073.pdf
Seed Price to Corn Price Ratio
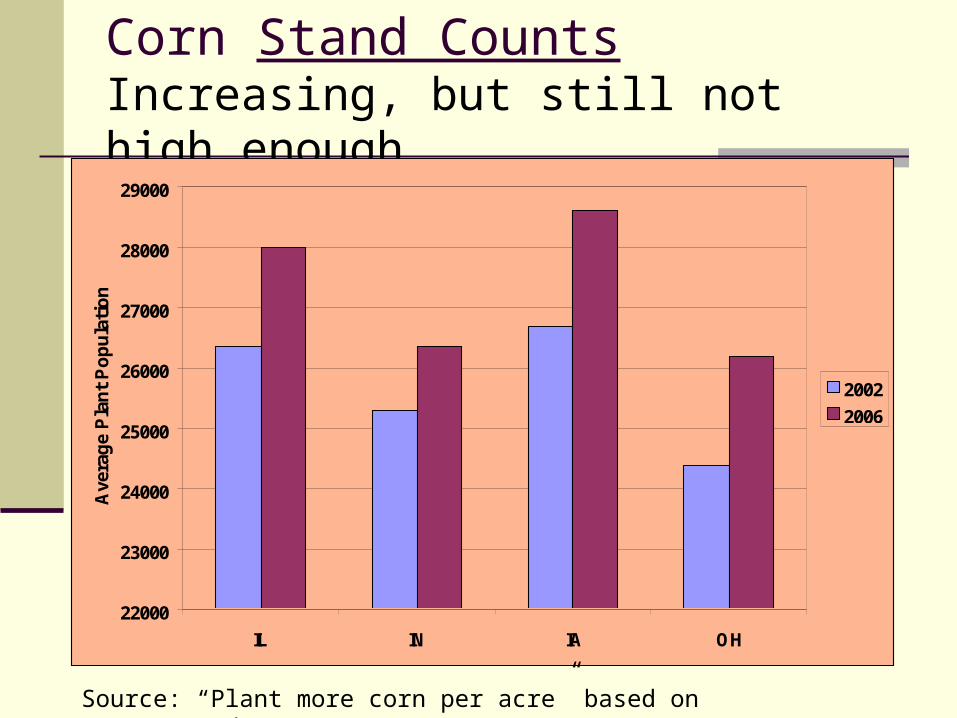
Pioneer’s Planting Rate Calculator
http://www.pioneer.com/web/site/portal/menuitem.0cbb3257343891dc86738673d10093a0/
Decision aid for farmers to help them choose seeding density for specific hybrids they plant
Enter seed and corn price, hybrid and yield environment, gives planting density using same method as Lauer Pioneer 36V53 (HX1,LL,RR2), $275/bag,
$3.50/bu, high yield environment (> 190 bu/ac) Recommends: 36,952 seeds per acre
Other companies have similar tools/guides

Main Point
Lots of news articles, company and university research, extension literature, decision aids, etc. saying that farmers should be planting corn at higher seeding densities than they used to use
What are farmers actually doing?

What have farmers actually been doing?
Annual telephone survey 2000 to 2007 of US corn farmers by Doane’s Market Research
Several thousand farmers each year, extensive questions on seed corn purchases Focus on the 12 North Central States: IL, IN,
IA, KS, MI, MN, MO, NE, ND, OH, SD, WI 29,770 farmers (2,071 WI), 57,762 purchases
Can construct corn seeding density and cost per acre for each trait purchased
Data use restrictions: no company specific information, so only report general types

Planting Density by Year and State(average across traits)
22,000
23,000
24,000
25,000
26,000
27,000
28,000
29,000
30,000
31,000
32,000
2000 2001 2002 2003 2004 2005 2006 2007
Ave
rag
e D
esn
ity
IL
IN
IA
KS
MI
MN
MO
NE
ND
OH
SD
WI
Annual upward trend
Strong latitude and longitude effect

Transgenic Trait Combinations
Conventional Single Stacks
Bt-CB, Bt RW, HT single Double Stacks
CB/RW, CB/HT, RW/HT and HT/HT Dropped HT/HT—not enough data
Triple Stacks CB/RW/HT, CB/HT/HT and RW/HT/HT
Dropped RW/HT/HT—not enough data Quadruple Stacks
CB/RW/HT/HT: Dropped—not enough data

Seeding Density by Trait: Midwest vs. WI(average across years)
WI above regional average (latitude effect)
Densities vary by transgenic trait
26,500
27,000
27,500
28,000
28,500
29,000
29,500
30,000
30,500
31,000
31,500
Conv CB RW HT CB/RW CB/HT RW/HT CB/RW/HT CB/HT/HT
Trait
See
din
g D
ensi
ty
All
WI

Trait Density HT Effect CB Effect RW Effect
Conv 28,479
CB 28,951 472
RW 29,676 1,197
HT 28,394 -85
CB/RW 30,389 713 1,438
CB/HT 29,056 105 662
RW/HT 30,293 618 1,899
CB/RW/HT 30,277 -112 -17 1,220
CB/HT/HT 29,035 -21 641
Average 101 494 1439
Trait Effect on Planting DensityAll Observations

Trait Density HT Effect CB Effect RW Effect
Conv 29,374
CB 30,043 669
RW 30,742 1,368
HT 29,514 140
CB/RW 31,123 381 1,080
CB/HT 30,533 490 1,018
RW/HT 30,972 231 1,458
CB/RW/HT 31,191 68 219 659
CB/HT/HT 31,218 685 1,703
Average 323 798 1141
Trait Effect on Planting DensityWI Observations only

Trait Effect on Planting Density
-500
0
500
1,000
1,500
2,000
HT Effect CB Effect RW Effect
Ch
ang
e in
See
din
g D
ensi
ty
All
WI

Trait Effect Summary
HT Effect Larger and more consistently positive effect in
WI than other states CB-Bt Effect
Larger and more variable effect in WI than in other states
RW-Bt Effect Smaller positive effect in WI than other states
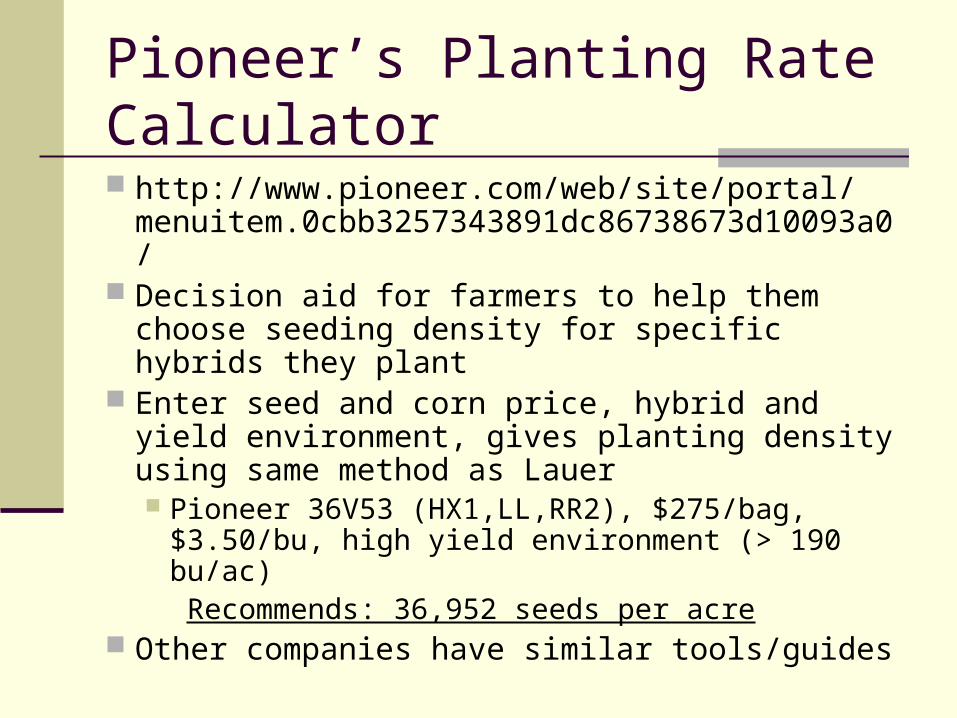
Problem: Averages over years and traits Miss annual changes, miss variation
Trait Effect over Years (all observations, main traits only)
27,000
27,500
28,000
28,500
29,000
29,500
30,000
30,500
2000 2001 2002 2003 2004 2005 2006 2007
Conv
CB
RW
HT
CB HT

Trait Effect vs. Conventional over Years
-1000
-500
0
500
1000
1500
2000
2500
2000 2001 2002 2003 2004 2005 2006 2007
Den
sity
Eff
ect HT All
CB All
RW All
HT WI
CB WI
RW WI

Trait Effect vs. Conventional over Years
WI follows regional trend, but “noisier” HT generally negative: farmers plant at lower
densities than conventional seed RW effect larger than CB effect All three generally trend downward
CB effect almost zero in 2007 (< 0 in WI) Price effects: traits getting too expensive? Conventional corn densities increasing?

Substantial Variation Among FarmersConventional and CB Bt Corn in WI in 2007
0%
5%
10%
15%
20%
25%
20,000 22,000 24,000 26,000 28,000 30,000 32,000 34,000 36,000
Conv
CB Bt
32,000 most common, then 30,000 and 34,000
Some go a little higher, many go lower, especially CB Bt

Economic Analysis
Examine factors affecting the CB trait effect Detailed economic model, work in progress
Farmers with incentives to use/seek more information tend to use higher densities Larger size, higher yielding county, more
specialized in a specific crop, use more GM, buy from Big 4 seed company, non-livestock grower, buy seed from self or other farmer
Prices matter too Higher seed prices, fewer seeds per acre Substitute between conventional and Bt corn

Variable Conventional Bt Corn
Seed Price: Conventional 0.078*** 0.929***
Seed Price: Bt Corn 0.106*** -0.128
Year -0.001-
0.311***
Total Farm Corn Acres 0.043*** 0.149***
Farm Corn Acres % GM -0.417*** 0.811***
Market Concentration 0.006 -0.016
Big 4 Acre Share -0.026-
0.688***
County Latitude 0.650*** 1.754***
County Longitude -0.381**-
5.816***
County Average Yield 0.404*** 1.693***
County Yield CV 0.010 0.134**
County Crop Diversity -0.092***-
0.668***
Elasticity Estimates

Variable Conventional Bt Corn
Purchased from Big 4 15.7%*** 35.5%***
Source: Self as Dealer 6.1%*** 9.4%***
Source: Seed Company 2.1%*** 8.5%***
Source: Other Farmer 2.5%*** 9.0%***
Use: Corn Gluten Plant 6.3% 5.4%
Use: Grain/Silage -6.2%*** -6.1%**
Use: Elevator 0.6% -13.4%***
Use: Ethanol Plant -2.1% -11.3%***
Use: Export 0.4% 6.4%
Use: Feed Mill -5.2%*** -7.8%**
Use: Grain: Livestock -2.8%* 0.8%
Use: Grain: Other -0.8% 7.7%***
Use: Multiple -3.1% -11.7%***
Use: Silage -2.4% -0.7%
% Change in Seeding Density

Summary
What seeding densities have WI and Midwestern farmers actually been using? MW: 27,500-29,000 WI: 29,000-31,000 Increasing each year, now 32,000 most common
What about the new transgenic traits? Bt planted at higher densities (especially RW),
but effect getting smaller (especially CB) HT planted at lower densities
Do corn and seed prices affect densities? Yes, may explain recent shifts Other factors matter too: Information effects

Recommendations
Look at company literature and local research to help determine recommended seeding densities
Optimal density responds to price of corn and seed, use decisions aids and common sense
Conduct own on-farm experiments If aids, experts, etc. all say higher densities than
typically use, try different densities Higher for CB Bt and RW Bt, but not HT Higher where more protected from winds After harvest, analyze yield data and see if
higher densities paid off

Questions?
Paul D. Mitchell
UW-Madison Ag & Applied Economics
Office: (608) 265-6514
Cell: (608) 320-1162
Email: [email protected]
Extension Web Page:
www.aae.wisc.edu/mitchell/extension.htm