Embed Size (px)
Citation preview
Coriolis Ocean database for ReAnalysis
CORA3.4 Product User Manual
Version 1.0
R&D Coriolis Team
February 11, 2013
IFREMER - Pointe du Diable -29280 Plouzané - web: www.coriolis.eu.org/Science/Data-and-Products
Contents
1 Dataset overview 11.1 History of the dataset . . . . . . . . . . . . . . . . . . . . . . . . . . . . . . . . . . . . 1
1.1.1 Previous versions of CORA . . . . . . . . . . . . . . . . . . . . . . . . . . . . . 11.1.2 Main changes for the CORA3.4 version . . . . . . . . . . . . . . . . . . . . . . 2
1.2 Data sources . . . . . . . . . . . . . . . . . . . . . . . . . . . . . . . . . . . . . . . . . 21.3 Organisation of the dataset . . . . . . . . . . . . . . . . . . . . . . . . . . . . . . . . . . 2
1.3.1 Files formats - structure . . . . . . . . . . . . . . . . . . . . . . . . . . . . . . . 21.3.2 Type of files and data type . . . . . . . . . . . . . . . . . . . . . . . . . . . . . . 31.3.3 The Index files . . . . . . . . . . . . . . . . . . . . . . . . . . . . . . . . . . . . 4
2 Data quality 52.1 Quality flags . . . . . . . . . . . . . . . . . . . . . . . . . . . . . . . . . . . . . . . . . 52.2 Adjusted parameter versus parameter . . . . . . . . . . . . . . . . . . . . . . . . . . . . 62.3 Data processing . . . . . . . . . . . . . . . . . . . . . . . . . . . . . . . . . . . . . . . 6
2.3.1 Climatological test . . . . . . . . . . . . . . . . . . . . . . . . . . . . . . . . . . 62.3.2 Check of duplicates profiles . . . . . . . . . . . . . . . . . . . . . . . . . . . . . 82.3.3 XBT bias correction . . . . . . . . . . . . . . . . . . . . . . . . . . . . . . . . . 82.3.4 Feebacks from model assimilation . . . . . . . . . . . . . . . . . . . . . . . . . 92.3.5 Non monotonic pressures . . . . . . . . . . . . . . . . . . . . . . . . . . . . . . 92.3.6 Duplicate pressure-depth . . . . . . . . . . . . . . . . . . . . . . . . . . . . . . 92.3.7 Global consistancy checked with Objective analysis tool . . . . . . . . . . . . . . 9
3 Data coverage 13
A Tables 19
i

CHAPTER 1
Dataset overview
CORA3.4 dataset is a product of MyOcean2 FP7 project. It stands for the historical globaldataset of MyOcean2V3. This document is a Product User Manual, it aims to describe thecontent of the dataset and how to use it properly. Some of the validation steps refer to the article[Cabanes et al.(2013)Cabanes, Grouazel, von Schuckmann, Hamon, Turpin, Coatanoan, Paris, Guinehut, Boone, Ferry, de Boyer Montégut, Carval, Reverdin, Pouliquen, and Le Traon].
1.1 History of the dataset
The program Coriolis has been setup at Ifremer at the beginning of the 2000’s in the wake of the devel-opment of operational oceanography in France. The project was launched in order to provide ocean insitu measurements to the French operational ocean analysis and forecasting system (Mercator-Océan)and to contribute to a continuous, automatic, and permanent observation networks. The Coriolis datacentre has been set up to gather, qualify [Coatanoan and Petit de la Villéon(2005)] and distribute datafrom the global ocean both in real and delayed time. The Coriolis database is a real time database as itis updated every day as new data arrive. On the contrary, the CORA dataset corresponds to an extractionof all in situ temperature and salinity profiles from the Coriolis database at a given time. All the data isthen re-qualified.
CORA is meant to fit the needs of both re-analysis and research projects. However, dealing with thequantity of data required by re-analysis projects and the quality of data required by research projectsremains a difficult task. Several important changes have been made since the last release CORA02, bothin the production procedure (to be able to release yearly reanalysis) and quality checks applied to thedata. These changes are fully described in this document.
1.1.1 Previous versions of CORA
Two previous versions of CORA have already been released by the Coriolis data center and the R&DCoriolis team:
1. CORA01 in 2007. It contains data from 2002 to 2006
2. CORA02 in 2008. data from 1990 to 2007.
To produce such a dataset the Coriolis data center proceed basically in three steps:
1

CORA3.4 Documentation, Rev. 1.0
1. Data passes through a statistical quality check based on objective analysis method (see[Gaillard et al.(2009)Gaillard, Autret, Thierry, Galaup, Coatanoan, and Loubrieu] for further de-tails).This statistical check produced alerts on doubtful profiles.
2. All doubtful profiles are visually checked, and profiles are flagged - if necessary - in the Coriolisdatabase.
3. Data is extracted from the Coriolis database (to produce netCDF files).
1.1.2 Main changes for the CORA3.4 version
• A new procedure is now used to produce the dataset: This sequence of processing steps is fullydescribed in the paper Cabanes et al. 2013:
• A set of quality checks is performed on the data (see Cabanes et al. 2013 for more details)
• A check of duplicates was re-run on the whole dataset.
• An XBT bias correction has been applied.
• CORA3.4 release covers the period 1990-2011 (such as CORA3.3) but ICES (CIEM) CTD datahave been added to the dataset.
1.2 Data sources
Data submitted to, or obtained by, the Coriolis Data Centre which contains profiles of temperature and/orsalinity were potential data source for CORA3.4 dataset. The CORA3.4 dataset thus corresponds to theCoriolis database at the date of the CORA3.4 retrieval (22th of January, 2013). For CORA3.3 (previousversion), the data retrieval has been spread over time (see table 1.1).
Data Span Date of retrieval1990-2008 25-May-2010
2009 09-September-20102010 22-03-2011
2011 01-09 04-10-20112011 10-12 22-03-2012
Table 1.1: Dates of retrieval for CORA3.3
The Coriolis centre receives data from Argo GDAC, French research ships, GTS flow, GTSPP, GOSUDGDAC, MEDS, voluntary observing and merchants ships, moorings (TAO-TRITON-PIRATA-RAMAplus coastal moorings), and the World Ocean Database (not in real time for the last one and for CTDonly). CORA thus contains data from different types of instruments: mainly Argo floats, XBT, CTD,XCTD, and moorings.
1.3 Organisation of the dataset
1.3.1 Files formats - structure
Files structure is the same as for the distribution of the Argo profiles data and it is fully describedin the argo-dm-user manual, section 2.2. Each netcdf files contains many profiles (number given by
2 Chapter 1. Dataset overview

CORA3.4 Documentation, Rev. 1.0
the dimension N_PROF) and a profile contains measurements of different variables (e.g. temperature,salinity) performed at different pressures or immersion (the number of vertical levels is given in thenetCDF file by the N_LEVELS dimension) taken as the instrument is being dropped or risen verticallyin the water column. For surface-only data, the profile consists of a single measurement. For mooredbuoys and drifting buoys, a profile is a discrete set of concurrent measurements from the instrumentsplaced at different depths.
All the variables in a file are defined for Argo float profiles, but most of these variables still have thesame signification for other types of profile (e.g. XBT or CTD profiles).
Guidance for the usersEach profile has a unique identifier in the Coriolis database and the CORA dataset which is theDC_REFERENCE number. Please, refer to this DC_REFERENCE number if you want to make afeedback on a specific profile to the Coriolis data centre. The variable PLATFORM_NUMBER is theplatform identifier that is assigned for the life of the platform (e.g. Profiling floats, moored buoys,...). For measurements collected from research vessels or merchant ships-of-opportunity the PLAT-FORM_NUMBER is the vessel/ship identifier.
1.3.2 Type of files and data type
In CORA3.4, data is sorted in 9 types depending mainly on the data sources and resolution. Most ofthese types are those defined for the GTSPP (PF, CT, XB, BA and TE) while others are ‘in-house’ types(OC, MO and HF). All the data are stored in netcdf files using the same format as the one defined for theArgo program and a naming convention that indicates the data type. Files are stored in yearly directories.There is one file per day and per type. The file name is of the form:
CO_DMQCGL01_YYYYMMDD_PR_TT.nc
This file contains all the raw data of the date YYYYMMDD and of the data type TT.
• PF files : data from Argo floats directly received from DACS (real Time and delayed mode ifavailable). These data have a nominal accuracy of 0.01° and 0.01 PSU and are transmitted withfull resolution.
• XB files : XBT or XCTD data received from research and opportunity vessels have accuracywithin 0.03° to 0.1° for temperature and 0.03 to 0.1 PSU for salinity.
• CT files : contains CTD data from research vessels (accuracy on the order of 0.002° for tempera-ture and 0.003 PSU for salinity after calibration) but also data from sea mammals equipped withCTD (accuracy is on the order of 0.01° for temperature and 0.02 PSU for salinity but can be lowerdepending of the availability of reference data for post-processing, see Boehme et al, 2009) andreceived from MNHN and some sea Gliders.
• OC files : Others CTD and XCTD data coming from the high resolution CTD dataset of the Worldocean database 2009.
• MO files : Mooring data are mostly from TAO TRITON RAMA and PIRATA mooring and haveaccuracy generally comparable to Argo floats (except for S near surface).
• TE and BA files : The two last categories are for all the data transmitted trough the GTS (data fromArgo floats not yet received at the DACS, mooring, XBT,...). This transmission system imposeslimitation on the accuracy: data is truncated two and one places beyond decimal point for TE andBA type respectively.
• HF files: High Frequency data coming from coastal moored buoys (max 3 levels of immersion,max depth<200m, with less than 0.01° of variation in position and more than one measure per
1.3. Organisation of the dataset 3
CORA3.4 Documentation, Rev. 1.0
day on at least 10 days in a year). The confidence on the quality of such data is much lower thanoffshore classical moorings because of the lack of climatology in such area.
• IC files: ICES CTD from CIEM database distributed over the whole time span.
Guidance for the users : How to find a particular data type in CORA3.4?This classification of the data in netcdf files depends mainly on the data sources and resolution. However,it can be difficult for the user to find all the data from one type of instrument (e.g. CTD) as it is found indifferent types of files (e.g. CT, OC, TE files for CTD instruments). The variable WMO_INST_TYPEin the netcdf raw files can help to distinguish the different instrument types (see table A.1). How-ever the same WMO_INST_TYPE can be attributed to different types of instrument platform (e.g. theWMO_INST_TYPE 830 standing for CTD is attributed to CTD launched from vessels or ships, CTDattached to sea mammals, some mooring buoys etc...). To facilitate the identification of a particulartype of data a PROBE_TYPE code was attributed to each profile (see table A.1 for definition of codes).The PROBE_TYPE variable can be found in the Index files (see section 1.3.2) and be used to select aparticular type of data.
1.3.3 The Index files
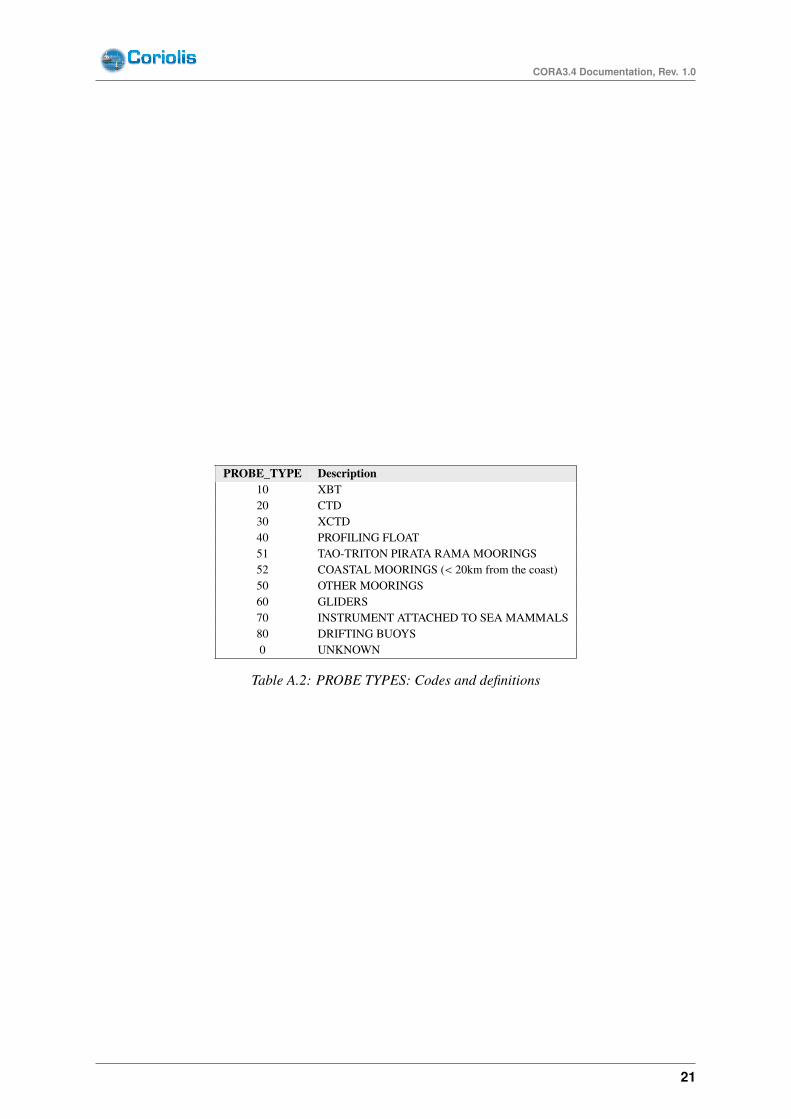
An Index for the raw data of CORA3.4 is available (./RAW/Index). The index is organized as follow:There is one index file per month (e.g. index_cora3.4_01_1990.nc) containing only the main informationabout the profile (e.g. LONGITUDE, LATITUDE, JULD, PROBE_TYPE, PLATFORM_NUMBER,etc...), the name of the corresponding raw file (FILE_NAME) and the profile number in the raw file(NUM_PROF_IN_FILE). As the index files can be read very quickly, this allows the user to make hisown data selection or to pick up a single profile in the raw dataset. The PROBE_TYPE variable wasadded to the index files (but not in the raw files) to facilitate the identification of a particular type of data(see table A.2).
4 Chapter 1. Dataset overview
CHAPTER 2
Data quality
2.1 Quality flags
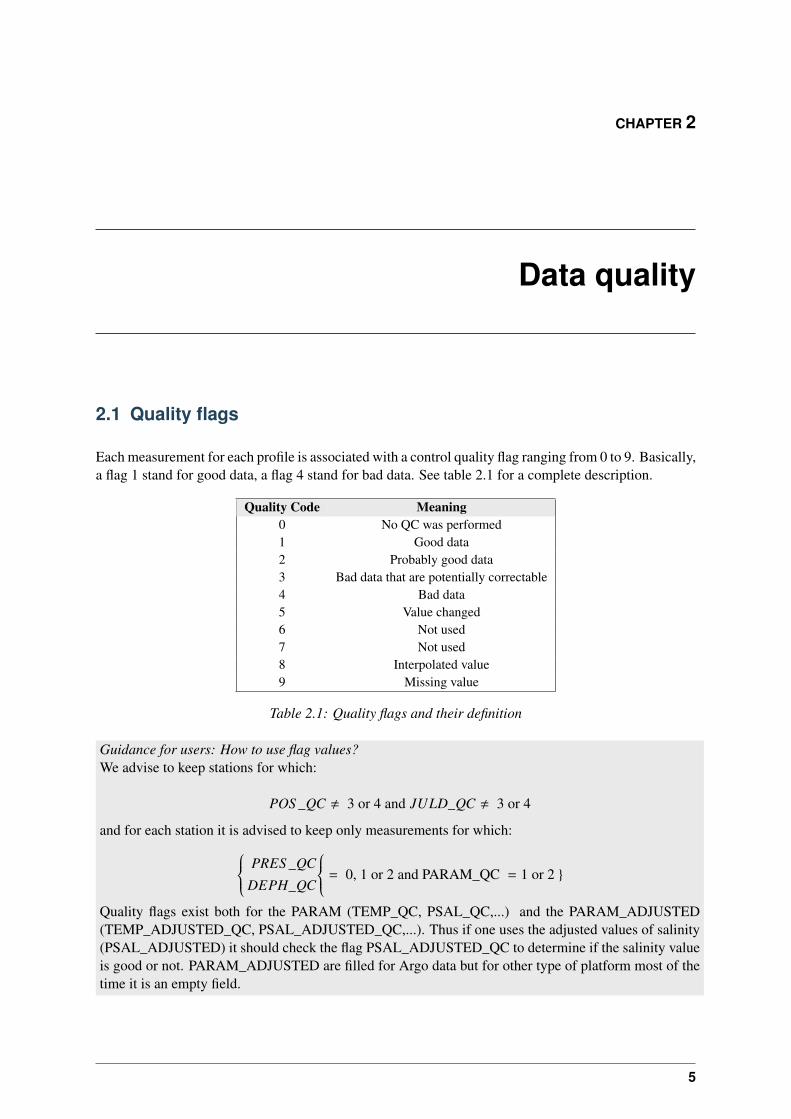
Each measurement for each profile is associated with a control quality flag ranging from 0 to 9. Basically,a flag 1 stand for good data, a flag 4 stand for bad data. See table 2.1 for a complete description.
Quality Code Meaning0 No QC was performed1 Good data2 Probably good data3 Bad data that are potentially correctable4 Bad data5 Value changed6 Not used7 Not used8 Interpolated value9 Missing value
Table 2.1: Quality flags and their definition
Guidance for users: How to use flag values?We advise to keep stations for which:
POS _QC , 3 or 4 and JULD_QC , 3 or 4
and for each station it is advised to keep only measurements for which: PRES _QC
DEPH_QC
= 0, 1 or 2 and PARAM_QC = 1 or 2 }
Quality flags exist both for the PARAM (TEMP_QC, PSAL_QC,...) and the PARAM_ADJUSTED(TEMP_ADJUSTED_QC, PSAL_ADJUSTED_QC,...). Thus if one uses the adjusted values of salinity(PSAL_ADJUSTED) it should check the flag PSAL_ADJUSTED_QC to determine if the salinity valueis good or not. PARAM_ADJUSTED are filled for Argo data but for other type of platform most of thetime it is an empty field.
5
CORA3.4 Documentation, Rev. 1.0
2.2 Adjusted parameter versus parameter
CORA3.4 dataset not only contains the raw parameters such as temperature, salinity, pressure or depthas received from the instrument. It can also include adjusted parameters, i.e. temperature, salinity,pressure or depth corrected from a drift or an offset. The data types affected by these adjustments areArgo floats and XBTs. For Argo data, it is the responsibility of each DAC to provide data correctionsboth in real time and in delayed mode. The Coriolis data centre, as a GDAC, gathers these correctionsand stores raw and adjusted parameters into the Coriolis database. No supplementary correction hasbeen made or applied to the Argo data in the CORA3.4 dataset. On the contrary, corrections for XBTdata have been calculated as part of the CORA3.4 data processing. For more details, see section 3.3 of the[Cabanes et al.(2013)Cabanes, Grouazel, von Schuckmann, Hamon, Turpin, Coatanoan, Paris, Guinehut, Boone, Ferry, de Boyer Montégut, Carval, Reverdin, Pouliquen, and Le Traon].
Guidance for the users: How to use adjusted parameters?It is advice to take the PARAM_ADJUSTED values instead of the PARAM values each time thePARAM_ADJUSTED values exist. The user should then take the PARAM_ADJUSTED values forthe whole profile if the variable DATA_MODE =’A’ or ’D’.
2.3 Data processing
The creation of CORA consists in a sequence of extra validation/correction steps performed indelayed mode and the whole dataset is also validated trhough real time checks: To have moredetails about the data validation done at Ifremer data center in real time refer to section 3.2.1 of[Cabanes et al.(2013)Cabanes, Grouazel, von Schuckmann, Hamon, Turpin, Coatanoan, Paris, Guinehut, Boone, Ferry, de Boyer Montégut, Carval, Reverdin, Pouliquen, and Le Traon].Here is an enumeration of usual processing steps performed in delayed-mode in CORA.
2.3.1 Climatological test
To detect coarse outliers on temperature and salinity, we use a climatological check. For CORA3.4 thecriteria choosen were:Temprature:
v = max(clim + 9xS igma, clim + 9 ∗ 0.1) (2.1)
Salinity:v = max(clim + 9xS igma, clim + 9 ∗ 0.025) (2.2)
In CORA3.4 this test has been performed on IC files and not a single alert was risen. The climatologyused was ’arglv502’ built from ARIVO dataset.
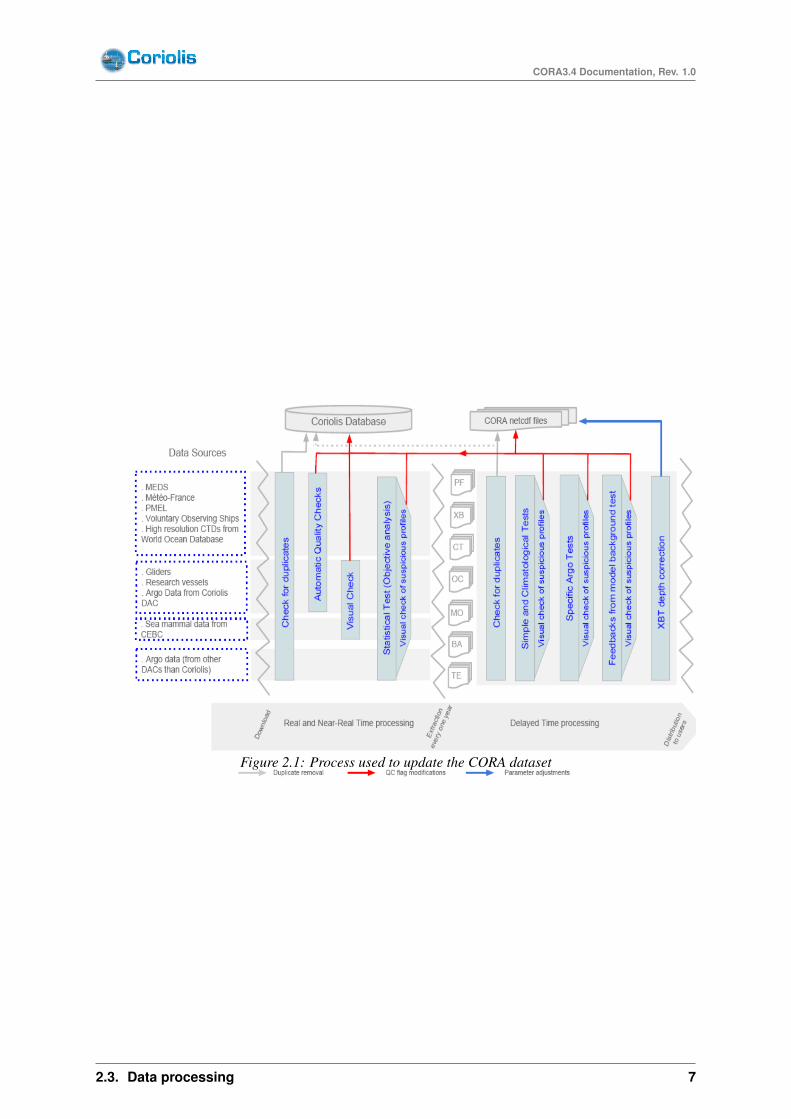
Figure 2.1 is a diagram of the different steps performed for the CORA3.4 dataset processing. The overallprocess includes duplicate checks to ensure the data is unique in the dataset, various quality checks thathelp differentiate ‘bad’ data from ‘correct’ ones, and adjustments applied to parameters. These differentsteps are detailed in the Cabanes et al 2013 paper. Some of them are processed in real or near-real timeand applied on the data freshly downloaded into the Coriolis database; others are processed in delayedtime (when the CORA3.4 files are generated).
6 Chapter 2. Data quality
CORA3.4 Documentation, Rev. 1.0
Figure 2.1: Process used to update the CORA dataset
2.3. Data processing 7

CORA3.4 Documentation, Rev. 1.0
2.3.2 Check of duplicates profiles
To have details about duplicates suppression whithin CORA dataset refer to section 3.1 of[Cabanes et al.(2013)Cabanes, Grouazel, von Schuckmann, Hamon, Turpin, Coatanoan, Paris, Guinehut, Boone, Ferry, de Boyer Montégut, Carval, Reverdin, Pouliquen, and Le Traon].Find below the table giving criteria of duplicate detection 2.2, an other table 2.3 explaining how weexclude some pairs of profiles to be duplicates thanks to data types comparison and in table 2.4 you havethe number of deleted profiles for CORA3.4. Note that duplicates in CORA3.4 concern solely PR_CTand PR_IC files, a previous duplicates check has been done in CORA3.3 between all the different typesof files.
Couple with same type(ex: BA BA or TE TE)
Couple with different type(ex: BA TE, BA OC)
delta date = +/- 0,00001 days (0,864s) 0,042 days (1h28s) - exception forTE PF : 24h -
Delta longitude = +/- 0,0001° 0,1°
delta latitude = +/- 0,0001° 0,1°
Platform number Can be different Must be the same
Table 2.2: Temporal and spatial criteria to identify possible duplicates
types OC BA XB CT PF MO TE HF IC
OC ? del. BA no del. OC no no del. TE del. HF del. OC
BA ? del. BA del. BA del. BA del. BA del. BA del. HF del. BA
XB ? no no no del. TE del. HF no
CT ? no no no del. HF del. CT
PF ? no del. TE del. HF no
MO ? del. TE del. HF no
TE ? del. HF del. TE
HF ? del. HF
IC ?
Table 2.3: Criteria on the data types to decide whether the pair is a duplicate
2.3.3 XBT bias correction
This particular correction follows the method decribed by [Hamon et al.(submitted 2011)Hamon, Reverdin, and Le Traon]but has not been applied in CORA3.4 because new data are ex-clusively CTD. More information can be found in section 3.3.2 of[Cabanes et al.(2013)Cabanes, Grouazel, von Schuckmann, Hamon, Turpin, Coatanoan, Paris, Guinehut, Boone, Ferry, de Boyer Montégut, Carval, Reverdin, Pouliquen, and Le Traon]
year 1990 1991 1992 1993 1994 1995 1996 1997 1998 19994 0 0 0 0 0 0 0 0 22000 2001 2002 2003 2004 2005 2006 2007 2008 2009 2010 20110 0 0 0 0 0 2 12 18 66 2 0
Table 2.4: Number of pair of profiles considered as duplicate with the detection check for CORA3.4
8 Chapter 2. Data quality

CORA3.4 Documentation, Rev. 1.0
1990
1991
1992
1993
1994
1995
1996
1997
1998
1999
2000
2001
2002
2003
2004
2005
2006
2007
2008
2009
2010
0
20000
40000
60000
80000
100000
120000
Number of pairs detected Number of profiles deleted
Figure 2.2: Number of pair detected and profiles deleted
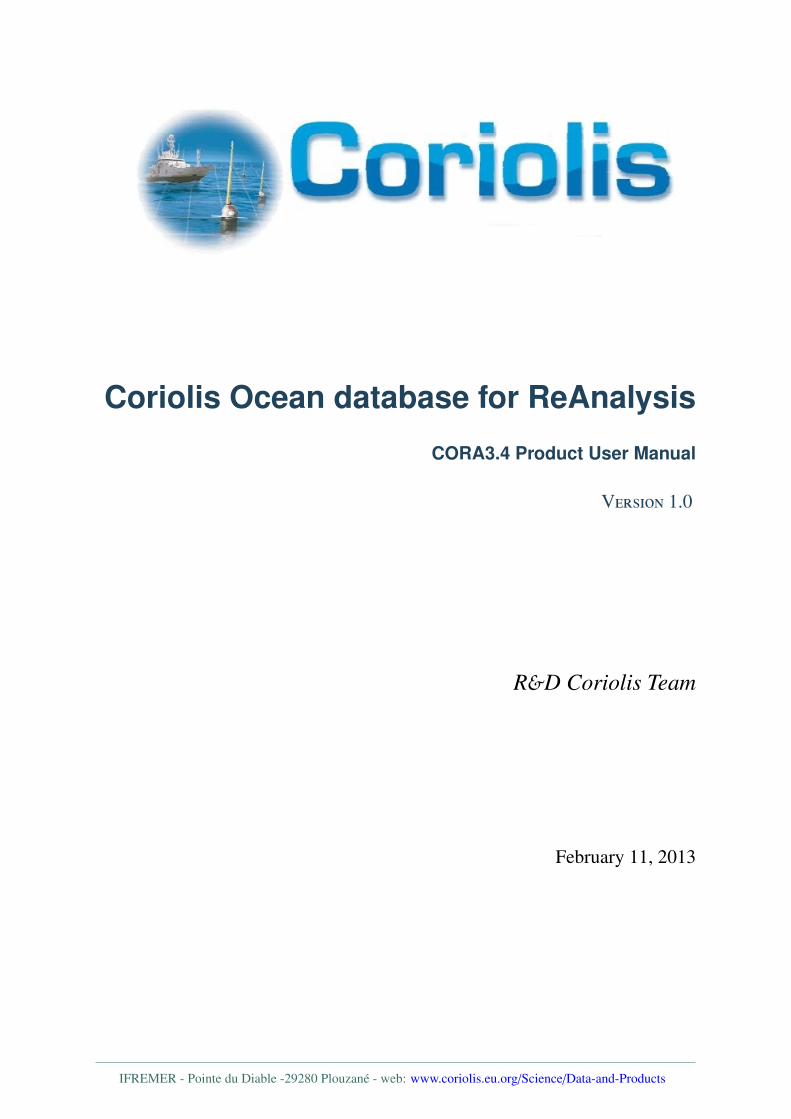
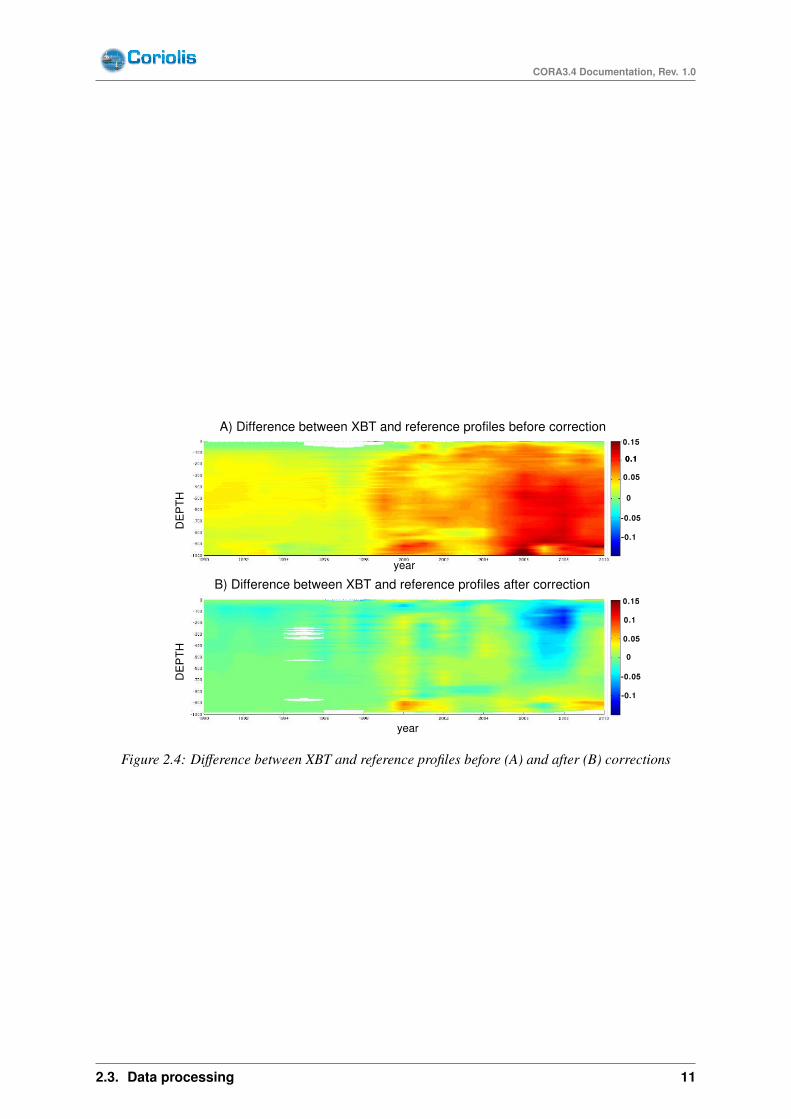
The values of the coefficient are given in table A.3. Figure 2.3 gives the number of XBT with co-localised profiles that can be found each year. The difference between the XBT profile and the referenceprofile before and after applying the correction is plotted in figure 2.4.
2.3.4 Feebacks from model assimilation
Mercator Ocean uses to provide Coriolis a list of anomalies detected thanks to an innovation checkwhen CORA observations are assimilated into runs such as GLORYS2V2. CORA benefits from thosefeedbacks and has confirmed about 50% of Mercator’s alerts in CORA3.2. This process has not beenapplied for CORA3.4 because of a shift between the release of CORA and the run date of GLORYS.
2.3.5 Non monotonic pressures
Nothing has been done in CORA3.4 about this particular Argo float issue. It has been done for CORA3.3.
2.3.6 Duplicate pressure-depth
Some profiles have depth values copied in the pressure (i.e. ’PRES’) field and nothing in ’DEPH’ field.Nothing has been done in CORA3.4 because it mostly concerns historical data from Coriolis database.
2.3.7 Global consistancy checked with Objective analysis tool
The ultimate process applied to CORA observations is an objective analysis (ISAS software also used inreal-time at Coriolis data center). It gives us alerts on profiles that are not consistant with the spatial andtemporal neighbourhood and secondarily produce 3D gridded fields with our raw data on the temperatureand salinity and respective standard deviation.
2.3. Data processing 9

CORA3.4 Documentation, Rev. 1.0
Guidance for the users: How to use XBT with thermal offset and depth corrected?For XBT profiles (PROBE_TYPE=10 in the index files) the corrected values are reported in the AD-JUSTED fields: TEMP_ADJUSTED field for the temperature corrected from the thermal offset andDEPH_ADJUSTED for the depth corrected.The depth correction which stretches the values of depth can lead to negative depth value on the firstlevel of some profiles (depending on the year, on the category of XBT and on the value of the first level).Those negative depth values have been kept in the DEPH_ADJUSTED field but the quality flag has beenset to 4. Those negative values concern between 50 and 70% of the profiles each year. Users are free toreject or not this first level (notice that the correction applied in the first layer is not that relevant).It appeared to us that some XBT profiles of the CORIOLIS database and CORA dataset have valuesof depth incorrectly stored in the field PRES. As we were not able to find the origin of this error, wecomputed the depth correction assuming that we had a depth and not pressure information. However toallow future corrections, for those XBT, we let the corrected depth in the PRES_ADJUSTED parameter.
1990
1991
1992
1993
1994
1995
1996
1997
1998
1999
2000
2001
2002
2003
2004
2005
2006
2007
0
5000
10000
15000
20000
25000
30000
35000
Colocalized with refe-rence profileTotal number of XBT
Figure 2.3: Number of XBT profiles colocalized with a reference profile
10 Chapter 2. Data quality
CORA3.4 Documentation, Rev. 1.0
A) Difference between XBT and reference profiles before correction
year
B) Difference between XBT and reference profiles after correctionyear
0
0.05
0.15
0.1
-0.05
-0.1
0.15
0.1
0.1
0.05
0
-0.05
-0.1
DEPT
HDE
PTH
Figure 2.4: Difference between XBT and reference profiles before (A) and after (B) corrections
2.3. Data processing 11
CORA3.4 Documentation, Rev. 1.0
12 Chapter 2. Data quality

CHAPTER 3
Data coverage
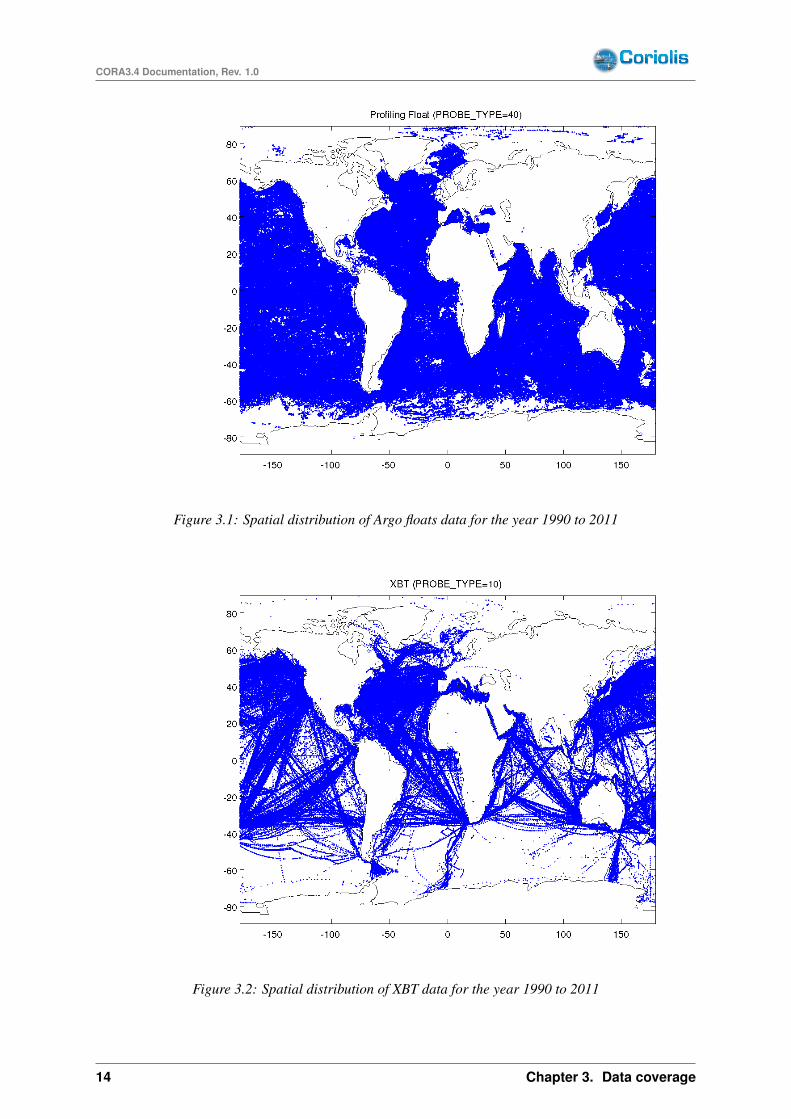
This section gives an overview of the CORA3.4 raw dataset. Figures 3.1 - 3.10 give the spatial distribu-tion of the different data types (table A.2) for each year between 1990-2011.
13
CORA3.4 Documentation, Rev. 1.0
Figure 3.1: Spatial distribution of Argo floats data for the year 1990 to 2011
Figure 3.2: Spatial distribution of XBT data for the year 1990 to 2011
14 Chapter 3. Data coverage

CORA3.4 Documentation, Rev. 1.0
Figure 3.3: Spatial distribution of XCTD data for the year 1990 to 2011
Figure 3.4: Spatial distribution of CTD data for the year 1990 to 2011
15

CORA3.4 Documentation, Rev. 1.0
Figure 3.5: Spatial distribution of Gliders data for the year 1990 to 2011
Figure 3.6: Spatial distribution of Sea mammals data for the year 1990 to 2011
16 Chapter 3. Data coverage

CORA3.4 Documentation, Rev. 1.0
Figure 3.7: Spatial distribution of TAO-TRITON-PIRATA-RAMA moorings array for the year 1990 to2011
Figure 3.8: Spatial distribution of Coastal Moorings data for the year 1990 to 2011
17

CORA3.4 Documentation, Rev. 1.0
Figure 3.9: Spatial distribution of other types of Moorings and drifters data for the year 1990 to 2011
Figure 3.10: Spatial distribution of unknown type of platform/instrument data for the year 1990 to 2011
18 Chapter 3. Data coverage
APPENDIX A
Tables
19

CORA3.4 Documentation, Rev. 1.0
WMO_INST_TYPE Description WMO_INST_TYPE Description001 Sippican T-4 700 Sippican XCTD standard002 Sippican T-4 new eq. 710 Sippican XCTD deep009 T-04 460m T-04 1500F 720 Sippican AXCTD011 Sippican T-5 730 Sippican SXCTD019 T-05 1830m 741 TSK XCTD021 Sippican Fast Deep 742 TSK XCTD-2022 inconnu022 743 TSK XCTD-2F031 Sippican T-6 751 TSK AXCTD032 Sippican T-6 new eq. 800 MBT Mechanical Bathy Thermograph039 T-06 460m 810 Hydrocast041 Sippican T-7 820 Thermistor Chain042 Sippican T-7 new eq. 830 CTD049 T-07 760m 831 Profiling Float (PF) - Generic051 Sippican Deep Blue 840 PF, PROVOR, no conductivity sensor052 Sippican Deep Blue new eq. 841 PF, PROVOR, SBE conductivity sensor059 T-DB 760m 842 PF, PROVOR, FSI conductivity sensor060 inconnu060 843 PF, Polar Ocean Profiling System (POPS), PROVOR SBE061 Sippican T-10 844 PF, ARVOR, Seabird conductivity sensor069 T-10 200m 845 PF, APEX, no conductivity sensor071 Sippican T-11 846 PF, APEX, SBE conductivity sensor079 T-11 460m 847 PF, APEX, FSI conductivity sensor081 Sippican AXBT (300m probes) 850 PF, SOLO, no conductivity sensor201 TSK T-4 851 PF, SOLO, SBE conductivity sensor202 TSK T-4 new eq. 852 PF, SOLO, FSI conductivity sensor211 TSK T-6 853 PF, SOLO2 (SCRIPPS), Seabird conductivity sensor212 TSK T-6 new eq. 856 PF, NINJA, SBE conductivity sensor221 TSK T-7 858 PF, NINJA, TSK conductivity sensor222 TSK T-7 new eq. 860 PF, NEMO, SBE conductivity sensor229 TSK T-7 861 PF, NEMO, FSI conductivity sensor231 TSK T-5 995 Instrument attached to marine mammals241 TSK T-10 999 Unknown251 TSK Deep Blue252 TSK Deep Blue401 Sparton XBT-1411 Sparton XBT-3421 Sparton XBT-4431 Sparton XBT-5451 Sparton XBT-6460 Sparton XBT-7 (old)461 Sparton XBT-7462 Sparton XBT-7481 Sparton XBT-10491 Sparton XBT-20501 Sparton XBT-20DB
Table A.1: WMO INSTRUMENT TYPES and their definition
20 Appendix A. Tables
CORA3.4 Documentation, Rev. 1.0
PROBE_TYPE Description10 XBT20 CTD30 XCTD40 PROFILING FLOAT51 TAO-TRITON PIRATA RAMA MOORINGS52 COASTAL MOORINGS (< 20km from the coast)50 OTHER MOORINGS60 GLIDERS70 INSTRUMENT ATTACHED TO SEA MAMMALS80 DRIFTING BUOYS0 UNKNOWN
Table A.2: PROBE TYPES: Codes and definitions
21

CORA3.4 Documentation, Rev. 1.0
HO
Tan
dD
EE
PH
OT
and
SHA
LL
OW
CO
LD
and
SHA
LL
OW
CO
LD
and
DE
EP
ab
ca
bc
ab
ca
bc
1990
-7.1
143e
-07
0.00
8364
50.
6906
52.
1037
e-05
-0.0
0104
390.
6806
84.
2526
e-06
0.00
6319
80.
7973
44.
2959
e-06
0.00
4332
70.
6585
819
911.
3984
e-06
0.00
7346
60.
6860
11.
0786
e-05
0.00
3023
60.
6717
93.
9592
e-07
0.00
7183
90.
7733
73.
4361
e-06
0.00
4904
0.60
144
1992
1.04
72e-
060.
0074
213
0.65
338
1.08
47e-
050.
0028
244
0.65
256
7.62
53e-
060.
0030
343
0.51
567
5.37
15e-
060.
0034
703
0.60
528
1993
2.97
32e-
070.
0080
382
0.61
483
3.18
62e-
070.
0071
422
0.61
035
1.96
61e-
05-0
.003
6154
0.33
827
2.84
72e-
060.
0051
036
0.54
112
1994
1.59
63e-
060.
0073
180.
5837
71.
6427
e-05
0.00
0876
990.
6284
61.
0832
e-05
0.00
8353
81.
0879
3.15
58e-
060.
0049
934
0.56
838
1995
3.35
09e-
060.
0060
772
0.51
941
1.08
86e-
060.
0018
374
0.22
987
0.00
0162
99-0
.011
499
3.55
748.
3509
e-06
0.00
0484
410.
5751
719
968.
0693
e-06
0.00
5777
61.
1429
4.41
81e-
05-0
.004
3531
0.42
843
4.61
05e-
06-0
.009
6887
0.00
5048
2.21
01e-
060.
0046
373
0.53
954
1997
1.06
53e-
050.
0009
5079
0.89
169
-2.0
466e
-05
0.02
4874
-0.4
6646
2.92
97e-
050.
0329
02-1
.883
71.
2932
e-05
-0.0
0113
470.
8670
219
98-6
.221
6e-0
70.
0075
039
0.27
032
-3.7
186e
-06
0.01
1031
1.29
13-7
.240
6e-0
50.
0315
210.
5801
51.
0817
e-06
0.00
4931
30.
4544
619
996.
2702
e-06
0.00
4398
51.
4626
7.50
43e-
060.
0002
3827
-0.5
9822
5.33
83e-
05-0
.003
4839
0.79
974
1.42
28e-
060.
0047
577
0.62
921
2000
5.45
07e-
060.
0137
073.
2011
-0.0
0018
074
0.07
7799
3.00
920.
0001
4598
-0.0
0867
353.
0833
7.78
39e-
060.
0027
011
3.37
5720
01-2
.319
3e-0
60.
0142
952.
1633
4.05
22e-
07-0
.000
5023
4-1
.072
7-0
.000
3653
60.
1158
35.
7531
1.68
03e-
05-0
.016
518
0.89
113
2002
2.09
87e-
050.
0026
797
2.06
225.
0699
e-05
0.02
2176
4.20
650.
0001
7235
-0.0
3970
43.
4083
1.43
25e-
05-0
.007
1179
2.47
6920
031.
0295
e-05
0.00
3334
11.
5199
-1.7
672e
-05
0.01
7371
1.48
36-0
.000
1589
40.
0421
830.
2733
36.
6755
e-07
-0.0
0012
579
1.78
5320
045.
4394
e-05
-0.0
2932
70.
5006
93.
9714
e-05
0.00
6209
21.
0057
-7.9
741e
-06
0.00
0721
452.
3911
-1.0
725e
-06
0.00
2635
82.
1516
2005
-1.2
825e
-06
0.01
2921
1.69
754.
2472
e-05
0.00
8682
31.
9908
5.62
5e-0
5-0
.024
077
-0.5
2684
2.85
11e-
05-0
.010
609
1.81
520
062.
4648
e-05
-0.0
0319
660.
1327
8-3
.388
5e-0
60.
0085
185
0.43
597
2.52
82e-
05-0
.027
834
0.28
719
-1.0
889e
-05
0.01
6215
1.84
2220
07-2
.885
1e-0
50.
0443
121.
098
-1.9
285e
-05
0.02
4406
3.57
10.
0002
0061
-0.0
8033
2-1
.440
9-1
.492
8e-0
50.
0211
72.
1417
2008
-2.1
199e
-05
0.03
8473
1.05
83-7
.519
7e-0
90.
0098
791.
4405
3.82
29e-
05-0
.035
406
-1.5
448
-1.5
126e
-05
0.02
7662
1.54
6620
09-1
.303
5e-0
60.
0205
21.
8746
-3.6
274e
-05
0.03
0775
4.23
021.
5642
e-05
0.00
6066
70.
7146
62.
3378
e-05
-0.0
0506
752.
2219
2010
3.86
18e-
060.
0167
30.
6974
3-7
.710
1e-0
50.
0383
861.
6881
1.74
55e-
05-0
.010
886
-2.3
344
3.02
86e-
05-0
.011
257
1.36
0520
112.
5301
e-05
0.00
3911
30.
1218
4-2
.233
2e-0
50.
0282
92-0
.069
972
-0.0
0011
707
0.06
6528
-0.1
6712
-1.5
268e
-05
0.01
9196
0.00
0941
37
Tabl
eA
.3:
Coe
ffici
ents
ofth
epa
rabo
licco
rrec
tion
and
the
dept
hoff
setf
orX
BT
22 Appendix A. Tables

Bibliography
[Cabanes et al.(2013)Cabanes, Grouazel, von Schuckmann, Hamon, Turpin, Coatanoan, Paris, Guinehut, Boone, Ferry, de Boyer Montégut, Carval, Reverdin, Pouliquen, and Le Traon]Cabanes, C., A. Grouazel, K. von Schuckmann, M. Hamon, V. Turpin, C. Coatanoan, F. Paris,S. Guinehut, C. Boone, N. Ferry, C. de Boyer Montégut, T. Carval, G. Reverdin, S. Pouliquen, andP.-Y. Le Traon, 2013: The cora dataset: validation and diagnostics of in-situ ocean temperature andsalinity measurements. Ocean Science, 9, 1–18, doi:10.5194/os-9-1-2013.URL http://www.ocean-sci.net/9/1/2013/
[Coatanoan and Petit de la Villéon(2005)] Coatanoan, C. and L. Petit de la Villéon, 2005: Coriolis DataCentre, In-situ data quality control procedures. Ifremer report, 17 pp.
[Gaillard et al.(2009)Gaillard, Autret, Thierry, Galaup, Coatanoan, and Loubrieu] Gaillard, F.,E. Autret, V. Thierry, P. Galaup, C. Coatanoan, and T. Loubrieu, 2009: Quality controls oflarge Argo datasets. Ocean. Tech., 26, 337–351.
[Hamon et al.(submitted 2011)Hamon, Reverdin, and Le Traon] Hamon, M., G. Reverdin, and P.-Y. LeTraon, submitted 2011: Empirical correction of XBT data. J. Geophys. Res..
23