Embed Size (px)
Citation preview
Corinna Feldmann
Agricultural and Food Marketing
1
Local and/or organic: A study on consumer preferences for organic food and food from
different origins
C. Feldmann & U. Hamm
Corinna Feldmann
Agricultural and Food Marketing
2
Background
• Increasing discussions on organic and local food– complementary trends – or substitutional quality attributes?
• Gracia et al. (2014): both food quality attributes are substitutes (study on eggs in Spain)
• Costanigro et al. (2014): both food quality attributes are complementary (study on apples in the USA)
→ Need for further research to clarify this discussion
Corinna Feldmann
Agricultural and Food Marketing
3
Research objectives• Consumers’ choices between products from different origins and
production processes • Differences between urban and rural consumers and differences
between consumers in North, East, West, and South Germany (very different regions with regard to purchase power, organic consumption, and regional identity)
• Compare purchase preferences and WTP values for four different products
• Influences on consumer preferences (through e.g. habits, attitudes towards local and organic food, and socio-demographic data)
• Information on whether consumers face a trade-off when choosing between a local and an organic product
Corinna Feldmann
Agricultural and Food Marketing
4
General information on study
• Combination of consumer survey and choice experiment• 641 interviews of consumers in eight supermarkets in
four regions of Germany (urban – rural; North – East – South – West)
• Computer-assisted self-interviewing (CASI) • 631 responses, appropriate for analysis of choice
experiment• Four products: apples, butter, flour, and steak• Design based on coefficients from pretest• Four blocks (one for each product) à 16 choice sets• 16 choice sets per respondent (four sets per product)
Corinna Feldmann
Agricultural and Food Marketing
5
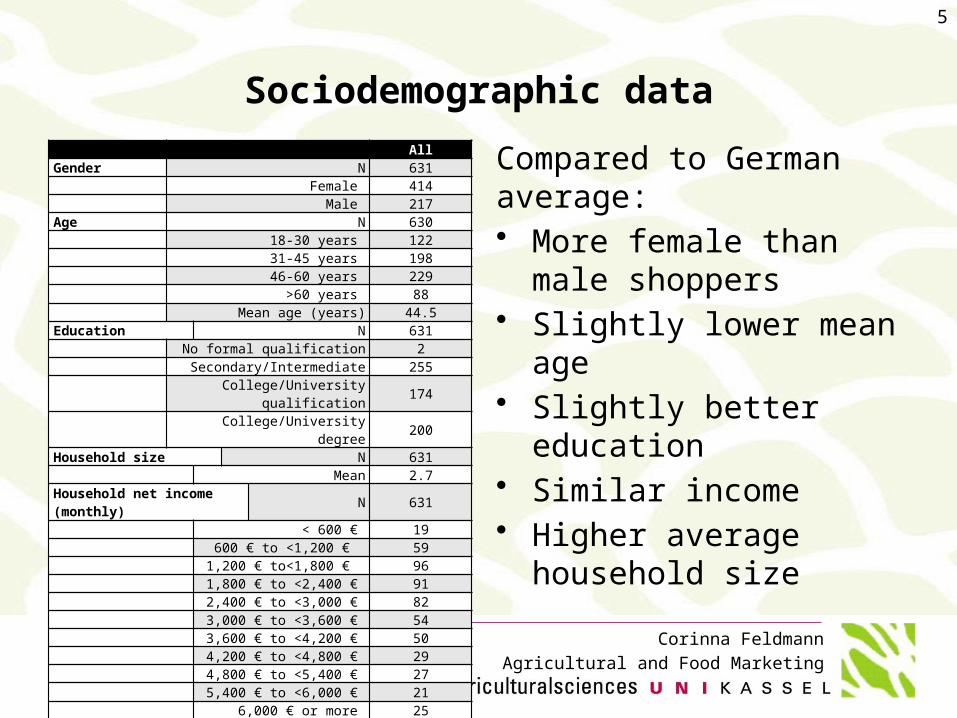
Sociodemographic data AllGender N 631 Female 414 Male 217Age N 630 18-30 years 122 31-45 years 198 46-60 years 229 >60 years 88 Mean age (years) 44.5Education N 631 No formal qualification 2 Secondary/Intermediate 255 College/University qualification 174 College/University degree 200Household size N 631 Mean 2.7Household net income (monthly)
N 631
< 600 € 19 600 € to <1,200 € 59 1,200 € to<1,800 € 96 1,800 € to <2,400 € 91 2,400 € to <3,000 € 82 3,000 € to <3,600 € 54 3,600 € to <4,200 € 50 4,200 € to <4,800 € 29 4,800 € to <5,400 € 27 5,400 € to <6,000 € 21 6,000 € or more 25 No comment 78
Compared to German average:• More female than male
shoppers• Slightly lower mean age • Slightly better education• Similar income • Higher average
household size
Corinna Feldmann
Agricultural and Food Marketing
6
Design of choice experiment
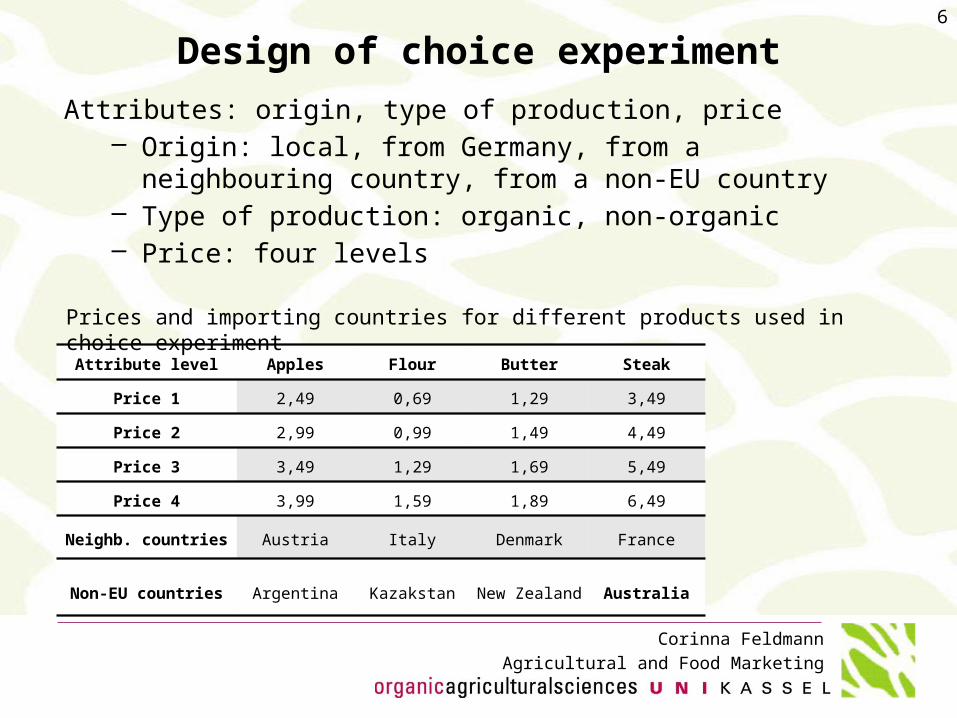
Attribute level Apples Flour Butter Steak
Price 1 2,49 0,69 1,29 3,49
Price 2 2,99 0,99 1,49 4,49
Price 3 3,49 1,29 1,69 5,49
Price 4 3,99 1,59 1,89 6,49
Neighb. countries Austria Italy Denmark France
Non-EU countries Argentina Kazakstan New Zealand Australia
Attributes: origin, type of production, price– Origin: local, from Germany, from a neighbouring country,
from a non-EU country– Type of production: organic, non-organic– Price: four levels
Prices and importing countries for different products used in choice experiment
Corinna Feldmann
Agricultural and Food Marketing
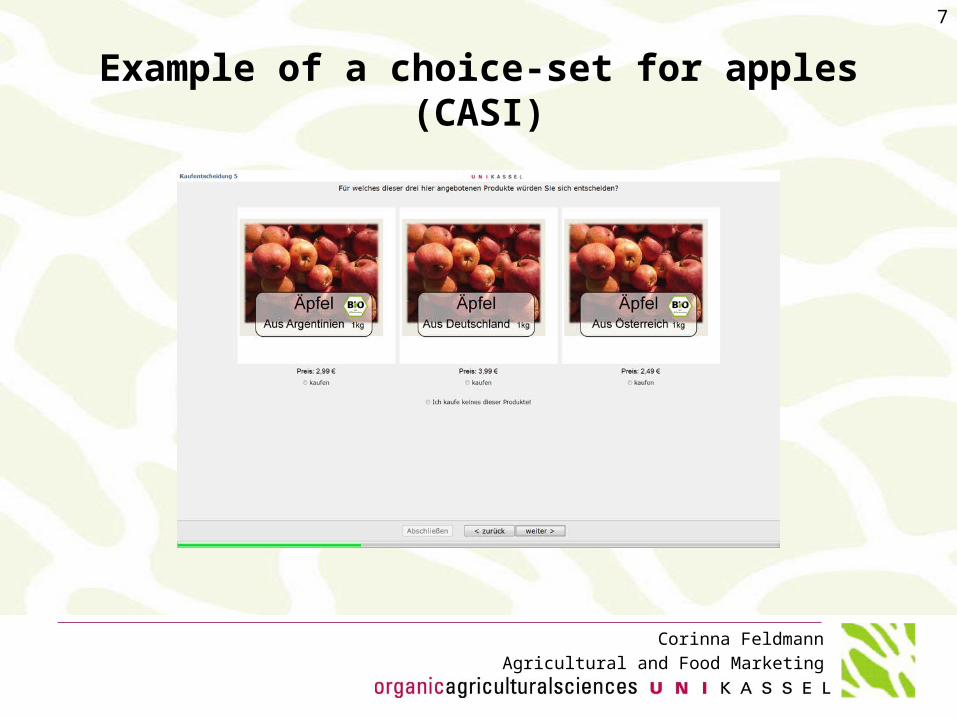
Example of a choice-set for apples (CASI)
7
Corinna Feldmann
Agricultural and Food Marketing
8
Methodological approach
• Choice experiment– Attribute-based survey method– Consumer preferences and utility (consumers choose the most
preferred alternative from a set of hypothetical products)– Relevance of different product attributes in comparison– Choice sets are composed of three product alternatives, varying
in three attributes– Including a no-buy option and a binding purchase decision
• Theoretical framework– Characteristics theory of value (Lancaster 1966)– Random utility theory (Thurstone 1922); basic form: Ui= Vi + Ɛi
Corinna Feldmann
Agricultural and Food Marketing
9
Random parameters logit models (RPL)
• Better model fit than multinomial logit models (MNL)• Individual models for all four products• Halton draws, 1000 pts• Fixed parameters, whenever standard deviations or
standard errors were insignificant• Price was treated as non-random
Corinna Feldmann
Agricultural and Food Marketing
1
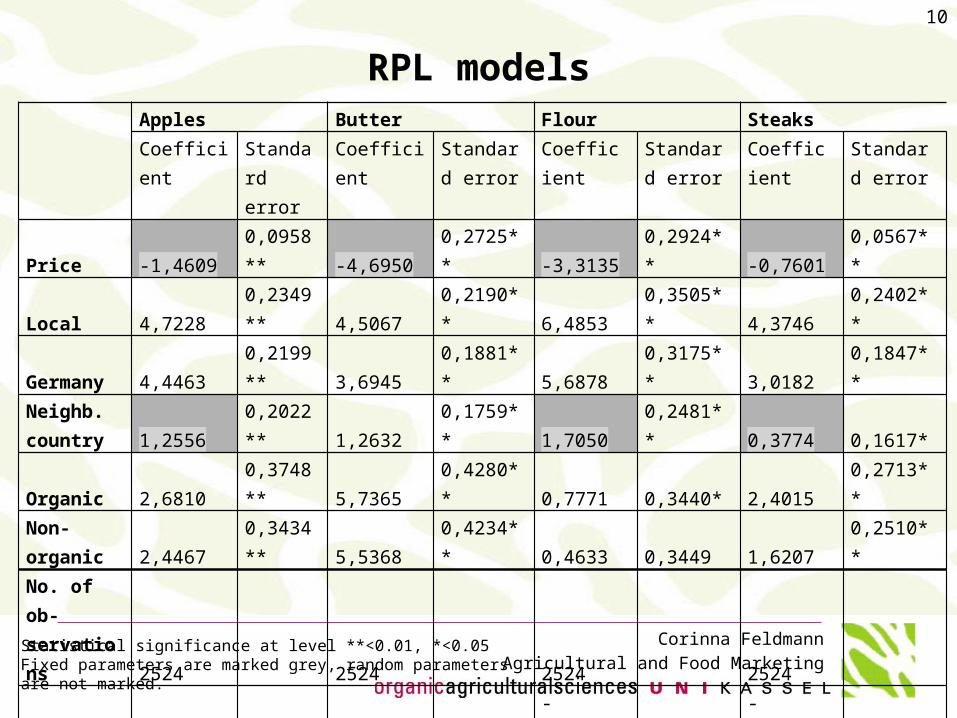
RPL modelsApples Butter Flour Steaks
Coefficient Standard error
Coefficient Standard error
Coefficient Standard error
Coefficient Standard error
Price -1,4609 0,0958** -4,6950 0,2725** -3,3135 0,2924** -0,7601 0,0567**
Local 4,7228 0,2349** 4,5067 0,2190** 6,4853 0,3505** 4,3746 0,2402**
Germany 4,4463 0,2199** 3,6945 0,1881** 5,6878 0,3175** 3,0182 0,1847**Neighb. country 1,2556 0,2022** 1,2632 0,1759** 1,7050 0,2481** 0,3774 0,1617*
Organic 2,6810 0,3748** 5,7365 0,4280** 0,7771 0,3440* 2,4015 0,2713**Non-organic 2,4467 0,3434** 5,5368 0,4234** 0,4633 0,3449 1,6207 0,2510**No. of ob-servations 2524 2524 2524 2524 LL function -2.183,06 -2.191,96 -1.773,86 -2.381,18
Pseudo R² 0,376 0,374 0,493 0,319 Halton draws, Pts 1000 1000 1000 1000
Statistical significance at level **<0.01, *<0.05Fixed parameters are marked grey, random parameters are not marked.
Corinna Feldmann
Agricultural and Food Marketing
Results ǀ
• Negative sign for price coefficients, relative importance of price varies between models
• Small impact of the parameter ‚organic‘, exception: steaks• Order of origin parameters in all models: local > from
Germany > from a neighbouring country > from a non-EU country
• Differences between coefficients for ‚local‘ and other origin attributes vary between models (e.g. local –Germany → very small for apples, larger for steaks)
• Product-specific differences in preference structures
11
Corinna Feldmann
Agricultural and Food Marketing
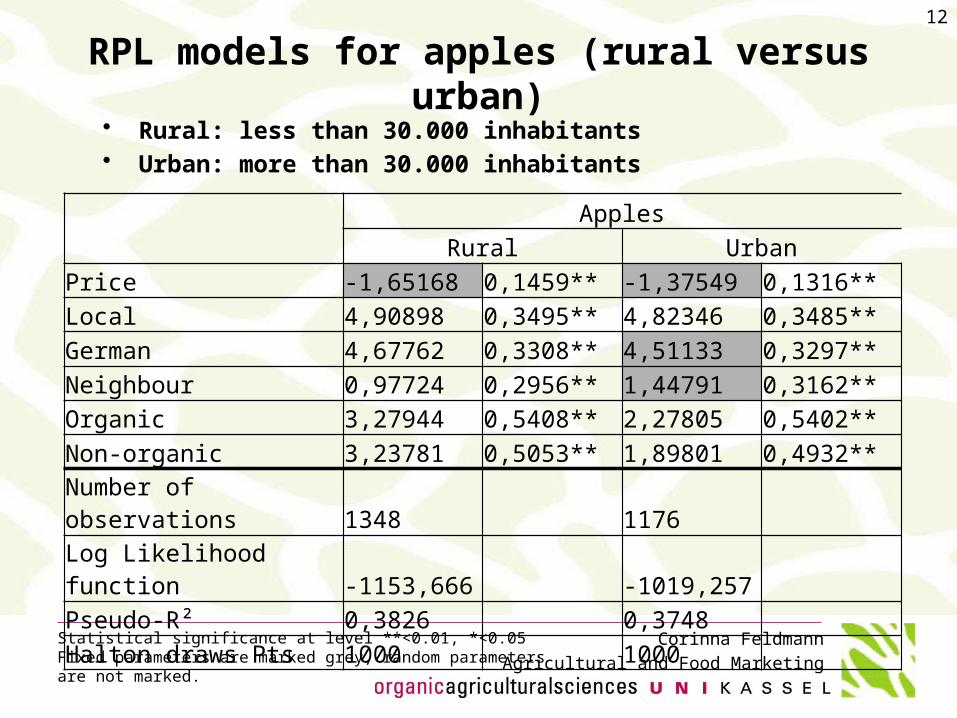
RPL models for apples (rural versus urban)• Rural: less than 30.000 inhabitants• Urban: more than 30.000 inhabitants
12
Apples
Rural Urban
Price -1,65168 0,1459** -1,37549 0,1316**
Local 4,90898 0,3495** 4,82346 0,3485**
German 4,67762 0,3308** 4,51133 0,3297**
Neighbour 0,97724 0,2956** 1,44791 0,3162**
Organic 3,27944 0,5408** 2,27805 0,5402**
Non-organic 3,23781 0,5053** 1,89801 0,4932**
Number of observations 1348 1176
Log Likelihood function -1153,666 -1019,257
Pseudo-R² 0,3826 0,3748
Halton draws Pts 1000 1000
Statistical significance at level **<0.01, *<0.05Fixed parameters are marked grey, random parameters are not marked.
Corinna Feldmann
Agricultural and Food Marketing
13
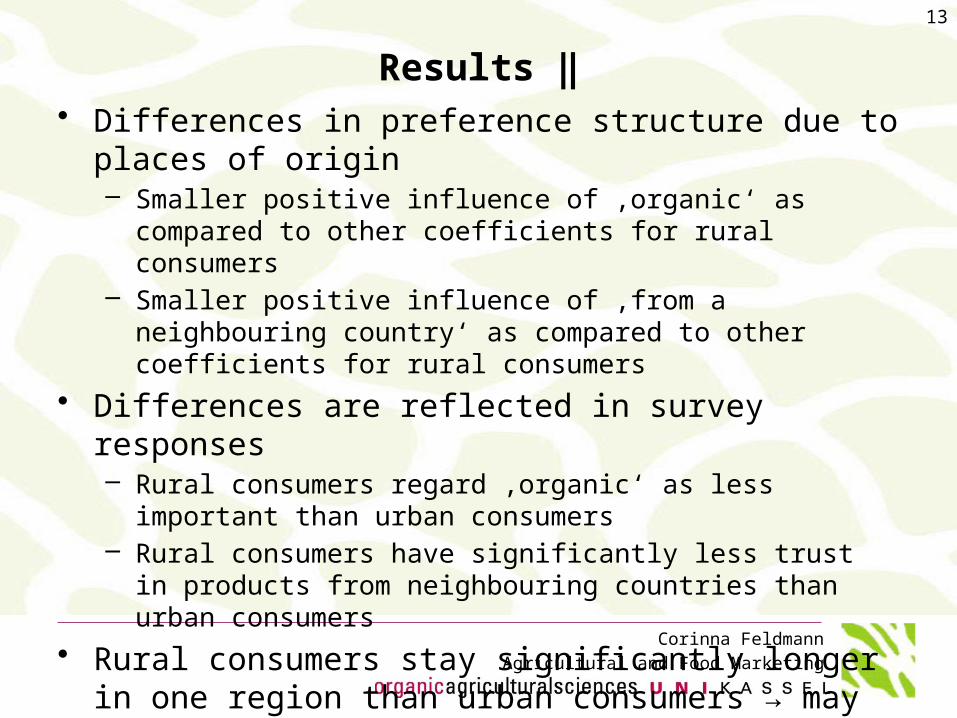
Results ‖• Differences in preference structure due to places of
origin– Smaller positive influence of ‚organic‘ as compared to other
coefficients for rural consumers– Smaller positive influence of ‚from a neighbouring country‘ as
compared to other coefficients for rural consumers
• Differences are reflected in survey responses– Rural consumers regard ‚organic‘ as less important than urban
consumers– Rural consumers have significantly less trust in products from
neighbouring countries than urban consumers
• Rural consumers stay significantly longer in one region than urban consumers → may influence attitude towards local food (cf. Wägeli & Hamm, 2013)
Corinna Feldmann
Agricultural and Food Marketing
14
Discussion of further models
• Interactions, e.g. local x organic, local x non-organic or non-EU x organic (+ marginal effects)
• Comparison of four products• Comparison of processed vs. unprocessed and animal
vs. plant products• Heterogeneity in means of random parameters to
determine influences related to socio-demographic data and attitudes
Corinna Feldmann
Agricultural and Food Marketing
15
Information on further research:
http://www.uni-kassel.de/fb11agrar/en/sections/agricultural-and-food-
marketing/research.html
Corinna Feldmann
Agricultural and Food Marketing
16
Additional slides…
Corinna Feldmann
Agricultural and Food Marketing
17
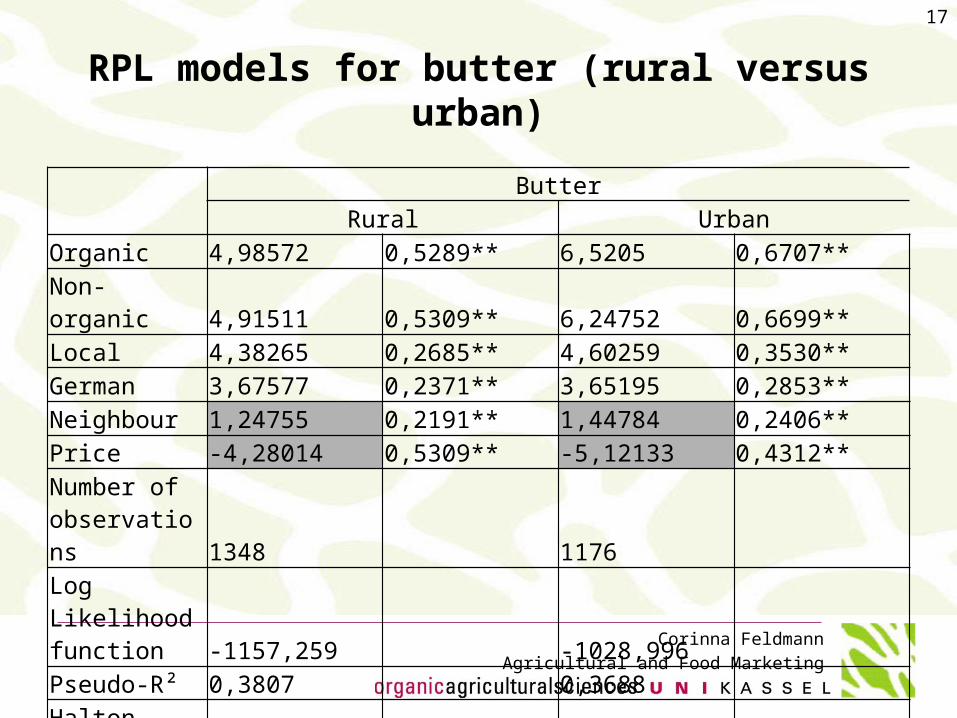
RPL models for butter (rural versus urban)
ButterRural Urban
Organic 4,98572 0,5289** 6,5205 0,6707**Non-organic 4,91511 0,5309** 6,24752 0,6699**Local 4,38265 0,2685** 4,60259 0,3530**German 3,67577 0,2371** 3,65195 0,2853**Neighbour 1,24755 0,2191** 1,44784 0,2406**Price -4,28014 0,5309** -5,12133 0,4312**Number of observations 1348 1176Log Likelihood function -1157,259 -1028,996Pseudo-R² 0,3807 0,3688Halton draws 1000 1000
Corinna Feldmann
Agricultural and Food Marketing
18
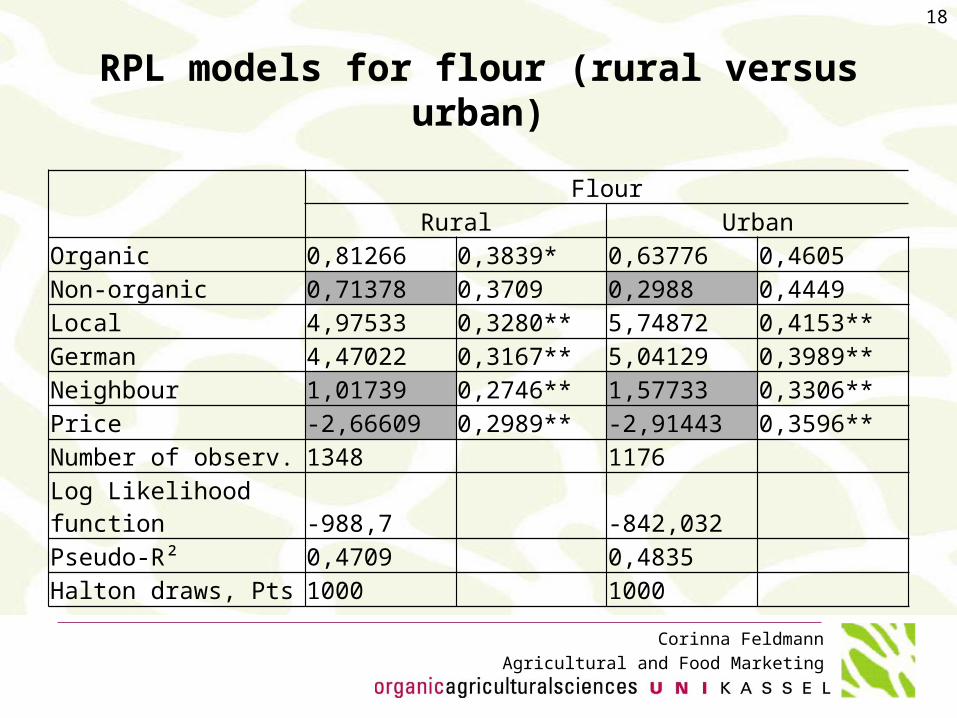
RPL models for flour (rural versus urban)
FlourRural Urban
Organic 0,81266 0,3839* 0,63776 0,4605Non-organic 0,71378 0,3709 0,2988 0,4449Local 4,97533 0,3280** 5,74872 0,4153**German 4,47022 0,3167** 5,04129 0,3989**Neighbour 1,01739 0,2746** 1,57733 0,3306**Price -2,66609 0,2989** -2,91443 0,3596**Number of observ. 1348 1176Log Likelihood function -988,7 -842,032Pseudo-R² 0,4709 0,4835Halton draws, Pts 1000 1000
Corinna Feldmann
Agricultural and Food Marketing
19
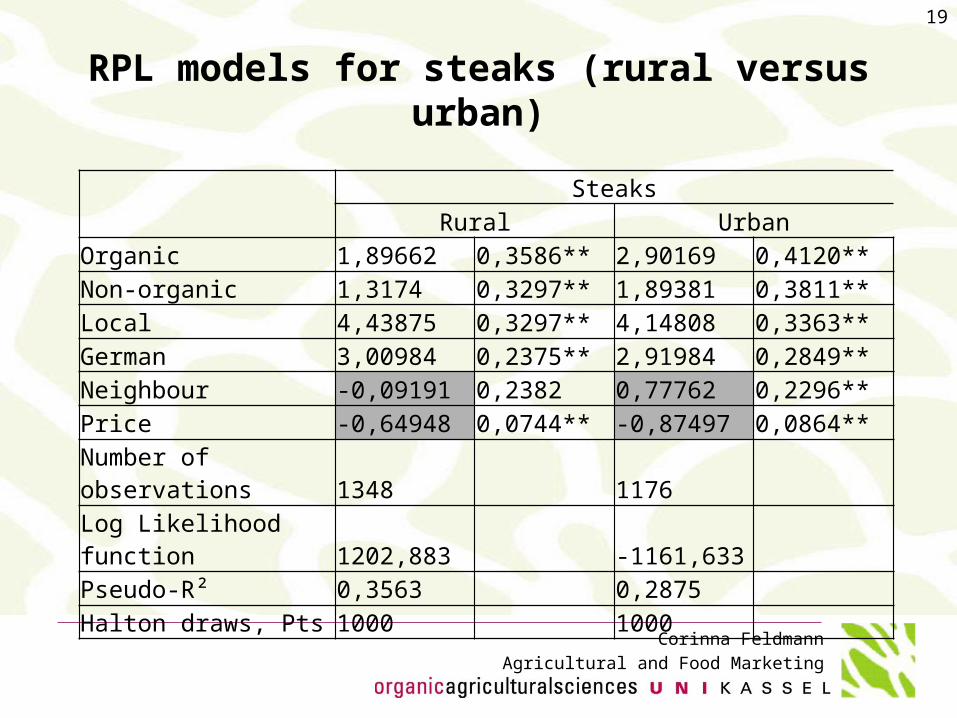
RPL models for steaks (rural versus urban)
SteaksRural Urban
Organic 1,89662 0,3586** 2,90169 0,4120**Non-organic 1,3174 0,3297** 1,89381 0,3811**Local 4,43875 0,3297** 4,14808 0,3363**German 3,00984 0,2375** 2,91984 0,2849**Neighbour -0,09191 0,2382 0,77762 0,2296**Price -0,64948 0,0744** -0,87497 0,0864**Number of observations1348 1176Log Likelihood function 1202,883 -1161,633Pseudo-R² 0,3563 0,2875Halton draws, Pts 1000 1000
Corinna Feldmann
Agricultural and Food Marketing
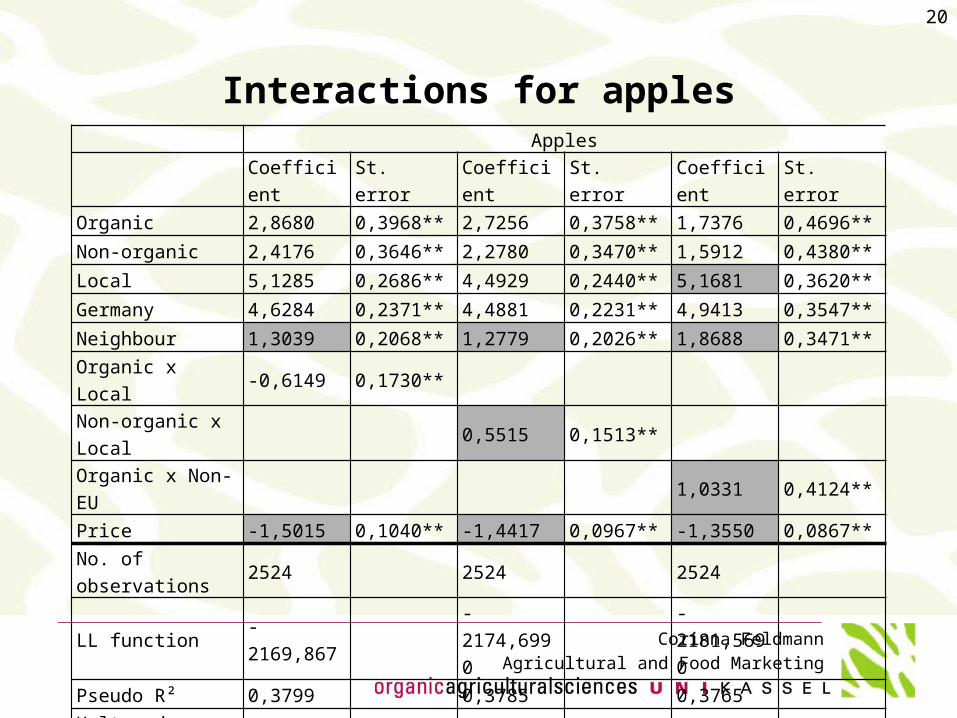
20
Interactions for applesApples
Coefficient St. error Coefficient St. error Coefficient St. error
Organic 2,8680 0,3968** 2,7256 0,3758** 1,7376 0,4696**
Non-organic 2,4176 0,3646** 2,2780 0,3470** 1,5912 0,4380**
Local 5,1285 0,2686** 4,4929 0,2440** 5,1681 0,3620**
Germany 4,6284 0,2371** 4,4881 0,2231** 4,9413 0,3547**
Neighbour 1,3039 0,2068** 1,2779 0,2026** 1,8688 0,3471**
Organic x Local -0,6149 0,1730**Non-organic x Local
0,5515 0,1513**
Organic x Non-EU 1,0331 0,4124**
Price -1,5015 0,1040** -1,4417 0,0967** -1,3550 0,0867**
No. of observations 2524 2524 2524
LL function -2169,867 -2174,6990 -2181,5690
Pseudo R² 0,3799 0,3785 0,3765
Halton draws, Pts 1000 1000 1000
Corinna Feldmann
Agricultural and Food Marketing
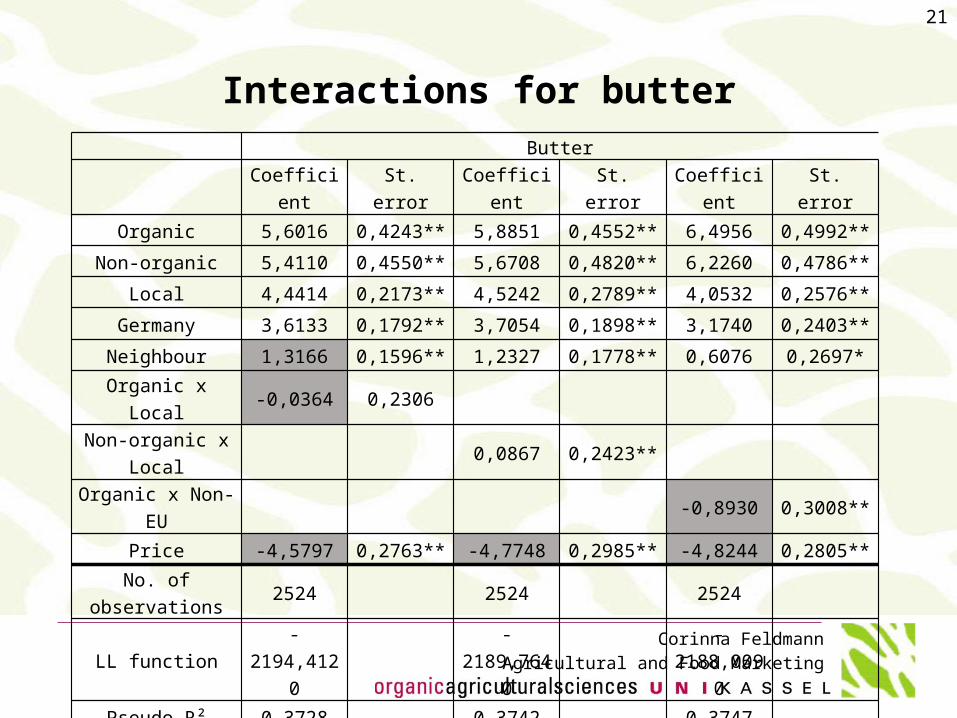
21
Interactions for butterButter
Coefficient St. error Coefficient St. error Coefficient St. error
Organic 5,6016 0,4243** 5,8851 0,4552** 6,4956 0,4992**
Non-organic 5,4110 0,4550** 5,6708 0,4820** 6,2260 0,4786**
Local 4,4414 0,2173** 4,5242 0,2789** 4,0532 0,2576**
Germany 3,6133 0,1792** 3,7054 0,1898** 3,1740 0,2403**
Neighbour 1,3166 0,1596** 1,2327 0,1778** 0,6076 0,2697*
Organic x Local -0,0364 0,2306
Non-organic x Local
0,0867 0,2423**
Organic x Non-EU -0,8930 0,3008**
Price -4,5797 0,2763** -4,7748 0,2985** -4,8244 0,2805**
No. of observations
2524 2524 2524
LL function -2194,4120 -2189,7640 -2188,0090
Pseudo R² 0,3728 0,3742 0,3747
Halton draws, Pts 1000 1000 1000
Corinna Feldmann
Agricultural and Food Marketing
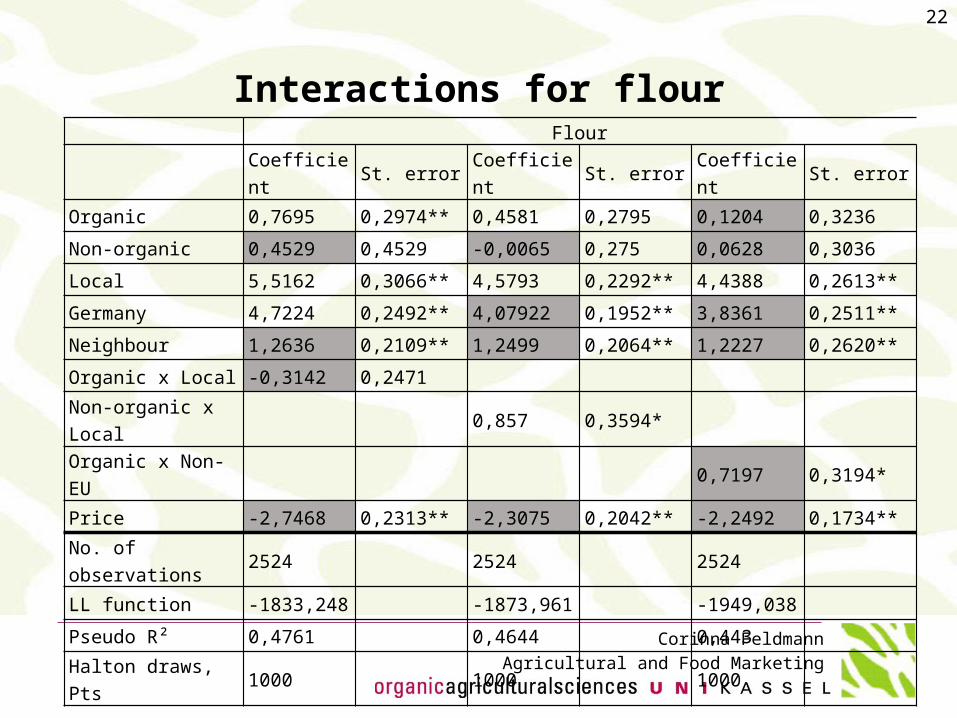
22
Interactions for flourFlour
Coefficient St. error Coefficient St. error Coefficient St. error
Organic 0,7695 0,2974** 0,4581 0,2795 0,1204 0,3236
Non-organic 0,4529 0,4529 -0,0065 0,275 0,0628 0,3036
Local 5,5162 0,3066** 4,5793 0,2292** 4,4388 0,2613**
Germany 4,7224 0,2492** 4,07922 0,1952** 3,8361 0,2511**
Neighbour 1,2636 0,2109** 1,2499 0,2064** 1,2227 0,2620**
Organic x Local -0,3142 0,2471
Non-organic x Local 0,857 0,3594*
Organic x Non-EU 0,7197 0,3194*
Price -2,7468 0,2313** -2,3075 0,2042** -2,2492 0,1734**
No. of observations 2524 2524 2524
LL function -1833,248 -1873,961 -1949,038
Pseudo R² 0,4761 0,4644 0,443
Halton draws, Pts 1000 1000 1000
Corinna Feldmann
Agricultural and Food Marketing
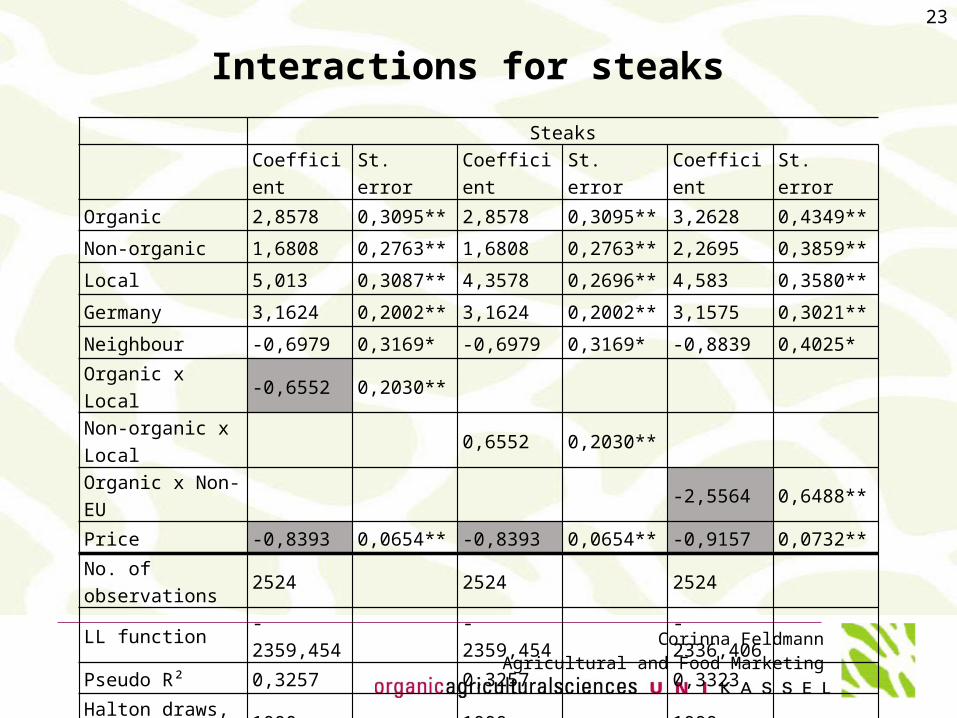
23
Interactions for steaks
SteaksCoefficient St. error Coefficient St. error Coefficient St. error
Organic 2,8578 0,3095** 2,8578 0,3095** 3,2628 0,4349**
Non-organic 1,6808 0,2763** 1,6808 0,2763** 2,2695 0,3859**
Local 5,013 0,3087** 4,3578 0,2696** 4,583 0,3580**
Germany 3,1624 0,2002** 3,1624 0,2002** 3,1575 0,3021**
Neighbour -0,6979 0,3169* -0,6979 0,3169* -0,8839 0,4025*
Organic x Local -0,6552 0,2030**
Non-organic x Local
0,6552 0,2030**
Organic x Non-EU -2,5564 0,6488**
Price -0,8393 0,0654** -0,8393 0,0654** -0,9157 0,0732**
No. of observations
2524 2524 2524
LL function -2359,454 -2359,454 -2336,406
Pseudo R² 0,3257 0,3257 0,3323
Halton draws, Pts 1000 1000 1000