Embed Size (px)
Citation preview

econstorMake Your Publication Visible
A Service of
zbwLeibniz-InformationszentrumWirtschaftLeibniz Information Centrefor Economics
Monkiewicz, Jan
Working Paper
Pension funds and acceleration of Poland'seconomic development
TIGER Working Paper Series, No. 53
Provided in Cooperation with:TIGER - Transformation, Integration and Globalization EconomicResearch, Warsaw
Suggested Citation: Monkiewicz, Jan (2004) : Pension funds and acceleration of Poland'seconomic development, TIGER Working Paper Series, No. 53
This Version is available at:http://hdl.handle.net/10419/140705
Standard-Nutzungsbedingungen:
Die Dokumente auf EconStor dürfen zu eigenen wissenschaftlichenZwecken und zum Privatgebrauch gespeichert und kopiert werden.
Sie dürfen die Dokumente nicht für öffentliche oder kommerzielleZwecke vervielfältigen, öffentlich ausstellen, öffentlich zugänglichmachen, vertreiben oder anderweitig nutzen.
Sofern die Verfasser die Dokumente unter Open-Content-Lizenzen(insbesondere CC-Lizenzen) zur Verfügung gestellt haben sollten,gelten abweichend von diesen Nutzungsbedingungen die in der dortgenannten Lizenz gewährten Nutzungsrechte.
Terms of use:
Documents in EconStor may be saved and copied for yourpersonal and scholarly purposes.
You are not to copy documents for public or commercialpurposes, to exhibit the documents publicly, to make thempublicly available on the internet, or to distribute or otherwiseuse the documents in public.
If the documents have been made available under an OpenContent Licence (especially Creative Commons Licences), youmay exercise further usage rights as specified in the indicatedlicence.
www.econstor.eu

TIGERTRANSFORMATION, INTEGRATION and GLOBALIZATION ECONOMIC RESEARCH
CENTRUM BADAWCZE TRANSFORMACJI, INTEGRACJI I GLOBALIZACJI
TIGER Working Paper Series
No. 53
Pension Funds and Acceleration of Poland’sEconomic Development
Jan Monkiewicz
Warsaw, May 2004
Jan Monkiewicz: Professor of Finance and International Economic Relations at Warsaw School of Economicsand Warsaw University of Technology. Chairman of the Insurance and Pension Funds Supervisory Commission.Email: [email protected]

2
Jan Monkiewicz
Pension Funds and Acceleration of Poland’s Economic Development
Summary
Retirement systems are extremely complex social, economic, legal, and organisational
structures. The authors of retirement systems are faced with a great number of dilemmas. The
pension related expenditure has systematically been increasing in the developed world, also as
a percentage of GDP, due to the fast ageing of societies both as a result of the fact that life
expectancy has become longer and due to a decline in the number of children per family.
Consequently, according to the estimates of the International Monetary Fund, in order to
maintain the liquidity of public retirement systems in industrialised countries in the light of
between 1995 and 2050 it would be necessary to increase expenditure for this purpose on
average by 1.8% of GDP annually. It is also a great challenge to Poland, which introduced its
new retirement system in 1999.
This paper analyses the possible impact of the new pension system on Poland’s
economic development. It discuses pension funds in the new architecture of the Polish
retirement system and lists conditions for such an impact. It also analyses position of the
pension funds on the Polish financial market and discusses opportunities for using open
pension fund investment potential. Eventually it focuses on development opportunities for
Polish economy in reference the pension system.

3
1. Introductory Comments
Retirement systems existing in different countries of the world are extremely complex
social, economic, legal, and organisational structures. This results both from the necessity of
reconciling different goals and tasks within them, from an extremely long redemption period
for their obligations as well as from a long period of ‘reforging’ their structures. In effect, the
‘portfolios’ of those systems are, like for example now in Poland, often shaped differently
depending on their history. In each case, their basic function is to provide funds for the
maintenance of people at post-working age, i.e. when they are deprived of their stream of
income from their job.
This basic function may be fulfilled in the circumstances of various systems of values,
the extreme expression of which is the principle of full solidarism on the one hand, and the
principle of full egoism, or full individualisation, on the other. In the former case, the
individual retirement-related burdens are not directly linked to future benefits, whereas in the
latter option they are directly and fully connected with retirement savings set aside. The said
principle of solidarism may apply to the settlements of accounts with the generation of
predecessors as well as/or settlements made within the same generation.
Apart from this fundamental choice, the authors of retirement systems are also faced
with many other dilemmas, in particular such as determining the level of compulsory
retirement-related burdens and, ipso facto, the level of future benefits in respect of this. The
situation in various countries is diversified in this respect. In 2000, pension-related
expenditure in OECD countries ranged from 2.0% GDP in South Korea through 3.0% in
Australia, 4.4% in the USA, 5.1% in Canada, 10.8% in Poland, 11.8% in Germany, 12.1% in
France, and 15.0% in Italy1. In the latest Eurostat pension study it is estimated that in the year
2000 pension-related expenditure constituted 12.5% of EU’s GDP and was growing at the
annual rate of 2%.2
This situation is not solely the issue of political choices, and it strongly depends on the
existing demographic processes. Their essence is the fast ageing of societies both as a result
of the fact that life expectancy has become longer and due to a decline in the number of
children per family. It appears from research conducted by OECD that between 1970 and
1999 the life expectancy of retiring people in that organisation’s member states increased by
1 M. Góra – System emerytalny, PWE, Warsaw 2003 p. 202.2 Special feature on pension funds. Data 1997-2000, European Commission, Eurostat, Luxembourg 2002, p. 12.

4
as many as five years.3 It is worthwhile to remember in this context that the retirement age
introduced by Bismarck in Prussia was 70 years with the then life expectancy of 45 years.
Currently the retirement age is typically at 60-65 with the usual life expectancy of 70-75
years.4
In effect, there is an increase in dependency ratios reflecting the extent to which the
working population’s income has to provide maintenance for those who are not working,
which is expressed as a ratio of pensioners to people who are professionally active. In the
coming 35-50 years, they will increase from 50% to 100% in OECD countries, and become a
serious challenge for the general stability and solvency of existing public retirement systems
(see Table 1). In some industrialised countries, dependency ratios may reach almost a
catastrophic level, turning upside down all the relationships existing today. Thus, for example,
in 2050 they may reach nearly 67% in Italy, 66% in Spain, and nearly 65% in Japan. Poland is
exposed to the same danger.
Table 1: Dependency ratios in OECD countries (ratio of pensioners to people at workingage) (%)
Country 2000 2035 2050BelgiumCanadaFranceGermanyItalyJapanNetherlandsNorwayPolandPortugalSpainSwedenUKUSA
28.120.427.226.628.827.721.925.620.426.727.129.426.621.7
50.042.2047.5054.1056.8053.9246.0241.3238.3640.9048.1745.7244.6438.15
49.5045.9050.8053.2066.8064.6244.8641.2155.2050.9065.6746.3445.2937.94
Source: OECD, citing A Rabough - Funding alternatives for Government sponsoredretirement systems - a global overview, op. cit p. 14
In this situation, according to the estimates of the International Monetary Fund, in
order to maintain the liquidity of public retirement systems in industrialised countries in the
3 A. Rabough – Funding alternatives for Government sponsored retirement systems – a global review, Global PensionsQuarterly, August 2003, p. 13.4 M. Góra – System emerytalny..., op. cit., p.39.
5
light of obligations already taken on by them, between 1995 and 20505 it would be necessary
to increase expenditure for this purpose on average by 1.8% of GDP annually.
No wonder that this being so there is ongoing search for the ways to solve the
problems that have arisen. The proposed therapy includes first of all the reform of traditional
repartition systems that are still dominant in the world and the essence of which is that the
present working generation finances retirement benefits for the preceding generation. The
activities undertaken include the increase of pension contributions, reduction of replacement
rates, making the retirement age start later, creation of national pension reserve funds etc.6
Another trend involves measures taken to increase the individual far-sightedness of the
stakeholders through the development of different optional forms of retirement savings based
on the use of financial market instruments. They may either take the form of group pension
schemes or individual schemes. They may utilise various forms of the state’s fiscal support.
Optional systems not only take over the burden from mandatory ones, but also diversify the
risk through their links with the financial market instead of the state budget. For this reason,
their positive consequence for the safety and stability of the whole retirement system is
stressed.
Another trend of activities involves a situation in which part or the whole mandatory
pension assurance system is based on the concept of fully funded pension funds, the
management of which is entrusted either to private entities (e.g. Chile, Mexico, Poland,
Estonia), or public entities (e.g. Singapore, Malaysia, Sweden).
5 Ch. Daykin – Pension systems: The EU and Accession countries. Lesson for the UK, Politeia, London 2002, p. 14.6 Compare A. Rabough – Funding alternatives..., op. cit., p. 13.

6
2. Pension Funds in the New Architecture of the Polish Retirement System
The new architecture of the Polish retirement system implemented since 1999 r. is
based on the principle of multiple sources and forms of financing future pension income that
are commonly referred to as pillars. Some of them are compulsory and thus are part of the
public pension assurance system, and some are optional but their product is defined by the
state. In the World Bank’s nomenclature, the obligatory part is the first pillar of pension
assurance.
In the case of Poland, this pillar is composed of two totally different parts: repartition
component administered by ZUS (Social Insurance Company), and fully funded component
administered by open pension funds that are managed by PTEs (pension fund companies).
Currently, the pension contribution transferred to the account of the Social Insurance
Company constitutes 12.22% of the gross salary, whereas 7.30% is allocated to the open
pension fund account. It should be remembered that apart from that 2.45% of the gross salary
is allocated to the ZUS account in respect of disability pension and 13% in respect of accident
benefits. To have a full picture, it should be added that those contributions are made by
employees and employers in different proportion.
It is worthwhile to remember that not the whole part of the pension contribution
received by ZUS is transferred to the retirement subaccount and thus directly reflects the
future pension of the insured. This is because in order to prevent the loss of future liquidity of
the repartition pillar a certain part of the contribution, which between 2002 and 2008
constitutes on average 0.25% of the pension contribution transferred to ZUS, is allocated for
the so-called national pensions reserve funds. Such reserve funds have also been recently
established in many industrialised countries (including the USA, Canada, Sweden, Japan,
Norway, and France).7
Figure 1: Architecture of the new national retirement system in Poland
Pillar IPublic
Pillar IIPrivate
Pillar IIIPrivate
ZUS(repartition
system)
OFE (openpension fund)(fully funded
system)
Employees’pension schemes
(fully fundedsystem)
Individualretirementaccounts
(fully fundedsystem)
7 A. Rabough – Funding alternatives..., op. cit., p.14-23.

7
The optional part of the Polish retirement system is composed of two types of pension
products: a group product in the form of employees’ pension schemes, and an individual
product in the form of individual retirement accounts. Those products are defined by the state,
and their use entails the possibility of obtaining relatively limited fiscal incentives by
employers (for group products) or employees (in the case of individual products). So far, their
popularity has been relatively low and in practice they do not play any important role.
Pension funds, which have taken over 37.4% of the obligatory contribution transferred
previously in its full amount to ZUS for retirement purposes, are special legal structures
whose only task is to multiply the obtained funds. This is done on their behalf and account by
pension fund companies that are a particular type of private asset management companies.
The institution of pension funds has been known for a long time in history. It emerged
as early as the beginning of the 19th century as an institution accumulating funds for
retirement purposes in plants located in Germany (among others Krupp, Siemens) and the
USA (among others American Express, ATT, GE).
The funds established in 1999 in Poland were based on the model of solutions adopted
before in Chile, Argentina and Mexico and recommended by the World Bank. From the
beginning, the number of their members was high, and it was by more than 100% higher than
the number of people who were obliged to become members of pension funds as a result of
the implementation of the retirement system reform (all those covered by the social insurance
system up to 30 years of age).
Table 2: Number of open pension fund members between 2002 and 2003
Open Pension Fund Name 31 December 2002 31 December 2003 Increase (%)Skarbiec- AIGAllianz PolskaBankowyCommercial UnionCredit Suisse4 L&PDOMErgo HestiaGeneraliING N-N PolskaKredyt BankPekaoPocztylionPolsatPZU Złota JesieńSAMPOSkarbiec – Emerytura
850,421233,513383,743
2,488,545338,155245,140358,602376,585
1,832,793154,803292,477448,534127,306
1,786,728442,830389,527
938,839245,284395,444
2,540,530367,916239,793397,907380,385
1,966,603140,816290,434452,376123,581
1,866,692510,090606,595
10.45.03.02.18.8
-2.211.01.07.3
-9.0-0.70.9
-2.94.5
15.255.7

8
{ego}* 240,114 - -Total 10,989,816 11,463,285 4.3
Source: ZUS* OFE Ego was accepted in 2003 by OFE Skarbiec Emerytura
At the end of December 2003, the 16 existing open pension funds had nearly 11.5 million
members, which represented an increase by nearly 0.5 million people in relation to the year
2002. This means that nearly 90% of professionally active population outside agriculture was
members of open pension funds.
3. Conditions for the Impact of Pension Funds on Poland’s Economic Development
Pension funds are the structures whose basic function is to provide material security
for future pensioners rather than stimulate economic development processes, although for
obvious reasons both those values are interrelated. A higher rate of growth usually means a
higher level of employment and higher salaries, and this ceteris paribus means a higher level
of retirement benefits. And the other way round: a lower rate of GDP growth means a higher
level of unemployment and lower salaries, and this ceteris paribus means worse retirement
benefits in future.
Nobody objects that the adoption of certain construction rules for a pension system
may affect national economic development processes both directly and indirectly. For
example, the determination of a retirement age has a direct impact on the shape and scale of
labour force supply, and ipso facto, among others, on the level of salaries (labour price). The
same indirect effect is caused by the determination of a retirement benefit level, because it is
translated into a burden of current labour costs and ipso facto into the price paid to
employees, which, as a further consequence, affects the competitiveness of business entities
and finally the level and dynamics of economic development.
While determining basic parameters for a retirement system, it would be ideal to
achieve such a situation in which instead of being a burden for development financing
processes it could become their driver. In other words, it would be ideal to shift this system
from the area of consumption to the area of investment. For obvious reasons, this is not fully
possible. Finally, retirement bonuses have to be paid and thus be a burden for the collected
pension fund, and at a certain moment they have to be converted into a consumptive
expenditure to some extent. This, however, does not mean that there is no place for converting

9
the funds collected for retirement purposes into pro-development funds at different stages and
in different components of the retirement system.
From the point of view of development processes, particularly promising are those
retirement system components that represent fully funded systems. In that case, they have a
direct impact on development processes through financial market institutions. In the language
of the economy, funds collected in a fully funded system become special purpose savings.
They are additionally multiplied through operations on the financial market, i.e. through
investments. Thus the bigger the part of the retirement system with a fully funded basis, the
stronger its direct influence on development processes. Of course, it should also be
remembered that at the same time this means that future retirement bonuses are more
dependent on the condition of future financial markets, in particular at the moment of the
‘redemption’ of retirement liabilities. The structure or the described relationships is outlined
in Figure 2.

10
Figure 2 Flow of money streams (M) and liabilities (L) in a retirement system
Contributions
Non-financialaccount
Non-financialagent
Budget
Financialbroker /OFE/
Financialaccount
Non-financialaccount
Retirementservice
institutions
/ZUS + ?/
Financialaccount
L
M L
L M
fund collection stage
L
M L
retirement bonus payment stage
Pensioners
L
M

11
It should be pointed out that retirement savings in the fully funded part of the
retirement system are invested on a financial market in two stages:
• until the retirement age is reached and the benefit is calculated;
• after the commencement of the payments of benefits until the moment when the system
has no more liabilities to the beneficiary.
At the first stage, this task is fulfilled by institutions that multiply contributions, and at
the second one by those servicing the retirement process. In some countries, both tasks are
fulfilled by the same entities, whereas in other ones they are separated. In Poland, this issue
has not been finally regulated so far.
In the repartition part of the system, pension contributions become the current income
of the state budget and their pro-development influence is exerted through the mechanism of
public expenditure.
Pension funds are currently the most popular form of multiplying pension
contributions in the world, and it should be immediately stressed that today they service the
optional part of retirement systems to the large extent, whereas the compulsory part is covered
by them only to a small extent.8 Other known solutions include public central savings funds,
to which part of pension contributions is transferred (e.g. in Singapore and Malaysia), and the
use of private investment funds for the purposes of managing capital funds collected in public
retirement systems.9 According to estimates, currently assets administered by pension funds
world-wide exceed $9 billion. The value of those assets constitutes nearly half of the value of
GDP in OECD countries (see Table 3). Their position is particularly prominent in such
countries as Switzerland, the Netherlands, UK, Iceland, USA, and Canada. On those markets,
their share in the capitalisation of financial markets ranges from 60% to 100%. In other
countries such as Germany, Italy or Norway, they are of little importance.
8 International pension funds and their advisors 2003, Aspire Publications, London 2003; Special feature on pension funds;Data 1997-2000 European Commission, Eurostat, Luxembourg; Preliminary results from the pension statistics data collectionand future direction of the project, OECD, DAFE/AS/PEN/WD (2003) 21, 07-Nov-2003.9 Compare N. Marska – Fundusze kapitałowe w finansowaniu świadczeń emerytalnych, niepublikowana praca doktorska,Uniwersytet Szczeciński, Szczecin 2003, p. 46-88.

12
Table 3: Importance of pensions fund investments for the economy and financialmarkets
OECDCountries
Fund Investments in Totalmillion USD
As % of GDP As % ofMarket Capitalisation
Year 2001 2002 2001 2002 2001 2002AustriaBelgiumCanadaDenmarkFinlandGermanyHungaryIcelandItalyNetherlandsNorwayPolandPortugalSpainSwedenSwitzerlandUKUSA
7,47412,639
365,60743,0737,828
62,6212,0716,256
19,373407,070
6,7964,767
-34,6978,397
269,0101,048,5516,667,300
9,00913,824
344,968--
75,4663,4318,441
24,194-
8,7878,063
16,303--
335,605-
5,934,300
3.95.6
51.927.16.53.44.0
82.31.8
106.04.02.7
-6.03.8
109.473.366.5
4.45.6
47.6--
3.85.2
100.52.0
-4.64.4
13.4--
125.5-
57.2
29.77.7
59.850.64.15.8
20.0157.4
3.781.39.8
18.2-
7.43.6
43.048.448.2
26.810.860.5
--
11.026.4
133.95.1
-12.928.037.8
--
61.4-
53.7
Total 8,973,529 6,782,390 50.9 43.6 43.5 49.7Other Selected CountriesBulgariaEstonia
83122
1741,012
0.52.0
1.014.7
16.77.0
24.149.1
Source: Preliminary results from the pension statistics data collection and future direction ofthe project, OECD, DAFFE/AS/PEN/WD(2003) 21.
4. Pension Funds on the Polish Financial Market: Scale of the Problem
In their role of financial institutions, pension funds operating in Poland only seem to
be the same as their counterparts existing in developed countries. This is connected not only
with the specific features of their liabilities, which as a result of the obligatory nature of the
system are much more stable and foreseeable, but also with the specific features of the Polish
economy and our financial markets. Thus, those differences exist both as regards the internal
features of those institutions and their macro-environment. As a result of the features of their
macro-environment, those funds may bring about many positive effects.10 In particular, this,
among others, may apply to:
10 D. Vittas – Pension reform and capital market development, WG 2414, World Bank, Washington DC, August 2000.

13
Increase in social savings, which in Poland are traditionally small. In the last period, the share
of accumulation in GDP is merely at the level of 20%, which creates unfavourable conditions
for development processes;
Reduction of the market cost of capital as a result of making the accumulated savings
available on the domestic financial market;
Development of the segment of institutional financial investors through the accumulation of
relatively large capital administered by specialised institutions oriented towards the
attainment of long-term goals;
Restructuring of domestic financial markets through the creation of demand for new types of
financial instruments and through the change of importance of traditional financial
institutions, banks, insurance companies and trust funds on such markets;
Introduction of the new practices of corporate order and the increase of the market and
environment transparency through stricter standards of asset management by pension funds,
which may, among others, considerably increase foreign investors’ trust in the Polish market.
All those potential effects are of fundamental importance to the Polish economy,
however their emergence is not a foregone conclusion, nor is the scale of their impact. This
depends both on decisions regarding the macro-environment and specific regulations.
The fact that the existence of fully funded pension funds considerably increases
savings in the national economy is beyond any doubt. Five years after the implementation of
the retirement system reform, at the end of 2003 those funds administered money in the
amount of nearly PLN 45 billion, which meant an increase by PLN 13.3 billion in relation to
the end of 2000 (see Table 4).
Table 4: Net assets of open pension funds (million PLN)
Open Pension FundName
31 December 2002 31 December2003 Increase (%)
AIGAllianz PolskaBankowyCommercial UnionCredit Suisse L&PDOMErgo HestiaGeneraliING N-N PolskaKredyt BankPekao
2,696.2839.7967.9
9,059.6761.6545.0555.3
1,057.86,996.2
214.0517.0
3,833.91,210.81,368.1
12,710.51,143.9
749.7915.4
1,481.510,046.9
264.2722.0
42.244.241.340.350.237.664.840.143.623.539.7

14
PocztylionPolsatPZU Złota JesieńSampoSkarbiec-Emerytura{ego}
658.5126.5
4,448.6914.5764.0442.3
937.5181.8
6,272.71,374.91,619.5
-
42.443.741.050.3
112.0 (34.3)-
Total 31,564,6 44,833,1 42,0Source: KNUiFE (Insurance and Pension Supervisory Commission) database
A similar scale of growth was achieved in 2002, when the net assets of open pension
funds increased by PLN 12.2 billion. We should note that those assets are strongly
concentrated between funds. Nearly 75% of them is controlled by four largest open pension
funds (Commercial Union, ING-Nationale Nederlanden, PZU Pogodna Jesień and AIG). The
other 12 entities control merely 25% of assets. This can be compared with the fact that in the
same period trust funds administered money of the order of PLN 30 billion, the assets of
insurance companies amounted to PLN 60 billion, whereas the assets of the banking sector
were nearly at the level of PLN 500 billion. In the coming several dozen years, the assets of
open pension funds will be still growing fast until the moment when the intensified
‘redemption’ of their liabilities begins, which will take place only after 15-20 years.
According to available estimates, in 2010 the value of the assets of open pension funds will
reach nearly PLN 170 billion.
Table 5 Projection of the value of net assets of open pension funds for the years 2004-2010 (million PLN)
Net Value of AssetsYearsBase Option a) Rate of
Return + 2%Rate of
Return + 1%Rate of
Return – 1%Rate of
Return – 2%2004 62.7 64.5 63.6 61.8 60.92005 79.5 82.8 81.2 77.9 76.32006 96.6 101.8 99.2 94.1 91.72007 112.5 120.0 116.2 108.9 105.52008 129.7 139.9 134.7 124.9 120.22009 148.1 161.5 154.6 141.9 135.92010 167.9 184.9 176.2 160.0 152.5a) The base scenario is a result of a forecast for the parameters taken as most reliable. It isassumed in it that among others the rate of return on open pension fund investments (withoutthe management fee) is 6% between 2003 and 2004, 4.5% in 2005, and 3% between 2005 and2010.Source: KNUiFE

15
5. Pension Funds on the Polish Financial Market: Opportunities for Using Open Pension
Fund Investment Potential
The importance of the future financial potential of open pension funds should be seen
from the perspective of possible Polish financial market development scenarios. The size of
that market will be finally the derivative of two circumstances:
Condition of the public finance sector;
Investment needs of the economy resulting, to the large extent, from the impact of Poland’s
accession to the European Union.
It can be estimated that in 2010 the projected supply of financial instruments will be probably
between PLN 520 billion and PLN 680 billion (realistic option: approx. PLN 590 billion),
compared with approx. PLN 310 billion in 2003. Thus, in the forecast it will be growing by
approx. 9.6% annually (pessimistic option: approx. 7.7%; optimistic option: approx. 11.9%).
Table 6: Instrument supply on the securities market by categories (cumulative) between2004 and 2010 (billion PLN)
Pessimistic Option Realistic Option Optimistic OptionYear
Stocka) Bonds Total Stocka) Bonds Total Stocka) Bonds Total
2004 39.3 332.1 371.4 49.3 343.3 392.6 53.6 353.9 407.5
2005 39.9 357.4 397.3 52.2 373.4 425.6 58.3 388.9 447.2
2006 40.1 381.9 422.0 54.4 403.3 457.7 62.9 425.8 488.7
2007 42.1 408.9 451.0 58.3 436.2 494.5 69.3 468.4 537.7
2008 44.4 435.0 479.4 62.7 469.0 531.7 76.4 512.5 588.9
2009 47.0 455.0 502.0 67.6 495.7 563.3 84.4 550.7 635.1
2010 49.7 469.9 519.6 72.9 517.3 590.2 93.2 586.5 679.7
a) free float
Source: KNUiFE
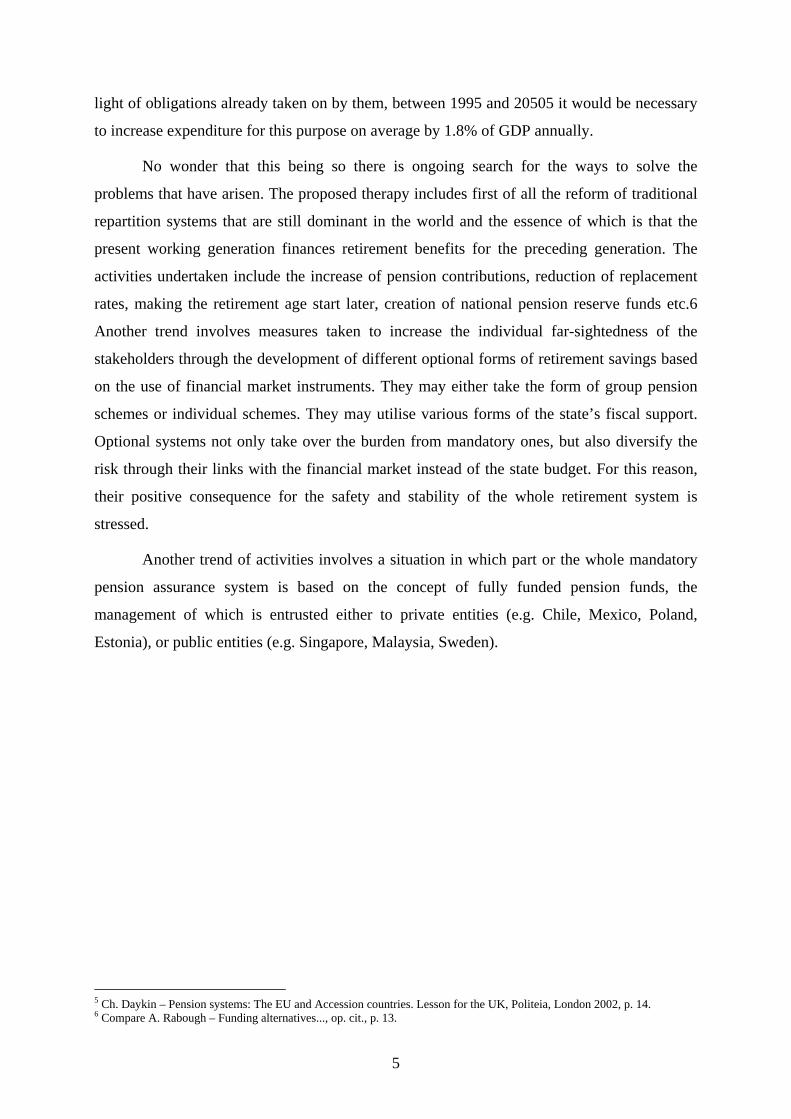
The ratio of open pension fund assets to the projected supply of securities in that period will
increase from approx. 13% to 25-32%, depending on the financial instrument supply
development scenario. In connection with the fact that the dynamics of open pension fund
assets is relatively independent from the situation of the national economy, the more
pessimistic the supply dynamics scenario, the higher the ratio.
16
Figure 3: Ratio of open pension fund demand to total financial instrument
supply between 2003 and 2010 (%)
0%
10%
20%
30%
40%
2003 2004 2005 2006 2007 2008 2009 2010
optimistic option realistic option pessimistic option
Source: KNUiFE
Taking into account the reality of the functioning of a single financial market in the European
Union, one should make an assumption of the actual concentration of the demand of Polish
financial institutions on the Polish market, given a rather supplementary role of investments
made abroad. While considering the issue of the investment power of open pension funds, it
should be remembered that those funds represent a specific segment of the Polish financial
market. They create a stream of savings in an autonomous manner, not in response to the real
demand from entities seeking capital, which results in a real threat such as the existence of
savings that may be difficult to manage on the domestic market. Therefore, there is a danger
such that in the conditions of strong legal restrictions for investment activities they may be
invested in an inefficient manner, which, in consequence, may lead to the emergence of a
speculative bubble effect.
This seems to be particularly possible on the stock market and it results from the relatively
low stock supply measured by the free float. The fast growing open pension fund assets
invested in stock on a long-term basis additionally reduce the available supply. A major scale
of privatisation through the stock exchange and a big number of offers addressed directly to
open pension funds might contribute to the limitation of the risk of insufficient supply on the
market. Such risk is likely to emerge particularly in the case of the low dynamics of stock
market development (pessimistic scenario). Then it may be expected that in 2010 open
pension fund assets will include the whole free float of the Stock Exchange.

17
Table 7: Open pension funds’ cumulative demand for share instruments between 2004and 2010 (billion)
Pessimistic Option Realistic Option Optimistic Option
25% of stock in
assets
35% of stock in
assets
25% of stock in
assets
35% of stock in
assets
25% of stock in
assets
35% of stock in
assets
2004 15.2 21.2 15.7 21.9 16.2 22.7
2005 18.9 26.5 19.9 27.8 20.9 29.2
2006 22.6 31.6 24.2 33.8 25.7 36.0
2007 25.8 36.2 28.1 39.4 30.4 42.6
2008 29.3 41.0 32.4 45.4 35.6 49.8
2009 32.9 46.1 37.0 51.8 41.2 57.7
2010 36.7 51.4 42.0 58.8 47.4 66.3
Source: KNUiFE
The scale of open pension funds’ demand for stock will depend on the structure of open
pension funds’ investment portfolios as well as on the rate of growth of their assets. It is
estimated that by the year 2010 the total demand will amount to PLN 37-66 billion.
Figure 4: Stock portfolio and the share of open pension funds in the stockmarket between 2003 and 2010
10.6 12.7 14.8 16.1 17.2 18.3 19.3 24.7 31.8 38.1
44.448.2 51.7
54.8 57.6
8.2
11.1 15.7
19.9 24.2
28.1
32.4
37.0
42.0
0
20
40
60
80
100
2003 2004 2005 2006 2007 2008 2009 20100
10
20
30
40
50
Share in free float (%) Share in capitalisation (%)
Value of stock in open pension funds’ portfolio (billion PLN)
% billion PLN
Source: KNUiFE
In the realistic option, this will mean that nearly 60% of the stock portfolio of all the public
companies from the Stock Exchange will be part of open pension fund assets. At the same
time, their share in the capitalisation of the Stock Exchange will be higher than 19.3%.

18
As regards the market of debt instruments, it will not be exposed to the risk of a
speculative bubble to the same extent as the stock market. This results from the fact that it is
much deeper. Between 2003 and 2010 it will still be clearly dominated by treasury securities
whose share in the market of debt instruments, however, is likely to decline from approx. 90%
to approx. 80%.
Figure 5: Ratio of open pension fund demand to debt instrument supply between 2003and 2010 (%)
5%
10%
15%
20%
25%
2003 2004 2005 2006 2007 2008 2009 2010
pessimistic option realistic option optimistic option
Source: KNUiFE
The sector of commercial securities, both short- and long term ones, clearly has a chance to
develop faster than the market of treasury and municipal securities. Its development will
significantly depend first of all on prospects for the development of the Polish economy. The
same remark applies to the market of mortgage bonds, instruments that are especially
attractive from the point of view of open pension funds. They have a chance to develop
dynamically because of significant housing needs.
Open pension funds’ demand for debt instruments, including, in particular, treasury securities,
seems to be certain. Those instruments, however, represent a major part of the portfolio of all
the types of financial institutions. They are also acquired more and more willingly by
individual investors. This may cause shortfalls in the supply of instruments with
characteristics that are particularly desired by those investors. It will lead to the reduced
profitability of such instruments, and a negative impact on the investment results of open
pension funds will not be avoided, thereby affecting adversely the level of future retirement
benefits.

19
Figure 6: Ratio of open pension funds’ demand to debt instrument supply between 2003and 2010
16.8 18.1 19.4 20.9
22.7
10.1 12.8
14.9 30.9 43.9
55.7
67.6 78.8
90.8
103.7 117.5
0
10
20
30
40
50
2003 2004 2005 2006 2007 2008 2009 2010 0
30
60
90
120
150
Share in supply (%) Value of bonds in open pension funds’ portfolio (billion PLN)
% billion PLN
Source: KNUiFE
According to KNUiFE estimates, open pension funds’ demand for debt instruments in 2010
may amount to PLN 90-100 billion in the realistic option and even PLN 113-133 billion in the
optimistic option. This means that open pension funds’ investments will include more than
20% of that segment of the financial market.
6. Pension Funds and Development Opportunities for the Polish Economy: Problems toSolve
In the analysis made so far, the relationship between pension funds and economic
development processes has been seen through the prism of a linear model, which was based
on the adoption of a simplified picture of the impact of those institutions on the accumulation
of social savings, and then through investment processes on financial markets on the
financing of economic needs. At the same time, the fact that such relationship does not occur
in the case of the repartition part of the retirement system was stressed. In that part, the Social
Insurance Company does not accumulate physically the contributions transferred to it, but
only enters the fact of receiving them in the books and in connection with this it does not
appear as an investor on the financial market. It is simply an inter-generation flow vehicle,
which collects pension contributions and uses them to finance the payment of due retirement

20
benefits. Collection applies to the working generation, whereas the benefits apply to the
generation that is already resting from work. Any possible shortfall or surplus of pension
contributions in relation to payments made in respect of retirement benefits is made up or
taken over by the state budget. In this way, the repartition part of the retirement system
appears to be a burden for development processes, whereas the fully funded part represented
by pension funds appears to be their support (see Figure 7).

21
Figure 7. Use of savings in the retirement system composed of repartition and fully funded parts
Source: M. Góra - op.cit p. 65
contribution
Financial account/liabilities/
Non-financialaccount (liabilities)
Financial agent/OFE/
Non-financial agent/ZUS/ Budget
Commercialsector
M Consumption orinvestments
Investments
L
L
M
M
M
L
M
L
M
L
M

22
Now let us try to bring this simplified picture a bit closer to the Polish reality. First of all, we
will notice that during the period of ‘reforging’ the old retirement financing system into the
new one pension funds are provided with a part of the contribution that in fact represents the
lost current proceeds of the Social Insurance Company. In this way, they create additional
burdens for the state budget, which has to increase the scale of subsidies for the retirement
system. Only between 1999 and 2003 were open pension funds provided with PLN 38.4
billion in the form of contributions. In efficient terms, this meant that in that period the state
budget deficit was increased exactly by that amount. To realise what scale of the problem we
are faced with, let us take the fact that between 2004 and 2010 contributions transferred to
pension funds will constitute about 6-7% of the total state budget expenditure. At the same
time, they represent more than one-third of the projected budget deficit in the same period.
This is a result of adopting a fast track of the retirement system reorganisation proposed in
1998. Today one can wonder whether it was not too ambitious as for the capabilities of the
Polish economy /compare Table 8/.

23
Table 8: State budget burden in respect of contributions paid to open pension funds
6.27.536.016,2442009a
6.27.534.815,3102008a
6.07.432.014,4042007a
7.39.137.316,7232006a
6.99.234.915,8642005a
7.39.234.515,0822004a
5.56.827.510,6542003
5.26.724.29, 6542002
5.06.226.98, 7062001
5.05.649.47, 6032000
1.71.818.32, 2851999
% of State BudgetExpenditure
% of State BudgetIncome
% of DeficitContributions +Total Debt
(million PLN)
YEARS
a) EstimateSource: KNUiFE

24
The high transfers of pension contributions to open pension funds mean an increase of the
financial needs of the state budget and its stronger presence on financial markets (compare
Table 8). In this way, according to well-known mechanisms, commercial sector investors are
forced out of the financial market, and this may have a negative impact on investment
processes in the economy. Even more interestingly, open pension funds, two-thirds of whose
investment portfolios are on average composed of treasury debt instruments, also participate
actively in this ‘trade’. Thus, there is a paradoxical situation in which the large part of open
pension funds’ resources created at the expense of the state budget is used for financing the
budget deficit instead of serving investment purposes.
A change of this situation may require both regulatory activities and other relevant
macroeconomic measures. A solution to this problem is not made easier by a poor market of
debt instruments, and, in particular, share-based enterprises. In the latter case, a real threat is
the occurrence of the speculative bubble phenomenon resulting from the low supply of such
instruments in relation to the open pension funds’ investment potential, and, at the same time,
from a serious limitation of the possibility of making investments abroad. In the latter point,
as it seems, the autonomy of our decisions will to a higher and higher extent be limited by
decisions taken in the European Union, which begins to apply more and more common
regulations to the segments of pension funds.
As a result of significantly growing open pension funds among investors on the stock market,
there is also a growing impact of those institutions on development decisions taken in
enterprises. On the one hand, this puts their reporting and management standards in order and
creates better environment for the absorption of other investors, in particular foreign ones. On
the other hand, however, it entails the stronger and stronger involvement of open pension
funds in management processes and creates a growing threat of the occurrence of a moral
hazard, and distracts open pension funds from their main areas of competence.

25
References
1. Daykin, Ch. (2002) Pensions systems: The EU and Accession countries. Lesson for
the UK, London, Politeia.
2. European Commission (2002) Special feature on pension funds. Data 1997-2000,
Luxembourg, European Commission, Eurostat.
3. Góra, M. (2003) System emerytalny, Warszawa, PWE.
4. Hadyniak, B., Monkiewicz, J. (1999) Fundusze emerytalne. II Filar, Warszawa,
Poltext.
5. International pension funds and their advisors 2003 (2003) London, Aspire
Publications.
6. Marska, N. (2003) Fundusze Kapitałowe w finansowaniu świadczeń emerytalnych,
(unpublished PhD dissertation) Szczecin, Uniwersytet Szczeciński
7. OECD (2003) Preliminary results from the pensions statistic data collection and future
direction of the project, OECD, DAFE/AS/PEN/WD.
8. Rabough, A. (2003) Funding alternatives for Government sponsored retirement
systems - a global review. Global Pensions Quarterly, August.
9. Vittas, D. (2000) Pension reform and capital market development. WG 2414.
Washington, World Bank, August.
26
Statistical Appendix
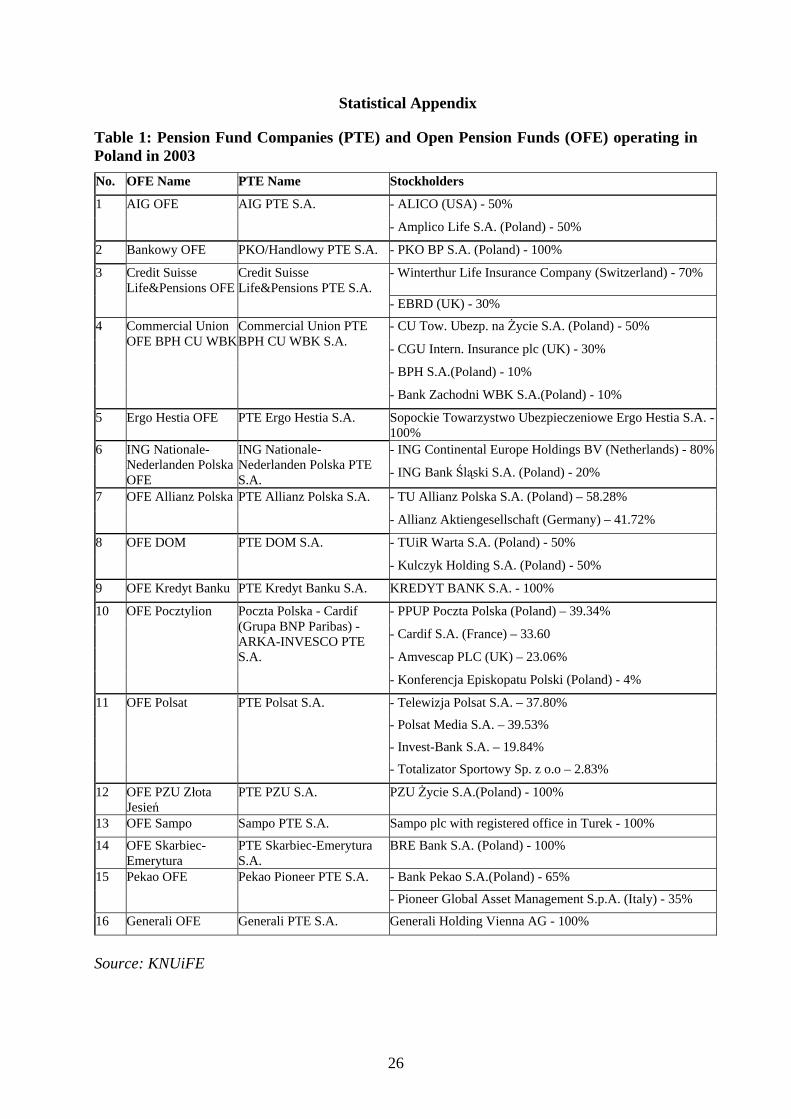
Table 1: Pension Fund Companies (PTE) and Open Pension Funds (OFE) operating inPoland in 2003No. OFE Name PTE Name Stockholders
- ALICO (USA) - 50%1 AIG OFE AIG PTE S.A.
- Amplico Life S.A. (Poland) - 50%
2 Bankowy OFE PKO/Handlowy PTE S.A. - PKO BP S.A. (Poland) - 100%
3 Credit SuisseLife&Pensions OFE
Credit SuisseLife&Pensions PTE S.A.
- Winterthur Life Insurance Company (Switzerland) - 70%
- EBRD (UK) - 30%
- CU Tow. Ubezp. na Życie S.A. (Poland) - 50%
- CGU Intern. Insurance plc (UK) - 30%
- BPH S.A.(Poland) - 10%
4 Commercial UnionOFE BPH CU WBK
Commercial Union PTEBPH CU WBK S.A.
- Bank Zachodni WBK S.A.(Poland) - 10%
5 Ergo Hestia OFE PTE Ergo Hestia S.A. Sopockie Towarzystwo Ubezpieczeniowe Ergo Hestia S.A. -100%- ING Continental Europe Holdings BV (Netherlands) - 80%6 ING Nationale-
Nederlanden PolskaOFE
ING Nationale-Nederlanden Polska PTES.A. - ING Bank Śląski S.A. (Poland) - 20%
- TU Allianz Polska S.A. (Poland) – 58.28%7 OFE Allianz Polska PTE Allianz Polska S.A.
- Allianz Aktiengesellschaft (Germany) – 41.72%
- TUiR Warta S.A. (Poland) - 50%8 OFE DOM PTE DOM S.A.
- Kulczyk Holding S.A. (Poland) - 50%
9 OFE Kredyt Banku PTE Kredyt Banku S.A. KREDYT BANK S.A. - 100%
- PPUP Poczta Polska (Poland) – 39.34%
- Cardif S.A. (France) – 33.60
- Amvescap PLC (UK) – 23.06%
10 OFE Pocztylion Poczta Polska - Cardif(Grupa BNP Paribas) -ARKA-INVESCO PTES.A.
- Konferencja Episkopatu Polski (Poland) - 4%
- Telewizja Polsat S.A. – 37.80%
- Polsat Media S.A. – 39.53%
- Invest-Bank S.A. – 19.84%
11 OFE Polsat PTE Polsat S.A.
- Totalizator Sportowy Sp. z o.o – 2.83%
12 OFE PZU ZłotaJesień
PTE PZU S.A. PZU Życie S.A.(Poland) - 100%
13 OFE Sampo Sampo PTE S.A. Sampo plc with registered office in Turek - 100%
14 OFE Skarbiec-Emerytura
PTE Skarbiec-EmeryturaS.A.
BRE Bank S.A. (Poland) - 100%
15 Pekao OFE Pekao Pioneer PTE S.A. - Bank Pekao S.A.(Poland) - 65%
- Pioneer Global Asset Management S.p.A. (Italy) - 35%
16 Generali OFE Generali PTE S.A. Generali Holding Vienna AG - 100%
Source: KNUiFE

27
Table 2: Age structure of OFE members as of 31 December 200318-20 21-25 26-30 31-35 36-40 41-45 46-50 51 and older Total
OFE NamePeople OFE
% People OFE% People OFE
% People OFE% People OFE
% People OFE% People OFE
% People OFE% People OFE %
AIG OFE 53,642 5.71 151,995 16.19 186,188 19.83 153,037 16.30 133,965 14.27 131,890 14.05 91,838 9.78 20,404 2.17 938,839 8.19
OFE Allianz Polska10,842 4.42 37,925 15.46 55,322 22.55 44,486 18.14 35,743 14.57 32,591 13.29 20,584 8.39 4,284 1.75 245,283 2.14
Bankowy OFE 26,896 6.80 82,136 20.77 82,241 20.80 66,217 16.75 51,302 12.97 49,253 12.46 29,411 7.44 5,639 1.43 395,442 3.45Commercial UnionOFE BPH CUWBK
55,666 2.19 379,796 14.95 645,481 25.41 520,117 20.47 384,698 15.14 331,020 13.03 184,277 7.25 28,249 1.11 2,540,526 22.16
Credit Suisse Life& Pensions OFE 24,157 6.57 73,426 19.96 77,285 21.01 60,659 16.49 48,270 13.12 42,952 11.67 27,790 7.55 6,043 1.64 367,916 3.21
OFE DOM 16,707 6.97 50,288 20.97 49,961 20.84 37,634 15.70 29,749 12.41 29,328 12.23 20,278 8.46 5,088 2.12 239,756 2.09
OFE Ergo Hestia 24,470 6.15 92,282 23.19 78,782 19.80 59,642 14.99 48,009 12.07 49,289 12.39 35,779 8.99 9,327 2.34 397,902 3.47
Generali OFE 17,943 4.72 61,980 16.29 69,822 18.36 63,301 16.64 58,665 15.42 59,115 15.54 40,083 10.54 9,112 2.40 380,376 3.32ING Nationale-Nederlanden PolskaOFE
85,925 4.37 325,390 16.55 486,890 24.76 378,589 19.25 271,693 13.82 230,668 11.73 137,907 7.01 26,185 1.33 1,966,594 17.16
OFE Kredyt Banku 7,275 5.17 46,857 33.28 27,109 19.25 17,546 12.46 14,098 10.01 14,171 10.06 10,798 7.67 2,935 2.08 140,814 1.23
Pekao OFE 18,143 6.25 74,710 25.72 54,426 18.74 39,402 13.57 33,755 11.62 34,792 11.98 26,666 9.18 8,158 2.81 290,433 2.53
OFE Pocztylion 30,885 6.83 98,201 21.71 75,669 16.73 66,179 14.63 62,749 13.87 61,735 13.65 39,478 8.73 9,051 2.00 452,372 3.95
OFE Polsat 6,728 5.44 32,522 26.32 21,977 17.78 16,784 13.58 15,314 12.39 14,969 12.11 11,349 9.18 3,911 3.16 123,581 1.08
OFE PZU ZłotaJesień 104,616 5.60 358,493 19.20 357,211 19.14 292,488 15.67 250,837 13.44 269,652 14.45 178,057 9.54 34,125 1.83 1,866,677 16.28
Sampo OFE 26,987 5.29 116,011 22.74 111,471 21.85 79,184 15.52 58,805 11.53 56,007 10.98 39,693 7.78 11,084 2.17 510,089 4.45
OFE Skarbiec-Emerytura 38,700 6.38 133,847 22.07 127,819 21.07 95,714 15.78 74,413 12.27 71,117 11.72 49,627 8.18 13,965 2.30 606,593 5.29
Total 549,582 4.79 2,115,859 18.46 2,507,654 21.88 1,990,979 17.37 1,572,065 13.71 1,478,549 12.90 943,615 8.23 197,560 1.72 11,463,193 100.00Source: ZUS
28
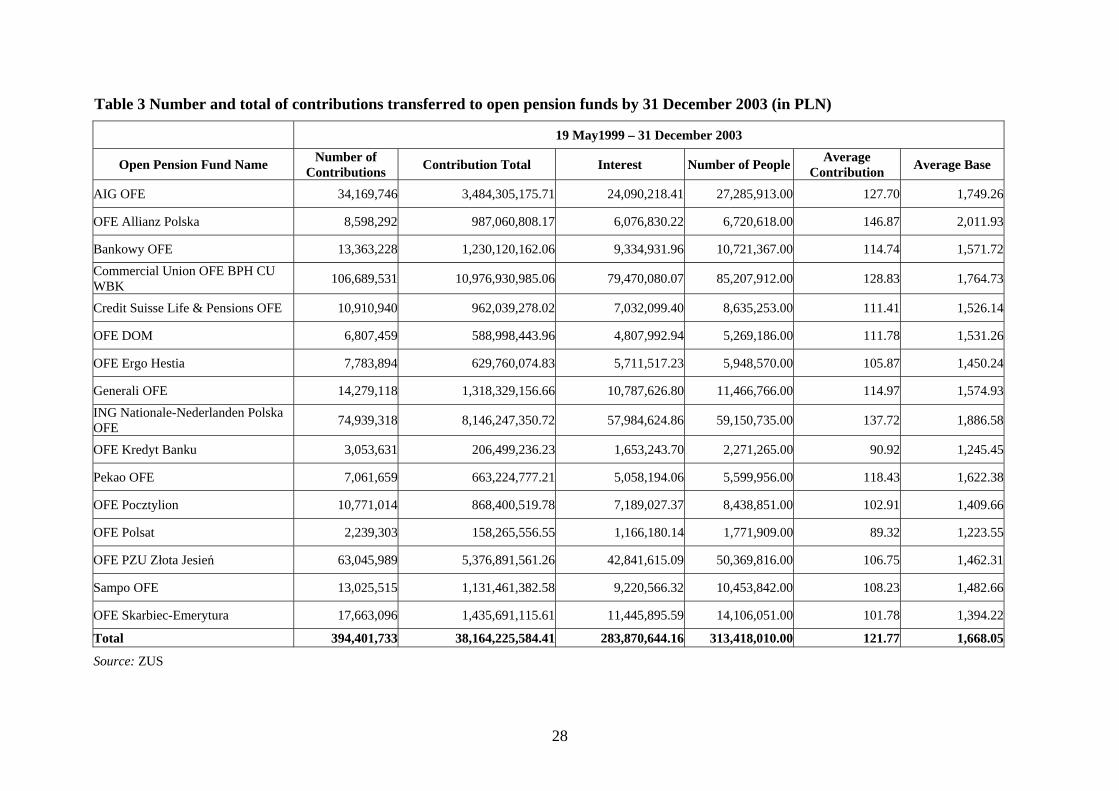
Table 3 Number and total of contributions transferred to open pension funds by 31 December 2003 (in PLN)
19 May1999 – 31 December 2003
Open Pension Fund Name Number ofContributions Contribution Total Interest Number of People Average
Contribution Average Base
AIG OFE 34,169,746 3,484,305,175.71 24,090,218.41 27,285,913.00 127.70 1,749.26
OFE Allianz Polska 8,598,292 987,060,808.17 6,076,830.22 6,720,618.00 146.87 2,011.93
Bankowy OFE 13,363,228 1,230,120,162.06 9,334,931.96 10,721,367.00 114.74 1,571.72Commercial Union OFE BPH CUWBK 106,689,531 10,976,930,985.06 79,470,080.07 85,207,912.00 128.83 1,764.73
Credit Suisse Life & Pensions OFE 10,910,940 962,039,278.02 7,032,099.40 8,635,253.00 111.41 1,526.14
OFE DOM 6,807,459 588,998,443.96 4,807,992.94 5,269,186.00 111.78 1,531.26
OFE Ergo Hestia 7,783,894 629,760,074.83 5,711,517.23 5,948,570.00 105.87 1,450.24
Generali OFE 14,279,118 1,318,329,156.66 10,787,626.80 11,466,766.00 114.97 1,574.93ING Nationale-Nederlanden PolskaOFE 74,939,318 8,146,247,350.72 57,984,624.86 59,150,735.00 137.72 1,886.58
OFE Kredyt Banku 3,053,631 206,499,236.23 1,653,243.70 2,271,265.00 90.92 1,245.45
Pekao OFE 7,061,659 663,224,777.21 5,058,194.06 5,599,956.00 118.43 1,622.38
OFE Pocztylion 10,771,014 868,400,519.78 7,189,027.37 8,438,851.00 102.91 1,409.66
OFE Polsat 2,239,303 158,265,556.55 1,166,180.14 1,771,909.00 89.32 1,223.55
OFE PZU Złota Jesień 63,045,989 5,376,891,561.26 42,841,615.09 50,369,816.00 106.75 1,462.31
Sampo OFE 13,025,515 1,131,461,382.58 9,220,566.32 10,453,842.00 108.23 1,482.66
OFE Skarbiec-Emerytura 17,663,096 1,435,691,115.61 11,445,895.59 14,106,051.00 101.78 1,394.22
Total 394,401,733 38,164,225,584.41 283,870,644.16 313,418,010.00 121.77 1,668.05
Source: ZUS

29
Table 4 Structure of open pension fund portfoliosState as of: 31 December 2003
Open Pension FundNational
InvestmentFund Stock
Stock of CompaniesListed on Regulated
Stock MarketTreasury Bills Bank Deposits and
Bank Securities Bonds InvestmentsMade Abroad Other Deposits All Deposits in Total
AIG OFE 1,288,727,896.90 309,360,318.60 2,121,469,498.00 28,862, 715.05 39,671,370.703,788,091,799.25OFE Allianz Polska 367,750,286.35 24,647,846.81 795,062,767.91 1,187,460,901.07Bankowy OFE 7,418,785.50 462,941,088.50 60,566,066.05 115,426,491.09 702,188,119.07 10,021,000.001,358,561,550.21Commercial Union OFE BPHCU WBK 3,876,403,983.55 290,426,126.48 418,010,116.13 7,709,594,681.02 209,172,714.14 11,505,004.1012,515,112,625.42
Credit Suisse Life &Pensions OFE 2,080,804.10 364,440,614.03 3,826,377.47 19,385,649.74 731,701,022.00 3,626,272.201,125,060,739.54
OFE DOM 14,440,515.10 244,944,242.30 67,921,845.88 32,232,736.10 371,607,642.00 11,978,539.81 743,125,521.19OFE Ergo Hestia 284,570,657.30 29,761,385.42 36,026,638.66 553,410,260.00 629,799.00904,398,740.38Generali OFE 491,199,042.95 63,913,287.74 900,500,739.00 1,455,613,069.69ING Nationale-NederlandenPolska OFE 1,816,352.70 3,264,327,411.65 898,912,927.15 36,299,652.40 5,710,319,595.63 26,569,269.609,938,245,209.13
OFE Kredyt Banku 81,561,720.00 23,283,722.50 3,787,340.89 144,280,969.18 8,006,300.00260,920,052.57Pekao OFE 11,059,715.37 190,705,666.26 34,756,198.03 46,769,544.73 406,136,915.60 22,044,549.60711,472,589.59OFE Pocztylion 3,492,830.61 288,817,450.85 43,648,253.90 38,604,388.80 535,295,625.35 20,042,000.00929,900,549.51OFE Polsat 57,880,319.09 19,410,175.65 9,900,000.00 91,162,371.50 178,352,866.24OFE PZU Złota Jesień 1,950,452,082.15 132,302,542.41 430,922,888.75 3,573,106,297.76 57,629,318.44 45,045,416.406,189,458,545.91Sampo OFE 403,925,011.75 88,516,433.08 847,371,037.58 3,598,079.201,343,410,561.61OFE Skarbiec-Emerytura 5,021,537.04 497,640,537.95 115,146,266.48 25,068,132.21 955,749,349.50 5,020,000.001,603,645,823.18Total OFE 45,330,540.42 14,116,288,011.58 1,719,961,887.42 1,698,871,465.7326,148,956,891.10 307,643,287.44 195,779,060.80 44,232,831,144.49Source: KNUiFE

30
Table 5 Structure of investment portfolios of pension funds in OECD countries (%)OECDCountries
Cash and Deposit Treasury Securities EnterpriseBonds
Loans Stock Real Estate Trust Funds Insurance Other
Austria 2.1 79.5 - 0.5 14.3 0.5 - - 3.1Belgium 4.4 13.6 3.2 0.3 14.6 1.1 55.8 2.6 4.1Canada 4.9 26.6 0.8 0.8 28.7 4.2 32.8 - 1.3Denmark 0.3 10.2 37.7 00.5.1 39.1 2.7 9.9 - 0.0Finland - - 42.9 25.6 16.8 8.5 0.0 0.0 31.4Germany 2.3 41.4 - - 15.8 6.4 8.1 - 0.4Hungary 4.4 68.1 5.2 14.8 8.7 - 5.8 - 7.8Iceland 2.2 39.6 15.9 14.8 25.8 0.2 - - 1.5Italy 13.5 49.1 0.8 - 8.6 16.4 6.5 0.3 4.9Korea 1.4 6.3 40.9 5.2 0.6 - - - 45.6Mexico 0.2 85.4 14.4 0.0 0.0 0.0 0.0 0.0 0.0Netherlands 0.0 - 36.2 8.1 47.8 4.8 - 0.0 3.1Norway 4.7 - - 3.9 19.5 5.9 - - 66.0Poland 4.2 66.8 1.2 0.0 27.8 - 0.0 - 0.0Portugal 12.0 25.2 23.5 0.0 16.7 8.6 11.8 - 2.2Spain 4.7 37.2 20.9 0.0 19.6 0.2 4.3 - 13.0Sweden 81.6 - - 18.4 - - - - -Switzerland 7.6 28.5 0.0 5.2 28.2 11.2 16.2 - 3.0UK 2.6 14.5 4.7 0.5 53.8 4.3 11.4 6.2 2.0USA 6.3 8.4 9.1 0.4 38.6 1.9 14.5 9.9 10.9Total 5.1 12.4 9.4 1.5 39.7 3.2 13.8 7.1 7.7Other CountriesBulgaria 27.8 62.2 7.0 0.0 0.2 2.8 0.0 0.0 0.0Estonia 14.9 34.0 26.1 - 11.4 - 13.5 - 0.1Slovenia 21.9 54.7 19.5 0.0 2.5 0.0 1.4 - 0.0Source: OECD

31
Table 6 Value of net assets of individual open pension funds between 1999 and 2003 31-12-99 31-12-00 31-12-01 31-12-02 31-12-03OFE Net Asset Value Net Asset Value Net Asset Value Net Asset Value Net Asset ValueAIG 180,642,668 897,909,085 1,703,498,159 2,696,202,465 3,833,870,686Allianz Polska 30,584,241 223,915,633 482,361,934 839,749,049 1,210,747,223ARKA-INVESCO 5,307,099 44,699,940 Bankowy 76,975,931 318,502,007 619,321,325 967,904,010 1,368,055,927Commercial Union BPH CU WBK 678,942,844 2,878,222,727 5,648,658,131 9,059,591,659 12,710,482,786Credit Suisse Life & Pensions 50,501,215 237,723,987 474,123,010 761,570,286 1,143,908,966DOM 34,909,055 140,846,757 304,306,040 544,994,831 749,711,841ego 33,966,349 147,333,943 281,725,870 442,306,503 EPOKA 3,111,458 18,124,438 Ergo Hestia 32,417,613 146,551,054 279,225,559 555,310,057 915,359,942Generali 96,948,220 386,156,299 705,618,970 1,057,836,417 1,481,544,019ING Nationale-Nederlanden Polska 478,206,070 2,123,735,598 4,139,986,650 6,996,190,270 10,046,859,081Kredyt Bank 1,613,548 28,818,169 108,699,629 213,962,423 264,161,336Pekao 10,008,125 69,174,227 328,901,811 517,023,476 721,973,593Pioneer 13,939,049 66,065,111 Pocztylion 27,870,888 156,640,981 409,167,855 658,470,382 937,525,518Polsat 2,948,426 36,746,185 80,816,955 126,499,076 181,839, 955PZU Złota Jesień 360,247,767 1,450,862,690 2,816,422,480 4,448,613,814 6,272,652,391Rodzina 271,884 9,205,980 Sampo 75,454,869 309,588,621 582,745,598 914,450,697 1,374,876,424Skarbiec-Emerytura 60,076,819 234,255,064 443,840,739 763,971,253 1,619,499,648Total 2,254,944,138 9,925,078,498 19,409,420,713 31,564,646,670 44,833,069,336
Source: OECD

32
Table 7 Investment results of open pension funds in 2000-2003
2000 2001 2002OFE average rate of return 13.1% 7.3% 13.6%Inflation indices (CPI) 8.6% 3.7% 0.9%NBP reference rate 16.5% 19.0% 11.5%12-month bank deposit 13.1% 15.0% 8.0%52-week treasury bills 15.8% 17.3% 10.8%Warsaw Stock Exchange Index (WIG) change -1.3% -22.0% 3.2%WIG 20 Index change 1.5% -33.5% -2.7%Domestic bond return index 9.4% 24.7% 20.0%

33
Table 8 Pension funds in selected countries of Central and Eastern EuropeCountry Implementation Date System Description Assets, Members System Evolution
Czech Republic Pillar II – not plannedPillar III - 1994
Pillar II – national, repartitionPillar III – fully funded, optional, withdefined contribution
Assets as of the end of 2002 –CZK 69 billion
Members at the end of 2002 –3.4 million
Pillar III – Strong market concentration – thenumber of funds declined from 44 in 1994 to 13at the end of 2002. Expected further decline inthe number of funds.The largest fund has a 27% share in the market,five largest funds - 73%.
Hungary Pillar II - 1998Pillar III - 1994
Pillar I - national, repartitionPillar II – fully funded, obligatory, withdefined contribution.Second pillar funds are open.Pillar III – fully funded, optional, withdefined contribution.Third pillar funds can be open or closed –limited only to the employees of selectedcompanies (company schemes).Hungarian pension funds operating both inthe second and third pillars are non-profitorganisations and they are owned by theirmembers. The authorities of those fundsmanage them independently or theyestablish co-operation with an externalmanagement company.
Assets at the end of 2002Pillar II – HUF 413.1 billionPillar III – HUF 358 billion
Members at the end of 2002Pillar II – 2.23 millionPillar III – 1.18 million
Pillar II – Strong market concentration – thenumber of funds declined from 39 in 1999 to 18at the end of 2002. Expected further decline inthe number of funds.The largest fund has a 25% share in the market,five largest funds -79%.
Pillar III – Strong market concentration – thenumber of funds declined from 315 in 1998 to82 at the end of 2002. Expected further declinein the number of funds.The largest fund has a market share of morethan 10%, five largest funds – more than 45%.Second pillar funds have a possibility ofrunning several pension schemes that vary interms of the degree of exposure. The membershave a possibility of moving the money freelybetween the schemes within a single fund.
Slovakia Pillar II – will start in2005Pillar III – 1996
Pillar I – national, repartition,Pillar II – fully funded, obligatory, withdefined contribution.Pillar III – fully funded, optional, withdefined contribution.
Assets at the end of 2002 –SKK 7.6 billionMembers at the end of 2002 –457,000.
Pillar III – There are four pension fundsoperating in Slovakia for several years now.
Lithuania Pillar II – not plannedin the nearest futurePillar III - 2000
Pillar II – national, repartition,Pillar III – fully funded, optional, withdefined contribution.Third pillar funds have a possibility ofrunning several pension schemes that varyin terms of the degree of exposure. The
Assets – no data,Members – at least 439,000(end of 2003).
Pillar III – There were no pension funds until2004. The market was controlled by pensioncompanies that enjoyed preferential taxes,which made the existence of funds unprofitable.Only the Law of 2001 created better conditionsfor the development of funds. Enrolment for

34
members have a possibility of moving themoney freely between the schemes withina single fund.
them took place between September andDecember 2003. The funds started theiroperations in early 2004. Currently there are tenpension funds that are managing 22 pensionschemes.
Latvia Pillar II - 2001Pillar III - 1998
Pillar I – national, repartitionPillar II – fully funded, obligatory, withdefined contribution. Open funds.Pillar III – fully funded, optional, withdefined contribution. Closed and openfunds. Closed funds are limited only to theemployees of selected companies.Participation in the second pillar isobligatory for all the newly insured andpeople who were under 30 years of age atthe moment when the reform started.People at 31-49 years of age had an optionto become fund members at the momentwhen the reform started.
Assets at the end of 2002Pillar II – LTL 12.3 millionPillar III - LTL 14 million
Members at the end of 2002Pillar II – 335,000Pillar III – 20,000
Pillar II - Between 2001 and 2002, the moneyaccumulated within the second pillar wasmanaged by the state. Privately managed fundsstarted their operations only from the beginningof 2003. In 2003 there were five pension fundsrunning ten pension schemes.
Pillar III – According to the status as of 2002there were four pension funds, three of whichwere open. In total, they managed nine pensionschemes.
Funds II and III have a possibility of runningseveral pension schemes that vary in terms ofthe degree of exposure. The members have apossibility of moving the money freely betweenthe schemes within a single fund.
Estonia Pillar II - 2002Pillar III - 1998
Pillar I – national, repartitionPillar II – fully funded, obligatory, withdefined contribution.Pillar III – fully funded, obligatory, withdefined contribution.Second and third pillar funds have apossibility of running several pensionschemes that vary in terms of the degree ofexposure. The members have a possibilityof moving the money freely between theschemes within a single fund.
AssetsPillar II – 700,000,000Estonian kroons at the end ofthe second quarter of 2003Pillar III – 63,000,000Estonian kroons at the end of2002.
MembersPillar II – 350,000 at the endof 2003 (projection), 207,000 atthe end of 2002.Pillar III – 2,300 people at theend of 2002.
Pillar II – Obligatory for people beginning theperiod of professional activity, optional forothers. There are six pension funds runningfifteen pension schemes. The funds may investin one of three ways: only in debt instruments,up to 25% in stock and up to 50% in stock.About half of the members choose the mostaggressive fund, and each of the two otherfunds is chosen by more than 20% of members.Pillar III – Two types of products: lifeinsurance (eleven pension schemes run by fourcompanies) and pension funds (4).
Source: Investments of pension funds in CEE countries. Research report.