Embed Size (px)
Citation preview
J. Exp. Biol. (1965), 43, 39-54 3 9With 10 text-figures
Printed in Great Britain
THE FORMATION OF URINE BY THE PROSOBRANCHGASTROPOD MOLLUSC VIVIPARUS VIVIPARUS LINN.
BY C. LITTLE
Department of Zoology, Cambridge*
{Received 23 November 1964)
In all aquatic molluscs examined (Anodonta—Picken, 1937; Haliotis—Harrison,1962; Octopus—Potts & Martin, 1963), blood is filtered through the wall of the heart(or branchial heart appendages in Octopus) into the pericardium. The pericardial fluidpasses to the kidney, where secretion and reabsorption modify it to form the finalurine. In the terrestrial pulmonates, however (Achatina—Martin, Harrison &Stewart, 1953; Helix pomatia and Archachatina—Vorvohl, 1961), blood appears to befiltered directly into the kidney, and reabsorption takes place in the ureter. In thepresent paper the inorganic composition of the urine of the freshwater prosobranchViviparus viviparus is analysed and the rate of urine production is measured. Themechanism of urine formation is then examined in some detail.
METHODS
In general, the methods of analysis were the same as those described in a first paperon Viviparus (Little, 1965). Operational techniques are described in the text.
Removal of urine samples. A hole was filed in the shell approximately 1 cm. fromthe aperture. This revealed the surface of the mantle and the ureter could be clearlyseen. Urine was withdrawn in a glass pipette, diameter 50 ji at the tip.
Estimation of 14C inulin. The volumes of samples were measured in small self-adjusting pipettes, and samples were transferred to planchets. Spreading was assistedby dilution with distilled water, and samples were dried down under an infra-redlamp. 14C was counted using a Nuclear-Chicago gas-flow detector. The time for1000 counts was taken, and results are expressed as counts per minute or c.p.m.Counts were taken three times and averaged. The background count was never morethan 15 c.p.m.
THE FREEZING-POINT DEPRESSION AND COMPOSITION OF THE URINE
(1) Snails living in stream water
The composition of the urine of snails living in stream water is given in Table 1,and is compared with the composition of the blood of the same individuals. The urineis markedly hypotonic to the blood. A of the urine appears to be lower than thatexpected from its salt content, but this is probably due to the fact that A measure-ments are inaccurate in this low range. Sodium and chloride make up most of the Aof the urine, but some calcium is present. The pH of urine is slightly lower than that
• Present address: Institute of Marine Science, University of Miami, Florida.
\o C. LITTLE
of blood. This may be related to the presence of uric acid; the kidney contains muchuric acid (Spitzer, 1937), and yellow crystals have at times been seen in the ureter.
(2) The relation between A of the urine and A of the blood
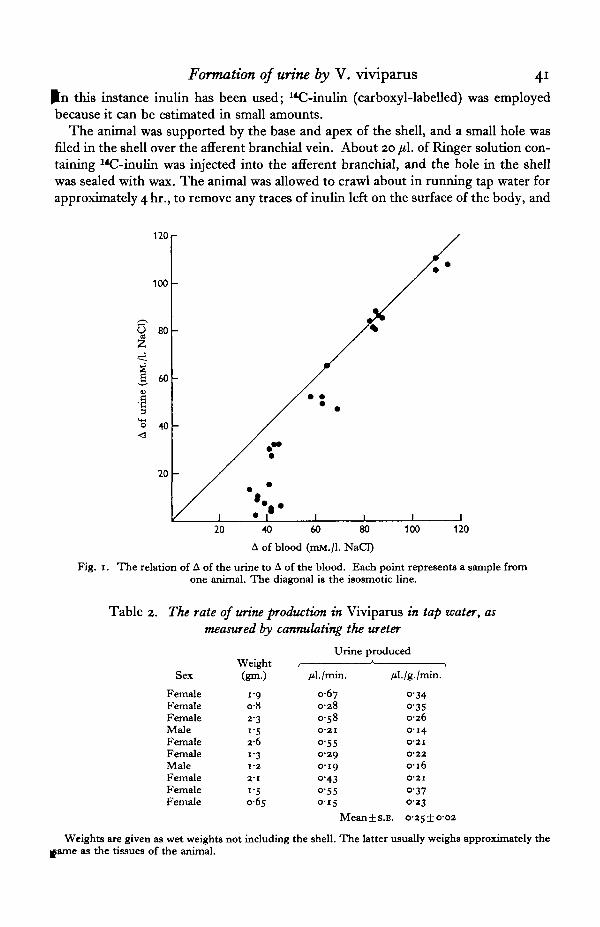
Fig. 1 shows the relation between A of the blood and A of the urine of snails fromstream water and from dilutions of sea water. The urine is hypotonic to the blood inconcentrations up to 10% sea water, but above this it is isotonic with the blood.
Table 1. Composition of the urine of snails from stream water
Measurement Blood Urine
A, rnM./l. NaCl±s.E. 375± I-I (7) TS± »•* (7)Sodium, mM./I. ±s.E. 32-o±o-7 (7) o,-o± 1-2(7)Calcium, mM./I.±s.E. 5'8±o-7 (7) i-5±o-2 (7)Chloride, mM./l. + s.E. 2Q-o± 1-1(7) I O - O ± I - 3 ( 7 )pH±s.E. 7-68±oo4(6) 7-521006(6)
Brackets denote number of observations.
THE RATE OF PRODUCTION OF URINE
(1) Snails in tap waterDirect measurement. A hole was filed in the shell to expose the mantle and a length
of ureter. The animal was supported by the base and apex of the shell, and a small holewas cut in the distal end of the ureter to allow the insertion of a polythene tube(external diameter 1 mm., internal diameter 0-7 mm.). The tube was held in placeby a small clip of polythene and beryllium-copper clamped across the ureter. Thesnail was covered with tap water and the system was tested for leaks using concentrateddyes.
The polythene tube was placed on a flat surface slightly below the level of theanimal, thus causing a slight negative pressure. As urine was produced the meniscusadvanced along the tube and its position was marked at intervals. The volume betweenthe marks was later measured with an 'Agla' micrometer syringe. The temperaturewas maintained at 190 C. (± i° C) .
It was found that in some cases the rate of production of urine decreased over thefirst 15 min. This was regarded as a kind of shock effect, and figures for the first15 min. were discarded. The rate of urine production was measured over a period ofapproximately 1 hr. in most cases, although some animals were followed for severalhours to check that the rate of production did not decline. Table 2 gives figures forten animals taken from stream water.
Measurement by the use of inulin. If the concentrations of a substance which islost only via the urine are known for the final urine and for the medium in which theanimal is placed, then the volume of urine passed after a given time may be calculated:
where Ue = concentration in urine,Mc = concentration in external medium,Uv = volume of urine produced,Mv = volume of external medium.
Formation of urine by V. viviparus 41
^n this instance inulin has been used; 14C-inuUn (carboxyl-labelled) was employedbecause it can be estimated in small amounts.
The animal was supported by the base and apex of the shell, and a small hole wasfiled in the shell over the afferent branchial vein. About 20 fi\. of Ringer solution con-taining 14C-inulin was injected into the afferent branchial, and the hole in the shellwas sealed with wax. The animal was allowed to crawl about in running tap water forapproximately 4 hr., to remove any traces of inulin left on the surface of the body, and
120
100
O 80
60
40
20
20 40 60 80
A of blood (mM./l. NaCI)
100 120
Fig. 1. The relation of A of the urine to A of the blood. Each point represents a sample fromone animal. The diagonal is the isosmotic line.
Table 2. The rate of urine production in Viviparus in tap water, asmeasured by camtulating the ureter
Sex
FemaleFemaleFemaleMaleFemaleFemaleMaleFemaleFemaleFemale
Weight(gin-)
1 9o-82-3i-52 6
i"31-2
2-1
i-S0-65
Urine
/il./min.
0-670 2 80 5 80 2 1
0-550-290-190-430 5 50 1 5
produced
/il./g./min.
o-34o-350 2 60 1 4O-2IO-220-16O 2 I
O-37O-23
Mean±s.E. o-25±o-O2
Weights are given as wet weights not including the shell. The latter usually weighs approximately thefame as the tissues of the animal.
42 C. LITTLE
to allow for any changes in the rate of urine production consequent upon the injectionof liquid into the blood.
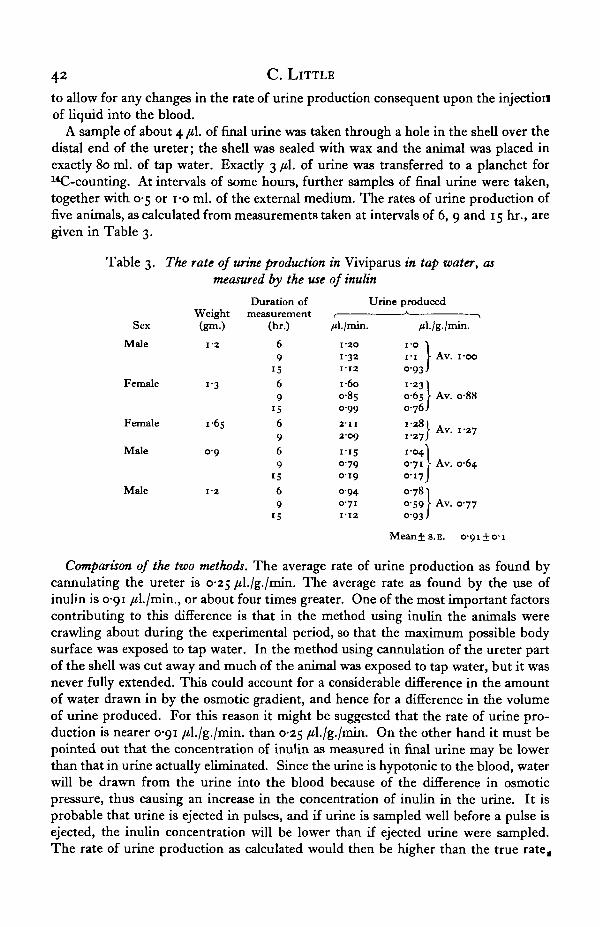
A sample of about 4 /A. of final urine was taken through a hole in the shell over thedistal end of the ureter; the shell was sealed with wax and the animal was placed inexactly 80 ml. of tap water. Exactly 3 /A. of urine was transferred to a planchet for14C-counting. At intervals of some hours, further samples of final urine were taken,together with 0-5 or i-o ml. of the external medium. The rates of urine production offive animals, as calculated from measurements taken at intervals of 6, 9 and 15 hr., aregiven in Table 3.
Table 3. The rate of urine production in Viviparus in tap water, asmeasured by the use of inulin
Sex
Male
Female
Female
Male
Male
Weight(gin.)
1 2
i-3
1 6 5
0 9
1-2
Duration ofmeasurement
(hr.)
69
15
69
IS6969
15
69
15
/tl./min.
I-2O
1-32I - I 2
I DO0-85099
211209
1 1 50 7 9
0-190 9 40 7 1I - I 2
Urine produced
/il./g./min.
i-o 1I-I \ Av. i-ooo-93 >
i-a3»065 \ Av. 088076 J
[• Av. 1'27
1-04]071 > Av. 0-64
017J0781059 \ Av. 0 77093)
Mean+s.E. 091
Comparison of the two methods. The average rate of urine production as found bycannulating the ureter is 0-25 /d./g./min. The average rate as found by the use ofinulin is 0-91 /il./min., or about four times greater. One of the most important factorscontributing to this difference is that in the method using inulin the animals werecrawling about during the experimental period, so that the maximum possible bodysurface was exposed to tap water. In the method using cannulation of the ureter partof the shell was cut away and much of the animal was exposed to tap water, but it wasnever fully extended. This could account for a considerable difference in the amountof water drawn in by the osmotic gradient, and hence for a difference in the volumeof urine produced. For this reason it might be suggested that the rate of urine pro-duction is nearer 0-91 /il./g./min. than 0-25 /il./g./min. On the other hand it must bepointed out that the concentration of inulin as measured in final urine may be lowerthan that in urine actually eliminated. Since the urine is hypotonic to the blood, waterwill be drawn from the urine into the blood because of the difference in osmoticpressure, thus causing an increase in the concentration of inulin in the urine. It isprobable that urine is ejected in pulses, and if urine is sampled well before a pulse isejected, the inulin concentration will be lower than if ejected urine were sampled.The rate of urine production as calculated would then be higher than the true
Formation of urine by V. viviparus 43
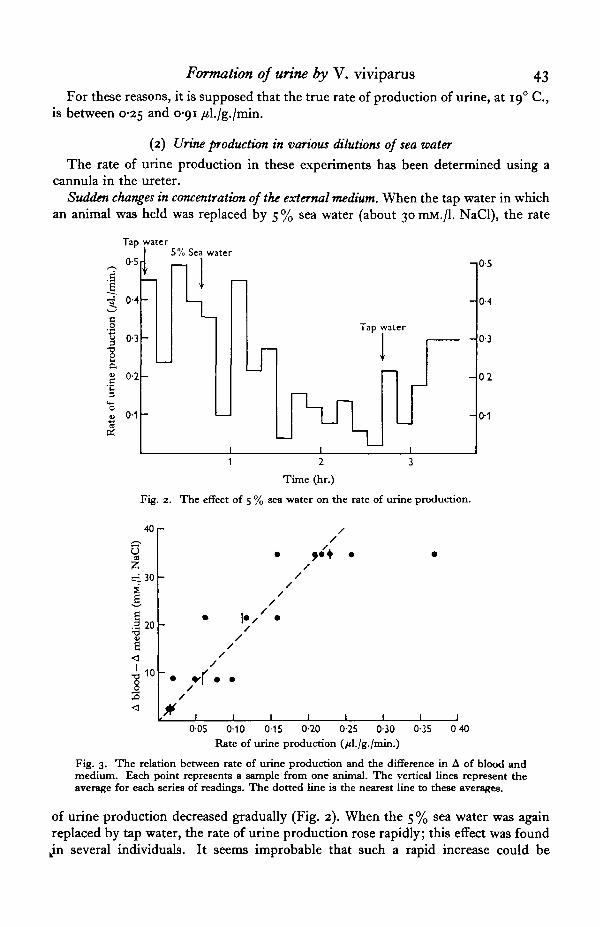
For these reasons, it is supposed that the true rate of production of urine, at 190 C,is between 0-25 and 0-91 /il./g./min.
(2) Urine production in various dilutions of sea water
The rate of urine production in these experiments has been determined using acannula in the ureter.
Sudden changes in concentration of the external medium. When the tap water in whichan animal was held was replaced by 5 % sea water (about 30 mM./l. NaCl), the rate
Tap water
0-55% Sea water
.5
3I 0-3
Ia.S 0-2
0-1
Tap water
Lfl
Lr
0-5
0-4
0-3
02
0-1
1 2 3
Time (hr.)
Fig. 2. The effect of 5 % sea water on the rate of urine production.
40
o
=£30
20
10
005 0-10 015 0-20 0-25 0-30 0-35Rate of urine production (/tl./g./min.)
0 40
Fig. 3. The relation between rate of urine production and the difference in A of blood andmedium. Each point represents a sample from one animal. The vertical lines represent theaverage for each series of readings. The dotted line is the nearest line to these averages.
of urine production decreased gradually (Fig. 2). When the 5 % sea water was againreplaced by tap water, the rate of urine production rose rapidly; this effect was found
kin several individuals. It seems improbable that such a rapid increase could be
44 C. LITTLE
activated by an increase in blood volume. The alternative would be that ViviparuXcan detect changes in salt concentration of the external medium and can adjust itsrate of urine production accordingly.
Animals adapted to various dilutions of sea water. The rates of production of urineby snails adapted to various dilutions of sea water are plotted against the amount bywhich the blood is hypertonic to the medium (in Fig. 3). The points fall approximatelyon a straight line passing through the origin, suggesting that all the water expelled inthe urine is taken up osmotically.
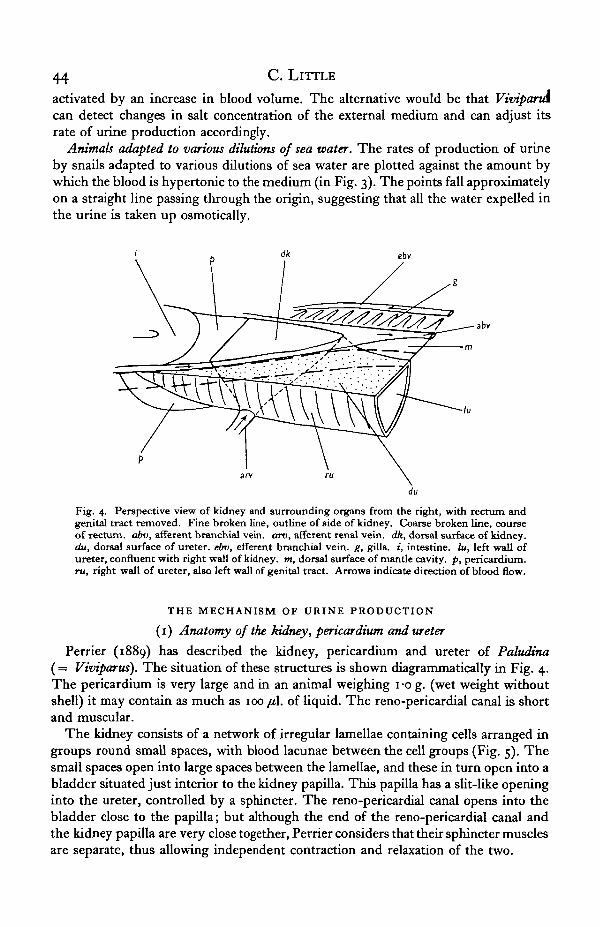
Fig. 4. Perspective view of kidney and surrounding organs from the right, with rectum andgenital tract removed. Fine broken line, outline of side of kidney. Coarse broken line, courseof rectum, abv, afferent branchial vein, arv, afferent renal vein, dk, dorsal surface of kidney.du, dorsal surface of ureter, ebv, efferent branchial vein, g, gills. «, intestine, lu, left wall ofureter, confluent with right wall of kidney, m, dorsal surface of mantle cavity, p, pericardium.ru, right wall of ureter, also left wall of genital tract. Arrows indicate direction of blood flow.
THE MECHANISM OF URINE PRODUCTION
(1) Anatomy of the kidney, pericardium and ureter
Perrier (1889) has described the kidney, pericardium and ureter of Paludina(= Viviparus). The situation of these structures is shown diagrammatically in Fig. 4.The pericardium is very large and in an animal weighing i-o g. (wet weight withoutshell) it may contain as much as 100 /i\. of liquid. The reno-pericardial canal is shortand muscular.
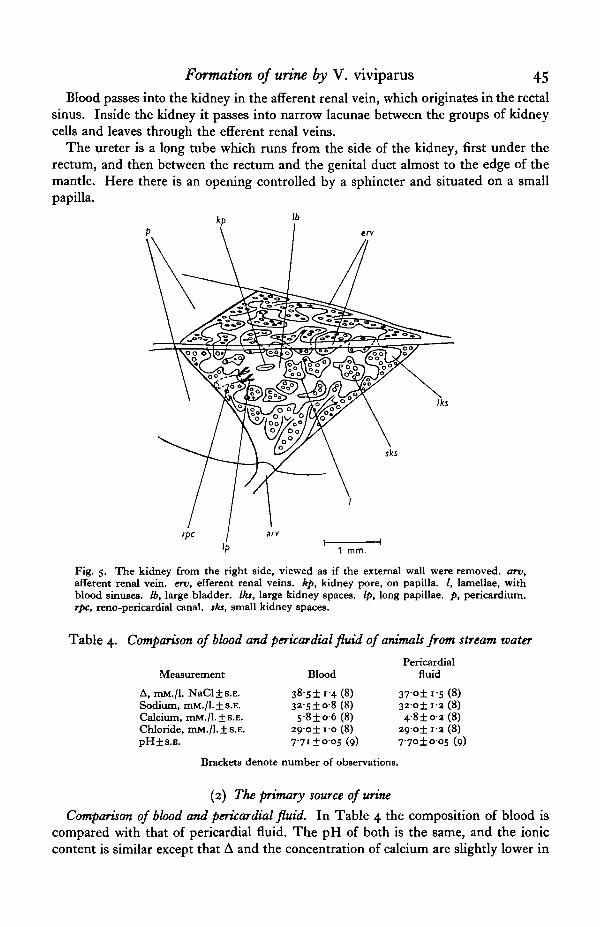
The kidney consists of a network of irregular lamellae containing cells arranged ingroups round small spaces, with blood lacunae between the cell groups (Fig. 5). Thesmall spaces open into large spaces between the lamellae, and these in turn open into abladder situated just interior to the kidney papilla. This papilla has a slit-like openinginto the ureter, controlled by a sphincter. The reno-pericardial canal opens into thebladder close to the papilla; but although the end of the reno-pericardial canal andthe kidney papilla are very close together, Perrier considers that their sphincter musclesare separate, thus allowing independent contraction and relaxation of the two.
Formation of urine by V. viviparus 45
Blood passes into the kidney in the afferent renal vein, which originates in the rectalsinus. Inside the kidney it passes into narrow lacunae between the groups of kidneycells and leaves through the efferent renal veins.
The ureter is a long tube which runs from the side of the kidney, first under therectum, and then between the rectum and the genital duct almost to the edge of themantle. Here there is an opening controlled by a sphincter and situated on a smallpapilla.
kp «•
Iks
rpc
1 mm.
Fig. 5. The kidney from the right side, viewed as if the external wall were removed, arv,afferent renal vein, erv, efferent renal veins, kp, kidney pore, on papilla. /, lamellae, withblood sinuses. Ib, large bladder. Iks, large kidney spaces. Ip, long papillae, p, pericardium.rpc, reno-pericardial canal, sks, small kidney spaces.
Table 4. Comparison of blood and pericardial fluid of animals from stream water
Measurement
A, mM./l. NaCl±s.E.Sodium, mM./l. ±s.E.Calcium, mM./l. ±s.E.Chloride, mM./l. ±s.E.pH±8.K.
Blood
38-5±i-4(8)32-S±o-8(8)5-8±o-6(8)
29-o±i-o (8)7-71 ±005 (9)
Pericardialfluid
37-o± i-S(8)32O± 1-3 (8)4-8± 0-2(8)
29O±I-3(8)
77O±oos (9)
Brackets denote number of observations.
(2) The primary source of urine
Comparison of blood and pericardial fluid. In Table 4 the composition of blood iscompared with that of pericardial fluid. The pH of both is the same, and the ioniccontent is similar except that A and the concentration of calcium are slightly lower in
46 C. LITTLE
pericardial fluid. In a first paper on Viviparus (Little, 1965) it was suggested that)some calcium in the blood is bound, and if pericardial fluid is an ultrafiltrate of theblood, containing less protein, a lower concentration of calcium would be expected.The protein content of pericardial fluid does indeed appear to be lower than that ofblood, although no direct measurements have been made. The viscosity is much lowerthan that of blood, and when sucked up into a pipette under liquid paraffin, themeniscus does not break as it does when blood is pipetted. The breaking of such ameniscus is thought to be due to the deposition of a thin protein layer on the wallsof the capillary. Furthermore, pericardial fluid is never blue, while blood may bebright blue from the haemocyanin.
These data all suggest that pericardial fluid could be an ultra-filtrate of the blood.The flow of liquid from the pericardium through the reno-pericardial canal. The
following experiments were carried out to demonstrate that filtration actually occurs.A method was devised by which a cannula could be fitted into the reno-pericardial
canal. A polythene capillary (external diameter 800 ft, internal diameter 400 ft) wasdrawn until the external diameter was 300 fi and the internal diameter about 120/1.The end of the capillary was cut diagonally as is the end of a hypodermic needle.With the animal supported by the base and apex of the shell, and with a large holefiled in the shell to reveal the pericardium and the proximal end of the ureter, theureter was opened and the rectum was folded back to expose the side of the kidney.The capillary described above was inserted through the kidney papilla, and by carefulturning towards the posterior end of the kidney it was pushed through the reno-pericardial canal so that the end protruded into the pericardium. The area around thekidney papilla was covered with liquid paraffin and flooded with concentrated dyedissolved in Ringer solution to reveal any leaks. The inserted capillary was connectedto a length of polythene capillary (internal diameter approximately 800 fi) which wasplaced on a flat surface a little below the level of the animal. Gentle suction wasapplied and liquid flowed along the tube until the pericardium was drained.
In order to be able to impose variations of blood pressure a cannula was insertedinto the efferent branchial vein which leads directly to the heart. The cannula was aPyrex tube, approximately 1 mm. in diameter, and tapering rapidly to a diameter of120 fi at the tip. It was pressed through the wall of the vein towards the heart untilthe diameter of the inserted portion was sufficient to stretch the walls of the veinslightly. The end of the cannula was supported on soft plasticene to allow it to followmovements of the animal. It was attached to a tube leading to a reservoir of Ringersolution which could be set at different heights. A fine suspension of Indian ink wasadded to the Ringer solution to show that the flow of liquid from the heart into thepericardium was not due to any rupture of the wall of the heart.
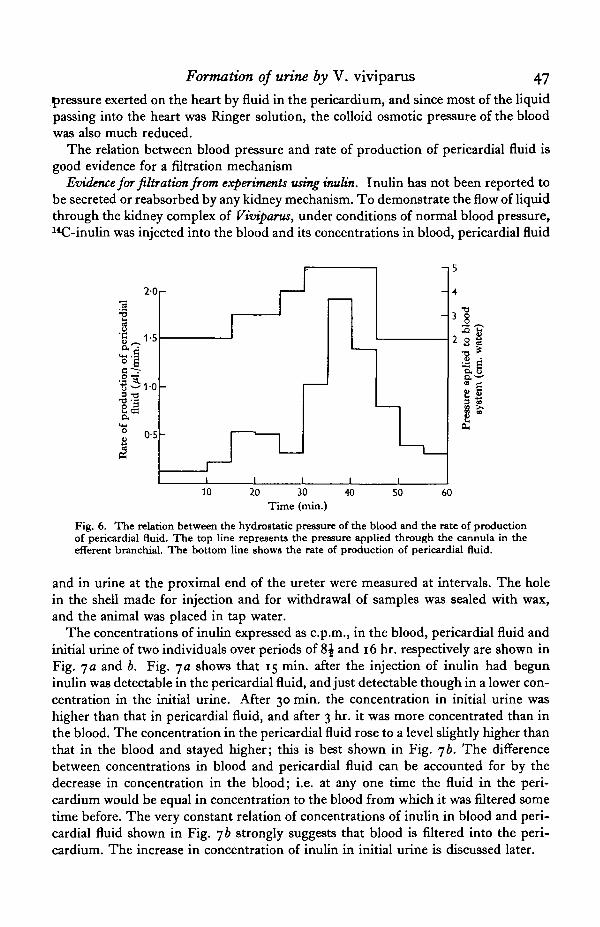
Results obtained from a typical animal are given in Fig. 6. An increase in pressureapplied through the cannula in the efferent branchial vein results in an increased rateof flow of pericardial fluid; a decrease in pressure produces a fall in the rate of flow ofpericardial fluid.
The rate of production of pericardial fluid at a blood pressure of 5 cm. of water ishigher than the average rate of urine production (Tables 2 and 3), although pressuresas high as 5 cm. have been recorded in the efferent branchial veins of some indi-viduals. It must be remembered, however, that in this experiment there was no back
Formation of urine by V. viviparus 47
pressure exerted on the heart by fluid in the pericardium, and since most of the liquidpassing into the heart was Ringer solution, the colloid osmotic pressure of the bloodwas also much reduced.
The relation between blood pressure and rate of production of pericardial fluid isgood evidence for a filtration mechanism
Evidence for filtration from experiments using inulin. Inulin has not been reported tobe secreted or reabsorbed by any kidney mechanism. To demonstrate the flow of liquidthrough the kidney complex of Viviparus, under conditions of normal blood pressure,14C-inulin was injected into the blood and its concentrations in blood, pericardial fluid
1C ~ro -a"6 3
L U
J
10
OS
1 -
-
-
I
!
I I I 1
- 4
10 20 30Time (min.)
40 50 60
Fig. 6. The relation between the hydrostatic pressure of the blood and the rate of productionof pericardial fluid. The top line represents the pressure applied through the cannula in theefferent branchial. The bottom line shows the rate of production of pericardial fluid.
and in urine at the proximal end of the ureter were measured at intervals. The holein the shell made for injection and for withdrawal of samples was sealed with wax,and the animal was placed in tap water.
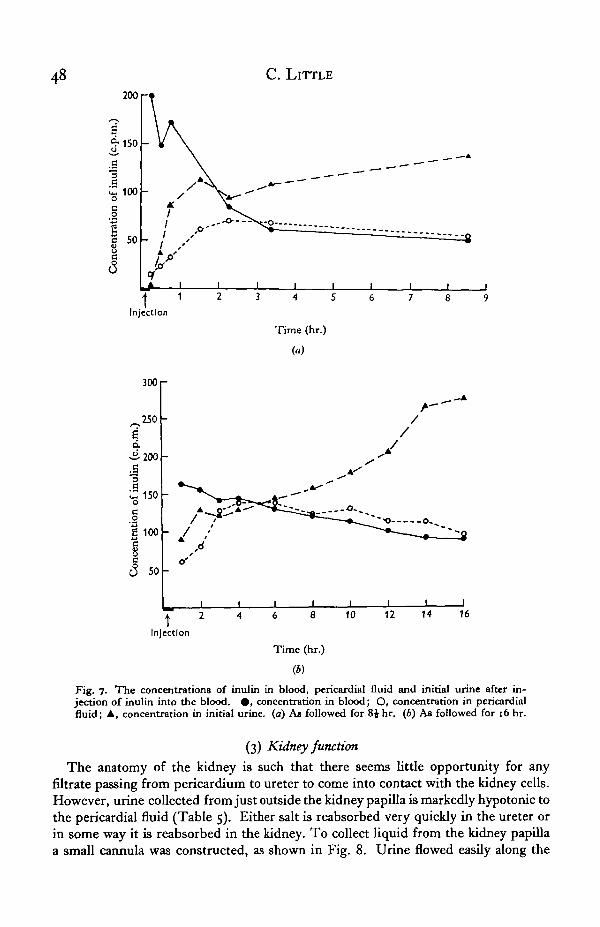
The concentrations of inulin expressed as c.p.m., in the blood, pericardial fluid andinitial urine of two individuals over periods of 8J and 16 hr. respectively are shown inFig. ja and b. Fig. ya shows that 15 min. after the injection of inulin had beguninulin was detectable in the pericardial fluid, and just detectable though in a lower con-centration in the initial urine. After 30 min. the concentration in initial urine washigher than that in pericardial fluid, and after 3 hr. it was more concentrated than inthe blood. The concentration in the pericardial fluid rose to a level slightly higher thanthat in the blood and stayed higher; this is best shown in Fig. yb. The differencebetween concentrations in blood and pericardial fluid can be accounted for by thedecrease in concentration in the blood; i.e. at any one time the fluid in the peri-cardium would be equal in concentration to the blood from which it was filtered sometime before. The very constant relation of concentrations of inulin in blood and peri-cardial fluid shown in Fig. 76 strongly suggests that blood is filtered into the peri-cardium. The increase in concentration of inulin in initial urine is discussed later.
C. LITTLE
200 r
InjectionTime (hr.)
(a)
300 r
Time (hr.)
(b)
Fig. 7. The concentrations of inulin in blood, pericardial fluid and initial urine after in-jection of inulin into the blood. • , concentration in blood; O, concentration in pericardialfluid; A, concentration in initial urine, (a) As followed for 8Jhr. (6) As followed for 16 hr.
(3) Kidney function
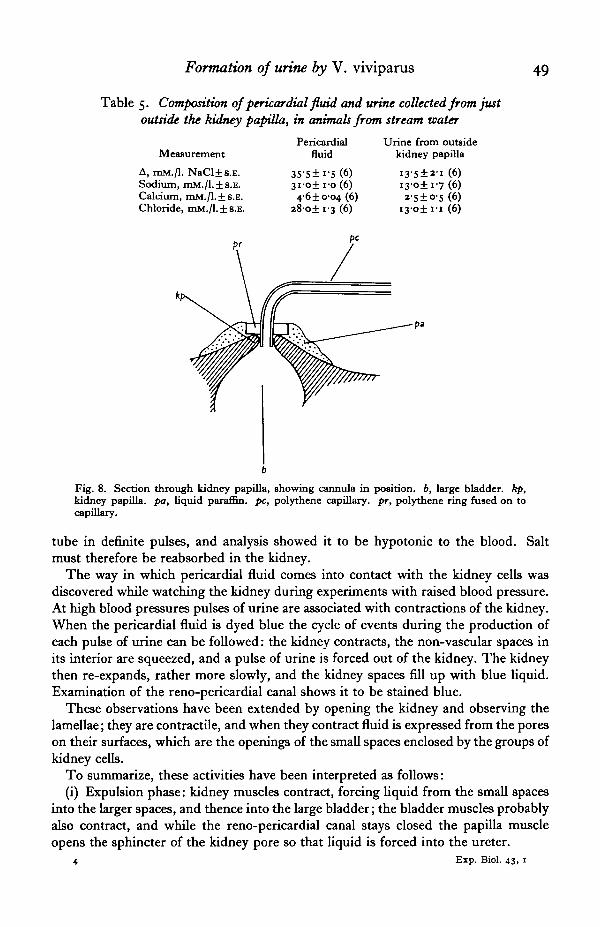
The anatomy of the kidney is such that there seems little opportunity for anyfiltrate passing from pericardium to ureter to come into contact with the kidney cells.However, urine collected from just outside the kidney papilla is markedly hypotonic tothe pericardial fluid (Table 5). Either salt is reabsorbed very quickly in the ureter orin some way it is reabsorbed in the kidney. To collect liquid from the kidney papillaa small cannula was constructed, as shown in Fig. 8. Urine flowed easily along the
Formation of urine by V. viviparus 49
Table 5. Composition of pericardial fluid and urine collected from justoutside the kidney papilla, in animals from stream water
Measurement
A, mM./l. NaCl±s.E.Sodium, mM./l.±s.E.Calcium, mM./l. ±s.E.Chloride, mM./l. ±s.E.
Pericardialfluid
35-5± i-S(6)3i-o±i-o (6)46±0-04 (6)
28o±i-3 (6)
Urine from outsidekidney papilla
(6)i3-o±i-7 (6)a-5±o-5 (6)
i 3 - o ± i i (6)
Fig. 8. Section through kidney papilla, showing cannula in position, b, large bladder, kp,kidney papilla, pa, liquid paraffin, pc, polythene capillary, pr, polythene ring fused on tocapillary.
tube in definite pulses, and analysis showed it to be hypotonic to the blood. Saltmust therefore be reabsorbed in the kidney.
The way in which pericardial fluid comes into contact with the kidney cells wasdiscovered while watching the kidney during experiments with raised blood pressure.At high blood pressures pulses of urine are associated with contractions of the kidney.When the pericardial fluid is dyed blue the cycle of events during the production ofeach pulse of urine can be followed: the kidney contracts, the non-vascular spaces inits interior are squeezed, and a pulse of urine is forced out of the kidney. The kidneythen re-expands, rather more slowly, and the kidney spaces fill up with blue liquid.Examination of the reno-pericardial canal shows it to be stained blue.
These observations have been extended by opening the kidney and observing thelamellae; they are contractile, and when they contract fluid is expressed from the poreson their surfaces, which are the openings of the small spaces enclosed by the groups ofkidney cells.
To summarize, these activities have been interpreted as follows:(i) Expulsion phase: kidney muscles contract, forcing liquid from the small spaces
into the larger spaces, and thence into the large bladder; the bladder muscles probablyalso contract, and while the reno-pericardial canal stays closed the papilla muscleopens the sphincter of the kidney pore so that liquid is forced into the ureter.
4 Exp. Biol. 43, 1
20
1-5
1
o>
10
0-5
C. LITTLE
if wl wl 't, 't
0-35
0-30 2 '
0-25 OS.
05
0-4
0-3
0-2
0-1
Io
I0)
i80 120
Time (min.)
160 200
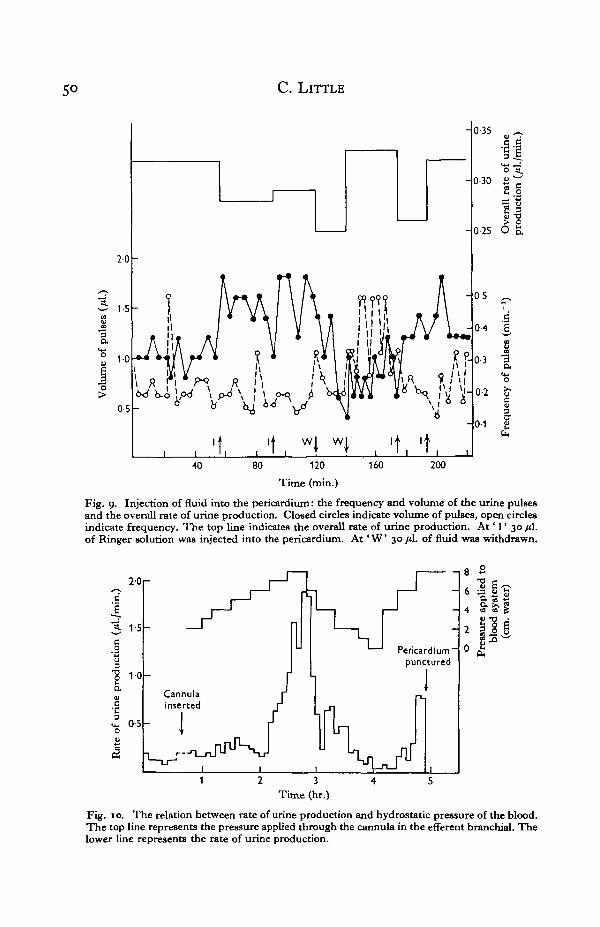
Fig. 9. Injection of fluid into the pericardium: the frequency and volume of the urine pulsesand the overall rate of urine production. Closed circles indicate volume of pulses, open circlesindicate frequency. The top line indicates the overall rate of urine production. At ' I ' 30 /*Lof Ringer solution was injected into the pericardium. A t ' W 30 fiL of fluid was withdrawn.
2-0r
Time (hr.)
Fig. 10. The relation between rate of urine production and hydrostatic pressure of the blood.The top line represents the pressure applied through the cannula in the efferent branchial. Thelower line represents the rate of urine production.
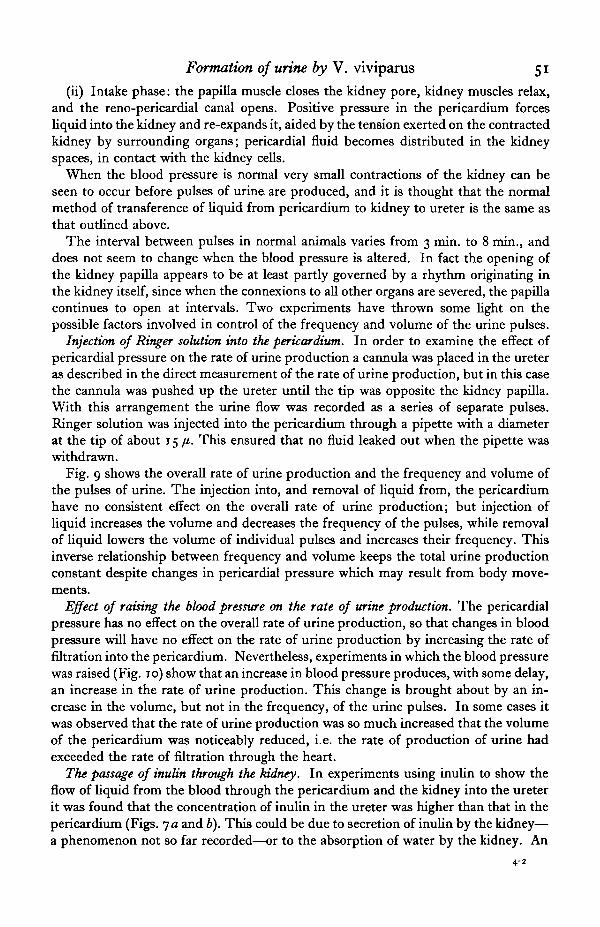
Formation of urine by V. viviparus 51
(ii) Intake phase: the papilla muscle closes the kidney pore, kidney muscles relax,and the reno-pericardial canal opens. Positive pressure in the pericardium forcesliquid into the kidney and re-expands it, aided by the tension exerted on the contractedkidney by surrounding organs; pericardial fluid becomes distributed in the kidneyspaces, in contact with the kidney cells.
When the blood pressure is normal very small contractions of the kidney can beseen to occur before pulses of urine are produced, and it is thought that the normalmethod of transference of liquid from pericardium to kidney to ureter is the same asthat outlined above.
The interval between pulses in normal animals varies from 3 min. to 8 min., anddoes not seem to change when the blood pressure is altered. In fact the opening ofthe kidney papilla appears to be at least partly governed by a rhythm originating inthe kidney itself, since when the connexions to all other organs are severed, the papillacontinues to open at intervals. Two experiments have thrown some light on thepossible factors involved in control of the frequency and volume of the urine pulses.
Injection of Ringer solution into the pericardium. In order to examine the effect ofpericardial pressure on the rate of urine production a cannula was placed in the ureteras described in the direct measurement of the rate of urine production, but in this casethe cannula was pushed up the ureter until the tip was opposite the kidney papilla.With this arrangement the urine flow was recorded as a series of separate pulses.Ringer solution was injected into the pericardium through a pipette with a diameterat the tip of about 15 fi. This ensured that no fluid leaked out when the pipette waswithdrawn.
Fig. 9 shows the overall rate of urine production and the frequency and volume ofthe pulses of urine. The injection into, and removal of liquid from, the pericardiumhave no consistent effect on the overall rate of urine production; but injection ofliquid increases the volume and decreases the frequency of the pulses, while removalof liquid lowers the volume of individual pulses and increases their frequency. Thisinverse relationship between frequency and volume keeps the total urine productionconstant despite changes in pericardial pressure which may result from body move-ments.
Effect of raising the blood pressure on the rate of urine production. The pericardialpressure has no effect on the overall rate of urine production, so that changes in bloodpressure will have no effect on the rate of urine production by increasing the rate offiltration into the pericardium. Nevertheless, experiments in which the blood pressurewas raised (Fig. 10) show that an increase in blood pressure produces, with some delay,an increase in the rate of urine production. This change is brought about by an in-crease in the volume, but not in the frequency, of the urine pulses. In some cases itwas observed that the rate of urine production was so much increased that the volumeof the pericardium was noticeably reduced, i.e. the rate of production of urine hadexceeded the rate of filtration through the heart.
The passage of inulin through the kidney. In experiments using inulin to show theflow of liquid from the blood through the pericardium and the kidney into the ureterit was found that the concentration of inulin in the ureter was higher than that in thepericardium (Figs, ya and b). This could be due to secretion of inulin by the kidney—a phenomenon not so far recorded—or to the absorption of water by the kidney. An
4-2
52 C. LITTLE
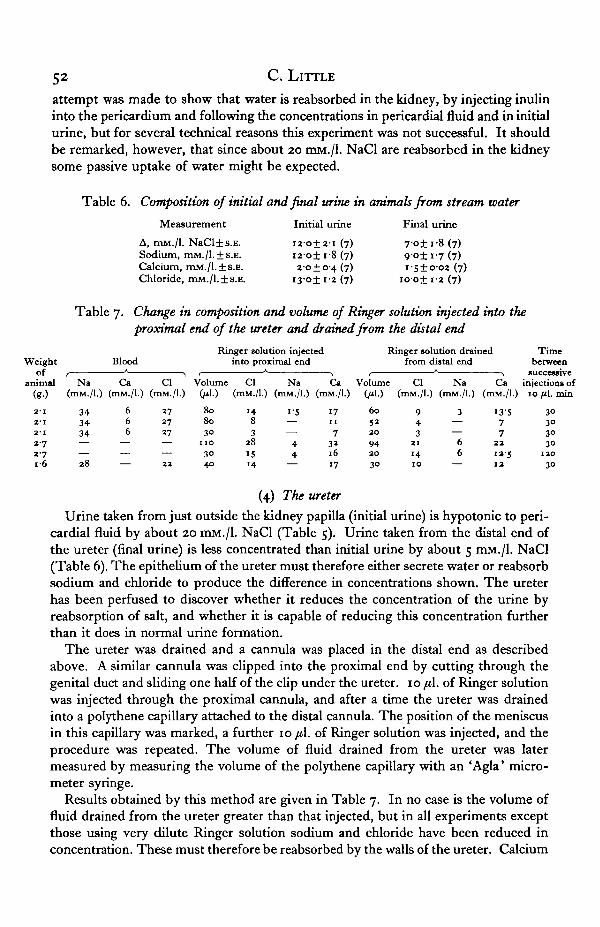
attempt was made to show that water is reabsorbed in the kidney, by injecting inulininto the pericardium and following the concentrations in pericardial fluid and in initialurine, but for several technical reasons this experiment was not successful. It shouldbe remarked, however, that since about 20 mM./l. NaCl are reabsorbed in the kidneysome passive uptake of water might be expected.
Table 6. Composition of initial and final urine in animals from stream water
Measurement Initial urine Final urine
A, mM./l. NaCl±s.E. i2-o±2-i (7) 7*o± 1-8(7)Sodium, mM./l.±s.E. i2-o± i-8 (7) g-o± 1-7 (7)Calcium, mM./l.±s.E. 2-0±0-4 (7) 1-5±0-02 (7)Chloride, mM./l.±s.B. i3-o± 1-2 (7) io-o± 1-2 (7)
Table 7. Change in composition and volume of Ringer solution injected into theproximal end of the ureter and drained from the distal end
WeightOI
animal(g-)
2'I2'I2 1
2-72-71 6
Na(mM./l.)
343434——28
Blood
Ca(mM./l.)
666
———
Cl(mM./l.)
272727——2 2
Ringer solution injectedinto proximal end
Volume Cl Na0*1.
8 08030
n o304 0
Ca) (mM./l.) (tnM./l.) (mM./l.)
14 1-58 —3 —
28 415 4'4 —
1711
73»16
17
Ringer solution drained
Volume(M)
60
5»2 0
942 0
3°
from distal end
Cl(mM./l.)
943
2 1
141 0
Na(mM./l.)
3——
66
—
Ca(mM./l.)
13577
2 2
1 2 51 2
Timebetween
successiveinjections of
IO III. min
3030
3030
1 2 0
30
(4) The ureter
Urine taken from just outside the kidney papilla (initial urine) is hypotonic to peri-cardial fluid by about 20 mM./l. NaCl (Table 5). Urine taken from the distal end ofthe ureter (final urine) is less concentrated than initial urine by about 5 mM./l. NaCl(Table 6). The epithelium of the ureter must therefore either secrete water or reabsorbsodium and chloride to produce the difference in concentrations shown. The ureterhas been perfused to discover whether it reduces the concentration of the urine byreabsorption of salt, and whether it is capable of reducing this concentration furtherthan it does in normal urine formation.
The ureter was drained and a cannula was placed in the distal end as describedabove. A similar cannula was clipped into the proximal end by cutting through thegenital duct and sliding one half of the clip under the ureter. 10 /A. of Ringer solutionwas injected through the proximal cannula, and after a time the ureter was drainedinto a polythene capillary attached to the distal cannula. The position of the meniscusin this capillary was marked, a further 10 /il. of Ringer solution was injected, and theprocedure was repeated. The volume of fluid drained from the ureter was latermeasured by measuring the volume of the polythene capillary with an 'Agla' micro-meter syringe.
Results obtained by this method are given in Table 7. In no case is the volume offluid drained from the ureter greater than that injected, but in all experiments exceptthose using very dilute Ringer solution sodium and chloride have been reduced inconcentration. These must therefore be reabsorbed by the walls of the ureter. Calcium
Formation of urine by V. viviparus 53
\s not reabsorbed, and, indeed, actually appears to be increased in concentration afterpassage through the ureter. The reduction in the concentrations of sodium andchloride is approximately 4 mM./l., which is similar to the difference found betweeninitial and final urine in normal animals. The amount of salt reabsorbed is not in-creased if liquid is left in the ureter for long periods of time.
DISCUSSION
The rate of production of urine by Viviparus is between 0-25 and 0-91 /il./g./min.At least two factors can apparently influence this rate: a change in blood pressure, anda change in salt concentration of the external medium which may act via externalsensory receptors. The action of blood pressure may be compared with vertebratesystems, where changes in blood pressure are detected by stretch receptors located invarious parts of the blood system; but as yet there appears to be no description of anysensory structure which can certainly be termed an 'osmoreceptor'.
Three processes may be involved in the formation of urine, namely nitration,reabsorption and secretion. In Viviparus there is reasonable evidence that theprimary process is nitration through the wall of the heart. This would agree with thefindings of Picken (1937) on Anodonta, and Harrison (1962) on HaUotis. Filtration isfollowed by the reabsorption of salt and water in the kidney, and to a lesser extent inthe ureter. The latter process is interesting in that it forms a parallel with the terrestrialpumonates, in which almost all reabsorption occurs in the ureter (Vorvohl, 1961); butwhereas the ureter in pulmonates is derived from the coelomoduct, the ureter ofViviparus is probably derived from the mantle surface (Johansson, 1950).
Secretion could occur from the pericardial glands, which are situated on the wall ofthe auricle (Perrier, 1889), but, more important, secretion is likely to take place in thekidney. Yellow crystals have at times been seen in the ureter, and Cuenot (1900)describes two types of cell in the kidney. He says that the most numerous (those havingeach a single vacuole) eliminate indigo, while the ciliated cells eliminate carmine.
The transfer of pericardial fluid into the kidney and then from the kidney into theureter is effected by the rhythmic contraction of the kidney. There is in fact reason tosuppose that contractility of the renal organ in molluscs may be a more widespread andimportant phenomenon than has been appreciated up till now. Joliet (1883) describedrhythmic contraction of the renal sac of the marine heteropod Pterotrachea and of thepelagic opisthobranch Phyllirhoe; and the lamellae of many monotocardian molluscscontain muscles (Fretter & Graham, 1962). In any excretory organ where fluidpasses along a more or less straight tube the efficiency with which salts may be re-absorbed will not be much increased by contractions of the organ; but if the surface ofthe kidney epithelium is increased by folding and by complex lamellae, or if the reno-pericardial canal opens into the distal part of the kidney near its opening to the ureteror to the exterior, as is the case in many gastropods, then rhythmic contractions of thekidney will greatly help in distributing fluid to the blind-ending cavities.
This paper forms part of a dissertation for the degree of Ph.D. at the Universityof Cambridge. It is a pleasure to thank Dr J. A. Ramsay once again for his manysuggestions and general advice. The work was carried out under a grant from theDepartment of Scientific and Industrial Research.
54 C. LITTLE
SUMMARY
1. The urine of Viviparus is hypotonic to the blood by about 30 mM./l. NaCl intap water, and remains hypotonic in concentrations of up to 10% sea water.
2. The rate of production of urine is between 0-25 and 0-91 /tl./g./min. in tap waterat 190 C. The rate decreases in proportion to the decrease in osmotic differencebetween blood and external medium. Viviparus may be able to detect changes in saltconcentration of the external medium and alter its rate of urine production accordingly.
3. Pericardial fluid is similar to blood in composition; the rate of flow of peri-cardial fluid through the reno-pericardial canal is proportional to the blood pressure;and when inulin is injected into the blood, concentrations in blood and pericardialfluid are approximately the same. For these reasons it is supposed that blood isfiltered through the heart into the pericardium.
4. About 20 mM./l. NaCl, and probably some water, are reabsorbed in the kidney.Liquid is passed through the kidney by rhythmic contractions of the kidney muscula-ture. Pericardial pressure does not influence the overall rate of urine production butblood pressure does have an effect.
5. About 5 mM./l. NaCl, and probably a little water, are reabsorbed in the ureter.
REFERENCES
CUENOT, L. (1900). L'excretion chez les mollusques. Arch. Biol., Paris, 16, 49-96.FRETTER, V. & GRAHAM, A. (1962). British Prosobranch Molluscs. London: Ray Society.HARRISON, F. M. (1962). Some excretory processes in the abalone, Haliotis rufescens. J. Exp. Biol. 39,
179-92.JOHANSSON, J. (1950). On the embryology of Viviparus and its significance for the phylogeny of the
Gastropoda. Ark. Zool. A.S. 1, 173-77.JOLIET, L. (1883). Sur les fonctions du sac rinal chez les Heteiopodes. CM. Acad. Set., Paris, 97,
1078.LITTLE, C. (1965). Osmotic and ionic regulation in the prosobranch gastropod mollusc, Viviparus
viviparus Linn. J. Exp. Biol. 43, 23-37.MARTIN, A. W., HARRISON, F. M. & STEWART, D. M. (1953). Urine formation in the Giant African
Snail. Int. Pkysiol. Congr. (abstracts), 19 (Montreal).PERRIER, M. R. (1889). Recherches BUT l'anatomie et I'histologie du rein des Gast6ropodes proso-
branches. Ann. Sei. nat. (zool.) 8, 61-315.PICKEN, L. E. R. (1937). The mechanism of urine formation in invertebrates. 2. The excretory
mechanism in certain Mollusca. J. Exp. Biol. 14, 20-34.POTTS, W. T. W. & MARTIN, A. W. (1963). The process of ammonia excretion in an Octopus. Proc.
Int. Congr. Zool. 16 (1), 78.SPITZER, J. M. (1937). Physiologisch Okologische Untersuchung uber den Excretstoffwechsel der
Mollusken. Zool. Jb. Abt. AUg. Zool. Pkysiol. 57, 457-96.VORVOHL, G. (1961). Zur Funktion der Excretionsorgane von Helix pomatia L. und Archachatina
ventricosa Gould. Z. vergl. Physiol. 45, 12—49.