Embed Size (px)
Citation preview

ORNL/TM-2011/365
Core and Refueling Design Studies for the Advanced High Temperature Reactor September 30, 2011 Prepared by D. E. Holcomb D. Ilas V. K. Varma A. T. Cisneros R. P. Kelly J. C. Gehin

DOCUMENT AVAILABILITY Reports produced after January 1, 1996, are generally available free via the U.S. Department of Energy (DOE) Information Bridge. Web site http://www.osti.gov/bridge Reports produced before January 1, 1996, may be purchased by members of the public from the following source. National Technical Information Service 5285 Port Royal Road Springfield, VA 22161 Telephone 703-605-6000 (1-800-553-6847) TDD 703-487-4639 Fax 703-605-6900 E-mail [email protected] Web site http://www.ntis.gov/support/ordernowabout.htm Reports are available to DOE employees, DOE contractors, Energy Technology Data Exchange (ETDE) representatives, and International Nuclear Information System (INIS) representatives from the following source. Office of Scientific and Technical Information P.O. Box 62 Oak Ridge, TN 37831 Telephone 865-576-8401 Fax 865-576-5728 E-mail [email protected] Web site http://www.osti.gov/contact.html
This report was prepared as an account of work sponsored by an agency of the United States Government. Neither the United States Government nor any agency thereof, nor any of their employees, makes any warranty, express or implied, or assumes any legal liability or responsibility for the accuracy, completeness, or usefulness of any information, apparatus, product, or process disclosed, or represents that its use would not infringe privately owned rights. Reference herein to any specific commercial product, process, or service by trade name, trademark, manufacturer, or otherwise, does not necessarily constitute or imply its endorsement, recommendation, or favoring by the United States Government or any agency thereof. The views and opinions of authors expressed herein do not necessarily state or reflect those of the United States Government or any agency thereof.

ORNL/TM-2011/365
Reactor and Nuclear Systems Division
CORE AND REFUELING DESIGN STUDIES FOR THE ADVANCED HIGH TEMPERATURE REACTOR
D. E. Holcomb D. Ilas
V. K. Varma A. T. Cisneros*
R. P. Kelly** J. C. Gehin
______________ *Student, University of California, Berkeley **Student, Texas A&M University
September 30, 2011
Prepared by OAK RIDGE NATIONAL LABORATORY
Oak Ridge, Tennessee 37831-6283 managed by
UT-BATTELLE, LLC for the
U.S. DEPARTMENT OF ENERGY under contract DE-AC05-00OR22725

iii
CONTENTS
Page
LIST OF FIGURES .................................................................................................................................... vii
LIST OF TABLES ....................................................................................................................................... xi
LIST OF ABBREVIATIONS .................................................................................................................... xiii
EXECUTIVE SUMMARY ........................................................................................................................ xv Overview ............................................................................................................................................ xv Core Neutronic Design ...................................................................................................................... xvi Thermal-Hydraulic Design ................................................................................................................ xvi Refueling Mechanics ........................................................................................................................ xvii Development Issues ......................................................................................................................... xviii
ABSTRACT ............................................................................................................................................... xix
INTRODUCTION ................................................................................................................................ 1 1.
AHTR CONCEPTUAL LAYOUT ...................................................................................................... 3 2.2.1 Reactor Core ................................................................................................................................ 5 2.2 Control Blade Drives ................................................................................................................... 7 2.3 Primary Coolant Loops ................................................................................................................ 9 2.4 Refueling Apparatus .................................................................................................................. 10
AHTR CORE DESCRIPTION .......................................................................................................... 13 3.3.1 AHTR Core ................................................................................................................................ 13
3.1.1 Constraints Used in the AHTR Core Design .................................................................. 16 3.1.2 Comparison Between the AHTR and AP-1000 Core Designs ....................................... 16
3.2 Fuel Assembly ........................................................................................................................... 17 3.3 Fuel Plate ................................................................................................................................... 19 3.4 Coated Particle Fuel ................................................................................................................... 20
3.4.1 Kernel Size ..................................................................................................................... 20 3.4.2 Packing Fraction ............................................................................................................. 21 3.4.3 Fuel Enrichment ............................................................................................................. 21
NEUTRONIC STUDIES ................................................................................................................... 23 4.4.1 Computational Tools ................................................................................................................. 23 4.2 Optimum Configuration Search ................................................................................................. 23 4.3 Control Blade Design ................................................................................................................ 24 4.4 Temperature Reactivity Cofficients ........................................................................................... 26 4.5 Void Reactivity Coefficient ....................................................................................................... 28 4.6 Power Distribution ..................................................................................................................... 29 4.7 Fast Fluence ............................................................................................................................... 29 4.8 Nonproliferation Implications ................................................................................................... 31 4.9 Use of Burnable Poison ............................................................................................................. 32 4.10 Secondary Shutdown Methodology ........................................................................................... 32

iv
THERMAL-HYDRAULIC EVALUATIONS ................................................................................... 35 5.5.1 Reference Parameters ................................................................................................................ 35 5.2 Sensitivity Studies ..................................................................................................................... 36
5.2.1 Fuel Thermal Conductivity ............................................................................................ 36 5.2.2 Sleeve Thermal Conductivity and Thickness ................................................................. 37 5.2.3 Fuel Thickness ............................................................................................................... 38 5.2.4 Fuel Packing Fraction ..................................................................................................... 39 5.2.5 Coolant Gap Thickness .................................................................................................. 40
REFUELING ...................................................................................................................................... 43 6.6.1 Conceptual Overview ................................................................................................................ 43 6.2 Refueling Mechanics ................................................................................................................. 43
6.2.1 Preliminary Steps before Refueling ............................................................................... 44 6.3 Neutronic Methodology ............................................................................................................. 46
6.3.1 Outage Duration ............................................................................................................. 46 6.4 Neutronics of Offline Refueling ................................................................................................ 47
6.4.1 Burnup ............................................................................................................................ 48 6.4.2 Power .............................................................................................................................. 49 6.4.3 Refueling Interval ........................................................................................................... 50
6.5 Pseudo-OnLine Refueling ......................................................................................................... 52 6.5.1 Loading Patterns ............................................................................................................. 52 6.5.2 Xenon Buildup ............................................................................................................... 53 6.5.3 Burnup ............................................................................................................................ 55 6.5.4 Power .............................................................................................................................. 56 6.5.5 Refueling Intervals ......................................................................................................... 57
KEY CORE AND FUEL TECHNOLOGY DEVELOPMENT AND DEMONSTRATION 7.ISSUES ............................................................................................................................................... 59 7.1 Advanced Ceramic Composites ................................................................................................. 59 7.2 Lithium Isotope Enrichment ...................................................................................................... 59 7.3 Benchmark Reactivity Measurements ....................................................................................... 59 7.4 Hydraulic Design ....................................................................................................................... 60 7.5 Fuel Manufacturing ................................................................................................................... 60 7.6 Fuel Handling and Mechanical Design ...................................................................................... 60 7.7 Neutronic Design Refinement ................................................................................................... 60
CONCLUSIONS ................................................................................................................................ 61 8.
REFERENCES ................................................................................................................................... 63 9.
APPENDIX A THE THERMAL-HYDRAULIC MODEL ..................................................................... A-1 Fuel Temperature Distribution Model .............................................................................................. A-3 Layered Plate Configuration ............................................................................................................ A-4 Core Pressure Drop .......................................................................................................................... A-5 Pump Motor Power .......................................................................................................................... A-5
APPENDIX B REFERENCE DEPLETION CALCULATIONS ............................................................ B-1 Dancoff Factor Method in SCALE .................................................................................................. B-3 Continuous Energy Benchmarking .................................................................................................. B-5 Works Cited in Appendix B ............................................................................................................. B-7
APPENDIX C FAST DEPLETION APPROXIMATIONS FOR REFUELING ANALYSIS ................ C-1 Introduction ...................................................................................................................................... C-3 Reactivity-Equivalent Physical Transform Method ......................................................................... C-3
v
Reactivity-Equivalent Physical Transform in Slab Geometry ......................................................... C-4 Verification of Depletion Results ..................................................................................................... C-6 Conclusion ...................................................................................................................................... C-10 Works Cited in Appendix C ........................................................................................................... C-10
APPENDIX D EQUILIBRIUM CYCLE METHODOLOGY ................................................................ D-1 Introduction ...................................................................................................................................... D-3 Iterative Equilibrium Depletion Search ............................................................................................ D-3
Search for the Equilibrium Fuel Cycle .................................................................................... D-4 Implementation of Search for Equilibrium Fuel Cycle ............................................................ D-4 Convergence Criteria ............................................................................................................... D-5 Search for Maximum Burnup .................................................................................................. D-5 Implementation of the Search for Maximum Burnup .............................................................. D-5 Uncertainty in the Maximum Burnup Predicted by Iterative Equilibrium Depletion Search Methodology ................................................................................................................ D-5
Nonlinear Reactivity Model ............................................................................................................. D-6 Model Uncertainty in Nonlinear Reactivity Model ................................................................. D-7
Conclusions ...................................................................................................................................... D-9 Works Cited in Appendix D ............................................................................................................. D-9

vii
LIST OF FIGURES
Figure Page
ES1 Current AHTR core, reactor vessel, and nearby structures ..................................................... xv
1 Overall view of AHTR core, vessel, heat transfer, and refueling components ......................... 4
2 Top view of the AHTR with the top vessel flange removed ..................................................... 5
3 Reactor vessel upper internal components ................................................................................ 6
4 Top view of a single fuel assembly held by the upper core support plate and mounted onto the lower core support plate .............................................................................................. 7
5 Control rod guide tubes (translucent) and the control blade leader rods gripping the control blades above the upper core support plate .................................................................... 8
6 AHTR reactor vessel with the upper vessel flange removed and the control drive plate slid horizontally for refueling .................................................................................................... 8
7 In-vessel fuel handling mechanisms for the AHTR ................................................................ 10
8 In-vessel fuel transfer mechanisms ......................................................................................... 11
9 A 3-D view of the AHTR reference core ................................................................................ 14
10 Transverse cross section of the AHTR reference core. ........................................................... 14
11 Transverse cross section of a group of fuel assemblies showing the interassembly spacing ..................................................................................................................................... 18
12 Transverse cross section of a fuel assembly with dimensions in centimeters ......................... 19
13 Transverse cross section of a fuel plate (reference model) ..................................................... 19
14 AGR-2 fuel particle ................................................................................................................. 20
15 AHTR once-through cycle length and achievable burnup as a fuction of CHM ..................... 24
16 Evolution of the 181Hf contributions to the total control blade activity and decay power after removal from core and the fraction of total activity and power after removal..... 25
17 Top portion of the control blade .............................................................................................. 26
18 Upper end of the fuel assembly with control blade inserted ................................................... 26
19 Variation of isothermal reactivity coefficient with temperature ............................................. 27
20 Coolant void coefficient as a function of carbon–to–heavy metal ratio .................................. 28
21 Regionwise peaking factors in the reference core at BOC ...................................................... 29
22 Graphite linear distortion as a function of fluence at various temperatures ............................ 30
23 Regionwise fast flux (E > 50 keV) in the reference core at BOC (10-22 n/cm2/year) ............ 31
24 Potential secondary shutdown poison salt cartridge configuration ......................................... 33
25 Reactivity insertion as a function of Eu concentration ............................................................ 34
26 Variation of maximum fuel temperature in the average channel with fuel thermal conductivity ................................................................................................................ 36
27 Dependence of maximum fuel temperature for the average assembly for different fuel sleeve thicknesses ............................................................................................................. 37
28 Dependence of maximum fuel temperature for the average assembly on sleeve thickness for the reference sleeve thermal conductivity .......................................................... 38
29 Dependence of maximum fuel temperature on matrix material thickness .............................. 39

viii
30 Dependence of maximum fuel temperature for the average assembly on the packing fraction for the same fuel loading .............................................................................. 40
31 Dependence of maximum fuel temperature on coolant gap size ............................................. 41
32 Dependence of flow velocity and pressure drop on coolant gap size ...................................... 41
33 Upper core support plate raised for easier access to the fuel assemblies ................................ 45
34 Refueling station components ................................................................................................. 45
35 Sample AHTR fuel loading patterns (one-sixth core) for two-batch fuel management schemes: (left) low-leakage loading pattern and (right) scatter loading pattern ..................... 47
36 Increase in discharge burnup resulting from implementing a multibatch fuel cycle as predicted by the linear reactivity model .................................................................................. 48
37 Estimate of maximum discharge burnup (MWd/MT) as a function of uranium enrichment and the carbon–to–heavy metal ratio for the AHTR ............................................ 49
38 Batch-averaged specific power (MW/MT) as a function of time in fuel cycle ....................... 50
39 Refueling interval as a function of discharge burnup for all offline refueling design points grouped (from left to right) by CHM, number of batches, and uranium enrichment ................................................................................................................. 52
40 Examples of isotropic loading patterns with 180° symmetry (from left to right) for 18, 14, and 12 assemblies per reload (14, 18, 21 batches) fuel cycles ............................... 53
41 The 135Xe absorption with energy and detail at low energy .................................................... 53
42 135Xe neutron absorption cross section and neutron spectra in fuel of different enrichments ............................................................................................................................. 54
43 Negative reactivity insertion by fission products buildup after reactor shutdown .................. 55
44 Estimate of maximum discharge burnup (MWd/MT) as a function of uranium enrichment and the carbon–to–heavy metal ratio for the AHTR ............................................ 55
45 Estimate of minimum beginning of equilibrium cycle reactivity (pcm) as a function of uranium enrichment and carbon–to–heavy metal ratio ........................................................... 56
A.1 Schematic representation of the cooling model used to generate the thermal hydraulic constraints .............................................................................................................................. A-3
B.1 Comparison of the evolution of keff for an NGNP fuel block as predicted by different models ..................................................................................................................... B-5
B.2 Comparison of the evolution of 239Pu concentration for an NGNP fuel block as predicted by different models ................................................................................................ B-5
B.3 Evolution of keff vs time for TRITON and VESTA depletion calculations ........................... B-6
C.1 The RPT transform for cylindrical and spherical coordinates: (upper) solid radial system transforms and (lower) annular radial system transforms ..................................................... C-4
C.2 The RPT transform for slab geometries: (top) solid slab system transforms, (middle) annular slab system transforms, and (bottom) solid slab approximation of annular slab system transform ........................................................................................... C-5
C.3 Calibration of RPT model of the AHTR with baseline fuel design ....................................... C-6
C.4 Comparison evolution of system keff for AHTR with baseline fuel design and single-batch fuel cycle for different depletion models .......................................................... C-7
C.5 Isotopic concentration evolutions in AHTR (central radial position and central axial position) ............................................................................................................ C-8
C.6 Isotopic concentration evolutions in AHTR (outer radial position and central axial position) ............................................................................................................ C-9

ix
D.1 Algorithm for the iterative equilibrium depletion search ...................................................... D-3
D.2 Predicted EOEC reactivity of the baseline AHTR as a function of discharge burnup for various numbers of reloads per fuel cycle ............................................................................. D-7
D.3 Comparison of reactivity predicted near EOEC .................................................................... D-8
D.4 Comparison of the maximum discharge burnup predicted by the nonlinear reactivity model assuming a second-order polynomial regression for burnup-dependent reactivity to the iterative equilibrium depletion search ........................... D-9


xi
LIST OF TABLES
Table Page
1 AHTR design parameters .......................................................................................................... 3
2 Main core characteristics of the AHTR reference model ........................................................ 15
3 Constraints imposed on the AHTR design .............................................................................. 16
4 Comparison of AHTR and AP-1000 core designs .................................................................. 17
5 Main geometric characteristics of the fuel assembly for the reference AHTR design ........... 18
6 Material characteristics of the fuel assembly for the reference AHTR design ........................ 18
7 TRISO particle description for the reference AHTR design ................................................... 20
8 Correlation of the mass of heavy metal and the CHM ratio with the central matrix thickness ....................................................................................................................... 24
9 Coolant void coefficients for the reference core ..................................................................... 29
10 Plutonium vector comparison .................................................................................................. 32
11 Parameters used in the thermal-hydraulic model .................................................................... 35
12 Design constraints and values for the reference core .............................................................. 36
13 Estimated refueling intervals in days for the AHTR with single-batch fuel cycle .................. 51
14 Estimated refueling intervals in days for the AHTR with two-batch fuel cycle ..................... 51
15 Estimated refueling intervals in days for the AHTR with three-batch fuel cycle ................... 51
16 Estimated refueling intervals in days for the AHTR with six-batch fuel cycle ....................... 51
17 Estimated refueling intervals in days for the Advanced High Temperature Reactor with 18 assembly reload (14 batch) pseudo-online fuel management scheme ........................ 57
18 Estimated refueling intervals in days for the Advanced High Temperature Reactor with 14 assembly reload (18 batch) pseudo-online fuel management scheme ........................ 57
19 Estimated refueling intervals in days for the Advanced High Temperature Reactor with 12 assembly reload (21 batch) pseudo-online fuel management scheme ........................ 57
C.1 Estimated maximum discharge burnup for single-batch fuel cycle AHTR with baseline fuel design for various depletion models................................................................. C-7
C.2 Computation requirements for depletion analysis ................................................................. C-9


xiii
LIST OF ABBREVIATIONS
3-D three dimensional
AHTR Advanced High Temperature Reactor
AP-1000 Westinghouse’s AP-1000 LWR design
ARM annular rolling manipulator
BOC beginning of cycle
BOEC beginning of equilibrium cycle
CHM carbon–to–heavy metal ratio
CR control blade
DOE U.S. Department of Energy
DRACS direct reactor auxiliary cooling system
EOC end of cycle
EOEC end of equilibrium cycle
FHR fluoride-salt-cooled high-temperature reactor
FIMA fissions per initial (heavy) metal atom
FLiBe peritectic mixture of lithium fluoride and beryllium fluoride (2LiF-BeF2)
IEDS Iterative Equilibrium Depletion Search
IRSN Institut de Radioprotection et de Sûreté Nucléaire (Institute for Radiological Protection and Nuclear Safety)
IVFHM in-vessel fuel handling manipulator
keff effective multiplication constant
LRM Linear Reactivity Model
LWR light-water reactor
MT metric ton
MTHM metric ton of heavy metal
NLRM Non-Linear Reactivity Model
ORNL Oak Ridge National Laboratory
ppm parts per million
RPT Reactivity-Equivalent Physical Transformation
RSM refueling station manipulator
RSND Reactor and Nuclear Systems Division
SmAHTR Small Modular Advanced High Temperature Reactor


xv
EXECUTIVE SUMMARY
OVERVIEW
The Advanced High Temperature Reactor (AHTR) is a design concept for a central generating station type [3400 MW(t)] fluoride-salt-cooled high-temperature reactor (FHR). The overall goal of the AHTR development program is to demonstrate the technical feasibility of FHRs as low-cost, large-size power producers while maintaining full passive safety. This report presents the current status of ongoing design studies of the core, in-vessel structures, and refueling options for the AHTR. The AHTR design remains at the notional level of maturity as important material, structural, neutronic, and hydraulic issues remain to be addressed. The present design space exploration, however, indicates that reasonable options exist for the AHTR core, primary heat transport path, and fuel cycle provided that materials and systems technologies develop as anticipated.
An illustration of the current AHTR core, reactor vessel, and nearby structures is shown in Fig. ES1. The AHTR core design concept is based upon 252 hexagonal, plate fuel assemblies configured to form a roughly cylindrical core. The core has a fueled height of 5.5 m with 25 cm of reflector above and below the core. The fuel assembly hexagons are ~45 cm across the flats. Each fuel assembly contains 18 plates that are 23.9 cm wide and 2.55 cm thick. The reactor vessel has an exterior diameter of 10.48 m and a height of 17.7 m. A row of replaceable graphite reflector prismatic blocks surrounds the core radially. A more complete reactor configuration description is provided in Section 2 of this report.
Fig. ES1. Current AHTR core, reactor vessel, and nearby structures.
The AHTR core design space exploration was performed under a set of constraints. Only low enrichment (<20%) uranium fuel was considered. The coated particle fuel and matrix materials were derived from those being developed and demonstrated under the Department of Energy Office of Nuclear Energy (DOE-NE) advanced gas reactor program.8 The coated particle volumetric packing fraction was
xvi
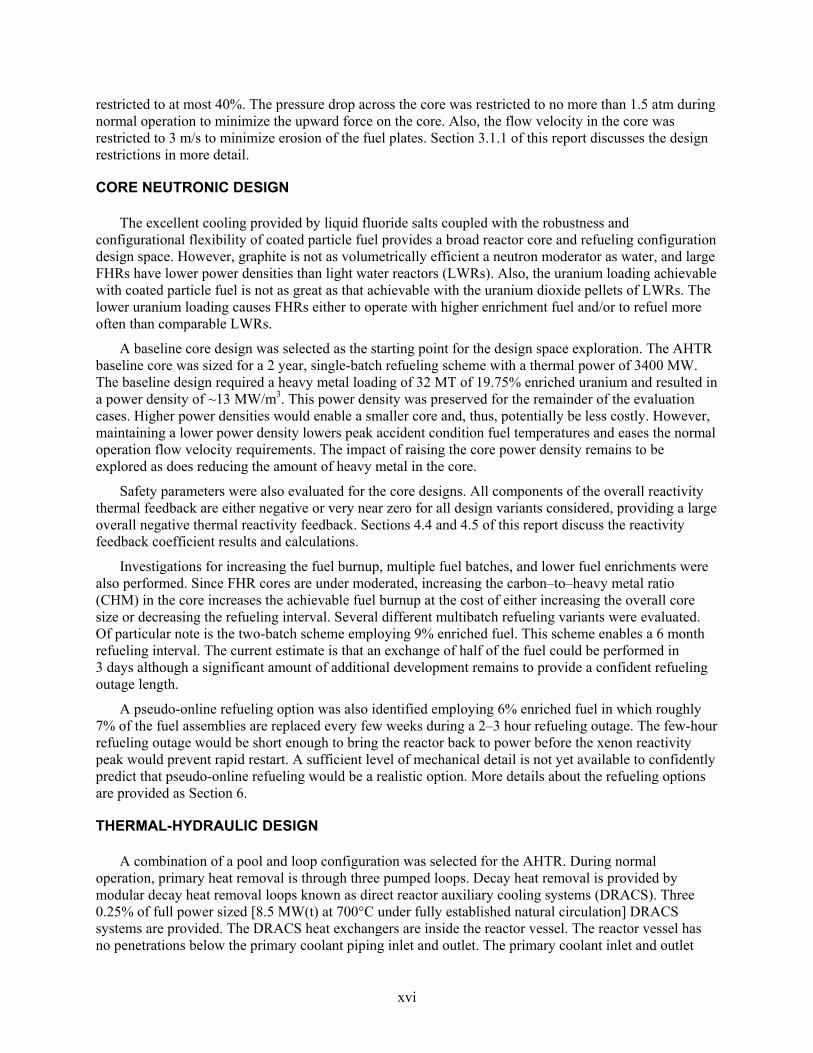
restricted to at most 40%. The pressure drop across the core was restricted to no more than 1.5 atm during normal operation to minimize the upward force on the core. Also, the flow velocity in the core was restricted to 3 m/s to minimize erosion of the fuel plates. Section 3.1.1 of this report discusses the design restrictions in more detail.
CORE NEUTRONIC DESIGN
The excellent cooling provided by liquid fluoride salts coupled with the robustness and configurational flexibility of coated particle fuel provides a broad reactor core and refueling configuration design space. However, graphite is not as volumetrically efficient a neutron moderator as water, and large FHRs have lower power densities than light water reactors (LWRs). Also, the uranium loading achievable with coated particle fuel is not as great as that achievable with the uranium dioxide pellets of LWRs. The lower uranium loading causes FHRs either to operate with higher enrichment fuel and/or to refuel more often than comparable LWRs.
A baseline core design was selected as the starting point for the design space exploration. The AHTR baseline core was sized for a 2 year, single-batch refueling scheme with a thermal power of 3400 MW. The baseline design required a heavy metal loading of 32 MT of 19.75% enriched uranium and resulted in a power density of ~13 MW/m3. This power density was preserved for the remainder of the evaluation cases. Higher power densities would enable a smaller core and, thus, potentially be less costly. However, maintaining a lower power density lowers peak accident condition fuel temperatures and eases the normal operation flow velocity requirements. The impact of raising the core power density remains to be explored as does reducing the amount of heavy metal in the core.
Safety parameters were also evaluated for the core designs. All components of the overall reactivity thermal feedback are either negative or very near zero for all design variants considered, providing a large overall negative thermal reactivity feedback. Sections 4.4 and 4.5 of this report discuss the reactivity feedback coefficient results and calculations.
Investigations for increasing the fuel burnup, multiple fuel batches, and lower fuel enrichments were also performed. Since FHR cores are under moderated, increasing the carbon–to–heavy metal ratio (CHM) in the core increases the achievable fuel burnup at the cost of either increasing the overall core size or decreasing the refueling interval. Several different multibatch refueling variants were evaluated. Of particular note is the two-batch scheme employing 9% enriched fuel. This scheme enables a 6 month refueling interval. The current estimate is that an exchange of half of the fuel could be performed in 3 days although a significant amount of additional development remains to provide a confident refueling outage length.
A pseudo-online refueling option was also identified employing 6% enriched fuel in which roughly 7% of the fuel assemblies are replaced every few weeks during a 2–3 hour refueling outage. The few-hour refueling outage would be short enough to bring the reactor back to power before the xenon reactivity peak would prevent rapid restart. A sufficient level of mechanical detail is not yet available to confidently predict that pseudo-online refueling would be a realistic option. More details about the refueling options are provided as Section 6.
THERMAL-HYDRAULIC DESIGN
A combination of a pool and loop configuration was selected for the AHTR. During normal operation, primary heat removal is through three pumped loops. Decay heat removal is provided by modular decay heat removal loops known as direct reactor auxiliary cooling systems (DRACS). Three 0.25% of full power sized [8.5 MW(t) at 700°C under fully established natural circulation] DRACS systems are provided. The DRACS heat exchangers are inside the reactor vessel. The reactor vessel has no penetrations below the primary coolant piping inlet and outlet. The primary coolant inlet and outlet

xvii
piping are near the top of the vessel, and a siphon break is provided on the return leg so that the vessel cannot be drained through the external piping. The DRACS heat exchangers are located slightly below the level of the primary coolant inlet and outlet. Passive decay heat removal through the DRACS would still occur with primary coolant loop piping completely sheared from the reactor vessel, avoiding the external piping having a safety role in providing decay heat removal.
Primary coolant flow is upwards through the core into a large upper plenum. The reactor vessel, primary piping, and primary-to-intermediate heat exchanger are all fabricated from Alloy N. The upper plenum mixed temperature is limited to 700°C in the present design effort due to the decrease in strength of Alloy N at higher temperatures. The primary-to-intermediate heat exchanger is located proximate to the reactor vessel to minimize the required volume of the expensive primary coolant salt. An integral primary coolant system design was avoided to improve the system maintainability and to reduce the complexity of the reactor vessel internals. The primary coolant pumps are located on the cold legs. The return flow is channeled downward around the reactor vessel periphery through downcomer channels maintaining the reactor vessel at the cold leg 650°C temperature. The three return flows mix in a lower vessel plenum before again flowing up through the core.
A key advantage of plate fuel assemblies over pebble bed cores is minimization of the pressure drop across the core and, therefore, increasing the flow rate through the core during loss-of-forced-flow accidents. The increased fluid flow through the core directly lowers the peak accident fuel temperature. Within the plates, the fuel particles are located near the plate surface with only a 1-mm-thick carbon matrix overcoating separating the particles from the coolant channels. Locating the fuel proximate to the coolant channels lowers the fuel temperature both during normal operation and during loss-of-forced-flow accidents by minimizing the distance that heat must be conducted before it is removed by the primary coolant.
REFUELING MECHANICS
The low-pressure, optically transparent primary coolant and robust fuel of an FHR significantly change an FHR’s refueling paradigm in comparison to an LWR or a liquid-metal-cooled reactor. Time-consuming cool-down, heat-up, and fuel transfer preparation steps required in LWR refueling are not required in FHRs. Further, the robust nature of coated particle fuel avoids the requirement to unload the core and inspect the fuel for leaks at each refueling outage. FHRs must be refueled hot as the melt point of the primary coolant, 27LiF-BeF2 or FLiBe, is 459°C. Keeping the system hot during refueling avoids thermally cycling the components. The refueling time for an FHR is dominated by the actual fuel manipulation time, enabling significantly shorter refueling outages. Further, the relatively flat flux profile in an FHR core and the effective liquid cooling avoid any requirement to shuffle fuel assemblies within the core; the most highly depleted assemblies are simply replaced in any refueling outage. Overall, the increased reactor availability provided by online refueling is approached using more conventional, less-complex, offline fuel manipulation.
The reactor vessel includes a refueling lobe, which protrudes from the otherwise cylindrical vessel above the core. The lobe serves as a short, permanently attached fuel transfer canal. The AHTR’s refueling concept draws upon the design of recent liquid-metal-cooled reactors in that fuel assemblies are first transferred out of the core vertically and then moved horizontally into the refueling lobe of the vessel. The fuel assemblies are then lifted, using a winch, through an inert atmosphere sliding up a triangular weir. Upon overtopping the weir, a fuel assembly swings, in a pendulum-like motion, to the weir’s opposite side whereupon it is lowered into a transfer canal filled with lower-cost, poisoned salt.
As coated particle fuel has a large margin between operating temperature and fuel failure, several minutes are available to transfer the fuel from the primary salt canal to the storage salt canal. At all times, due to the weir’s triangular shape, the fuel assembly is above a salt canal, allowing the fuel assembly to slide (if necessary, using a passive, thermally triggered release mechanism) back into cooling salt.

xviii
Additionally, the present AHTR design employs one control blade per fuel assembly. The control blade remains with the fuel assembly throughout the fuel manipulation process, lowering the probability of a criticality accident or fuel damage accident and providing the additional mass necessary so that the fuel assemblies will sink within the coolant. The fluoride salt transparency enables all fuel manipulation processes to be visually observed and confirmed, increasing the allowable motion speed and confidence in proper transfer.
DEVELOPMENT ISSUES
Significant work remains to advance the present AHTR design concept to the level of preconceptual design. The AHTR thermal and hydraulic design has had only cursory examination, the structural and seismic design aspects of the reactor vessel remain largely unexplored, the core mechanical components have not yet been integrated into a system design, and key aspects of the fuel cycle options such as core power density have yet to be considered.
The largest remaining technology development issue for the AHTR is maturation and qualification of the in-vessel structural ceramic composites. The proposed AHTR core design makes extensive use of carbon–carbon (C-C) composites in the core. C-C composites are not currently an approved core structural material, and the design allowances that will eventually be needed are not known. Further, key in-vessel structures such as the upper and lower core support plates and the control rod leaders are formed from silicon carbide–silicon carbide (SiC-SiC) composites, which also are not yet approved nuclear reactor design materials. The approach taken in the present design effort was to provide conservative design allowances (such as potential radiation-induced in-core mechanical distortions) for the C-C composites and to await further technology developments before proceeding to detailed design.
xix
ABSTRACT
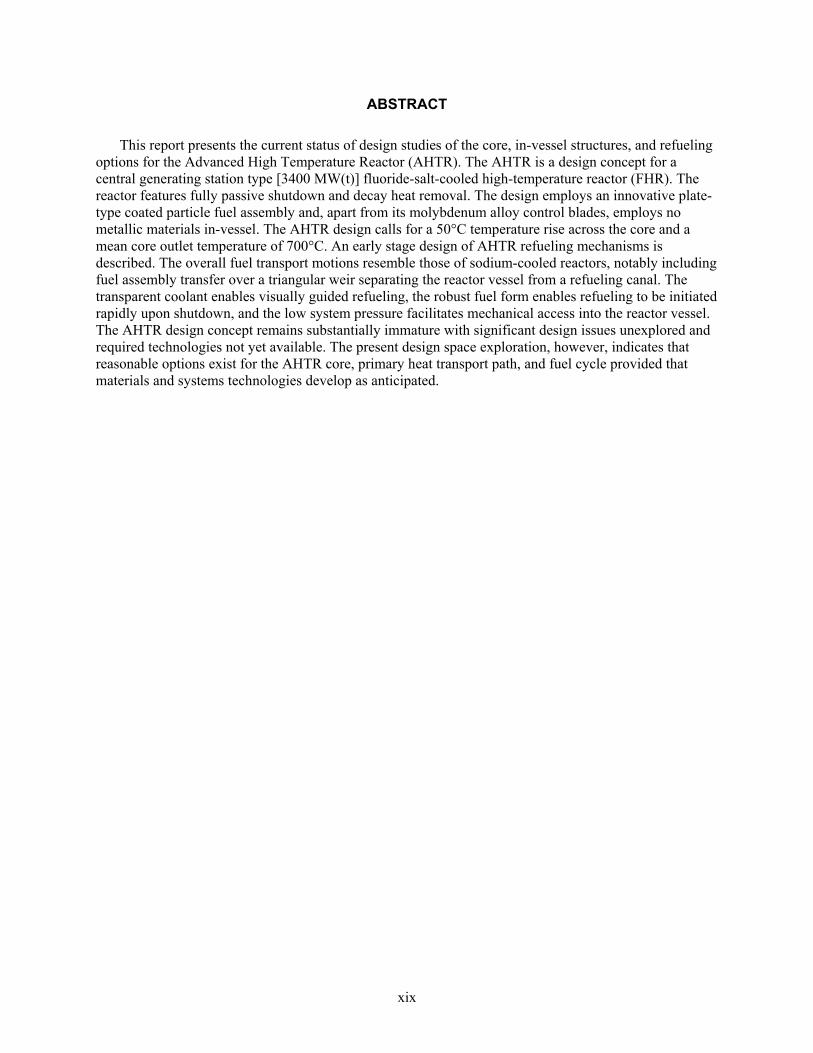
This report presents the current status of design studies of the core, in-vessel structures, and refueling options for the Advanced High Temperature Reactor (AHTR). The AHTR is a design concept for a central generating station type [3400 MW(t)] fluoride-salt-cooled high-temperature reactor (FHR). The reactor features fully passive shutdown and decay heat removal. The design employs an innovative plate-type coated particle fuel assembly and, apart from its molybdenum alloy control blades, employs no metallic materials in-vessel. The AHTR design calls for a 50°C temperature rise across the core and a mean core outlet temperature of 700°C. An early stage design of AHTR refueling mechanisms is described. The overall fuel transport motions resemble those of sodium-cooled reactors, notably including fuel assembly transfer over a triangular weir separating the reactor vessel from a refueling canal. The transparent coolant enables visually guided refueling, the robust fuel form enables refueling to be initiated rapidly upon shutdown, and the low system pressure facilitates mechanical access into the reactor vessel. The AHTR design concept remains substantially immature with significant design issues unexplored and required technologies not yet available. The present design space exploration, however, indicates that reasonable options exist for the AHTR core, primary heat transport path, and fuel cycle provided that materials and systems technologies develop as anticipated.


1
INTRODUCTION 1.
The Advanced High Temperature Reactor (AHTR) is a design concept for a large power output fluoride-salt-cooled high-temperature reactor (FHR). FHRs feature low-pressure liquid fluoride salt cooling, coated particle fuel, a high-temperature power cycle, and fully passive decay heat rejection. The modular, passive, decay heat removal, enabled by the excellent natural circulation cooling provided by liquid fluoride salts, allows FHRs to be developed at almost any scale while maintaining full passive safety. The AHTR power output was selected to allow investigation of the performance and requirements of a large, central generating station type FHR power plant.
The AHTR design effort builds upon a series of small-scale efforts over the past decade to evaluate and describe the features and technology variants of FHRs. Key prior concept evaluations include the small modular AHTR (SmAHTR) preconceptual design report,1 the pebble bed AHTR (PB-AHTR) preconceptual design,2 and the series of early phase AHTR evaluations performed from 2004 to 2006.3–5
The fuel robustness and the good cooling properties of the fluoride salt primary coolant combine to provide considerable design flexibility for the AHTR core. A principal design challenge for any FHR core is loading an adequate amount of fissile material and carbon moderator into the core. Coated particle fuel compacts do not achieve as high a uranium density as light water reactor (LWR) fuel pellets, and carbon is not as volumetrically efficient a neutron moderator as water. Thus, FHR cores tend to have lower power density than LWRs and be somewhat under moderated. Being under moderated, increasing the carbon–to–heavy metal concentration ratio in FHR cores tends to increase the achievable uranium burnup.
Different core mechanical configurations have been employed in previous FHR design efforts to maximize the uranium utilization while preserving high overall plant availability. Earlier AHTR designs employed a large core with a low power density along with somewhat higher uranium enrichment. The PB-AHTR design, in contrast, employs online refueling to enable a higher power density while preserving the high uranium utilization. The present AHTR design combines features from both prior efforts. The current AHTR core power density is intermediate between the PB-AHTR and earlier AHTR designs although accommodative of potential future power density increases. The current AHTR is designed to minimize refueling downtime rather than trying to refuel online. In order to achieve rapid, offline refueling, the core is composed of mechanically large fuel assemblies that can be rapidly replaced. The inherent properties of FHRs facilitate rapid fuel manipulation. The transparent, low-pressure coolant enables good mechanical access, and the robust fuel enables fuel manipulation to begin as soon as shutdown occurs.
This report provides a description of the AHTR core and vessel internal components, the neutronic and fuel cycle performance with the selected core geometry, and the mechanical systems necessary for refueling the reactor. The AHTR power plant systems are the subject of a companion report.6 Section 2 of this report provides an overview of the reactor core and vessel component layout. For illustrative purposes, the reactor layout overview section provides a comparison of key reactor parameters with those of the AP-1000. Section 3 provides a description of the AHTR core and fuel assembly design and includes a table of the core properties and the constraints applied to the design. Section 4 describes the neutronic studies performed and includes both the control and feedback methodologies and descriptions of the calculated flux distribution. Section 5 provides a description of the core thermal and hydraulic parameters. Section 6 describes the refueling options for the AHTR and includes descriptions of the mechanical process for refueling as well as the neutronic requirements. Finally, in Section 7 the report provides an assessment of the major remaining neutronic, mechanical, and hydraulic design steps still required to advance the AHTR to the level of a complete, preconceptual design. The report also includes a series of appendices detailing the neutronic and hydraulic calculations.


3
AHTR CONCEPTUAL LAYOUT 2.
This section describes the currently proposed overall physical layout of the AHTR in- and near-vessel components. The overall design remains at a notional level of maturity. Significant material development, as well as mechanical, hydraulic, and thermal design challenges, remain to be addressed. However, no fundamental technical issues with the design concept have yet been identified. Table 1 lists major AHTR primary system mechanical design parameters.
Table 1. AHTR design parameters
Parameter Unit Value Exterior vessel diameter m 10.48 Vessel height m 17.7 Primary salt mass MT 2310 Primary salt depth above upper core support plate m 8.45 DRACS centerline height above core fueled region m 6.05 Number of primary heat exchangers 3 Primary piping interior diameter m 1.24 Number of DRACS 3 Mixed mean upper plenum temperature °C 700 Cold leg temperature °C 650 Core barrel material C-C Composite Reactor vessel and primary piping material Alloy N Number of fuel assemblies 252 Number of control blades 252 Upper and lower core support plates SiC-SiC composite
The AHTR primary system is a blend of a pool and a loop design. The decay heat removal heat exchangers are integral to the reactor vessel, and the power cycle heat exchangers are located immediately outside the primary vessel to enable easier mechanical access to the in-vessel structures while minimizing the required volume of the expensive primary coolant salt. The external piping loops, however, do not have any safety role in removing decay heat as the DRACS are designed to function normally even if the primary loops are entirely removed from the reactor vessel. The entire vessel and heat transfer loop system has electrical external heating to allow for initial salt filling.
The reactor vessel is generally cylindrical with a short refueling lobe extension on its upper half. Figure 1 shows a vertical section of the reactor vessel and primary loop components and the refueling system. The reactor vessel is intended to be primarily supported by the top flange. However, neither mechanical anchoring nor seismic response design has yet been performed, and the strength decrease of Alloy N at 650°C may necessitate additional bottom support.
4
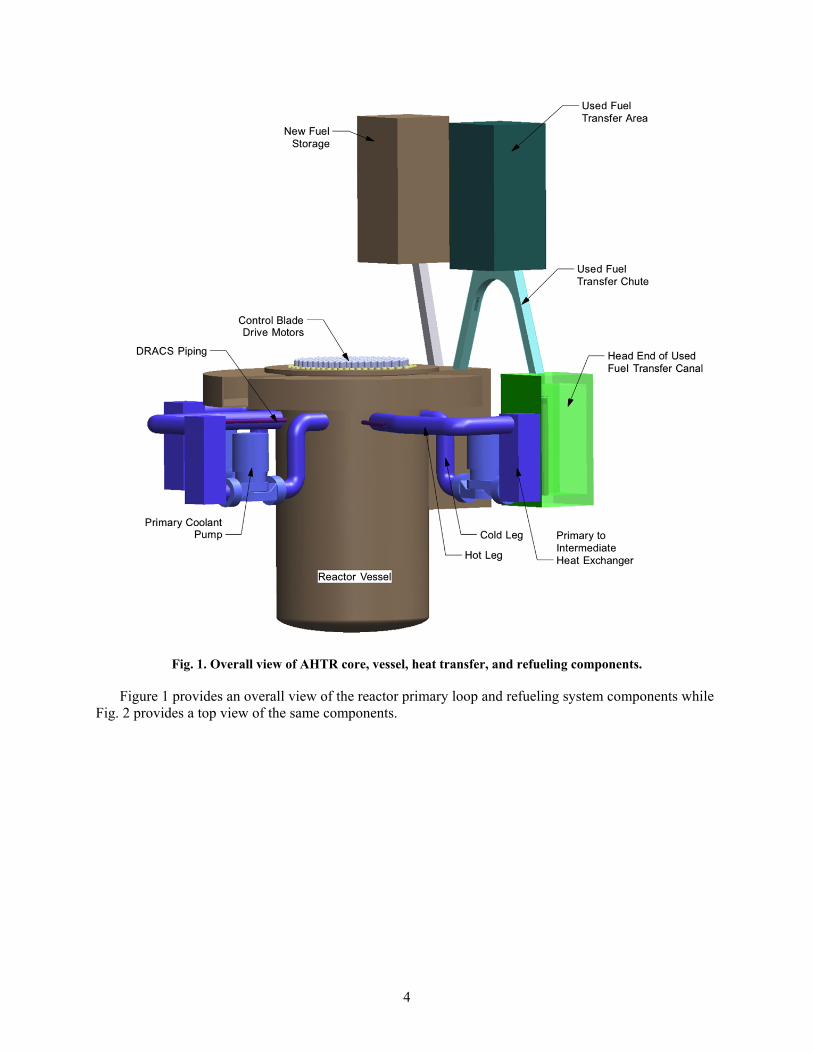
Fig. 1. Overall view of AHTR core, vessel, heat transfer, and refueling components.
Figure 1 provides an overall view of the reactor primary loop and refueling system components while Fig. 2 provides a top view of the same components.
5
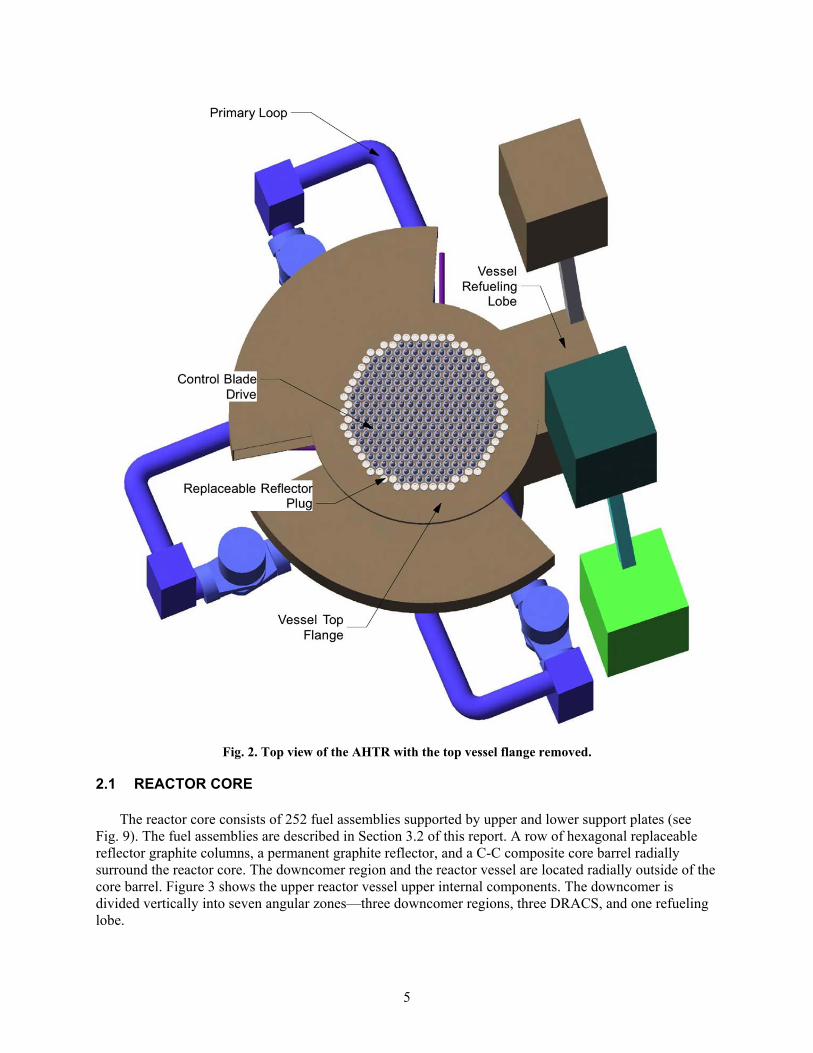
Fig. 2. Top view of the AHTR with the top vessel flange removed.
2.1 REACTOR CORE
The reactor core consists of 252 fuel assemblies supported by upper and lower support plates (see Fig. 9). The fuel assemblies are described in Section 3.2 of this report. A row of hexagonal replaceable reflector graphite columns, a permanent graphite reflector, and a C-C composite core barrel radially surround the reactor core. The downcomer region and the reactor vessel are located radially outside of the core barrel. Figure 3 shows the upper reactor vessel upper internal components. The downcomer is divided vertically into seven angular zones—three downcomer regions, three DRACS, and one refueling lobe.

6
Fig. 3. Reactor vessel upper internal components.
The fuel assemblies rest on guides in the lower core support plate and are held down by brackets on the upper support plate as shown in Fig. 4. A 1.8-cm gap between the fuel assemblies is provided to account for mechanical distortion during operation. The upper core support plate includes webbing that fills the interassembly gap to limit flow-induced fuel assembly vibration.
All the fuel assemblies have a fuel assembly grappling collar that interfaces with the upper core support plate and provides a grappling interface for fuel reloading. A design constraint for the grappling collar is to maintain at least double the flow channel area as the combined interstitial area between the fuel plates to avoid the upper core support becoming a significant portion of the pressure drop along the primary coolant flow path.
The hold-down brackets on the upper core support plate resist the force exerted by the upward coolant flow on the fuel assembly during normal operation. The upper core support plate is raised to just below the reactor vessel upper flange during refueling. The fuel assemblies are slightly buoyant in the primary coolant. To prevent the fuel assemblies from floating when unconstrained during fuel loading, each fuel assembly includes a dense molybdenum alloy control blade that is locked into place until the upper core support plate is lowered onto the core.

7
Fig. 4. Top view of a single fuel assembly held by the upper core support plate and mounted onto the lower core support plate.
2.2 CONTROL BLADE DRIVES
The control blade drives are located on a plate above the reactor vessel upper flange. Each control blade is independently driven. Each control blade has a SiC-SiC leader rod that extends from the top of the control blade through the reactor vessel to its control blade drive motor. Each control blade also has a SiC-SiC composite control blade guide structure that serves as a support pillar against the upward thrust on the fuel assemblies produced by the primary coolant upflow through the core (Fig. 5). During refueling the control blade is detached from the control blade leader rod and left inserted into the core. The control blade leader rods and control blade guide structures are withdrawn through the top of the reactor vessel. The entire control blade mounting plate is then moved horizontally, out of position, to enable the vertical transfer in-vessel fuel handling manipulator machine to be placed on the reactor vessel upper flange (Fig. 6).
Fuel Plates
Upper Support Plate Webbing
Hold-Down Brackets
Fuel Assembly Grappling Collar
Portion of Lower Support Plate

8
Fig. 5. Control rod guide tubes (translucent) and the control blade leader rods gripping the control blades above the upper core support plate.
Fig. 6. AHTR reactor vessel with the upper vessel flange removed and the control drive plate slid horizontally for refueling.
9
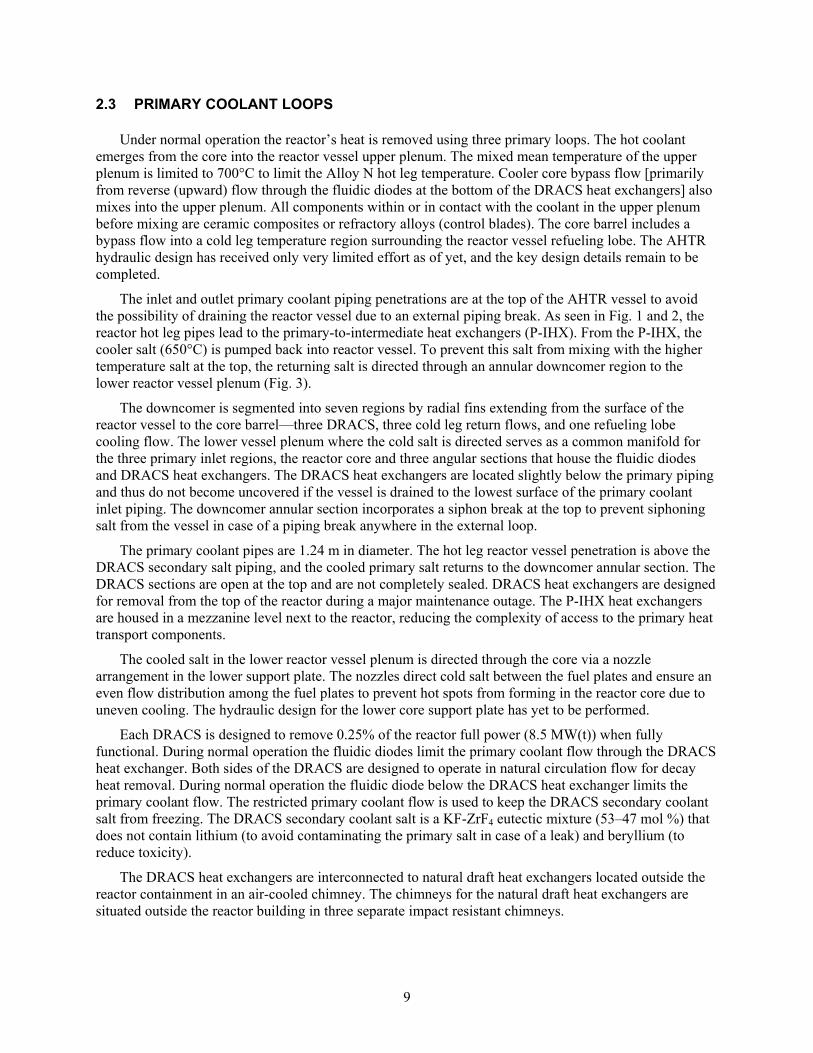
2.3 PRIMARY COOLANT LOOPS
Under normal operation the reactor’s heat is removed using three primary loops. The hot coolant emerges from the core into the reactor vessel upper plenum. The mixed mean temperature of the upper plenum is limited to 700°C to limit the Alloy N hot leg temperature. Cooler core bypass flow [primarily from reverse (upward) flow through the fluidic diodes at the bottom of the DRACS heat exchangers] also mixes into the upper plenum. All components within or in contact with the coolant in the upper plenum before mixing are ceramic composites or refractory alloys (control blades). The core barrel includes a bypass flow into a cold leg temperature region surrounding the reactor vessel refueling lobe. The AHTR hydraulic design has received only very limited effort as of yet, and the key design details remain to be completed.
The inlet and outlet primary coolant piping penetrations are at the top of the AHTR vessel to avoid the possibility of draining the reactor vessel due to an external piping break. As seen in Fig. 1 and 2, the reactor hot leg pipes lead to the primary-to-intermediate heat exchangers (P-IHX). From the P-IHX, the cooler salt (650°C) is pumped back into reactor vessel. To prevent this salt from mixing with the higher temperature salt at the top, the returning salt is directed through an annular downcomer region to the lower reactor vessel plenum (Fig. 3).
The downcomer is segmented into seven regions by radial fins extending from the surface of the reactor vessel to the core barrel—three DRACS, three cold leg return flows, and one refueling lobe cooling flow. The lower vessel plenum where the cold salt is directed serves as a common manifold for the three primary inlet regions, the reactor core and three angular sections that house the fluidic diodes and DRACS heat exchangers. The DRACS heat exchangers are located slightly below the primary piping and thus do not become uncovered if the vessel is drained to the lowest surface of the primary coolant inlet piping. The downcomer annular section incorporates a siphon break at the top to prevent siphoning salt from the vessel in case of a piping break anywhere in the external loop.
The primary coolant pipes are 1.24 m in diameter. The hot leg reactor vessel penetration is above the DRACS secondary salt piping, and the cooled primary salt returns to the downcomer annular section. The DRACS sections are open at the top and are not completely sealed. DRACS heat exchangers are designed for removal from the top of the reactor during a major maintenance outage. The P-IHX heat exchangers are housed in a mezzanine level next to the reactor, reducing the complexity of access to the primary heat transport components.
The cooled salt in the lower reactor vessel plenum is directed through the core via a nozzle arrangement in the lower support plate. The nozzles direct cold salt between the fuel plates and ensure an even flow distribution among the fuel plates to prevent hot spots from forming in the reactor core due to uneven cooling. The hydraulic design for the lower core support plate has yet to be performed.
Each DRACS is designed to remove 0.25% of the reactor full power (8.5 MW(t)) when fully functional. During normal operation the fluidic diodes limit the primary coolant flow through the DRACS heat exchanger. Both sides of the DRACS are designed to operate in natural circulation flow for decay heat removal. During normal operation the fluidic diode below the DRACS heat exchanger limits the primary coolant flow. The restricted primary coolant flow is used to keep the DRACS secondary coolant salt from freezing. The DRACS secondary coolant salt is a KF-ZrF4 eutectic mixture (53–47 mol %) that does not contain lithium (to avoid contaminating the primary salt in case of a leak) and beryllium (to reduce toxicity).
The DRACS heat exchangers are interconnected to natural draft heat exchangers located outside the reactor containment in an air-cooled chimney. The chimneys for the natural draft heat exchangers are situated outside the reactor building in three separate impact resistant chimneys.

10
2.4 REFUELING APPARATUS
During refueling the control blade motor plate is moved horizontally out of the way and replaced by a vertical fuel handling manipulator. All of the refueling motions are guided visually using several cameras connected to optical systems located in the gas region above the pool and below the vessel upper flange. The level of the primary coolant salt inside the reactor vessel is maintained at least 2 m above the fuel assemblies during refueling to provide shielding to the components and maintain cooling of the fuel.
The reactor design uses three manipulators for fuel handling: (1) in-vessel fuel handling manipulator (IVFHM), (2) annular rolling manipulator (ARM), and (3) refueling station manipulator (RCM) (Fig. 7).
Fig. 7. In-vessel fuel handling mechanisms for the AHTR.
The IVFHM robot is the manipulator that interfaces with the core through the upper flange cover plate. It has three joints and is mainly used to vertically transfer fuel into and out of the core. All motors for this manipulator are outside the reactor vessel. The manipulator joints are actuated mechanically. Once a fuel assembly has been lifted from the reactor core, the assembly is handed over to the ARM.
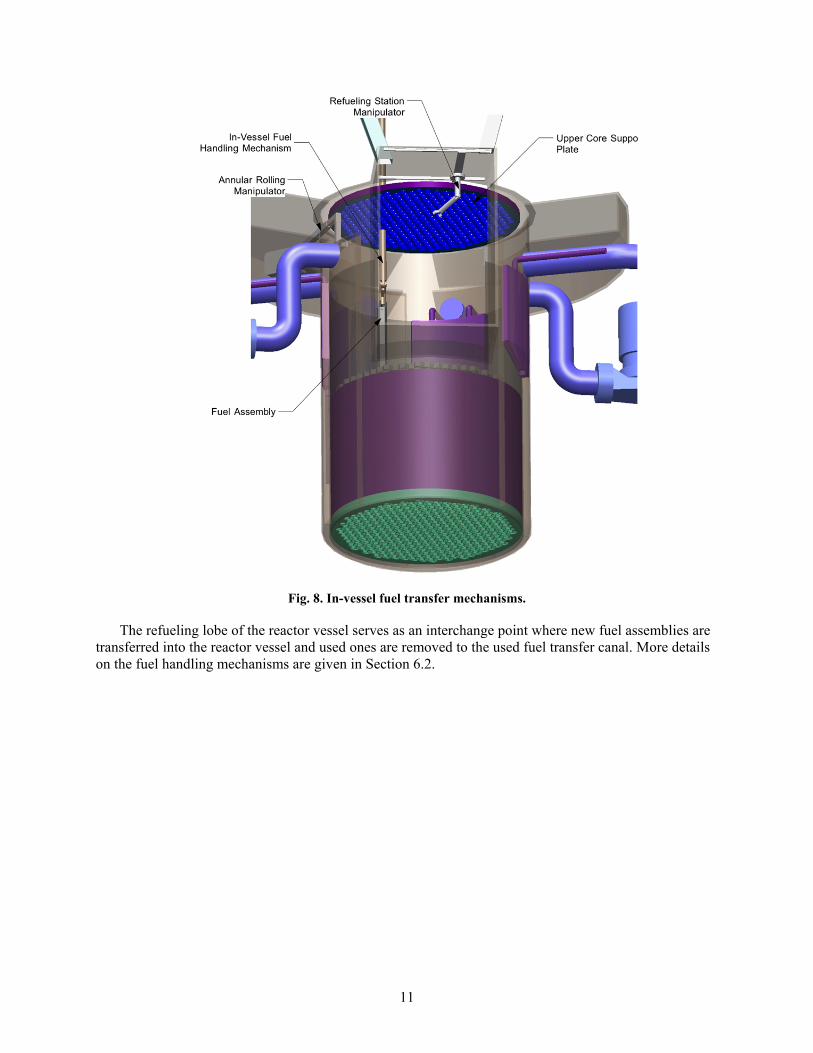
The telescoping ARM robot transfers fuel assemblies horizontally across the vessel upper plenum into the refueling lobe (Fig. 8). This robot travels in an annular ring along the circumference of the reactor. Two such robots are employed to enable reaching any radial position of the fuel core. The fuel assembly that has been lifted from the core by the IVFHM is handed to the ARM, which then transfers it to the refueling lobe of the reactor vessel where the fuel assembly is handed to the refueling station manipulator (RSM).
The RSM is a gantry robot that handles the entry of new fuel assemblies into the reactor and also transfers used fuel from the ARM to the refueling carousel.
11
Fig. 8. In-vessel fuel transfer mechanisms.
The refueling lobe of the reactor vessel serves as an interchange point where new fuel assemblies are transferred into the reactor vessel and used ones are removed to the used fuel transfer canal. More details on the fuel handling mechanisms are given in Section 6.2.


13
AHTR CORE DESCRIPTION 3.
This section describes the neutronic aspects of the AHTR core. The neutronic design includes consideration of thermal-hydraulic issues to achieve a more realistic design.
Starting with the plank fuel design from the SmAHTR neutronics work,1 the reference AHTR core design was obtained after a series of iterations that involved thermal-hydraulic, mechanical, fuel, and structural limitations. Each of the design elements imposes its own constraints on the AHTR core.
The baseline for the AHTR core design was to achieve a lifetime of 2 years for a core that uses 19.75% or less enriched fuel. The 19.75% enrichment is just under the uranium low-enrichment limit, and using it should provide the maximum expected fuel cycle length for the AHTR. The baseline core should not be interpreted as an optimized core design, but as the model used to evaluate whether design changes represent an improvement. In particular, there is a desire to reduce the fuel enrichment, which would likely result in lower fuel cycle costs.
Multibatch evaluations described in Section 6 indicate that a possible candidate for a lower cost AHTR is a configuration that uses 9% enriched fuel and a two-batch design with a carbon–to–heavy metal ratio (CHM) of 400. This core has a 6 month refueling interval and uses the same geometrical configuration as the baseline AHTR core, with about half the heavy metal inventory.
3.1 AHTR CORE
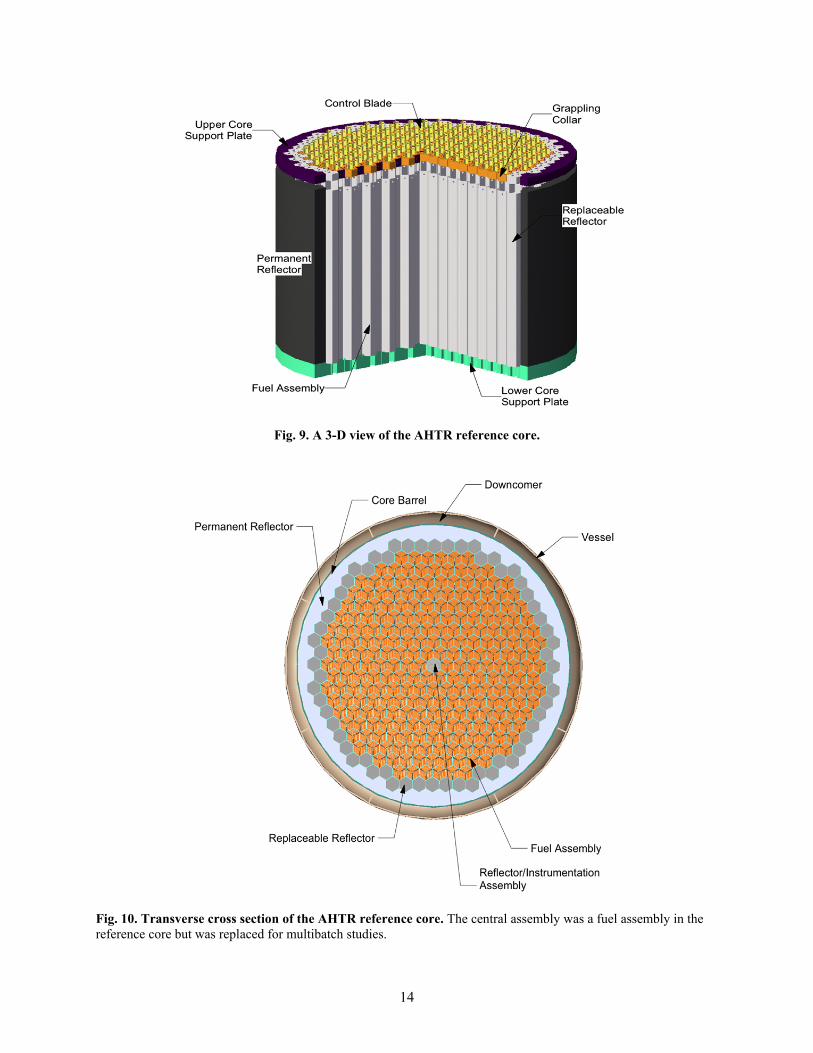
The 3,400-MW(t) AHTR reference core consists of 253 fuel assemblies* arranged in a hexagonal lattice with roughly cylindrical shape. Figure 9 shows a 3-D view of the AHTR reference core, with the upper and lower core support plates visible, while Fig. 10 shows a midplane horizontal cross section detailing the main elements of the core and reactor vessel including the downcomer segmentation. At the edge of the fueled region (in the horizontal cross section) is a ring of removable reflector blocks made of graphite, followed by the permanent graphite reflector. The fueled core and the radial reflector are included in a 2-cm-thick (tentatively) core barrel made of C-C that separates the up-flow from the downcomer. The downcomer is dimensioned so that its Transverse flow area is at least twice the in-core flow area. The downcomer is bounded by the reactor vessel, made of Alloy N.
* The number of fuel assemblies is for the reference, single-batch calculations. The number was later reduced to 252 fuel assemblies for multibatch refueling purposes (Section 6) by replacing the central assembly with a reflector/instrumentation column. This results in a decrease of about 0.4% in the mass of fuel.
14
Fig. 9. A 3-D view of the AHTR reference core.
Fig. 10. Transverse cross section of the AHTR reference core. The central assembly was a fuel assembly in the reference core but was replaced for multibatch studies.

15
Table 2 contains the main characteristics of the AHTR core for the reference model. The 32.9 metric tons of heavy metal (MTHM) corresponds to the fresh initial core, as does the amount of fissile material. In the axial direction, the 5.5 m fueled region in the fuel assemblies is continued by 25 cm of carbonaceous material for additional moderation and reflection.
Table 2. Main core characteristics of the AHTR reference model
Parameter Value Units Power (thermal) 3,400 MW Number of fuel assemblies 253a - Assembly lattice type Hexagonal - Fuel type Coated Particle - Moderator Graphite - Reflector Graphite Coolant FLiBe - Coolant pressure drop across core 1 atm Core height (fueled region) 5.5 m Core height (including axial reflector) 6.0 m Equivalent core diameter (fueled region) 7.81 m Core diameter (including radial reflector) 9.56 m Average power per grain 41 mW/particle Average power density in fueled region 52 W/cm3 Volumetric core power density 12.9 MW/m3
Mass of heavy metal 32.91 MT Fuel enrichment 19.75 % Mass of fissile 6.5 MT Fuel cycle length (once-through) 2.2 years Inlet coolant temperature 650 °C Outlet coolant temperature (average) 700 °C Maximum fuel temperature (average assembly) 854 °C Average coolant flow velocity (intra-assembly flow) 1.93 m/s Coolant volumetric flow rateb 14.56 m3/s Average Reynolds number (intra-assembly flow) 7,212 – aThe 253-assembly configuration was changed to a 252-assembly one in the refueling study (Section 6). bAssumed that the flow velocity outside the channel box is 1/10 of the flow velocity inside the channel box.
The coolant flows from the bottom of the core to the top of the core. The average coolant velocity inside the fuel assembly, the average Reynolds number, and the maximum (axial) fuel temperature in the average assembly were calculated using the simple thermal-hydraulic model presented in Appendix A and in Table 2.
The AHTR is cooled with molten FLiBe, a transparent fluoride salt which allows visual control of manipulators inside the reactor vessel. The FLiBe peritectic composition (27LiF-BeF2) used in these studies has a higher melting point of 459°C but is less viscous than its eutectic counterpart (7LiF-BeF2). To allow criticality, the lithium component in FLiBe has to be highly isotopically enriched in 7Li as 6Li has a high thermal neutron capture cross section. The reference enrichment that we used in our studies is 99.995 wt % 7Li. During reactor operation the isotopic fraction of 7Li reaches an equilibrium value and, with an even higher starting enrichment, would be degraded back to the equilibrium value.
For this reference core configuration the once-through cycle length was calculated at 2.2 years. Thus, the uranium enrichment can actually be slightly less to achieve the 2 year refueling interval. The maximum fuel temperature calculated with the model described in Appendix A is 854°C in the average fuel assembly (which would correspond to a radially flat power distribution), well below the 1250°C that has been employed as the upper operational fuel temperature in gas-cooled reactors. The particular fuel

16
configuration used in this design allows raising the power density in the core by ~30% compared to a prior AHTR design,5 to almost 13 MW/m3.
3.1.1 Constraints Used in the AHTR Core Design
To create the reference AHTR core design, a number of constraints were imposed based on known limitations of the materials, coated particle fuel, mechanics requirements, and thermal-hydraulic performance considerations. These constraints, listed in Table 3, have the net effect of narrowing the design space for the AHTR core design.
The large thermal power design goal of the AHTR, combined with the requirement that the operating fuel temperature be maintained below 1000°C, dictated the size of the core. Thermal-hydraulic considerations led to the internal structure of the fuel plates, to the size and arrangement of the coolant gaps between the fuel plates, and to the number of fuel plates. The design goal of maximizing the fuel cycle length for the once-through fuel cycle led to the amount of heavy metal in the core, while the desire to achieve a higher fuel burnup and a less costly fuel cycle led to the consideration of the multibatch and online refueling strategies.
Further evolutionary constraints, such as refueling time, reactivity coefficients, etc. are detailed in the following chapters.
Table 3. Constraints imposed on the AHTR design
Constraint Consequence Power [3,400 MW(t)] Size of reactor High temperature operation Choice of structure materials, coolant Low fuel temperature Power density (<13MW/m3), striped fuel configuration Use of realistic, qualified fuel Fuel kernel size (AGR-2 UCO fuel), packing fraction upper limit (<40%)Use of low fuel enrichment Upper limit of fuel enrichment <20% Use of realistic carbonaceous materials Density of C-C composite below 2 g/cm3 Achieve high burnup, long core life Online refueling, multibatch Fuel compacting distance <75 mm Plate maximum thickness Plate thickness >20 mm for structural strength
Plate minimum thickness
In-core coolant flow velocity <3m/s Size and arrangement of fuel plates (spacing between fuel plates) Reynolds number >5000 Size and arrangement of fuel plates (spacing between fuel plates) Low coolant pressure drop (<1.5 atm) Size and arrangement of fuel plates (spacing between fuel plates) Potential fuel assembly distortion Spacing between fuel assemblies
3.1.2 Comparison Between the AHTR and AP-1000 Core Designs
The AHTR is a liquid-cooled, solid fuel design concept. As such it has inherent similarities to LWRs. As part of the design studies, the key performance variables between the AHTR and a modern LWR core design (the Westinghouse AP-100016) were compared and are presented in Table 4. The last column in this table presents the ratio between the respective parameters for the AHTR and the AP-1000.
The heat transfer flow rate is the coolant mass flow rate (i.e., the product of the coolant density and the volumetric flow rate). The heat transfer cross section is the transverse cross-sectional area of the coolant through the reactor core. The heat transfer surface area is the total fuel plate area seen by the coolant. Dividing the total power generated in the reactor by the heat transfer surface area, the average heat flux is obtained. Further, the average coolant velocity along the fuel is obtained as described in APPENDIX A, by imposing the average coolant temperature rise in the core of 50°C. The UO2 (UCO for AHTR) and uranium masses are calculated from the geometry of the fuel elements. The equivalent core

17
diameter is determined by considering a cylindrical reactor with the same cross-sectional area as the hexagonal area of the AHTR. The core volume includes only the fueled region (i.e., no radial or axial reflector) and is further used in determining the core power density. Finally, the heat transfer surface area per megawatt and the coolant flow per megawatt are determined by dividing the respective quantities by the reactor thermal power. Many of the parameters of the AHTR are similar to the AP-1000, providing confidence in the reasonableness of the AHTR design, with a notable decrease in the core power density due to the lower amount of uranium that can be loaded into a carbon-moderated core as compared to a hydrogen-moderated core.
Table 4. Comparison of AHTR and AP-1000 core designs
Parameter AHTR AP1000 AHTR/AP1000 Heat transfer flow rate (kg/s) 28,408.1 65,415.0 0.43 Heat transfer cross section (m2) 10.70 3.88 2.75 Heat transfer surface area (m2) 11,279.5 5,267.6 2.14 Average heat flux (W/m2) 301,431.9 645,455.0 0.47 Average coolant velocity along fuel (m/s) 1.93 4.82 0.40 Coolant pressure (atm) 1.0 153.0 0.0065 Average coolant outlet temperature (K) 973 588 1.65 Average coolant temperature rise in core (K) 50 27.4 1.82 Thermal efficiency (%) 45 34 1.32 UO2 mass (kg) 36,788.2 95,958.3 0.38 Uranium mass (kg) 32,912.7 84,582.3 0.39 Equivalent core diameter (m) 7.81 3.04 2.57 Fueled core height (cold) (m) 5.5 4.2672 1.29 Enrichment at loading—equilibrium core (wt %) 19.75% 4.45% 4.44 Core volume (m3) 263.38 30.98 8.50 Core power density (MW/m3) 12.91 109.75 0.12 Heavy metal per MW (kg-U/MW) 9.68 24.88 0.39 Heat transfer surface area/MW (m2/MW) 3.32 1.55 2.14 Coolant flow/MW (kg/MW) 8.36 19.24 0.43
3.2 FUEL ASSEMBLY
The fuel assembly is a 6-m tall hexagonal prismatic box with 1-cm-thick walls made of C-C composite. The outer apothem (half the side-to-side distance) of the hexagon is 22.5 cm. The interior (“channel”) of the hexagonal box (“channel box”) is divided into three symmetric regions by a 4-cm-thick Y-shaped structure (“Y-shape”), also made of C-C composite. In each of the three regions there are six equidistant fuel plates that are supported at one end by the Y-shaped structure and at the other end by the channel box. The 0.7 cm distance between two fuel plates is filled by the FLiBe coolant (“intra-assembly coolant”). For the plates adjacent to the walls (channel box or Y-shape), the coolant thickness is half the thickness between plates: 0.35 cm. Table 5 summarizes the main geometric characteristics of the AHTR fuel assembly while Fig. 11 shows a cross section through a fuel assembly inside the core.
The channel boxes of two adjacent assemblies are not in direct contact but are separated by 1.7 cm of coolant (“interassembly coolant”) inside the core region (Fig. 11).
At the center of the Y-shape is the control blade slot, also Y-shaped. The slot is 1 cm thick and each wing is 10 cm long.

18
Table 5. Main geometric characteristics of the fuel assembly for the reference AHTR design
Characteristic Value Units Total height 600 cm Fueled region height 550 cm Fuel assembly pitch 46.75 cm Outer apothem 22.5 cm Channel box wall thickness 1 cm Y-shape thickness 4 cm Coolant thickness between plates 7 mm Coolant thickness between plate and wall 3.5 mm Control blade location thickness 1 cm Control blade location wing length 10 cm Fuel plate thickness 2.55 cm Number of fuel plates 18 –
Fig. 11. Transverse cross section of a group of fuel assemblies showing the interassembly spacing.
Table 6 shows the material composition and their densities for the main components of the AHTR assembly. A dimensioned cross-sectional view of a single fuel assembly is shown in Fig. 12.
Table 6. Material characteristics of the fuel assembly for the reference AHTR design
Part Material ρ (g/cm3) Channel box C-C 1.95 Y-shape C-C 1.95 Coolant FLiBe 1.9506 Fuel plate See Table 7

19
Fig. 12. Transverse cross section of a fuel assembly with dimensions in centimeters.
3.3 FUEL PLATE
The plate design for the fuel elements represents a design evolution from the SmAHTR design.1 Within the slab fuel element, the TRISO fuel particles are distributed in two stripes separated by central carbonaceous material. This represents the main departure from the SmAHTR fuel, where the fuel was distributed throughout the plate. This design was chosen taking into account both neutronic considerations, to allow better moderation, and also thermal-hydraulic considerations, to allow better cooling. A thin (~1 mm thick) sleeve of carbonaceous material separates each fuel stripe from the FLiBe coolant, preventing individual fuel particles from eroding away.
Figure 13 shows a cross-sectional view of the fuel plank as modeled for the depletion calculations. The thickness of the fuel stripes is designed to allow maximum thermal-hydraulic performance (i.e., minimize the maximum temperature in the fuel) and to maximize the lifetime of the reactor core. It should be pointed out that maximization of the once-through cycle length does not automatically also lead to maximization of the fuel burnup.
Fig. 13. Transverse cross section of a fuel plate (reference model).
20
3.4 COATED PARTICLE FUEL
The prototype for the reference coated particle fuel grain used in this study was the AGR-2 fuel described in a recent paper by Phillips et al.8 Table 7 summarizes the dimensions and the material properties of the fuel. The matrix pitch is calculated for a centered cubic lattice of grains assuming the reference packing fraction of 40%.
Table 7. TRISO particle description for the reference AHTR design
Region Parameter Parameter value
(m) Material
ρ (g/cm3)
Kernel diameter 427 UCO 10.9 Buffer thickness 100 Porous graphite 1.0 IPyC thickness 35 Pyrolitic graphite 1.9 SiC thickness 35 SiC 3.2 OPyC thickness 40 Pyrolitic graphite 1.87 Fuel particle diameter 847 – – Matrix pitch 927 Carbon material 1.59
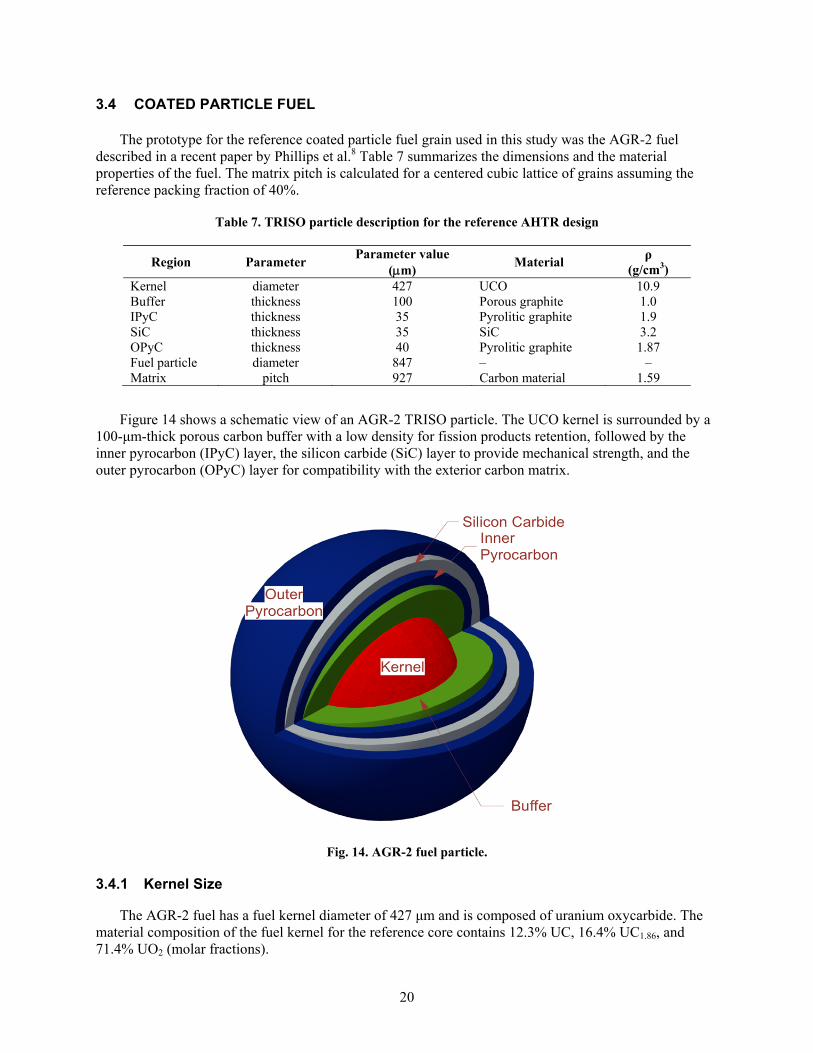
Figure 14 shows a schematic view of an AGR-2 TRISO particle. The UCO kernel is surrounded by a 100-μm-thick porous carbon buffer with a low density for fission products retention, followed by the inner pyrocarbon (IPyC) layer, the silicon carbide (SiC) layer to provide mechanical strength, and the outer pyrocarbon (OPyC) layer for compatibility with the exterior carbon matrix.
Fig. 14. AGR-2 fuel particle.
3.4.1 Kernel Size
The AGR-2 fuel has a fuel kernel diameter of 427 μm and is composed of uranium oxycarbide. The material composition of the fuel kernel for the reference core contains 12.3% UC, 16.4% UC1.86, and 71.4% UO2 (molar fractions).
21
3.4.2 Packing Fraction
The packing fraction for the reference model calculations was 40%. The current packing fraction for the AGR-2 UCO fuel design is 37%. Discussions with ORNL fuel fabrication staff confirmed that the 40% packing fraction as used in this study is technologically reasonable.
The fuel graphite matrix has a density of 1.59 g/cm3 for the reference core, in accord with the matrix density for the UCO-based AGR-2 fuel. This represents an increase from the 1.3 g/cm3 graphite matrix density used in the AGR-1 fuel specifications. The density of the carbon in the matrix has an important effect on the reactivity of the system: a higher density is desirable to provide additional moderation.
3.4.3 Fuel Enrichment
The assumed enrichment for the reference core was 19.75 wt % 235U/U. This is closer to the enrichment used in the design of the AGR-1 fuel (19.7 wt % 235U/U) but represents a departure from the AGR-2 specification, which uses an enrichment of 14%. The 19.75% fuel enrichment was used to assess the maximum achievable refueling interval for the AHTR core concept. The target was a 2-year, once-through cycle length for the core with this enrichment. As electrical demand in the United States has both fall and spring minimums, an alternate core design considered minimizing the fuel enrichment subject to the constraint of having at least a 6-month refueling interval. A two-batch, 9% enriched fuel configuration was identified as a possible design candidate.

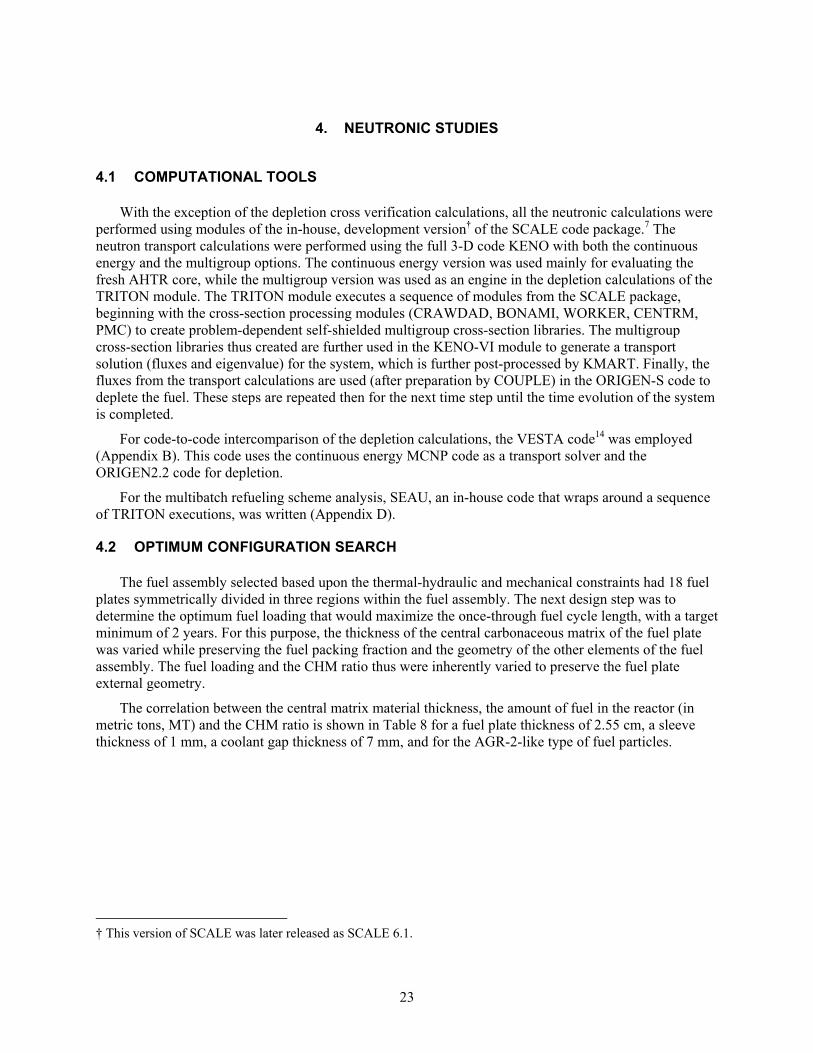
23
NEUTRONIC STUDIES 4.
4.1 COMPUTATIONAL TOOLS
With the exception of the depletion cross verification calculations, all the neutronic calculations were performed using modules of the in-house, development version† of the SCALE code package.7 The neutron transport calculations were performed using the full 3-D code KENO with both the continuous energy and the multigroup options. The continuous energy version was used mainly for evaluating the fresh AHTR core, while the multigroup version was used as an engine in the depletion calculations of the TRITON module. The TRITON module executes a sequence of modules from the SCALE package, beginning with the cross-section processing modules (CRAWDAD, BONAMI, WORKER, CENTRM, PMC) to create problem-dependent self-shielded multigroup cross-section libraries. The multigroup cross-section libraries thus created are further used in the KENO-VI module to generate a transport solution (fluxes and eigenvalue) for the system, which is further post-processed by KMART. Finally, the fluxes from the transport calculations are used (after preparation by COUPLE) in the ORIGEN-S code to deplete the fuel. These steps are repeated then for the next time step until the time evolution of the system is completed.
For code-to-code intercomparison of the depletion calculations, the VESTA code14 was employed (Appendix B). This code uses the continuous energy MCNP code as a transport solver and the ORIGEN2.2 code for depletion.
For the multibatch refueling scheme analysis, SEAU, an in-house code that wraps around a sequence of TRITON executions, was written (Appendix D).
4.2 OPTIMUM CONFIGURATION SEARCH
The fuel assembly selected based upon the thermal-hydraulic and mechanical constraints had 18 fuel plates symmetrically divided in three regions within the fuel assembly. The next design step was to determine the optimum fuel loading that would maximize the once-through fuel cycle length, with a target minimum of 2 years. For this purpose, the thickness of the central carbonaceous matrix of the fuel plate was varied while preserving the fuel packing fraction and the geometry of the other elements of the fuel assembly. The fuel loading and the CHM ratio thus were inherently varied to preserve the fuel plate external geometry.
The correlation between the central matrix material thickness, the amount of fuel in the reactor (in metric tons, MT) and the CHM ratio is shown in Table 8 for a fuel plate thickness of 2.55 cm, a sleeve thickness of 1 mm, a coolant gap thickness of 7 mm, and for the AGR-2-like type of fuel particles.
† This version of SCALE was later released as SCALE 6.1.

24
Table 8. Correlation of the mass of heavy metal and the CHM ratio with the central matrix thickness
Matrix meat thickness (mm)
Mass of heavy metal in reactor
(MT) CHM
0 63.18 97 1 60.82 101 2 58.42 106 5 51.07 122 8 43.46 144
12 32.91 193 14 27.46 232 16 21.90 293 17 19.07 337 18 16.22 397 20 10.42 622
Evaluations were performed with matrix thicknesses between 12 and 20 mm (corresponding to CHM
ratios between 200 and 600) to assess the once-through cycle lengths of the AHTR core. The results show a decrease in the cycle length as the CHM ratio increases (Fig. 15), combined with a sharp increase in the discharge burnup. The baseline AHTR core was chosen as the one that maximized the cycle length and corresponds to a core life of 2.18 years but to a burnup of only ~80 GWd/MTHM.
100 200 300 400 500 600 7001.0
1.1
1.2
1.3
1.4
1.5
1.6
1.7
1.8
1.9
2.0
2.1
2.2
2.3
2.4
2.5
Cyc
le le
ngth
(ye
ars)
CHM
Cycle length Burnup
80
90
100
110
120
130
140
150
Bur
nup
(GW
d/M
TH
M)
Fig. 15. AHTR once-through cycle length and achievable burnup as a fuction of CHM.
4.3 CONTROL BLADE DESIGN
The AHTR employs one control blade per fuel assembly with each control blade having relatively low reactivity worth. The control blade remains with the fuel assembly throughout the fuel loading and unloading procedure to preclude criticality accidents during fuel handling. The current AHTR design
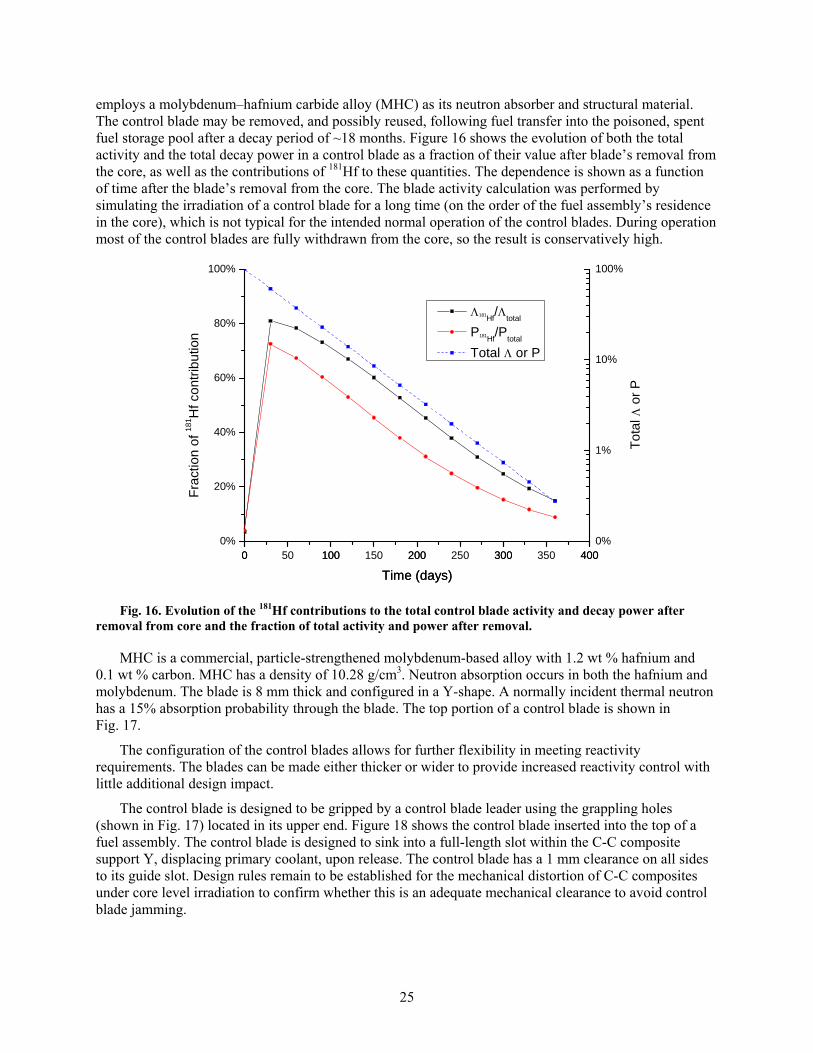
25
employs a molybdenum–hafnium carbide alloy (MHC) as its neutron absorber and structural material. The control blade may be removed, and possibly reused, following fuel transfer into the poisoned, spent fuel storage pool after a decay period of ~18 months. Figure 16 shows the evolution of both the total activity and the total decay power in a control blade as a fraction of their value after blade’s removal from the core, as well as the contributions of 181Hf to these quantities. The dependence is shown as a function of time after the blade’s removal from the core. The blade activity calculation was performed by simulating the irradiation of a control blade for a long time (on the order of the fuel assembly’s residence in the core), which is not typical for the intended normal operation of the control blades. During operation most of the control blades are fully withdrawn from the core, so the result is conservatively high.
0 100 200 300 4000%
20%
40%
60%
80%
100%
Fra
ctio
n o
f 181
Hf c
ont
ribu
tion
Time (days)
181Hf/
total
P181Hf/P
total
Total or P
0 50 100 150 200 250 300 350 4000%
1%
10%
100%
To
tal
or
P
Time (days)
Fig. 16. Evolution of the 181Hf contributions to the total control blade activity and decay power after removal from core and the fraction of total activity and power after removal.
MHC is a commercial, particle-strengthened molybdenum-based alloy with 1.2 wt % hafnium and 0.1 wt % carbon. MHC has a density of 10.28 g/cm3. Neutron absorption occurs in both the hafnium and molybdenum. The blade is 8 mm thick and configured in a Y-shape. A normally incident thermal neutron has a 15% absorption probability through the blade. The top portion of a control blade is shown in Fig. 17.
The configuration of the control blades allows for further flexibility in meeting reactivity requirements. The blades can be made either thicker or wider to provide increased reactivity control with little additional design impact.
The control blade is designed to be gripped by a control blade leader using the grappling holes (shown in Fig. 17) located in its upper end. Figure 18 shows the control blade inserted into the top of a fuel assembly. The control blade is designed to sink into a full-length slot within the C-C composite support Y, displacing primary coolant, upon release. The control blade has a 1 mm clearance on all sides to its guide slot. Design rules remain to be established for the mechanical distortion of C-C composites under core level irradiation to confirm whether this is an adequate mechanical clearance to avoid control blade jamming.

26
Fig. 17. Top portion of the control blade.
The control blades provide a total negative reactivity of ~10% Δk/k when all the blades are fully inserted. This reactivity combined with the required shutdown margin determines the maximum allowed excess reactivity for the AHTR core. The limited negative reactivity available from the control blades necessitates the use of burnable poisons in the AHTR core to reduce the amount of excess reactivity.
Fig. 18. Upper end of the fuel assembly with control blade inserted.
4.4 TEMPERATURE REACTIVITY COFFICIENTS
The isothermal temperature reactivity coefficient was evaluated for the reference configuration at the beginning of cycle (fresh fuel) over the temperature interval [800 K, 1850 K] (approximately [500°C, 1600°C]). The isothermal temperature reactivity coefficient of reactivity, (∂ρ/∂T)iso, is calculated as the derivative of the reactivity induced by an isothermal change in the temperature of the core considering the

27
core in an isothermal condition (i.e., uniform temperature everywhere) with all the other parameters maintained constant.
For the fresh reference core, the average isothermal temperature coefficient over this interval is (∂ρ/∂T)iso = –3.80 pcm/K. The isothermal coefficient is not constant but varies linearly over the above interval. Therefore it can be better approximated‡ with a linear function:
⁄ 5.78 0.20 0.75 0.07 10 .
Fuel burnup has a beneficial effect on the isothermal temperature coefficient. For the reference core at
the end of cycle, the average isothermal temperature coefficient over the above temperature interval is (∂ρ/∂T)iso = –7.53 pcm/K. As a linear function, it can be approximated as
⁄ 2.95 0.24 1.74 0.09 10 .
In this case the coefficient becomes more negative with the temperature increase.
The reference core corresponds to a CHM ratio of just below 200. If the CHM increases, the average isothermal temperature coefficient becomes more positive. For a CHM of 337, the coefficient has an average value of –2.92 pcm/K over the same temperature interval with the linear approximation
⁄ 4.84 0.14 0.73 0.05 10 .
The plot in Fig. 19 shows graphically the variation of the isothermal reactivity coefficient with
temperature for the three cases discussed above.
The temperature reactivity coefficient calculations do not yet include the effects of burnable poisons.
700 800 900 1000 1100 1200 1300 1400 1500 1600 1700 1800 1900-10
-9
-8
-7
-6
-5
-4
-3
-2
-1
0
Re
activ
ity c
oef
ficie
nt (
pcm
/K)
Temperature (K)
Reference, BOC Reference, EOC CHM=337, BOC
Fig. 19. Variation of isothermal reactivity coefficient with temperature.
‡ The uncertainties in the coefficients of the linear approximations are purely statistical uncertainties and do not account for any approximation due to the physics used in the codes.

28
4.5 VOID REACTIVITY COEFFICIENT
The effect of voiding the AHTR core was studied for the reference fresh core by calculating the insertion of reactivity that would result from the complete removal of the coolant. The negative reactivity thus inserted is –2056.3 ± 26.3 pcm, or about –2% Δk/k. This results in an average void reactivity coefficient of
(∂ρ/∂α) = –20.56 ± 2.63 pcm/% void .
The coolant density can vary with its temperature as a linear function:5
2.280 0.000488 2.413 0.000488 .
Combining this law with the above result for the average void reactivity coefficient results in an
average value of (∂ρ/∂T)c = –0.51 pcm/K for the rate of reactivity insertion due to the voiding of coolant with temperature increase. The isothermal and void coefficients of reactivity can be compounded, yielding the combined effect of (dρ/dT)iso = –4.3 pcm/K over the temperature interval [800 K, 1850 K].
The coolant void reactivity coefficient can vary drastically with the fuel design and can become positive for high CHM ratio. This is shown in Fig. 20 where the calculated void coefficient values for several CHM ratios were fitted with a straight line. The calculations were performed by varying the mass of fuel (fuel stripe thickness) in the fuel plate. For CHM ratios beyond ~450, the void coefficient of the coolant becomes positive. The coolant void coefficient for the reference model corresponds to a CHM value just below 200. The CHM for the 9% enriched, two-batch core design is ~400.
100 200 300 400 500 600 700-25
-20
-15
-10
-5
0
5
10
15
Vo
id c
oeffi
cien
t (pc
m/%
)
CHM
Fig. 20. Coolant void coefficient as a function of carbon–to–heavy metal ratio.

29
The coolant void coefficient also varies substantially during fuel irradiation as a result of fission product buildup and change in actinide composition. Calculations were performed for the reference model for the BOC and for the EOC (once-through) compositions. The results are shown in Table 9. The void coefficient almost doubles by the end of the fuel cycle.
Table 9. Coolant void coefficients for the reference core
AHTR core (∂ρ/∂α)
(pcm/%) σ
(pcm/%) BOC –20.56 0.26 EOC –38.70 1.22
4.6 POWER DISTRIBUTION
The power distribution in the reactor is expected to be fairly flat, even at the beginning of the fuel cycle because of the optically thin regions (due to the small neutron absorption in moderator and coolant) that separate different fueled regions. Figure 21 shows the distribution of the regionwise power peaking factors in the reference core at the beginning of cycle for the reference AHTR core.
Fig. 21. Regionwise peaking factors in the reference core at BOC.
4.7 FAST FLUENCE
The fast fluence distribution in the core determines the life of the carbonaceous materials that are part of the core and nearby structures including the C-C composite core barrel. The average 60 year fast fluence at the core barrel is 5.7 1018 n/cm2, and its total fluence is 4.8 1021 n/cm2, mostly due to thermal neutrons.
The mechanical distortion of C-C composites and coated particle fuel compacts due to neutron irradiation is not well documented at present. While the only graphite near the AHTR core forms its removable and permanent reflectors, as a temporary surrogate this task assumed the radiation distortion of graphite is similar to that of other carbon-based materials. Figure 22 shows the behavior of the graphite

30
distortion at different temperatures and fast fluences.13 For temperatures typical of the AHTR operating temperature, the distortion of graphite is below 2% for fast fluences up to 4 1022 n/cm2.
The distribution of the fast neutron flux (E > 50 keV) in the reactor core is shown in Fig. 23 for the reference AHTR core. At the maximum fast flux of 0.19 1022 n/cm2/year for the central region, the graphite needs ~20 years of in-core irradiation before reaching a fast fluence of 4 1022 n/cm2.
Although this 20 year time seems to provide enough margin for the residence time of a fuel assembly in the core, the design margin can be substantially reduced for lower enrichment designs. The reason is that the neutron flux varies with the inverse of the enrichment fraction for the same core configuration to provide the same level of power. The design margin is further reduced with the fuel burnup, as the net effect of the burnup is a decrease in the fissile fraction (and hence the enrichment) of the fuel. Assuming a 10% initial enrichment for the fresh fuel and an average of 7% fissions per initial metal atom (FIMA) for the equilibrium fuel (in case a multibatch refueling scheme is adopted), this results in a threefold increase in the fast fluence rate (fast neutron flux) and a corresponding decrease to an approximately 7-year life for core graphite components. More radiation performance data is needed but currently unavailable for the carbonaceous materials intended for use in the AHTR core.
Fig. 22. Graphite linear distortion as a function of fluence at various temperatures (Ref. 13).

31
Fig. 23. Regionwise fast flux (E > 50 keV) in the reference core at BOC (10-22 n/cm2/year).
The average total fluence over the height of the reactor vessel is calculated for the fresh reference core to be 2.0 1018 n/cm2/year, which yields a total fluence of 1.2 1020 n/cm2 over an anticipated lifespan of 60 years. At the midplane of the reactor, this can reach 4.8 1020 n/cm2 over a 60-year period. In both cases the main contributor to the fluence is the thermal component (E < 0.625 eV). High-nickel alloys, such as Alloy N, embrittle presumably due to helium accumulation at the grain boundaries when subjected to high neutron fluence (>~1020 n/cm2) at high temperatures (>500°C).17 The embrittlement has both thermal and energetic neutron pathways. The lifetime neutron fluence is sufficiently high that some shielding is needed to protect the vessel. Incorporation of a thin boron carbide layer just inside the core barrel is a possible shield configuration.
4.8 NONPROLIFERATION IMPLICATIONS
The isotopes produced during fuel depletion in the AHTR core can be divided into several classes, depending on their impact and the concerns they might present: isotopes important for reprocessing and waste storage, for accident scenarios, for proliferation concerns, and for reactor operation. This section focuses on the evolution of the actinides with implications for proliferation of uranium and plutonium isotopes. Reprocessing of coated particle fuel is not anticipated to be significantly more difficult than LWR fuel.23
The uranium isotopic composition depends mainly on the initial enrichment and the burnup achieved and does not represent a major proliferation concern at any time since the enrichment is always below the criterion for low-enriched uranium of 20 wt % 235U. For the AHTR reference core, the discharge burnup achieved with a once-through cycle is ~80 GWd/MT or ~8% FIMA and the uranium enrichment at discharge is ~13.1 wt % 235U. For a more moderated core (with CHM=337) starting also with 19.75 wt % 235U, the discharge burnup of the once-through cycle is ~130 GWd/MT or ~13% FIMA and the uranium enrichment at discharge is ~8.9 wt % 235U.
The amount of plutonium buildup in the AHTR reference core at EOC is 916 kg, comparable with the quantity produced in an LWR,21 with the plutonium vector as shown in Table 10. For an AHTR design with a softer spectrum (CHM = 337 line in Table 10), the plutonium isotopic composition improves from a nonproliferation standpoint and the total amount of plutonium at discharge decreases to 451 kg. For the AHTR reference the plutonium isotopic composition contains more than 7% 240Pu after about 5–6 months

32
of full power operation. At this time, the total amount of plutonium in the core is about 250 kg of which just over 90% is 239Pu. For the CHM = 337 case, the 7% 240Pu threshold is passed after about 3 months of full power operation, at which time the amount of plutonium in the core is only 90 kg—well below the plutonium amounts typical for LWRs. Reporting the plutonium production per unit electric power produced tilts the plutonium production and isotopic compositing further in the AHTR’s favor. The softer spectrum AHTR compares favorably with the current LWR from the plutonium vector standpoint as the comparison in Table 10 suggests.
Table 10. Plutonium vector comparison
238Pu 239Pu 240Pu 241Pu 242Pu AHTR, reference 1.1% 69.2% 12.7% 15.0% 2.1% AHTR, CHM = 337 2.6% 50.0% 18.6% 21.0% 7.7% Takahama LWR 1.5% 58.2% 21.4% 14.2% 4.7%
As compared to the reference enrichment of 19.75%, a reactor concept with a softer spectrum, such as
the 9% two-batch core concept, improves the nonproliferation indicators.
4.9 USE OF BURNABLE POISON
To compensate for the large excess of reactivity of the initial bare core, burnable poison particles will be incorporated into the central matrix material of each fuel plate. Europium was selected as the burnable poison material as it burns out at nearly the same rate as the fuel, minimizing the requirement for additional control blades. Particle-based neutron poison was selected so that the poison would be retained in the fuel during fabrication and poisoning the primary coolant would result in a positive void coefficient. The high temperature impurity burnout phase of the coated particle compact manufacturing would tend to burn out bulk impurities in the carbon matrix material. In the present design, the poison kernels have a diameter of 500 μm. A uniform load of ~50 g of europium per fuel plate will lower the initial reactivity of the AHTR core below 10% Δk/k and maintain it below this limit for the life of the once-through cycle. (The calculations were performed for a core with a design slightly different from the reference design. We expect that this load will remain close for the reference core.) The remainder of the excess reactivity is controlled over the fuel cycle using control rods. The impact of burnable poison on the fuel temperature reactivity coefficient remains to be studied.
4.10 SECONDARY SHUTDOWN METHODOLOGY
There are several possible techniques of providing diverse means of inserting an adequate amount of negative reactivity into the core to shut down the critical fission reaction. However, as deploying the secondary shutdown mechanism implies that the primary control rod insertion shutdown mechanism has failed, a technique that does not involve insertion of a mechanical component into the core provides greater diversity.
The secondary shutdown mechanism selected for the AHTR is the injection of a rare earth fluoride neutron poison (EuF3 and/or GdF3) into the primary coolant. The poison salt injection mechanism design is currently immature. Both EuF3 and GdF3 have melting points well above the operating temperature of an FHR. However, their Gibbs energy lies between that of LiF and BeF2, indicating that the poison salts will mix with the primary coolant fluorides and not plate out onto the container surfaces. Further, both EuF3 and GdF3 have low temperature (<700°C) eutectics with LiF, indicating that both will dissolve readily into the primary salt.
One possible mechanism for injecting rare earth poison fluoride into the primary coolant would be to position a cartridge of poison salt within the primary coolant. A nitrogen accumulator would be
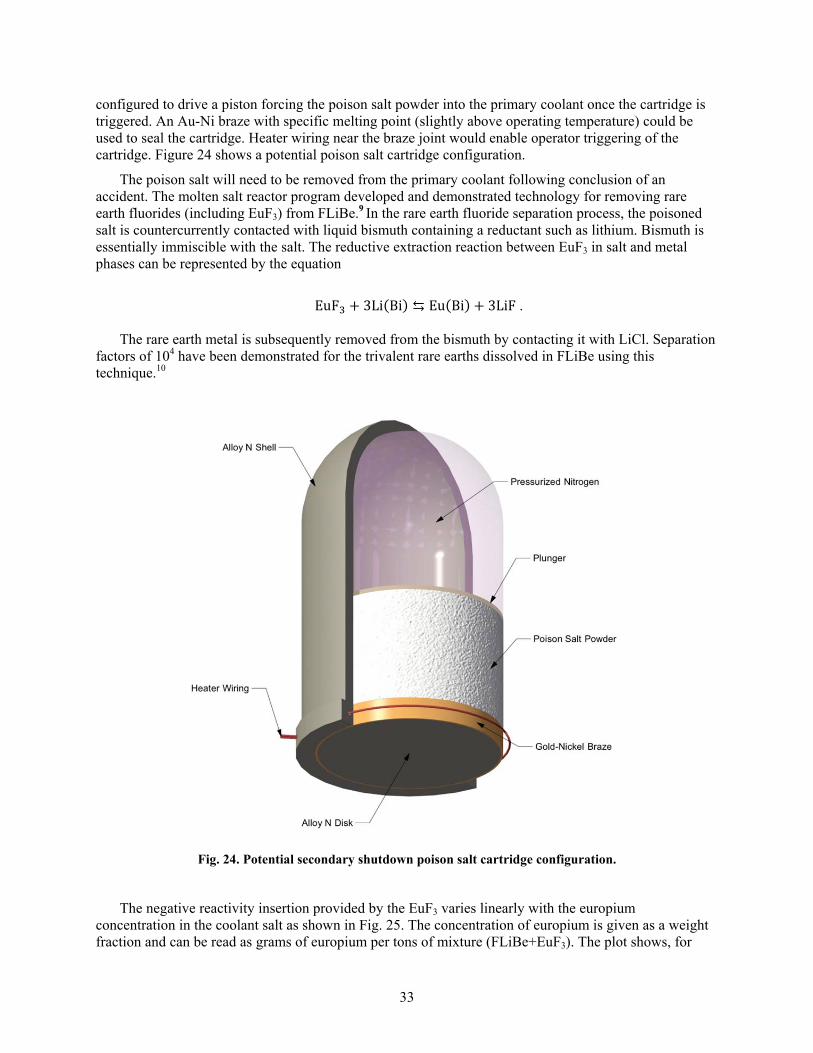
33
configured to drive a piston forcing the poison salt powder into the primary coolant once the cartridge is triggered. An Au-Ni braze with specific melting point (slightly above operating temperature) could be used to seal the cartridge. Heater wiring near the braze joint would enable operator triggering of the cartridge. Figure 24 shows a potential poison salt cartridge configuration.
The poison salt will need to be removed from the primary coolant following conclusion of an accident. The molten salt reactor program developed and demonstrated technology for removing rare earth fluorides (including EuF3) from FLiBe.9 In the rare earth fluoride separation process, the poisoned salt is countercurrently contacted with liquid bismuth containing a reductant such as lithium. Bismuth is essentially immiscible with the salt. The reductive extraction reaction between EuF3 in salt and metal phases can be represented by the equation
EuF 3Li Bi ⇆ Eu Bi 3LiF .
The rare earth metal is subsequently removed from the bismuth by contacting it with LiCl. Separation
factors of 104 have been demonstrated for the trivalent rare earths dissolved in FLiBe using this technique.10
Fig. 24. Potential secondary shutdown poison salt cartridge configuration.
The negative reactivity insertion provided by the EuF3 varies linearly with the europium
concentration in the coolant salt as shown in Fig. 25. The concentration of europium is given as a weight fraction and can be read as grams of europium per tons of mixture (FLiBe+EuF3). The plot shows, for

34
example, that half a kilogram of europium in EuF3 compound per ton of FLiBe provides a negative reactivity insertion similar to that provided by the insertion of all the control rods (~ –11% Δk/k). The computed points can be fitted with a quadratic function over the Europium concentration interval [0, 1000] ppm:
%∆ ⁄ 3.70 2.95 10 2.30 0.02 10 2.10 0.17 10 ,
where Eu is the europium concentration in parts per million.
The calculations assumed uniform dispersion of EuF3 in the FLiBe salt. With the roughly 2310 tons of FLiBe in the primary circuit, ~1150 kg of EuF3 would need to be added to the primary coolant by the poison salt injectors to roughly equal the reactivity worth of complete control blade insertion.
0 100 200 300 400 500 600 700 800 900 1000-22
-20
-18
-16
-14
-12
-10
-8
-6
-4
-2
0
(%
k/
k)
Eu concentration (wt ppm)
Fig. 25. Reactivity insertion as a function of Eu concentration.

35
THERMAL-HYDRAULIC EVALUATIONS 5.
5.1 REFERENCE PARAMETERS
The thermal-hydraulic model developed in Appendix A of this report was applied in designing the AHTR core to maintain the reactor within acceptable thermal limits. The reference parameters used in the thermal-hydraulic model are listed in Table 11. The AHTR is designed with a coolant inlet temperature of 650°C and a mixed mean core outlet temperature of 700°C. The radial power peaking factor is calculated for a cylindrical bare reactor, while the axial power is assumed to have a cosine distribution. In the real AHTR, the actual fuel temperature peaking factor is expected to be significantly smaller than the radial power peaking factor provided in Table 11. The viscosity of the primary coolant decreases with increased temperature, resulting in increased coolant flow to the hottest channels. The fuel in the hottest channel will burn out faster than the fuel in the cooler channels, thus flattening the power distribution over time. Also, to apply the simple thermal-hydraulic model to a particular fuel assembly configuration, the simplifying assumption that 95% of power is carried by the flow inside the fuel assembly (“intra-flow”) was made. The rest is assumed to be removed through the interassembly flow (coolant flow outside the channel box) or through other mechanisms (conduction, radiation).
Table 11. Parameters used in the thermal-hydraulic model
Parameter Value Units Fuel thermal conductivity 0.15 W/(cm·K) Graphite sleeve thermal conductivity 0.2 W/(cm·K) Coolant thermal conductivity 0.011 W/(cm·K) Coolant density (at 675°C) 1.95 g/cm3 Average fuel assembly density 1.89 g/cm3 Coolant dynamic viscosity 6.09 mPa·s Coolant specific heat 2.39 J/(g·K) Coolant inlet temperature 650 °C Coolant temperature increase across the core 50 K Fraction of power carried by intra-flow 95 % Radial power peaking factor (bare reactor) 2.3 –
The set of parameters listed in Table 12 were varied as the core geometry design parameters were varied. The main goal was to maintain as low a fuel temperature as possible. This was achieved by using the particular distribution of the fuel in the fuel plates, as described in the reference core description section and by adjusting the width of the coolant gap between the plates. The velocity of the coolant between the plates (the requirement was to maintain it below 3 m/s) was also monitored to assure turbulent flow (Reynolds number greater than 5000) and, thereby, adequate heat transfer. The coolant pressure drop across the core was also limited to less than 1.5 atm in order to minimize the upward force on the fuel assemblies. The power needed by the coolant pump to overcome the core pressure drop was also estimated.
For use in the following sections, the average fuel assembly is defined as the fuel assembly in which the average thermal power is generated, i.e., the thermal power 3,400/N MW(t), where N is the number of assemblies in the core (253 for the baseline core).
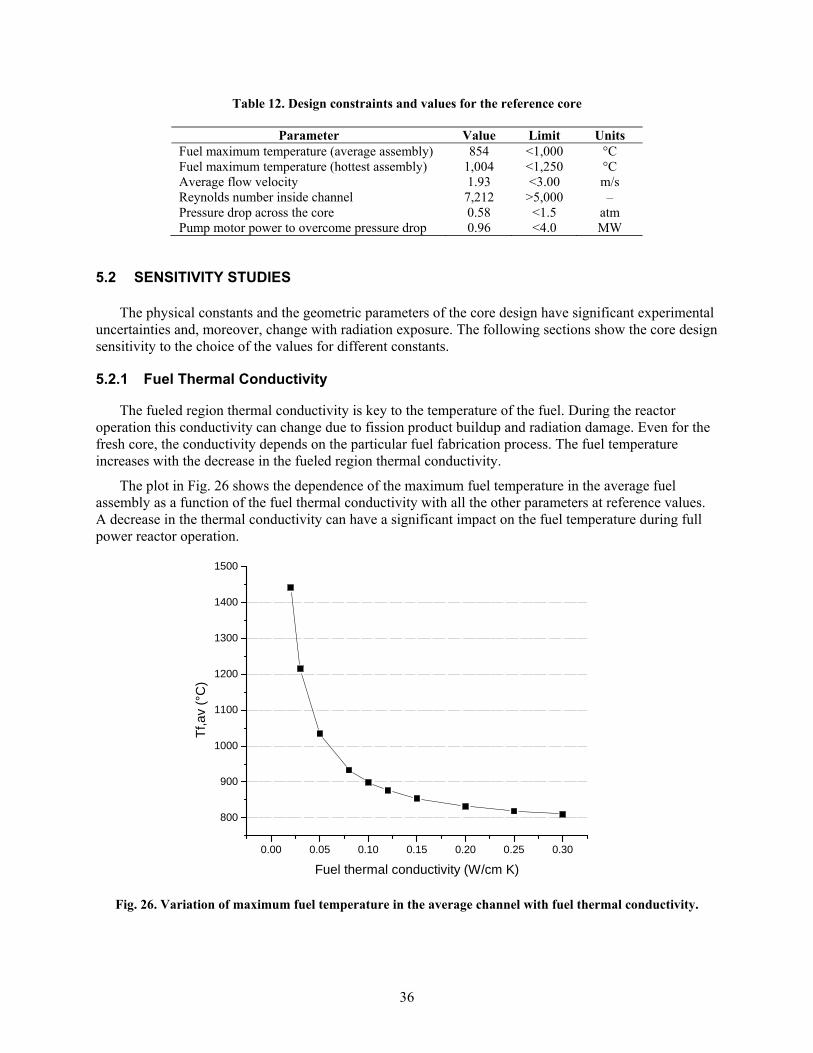
36
Table 12. Design constraints and values for the reference core
Parameter Value Limit Units Fuel maximum temperature (average assembly) 854 <1,000 °C Fuel maximum temperature (hottest assembly) 1,004 <1,250 °C Average flow velocity 1.93 <3.00 m/s Reynolds number inside channel 7,212 >5,000 – Pressure drop across the core 0.58 <1.5 atm Pump motor power to overcome pressure drop 0.96 <4.0 MW
5.2 SENSITIVITY STUDIES
The physical constants and the geometric parameters of the core design have significant experimental uncertainties and, moreover, change with radiation exposure. The following sections show the core design sensitivity to the choice of the values for different constants.
5.2.1 Fuel Thermal Conductivity
The fueled region thermal conductivity is key to the temperature of the fuel. During the reactor operation this conductivity can change due to fission product buildup and radiation damage. Even for the fresh core, the conductivity depends on the particular fuel fabrication process. The fuel temperature increases with the decrease in the fueled region thermal conductivity.
The plot in Fig. 26 shows the dependence of the maximum fuel temperature in the average fuel assembly as a function of the fuel thermal conductivity with all the other parameters at reference values. A decrease in the thermal conductivity can have a significant impact on the fuel temperature during full power reactor operation.
0.00 0.05 0.10 0.15 0.20 0.25 0.30
800
900
1000
1100
1200
1300
1400
1500
Tf,a
v (°
C)
Fuel thermal conductivity (W/cm K)
Fig. 26. Variation of maximum fuel temperature in the average channel with fuel thermal conductivity.
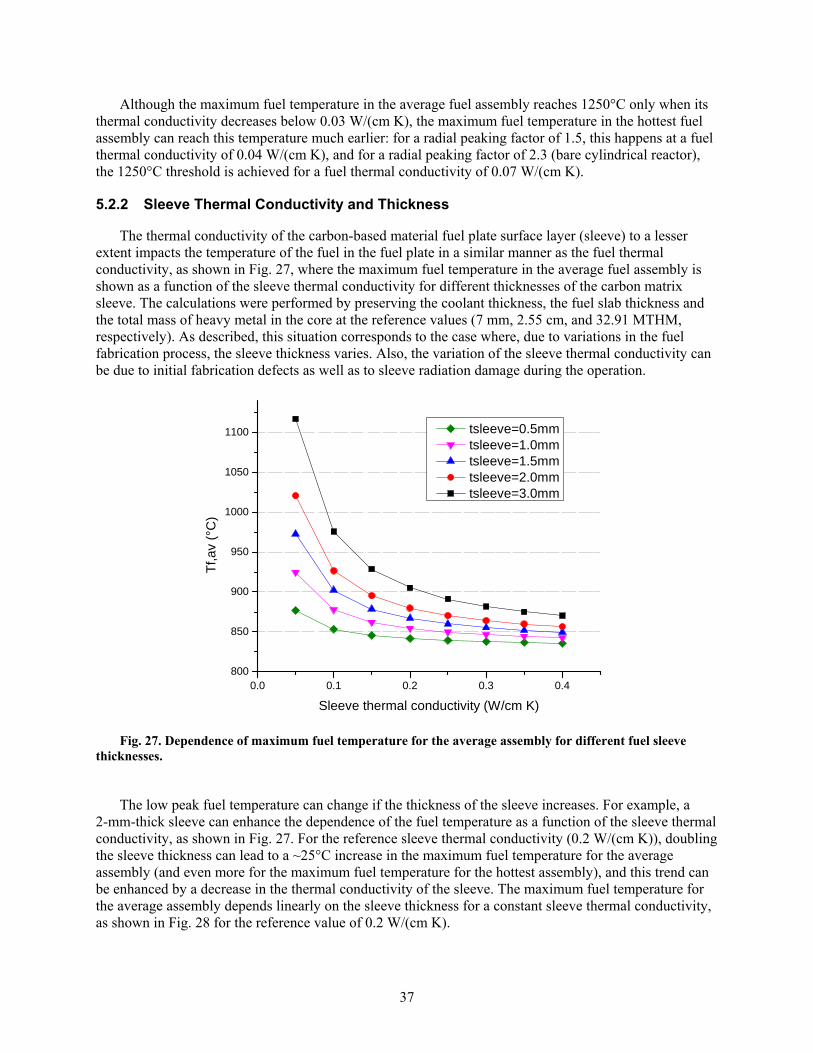
37
Although the maximum fuel temperature in the average fuel assembly reaches 1250°C only when its thermal conductivity decreases below 0.03 W/(cm K), the maximum fuel temperature in the hottest fuel assembly can reach this temperature much earlier: for a radial peaking factor of 1.5, this happens at a fuel thermal conductivity of 0.04 W/(cm K), and for a radial peaking factor of 2.3 (bare cylindrical reactor), the 1250°C threshold is achieved for a fuel thermal conductivity of 0.07 W/(cm K).
5.2.2 Sleeve Thermal Conductivity and Thickness
The thermal conductivity of the carbon-based material fuel plate surface layer (sleeve) to a lesser extent impacts the temperature of the fuel in the fuel plate in a similar manner as the fuel thermal conductivity, as shown in Fig. 27, where the maximum fuel temperature in the average fuel assembly is shown as a function of the sleeve thermal conductivity for different thicknesses of the carbon matrix sleeve. The calculations were performed by preserving the coolant thickness, the fuel slab thickness and the total mass of heavy metal in the core at the reference values (7 mm, 2.55 cm, and 32.91 MTHM, respectively). As described, this situation corresponds to the case where, due to variations in the fuel fabrication process, the sleeve thickness varies. Also, the variation of the sleeve thermal conductivity can be due to initial fabrication defects as well as to sleeve radiation damage during the operation.
0.0 0.1 0.2 0.3 0.4800
850
900
950
1000
1050
1100
Tf,a
v (°
C)
Sleeve thermal conductivity (W/cm K)
tsleeve=0.5mm tsleeve=1.0mm tsleeve=1.5mm tsleeve=2.0mm tsleeve=3.0mm
Fig. 27. Dependence of maximum fuel temperature for the average assembly for different fuel sleeve thicknesses.
The low peak fuel temperature can change if the thickness of the sleeve increases. For example, a
2-mm-thick sleeve can enhance the dependence of the fuel temperature as a function of the sleeve thermal conductivity, as shown in Fig. 27. For the reference sleeve thermal conductivity (0.2 W/(cm K)), doubling the sleeve thickness can lead to a ~25°C increase in the maximum fuel temperature for the average assembly (and even more for the maximum fuel temperature for the hottest assembly), and this trend can be enhanced by a decrease in the thermal conductivity of the sleeve. The maximum fuel temperature for the average assembly depends linearly on the sleeve thickness for a constant sleeve thermal conductivity, as shown in Fig. 28 for the reference value of 0.2 W/(cm K).

38
0 1 2 3
840
860
880
900
920
Tf,a
v (°
C)
Sleeve Thickness (mm)
Fig. 28. Dependence of maximum fuel temperature for the average assembly on sleeve thickness for the reference sleeve thermal conductivity.
5.2.3 Fuel Thickness
Designs that depart from the baseline AHTR specifications were investigated. The fuel plate thickness of 2.55 cm, the sleeve thickness of 1 mm, and the coolant gap thickness of 7 mm were all preserved in the analysis. These designs basically correspond to different CHM ratios. The analysis shows the behavior of different thermal-hydraulic parameters with these changes in the AHTR design.
The maximum temperature in fuel depends linearly on the thickness of the fuel stripes, or, alternatively, on the thickness of the carbon-based matrix material that comprises the center of the fuel plates, as shown in Fig. 29. The plots in Fig. 29 assume a coolant gap of 7 mm between the fuel plates and a sleeve thickness of 1 mm. Therefore, the mass of fuel in the reactor varies also with the thickness of the matrix material. The Tf,av curve is the maximum fuel temperature in the average fuel assembly, while the two Tf,max curves represent the maximum fuel temperature in the fuel assembly where the power peaks for two radial peaking factors (RPFs): one corresponding to a bare cylindrical reactor (RPF = 2.3) and one corresponding to a more realistic peaking factor (RPF = 1.5), typical of the LWR.
A matrix material thickness of zero corresponds to a fully loaded fuel plate (one unique lump of fuel), while a matrix material thickness of 12 mm corresponds to the reference model. Using the striped reference fuel instead of a fully loaded fuel plate decreases the maximum fuel temperature in the average fuel assembly by 100°C for the same thermal power. The lower fuel temperature is also anticipated to carry over to loss-of-forced-flow accidents.
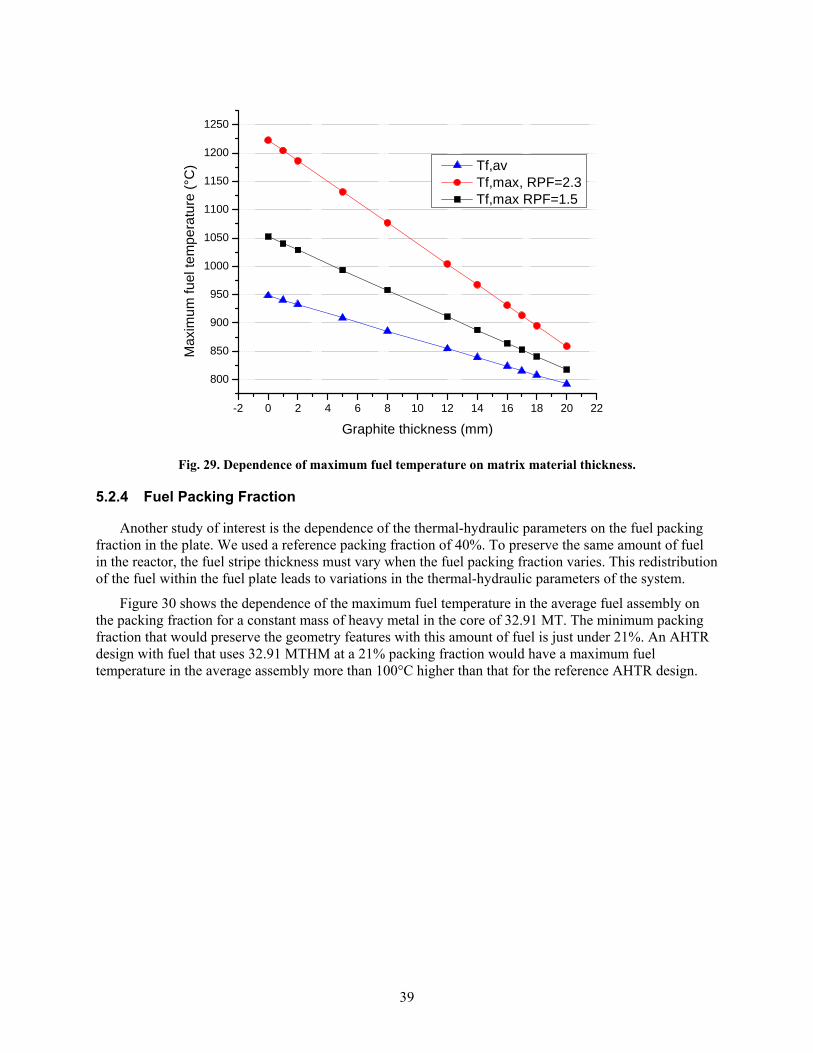
39
-2 0 2 4 6 8 10 12 14 16 18 20 22
800
850
900
950
1000
1050
1100
1150
1200
1250
Max
imu
m fu
el te
mpe
ratu
re (
°C)
Graphite thickness (mm)
Tf,av Tf,max, RPF=2.3 Tf,max RPF=1.5
Fig. 29. Dependence of maximum fuel temperature on matrix material thickness.
5.2.4 Fuel Packing Fraction
Another study of interest is the dependence of the thermal-hydraulic parameters on the fuel packing fraction in the plate. We used a reference packing fraction of 40%. To preserve the same amount of fuel in the reactor, the fuel stripe thickness must vary when the fuel packing fraction varies. This redistribution of the fuel within the fuel plate leads to variations in the thermal-hydraulic parameters of the system.
Figure 30 shows the dependence of the maximum fuel temperature in the average fuel assembly on the packing fraction for a constant mass of heavy metal in the core of 32.91 MT. The minimum packing fraction that would preserve the geometry features with this amount of fuel is just under 21%. An AHTR design with fuel that uses 32.91 MTHM at a 21% packing fraction would have a maximum fuel temperature in the average assembly more than 100°C higher than that for the reference AHTR design.
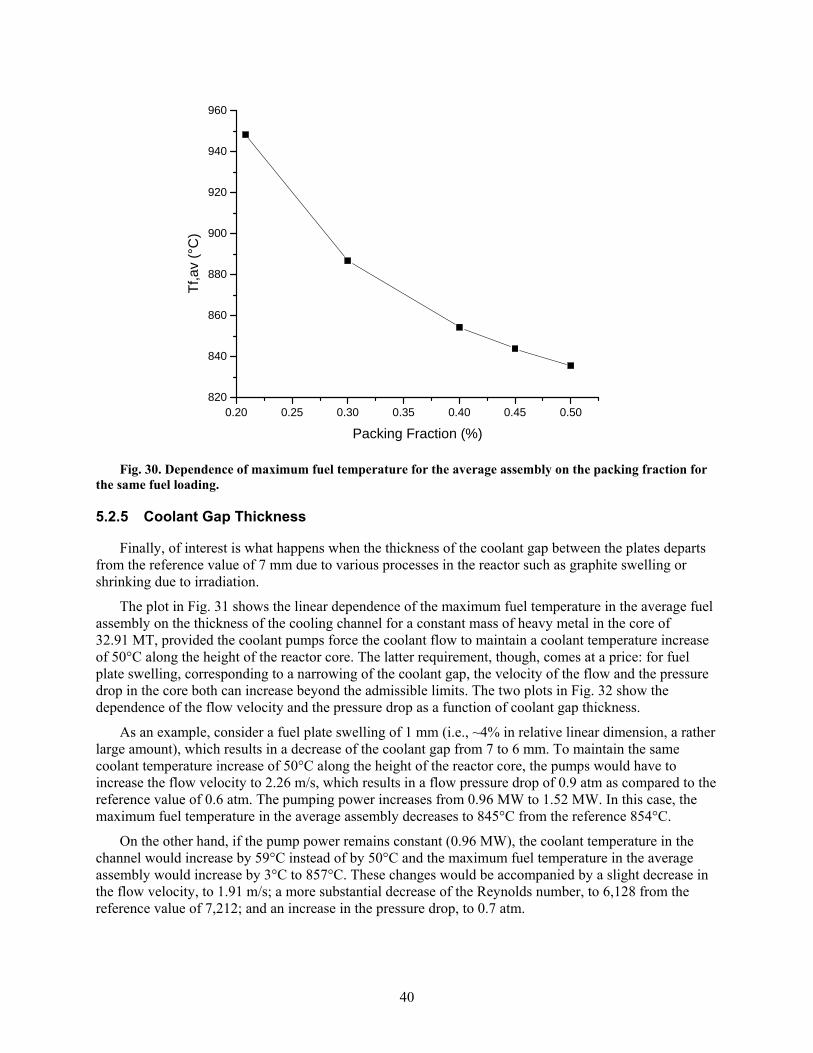
40
0.20 0.25 0.30 0.35 0.40 0.45 0.50820
840
860
880
900
920
940
960
Tf,a
v (°
C)
Packing Fraction (%)
Fig. 30. Dependence of maximum fuel temperature for the average assembly on the packing fraction for the same fuel loading.
5.2.5 Coolant Gap Thickness
Finally, of interest is what happens when the thickness of the coolant gap between the plates departs from the reference value of 7 mm due to various processes in the reactor such as graphite swelling or shrinking due to irradiation.
The plot in Fig. 31 shows the linear dependence of the maximum fuel temperature in the average fuel assembly on the thickness of the cooling channel for a constant mass of heavy metal in the core of 32.91 MT, provided the coolant pumps force the coolant flow to maintain a coolant temperature increase of 50°C along the height of the reactor core. The latter requirement, though, comes at a price: for fuel plate swelling, corresponding to a narrowing of the coolant gap, the velocity of the flow and the pressure drop in the core both can increase beyond the admissible limits. The two plots in Fig. 32 show the dependence of the flow velocity and the pressure drop as a function of coolant gap thickness.
As an example, consider a fuel plate swelling of 1 mm (i.e., ~4% in relative linear dimension, a rather large amount), which results in a decrease of the coolant gap from 7 to 6 mm. To maintain the same coolant temperature increase of 50°C along the height of the reactor core, the pumps would have to increase the flow velocity to 2.26 m/s, which results in a flow pressure drop of 0.9 atm as compared to the reference value of 0.6 atm. The pumping power increases from 0.96 MW to 1.52 MW. In this case, the maximum fuel temperature in the average assembly decreases to 845°C from the reference 854°C.
On the other hand, if the pump power remains constant (0.96 MW), the coolant temperature in the channel would increase by 59°C instead of by 50°C and the maximum fuel temperature in the average assembly would increase by 3°C to 857°C. These changes would be accompanied by a slight decrease in the flow velocity, to 1.91 m/s; a more substantial decrease of the Reynolds number, to 6,128 from the reference value of 7,212; and an increase in the pressure drop, to 0.7 atm.

41
0 1 2 3 4 5 6 7 8 9 10 11
790
800
810
820
830
840
850
860
870
880
890
Tf,a
v (°
C)
Coolant gap thickness (mm)
Fig. 31. Dependence of maximum fuel temperature on coolant gap size.
0
200
400
600
800
1000
1200
1400
0 1 2 3 4 5 6 7 8 9 10
02468
10121416
Flo
w v
eloc
ity (
cm/s
)P
ress
ure
dro
p (a
tm)
Coolant gap thickness (mm)
Fig. 32. Dependence of flow velocity and pressure drop on coolant gap size.


43
REFUELING 6.
6.1 CONCEPTUAL OVERVIEW
Designing a refueling scheme has several competing requirements. Plant availability is maximized by decreasing both refueling outage durations and frequency. Fuel cost is minimized by decreasing the number of fuel assemblies used, decreasing the fuel uranium enrichment, and increasing the uranium discharge burnup. The number of fuel assemblies required depends on both the fuel loading within the assembly and its enrichment. Also, the value of electricity can vary significantly both during individual days and seasonally, so outage scheduling is financially important. Significant additional fuel costs may also accrue if uranium requires enrichment beyond what can be supplied using current enrichment facilities. Accurate cost models for coated particle fuel manufacturing and used coated particle fuel storage/recycling do not currently exist. Therefore a good deal of uncertainty remains with current fuel-related cost estimates.
The dominant refueling consideration for the current design effort was to maximize the AHTR availability. A 19.75 wt % enriched uranium core with a single-batch, 2-year refueling interval was selected as a baseline case to compare with multibatch refueling schemes. A core design was then sought with less than 10 wt % enriched fuel and at least a 6 month refueling interval to match the seasonal demand minimums. A two-batch 9 wt % enriched refueling scheme was identified that meets the enrichment and refueling interval requirements. Additional design space exploration was performed to assess whether pseudo-online refueling (where a few fuel assemblies are replaced as rapidly as possible offline and the reactor brought back to power before the 135Xe negative reactivity transient inhibits criticality) with even lower enrichment fuel would be possible for the AHTR. Design considerations for each of the refueling options—single-batch, multibatch, and pseudo-online—are presented in this section.
Multibatch fuel cycles enable the excess reactivity of the lower-irradiated fuel to offset a reactivity deficit of the more highly irradiated fuel. This increased neutron economy can be utilized to either increase discharge burnup, reduce the uranium enrichment requirements, or a combination of both. Additionally, the reactivity swing over the equilibrium cycle will be decreased, reducing the negative reactivity worth requirements of the AHTR’s control systems. The linear reactivity model predicts that the limit of discharge burnup in a multibatch fuel cycle can reach twice that of a single-batch fuel cycle; even a modest increase in discharge burnup reduces the fuel cycle costs of natural uranium, enrichment, and fuel fabrication per unit energy produced. Reducing the enrichment requirements from 19.75 wt % to between 5 and 10 wt % 235U would likely enable fuel producers to use existing uranium enrichment facilities rather than build dedicated enrichment facilities to maintain criticality safety while producing the higher (but still below 20%) enriched uranium.
Optimizing the neutron spectrum in the AHTR can increase discharge burnup by 90% for single-batch fuel management schemes. For this study, many fuel designs were considered by analyzing systems with different CHMs as well as different enrichments. The CHM sets the neutron spectrum of the system, which influences the neutron economy and the conversion ratio within the AHTR. Specific CHMs were induced by reducing the packing fraction of the coated particles within the active fuel region but maintaining the same fuel design as well as the fuel assembly designs.
6.2 REFUELING MECHANICS
Two refueling scenarios are currently envisioned: (1) an offline refueling probably taking 2–3 days and (2) a pseudo online refueling taking only 2–3 hours. Initially an online refueling method was also

44
pursued; online refueling was subsequently abandoned because only limited advantages and considerable technical challenges were found with that approach.
The estimate for the refueling time derives from breaking the overall refueling task into a series of subtasks and estimating the time required for each unit task. The mechanical design of the refueling system remains at an early stage; hence, significant uncertainty remains with the time estimates for the subtasks.
6.2.1 Preliminary Steps before Refueling
To begin the refueling process, the core is first taken subcritical by inserting the control blades. This stops the generation of fission power, and the decay heat begins to decline as the result of radioactive decay. Next, coolant flow is reduced by slowing the primary coolant pumps. Since the force exerted by the upflow of the coolant salt on the fuel assemblies is relatively large (1.0 MT force in the current design), reducing the flow to a few percent of full flow greatly increases the handling ease.
Fuel assemblies rest on the bottom support plate and are held at the top by the upper support plate. Fuel assemblies are held down by three independent means: (1) weight of the assembly (including the control blade during refueling), (2) upper support plate, and (3) control rod guide tube. The density of the fuel assembly (~1.89 g/cm3) is slightly less than the density of salt, which is 1.95 g/cm3.
The heavy control blades will be left in the fuel assemblies during refueling to prevent the fuel assembly from floating upward in salt or from being carried away by the upward flow. The upper core support plate has hold-down brackets that secure the fuel assemblies as shown in Fig. 4. The upper support plate provides lateral positioning of the fuel assemblies while also providing support against force exerted by the flow. The control blade guide tube is an annular cylindrical rod that holds down the fuel bracket (as well as guides the control blade into the fuel assembly) as shown in Fig. 5. The control blade guide tube is an integral part of the control blade drive mechanism and is removed when the control blades are removed from the reactor vessel.
To begin the process of refueling, the following steps are involved.
1. Insert all the control blades into the fuel assemblies. Coast down the primary pumps to reduce the salt flow.
2. Detach the control blade leader rods from the control blades. 3. Remove the control blade leader rods and the control blade guide tubes from the reactor vessel. 4. Slide the control rod drive plate laterally to allow access to the top cover flange of the reactor. 5. Position the ARM robot so that it is over the downcomer area and does not hinder the raising of
the upper core support plate. 6. Raise the upper core support plate until it rests below the reactor cover flange§ (Fig. 33). 7. Select the region where the fuel assemblies are to be removed and insert the IVFHM.
Once the preliminary steps for refueling operation are completed, the process of refueling the reactor
can begin. The IVFHM removes individual fuel assemblies from the reactor and transfers them to the ARM. One of the two ARM robots that move around the two annular rings interfaces with the IVFHM. Once the ARM receives the fuel assembly, the ARM transfers the fuel assembly to the refueling station. The RSM robot at the refueling station receives new fuel, exchanges fuel so that fuel can be shuffled to a new position in the reactor, or transfers used fuel to the used fuel canal. Figure 34 shows the refueling station with new fuel loading area and used fuel transfer. The fuel assemblies remain ~2 m below the § The upper cover plate is attached to five drive rods. The upper core plate is raised during fuel transfer to provide unhindered access to the fuel assemblies. The upper core support plates position the fuel assemblies in place and also hold them down with a bracket (see Section 2).
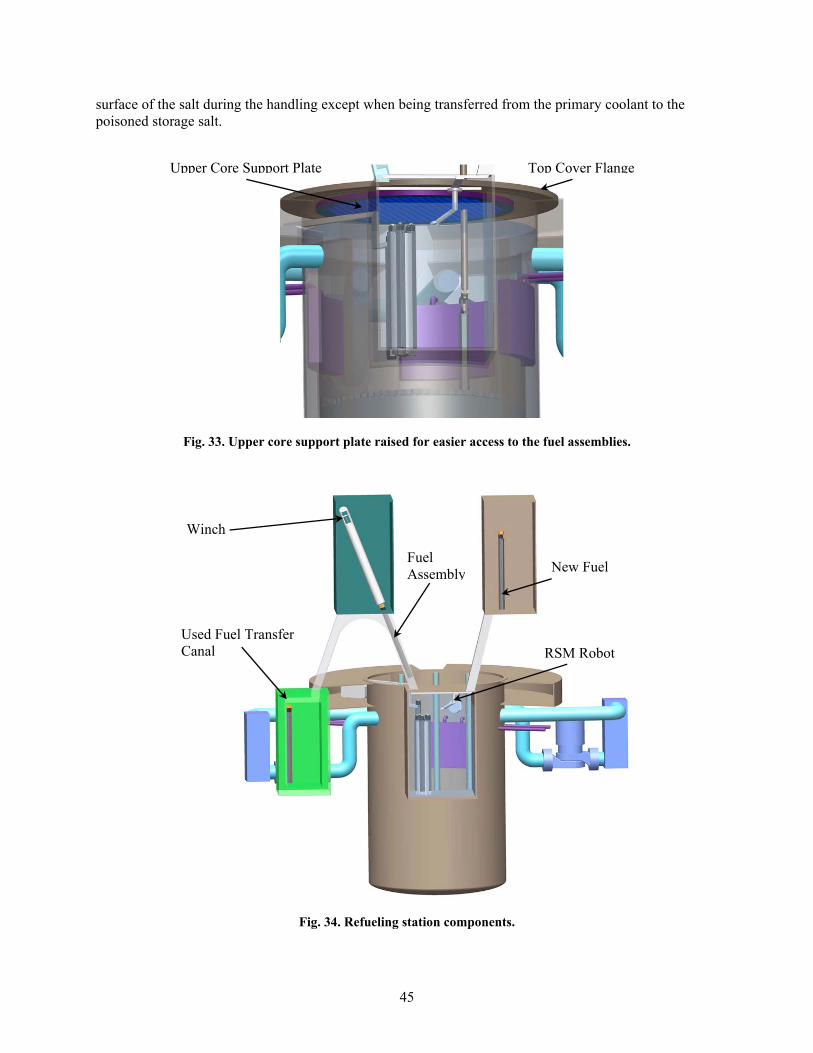
45
surface of the salt during the handling except when being transferred from the primary coolant to the poisoned storage salt.
Fig. 33. Upper core support plate raised for easier access to the fuel assemblies.
Fig. 34. Refueling station components.
Upper Core Support Plate Top Cover Flange
Used Fuel Transfer Canal
Winch
New Fuel Fuel Assembly
RSM Robot
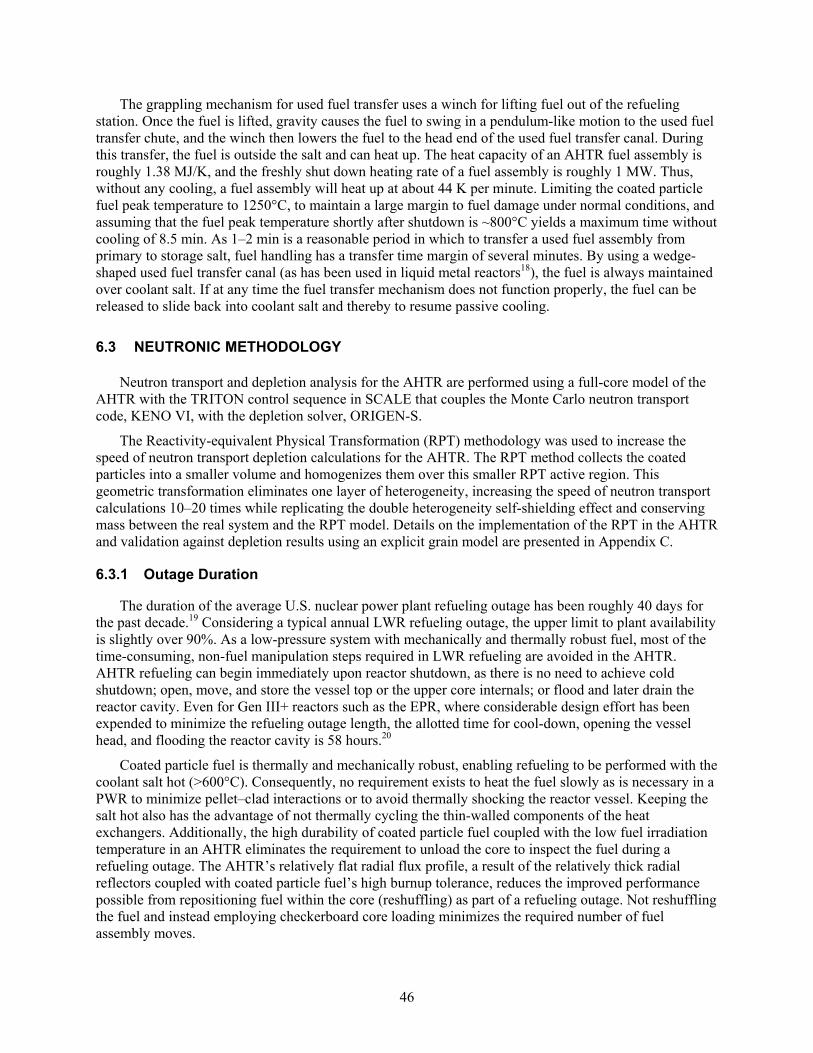
46
The grappling mechanism for used fuel transfer uses a winch for lifting fuel out of the refueling station. Once the fuel is lifted, gravity causes the fuel to swing in a pendulum-like motion to the used fuel transfer chute, and the winch then lowers the fuel to the head end of the used fuel transfer canal. During this transfer, the fuel is outside the salt and can heat up. The heat capacity of an AHTR fuel assembly is roughly 1.38 MJ/K, and the freshly shut down heating rate of a fuel assembly is roughly 1 MW. Thus, without any cooling, a fuel assembly will heat up at about 44 K per minute. Limiting the coated particle fuel peak temperature to 1250°C, to maintain a large margin to fuel damage under normal conditions, and assuming that the fuel peak temperature shortly after shutdown is ~800°C yields a maximum time without cooling of 8.5 min. As 1–2 min is a reasonable period in which to transfer a used fuel assembly from primary to storage salt, fuel handling has a transfer time margin of several minutes. By using a wedge-shaped used fuel transfer canal (as has been used in liquid metal reactors18), the fuel is always maintained over coolant salt. If at any time the fuel transfer mechanism does not function properly, the fuel can be released to slide back into coolant salt and thereby to resume passive cooling.
6.3 NEUTRONIC METHODOLOGY
Neutron transport and depletion analysis for the AHTR are performed using a full-core model of the AHTR with the TRITON control sequence in SCALE that couples the Monte Carlo neutron transport code, KENO VI, with the depletion solver, ORIGEN-S.
The Reactivity-equivalent Physical Transformation (RPT) methodology was used to increase the speed of neutron transport depletion calculations for the AHTR. The RPT method collects the coated particles into a smaller volume and homogenizes them over this smaller RPT active region. This geometric transformation eliminates one layer of heterogeneity, increasing the speed of neutron transport calculations 10–20 times while replicating the double heterogeneity self-shielding effect and conserving mass between the real system and the RPT model. Details on the implementation of the RPT in the AHTR and validation against depletion results using an explicit grain model are presented in Appendix C.
6.3.1 Outage Duration
The duration of the average U.S. nuclear power plant refueling outage has been roughly 40 days for the past decade.19 Considering a typical annual LWR refueling outage, the upper limit to plant availability is slightly over 90%. As a low-pressure system with mechanically and thermally robust fuel, most of the time-consuming, non-fuel manipulation steps required in LWR refueling are avoided in the AHTR. AHTR refueling can begin immediately upon reactor shutdown, as there is no need to achieve cold shutdown; open, move, and store the vessel top or the upper core internals; or flood and later drain the reactor cavity. Even for Gen III+ reactors such as the EPR, where considerable design effort has been expended to minimize the refueling outage length, the allotted time for cool-down, opening the vessel head, and flooding the reactor cavity is 58 hours.20
Coated particle fuel is thermally and mechanically robust, enabling refueling to be performed with the coolant salt hot (>600°C). Consequently, no requirement exists to heat the fuel slowly as is necessary in a PWR to minimize pellet–clad interactions or to avoid thermally shocking the reactor vessel. Keeping the salt hot also has the advantage of not thermally cycling the thin-walled components of the heat exchangers. Additionally, the high durability of coated particle fuel coupled with the low fuel irradiation temperature in an AHTR eliminates the requirement to unload the core to inspect the fuel during a refueling outage. The AHTR’s relatively flat radial flux profile, a result of the relatively thick radial reflectors coupled with coated particle fuel’s high burnup tolerance, reduces the improved performance possible from repositioning fuel within the core (reshuffling) as part of a refueling outage. Not reshuffling the fuel and instead employing checkerboard core loading minimizes the required number of fuel assembly moves.

47
The mechanical manipulations to add or remove a fuel assembly are similar between an LWR and the AHTR. Thus, similar amounts of time are anticipated to be required for fuel assembly manipulation. Current LWR practice is to move one fuel assembly roughly every 10 min. The AHTR has approximately 250 fuel assemblies requiring slightly less than two days for a full core unload or a half core unload and reload. Overall, refueling outage duration in the AHTR appears likely to be on the order of a few days.
Maintenance is required on any mechanical system as it wears, and some of this maintenance (e.g., valve and pump maintenance) can be performed only when the system is shut down. While maintenance can be scheduled during refueling outages, maintenance intervals are anticipated to be large (several years) relative to refueling frequency.
6.4 NEUTRONICS OF OFFLINE REFUELING
Offline refueling in the AHTR can be implemented using either single- or multibatch-style core reloading schemes. Core reshuffling could also take place during refueling outages for multibatch refueling schemes, although, as discussed above, it is not desirable. A primary motivation to implement a multibatch refueling scheme is to significantly increase the fuel discharge burnup. However, competing effects limit the advisable number of batches. Burnup increases as more batches are used in the fuel management scheme, but at the expense of availability because of reduced intervals between refueling outages and increased outage duration. This study will investigate the design space for multibatch refueling fuel management schemes in the AHTR, but with a special interest in fuel cycles with only a limited number of batches as such systems will likely be more lucrative.
There are two options for refueling the AHTR: reshuffling the entire core during each outage or simply replacing the highest burnup fuel. The advantages of reshuffling the entire core are that the core remains in a low-leakage configuration and that the power distribution is flattened. With reshuffling, however, every fuel assembly is moved, leading to longer refueling outages. The other option, to replace only the highest burn-up fuel assemblies with fresh ones, reduces the number of fuel assembly moves and thereby limits the duration of the refueling outage and increases the capacity factor of the AHTR. Sample fuel loading patterns for both of these fuel management schemes are presented in Fig. 35.
Fig. 35. Sample AHTR fuel loading patterns (one-sixth core) for two-batch fuel management schemes: (left) low-leakage loading pattern and (right) scatter loading pattern.
The modest neutronics and thermal-hydraulics benefits of fully reshuffling the core may be offset by the reduction in capacity factor. The AHTR has inherently low neutron leakage and has a relatively flat power distribution. Deploying control rods in local hot spots can also be used to flatten local power peaks. Therefore, it is anticipated that a scatter-style fuel loading pattern will be the preferred option for the AHTR.

48
6.4.1 Burnup
Implementing multibatch fuel management can significantly increase the discharge burnup of the fuel cycle. Figure 36 presents the increase in discharge burnup relative to the single-batch case as predicted by the linear reactivity model (LRM). For example, implementing a six-batch fuel cycle will increase the discharge burnup of the fuel cycle by 71%. The maximum discharge burnup predicted by the LRM is twice the single-batch discharge burnup.
0 1 2 3 4 5 6 7
0.8
1.0
1.2
1.4
1.6
1.8
2.0B
urnu
p
# batches
Fig. 36. Increase in discharge burnup resulting from implementing a multibatch fuel cycle as predicted by the linear reactivity model.
The maximum discharge burnup for a single-batch fuel cycle is estimated by performing depletion analysis and used as a reference point for fuel cycle optimization.
The maximum discharge burnup in these multibatch refueling systems with offline refueling fuel management schemes is estimated using the nonlinear reactivity model (NLRM) as described in Appendix D. The estimate used the nonlinear reactivity model with a third-order polynomial approximation of reactivity from single-batch depletion analysis using a full-core RPT model. Values for a CHM of 600, with 5 wt % fuel were interpolated. For the single-batch, two-batch, three-batch, and six-batch fuel management schemes, estimates of maximum discharge burnup are presented in Fig. 37.
Increasing the number of batches increases the attainable discharge burnup. The systems with higher conversion ratios, because of harder neutron spectra or lower enrichment, burn longer with respect to the maximum burnup in a single-batch fuel cycle because the fissile fuel bred at the beginning of the equilibrium cycle (BOEC) is consumed at the end of the equilibrium cycle (EOEC).
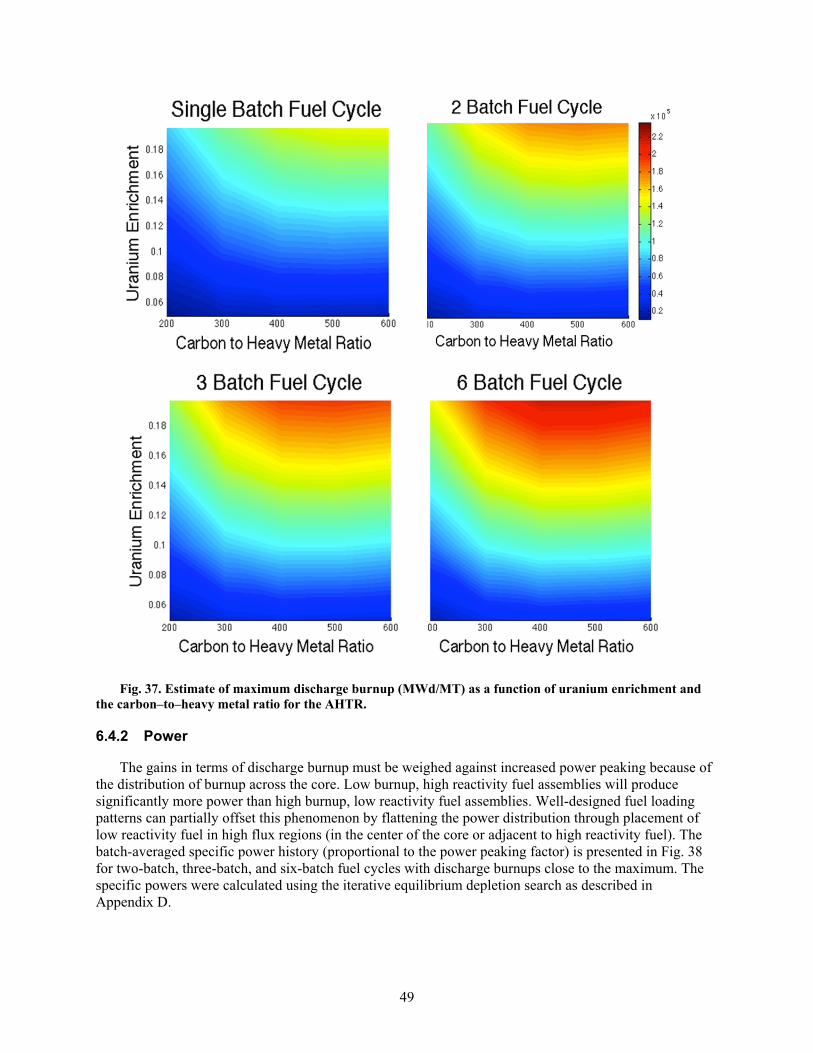
49
Fig. 37. Estimate of maximum discharge burnup (MWd/MT) as a function of uranium enrichment and the carbon–to–heavy metal ratio for the AHTR.
6.4.2 Power
The gains in terms of discharge burnup must be weighed against increased power peaking because of the distribution of burnup across the core. Low burnup, high reactivity fuel assemblies will produce significantly more power than high burnup, low reactivity fuel assemblies. Well-designed fuel loading patterns can partially offset this phenomenon by flattening the power distribution through placement of low reactivity fuel in high flux regions (in the center of the core or adjacent to high reactivity fuel). The batch-averaged specific power history (proportional to the power peaking factor) is presented in Fig. 38 for two-batch, three-batch, and six-batch fuel cycles with discharge burnups close to the maximum. The specific powers were calculated using the iterative equilibrium depletion search as described in Appendix D.
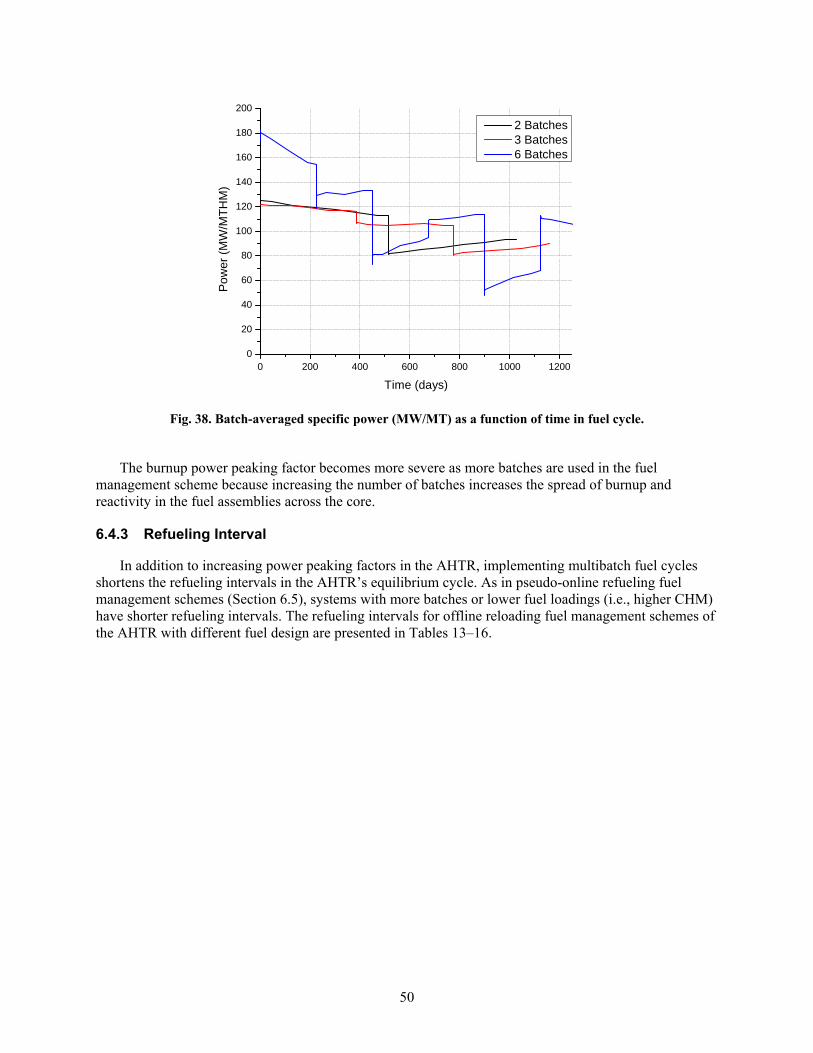
50
0 200 400 600 800 1000 12000
20
40
60
80
100
120
140
160
180
200
Po
wer
(M
W/M
TH
M)
Time (days)
2 Batches 3 Batches 6 Batches
Fig. 38. Batch-averaged specific power (MW/MT) as a function of time in fuel cycle.
The burnup power peaking factor becomes more severe as more batches are used in the fuel
management scheme because increasing the number of batches increases the spread of burnup and reactivity in the fuel assemblies across the core.
6.4.3 Refueling Interval
In addition to increasing power peaking factors in the AHTR, implementing multibatch fuel cycles shortens the refueling intervals in the AHTR’s equilibrium cycle. As in pseudo-online refueling fuel management schemes (Section 6.5), systems with more batches or lower fuel loadings (i.e., higher CHM) have shorter refueling intervals. The refueling intervals for offline reloading fuel management schemes of the AHTR with different fuel design are presented in Tables 13–16.

51
Table 13. Estimated refueling intervals in days for the AHTR with single-batch fuel cycle
Enrichment CHM: 200 CHM: 300 CHM: 400 CHM: 500 CHM: 600
19.75 wt % 824 767 676 576 483
15 wt % 589 577 508 426 353
10 wt % 347 357 315 259 211
5 wt % 111 125 106 82 58
Table 14. Estimated refueling intervals in days for the AHTR with two-batch fuel cycle
Enrichment CHM: 200 CHM: 300 CHM: 400 CHM: 500 CHM: 600
19.75 wt % 555 509 431 354 290
15 wt % 402 383 327 267 217
10 wt % 236 241 207 167 134
5 wt % 76 84 71 54 37
Table 15. Estimated refueling intervals in days for the AHTR with three-batch fuel cycle
Enrichment CHM: 200 CHM: 300 CHM: 400 CHM: 500 CHM: 600
19.75 wt % 419 379 318 258 210
15 wt % 303 287 241 196 158
10 wt % 179 182 154 124 98
5 wt % 57 63 53 40 27
Table 16. Estimated refueling intervals in days for the AHTR with six-batch fuel cycle
Enrichment CHM: 200 CHM: 300 CHM: 400 CHM: 500 CHM: 600
19.75 wt % 241 216 178 143 115
15 wt % 175 164 136 109 87
10 wt % 104 104 87 69 55
5 wt % 33 36 30 23 15
52
To illustrate the relationship between the refueling interval of the fuel cycle and the discharge burnup, design points can be grouped by input parameter (uranium enrichment, number of batches, CHM, etc.) and can be plotted on coordinates of discharge burnup and refueling interval (Fig. 39).
Fig. 39. Refueling interval as a function of discharge burnup for all offline refueling design points grouped (from left to right) by CHM, number of batches, and uranium enrichment.
As expected, cases on the refueling interval–discharge burnup efficiency frontier all use 19.75 wt % enriched uranium fuel, and the number of batches increases the discharge burnup at the expense of refueling interval length. For a given combination of uranium enrichment and batches per fuel cycle, increasing the carbon–to–heavy metal ratio will increase the discharge burnup at the expense of refueling interval up to a CHM of 400. The length of the refueling interval decreases quickly for CHMs greater than 400, especially for fuel management schemes with many batches.
6.5 PSEUDO-ONLINE REFUELING
The philosophy of the pseudo-online refueling fuel cycle is to utilize the increased neutron economy of a multibatch fuel cycle to reduce the fissile loading and uranium enrichment requirements of the AHTR. The refueling interval of this fuel cycle should align with the electricity demand profile so that short refueling outages occur when electricity demand is low (i.e., on Sunday nights). To keep these refueling outages on the order of hours, only a limited number of fuel assemblies (between 12 and18) can be exchanged per refueling. Thus in pseudo-online refueling fuel management schemes, only the highest burnup fuel is replaced with fresh fuel, and all the other fuel assemblies are left in their previous positions.
6.5.1 Loading Patterns
The loading patterns in pseudo-online refueling fuel cycles are supposed to be isotropic—fuel assemblies with dissimilar burnups are placed next to each other. An isotropic loading pattern minimizes local hot spots throughout the core, enables neutrons from high reactivity BOEC fuel to drive low reactivity EOEC fuel, and responds gently to the fuel reloads that replace low reactivity EOEC fuel with high reactivity BOEC fuel. Sample loading patterns were generated using a simple script to stochastically populate an AHTR core and assess a figure of merit that aims to maximize neutrons streaming from BOEC fuel assemblies to EOEC fuel assemblies. Examples of loading patterns for fuel management schemes that reload 18, 14, and 12 fuel assemblies per refueling are presented in Fig. 40.
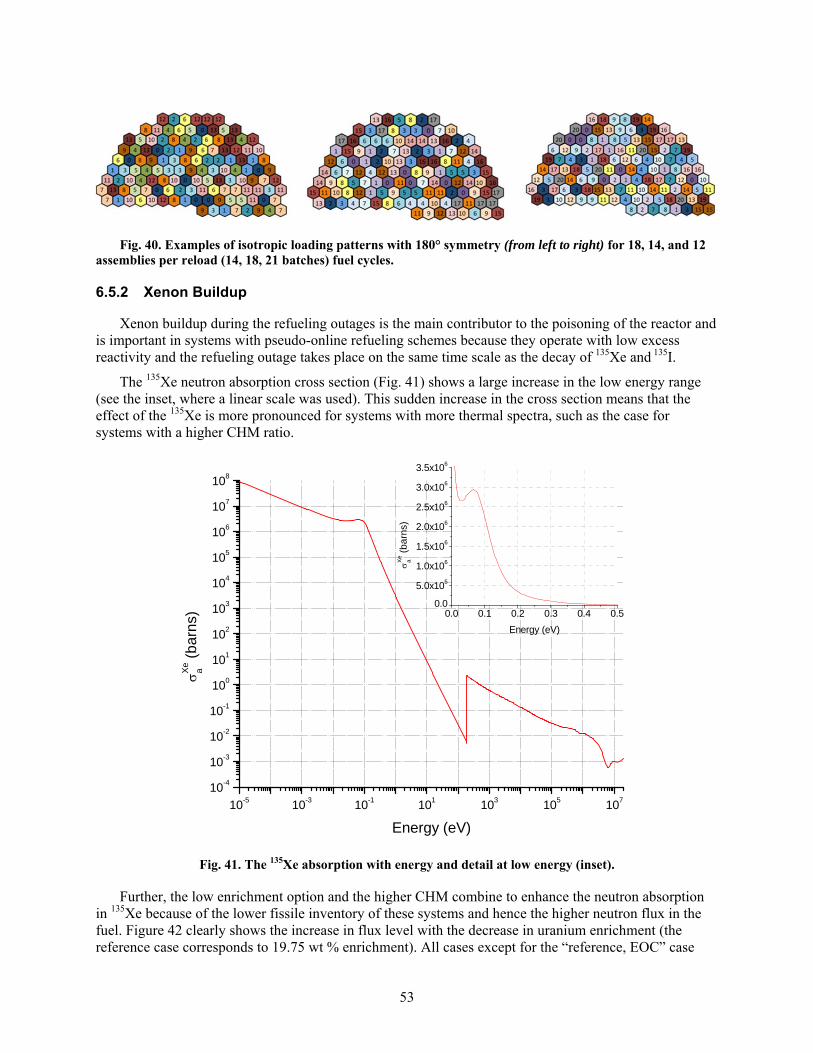
53
Fig. 40. Examples of isotropic loading patterns with 180° symmetry (from left to right) for 18, 14, and 12 assemblies per reload (14, 18, 21 batches) fuel cycles.
6.5.2 Xenon Buildup
Xenon buildup during the refueling outages is the main contributor to the poisoning of the reactor and is important in systems with pseudo-online refueling schemes because they operate with low excess reactivity and the refueling outage takes place on the same time scale as the decay of 135Xe and 135I.
The 135Xe neutron absorption cross section (Fig. 41) shows a large increase in the low energy range (see the inset, where a linear scale was used). This sudden increase in the cross section means that the effect of the 135Xe is more pronounced for systems with more thermal spectra, such as the case for systems with a higher CHM ratio.
10-5 10-3 10-1 101 103 105 107
10-4
10-3
10-2
10-1
100
101
102
103
104
105
106
107
108
Xe
a (
bar
ns)
Energy (eV)
0.0 0.1 0.2 0.3 0.4 0.50.0
5.0x10⁵
1.0x10⁶
1.5x10⁶
2.0x10⁶
2.5x10⁶
3.0x10⁶
3.5x10⁶
X
e
a (
ba
rns)
Energy (eV)
Fig. 41. The 135Xe absorption with energy and detail at low energy (inset).
Further, the low enrichment option and the higher CHM combine to enhance the neutron absorption in 135Xe because of the lower fissile inventory of these systems and hence the higher neutron flux in the fuel. Figure 42 clearly shows the increase in flux level with the decrease in uranium enrichment (the reference case corresponds to 19.75 wt % enrichment). All cases except for the “reference, EOC” case

54
correspond to fresh fuel and to the baseline case CHM ratio (~200). Figure 42 shows a shift in the maximum of the neutron spectrum towards lower energy values corresponding to a softening of the spectrum for lower enrichment, which in turn leads to an increase in the effective absorption cross section of 135Xe and, partially compensating for this, to a slight hardening of the spectrum with fuel burnup.
Fig. 42. 135Xe neutron absorption cross section and neutron spectra in fuel of different enrichments.
These effects, plus the increase in the equilibrium value for the ratio of the concentrations of 135I and
135Xe in fuel for higher CHM ratios, together lead to a higher negative reactivity insertion and longer transients in case of a reactor shutdown. Figure 43 shows the increase in negative reactivity insertion for several enrichment options for a CHM ratio of ~200. Use of higher CHM ratios will enhance these trends.

55
0 4 8 12 16 20 24-5000
-4000
-3000
-2000
-1000
0
1000
(p
cm)
Time after shutdown (hours)
5% 10% 15% 19.75%
Fig. 43. Negative reactivity insertion by fission products buildup after reactor shutdown.
In conclusion, refueling operations must be performed in times short enough to enable re-achieving criticality before the xenon buildup becomes too large. Depending on the reserve of reactivity of these systems (typically low), the refueling time must be on the order of a few hours (typically, less than 4).
6.5.3 Burnup
The maximum discharge burnup in these multibatch systems with pseudo-online refueling fuel management schemes is estimated using the nonlinear reactivity model (NLRM) as described in Appendix D. The estimates of maximum discharge burnup are presented in Fig. 44 for cases with 18, 14, and 12 assemblies replaced per reload (i.e., 14 batches, 18 batches, and 21 batches). The estimates used the NLRM with a third-order polynomial approximation of reactivity from single-batch depletion analysis using a full-core RPT model. Values for a CHM of 600, 5 wt % were interpolated.
Fig. 44. Estimate of maximum discharge burnup (MWd/MT) as a function of uranium enrichment and the carbon–to–heavy metal ratio for the AHTR.
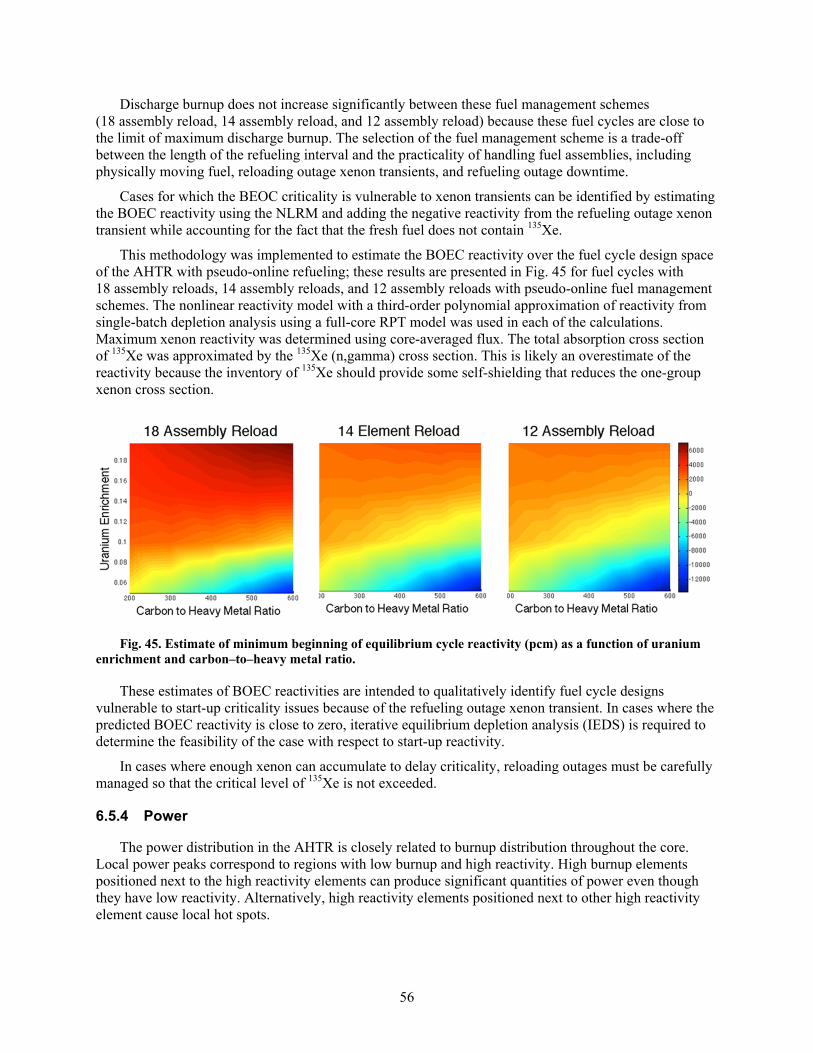
56
Discharge burnup does not increase significantly between these fuel management schemes (18 assembly reload, 14 assembly reload, and 12 assembly reload) because these fuel cycles are close to the limit of maximum discharge burnup. The selection of the fuel management scheme is a trade-off between the length of the refueling interval and the practicality of handling fuel assemblies, including physically moving fuel, reloading outage xenon transients, and refueling outage downtime.
Cases for which the BEOC criticality is vulnerable to xenon transients can be identified by estimating the BOEC reactivity using the NLRM and adding the negative reactivity from the refueling outage xenon transient while accounting for the fact that the fresh fuel does not contain 135Xe.
This methodology was implemented to estimate the BOEC reactivity over the fuel cycle design space of the AHTR with pseudo-online refueling; these results are presented in Fig. 45 for fuel cycles with 18 assembly reloads, 14 assembly reloads, and 12 assembly reloads with pseudo-online fuel management schemes. The nonlinear reactivity model with a third-order polynomial approximation of reactivity from single-batch depletion analysis using a full-core RPT model was used in each of the calculations. Maximum xenon reactivity was determined using core-averaged flux. The total absorption cross section of 135Xe was approximated by the 135Xe (n,gamma) cross section. This is likely an overestimate of the reactivity because the inventory of 135Xe should provide some self-shielding that reduces the one-group xenon cross section.
Fig. 45. Estimate of minimum beginning of equilibrium cycle reactivity (pcm) as a function of uranium enrichment and carbon–to–heavy metal ratio.
These estimates of BOEC reactivities are intended to qualitatively identify fuel cycle designs vulnerable to start-up criticality issues because of the refueling outage xenon transient. In cases where the predicted BOEC reactivity is close to zero, iterative equilibrium depletion analysis (IEDS) is required to determine the feasibility of the case with respect to start-up reactivity.
In cases where enough xenon can accumulate to delay criticality, reloading outages must be carefully managed so that the critical level of 135Xe is not exceeded.
6.5.4 Power
The power distribution in the AHTR is closely related to burnup distribution throughout the core. Local power peaks correspond to regions with low burnup and high reactivity. High burnup elements positioned next to the high reactivity elements can produce significant quantities of power even though they have low reactivity. Alternatively, high reactivity elements positioned next to other high reactivity element cause local hot spots.
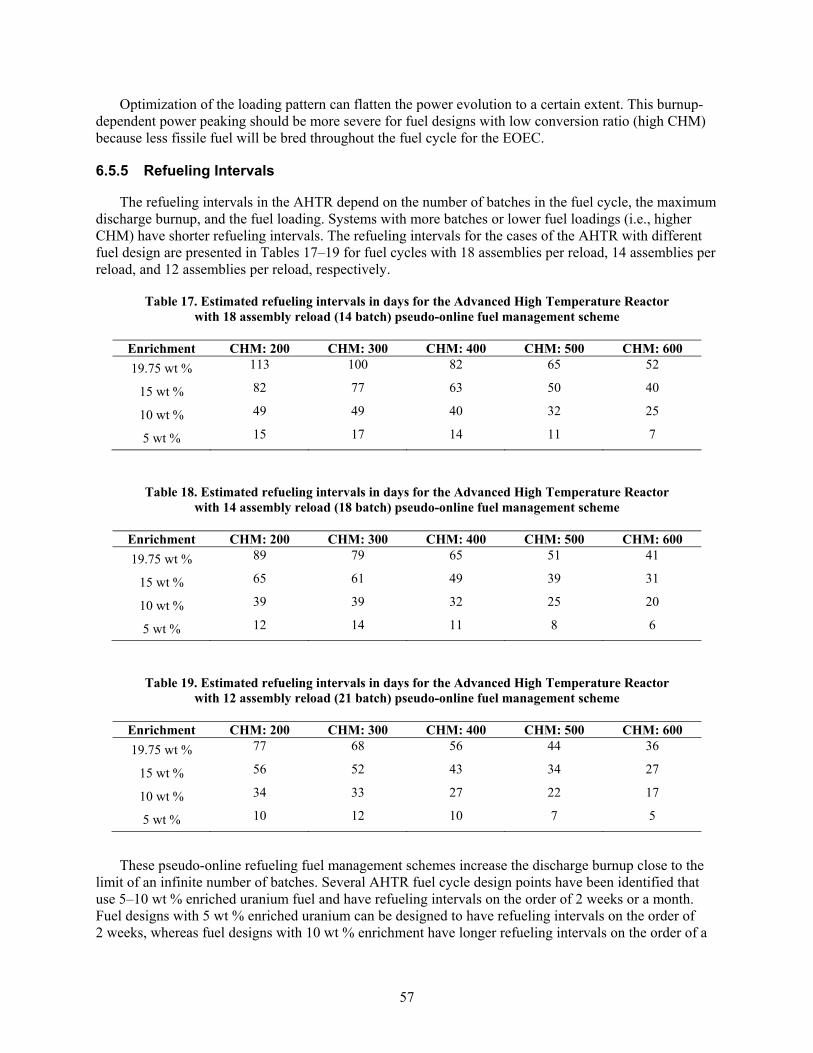
57
Optimization of the loading pattern can flatten the power evolution to a certain extent. This burnup-dependent power peaking should be more severe for fuel designs with low conversion ratio (high CHM) because less fissile fuel will be bred throughout the fuel cycle for the EOEC.
6.5.5 Refueling Intervals
The refueling intervals in the AHTR depend on the number of batches in the fuel cycle, the maximum discharge burnup, and the fuel loading. Systems with more batches or lower fuel loadings (i.e., higher CHM) have shorter refueling intervals. The refueling intervals for the cases of the AHTR with different fuel design are presented in Tables 17–19 for fuel cycles with 18 assemblies per reload, 14 assemblies per reload, and 12 assemblies per reload, respectively.
Table 17. Estimated refueling intervals in days for the Advanced High Temperature Reactor with 18 assembly reload (14 batch) pseudo-online fuel management scheme
Enrichment CHM: 200 CHM: 300 CHM: 400 CHM: 500 CHM: 600
19.75 wt % 113 100 82 65 52
15 wt % 82 77 63 50 40
10 wt % 49 49 40 32 25
5 wt % 15 17 14 11 7
Table 18. Estimated refueling intervals in days for the Advanced High Temperature Reactor with 14 assembly reload (18 batch) pseudo-online fuel management scheme
Enrichment CHM: 200 CHM: 300 CHM: 400 CHM: 500 CHM: 600
19.75 wt % 89 79 65 51 41
15 wt % 65 61 49 39 31
10 wt % 39 39 32 25 20
5 wt % 12 14 11 8 6
Table 19. Estimated refueling intervals in days for the Advanced High Temperature Reactor with 12 assembly reload (21 batch) pseudo-online fuel management scheme
Enrichment CHM: 200 CHM: 300 CHM: 400 CHM: 500 CHM: 600
19.75 wt % 77 68 56 44 36
15 wt % 56 52 43 34 27
10 wt % 34 33 27 22 17
5 wt % 10 12 10 7 5
These pseudo-online refueling fuel management schemes increase the discharge burnup close to the limit of an infinite number of batches. Several AHTR fuel cycle design points have been identified that use 5–10 wt % enriched uranium fuel and have refueling intervals on the order of 2 weeks or a month. Fuel designs with 5 wt % enriched uranium can be designed to have refueling intervals on the order of 2 weeks, whereas fuel designs with 10 wt % enrichment have longer refueling intervals on the order of a

58
month. Fuel cycle design points with 10 wt % enriched uranium fuel consume fuel more efficiently with respect to the initial enrichment. These attractive fuel design points should be analyzed in detail as candidates for the optimized fuel cycle design for offline refueling fuel management schemes.
59
KEY CORE AND FUEL TECHNOLOGY DEVELOPMENT 7.AND DEMONSTRATION ISSUES
7.1 ADVANCED CERAMIC COMPOSITES
The present AHTR core design is dependent upon C-C and SiC-SiC composites. Advanced ceramic fiber composites possess a unique combination of high strength at high temperatures along with useful radiation tolerance22 combined with good compatibility with fluoride salts. The C-C composites are intended for in-core use, and the SiC-SiC composites for use as in-vessel mechanical structures. Materials for use in the core need to withstand temperatures exceeding 700°C combined with high neutron fluxes and exposure to fluoride salt. The AHTR’s core outlet temperature exceeds the temperature limits of available nuclear-grade steels. Available nickel-based alloys would rapidly embrittle in core-level neutron fluxes, which are at or near their upper temperature limits. The structural elements of the reactor core require combined properties of high temperature tensile strength and toughness, which are not possible for graphite.
Neither of the ceramic fiber composites is yet qualified for use in nuclear reactor cores or in core support structures. Further, the envisioned advanced ceramic composite shapes (e.g., the channel box, support Y, and core support plates) are large and mechanically complex. While large, complex ceramic shapes have been manufactured in the past and the technology for ceramic composite manufacturing is advancing rapidly, the manufacturability of the proposed components will need to be demonstrated. It is envisioned that a significant amount of effort will be devoted over the next few years to understanding the irradiation performance characteristics and mechanical design limitations of both C-C and SiC-SiC composites.
7.2 LITHIUM ISOTOPE ENRICHMENT
FHRs require industrial quantities (hundreds of tons) of highly separated (~99.995%) 7Li. The United States does not currently have the industrial capability to separate large quantities of lithium isotopes. The mercury amalgam–based process used in the 1960s is not environmentally acceptable today. An alternate lithium isotope separation technology will need to be developed and industrialized.
7.3 BENCHMARK REACTIVITY MEASUREMENTS
While values of FLiBe reactivity worth as a function of temperature can be calculated using existing neutronic toolsets, the fluoride salt is a major core component and its reactivity worth (due to actual impurity levels) as a function of temperature has sufficient remaining uncertainty so as to impact the reactor design and licensing. Neutronic modeling tools used for FHR core design have not been experimentally validated using prototypic materials and temperatures, and there is essentially no available experimental data for FLiBe salts containing high-purity 7Li, as is proposed for the FHR designs. Benchmarking of the reactivity thermal feedback modeling (including the void coefficient) would increase confidence in the design tools and support using the tools in a reactor licensing effort.
Experimental measurements of the temperature reactivity coefficients of the Molten Salt Reactor Experiment (MSRE) coolant salt FLiBe are planned at the LR-0 reactor of the Nuclear Research Institute in the Czech Republic through a cooperative research agreement.
60
7.4 HYDRAULIC DESIGN
Proper performance of the AHTR involves a number of complex flows and heat transfer loops. Currently, only basic spreadsheet calculations have been performed. To bring the AHTR to the level of preconceptual design, its flow patterns must be modeled using computational fluid dynamics. For example, the lower core support plate will need to have a complex orifice structure to properly subdivide the flow into the subchannels in and around each fuel assembly. Also, the thermal mixing pattern in the upper plenum region is key to not exceeding the temperature design limit on the hot leg piping. The AHTR passive safety is dependent on proper operation of the DRACS system, so the interconnected flow loops must be analyzed to provide assurance that the DRACS will function as intended.
7.5 FUEL MANUFACTURING
While conceptually the plate fuel would be manufactured using the same techniques as the much smaller cylindrical compacts, large coated particle fuel structures have not been manufactured previously. Further, the large plates will require larger furnaces and presses than are currently available to the coated particle fuel manufacturing program. As coated particle fuel qualification is currently under way in the DOE-NE advanced gas reactor program, it is not envisioned that a separate qualification effort will be required for the different configuration of the fuel particles planned for the AHTR. However, the manufacturing process for the plates and the mechanical properties of the plates remain to be demonstrated. The AHTR fuel manufacturing development task will also need to include burnable poison particle manufacturing and evaluation as the DOE-NE advanced gas reactor program does not currently include them.
7.6 FUEL HANDLING AND MECHANICAL DESIGN
The current fuel handling of AHTR envisions coordinated fuel transfer between different manipulators. The components, mechanisms, and instrumentation necessary for fuel manipulation all must be designed and demonstrated. In particular, mechanisms that function while immersed in the hot salt remain largely unknown. The operations are planned to be remotely monitored using cameras located above the salt line. A virtual representation of the inside of the reactor from camera views providing depth and occlusion information (3-D reconstruction) is necessary to provide confidence in the visual monitoring of refueling operations.
7.7 NEUTRONIC DESIGN REFINEMENT
The thermal-hydraulic considerations combined with the refueling options seem to indicate that a further increase in the power density of the AHTR is possible with maintaining safety and other design parameters within acceptable limits. An analysis of different options is necessary to show compliance with requirements.
The power distribution in the AHTR core can change with burnup, burnable poison distribution, and control blade insertion. A more detailed model of the AHTR core is necessary to better account for these parameters and for the possible power peaking near the reflector. The impact of using burnable poisons in the AHTR core on the core temperature reactivity coefficients remains to be evaluated.

61
CONCLUSIONS 8.
The AHTR is a 3400 MW(t) FHR class reactor design concept intended to serve as a central generating station type power plant. It is inadvisable that a large-scale reactor be the first-built FHR class reactor as all complex systems have unforeseen issues that are best resolved on smaller-scale, less-expensive systems. The power plant aspects of the AHTR closely resemble those of other large, modern, high-temperature thermal power plants providing direct design models. The low-pressure liquid cooling and lower core power density enable the large-scale reactor core to be a close analogy to smaller-scale systems, enabling direct scale-up to a large system from a test reactor. The large thermal margins and overall passive safety afforded by the combination of coated particle fuel, low-pressure liquid cooling, and ceramic composite structural materials significantly decreases the reactor development risk. While significant technology development and demonstration remains, the basic design concept appears sound and tolerant of much of the remaining performance uncertainty.
The concept development for the AHTR has now reached the stage where the broad outlines of its major elements have been identified. The concept continues to exhibit a great deal of promise for large-scale, on-demand, cost-competitive electricity production while maintaining full passive safety. No fundamental impediments have been identified that would prevent widespread deployment of the concept. However, the design concept remains immature and a number of technological hurdles remain to be overcome before the potential of the AHTR can be realized.

63
REFERENCES 9.
1. S. R. Greene, J. C. Gehin, D. E. Holcomb, et al., Pre-Conceptual Design of a Fluoride-Salt-Cooled Small Modular Advanced High-Temperature Reactor (SmAHTR), ORNL/TM-2010/199, Oak Ridge National Laboratory, Oak Ridge, TN (December 2010).
2. P. Bardet et al., “Design, Analysis and Development of the Modular PB-AHTR,” Proceedings of ICAPP’08, Anaheim, CA, June 8–12, 2008.
3. D. T. Ingersoll et al., Status of Preconceptual Design of the Advanced High-Temperature Reactor (AHTR), ORNL/TM-2004/104, Oak Ridge National Laboratory, Oak Ridge, TN (May 2004).
4. D. T. Ingersoll et al., Status of Physics and Safety Analyses for the Liquid-Salt-Cooled Very High-Temperature Reactor (LS-VHTR), ORNL/TM-2005/218, Oak Ridge National Laboratory, Oak Ridge, TN (December 2005).
5. D. T. Ingersoll et al., Trade Studies for the Liquid-Salt-Cooled Very High-Temperature Reactor: Fiscal Year 2006 Progress Report, ORNL/TM-2006/140, Oak Ridge National Laboratory, Oak Ridge, TN (February 2007).
6. D. E. Holcomb, F. J. Peretz, and A. L. Qualls, Advanced High Temperature Reactor Systems and Economics Analysis, ORNL/TM-2011/364, Oak Ridge National Laboratory, Oak Ridge, TN (September 2011).
7. SCALE: A Modular Code System for Performing Standardized Computer Analyses for Licensing Evaluation, ORNL/TM-2005/39, Version 6, Vols. I–III, Oak Ridge National Laboratory, Oak Ridge, TN (2009). (Available from Radiation Safety Information Computational Center at Oak Ridge National Laboratory as CCC-750.)
8. J. A. Phillips, C. M. Barnes, and J. D. Hunn, “Fabrication and Comparison of Fuels for Advanced Gas Reactor Irradiation Tests,” Proceedings of HTR 2010, Prague, Czech Republic, Oct. 18–20, 2010.
9. M. W. Rosenthal et al., “Recent progress in molten salt reactor development,” Atomic Energy Review IX(3), 601–650 (1971).
10. L. M. Ferris, “Measurement of Distribution Coefficients in Molten-Salt-Metal Systems,” pp. 279–284 in MSRP Semiannual Progress Report, ORNL-TM-4396, Oak Ridge National Laboratory, Oak Ridge, TN (June 1974).
11. M. L. Williams, S. Goluoglu, and L. M. Petrie, “Recent Enhancements to the SCALE 5 Resonance Self-Shielding Methodology,” ANS Transactions 92, 751 (2005).
12. Y. Kim and M. Baek, “Elimination of Double-Heterogeneity through a Reactivity-Equivalent Physical Transformation,” Proceedings of GLOBAL 2005, Tsukuba, Japan, Oct. 9–13, 2005.
13. R. C. Robertson, Conceptual Design Study of a Single-Fluid Molten-Salt Breeder Reactor, ORNL-4541 (June 1971), Figure 3.10.
14. W. Haeck, VESTA User's Manual—Version 2.0.0, IRSN DSU/SEC/T/2008-331 - Index A, Institut de Radioprotection et de Surete Nucleaire, France (2009).
15. W. M. Rohsenow and H. Choi, Heat, Mass, and Momentum Transfer, Prentice-Hall series in engineering of the physical sciences, Prentice-Hall, Englewood Cliffs, NJ (1961).
16. “Reactor,” Chapter 4 of AP1000 Design Control Document, Westinghouse.
64
17. T. Angleiu, J. Ward, and J. Witter, Assessing the Effects of Radiation Damage on Ni-Base Alloys for the Prometheus Space Reactor System, LM-06K033, Knolls Atomic Power Laboratory, Niskayuna, NY (April 2006).
18. Y. Chikazawa, M. Farmer, and C. Grandy, “Technology Gap Analysis on Sodium-Cooled Reactor Fuel-Handling System Supporting Advanced Burner Reactor Development,” Nuclear Technology 165, 270–292 (March 2009).
19. http://www.nei.org/filefolder/US_Nuclear_Refueling_Outages_Days_Average.ppt
20. Technologies for Improving the Availability and Reliability of Current and Future Water Cooled Nuclear Power Plants, Proceedings of a Technical Committee Meeting Held in Argonne, Illinois, Sept. 8–11, 1997, IAEA-Tecdoc-1054, International Atomic Energy Agency (1998), Figure 8, p. 306.
21. G. Radulescu, I. C. Gauld, and G. Ilas, SCALE 5 Predictions of PWR Spent Nuclear Fuel Isotopic Compositions, ORNL/TM-2010/44, Oak Ridge National Laboratory, Oak Ridge, TN (March 2010).
22. L. L. Snead, Y. Katoh, W. E. Windes, R. J. Shinaviski, and T. D. Burchell, “Ceramic Composites of Near Term Reactor Application,” Proceedings of the 4th International Meeting on High Temperature Reactor Technology, HTR2008-58050, USA, Sept. 28–Oct. 1, 2008.
23. G. D. DelCul, B. B. Spencer, C. W. Forsberg, et al., TRISO-Coated Fuel Processing to Support High-Temperature Gas-Cooled Reactors, ORNL/TM-2002/156, Oak Ridge National Laboratory, Oak Ridge, TN (September 2002).

APPENDIX A
THE THERMAL-HYDRAULIC MODEL


A-3
APPENDIX A. THE THERMAL-HYDRAULIC MODEL
Thermal and hydraulic constraints are among the most important in the design of a viable neutronic model. Among the constraints that should be considered are the fuel temperature, the coolant flow velocity, the Reynolds number, and the coolant pressure drop.
FUEL TEMPERATURE DISTRIBUTION MODEL
Thermal-hydraulic constraints were applied to limit the neutronic design space. The thermal-hydraulic model that was applied to the cooling of each fuel plate considers an infinite slab of uniform thickness 2a with uniform heat generation inside. The cooling is performed by a coolant flowing parallel to the plate wall (Fig. A.1).
Fig. A.1. Schematic representation of the cooling model used to generate the thermal hydraulic constraints.
We can consider that the heat generated inside the slab flows (along the x axis on Fig. A.1) and is taken over by the coolant flowing along one of its walls (in the z direction on Fig. A.1). Considering that the heat generated inside the plate in a volume subtended by a height dz flows into the coolant, increasing the coolant’s temperature dT, then based on the energy conservation law we can write the following equation:
cdTmdzAzq f )(
where Af is the fuel Transverse area and c is the specific heat for the FLiBe coolant. Further, the heat
generated is considered to have a sinusoidal distribution along the height of the fuel plate ( H~
is the extrapolated height of the plate):
x
z
coolant sleeve
fuel dz

A-4
H
zqzq ~sin)( max
and m is the mass flow rate of the coolant:
cvAm
Taking into account the heat conduction in the fuel plate and the graphite sleeve (of thickness b on
Fig. A.1, the conservation equation above can be integrated to lead to the maximum (center) temperature in the fuel element, Tm:
fccm k
a
k
ba
H
zqzTzT
2~sin)( max
where
ckb, are the thickness and the conductivity of the graphite sleeve,
fka, are the semi-thickness and the conductivity of the fuel,
and
H
zTTzT inc ~cos1
2
1
fbf NAH
Pq ~
2max
where Tin is the inlet temperature of the core coolant, ΔT is the allowed temperature increase of the coolant along the flow channel (50°C), P is the reactor thermal power, Nfb is the number of fuel assemblies in the core.
The model above was further enhanced by considering the wall (boundary layer) temperature, instead
of the clad temperature, in calculating the maximum fuel temperature. The wall temperature was obtained from the expression of the heat transfer coefficient with the use of the Dittus-Bölter correlation.
As presented, the thermal-hydraulic model assumes a homogeneous distribution of the fuel in the plate’s fuel stripe region. To account for the heterogeneity of the coated particle fuel, corrections should be applied that would lead to some increase in the maximum fuel temperature.
LAYERED PLATE CONFIGURATION
The thermal model developed above can be applied to a fuel plate that is filled with fuel and has an outer graphite sleeve. In the reference AHTR design used in this report, we considered a layered fuel plate, that is, a plate that has a “sandwich” cross-sectional configuration:
sleeve – fuel – carbon matrix – fuel – sleeve.
A-5
The temperature dependence inside the fuel region along the x axis is still parabolic, but the parabolic temperature dependence is cut at the interface of the fuel and carbon matrix regions.
CORE PRESSURE DROP
The pressure drop across the core is calculated from the following Fanning friction factor relationship15:
∆4 0.0791
⁄ 2
where ΔP is the pressure drop, ρ is the coolant density, v is the flow velocity, H is the height of the core, DH is the hydraulic diameter.
PUMP MOTOR POWER
The pump motor power is the power needed by the pumps to circulate the salt through the reactor core. It is calculated from the following relationship:
∆0.9
where Ppump is the pump power needs, ΔP is the pressure drop, is the volumetric flow rate.
The denominator 0.9 is used to account for the pump efficiency. As used, this equation does not account for losses in the heat exchangers.


APPENDIX B
REFERENCE DEPLETION CALCULATIONS


B-3
APPENDIX B. REFERENCE DEPLETION CALCULATIONS
DANCOFF FACTOR METHOD IN SCALE
Introduction
Departing from previous AHTR efforts1 that used fuel in cylindrical solid pins, the new concept uses fuel plates instead. The plate design for the fuel elements was also previously used in the small reactor concept SmAHTR,2 where fully fueled plates were alternated with graphite-only plates. The design for the fuel plate was changed in the new AHTR by modifying the fuel plate into a “sandwich” configuration in order to accommodate better thermal-hydraulics and mechanical requirements (see Appendix A). As a result of additional graphite in each fuel plate, the graphite-only plates from the SmAHTR design were also eliminated. While providing superior cooling properties, because of the particular plate configuration the current design raises additional challenges for the neutronic depletion calculations needed to evaluate the cycle length.
The purpose of this appendix is to present the implementation and use of a methodology that performs fuel depletion calculations using the SCALE code system3 for this nonstandard AHTR fuel configuration.
Issues with the Standard Depletion Model
The TRITON sequence in SCALE can use the multigroup version of the KENO Monte Carlo transport code coupled with the ORIGEN-S fuel depletion code to perform full 3-D depletion calculations on highly heterogeneous core-size configurations. Although the KENO code is a Monte Carlo code and provides the best option for the transport of the particles through complicated geometries, because of the multigroup treatment of the energy variable, it is crucial for the overall accuracy to have available appropriate, problem-dependent neutronic cross sections. To deal with the double heterogeneous nature of the TRISO fuel, special “doublehet” treatments have been implemented4 to correctly evaluate the multigroup cross sections. The doublehet feature, however, is only available in SCALE for fuel elements specific to high temperature gas reactor fuel designs (i.e., TRISO grains in solid cylindrical pins or spherical pebbles), for which they were developed.
It was found that standard, straightforward methods, such as volumetric fuel homogenization and explicit grain representation (similar to the continuous energy models) of the fuel can lead to large discrepancies between them. For example, for one AHTR core design option it was found that the predicted fuel cycle length was 1.3 years with the homogenized fuel model and 2.2 years with the explicit grain model. Moreover, neither of these two models was able to predict the beginning of life (BOC) multiplication factor. In fact, the difference in both cases was unacceptably large: 1.236 with the homogenized model and 1.361 with the explicit grain model, while the continuous energy KENO model predicted a multiplication constant of 1.295 (used as a reference). The standard methods account for the self-shielding effects in the fuel by considering one-dimensional, Wigner-Seitz modified cells, i.e., asymmetric plate for the volumetric-homogenized model, respectively spheres in a square pitch for the explicit grain model, both standard procedures in SCALE.
Dancoff Factor Method
To improve the accuracy of the depletion calculations, we used the explicit grain model and corrected the self-shielding calculations by using a Dancoff correction to the escape probability evaluation in the CENTRM module of SCALE.4 The method, applied to a core that uses a unique type of fuel, assumes the following steps:
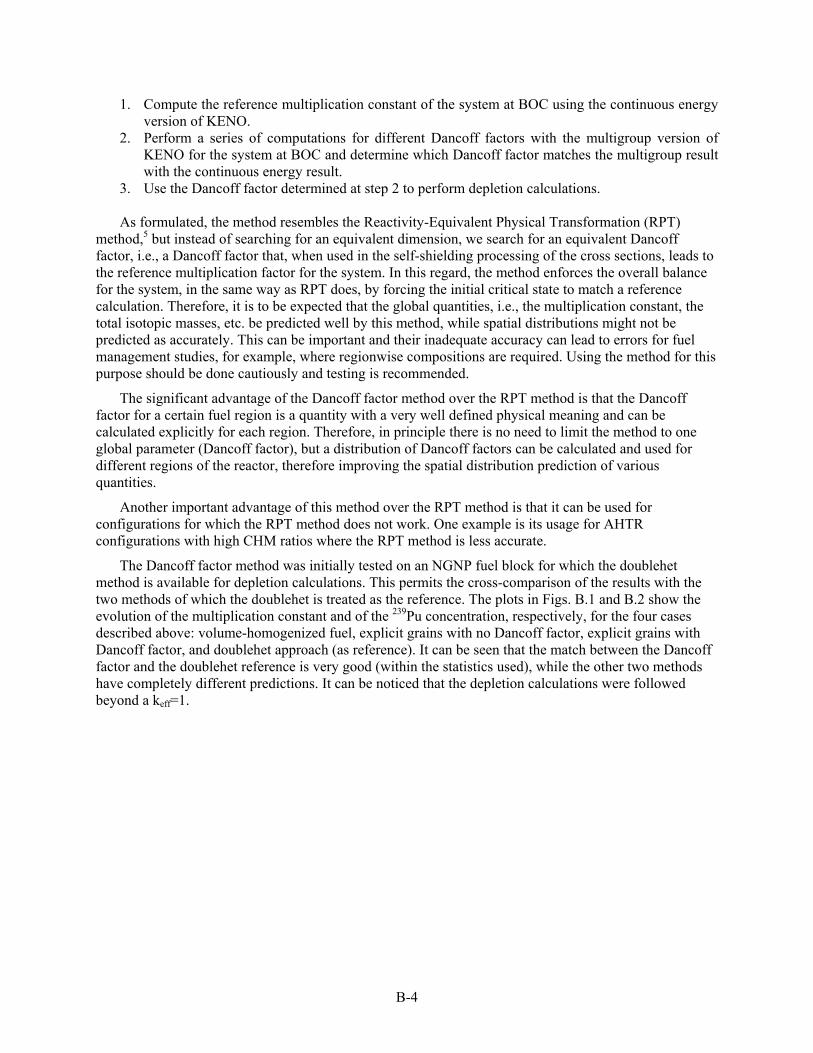
B-4
1. Compute the reference multiplication constant of the system at BOC using the continuous energy version of KENO.
2. Perform a series of computations for different Dancoff factors with the multigroup version of KENO for the system at BOC and determine which Dancoff factor matches the multigroup result with the continuous energy result.
3. Use the Dancoff factor determined at step 2 to perform depletion calculations. As formulated, the method resembles the Reactivity-Equivalent Physical Transformation (RPT)
method,5 but instead of searching for an equivalent dimension, we search for an equivalent Dancoff factor, i.e., a Dancoff factor that, when used in the self-shielding processing of the cross sections, leads to the reference multiplication factor for the system. In this regard, the method enforces the overall balance for the system, in the same way as RPT does, by forcing the initial critical state to match a reference calculation. Therefore, it is to be expected that the global quantities, i.e., the multiplication constant, the total isotopic masses, etc. be predicted well by this method, while spatial distributions might not be predicted as accurately. This can be important and their inadequate accuracy can lead to errors for fuel management studies, for example, where regionwise compositions are required. Using the method for this purpose should be done cautiously and testing is recommended.
The significant advantage of the Dancoff factor method over the RPT method is that the Dancoff factor for a certain fuel region is a quantity with a very well defined physical meaning and can be calculated explicitly for each region. Therefore, in principle there is no need to limit the method to one global parameter (Dancoff factor), but a distribution of Dancoff factors can be calculated and used for different regions of the reactor, therefore improving the spatial distribution prediction of various quantities.
Another important advantage of this method over the RPT method is that it can be used for configurations for which the RPT method does not work. One example is its usage for AHTR configurations with high CHM ratios where the RPT method is less accurate.
The Dancoff factor method was initially tested on an NGNP fuel block for which the doublehet method is available for depletion calculations. This permits the cross-comparison of the results with the two methods of which the doublehet is treated as the reference. The plots in Figs. B.1 and B.2 show the evolution of the multiplication constant and of the 239Pu concentration, respectively, for the four cases described above: volume-homogenized fuel, explicit grains with no Dancoff factor, explicit grains with Dancoff factor, and doublehet approach (as reference). It can be seen that the match between the Dancoff factor and the doublehet reference is very good (within the statistics used), while the other two methods have completely different predictions. It can be noticed that the depletion calculations were followed beyond a keff=1.
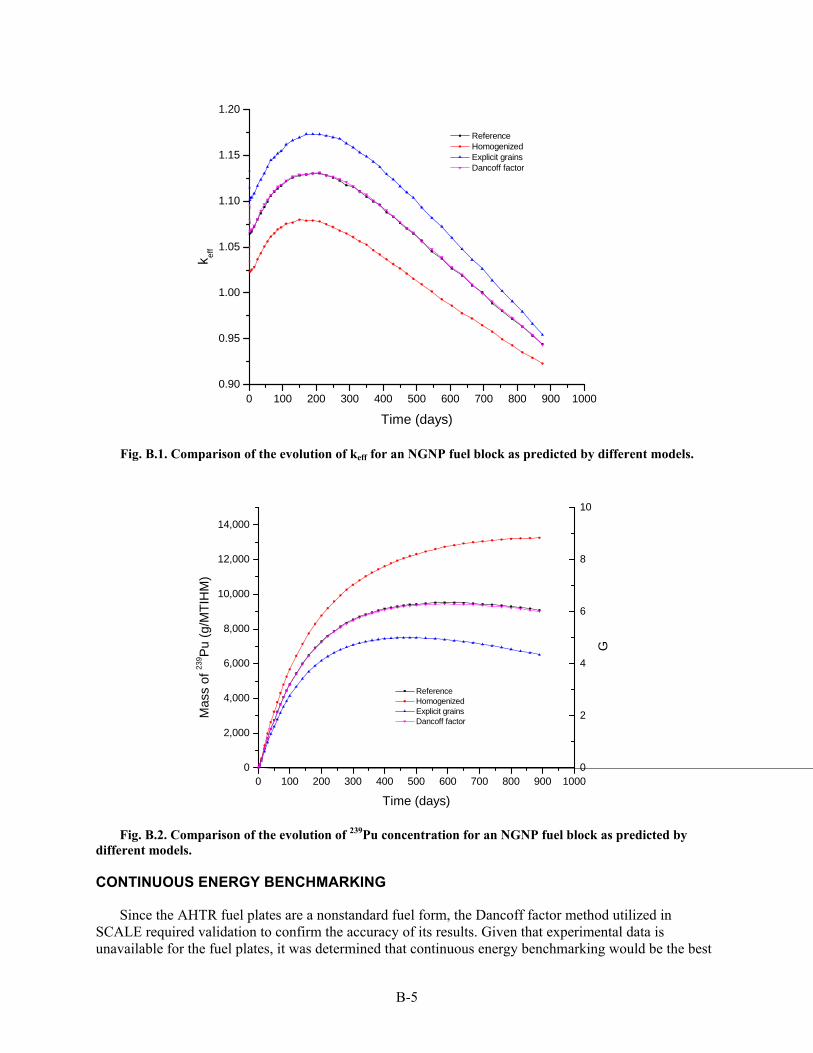
B-5
0 100 200 300 400 500 600 700 800 900 10000.90
0.95
1.00
1.05
1.10
1.15
1.20
k eff
Time (days)
Reference Homogenized Explicit grains Dancoff factor
Fig. B.1. Comparison of the evolution of keff for an NGNP fuel block as predicted by different models.
0 100 200 300 400 500 600 700 800 900 10000
2,000
4,000
6,000
8,000
10,000
12,000
14,000
Mas
s of
239 P
u (
g/M
TIH
M)
Time (days)
Reference Homogenized Explicit grains Dancoff factor
0
2
4
6
8
10
G
Fig. B.2. Comparison of the evolution of 239Pu concentration for an NGNP fuel block as predicted by different models.
CONTINUOUS ENERGY BENCHMARKING
Since the AHTR fuel plates are a nonstandard fuel form, the Dancoff factor method utilized in SCALE required validation to confirm the accuracy of its results. Given that experimental data is unavailable for the fuel plates, it was determined that continuous energy benchmarking would be the best

B-6
approach to this problem. This method avoids potential issues related to the correct treatment of the self-shielding effects for the energy group structures and provides an alternative methodology that should generate the same conclusion to test the viability of the approximations. To accomplish this, the VESTA depletion code, which utilizes MCNP5 and ORIGEN 2.2, was used to deplete the system, and the keff results were compared to the results of the corresponding AHTR SCALE/TRITON case that used the Dancoff factor method. In addition, key isotopic inventories were tracked, including 235U, 239Pu, and 240Pu, and their masses were compared to the results provided by the TRITON calculations. The middlestep depletion methodology was used in VESTA, since this most closely corresponds to the process utilized by TRITON, thus simplifying comparisons. In this method, the keff is determined from transport calculations at the start of a time step, the mixture is depleted to the center of the time step, and the transport calculation is repeated. Only the composition data at the end of each step is recorded.
The VESTA case was designed to match the TRITON model as closely as possible, including the use of a lattice structure to model the randomly distributed grains. The model was run with sufficient accuracy to generate a standard deviation of less than 100 pcm in keff for each time step, both to serve as an accurate baseline for comparisons and because a high level of accuracy was important for the large energy group structure used by VESTA for depletion.
The comparison between VESTA and TRITON results for the keff vs time can be seen in Fig. B.3. The difference in eigenvalue predicted by TRITON is on average ~200 pcm below that predicted by VESTA. For the initial eigenvalue, the difference is 41 pcm, while the difference between the VESTA (MCNP) prediction and the continuous energy KENO prediction is even smaller. The apparent bias between the TRITON and VESTA can be due to difference in the methodologies used by the two codes (including the depletion modules, ORIGEN-S and ORIGEN2.2, respectively), difference in the libraries used by KENO and MCNP, and the possible bias introduced by the Dancoff factor method in TRITON (calibration to the continuous energy result). The 200 pcm average bias was determined to be adequate for the type of calculations performed.
The evolutions of concentrations of various isotopes (235U, 239Pu, 240Pu in particular) were also compared, and the agreement between the two codes was determined to be adequate.
These comparisons were repeated for a higher CHM ratio with similar results.
Fig. B.3. Evolution of keff vs time for TRITON and VESTA depletion calculations.
0.8
0.9
1
1.1
1.2
1.3
1.4
0 500 1000 1500 2000
k‐eff
Time (days)
VESTA
TRITON

B-7
WORKS CITED IN APPENDIX B
1. D. T. Ingersoll et al., Trade Studies for the Liquid-Salt-Cooled Very High-Temperature Reactor: Fiscal Year 2006 Progress Report, ORNL/TM-2006/140, Oak Ridge National Laboratory, Oak Ridge, TN (February 2007).
2. S. R. Greene, J. C. Gehin, D. E. Holcomb, et al., Pre-Conceptual Design of a Fluoride-Salt-Cooled Small Modular Advanced High-Temperature Reactor (SmAHTR), ORNL/TM-2010/199, Oak Ridge National Laboratory, Oak Ridge, TN (December 2010).
3. SCALE: A Modular Code System for Performing Standardized Computer Analyses for Licensing Evaluation, ORNL/TM-2005/39, Version 6, Vols. I–III, Oak Ridge National Laboratory, Oak Ridge, TN (2009). (Available from Radiation Safety Information Computational Center at Oak Ridge National Laboratory as CCC-750.)
4. M. L. Williams, S. Goluoglu, and L. M. Petrie, “Recent Enhancements to the SCALE 5 Resonance Self-Shielding Methodology,” ANS Transaction,s 92, 751 (2005).
5. Y. Kim and M. Baek, “Elimination of Double-Heterogeneity through a Reactivity-Equivalent Physical Transformation,” Proceedings of GLOBAL 2005, Tsukuba, Japan, Oct. 9–13, 2005.

APPENDIX C
FAST DEPLETION APPROXIMATIONS FOR REFUELING ANALYSIS


C-3
APPENDIX C. FAST DEPLETION APPROXIMATIONS FOR REFUELING ANALYSIS
INTRODUCTION
The Advanced High Temperature Reactor (AHTR) uses coated particle, high temperature fuel similar to that anticipated for the Next Generation Nuclear Plant (NGNP), but the AHTR uses plate-type fuel rather than cylindrical fuel compacts or spherical pebbles. Each fuel plate contains two fuel compacts in slab geometry on both sides of an inert carbon matrix slab with an inert carbon sleeve over the matrix and the inert central carbon matrix, the “meat.”
Because of the lumped nature of particle fuel and the reduced scattering cross section in the resonance region that enhances the resonance self-shielding effect in this fuel, it cannot be modeled accurately by a simple volume-weighted homogenized composition (1). Therefore, great care must be taken to account for this double heterogeneity self-shielding effect.
Monte Carlo neutron transport is used to estimate criticality and reaction rates with a full 3-D model of the AHTR generated for the KENO module in Scale, and the TRITON module couples KENO to ORIGEN-S to perform depletion analysis (2) (3) (4).
Currently, TRITON cannot be coupled to KENO in continuous energy (CE) mode, and this necessitates implementation of cross-section processing techniques to generate case-specific sets of multigroup cross sections accounting for the double heterogeneity (“doublehet”) self-shielding effect.
The Next Generation Nuclear Plant project has sponsored the development of a doublehet treatment for particle-type fuel implemented in Scale (5). This treatment homogenizes the fuel particle, TRISO layers, and fuel matrix into a single material and generates a set of multigroup cross sections for this homogenized material accounting for the self-shielding effect. However, this technique was developed only for the geometries considered for NGNP—spherical (pebbles) and cylindrical (prismatic).
The explicit grain modeling method (see Appendix B) is complicated because the number of fuel grains in the system must be precisely controlled to impose the heavy metal loading. Furthermore, this methodology is computationally intensive—depletion runs can take up to 2–3 weeks because of the complicated geometry. In order to perform neutronics design work on the AHTR, faster methods of neutron transport must be developed and verified for estimating maximum discharge burnup, by performing depletion analysis as part of design studies for the AHTR.
REACTIVITY-EQUIVALENT PHYSICAL TRANSFORM METHOD
The Reactivity-Equivalent Physical Transform (RPT) Method is an efficient and effective way to model a particle fueled system (1) and can be implemented in Scale without editing any of its source code. The RPT method models the fuel in cylindrical and spherical compacts by collecting the fuel particles in a smaller RPT active region and then performing a volume-weighted material homogenization on the transformed active region (Fig. C.1).
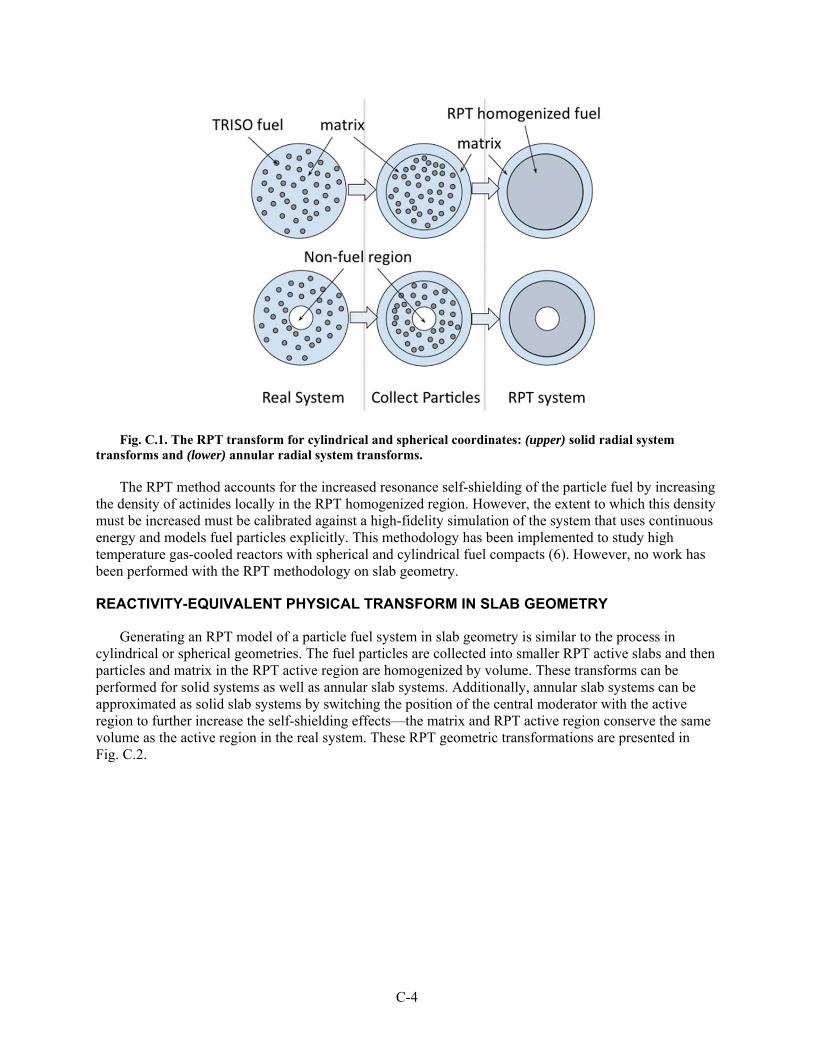
C-4
Fig. C.1. The RPT transform for cylindrical and spherical coordinates: (upper) solid radial system transforms and (lower) annular radial system transforms.
The RPT method accounts for the increased resonance self-shielding of the particle fuel by increasing the density of actinides locally in the RPT homogenized region. However, the extent to which this density must be increased must be calibrated against a high-fidelity simulation of the system that uses continuous energy and models fuel particles explicitly. This methodology has been implemented to study high temperature gas-cooled reactors with spherical and cylindrical fuel compacts (6). However, no work has been performed with the RPT methodology on slab geometry.
REACTIVITY-EQUIVALENT PHYSICAL TRANSFORM IN SLAB GEOMETRY
Generating an RPT model of a particle fuel system in slab geometry is similar to the process in cylindrical or spherical geometries. The fuel particles are collected into smaller RPT active slabs and then particles and matrix in the RPT active region are homogenized by volume. These transforms can be performed for solid systems as well as annular slab systems. Additionally, annular slab systems can be approximated as solid slab systems by switching the position of the central moderator with the active region to further increase the self-shielding effects—the matrix and RPT active region conserve the same volume as the active region in the real system. These RPT geometric transformations are presented in Fig. C.2.
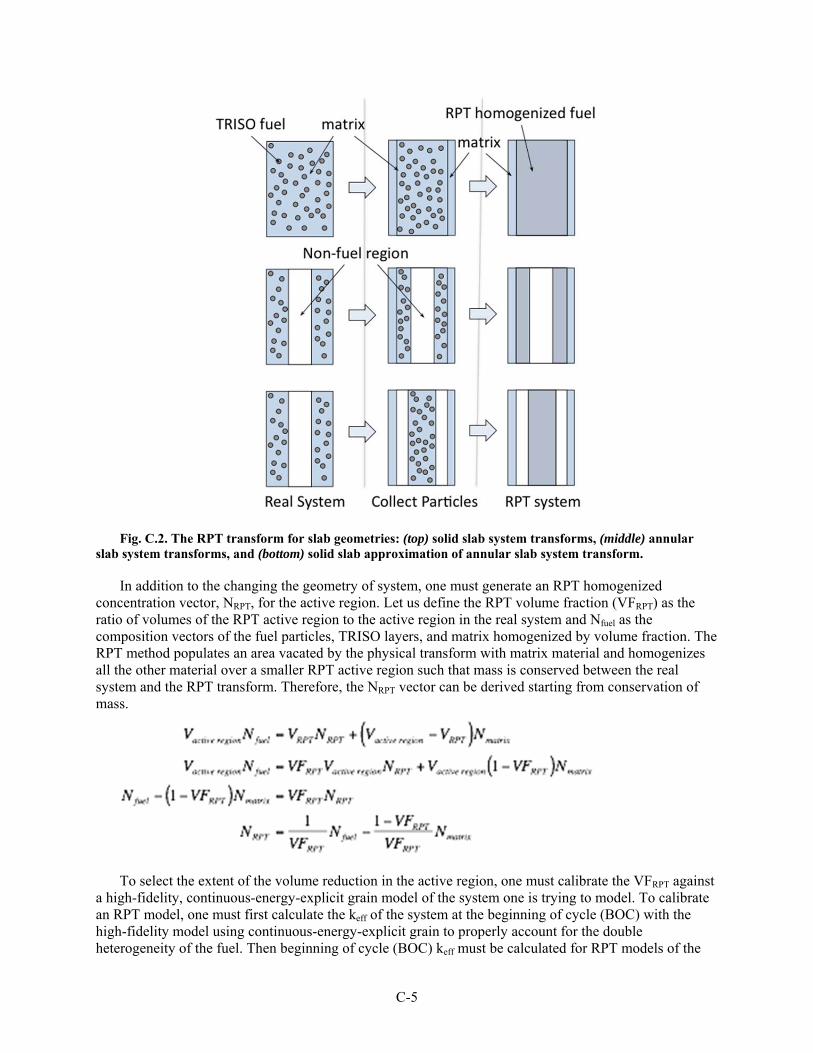
C-5
Fig. C.2. The RPT transform for slab geometries: (top) solid slab system transforms, (middle) annular slab system transforms, and (bottom) solid slab approximation of annular slab system transform.
In addition to the changing the geometry of system, one must generate an RPT homogenized concentration vector, NRPT, for the active region. Let us define the RPT volume fraction (VFRPT) as the ratio of volumes of the RPT active region to the active region in the real system and Nfuel as the composition vectors of the fuel particles, TRISO layers, and matrix homogenized by volume fraction. The RPT method populates an area vacated by the physical transform with matrix material and homogenizes all the other material over a smaller RPT active region such that mass is conserved between the real system and the RPT transform. Therefore, the NRPT vector can be derived starting from conservation of mass.
To select the extent of the volume reduction in the active region, one must calibrate the VFRPT against
a high-fidelity, continuous-energy-explicit grain model of the system one is trying to model. To calibrate an RPT model, one must first calculate the keff of the system at the beginning of cycle (BOC) with the high-fidelity model using continuous-energy-explicit grain to properly account for the double heterogeneity of the fuel. Then beginning of cycle (BOC) keff must be calculated for RPT models of the

C-6
AHTR with different VFRPT to determine the VFRPT that forces the RPT model to match the keff of the high-fidelity model. Figure C.3 presents the keff as a function of VFRPT for the AHTR with the baseline fuel design for the annular slab model and the solid slab approximation transformations—either transform can be used for the baseline system because AHTR fuel has annular slab fuel geometry.
Fig. C.3. Calibration of RPT model of the AHTR with baseline fuel design.
The baseline fuel design has significant inherent self-shielding because of the high fuel-to-moderator ratio and, as a result, the double-heterogeneity effect only weakly increases the resonance self-shielding in this system. Systems with softer neutron spectra, either from additional moderation or because of lower enrichment, require more volume reduction to induce the correct amount of self-shielding. Notice in Fig. C.3 that the RPT annular-slab transform requires a greater volume reduction to match the keff of the benchmark. The solid slab approximation RPT transform is able to induce more self-shielding because more of the fuel is grouped together. This effect enables the solid slab approximation RPT transform to model more systems with softer neutron spectra than the annular slab RPT transform.
VERIFICATION OF DEPLETION RESULTS
To determine to what extent the RPT methodology can be utilized for depletion analysis of the AHTR, the single-batch depletion results obtained using the annular slab RPT transform and the solid slab approximation RPT transform were compared to the results obtained from a multigroup explicit grain model of AHTR with the baseline fuel design. The verification efforts compared the predicted maximum discharge burnup, the keff evolution, and the evolution of a set of critical isotopes. Additionally, the reduction in computational intensity attributed to using these simplified models was quantified.
Predicted Maximum Discharge Burnup
Recall that one of the primary motivations for implementing the RPT model is to quickly and accurately estimate the burnup of many point designs of the AHTR. Therefore, one must assess how accurately the RPT methodologies can estimate the discharge burnup of the AHTR. The estimated maximum discharge burnups for the AHTR with baseline fuel design and a single-batch fuel cycle are compared in Table C.1.

C-7
Table C.1. Estimated maximum discharge burnup for single-batch fuel cycle AHTR with baseline fuel design for various depletion models
Model Estimated discharge
burnup (MWd/MT)
Error (%)
Continuous energy explicit grain 7.91E+04 - Multigroup RPT annular slab 8.09E+04 +2.4 Multigroup RPT solid slab approximation 8.17E+04 +3.3
Both RPT methodologies predicted the maximum attainable burnup within an error of 4%.
k-Effective Evolution
The keff evolution was also compared for the depletion of the AHTR with baseline fuel design and a single-batch fuel cycle as shown in Fig. C.4.
Fig. C.4. Comparison evolution of system keff for AHTR with baseline fuel design and single-batch fuel cycle for different depletion models.
The evolutions of the RPT method matched the trajectory of the multigroup explicit particle benchmark well. The average error between the RPT method and the benchmark model was 350 pcm for the annular slab geometry approximation and 540 pcm for the single slab approximation.
Composition Evolution
To ensure that the correct physics were used to predict the maximum discharge burnup and keff evolution, the composition evolutions for a set of critical isotopes (235U, 238U, 239Pu and 240Pu) were compared for two depletion zones (the center radial and axially central position and on the radial

C-8
periphery and axially central position). These isotopic concentration evolutions are presented in Figs. C.5 and C.6.
Fig. C.5. Isotopic concentration evolutions in AHTR (central radial position and central axial position).

C-9
Fig. C.6. Isotopic concentration evolutions in AHTR (outer radial position and central axial position).
These figures show that the concentration evolutions for both RPT model match well.
Computational Requirements
The motivation behind implementing the RPT methodology for depletion analysis is to reduce the computation time required to perform depletion analysis. Therefore, we need to see significant reductions in computational time to accept the error introduced by implementing the RPT geometric simplification. The time required to perform the depletion analysis for the AHTR with baseline fuel and a single-batch fuel cycle was used as a metric of computational requirements; in this analysis TRITON can run on only one node so the computation time is the same as wall-clock time. The comparison of computational requirements is presented in Table C.2.
Table C.2. Computation requirements for depletion analysis
Model Computation
time (s) Speed up
Burnup error (%)
Continuous energy explicit grain 1.49E+06 – – Multigroup RPT annular slab 1.43E+05 10.4 +2.3 Multigroup RPT solid slab approximation 7.33E+04 20.3 +3.3
Table C.2 shows that utilizing the RPT geometry simplification reduces the run time by an order of
magnitude.

C-10
CONCLUSION
The RPT method is a geometry simplification that is used to account for the double-heterogeneity self-shielding effect observed in the neutron transport of nuclear systems with particle fuel. The RPT method has previously been implemented in cylindrical and spherical systems and can also be applied to slab geometry to model the plate-type fuel in the AHTR. These annular slab systems can be modeled with two different kinds of RPT transforms, an annular slab transform and a solid slab approximation transform. The solid slab approximation transformation allows one to model more systems with softer spectra than the annular slab RPT transform. The results between the depletion analysis using these RPT transforms and a multigroup explicit grain model of the AHTR matched well with respect to predicted maximum discharge burnup, keff evolution, and evolution of isotopic concentrations. Utilizing the RPT method for depletion analysis increases the speed of depletion analysis by 10–20 times. Therefore, the RPT can be utilized for depletion analysis in parametric studies so long as one notes the associated uncertainty RPT introduces to predicted fuel cycle parameters.
WORKS CITED IN APPENDIX C
1. Elimination of Double-Heterogeneity Through a Reactivity-Equivalent Physical Transformation. Kim, Yonghee. 2005. Global 2005.
2. Hollenbach, D. F. KENO-VI: A General Quadratic Version of the KENO Program. Oak Ridge National Laboratory. s.l. : RSICC, 2009.
3. DeHart, M. D. TRITON: A Two-Dimensional Transport and Depletion Module for Characterization of Spent Nuclear Fuel. Oak Ridge National Laboratory. s.l. : RSICC, 2009.
4. Gauld, I. C. ORIGEN-ARP: Automatic Rapid Processing for Spent Fuel Depletion, Decay, and Source Term Analysis. Oak Ridge National Laboratory. s.l. : RSICC, 2009.
5. Goluoglu, S., Hollenbach, D.F., Landers, N. F., Petrie, N. F., Bucholz, J. A., Weber, J. A., Hopper, C. M. The Material Information Processor for SCALE . Oak Ridge National Laboratory. s.l. : Oak Ridge National Laboratory, 2009.
6. "Optimization of One-Pass Transuranic Deep Burn in a Modular Helium Reactor." Kim, Yonghee and Venneri, Francesco. 2008 йил, Nuclear Science and Engineering, Vol. 160, pp. 59-74.
7. Oak Ridge National Laboratory. TRITON: A Two-Dimensional Transport and Depletion Module for Characterization of Spent Nuclear Fuel . 2009.
8. Driscoll, M. J. The Linear Reactivity Model for Nuclear Fuel Management. s.l. : American Nuclear Society, 1991.
9. Greene, S. R., Gehin, J. C., Holcomb, D. E. et al. Pre-Conceptual Design of a Fluoride-Salt-Cooled Small Modular Advanced High-Temperature Reactor (SmAHTR). Oak Ridge National Laboratory. Oak Ridge, TN : s.n., 2010. ORNL/TM-2010/199, December 2010.

APPENDIX D
EQUILIBRIUM CYCLE METHODOLOGY

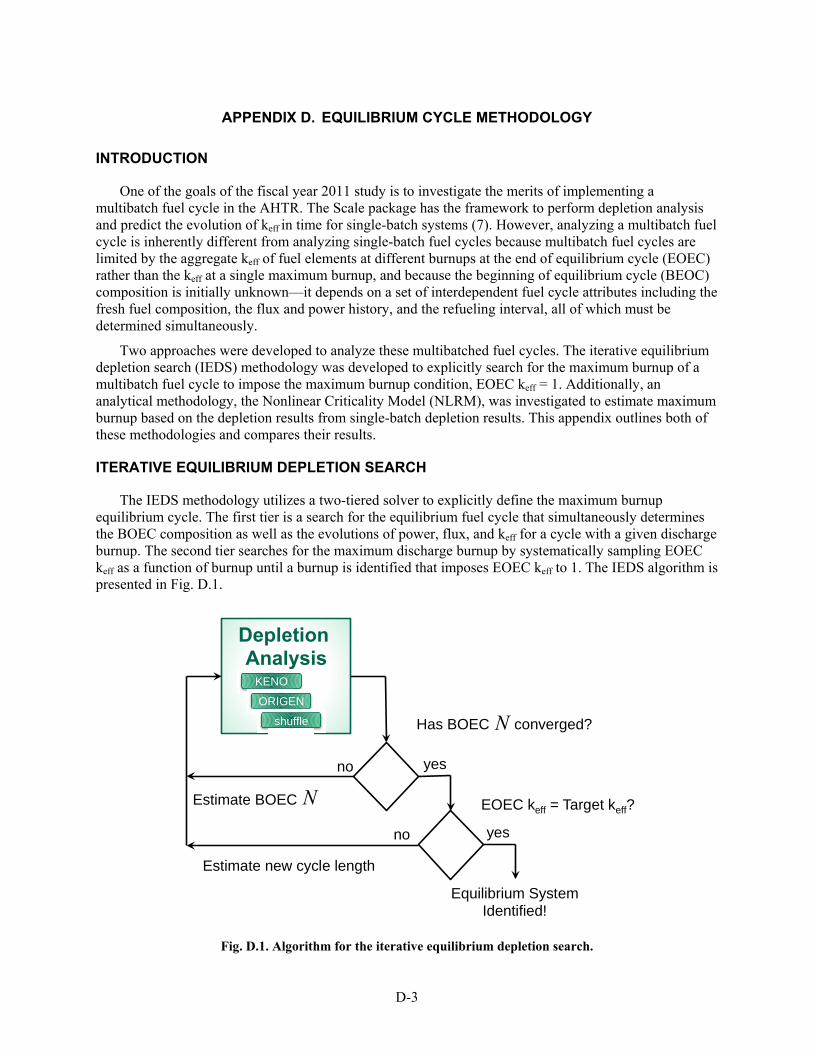
D-3
APPENDIX D. EQUILIBRIUM CYCLE METHODOLOGY
INTRODUCTION
One of the goals of the fiscal year 2011 study is to investigate the merits of implementing a multibatch fuel cycle in the AHTR. The Scale package has the framework to perform depletion analysis and predict the evolution of keff in time for single-batch systems (7). However, analyzing a multibatch fuel cycle is inherently different from analyzing single-batch fuel cycles because multibatch fuel cycles are limited by the aggregate keff of fuel elements at different burnups at the end of equilibrium cycle (EOEC) rather than the keff at a single maximum burnup, and because the beginning of equilibrium cycle (BEOC) composition is initially unknown—it depends on a set of interdependent fuel cycle attributes including the fresh fuel composition, the flux and power history, and the refueling interval, all of which must be determined simultaneously.
Two approaches were developed to analyze these multibatched fuel cycles. The iterative equilibrium depletion search (IEDS) methodology was developed to explicitly search for the maximum burnup of a multibatch fuel cycle to impose the maximum burnup condition, EOEC keff = 1. Additionally, an analytical methodology, the Nonlinear Criticality Model (NLRM), was investigated to estimate maximum burnup based on the depletion results from single-batch depletion results. This appendix outlines both of these methodologies and compares their results.
ITERATIVE EQUILIBRIUM DEPLETION SEARCH
The IEDS methodology utilizes a two-tiered solver to explicitly define the maximum burnup equilibrium cycle. The first tier is a search for the equilibrium fuel cycle that simultaneously determines the BOEC composition as well as the evolutions of power, flux, and keff for a cycle with a given discharge burnup. The second tier searches for the maximum discharge burnup by systematically sampling EOEC keff as a function of burnup until a burnup is identified that imposes EOEC keff to 1. The IEDS algorithm is presented in Fig. D.1.
Fig. D.1. Algorithm for the iterative equilibrium depletion search.
KENO
ORIGEN
shuffle
Depletion Analysis
Estimate BOEC
Estimate new cycle length
Has BOEC converged?
EOEC keff = Target keff?
no
no
yes
yes
Equilibrium System Identified!
N
!N
D-4
Search for the Equilibrium Fuel Cycle
In these multibatch systems, the BOEC composition is burned for a single refueling interval, the last batch of fuel is discharged, the remaining fuel is shuffled, and fresh fuel is added to the core. The change to the fuel composition, N, over the irradiation campaign can be modeled by a differential equation.
The depletion matrix, A, contains the depletion parameters including, decay constants, cross sections,
and flux distributions as a function of batch and time in the equilibrium cycle—more detailed analysis can be performed where batches of fuel are divided into sub-batches, but whole batches provide enough fidelity for this explanation.
This differential equation can be integrated from BOEC to EOEC to determine the EOEC composition.
The BOEC composition can then be estimated by shuffling the EOEC fuel and loading fresh fuel into
the core.
Here, mshuffling is a matrix that advances each batch of fuel. Combining these equations, one can define
the equilibrium cycle requirement:
In the search for the equilibrium fuel cycle, the equation for the equilibrium fuel cycle condition is
evaluated with the best estimate of the BOEC composition; the estimate of BOEC composition must meet a set of two convergence criteria to converge. The first criterion is that the EOEC keff is constant between two iterations. It would be arduous to solve for the concentration precisely for every isotope; therefore, the differences in the estimates of the EOEC keff between cycles is used as a metric of the convergence of the aggregate composition of the BOEC vector. The EOEC keff is used rather than the BOEC keff as a metric for BOEC composition because the EOEC keff is influenced more by the unknown compositions that will become the BOEC composition, or conversely, the EOEC keff is less influenced by the fresh fuel composition, which is already known exactly. The second criterion is that the concentrations of a set of critical isotopes converge within an acceptable error. After these criteria are met, the EOEC keff is passed to the second tier of the IEDS algorithm.
Implementation of Search for Equilibrium Fuel Cycle
The equilibrium cycle evaluation was performed using the TRITON model of SCALE, which couples KENO-VI (a 3-D Monte Carlo neutron transport code that determines the neutron flux distribution,
dN
dt A(batch, t)N
NEOEC A(batch, t)N dtBOEC
EOEC
NEOEC NBOEC exp dt ' A(batch, t)BOEC
EOEC
NBOEC NEOEC mshuffling Nmakeup mfresh fuel
NBOEC NBOEC exp dt ' A(batch, t)BOEC
EOEC
mshuffling Nmakeup mfresh fuel

D-5
case-specific cross sections, and the system-wide multiplication factor for each burnup state) to ORIGEN-S (a program that solves the depletion equations and returns the composition of the next burnup state). A driver program, Scale Equilibrium Analysis Utility (SEAU), was developed to iteratively execute TRITON, shuffle EOEC fuel, insert fresh fuel, assess the convergence of the BOEC composition, and pass the EOEC keff to the next iteration loop once the BOEC composition has converged.
Convergence Criteria
As stated earlier, there are two criteria for the convergences of the equilibrium fuel cycle: the EOEC keff and the concentrations of a set of critical isotopes. For the equilibrium depletion analysis performed for this project, the EOEC keff is required to converge within 0.002, though a more rigorous convergence criterion could be implemented if one so desired. The differences between concentrations of the isotopes in the set of critical isotopes between estimates of the BOEC composition normalized by the latest estimate of the concentration, normalized error, was required to converge within 1% for each isotope in the set of critical isotopes for every depletion zone in the model. The set of critical isotopes was limited to 235U, 238U, and 239Pu, but the set could easily be increased.
Search for Maximum Burnup
The goal of the second tier of the IEDS algorithm is to systematically sample the EOEC keff as a function of burnup to find the burnup that imposes the maximum burnup condition, EOEC keff =1, by initiating the search for the equilibrium fuel cycle for various discharge burnups. Usually, EOEC keff is well behaved as a function of discharge burnup for the AHTR and can be approximated as a linear function around the maximum burnup. After the first two points of EOEC keff and burnup are generated, the maximum burnup can be determined by interpolating or extrapolating to a discharge burnup that imposes the EOEC keff to 1. To have confidence that this discharge burnup meets the maximum burnup condition, the search for the equilibrium fuel cycle is initiated for the estimate of maximum burnup to confirm that the EOEC keff is equal to 1 within an acceptable error. If the EOEC keff is not equal to 1, the new EOEC keff point informs a new estimate of maximum burnup, and another search for the equilibrium fuel cycle is started. This process is iterated until the maximum burnup condition is satisfied.
Implementation of the Search for Maximum Burnup
SEAU includes a module that automatically performs an initial search for equilibrium solvers and interpolates or extrapolates once EOEC keff is sampled twice. The search is completed once an equilibrium fuel cycle is identified with an EOEC keff within 0.002 of 1.000. These data points can be used to make a linear regression for EOEC keff as a function of discharge burnup, and this function can be evaluated to estimate the maximum discharge burnup.
Uncertainty in the Maximum Burnup Predicted by Iterative Equilibrium Depletion Search Methodology
The uncertainty in the estimate of the maximum burnup is related to the confidence one has in the linear regression of EOEC keff vs burnup. There are uncertainties associated with the slope and intercept of the EOEC keff regression that should be propagated to estimate the uncertainty in the maximum burnup. These uncertainties can be evaluated as functions of the discharge burnups sampled; the number of points in the regression, N; and the correlation coefficient, R; and propagated to uncertainty in the maximum discharge burnup.
D-6
keffEOEC yo y 'b
bmax y '
y ' 2
2
yo
y '
2
y ' y ' tan arccos R
N 2
yo y 'brms
These expressions indicate the uncertainty in the maximum discharge burnup on the order of 15% of the predicted maximum discharge burnup. The certainty can be increased by sampling the EOEC keff function more often or tightening the convergence EOEC keff convergence criterion—the uncertainty in yo cannot be less than the EOEC keff convergence criterion or the Monte Carlo statistical error.
NONLINEAR REACTIVITY MODEL
Many multibatch fuel cycle parametric studies are performed using the linear reactivity model (LRM) to estimate the maximum attainable burnup of a system based on the depletion results of a single-batch system (8). The LRM assumes that reactivity decreases linearly with burnup, b, and that aggregate reactivity, aggregate, is dependent on the reactivities in each batch of fuel (i.e., burnup-dependent reactivity).
aggregate 1
n bi
i1
n
b yo y 'b
The accuracy of the LRM model can be increased and its applicability expanded to more systems
when higher-order polynomials are used to model the evolution of reactivity. The maximum discharge burnup can be estimated using NLRM assuming an mth-order polynomial and assuming n reloads per fuel cycles as shown below.
b yo y 'b ... y(m)bm
EOEC 1
n ib
n
i1
n
EOEC 1
nyo y '
ib
n
... y(m) ib
n
m
i1
n
EOEC yo y 'b
n2 ii1
n
... y(m)bm
nm1 im
i1
n
0 yo y 'bmax
n2i
i1
n
... y(m)bmax
m
nm1im
i1
n
Curves for the EOEC reactivity as a function of discharge burnup can be generated using these
expressions, and the maximum discharge burnup can be solved for numerically such that there is no excess reactivity at EOEC. These curves are plotted in Fig. D.2 for fuel cycles with varying numbers of reloads per fuel cycle for the baseline fuel design.

D-7
Fig. D.2. Predicted EOEC reactivity of the baseline AHTR as a function of discharge burnup for various numbers of reloads per fuel cycle.
Model Uncertainty in Nonlinear Reactivity Model
The applicability of this methodology is predicated on the ability of the NLRM to accurately predict EOEC reactivity. The NLRM expression presented earlier assumes that power is constant with burnup, as is usually assumed when depleting a single-batch core initially loaded with fresh fuel. Furthermore, a more accurate calculation of core-averaged reactivity weighs the reactivity of each batch of neutrons born in each fuel zone (this can be approximated by weighting the reactivity by power fraction of each batch) rather than using a simple arithmetic average. The presented methodology also disregards these details because the power history in the core is unknown (though Driscoll et al. have proposed a means to estimate the power fraction in each zone based on the burnup-dependent reactivity and diffusion theory). Figure D.3 compares the EOEC reactivity for the maximum burnup fuel cycle determined explicitly with the IEDS methodology to those predicted assuming a second-order regression for the reactivity determined with the NLRM presented and one that uses that utilizes batch reactivities determined based on the actual burnup of each batch at EOEC and weighted by power fractions determined by IEDS.

D-8
Fig. D.3. Comparison of reactivity predicted near EOEC. “NLRM” values were predicted by assuming constant power with burnup and simple average. “NLRM detailed” values were predicted by assuming burnup-dependent reactivity determined based on batch-specific burnup weighted by power fraction (batch-specific burnup and power fractions were calculated based on results from IEDS).
Comparisons of the reactivity predicted by NLRM to the results predicted using the iterative equilibrium depletion solver for burnups are close to the maximum burnup.
The maximum error in the NLRM estimate of EOEC reactivity is 860 pcm. However, it is critical to understand how the uncertainty in the estimate EOEC reactivity is propagated to uncertainty in the maximum discharge burnup. To first order, this can be estimated by multiplying the uncertainty in reactivity by the differential of burnup with respect to EOEC reactivity or, alternatively, by the inverse of the differential of EOEC reactivity with respect to discharge burnup.
EOEC yo y 'bdischarge
n2 ii1
n
... y(m)b
discharge
m
nm1 im
i1
n
EOEC
bdischarge
y '
n2 ii1
n
... m * y(m)b
discharge
m1
nm1 im
i1
n
bdischarge
EOEC
1
y 'n2 i
i1
n
... m * y(m)b
discharge
m1
nm1 im
i1
n
Here, n is the number of batches used in the fuel cycle and an mth-order polynomial is used to model
reactivity as a function of burnup.
Comparing the maximum discharge burnups estimated with the IEDS to the NLRM (assuming a second-order polynomial representation of burnup-dependent reactivity) plotted with their respective uncertainties, one can see that values predicted by the NLRM fall within the confidence interval of the IEDS as shown in Fig. D.4. The uncertainties in the maximum discharge burnup for the NLRM method were calculated assuming an uncertainty in the predicted reactivity of 860 pcm, the maximum difference between predicted reactivity using NLRM and observed EOEC reactivity using IEDS.

D-9
Fig. D.4. Comparison of the maximum discharge burnup predicted by the nonlinear reactivity model assuming a second-order polynomial regression for burnup-dependent reactivity to the iterative equilibrium depletion search.
CONCLUSIONS
Two methodologies were developed to estimate the maximum discharge burnup in multibatch refuel cycles, and their results agree within uncertainty. IEDS methodology completely defines the equilibrium fuel cycles, including the power history throughout the core, composition evolution, and system keff trajectory, but it is computationally intensive. The NLRM methodology can be used to quickly estimate the maximum discharge burnup with an uncertainty of ~4.5% and is orders of magnitude times faster than the IEDS methodology. The best approach to utilizing these methodologies in fuel cycle design is to use the NLRM method for parametric studies to identify maximum burnups and refueling intervals, thus identifying an optimized fuel cycle, and then use the IEDS to confirm these results and study this optimized fuel cycle in detail.
WORKS CITED IN APPENDIX D
1. Elimination of Double-Heterogeneity Through a Reactivity-Equivalent Physical Transformation. Kim, Yonghee. 2005. Global 2005.
2. Hollenbach, D. F. KENO-VI: A General Quadratic Version of the KENO Program. Oak Ridge National Laboratory. s.l. : RSICC, 2009.
3. DeHart, M. D. TRITON: A Two-Dimensional Transport and Depletion Module for Characterization of Spent Nuclear Fuel. Oak Ridge National Laboratory. s.l. : RSICC, 2009.
4. Gauld, I. C. ORIGEN-ARP: Automatic Rapid Processing for Spent Fuel Depletion, Decay, and Source Term Analysis. Oak Ridge National Laboratory. s.l. : RSICC, 2009.
D-10
5. Goluoglu, S., Hollenbach, D.F., Landers, N. F., Petrie, N. F., Bucholz, J. A., Weber, J. A., Hopper, C. M. The Material Information Processor for SCALE . Oak Ridge National Laboratory. s.l. : Oak Ridge National Laboratory, 2009.
6. "Optimization of One-Pass Transuranic Deep Burn in a Modular Helium Reactor." Kim, Yonghee and Venneri, Francesco. 2008 йил, Nuclear Science and Engineering, Vol. 160, pp. 59-74.
7. Oak Ridge National Laboratory. TRITON: A Two-Dimensional Transport and Depletion Module for Characterization of Spent Nuclear Fuel . 2009.
8. Driscoll, M. J. The Linear Reactivity Model for Nuclear Fuel Management. s.l. : American Nuclear Society, 1991.
9. Greene, S. R., Gehin, J. C., Holcomb, D. E. et al. Pre-Conceptual Design of a Fluoride-Salt-Cooled Small Modular Advanced High-Temperature Reactor (SmAHTR). Oak Ridge National Laboratory. Oak Ridge, TN : s.n., 2010. ORNL/TM-2010/199, December 2010.

ORNL/TM-2011/365
INTERNAL DISTRIBUTION
1. B. J. Ade 2. S. J. Ball 3. G. L. Bell 4. J. L. Binder 5. S. M. Bowman 6. T. W. Burgess 7. J. T. Busby 8. J. J. Carbajo 9. M. S. Cetiner 10. M. E. Dunn 11. G. F. Flanagan 12. J. C. Gehin 13. S. R. Greene 14. R. E. Grove 15. T. J. Harrison 16. D. E. Holcomb 17. J. E. Hubbs 18. J. D. Hunn
19. D. Ilas 20. D. T. Ingersoll 21. Y. Katoh 22. D. B. Kothe 23. G. T. Mays 24. G. Muralidharan 25. F. J. Peretz 26. C. V. Parks 27. A. L. Qualls 28. W. Ren 29. S. Sham 30. L. L. Snead 31. M. P. Trammell 32. V. K. Varma 33. J. C. Wagner 34. D. F. Wilson 35. G. L. Yoder 36. S. J. Zinkle
EXTERNAL DISTRIBUTION
37. J. E. Kelly (DOE/NE) 38. D. C. Welling (DOE/NE) 39. S. J. Golub (DOE/NE) 40. B. K. Robinson (DOE/NE) 41. M. A. Hutmaker Jr. (DOE/NE) 42. R. N. Hill (ANL) 43. C. Grandy (ANL) 44. G. E. Rochau (SNL) 45. P. F. Peterson (UCB) 46. A. T. Cisneros (UCB) 47. R. Scarlat (UCB) 48. R. P. Kelly (TAMU) 49. C. W. Forsberg (MIT) 50. L. Hu (MIT) 51. T. R. Allen (UWM)
52. M. H. Anderson (UWM) 53. C. Rodriguez (GA) 54. R. Schleicher (GA) 55. M. W. Patterson (INL) 56. P. Sabharwall (INL) 57. J. E. Goossen (Westinghouse) 58. M. G. Anness (Westinghouse) 59. Paul Murray (AREVA) 60. Kim Stein (AREVA) 61. Bojan Petrovic (GIT) 62. X. Sun (OSU) 63. J. Uhlir (NRI—Czech Republic) 64. P. K. Vijayan (BARC—India) 65. H. Boussier (CEA—France)