Embed Size (px)
Citation preview

A NEW APPROACH TO PILOT RATING SCALES
Coral Vance Schufeldt


United StatesNaval Postgraduate School
THESISA NEW APPROACH TO PILOT RATING SCALES
by
Coral Vance Schufeldt
Thesis Advisor: D. M. Layton
T/¥C ?S3September 1971
Approved {^on. pubtic ^c-deaie; dL&tnJJouZlon ijntinxitzd.


A New Approach to Pilot Rating Scales
by
Coral Vance SchufeldtLieutenant Commander, United States NavyB. S. , United States Naval Academy, 1963
Submitted in partial fulfillment of therequirements for the degree of
MASTER OF SCIENCE IN AERONAUTICAL ENGINEERING
from the
NAVAL POSTGRADUATE SCHOOLSeptember 1971

ABSTRACT
An examination and comparison of pilot rating scales presently
in use and an investigation into the possibilities of a linear rating
scale were conducted. The hypothesis was advanced that a rater
may transpose his impression of performance directly to a non-
adjectival, non-ordinal rating scale and thereby relate his psycholog-
ical continuum to a numerical index. Experimental data, though
limited, tended to support this hypothesis.

table of contents
i. introduction 7
ii. history 9
a. early developments 9
b. cooper scale 9
c. harper scale 12
d. harper scale adaptation 14
e. cooper-harper scale 14
f. McDonnell scale 18
g. contemporary research 21
h. summary 23
iii. human response 26
a. introduction 26
b. test equipment 27
c. testing procedure 27
d. results and discussion 30
1. Question Formulation 30
2. Linearity 31
3. Rating Analysis 33
4. Scale Preference 35
5. Recommendations 37
E. CONCLUSIONS 37
APPENDIXA 39
APPENDIX B 41
BIBLIOGRAPHY 43

TABLE OF CONTENTS(Continued)
INITIAL DISTRIBUTION LIST 44
FORM DD 1473 45


LIST OF TABLES
I. Rater Questionnaire 29
II. Rater Performance -Rating Correlation Factor 32

list of figures
1. cooper scale 10
2. factors affecting pilot opinion 10
3. harper scale 13
4. pilot comment cards 15
5. cooper-harper scale 17
6. McDonnell scale 20
7. conrad scales 22
8. pilot response 23
9. even-steven 28
10. group rating curves 34
11. average rating curves 36

I. INTRODUCTION
With the advent of flight vehicles with operating envelopes ranging
from terra firma to the threshold of space and beyond, the environ-
mental and dynamic spectrums encountered on a single flight are
all-encompassing. Man is the low frequency response component
[Ref. 1] in the overall closed-loop man-ma chine system, therefore,
control systems must be designed within manageable limits. In short,
the effort expended in vehicle control must be minimized so that the
pilot may be free to complete other duties in the cockpit.
Consequently, the suitability of a machine system to serve its
intended mission is ultimately determined by a series of evaluations.
Tbe 'most difficult of these assessments occurs at the man-machine
system interface.
Pilot evaluation of handling qualities determines the suitability
of the machine system, yet there remains to be found a set of
universally acceptable parameters for this evaluation. The complete
nature of a pilot's task, work load, mental stress and acuity have
not been described in any form of analytically determined transfer
function or performance index [Ref. 2]. It is assumed, however,
that there exists a relationship betweerl pilot comment and perfor-
mance and/or vehicle handling qualities.
Efforts to standardize the qualitative aspects of language into
a quantitative handling quality rating have been made. It is the
purpose of this study to examine and compare the rating scales

presently in use and to investigate the possibilities of a linear rating
scale with its inherent advantages.

H. HISTORY
A. EARLY DEVELOPMENTS
During the early 1930's when aviation was maturing, the need to
delineate acceptable aircraft parameters was recognized. Consequently,
a "check list" for this purpose was proposed by Edward P. Warner
[Ref. 3]. Subsequent work by Soule ' and by R. R. Gilruth at the
Langley Laboratory of NACA condensed these requirements and a
set of specifications for military aircraft acceptance eventually
resulted [Ref. 4].
After this initial break-through in establishing aircraft specifica-
tions, emphasis was placed on devising pilot opinion ratings aimed at
specific problem areas. The concept of a general pilot rating received
little attention.
B. COOPER SCALE
In 1957 at the annual meeting of the Flight Testing Session,
Institute of Aeronautical Sciences, Ames 1 Chief Research Pilot George
E. Cooper introduced a generalized pilot rating scale which enjoyed
immediate and almost total acceptance [Ref. 5]. This epoch scale
(Fig. 1) synthesized the previous work of NACA Langley and thereby
provided an authenticated scale which could be applied to any aircraft
handling qualities evaluation. It was the first rating scale to associate
the qualitative nature of pilot opinion with a quantitative index.
In applying this scale, it was recommended that the evaluator
pay particular attention to question formulation (Fig. 2). The


J
f ADJECTIVE
RATINC
NUMERICAL
RATINGDESCRIPTION
PRIMARY CAN BE 1
MISSION LANDED
rNORMAL
OPERATIONSatisfactory
1
2
3
Excellent, lncludea optimum
Cood, pleasant to fly
Satisfactory, but vlth some mildlyunpleaaant characteristics
Yea Yes
Yea Yes
Yes Yes
EMERGENCY
OPERATIONUnaatlafactory
4
5
6
Acceptable, but vlth unpleasantcharacteristics
Unacceptable for normaloperation
Acceptable for emergencycondition only*
Yes Yes
Doubtful Yes
Doubtful Yes
NO
OPERATION
VUnacceptable
7
8
9
Unacceptable even for
emergency condition*
Unacceptable - Dancerous
Unacceptable - Uncontrollable
No Doubtful
No No
No No ,
1^_ 10 "Motions possibly violent enough (
to prevent pilot escape' J
'Failure of stability augment rr
COOPER SCALE
FIGURE 1
QUESTION FOPMULATION
ANSWERING THE QUESTION
WEIGHING THE ANSWER BY
CONSIDERATION OF FILOT'S
>>
Selection of proper tasl or maneuverAmhipulty - Tllot responsibility
Use of wordsStandardized ratine system
PRESENT VIEWPOINT^ Current duties and responsibilities
EXPERIENCE "^ Training - Types of aircraft flovn
ADAPTABILI TY ^> Human resourcefulness and capacity
INITIAL IMPRESSIONS
LEARNING CURVE I
PILOT WORK
USE OF GROUND SIMULATORS > As a research tool
Invalidating assumptionsPilot responsibility
FACTOPS AFFECTING PILOT OPINION
FIGURE 2
10

question had to be sufficiently specific so as to minimize interpreta-
tion and ambiguity.
The pilot, in answering the question, was required to channel his
exposure, sensations and reactions into the scale vocabulary by first
considering four handling qualities categories: Satisfactory, Unsatis-
factory, Unacceptable and Unprintable. As may be noted from Figure 1,
these categories were separated, for description purposes, at the
approximate values 3. 5, 6. 5 and 9- 5 respectively. Within each cate-
gory, the pilot was required to further define his opinion in terms of
the scale vocabulary and a secondary mission (landing).
Once the pilot had formulated his opinion with respect to the scale,
his evaluation had to be weighted in consideration of his viewpoint,
experience and adaptability. For example, a patrol pilot might evalu-
ate the stall-associated buffet and departure in a fighter as "Unaccep-
table-Dangerous" (numerical rating 8); whereas, a fighter pilot might
evaluate the same characteristics as "Satisfactory, but with some
unpleasant characteristics" (numerical rating 3). Then, with some
exposure, the same two pilots might reevaluate the characteristics
at 4 and 2 respectively. The rating scale was, therefore, very subject
to experience and adaptability. To eliminate this deficiency and to
provide some measure of consistency, it was suggested that the scale
be used only by test pilots.
Though the Cooper Scale had claim to primacy, it was ambiguous
in its definitions and complicated in that it placed stipulations on pilot
opinion. It would appear that the scale was designed to evaluate
aggregate handling qualities.
11

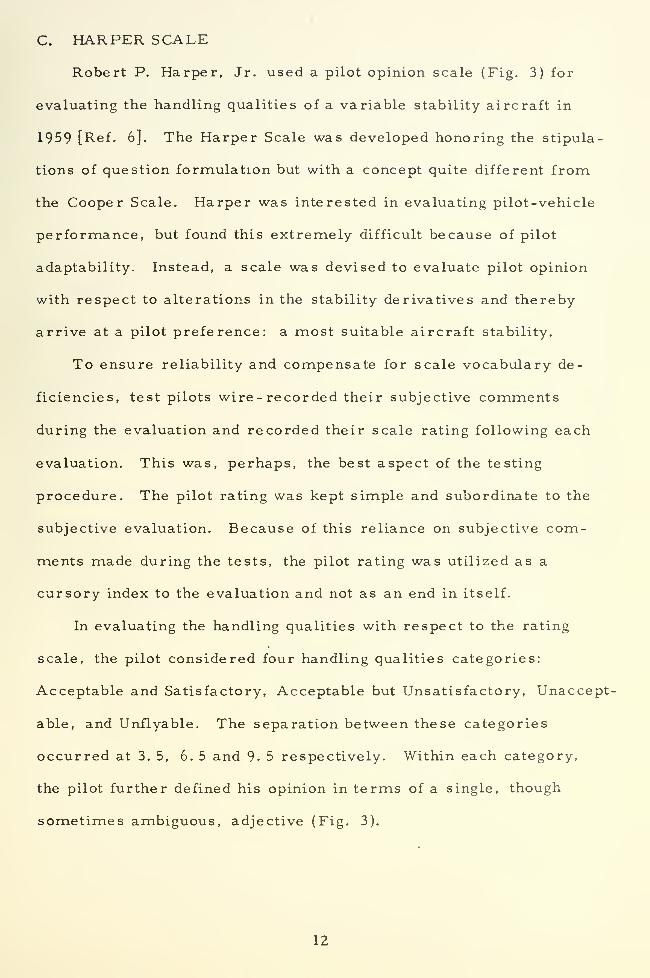
C. HARPER SCALE
Robert P. Harper, Jr. used a pilot opinion scale (Fig. 3) for
evaluating the handling qualities of a variable stability aircraft in
1959 [Ref. 6], The Harper Scale was developed honoring the stipula-
tions of question formulation but with a concept quite different from
the Cooper Scale. Harper was interested in evaluating pilot-vehicle
performance, but found this extremely difficult because of pilot
adaptability. Instead, a scale was devised to evaluate pilot opinion
with respect to alterations in the stability derivatives and thereby
arrive at a pilot preference: a most suitable aircraft stability.
To ensure reliability and compensate for scale vocabulary de-
ficiencies, test pilots wire- recorded their subjective comments
during the evaluation and recorded their scale rating following each
evaluation. This was, perhaps, the best aspect of the testing
procedure. The pilot rating was kept simple and subordinate to the
subjective evaluation. Because of this reliance on subjective com-
ments made during the tests, the pilot rating was utilized as a
cursory index to the evaluation and not as an end in itself.
In evaluating the handling qualities with respect to the rating
scale, the pilot considered four handling qualities categories:
Acceptable and Satisfactory, Acceptable but Unsatisfactory, Unaccept-
able, and Unflyable. The separation between these categories
occurred at 3. 5, 6. 5 and 9- 5 respectively. Within each category,
the pilot further defined his opinion in terms of a single, though
sometimes ambiguous, adjective (Fig. 3).
12

rCATEGORY
ADJECTIVE DESCRIPTION
WITHIN CATEGORY
NUFEPICAL <
RATING
Acceptableand
Satisfactory
ExcellentGoodFair
1
2
3
Acceptablebut
Unsatisfactory
FairPoorBad
4
5
6
UnacceptableBad*Very bad-*Dangerous***
7
8
9
i Unflyable Unflyable 10 J*Requires major portion of pilot's attention**Controllable only with a minimum of cockpit duties***Aircraft just controllable vith complete attention
HARPER SCALE
FIGURE 3
13


D. HARPER SCALE ADAPTATIONS
In contrast to the Cooper Scale, the Harper Scale (often cited
as the Cornell or CAL Scale because of its extensive use by Cornell
Aeronautical Laboratory, Inc. ) was designed as an index for evalua-
ting particular and highly restricted handling qualities. Efforts to
adapt the CAL Scale to the evaluation of aggregrate handling qualities
met with varied success.
One such example was the application made by Michael L. Parrag
in 1967 [ Ref. 7] in studying the effects on handling qualities of higher-
order response characteristics against a background of varying
conditions and associated mission tasks.
To facilitate more reliable and consistent pilot comments, the
test pilots were provided with a comment check list for the two flight
conditions (Fig. 4), and instructed to make subjective comments
following each test run. After all tasks were completed, a compre-
hensive subjective report was required incorporating all the salient
features of each configuration. Finally, an objective report using
the comment check list was made.
Here, as in Ref. 4, emphasis was placed on subjective comments.
Task-oriented objective comments were used to provide consistency
and point out features of each task which might otherwise have been
overlooked. Although the CAL Scale was used as an index to pilot
opinion, it was, for all practical purposes, insignificant in evaluating
the handling qualities investigated.
E. COOPER-HARPER SCALE
With wide and independent usage of the Cooper and Harper Scales
14


APP POACH COMMENT CARD
1. IS THE AIRPLANE DIFFICULT TO TRIM?
2. IS ATTITUDE CONTPOL SATISFACTOPY?TENDENCY TO OVERCONTROL?
3. IS MAINTAINING ALTITUDE A PROBLEM?a) STRAIGHT AND LEVELb) TLRNS
A. IS MAINTAINING AIRSPEED A PROBLEM?
5. WERE GLIDE SLOPE EPRORS E/SILY CORRECTED?WAS IT DIFFICULT TO MAINTAIN GOOD GLIDESLOPE CONTPOL?
6. WHAT INSTRUMENTS ARE YOU USING MOST?
7. COULD YOU MAKE AN INSTRUMENT LANDING APPPOACHWilli THIS CONFIGURATION AT THE SPEED OF 125 KNOTS?
8. PILOT RATING - ADJECTIVES - NUMBER - WHY?
HIGH ALTITUDE COMMENT CARD
1. IS THE AIRPLANE DIFFICULT TO TRIM?
2. IS ATTITUDE CONTROL SATISFACTORY? TENDENCY TO OVEFCONTROL?
3. IS NORMA.L ACCELERATION CONTROL A PROBLEM?
4. IS HOLDING ALTITUDE A PROBLEM?a) STRAIGHT AND LEVELb) TURNS
5. ARE THERE ANY DIFFICULTIES IN FLIGHT PATH CONTROLDURING THE CLIMBING AND DESCENDING TURNS?
6. ARE THERE ANY PPOBLEMS ASSOCIATED WITH THETRACKING TASK?
7. PILOT RATING - ADJECTIVES - NUMBER - WHY?
PILOT COMMENT CARDS
FIGURE A
15

the problems previously cited for each were sources of confusion in
application. It became increasingly apparent that an acceptable
composite rating system incorporating the best features of each
scale would be advantageous.
To this end Cooper and Harper jointly advanced a revised rating
scale in 1966 [Ref. 8]. This scale (Fig. 5), hereafter referred to
as the Cooper-Harper Scale, enjoyed general acceptance and prefer-
ence over the previous scales; however, the various implementing
institutions voiced a need for clarification in semantics and in applica-
tion. In 1969 an explicitly comprehensive joint report was published
to modify and clarify the Cooper-Harper Scale [Ref. 9]- The report
precisely defined flight evaluation terminology and discussed the
aspects of question formulation and scale data application.
Based on the voluminous data and comments available from
international audiences of the Cooper and Harper Scales, the Cooper
-
Harper Scale was excellently designed as a dichotomous procedure
of evaluation. A pilot, in evaluating a handling quality, systematically
chose between two alternatives which channeled his consideration into
a rating category or into another dichotomous decision with the same
channeling result. Through this simplified procedure (compare with
the relative complexity of previously discussed procedures) three of
four existing categories were eliminated! without ever considering
the applicable descriptive adjectives.
The inverted ten-point scale was retained in the interests of
consistency. An ordinal sequence varying in magnitude with the
degree of "goodness" would seem more appropriate; however,
audiences of the previous scales had become accustomed to the
16


h*zo<cr
goUJcr
=)
o
o £
IUJ OO £
i_>
UJ_lUJl/>
Z
COaCO
orUJt-
<<io
u.<or
or
f
or
\
O*:
55r- zoo r-UJ <(- rru iiiUJ n_JUlO
CO Qoro
UJor
u )oV UJ
u ir<
)oUJQ<
I J
O a)c <_>
cc o2 E
S £C w-
a> oja. a.
o in
0. T3
-Oo
0)
I
b a,u
c Co o- £O w</> oC T-<U a,
o
CL T3
I ^
0)
-9
>* r
o "o
E £
o>
at<j cC Oo sE ofc_ COO C* <u
u aa. E
oo o0)
in oO) ^O Q.
— 0>
if)
2 o
o tc oo oE -
"t; °-
o a>3 T3
ST'i
3 s
82.oo
CO
cr
E 2
1> a)
£ §o o3Cr _<X) oTD —< a
0> Os £c oo »z— o><-> "Ooj_
jo *>
o XIo
>. •->_ <u
« o
r~ Ar^- 00 <T>
•o01
j= .b o33 cr
01c hi T3
o> o 01
xioc
oc
in
c
'5cr
o UJ c o1
1
o F a l/>
o </> </>
oc
u
o
0>3cr
cQJQ.
co
0) E o<->
c CL c o </)
o c
Eo
o>
-Oo
oc o
a>a.
Eo
o>CD >s a. oO
a. jz a> t; c>
ED
JOo g s
o i:
5- 13 fc
XOE
o 4) C oC7
<co
-o O5 °c° o
01
£ E
C a,
•• •
IS 01 su o ya> ai d> |
o o u0) <W a>u TO TD
o & 6
5 io5
V. >
5 I
CO
DC!
c W trioocen
S tjj
^DC!
w> i O0)
(Si Mw fc
in /^ .
a>> oO o>c
u
•o -oJ ch o
17

inverted scale and a reordering of the numerical indices would have
resulted in unnecessary confusion. To further ease the transition
from previous scales, the boundaries of 3. 5, 6. 5 and 9. 5 were
retained.
It would appear that a satisfactory method for assessing the
man-machine interface had been achieved; but not quite. Although
the Cooper-Harper Scale continues to be the most widely used
evaluation system to date, it remains insensitive at the bad end and
does not exhibit the desirable feature of linearity. Linearity is that
feature of a rating scale which will allow the averaging of data
ensembles without distorting the data sample interpretation.
f. McDonnell scale
In 1968, J. D. McDonnell published his study of rating techniques
[Ref. 10]. His objective was to evolve a rating scale which had an
underlying linear structure to facilitate mathematical operations on
pilot data. This underlying structure required the discipline of
psychophysics for determination.
Although a detailed examination of psychophysics is beyond the
scope of this study, the basic theory is presented for clarification.
If an objective measure is made upon some object, the resulting data
must lie along some physical continuum. If an evaluator estimates
a measure, the measure is subjective and must lie along some
psychological continuum. The relationship between these two con-
tinua, if it could be determined, would provide a means of linear-
izing the subjective scale.
18

To establish an intervaled psychological continuum, a list of
sixty-four appropriately descriptive phrases were randomly sub-
mitted to sixty-three raters. For each phrase, the raters were
instructed to indicate their impression of a hypothetical vehicle
so described on a plot with the end points of "most favorable" and
"least favorable". The data were then processed by the methods
of psychophysics and successive intervals and assigned a relative
standing on a scale of nine. The data were further reduced to the
arbitrary seven-point McDonnell Scale depicted in Figure 6.
The McDonnell Scale (often called the Global Rating Scale be-
cause it related aggregate handling qualities) was, therefore,
presumed to be a linear scale of constant subjective sensitivity
reflecting the resolving power of raters to distinguish semantic
differences. Because it was related to a seven-point scale in
contrast to the ten point scales with which users were familiar, it
was not accepted with any noticeable exuberance.
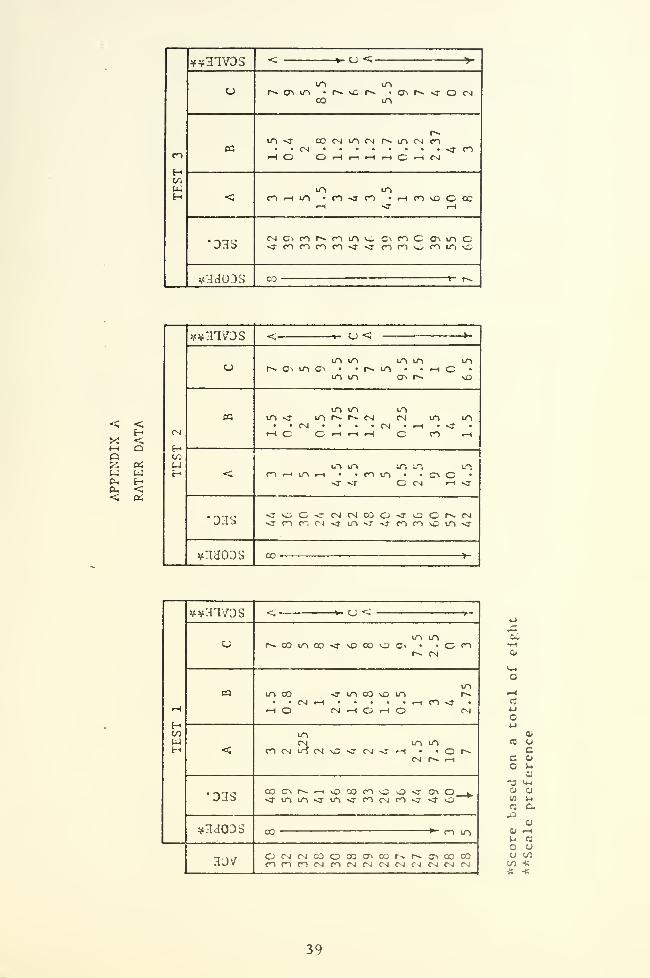
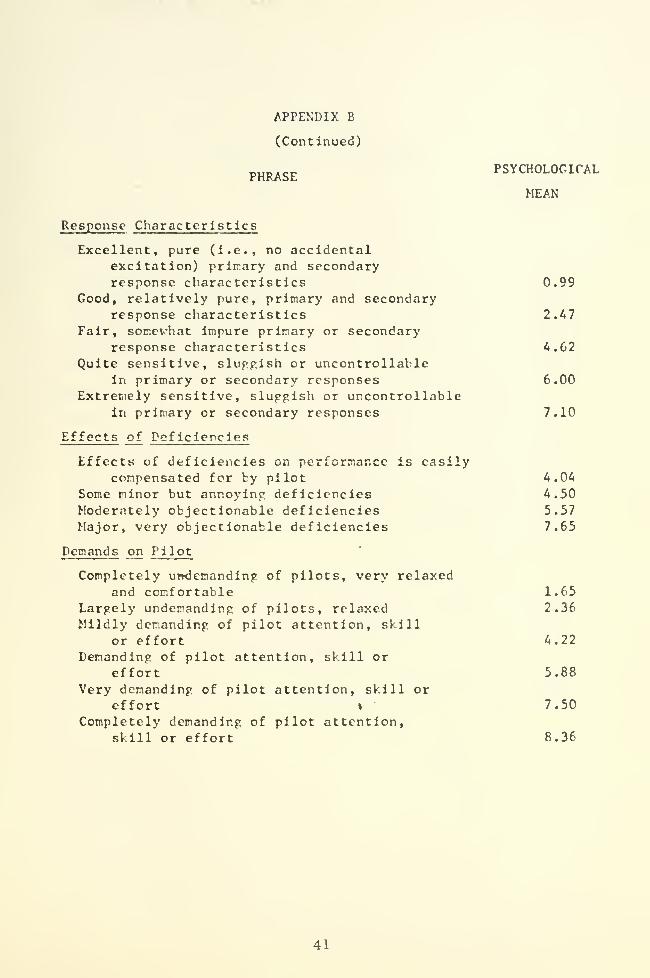
The truely important contribution made by McDonnell was the
list of evaluation phrases related to an index of nine and reflecting
psychological sensitivity. The phrases were divided into six
categories: Handling Qualities, Control, Precision, Response
Characteristics, Effects of Deficiencies, and Demands on Pilot.
Through the use of this listing, specialized linear scales may be
constructed to satisfy particular rating requirements.
^ee APPENDIX B.
19


FAVORABILITY OF HANDLING QUALITIES
C_
— — Excellent
__ — Highly Desirable
Good
— Fair
Poor
Bad
Nearly Uncontrollable
Uncontrollable
MCDONNELL SCALE
FIGURE 6 k
20

G. CONTEMPORARY RESEARCH2
In designing the washout circuitry for the Ames All-Axis Motion
Generator, it became necessary and expedient to solicit pilot opinion
in determining the "best" set of parameters to use in a given con-
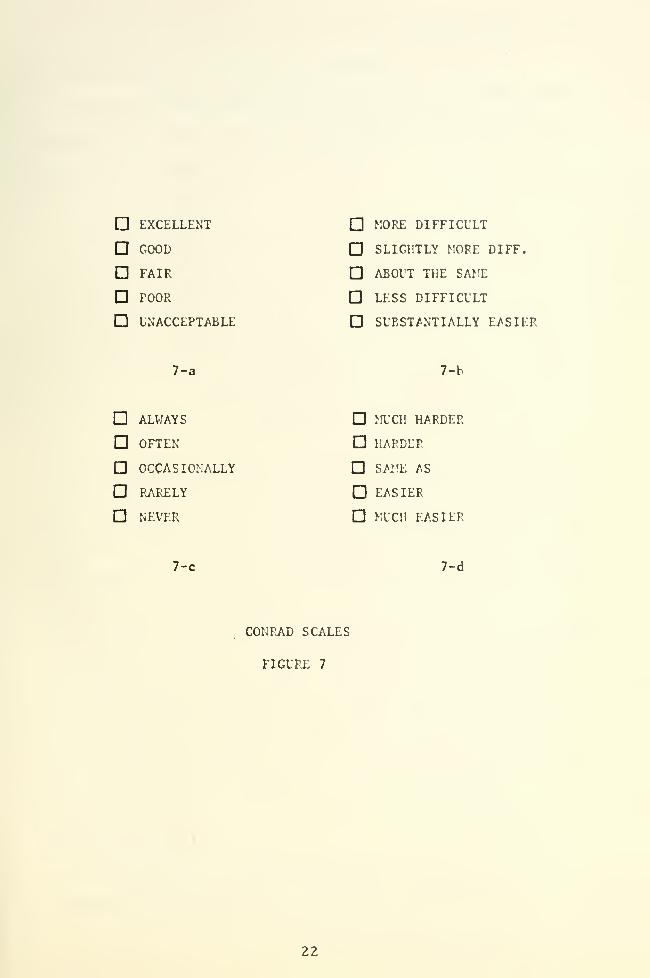
figuration. To this end, S. F. Schmidt and Bjorn Conrad [Ref. 11]
used three non-ordinal, relative rating scales in their evaluations
(Fig. 7-a,b, c).
The questions related to each scale were particularly tailored to
the descriptive adjectives shown and they were simple in nature. By
using pilot comments as an index, the design providing the best over-
all simulator characteristics was obtained. However, moderate
changes in the washout circuitry initially selected did not alter pilot
opinion during subsequent testing.
It would appear that one or both of the following factors were
responsible for the inability of rating pilots to distinguish minor
changes in simulator characteristics:
1. The evaluation task was insensitive to minor changesin system response
2. The rating scale adjectives were too widely separatedon psychological continuum.
3During a personal interview Conrad discussed the work on which
he had reported in Ref. 11. In determining the best washout circuitry
the pilot ratings extracted from his scales were heavily supplemented
2That servo circuitry of an all-axis motion simulator which
provides for returning the simulator to its initial position after beingdisturbed. It is important that this function be executed at a rate
below a pilot's sensing threshold.
3 Interviewed on 10 May 1971 at Analytical Mechanics AssociatesInc. of Palo Alto, California.
21

D EXCELLENT
Q GOOD
D FAIR
D POOR
D UNACCEPTABLE
MORE DIFFICULT
D SLIGHTLY MORE DIFF.
ABOUT THE SAME
D LESS DIFFICULT
SUBSTANTIALLY EASIER
7-a 7-b
ALWAYS
OFTEN
Q OCCASIONALLY
D RARELY
NEVER
MUCH HARDER
HARDER
SAME AS
EASIER
MUCH EASIER
7-c 7-d
CONRAD SCALES
FIGURE 7
22


with debriefs. It was primarily through this method of pilot interview
that the best washout circuitry was obtained.
He observed that pilots rapidly adapted to minor configuration
changes without altering their rating, and he described this lack of
sensitivity as a rating plateau (Fig. 8).
y \/ \
/ \
Pe rformance
PILOT RESPONSE
Figure 8
He additionally noticed that a pilot's impression of his mean
performance changed from day to day. This, therefore, required
that at least one test run utilizing the "standard" washout circuitry
be conducted to reestablish the pilot's mean performance, a time-
consuming and costly procedure.
Conrad's present work, an extension of that above, tasks pilots
with flying formation on the television display of a six-degree of
freedom simulated tanker aircraft. It is his hope that this relative
position task will prove to be sufficiently sensitive and thereby
provide reliable pilot ratings on the scale depicted in Figure 7-d.
H. SUMMARY
The rating scales which have been reviewed fall into the two
categories, as distinguished according to purpose, of aggregate and
23

relative handling qualities evaluations. The first category consists
of the Cooper and Cooper-Harper Scales; whereas, the latter consists
of the Karper, McDonnell and Conrad Scales.
4During a personal interview Cooper related the circumstances
stimulating the evolution of his Scale. While evaluating a variable
stability F6F Wildcat the project engineers had an understandable
tendency to mathematically manipulate the flight data in the course
of its reduction; however, the conclusions derived therefrom did not
necessarily reflect the pilot's interpretation of the actual handling
qualities encountered. To eliminate this inadvertent misinterpreta-
tion of flight data, the Cooper Scale was designed.
When Cooper presented his Scale at the annual meeting of the
Institute of Aeronautical Sciences it was immediately accepted and
internationally implemented as an aggregate evaluation scale. Though
the Cooper Scale was not designed for this purpose, international
usage determined its application.
In the collaborative effort to develop the Cooper-Harper Scale,
Harper advocated a relative evaluation scale; however, the various
implementing institutions preferred a scale applicable to aggregate
evaluations and the dichotomous scale resulted.
The Harper and Conrad Scales were obviously designed to
evaluate relative handling qualities and no further discussion is
necessary.
The McDonnell (or Global) Scale was designed as an aggregate
rating scale; however, because of its syntactical simplicity it could
4Interviewed on 10 May 1971 at the Ames Research Laboratory,
NASA, NAS Moffett Field, California.
24

be applied only to relative evaluations (see Fig. 6). The sixty-three
psychologically intervaled phrases resulting from McDonnell's re-
search, however, were applicable to both aggregate and relative
handling qualities evaluations.
In evaluations utilizing any of the rating scales except the Cooper
Harper Scale subjective pilot comment was required to provide
meaningful evaluation data.
25

III. HUMAN RESPONSE
A. INTRODUCTION
The Cooper-Harper Scale was excellently designed and remains
the best aggregate rating scale in existence because of its dichotomous
nature and its acceptance as the international standard. However, it
was specifically designed so as not to facilitate the averaging of
ratings [9].
With the advent of greater sophistication in aircraft research
and development, it has become increasingly important to evaluate
the relative "goodness" of aircraft components and subsystems. It
is assumed that a highly desirable aerospace vehicle may be designed
and built; however, a rating scale capable of reliably determining the
acceptance or rejection of one highly desirable system over another
is yet to be evolved. It is the purpose of this section to investigate
the possibility of such a rating scale.
For a scale to effectively reflect minor differences in performance,
extreme sensitivity is desired. The inherent advantages of linearity
are also desired to facilitate mathematical operations on a limited
ensemble and thereby suppress research and procurement costs.
The hypothesis of this investigation1 is that a linear rating scale
coincident with the psychological continuum begets sensitivity. The
psychological continuum was investigated [10] and resulted in the
McDonnell Scale, but, as may be noted from Figure 6, descriptive
adjectives and/or phrases did not align cardinally. This, then,
provided a source of confusion because the numerical value associated
26

with the adjective might not coincide with the rater's psychological
continuum. Were this source of syntactic confusion eliminated, the
rater could transpose his impression of performance directly to a
rating scale and thereby relate his psychological continuum to a
linear numerical index. Additionally, if allowed to fractionalize his
rating, sensitivity would be limited only by the rater's discriminate
5dispersion and frustrations.
To investigate this hypothesis, a simple puzzle was selected and
submitted to the analytically inclined students in the Department of
Aeronautics of the Naval Postgraduate School. Upon completion of
the test, or at the expiration of an allotted time, the subjects were
asked to rate their impression of the difficulty they encountered in
working the puzzle on three numerical scales.
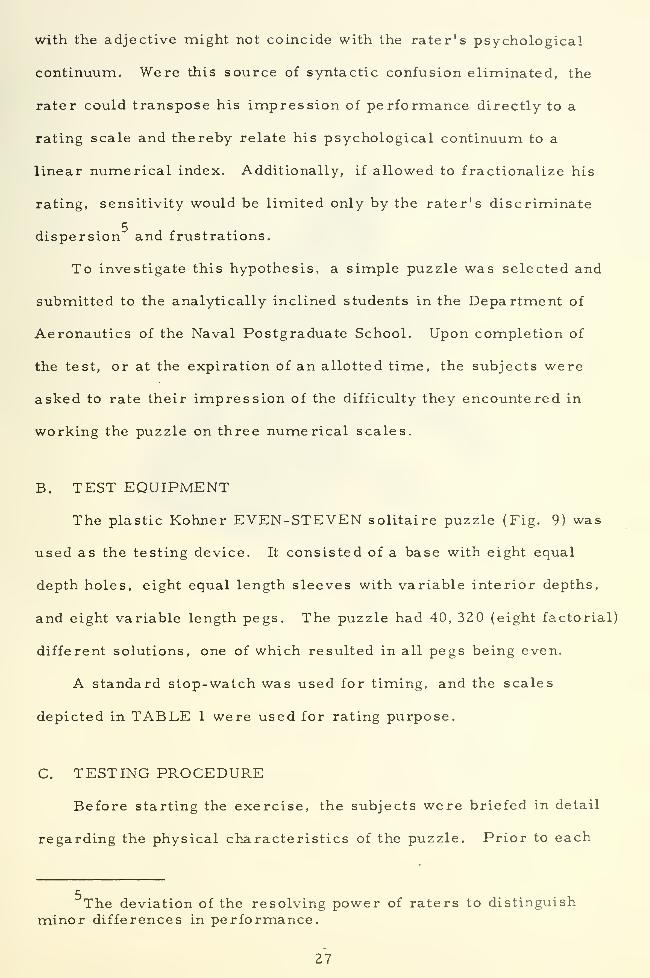
B. TEST EQUIPMENT
The plastic Kohner EVEN-STEVEN solitaire puzzle (Fig. 9) was
used as the testing device. It consisted of a base with eight equal
depth holes, eight equal length sleeves with variable interior depths,
and eight variable length pegs. The puzzle had 40, 320 (eight factorial)
different solutions, one of which resulted in all pegs being even.
A standard stop-watch was used for timing, and the scales
depicted in TABLE 1 were used for rating purpose.
C. TESTING PROCEDURE
Before starting the exercise, the subjects were briefed in detail
regarding the physical characteristics of the puzzle. Prior to each
5The deviation of the resolving power of raters to distinguish
minor differences in performance.
27

EVEN-STEVEN
FIGURE 9
28

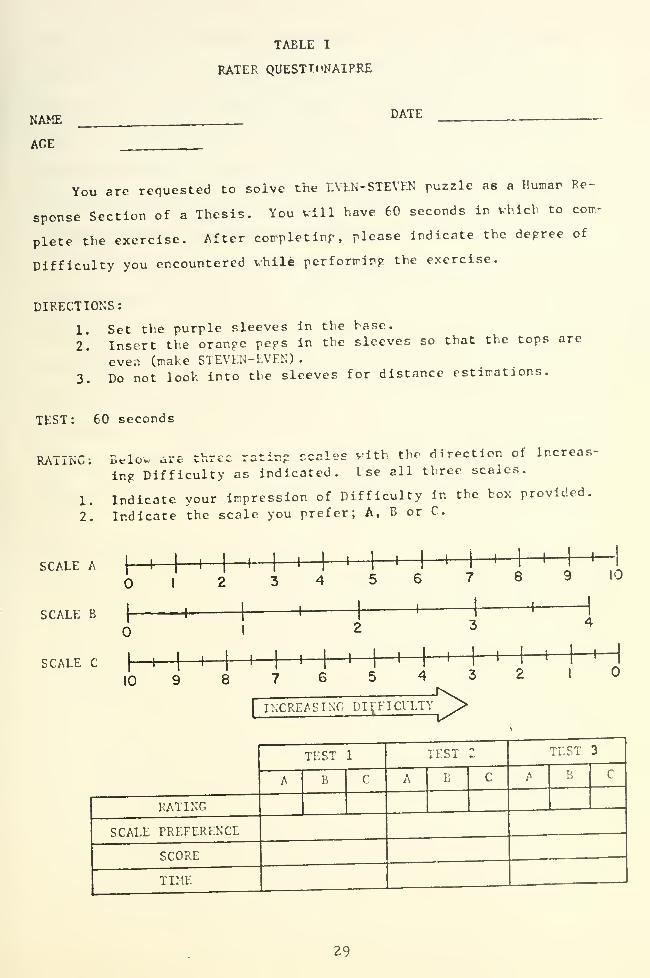
TABLE I
RATER QUESTTONAIPRE
NAME
AGE
DATE
You are requested to solve the EVEN-STEVEN puzzle as a Human Re-
sponse Section of a Thesis. You will have 60 seconds in which to com-
plete the exercise. After completing, please indicate the degree of
Difficulty you encountered vhile performing the exercise.
DIRECTIONS:
1. Set the purple sleeves in the base.
2. Insert the orange pegs in the sleeves so that the tops are
even (make STEVEN-EVEN)
.
3. Do not look into the sleeves for distance estimations.
TEST: 60 seconds
_.
.
„ „ ,_ .. «-v,-r«e ...,..,•„,> r.,- c ioe yith the direction of Increas-
ing Difficulty as indicated. I se all three scales.
1. Indicate your impression of Difficulty in the box provided.
2. Indicate the scale you prefer; A, B or C.
SCALE A 1I 1 I |
I 1 1I
' 1 ' I ' 1 ' 1I
112 3 4 5 6 7 8 9 10
SCALE B |- I
SCALE C1
I 1I
1I
1I
1
I1 ' 1 ' 1 1 ' 1 '
J8 7 6 5 4 3 2 10
INCREASING DIFFICULTY J^>
RATING
SCALE PREFERENCE
SCORE
TEST 1
B
TIME
TEST 2 :est 3
29

test the pegs and sleeves were removed from the base and mixed ran-
domly within a box before the subject. The exercise was started on
the proctor's "mark" with the subject's hands poised over the box.
At test completion the time was recorded or, if the subject did not
complete the test in 60 seconds, the number of even pegs, regardless
of height, was recorded. The elapsed time or number of even pegs
was the basis for determining performance.
The subject was then asked to rate his impression of the difficulty-
he encountered in working the puzzle witli respect to all three scales
on the RATER QUESTIONNAIRE (TABLE 1), and to indicate his rating
in the box provided. This procedure was repeated twice to provide
for three tests. When subjects inquired as to the degree of difficulty
associated with scale end points, they were briefed that this deter-
mination was the rater's responsibility. By so doing, the rater's
personal psychological continuum was enjoined.
D. RESULTS AND DISCUSSION
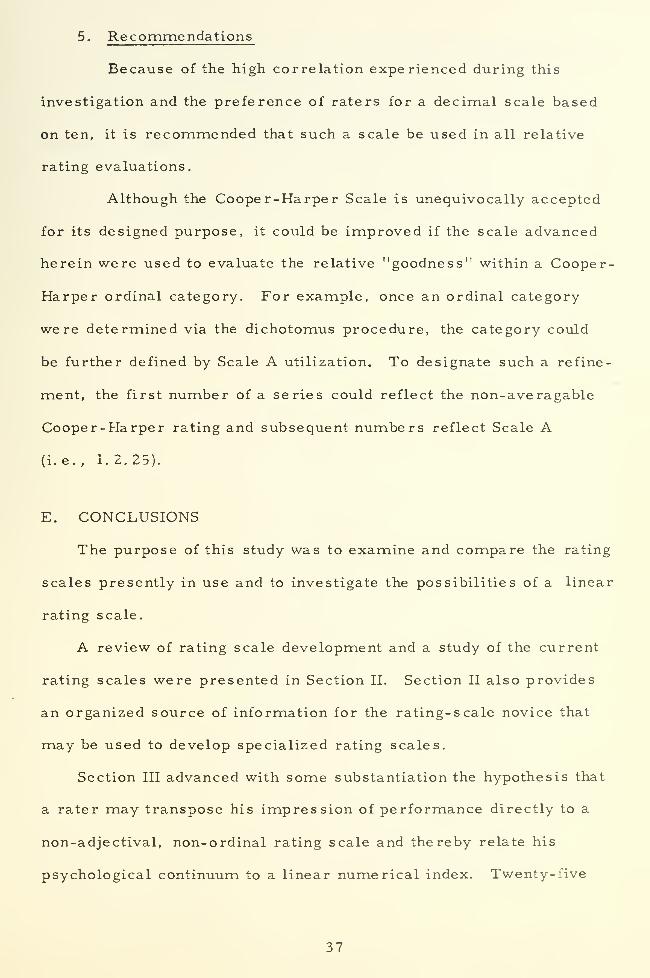
The exercise was administered to thirty-one subjects as outlined
above, and the raw data were recorded in Appendix A. Of the subjects
tested, 25 or 80. 8% understood the rating procedure. The remaining
six failed to rate their impression of the difficulty they encountered
as evidenced by their constant ratings on each scale, regardless of
their performance, throughout the testing sequence. Consequently
these data were discarded because it was impossible to determine
the linear correlation of a point.
1. Question Formulation and Interpretation
The failure of 19.2% of the subjects to comprehend the rating
procedure may be the result of incorrectly written rating statements
30

(i. e. , "... please indicate the degree of Difficulty you encountered
while performing the exercise." and "Indicate your impression of
Difficulty in the box provided. ") However, these statements were
combined during the pretesting brief (i.e. , "Indicate your impression
of the Difficulty you encountered in working the puzzle. ").
When this 19- 2% was queried regarding their constant rating, all
replied that the difficulty of the test was a constant regardless of
their performance.
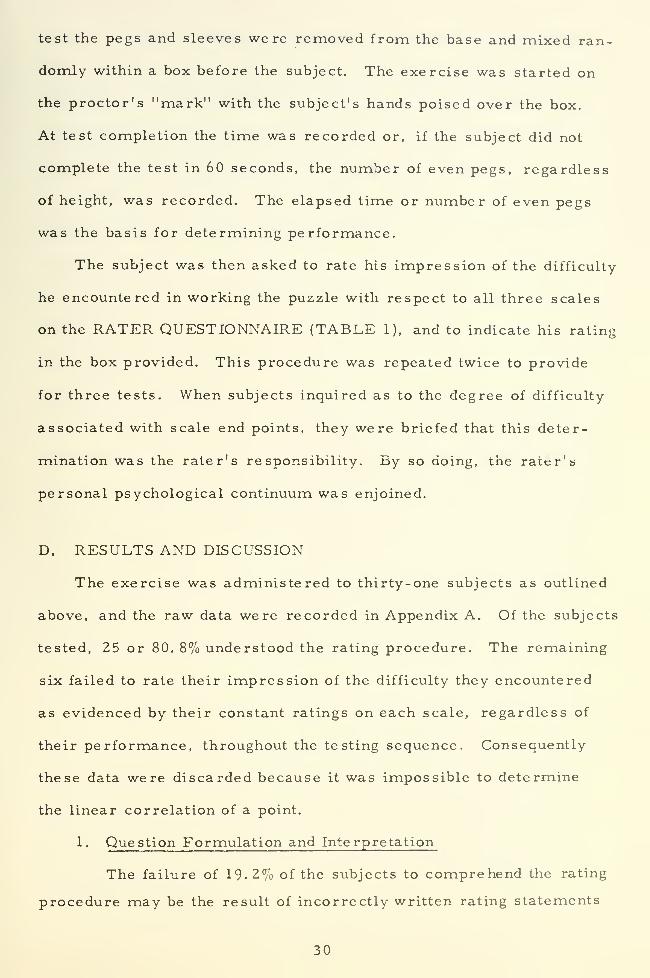
Subjects 7, 12 and 14 (TABLE II) all had inappropriately low
correlation factors because their ratings indicated increased difficulty
for increased performance. When each was queried, he related that
more incorrect puzzle combinations were discovered in subsequent
testing; consequently, his impression of puzzle difficulty increased.
Although these ratings did not properly reflect Lh«i rating statements,
they were used in the Linea rity section because such deviations may
be expected in any testing procedure.
2. Linearity
Linear correlation assumes a linear relationship between
variables. If a series of variables are linearly related, the cor-
relation factor will be 1. 00. Deviations from linearity will yield
factors less than 1. 00.
To facilitate detailed analysis and to justify raw data averaging,
an individual correlation factor (r) was calculated for each exercise
subject listed in TABLE II. In correlation factor calculations the
time to exercise completion or the number of even pegs was used as
the independent variable, and the subject's rating was used as the
dependent variable.
31

TABLE II
RATER PERFORMANCE - RATING
CORRELATION FACTOR
CORRELATION- FACTOPS (r)
SCALE SCALESUBJECT
A B CSl'EJECT
A B C
1 .992 .993 .993 14 .143 .142 .142
2 .995 .983 .956 15 .986 .999 .986
3 .992 .997 .992 16 .901 .998 .998
4 .905 .905 .905 17 .999 .97] • °99
5 .993 .993 .993 18 .999 .982 .929
6 .899 .739 .897 19 . 999 .499 .999
7 .181 .181 .181 20 .866 .866 .866
8 .938 .939 .939 21 .960 .961 .961
9 .596 .659 .596 22 .997 .998 .998
10 .866 .831 .866 23 .997 .953 .976
11 .545 .645 .600 24 .999 ooq .999
12 .189 .346 .453 25 .997 .993 .96 8
13 .997 .999 .999
32

Scales A and B yielded correlation factors of which 90. 9%
were greater than 0. 8 and 81. 8% were greater than 0. 9. Scale C
yielded 77% and 72% respectively. The overall correlation factors
for Scales A, B and C were 0. 928, 0. 905 and 0. 927 respectively.
This high degree of performance - rating correlation confirmed
linearity and sensitivity, and was an extremely strong indication
that raters were able to relate their personal psychological continuum
to a linear, non-adjectival, non-ordinal rating scale. It additionally
provided justification for the averaging of ratings.
Another feature of high correlation is that relatively few
trials may be conducted with a high degree of confidence in the
resulting data. This thereby reduces the time and cost expenditures
associated with testing.
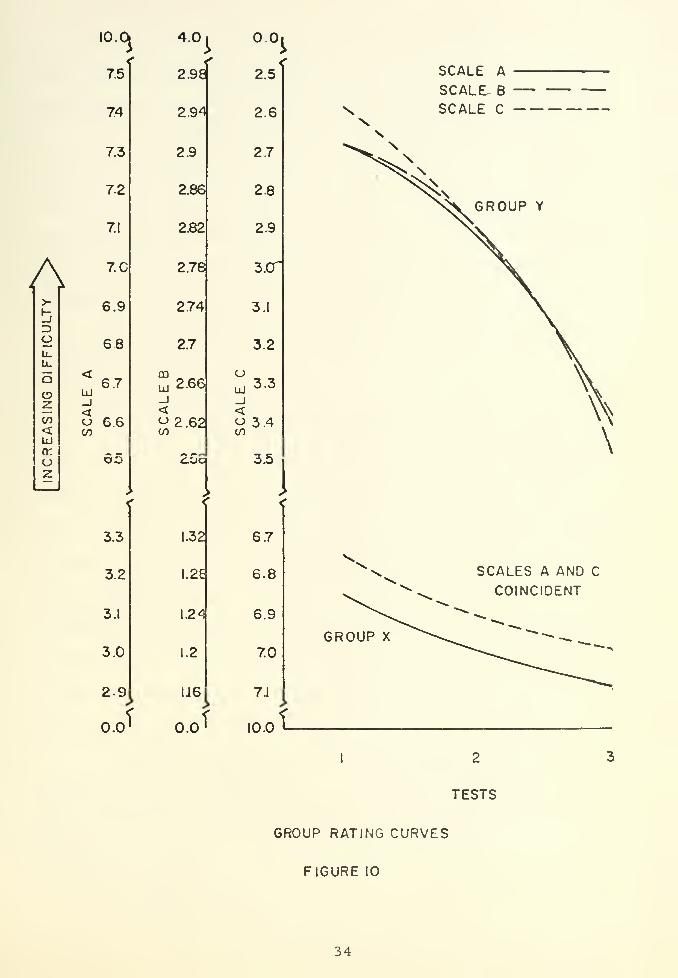
3. Rating Analys is
The test subjects' ratings fell into two groups as characteri-
zed by those who completed all tests during the allotted time (Group
X) and those who completed two or less tests (Group Y). As indicated
in Figure 10, Group X experienced less difficulty than Y throughout
the testing sequence; however, the rating curves of Group X reflected
decreased learning in contrast to the curves of Group Y.
It should be noted that the rating curves of Group Y did not
remain parallel as did those of Group X. This was, perhaps, an
indication of the frustration experienced in not being able to complete
each test. Such a factor would influence rating accuracy and, con-
sequently, rating sensitivity.
By averaging the unweighted corresponding test ratings of
both Groups (there were more subjects in Group Y), Figure 11 was
33

A3OLlU.
5
zto
<UJ
a:
az
10.
Q
75
74
7.3
7.2
7.1
7.C
6.9
6 8
6.7UJ_i
<o 6.6
oo
3.3
3.2
3.1
3.0
2-9
0.0
03
UJ
4.0 i
2.98
2 94
2.9
2.86
2.82
2.78
2.74
2.7
2.66
<^ 2.621
Oc
1.32
.26
1.24
1.2
oUl
0.0
2.5
2.6
2 7
2.8
23
3.0l
3.1
3.2
3.3
<o 3.4if)
35
6.7
6.8
6.9
7.0
IJ6 7.1
.\>
D.0' 10.0 «-
SCALE A
SCALE B
SCALE C
GROUP Y
SCALES A AND C
COINCIDENT
GROUP X
2
TESTS
GROUP RATING CURVES
FIGURE 10
34

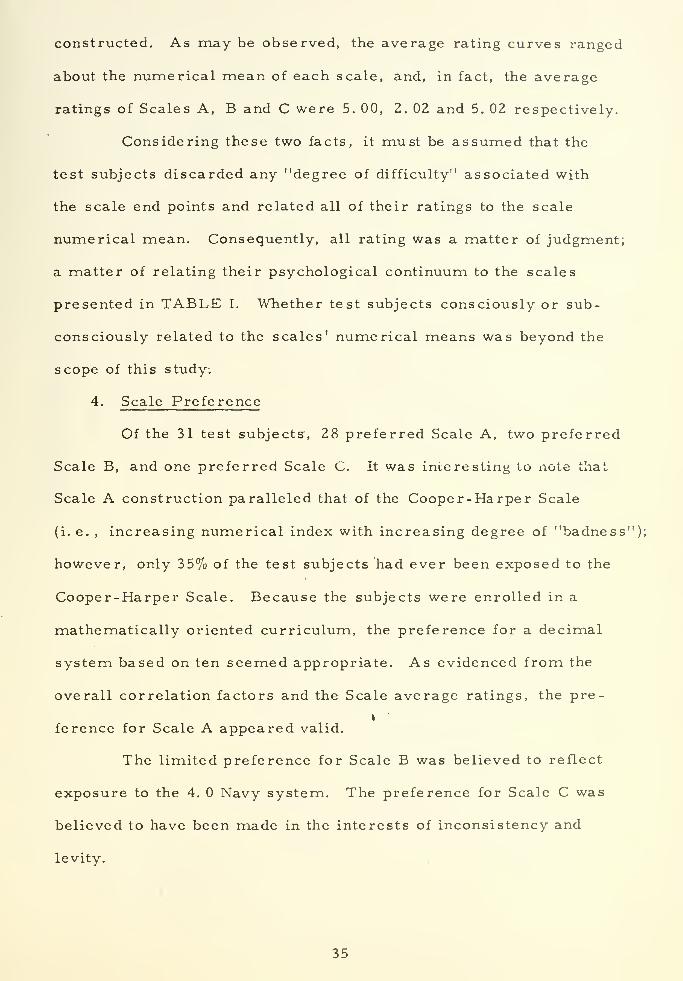
constructed. As may be observed, the average rating curves ranged
about the numerical mean of each scale, and, in fact, the average
ratings of Scales A, B and C were 5. 00, 2. 02 and 5. 02 respectively.
Considering these two facts, it must be assumed that the
test subjects discarded any "degree of difficulty" associated with
the scale end points and related all of their ratings to the scale
numerical mean. Consequently, all rating was a matter of judgment;
a matter of relating their psychological continuum to the scales
presented in TABLE I. Whether test subjects consciously or sub-
consciously related to the scales' numerical means was beyond the
scope of this study.
4. Scale Preference
Of the 31 test subjects, 28 preferred Scale A, two preferred
Scale B, and one preferred Scale C. It was interesting to note that
Scale A construction paralleled that of the Cooper-Harper Scale
(i. e. , increasing numerical index with increasing degree of "badness");
however, only 35% of the test subjects had ever been exposed to the
Cooper-Harper Scale. Because the subjects were enrolled in a
mathematically oriented curriculum, the preference for a decimal
system based on ten seemed appropriate. As evidenced from the
overall correlation factors and the Scale average ratings, the pre-
I
ference for Scale A appeared valid.
The limited preference for Scale B was believed to reflect
exposure to the 4. Navy system. The preference for Scale C was
believed to have been made in the interests of inconsistency and
levity.
35

10
i
A5.5
Z>OU_u.
QOzV)<IdCCOZ
<Ld
<oV)
4.5
4.0
<30
2.5
CD
<o(A
2.0
15
1.0
'*
<*
4.5
oId
<O
5.5
' o' 10^
SCALE A
SCALE B
SCALE C
2
TESTS
AVERAGE RATING CURVES
FIGURE II
36

5. Recommendations
Because of the high correlation experienced during this
investigation and the preference of raters for a decimal scale based
on ten, it is recommended that such a scale be used in all relative
rating evaluations.
Although the Cooper-Harper Scale is unequivocally accepted
for its designed purpose, it could be improved if the scale advanced
herein were used to evaluate the relative "goodness" within a Cooper-
Harper ordinal category. For example, once an ordinal category
were determined via the dichotomus procedure, the category could
be further defined by Scale A utilization. To designate such a refine-
ment, the first number of a series could reflect the non-averagable
Cooper-Harper rating and subsequent numbers reflect Scale A
(i.e., 1.2. 25).
E. CONCLUSIONS
The purpose of this study was to examine and compare the rating
scales presently in use and to investigate the possibilities of a linear
rating scale.
A review of rating scale development and a study of the current
rating scales were presented in Section II. Section II also provides
an organized source of information for the rating-scale novice that
may be used to develop specialized rating scales.
Section III advanced with some substantiation the hypothesis that
a rater may transpose his impression of performance directly to a
non-adjectival, non-ordinal rating scale and thereby relate his
psychological continuum to a linear numerical index. Twenty-five
37


test subjects utilized such a scale and 81. 8% had correlation factors
in excess of 0. 953 during three tests.
The use of a non-adjectival, non-ordinal scale could provide
simplicity, linearity, averaging, high correlation and a high confidence
for minimum testing. Such a scale, if used in contemporary testing,
might greatly reduce evaluation and procurement costs.
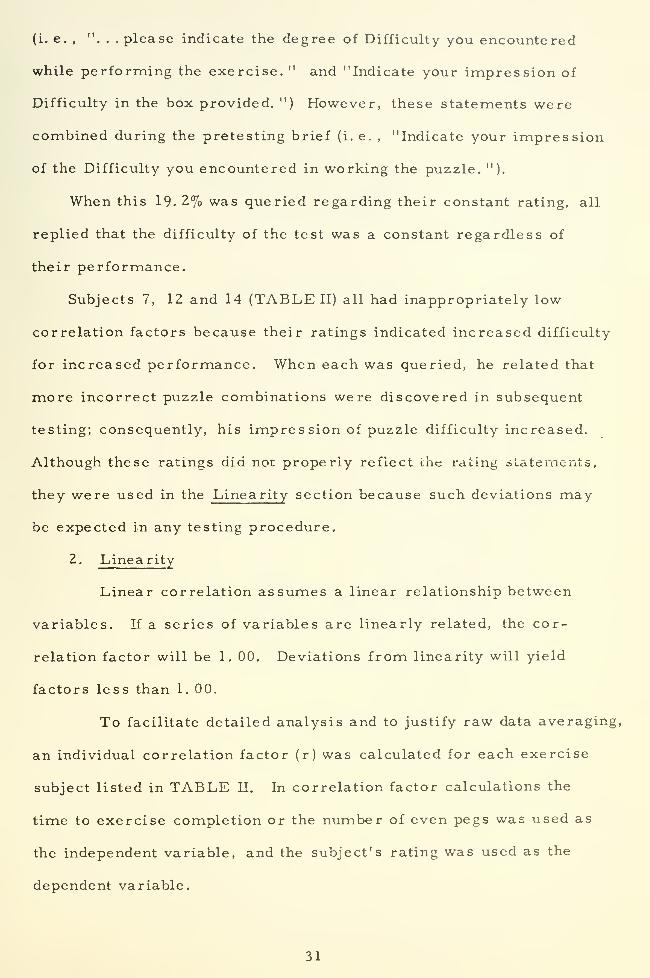
38

¥¥3TVDS U <- >-
m mu r-» on mCO
r^ sC r^- m a- r^ >T O CM
r^m <r CO rj m CN r» in CM COCG
co .-H O o i-t •—
'
i-4 .—
1
C H CM
HCOu: m mH < CO i-H m
.—
t
en -a CO-j-H ro M3C(C
i-H
*333 Csl G\ to r^ co in s^ o\ CO C_ cr> m c<r co co co CO ^ VT CO CO \-/ CO m vG
¥3dODS CO *- r~-
< <;H
X <.»-l OR?5 PSW UJCm Ha* << et;
¥¥33v'3S U < V-1
WO in in m mu r-. on m c\in m r> m
o\ r^r-i c •
in m inCQ m vj LO r^ r~ CM CM CO in
• • CM • • • • CM • iH • sT •
CM
Hcrj
M C O i—
t
t—
(
H C CO i-H
U m m in m LOH < CO rH uO ^H<r -r
CO m o CMON c •
*D3S < C C -3" CM CM CO o •<r o c r-- cm<r co co CM «tf m vr -r co CO Ski m sr
¥3doos
HCOWH
v¥'.-n/;)s <,
u r^- co in co <r \o co o Onin m
CMC co
CQ mi—
t
oo vt moo\c mi—
i
CO
m
CMO M H O H O
< co
in
cm in cm vc vr csi <r i-H
mCM
C r-i—
t
'disCO O N H o m n cm m ^r m ^r co csi
OCO -J-
o v
¥3dODS CO co in
3J^ oCO
CM CM CO O CO CT\ COCO CO CM CO CM CM CM r J Csl CM
00 COCM Csl——
—
Co,
•H
co
4J
«-l
0i
(S uc
c o>-»
0)
-J U-l
ai ow uC5 a.j
<u
Cv ^HJ- C3
U(J VIW3 K* •fc
39


co
HonuH
¥¥XIVJS C3 <<
Um
• CM co m mm
mCMCM
mc in m • cm
min • st cm co
inin •
CM
pq
<— CO
m• CM
CM
ccen
in
si CM (N • O«-H
v£, m cmCM • • • CO
CO CM CO
mr-s.
CM •
CM
<m
• 00m r-» inm
r^m
c in m 'oor-l co
in cx> <j oo oo m r-s
*D3S in sa-
CO sCin co
i-H O
.. rr*ir\OjC in co s3* co in ir? <r en ic r> r« x (^ O -<T>
<; -ao
M CQ •«
IS ^~»
W UCL. CPh cj-"5. *-"
CM
HCOWH
warns —ea <.
"" <}
c_ -sT O rH in00
vf rH c com mm • m m
in •
oI—
t
in
PQ
incm mCM CO
CNco
CM
mCM
CM
CM
ensj
in
CM
mCM sC
CM • CMco
CM •
co COCM
< \C c o> inCM
t
m s^ o. OrH
sCm
• occo
mom inm •
<?<o> m
•03S^_ COm + m OIt
¥3«oos in r- co m i£ 00 m 00 in ^r cm r-s o cm sr cm •st r^
rH
HC/3
w
**3'I/3S < ~ HI s w s
u uomo
r—
l
Oom cm
sr
OCM
"st o CM \0 CM m CM CO sO rH rH CM
co.CM
vOo^
COCMmCM
mCM
CO
lOCM
CMST CO
in
• CO>-<
inin i— <j co in in
CO CM rH CO CO CO
< m c>C7i
m co
min
COsO o
rH00 -sf CO in oo rs »j c^ on co
'33S oSO
-*~ O o 7
*3H0DS CM CO o m <T co 00 o m CO sT r- sO \0 CO sT -sT CM
33V CMsa-
co CMoro
atCI
enCM
cr>
CM CMcoCM
cr. cmCM CO
cm r-s o O co cr. cr>
CO CM CO CO CM C-4 CM
4-1
"cL
0)
aa u
cC a>
o u0)
-3 u-t
a* a*C/j -CO c-O
VCV rHU CO
o uo c/:
•fC *
40

PHRASE
APPENDIX B
(Continued)
PSYCHOLOGICAL
MEAN
Response Characteristics
Excellent, pure (i.e., no accidentalexcitation) primary and secondaryresponse characteristics 0.99
Good, relatively pure, primary and secondaryresponse characteristics 2.47
Fair, somevhat impure primary or secondaryresponse characteristics 4.62
Quite sensitive, sluggish or uncontrollablein primary or secondary responses 6.00
Extremely sensitive, sluggish or uncontrollablein primary or secondary responses 7.10
Effects of Deficiencies
Effects of deficiencies on performance is easilycompensated for by pilot 4.04
Some minor but annoying deficiencies 4.50Moderately objectionable deficiencies 5.57Major, very objectionable deficiencies 7.65
Demands on Pilot
Completely undemanding of pilots, very relaxedand comfortable 1.65
Largely undemanding of pilots, relaxed 2.36Mildly demanding of pilot attention, skill
or effort 4.22Demanding of pilot attention, skill or
effort 5.88Very demanding of pilot attention, skill or
effort i 7.50Completely demanding of pilot attention,
skill or effort 8.36
41

APPENDIX B
LIST OF EVALUATION PHRASES
PSYCHOLOGICALPHPASE
MEAN
Handling Qualities
Excellent handling qualities 1.00Highly desirable handling qualities 1.47Good handling qualities 2.58Pleasant handling qualities 2.65Fair handling qualities A. 13
Bad handling qualities 7.74Very bad handling qualities 8.22
Control
Extremely easy to control vith excellentprecision 0.97
Very easy to central with good precision 1.76
Easy to contrul vith fair precision 3.21
Controllable vith somevhat idadequate preeision 5.43Controllable, but only very imprecisely 6.65Difficult to control 7.18Very difficult to control 8.15Nearly uncoltrollable 8.91
Precision
Extremely easy to control vith excellentprecision 0.97
Very easy to control vith good precision 1.76Easy to control vith fair precision 3.21Controllable vith somevhat idadequate
precision 5.45Controllable, but only very imprecisely 6.65
42

BIBLIOGRAPHY
1. Air Force Flight Dynamics Laboratory Technical Report 65-15,Human Pilot Dynamics in Compensatory Systems , by D. T.McRuer, July 1965.
2. National Aeronautics and Space Administration ContractorReport 1643, A Study of Relationships Between AircraftSystem Performance and Pilot Ratings, by W. C. Schultz,F. D. Newell, and R. F. Whitbeck, July 1970.
3. Warner, E. P. , Airplane Design, McGraw-Hill, 1936.
4. National Advisory Committee for Aeronautics, AdvanceConfidential Report, Requirements for Satisfactory FlyingQualities , by R. R. Gilruth, April 1941.
5. Cooper, G. E. , "Understanding and Interpreting Pilot Opinion",Aeronautical Engineering Review, March 1957.
6. Air Force Aeronautical Systems Division Technical Report61-147, In- Flight Simulation of the Lateral-DirectionalHandling Qualities of EnLry Vehicles, by R. P. Harper, Jr. ,
November 1961.
7. Air Force Aeronautical Systems Division Technical Report 67-19,Pilot Evaluations in a Ground Simulator of the Effects of
Elevator Control System Dynamics in Fighter Aircraft , byM. L. Parrag, September I9b7.
8. Advisory Group for Aerospace Research & Development Con-ference Proceedings No. 17, A Revised Pilot Rating Scalefor the Evaluation of Handling Qualities , by R. P. Harper,and G. E. Cooper, September 1966.
9. National Aeronautics and Space Administration Technical NoteD-5153, The Use of Pilot Rating in the Evaluation of AircraftHandling Qualities , by G. E. Cooper and R. P. Harper, Jr. ,
April 1969.
10. Air Force Flight Dynamics Laboratory Technical Report 68-76,Pilot Rating Techniques for the Estimation and Evaluation of
Handling Qualities , by J. D. McDonnell, December 1968.
11. National Aeronautics and Space Administration Contract Report1601, Motion Drive Signals for Piloted Flight Simulators , byS. F. Schmidt and Bjorn Conrad, May 1970.
43

INITIAL DISTRIBUTION LIST
No. Copies
1. Defense Documentation Center 2
Cameron StationAlexandria, Virginia 22314
2. Library 2
Naval Postgraduate SchoolMonterey, California 93940
3. Chairman, Department of Ae ronautics 1
Naval Postgraduate SchoolMonterey, California 93940
4. Associate Professor Donald M. Layton 1
Department of Ae ronauticsNaval Postgraduate SchoolMonterey, California 93940
5. LCDR C. Vance Schufeidt, USN 1
Attack Squadron 212Lemoore, California 93245
6. George E. Cooper 1
Ames Research CenterMoffett Field, California 94035
7. Robert P. Harper, Jr. 1
Cornell Aeronautical Laboratory, Inc.
Buffalo, New York 14221
8. James D. McDonnell 1
Systems Technology, Inc.
Hawthorne, California 90250
9. Bjorn Conrad 1
Analytical Mechanics AssociatesPalo Alto, California 943 02
%
44

UNCLASSIFIEDSecurUv Classification
DOCUMENT CONTROL DATA -R&D, Security clas si I ic ation o( title, body of abstract and indexing annotation mw>t be entered when the overall report is c las si lied)
I originating activity (Corporate author)
Naval Postgraduate SchoolMonterey, California 93940
Za. REPORT SECURITY C L ASSIFlC » TIOI
Unclas sified26. GROUP
3 REPORT TITLE
A New Approach to Pilot Rating Scales
4 DESCRIPTIVE NOTES (Type of report and.inc lusive dates)
Master's Thesis; September 19715. A\j T MORiS) ( Firs t name, middle mttiml, la at name)
Coral Vance Schufeldt
S REPOR T DATE
September 1971
7a. TOTAL NO. OF PAGES
467b. NO OF RE FS
11
•a. CONTRACT OR GRANT NO
6. PROJEC T NO
9a. ORIGINATOR'S REPORT NUMBER(S)
9b. OTHER REPORT NO(S) (Any other numbers that may be maal$nedthis report)
10 DISTRIBUTION STATEMENT
Approved for public release; distribution unlimited.
II SUPPLEMENTARY NOTES 12. SPONSORING MILITARY ACTIVITY
Naval Postgraduate SchoolMonterey, California 93940
13. ABSTRACT
An examination and comparison of pilot rating scales presently in use andan investigation into the possibilities of a linear rating scale were conducted.
The hypothesis was advanced that a rater may transpose his impression of
performance directly to a non-adjectival, non-ordinal rating scale and therebyrelate his psychological continuum to a numerical index. Experimental data,
though limited, tended to support this hypothesis.
DD/.T..1473S/N 01 01 -807-681 1
(PAGE 1)
45UNCLASSIFIEDSecurity Classification
1- 31408

UNCLASSIFIEDSecurity Classification
KEY WORDS
Pilot rating scale
Psychological continuum
Linear numerical index
D, F.T..1473 'BACK) UNCLASSIFIED
0101 -807-6321 46 Security Classification .- JHOs


Thes 129110S358 Schufeldt
c.l A new approach to
pi lot rating scales.
.8AUG72 2190328JAN79 !?§!8I0AUG63 2936*'
129110Schufeldt
A new approach to
pi lot rati ng scales.

thesS358
A new approach to pilot rating scales.
3 2768 002 00050 7DUDLEY KNOX LIBRARY
![The Inventory of the John Holbrook Vance [Jack Vance ...archives.bu.edu/finding-aid/finding_aid_122912.pdf · Vance.JR Box 1 Box 2 Box 3 VANCE, JOHN HOLBROOK, 1916 - [Jack Vance]](https://img.pdfslide.us/doc/110x75/5e776f55989f9014e425e4a0/the-inventory-of-the-john-holbrook-vance-jack-vance-vancejr-box-1-box-2-box.jpg)