Embed Size (px)
Citation preview

STUDENT WORKSHEET – LEVEL 1
CORAL REEFS: WHERE IN THE WORLD?
Dear Student, Are you fascinated by coral reefs where every surface, nook, and cranny is
bursting with life? These oases of life are found around the tropics, where sunlight and sea
surface temperature are fairly even throughout
the year. But there’s a problem - rising ocean
temperatures are seriously affecting the health
of coral reefs. Your job will be to investigate the
consequences of rising temperature on reefs
around the planet. Let’s begin by investigating
the locations of coral reefs around the world
and the temperature range in which they can
survive.
A map of coral reef locations around the world.
Instructions:
Go to the Coral Bleaching activity on the website. Click on Level 1, complete the activities
and answer the questions below.
1. Generally, coral reefs are found in shallow waters between ______ degrees N latitude
and ______ degrees S latitude.
2. In the United States, coral reefs are located off the coasts of which state(s)?
_________________________ , _________________________ , and _________________________ .
3. Corals have a limited temperature range within which they can live. Most corals
survive in temperatures ranging from ___________ to ____________ degrees Celsius.
9 INVESTIGATING CORAL BLEACHING USING REAL DATA: LEVEL 1

STUDENT WORKSHEET – LEVEL 2
MEASURING WATER THAT IS WARMER THAN NORMAL
Your mission: An oceanic heat wave is causing
severe coral bleaching at reefs across the
globe. It’s the worst bleaching event in history.
To what extent are the corals on the Great
Barrier Reef at risk? You have been selected
to join a team of scientists who will analyze
temperature data to find out.
Can you locate the Great Barrier Reef from space?
Instructions:
1. Go to the Coral Bleaching activity on the website. Click on Level 2 and scroll down to
the activity titled ‘Measuring Water That Is Warmer Than Normal.’
2. The graph shows real temperature data (collected by satellites) along the Great
Barrier Reef during Summer 2017. Use the graph to answer the questions below:
a. On the Great Barrier Reef, how warm does the water need to be for corals to
bleach? _____________________
b. How many weeks did the temperatures exceed the ‘bleaching limit’?
_____________________
c. How many degrees above the bleaching limit did the sea surface
temperature rise during the week of Feb 18th, 2017? _____________________
9 INVESTIGATING CORAL BLEACHING USING REAL DATA: LEVEL 2

3. Are the corals on the Great Barrier Reef at high risk, moderate risk or low risk of
bleaching due to heat stress? Use the temperature data to explain your answer.
_____________________________________________________________________________________
_____________________________________________________________________________________
_____________________________________________________________________________________
_____________________________________________________________________________________
4. As you work through Level 2, keep a list of questions that you have about coral
bleaching in the table below.
What GENERAL questions do you have about coral bleaching?
What questions could you ask (and answer) using the types of data you explored in Level 2?
10 INVESTIGATING CORAL BLEACHING USING REAL DATA: LEVEL 2

STUDENT WORKSHEET #1 – LEVEL 3
IDENTIFYING THE EFFECTS OF BLEACHING ON CORAL REEFS AROUND THE WORLD
Your mission: Congratulations! You have
been selected to join a team of scientists who
will be investigating the health of coral reefs
around the world. Your current mission is to
look for evidence of coral bleaching and
mortality at four reefs in the Pacific Ocean.
Put on your goggles and get ready to take the
plunge.
Visit the reefs (above) using the map in Level 3.
Making Observations: Go to the Coral Bleaching activity on the website, click on Level 3,
and scroll down to the activity titled ‘Identifying the Effect of Bleaching on Coral Reefs.’ Use
the map tool to visit each of the four coral reefs in the western Pacific. Examine the photos
and complete the table below. As an example, Reef #1 is partly completed for you.
Coral Reef #
Reef Name and Location Date Observations:
1 Phoenix islands, Republic of Kirabati
2004 healthy bleached dead Other observations: coral is bright green and yellow. Lots of colorful fish are present.
1 Phoenix islands, Republic of Kirabati
2016 healthy bleached dead Other observations:
10 INVESTIGATING CORAL BLEACHING USING REAL DATA: LEVEL 3

Coral Reef #
Reef Name and Location Date Observations:
2 healthy bleached dead Other observations:
2 healthy bleached dead Other observations:
Coral Reef #
Reef Name and Location Date Observations:
3 healthy bleached dead Other observations:
3 healthy bleached dead Other observations:
Coral Reef #
Reef Name and Location Date Observations:
4 healthy bleached dead Other observations:
4 healthy bleached dead Other observations:
11 INVESTIGATING CORAL BLEACHING USING REAL DATA: LEVEL 3

Making Sense of Your Observations: Answer the questions below.
1. How many of the reefs you visited showed signs of bleaching? _____________________
2. Has the health of these coral reefs changed over time? If yes, describe the changes
you observed.
_____________________________________________________________________________________
_____________________________________________________________________________________
3. If you were a scientist, what more would you want to know to better understand
coral bleaching?
____________________________________________________________________________________
_____________________________________________________________________________________
____________________________________________________________________________________
_____________________________________________________________________________________
4. What is one way that you could more accurately measure the amount of coral
bleaching taking place at these locations?
____________________________________________________________________________________
_____________________________________________________________________________________
____________________________________________________________________________________
_____________________________________________________________________________________
12 INVESTIGATING CORAL BLEACHING USING REAL DATA: LEVEL 3
STUDENT WORKSHEET #2 – LEVEL 3
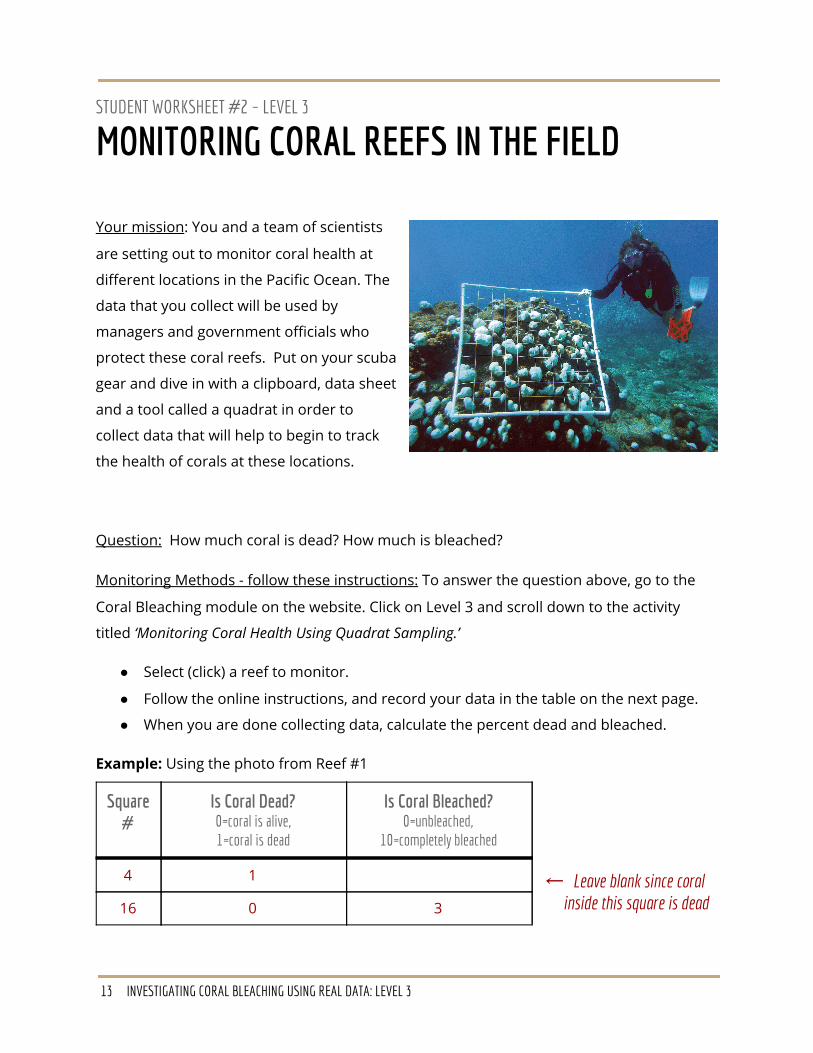
MONITORING CORAL REEFS IN THE FIELD
Your mission: You and a team of scientists
are setting out to monitor coral health at
different locations in the Pacific Ocean. The
data that you collect will be used by
managers and government officials who
protect these coral reefs. Put on your scuba
gear and dive in with a clipboard, data sheet
and a tool called a quadrat in order to
collect data that will help to begin to track
the health of corals at these locations.
Question: How much coral is dead? How much is bleached?
Monitoring Methods - follow these instructions: To answer the question above, go to the
Coral Bleaching module on the website. Click on Level 3 and scroll down to the activity
titled ‘Monitoring Coral Health Using Quadrat Sampling.’
● Select (click) a reef to monitor.
● Follow the online instructions, and record your data in the table on the next page.
● When you are done collecting data, calculate the percent dead and bleached.
Example: Using the photo from Reef #1
Square #
Is Coral Dead? 0=coral is alive, 1=coral is dead
Is Coral Bleached? 0=unbleached,
10=completely bleached
← Leave blank since coral inside this square is dead
4 1
16 0 3
13 INVESTIGATING CORAL BLEACHING USING REAL DATA: LEVEL 3

Reef #: ________________
Square # Is Coral Dead? 0=coral is alive, 1=coral is dead
Is Coral Bleached? 0=unbleached,
10=completely bleached
Total # squares dead = Average =
% dead
(total x 10) =
% bleached
(total x 10) =
Results: answer the questions below.
1. In the area you monitored, approximately how much coral is dead? Approximately
how much of the living coral is bleached?
2. In order to monitor the health of this reef over time, you need to collect more data.
How often do you think you should return to collect data (weekly, monthly, yearly)?
And during which seasons? Why?
14 INVESTIGATING CORAL BLEACHING USING REAL DATA: LEVEL 3
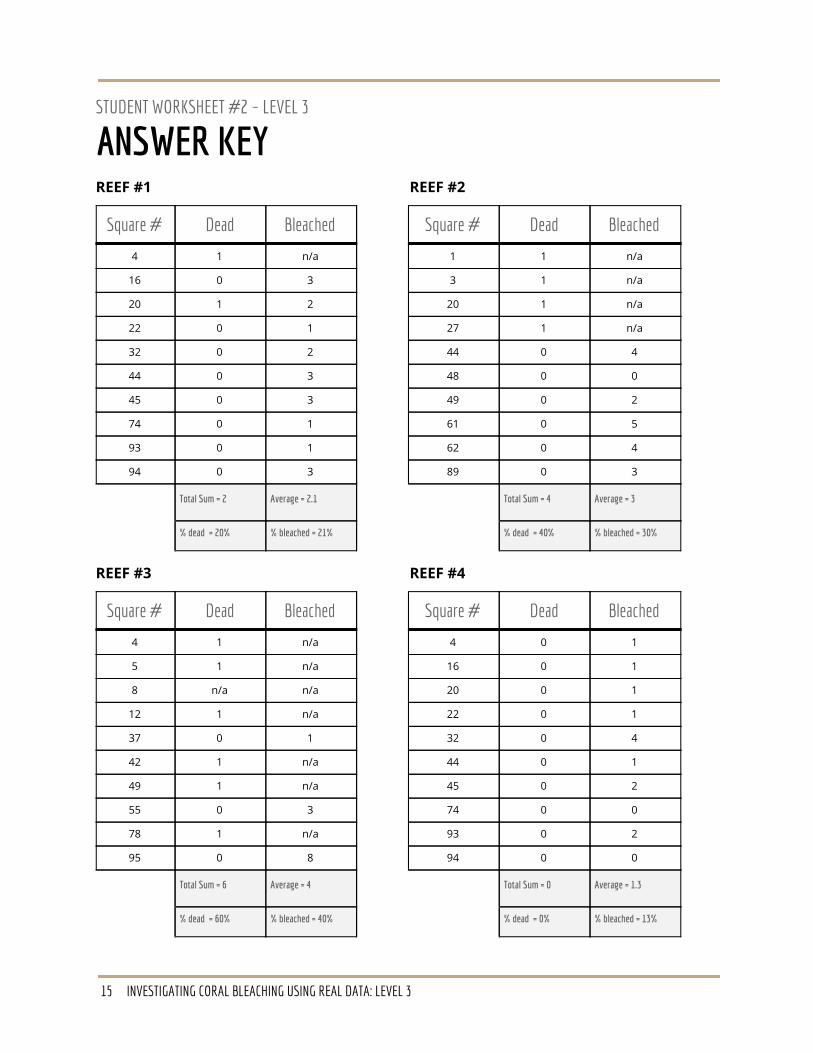
STUDENT WORKSHEET #2 – LEVEL 3
ANSWER KEY REEF #1 REEF #2
Square # Dead Bleached Square # Dead Bleached
4 1 n/a 1 1 n/a
16 0 3 3 1 n/a
20 1 2 20 1 n/a
22 0 1 27 1 n/a
32 0 2 44 0 4
44 0 3 48 0 0
45 0 3 49 0 2
74 0 1 61 0 5
93 0 1 62 0 4
94 0 3 89 0 3
Total Sum = 2 Average = 2.1
Total Sum = 4 Average = 3
% dead = 20% % bleached = 21% % dead = 40% % bleached = 30%
REEF #3 REEF #4
Square # Dead Bleached Square # Dead Bleached
4 1 n/a 4 0 1
5 1 n/a 16 0 1
8 n/a n/a 20 0 1
12 1 n/a 22 0 1
37 0 1 32 0 4
42 1 n/a 44 0 1
49 1 n/a 45 0 2
55 0 3 74 0 0
78 1 n/a 93 0 2
95 0 8 94 0 0
Total Sum = 6 Average = 4
Total Sum = 0 Average = 1.3
% dead = 60% % bleached = 40% % dead = 0% % bleached = 13%
15 INVESTIGATING CORAL BLEACHING USING REAL DATA: LEVEL 3

RESEARCH PROJECT: CORAL BLEACHING IN THE FLORIDA KEYS
Your mission: Florida’s coral reefs make up
the third largest barrier reef ecosystem in
the world. These reefs protect the shore and
bring in billions of tourist dollars every year.
How is sea surface temperature affecting
the health of Florida’s coral reefs? You are
joining a team of scientists who are using
data to find out.
Part 1 – Has the water been warm enough to put Florida’s corals at risk?
1. Go to the Coral Bleaching activity on the website. Click on Level 4 and scroll down to
the activity titled ‘Analyzing Bleaching in the Florida Keys.’
2. On the map, select the light green circle that marks the location of the Florida Keys.
Click ‘Graph Link.’ The graph shows the latest Degree Heating Week (DHW) data for
this region. Analyze the graph and answer the questions below:
a. What does the y-axis on the left represent? ________________________________
b. What time period is represented on this graph? ____________________________
3. Record the date(s), if any, when coral bleaching was expected (above 4 DHW):
_______________________________________________________________________________________
6 INVESTIGATING CORAL BLEACHING USING REAL DATA: LEVEL 3

4. Make a prediction: How severe was the risk of bleaching during the time period
described above? Support your prediction by including information about ‘how long’
and ‘how much’ DHW values were over 4.
_______________________________________________________________________________________
_______________________________________________________________________________________
_______________________________________________________________________________________
Part 2 – How much bleaching was actually observed?
5. Was your prediction accurate? Did corals bleach? Did they survive and recover? To
find out, you’ll need real data and observations from people who monitor coral reef
conditions in the Florida Keys. Use the two options below, to begin your search:
● Florida’s Mote Marine Lab publishes coral Condition Reports on their website.
These reports will show you when and where bleaching occurred in the
Florida Keys during a given time period. *See page 2 of the reports.
● Search for news articles about bleaching in the Florida Keys by using search
terms such as: coral bleaching, Florida Keys, 2015.
6. Record information and specific evidence about bleaching from at least 2 sources.
Source Date Bleaching data and observations
Example: Mote Marine Lab, Current Conditions Report #20160601
June 1, 2016 No bleaching was observed during this time period.
7 INVESTIGATING CORAL BLEACHING USING REAL DATA: LEVEL 3

Part 3 – Draw a Conclusion: How is sea surface temperature affecting the health of Florida’s
coral reefs? Use evidence and data from Parts 1 and 2 to support your conclusion.
_____________________________________________________________________________________________
_____________________________________________________________________________________________
_____________________________________________________________________________________________
_____________________________________________________________________________________________
_____________________________________________________________________________________________
_____________________________________________________________________________________________
_____________________________________________________________________________________________
_____________________________________________________________________________________________
8 INVESTIGATING CORAL BLEACHING USING REAL DATA: LEVEL 3

STUDENT WORKSHEET – LEVEL 5
DESIGN YOUR OWN INVESTIGATION
Develop Your Question:
___________________________________________
___________________________________________
___________________________________________
___________________________________________
Make a Plan: Make a list below of the specific data you will need to answer the question.
Data Set Date Map or Graph?
Example: Degree Heating Weeks, Florida Keys
August 2015 map
Other than the data listed above, what other information (if any) will you need to answer
your question?
_____________________________________________________________________________________________
_____________________________________________________________________________________________
6 UNDERSTANDING SEA LEVEL USING REAL DATA: LEVEL 5

Get the data: Use the website to get the data you will need.
Interpret the data: What does your data show? Be specific and descriptive.
_____________________________________________________________________________________________
_____________________________________________________________________________________________
_____________________________________________________________________________________________
_____________________________________________________________________________________________
_____________________________________________________________________________________________
_____________________________________________________________________________________________
_____________________________________________________________________________________________
____________________________________________________________________________________________
____________________________________________________________________________________________
Draw a Conclusion: What is the answer to your question? Use evidence and data to support
your conclusion.
_____________________________________________________________________________________________
_____________________________________________________________________________________________
_____________________________________________________________________________________________
_____________________________________________________________________________________________
____________________________________________________________________________________________
____________________________________________________________________________________________
7 UNDERSTANDING SEA LEVEL USING REAL DATA: LEVEL 5