Embed Size (px)
Citation preview
CORAL REEF ECOSYSTEM MONITORING GRANT FINAL REPORT
NA09NOS4260099 2009-2011
Editors: Dr. Peter Houk and Steven M. Johnson
Contributors:
David Benavente, Dr. Ryan Okano, Fran Castro
Laolao Bay, Saipan Photo credit: Fran Castro
2
Title: Commonwealth of the Northern Mariana Islands (CNMI) Coral Reef Ecosystems Monitoring Program for FY09 – FY11. Application Organization: Coastal Resources Management Office (CRMO), Office of the Governor, CNMI. Principal Contacts: David Benavente, Marine Technician, CRMO; Fran Castro, Coral Reef Initiative Point of Contact, Division of Environmental Quality (DEQ) Contact Information:
[email protected] (670) 664-8303 [phone] [email protected] (670) 664-8525 [phone]
Coastal Resources Management Office, PO Box 10007, Saipan, MP 96950
Program Category: State and Territory Coral Reef Ecosystem Monitoring Geographic Location: Commonwealth of the Northern Mariana Islands, Western Pacific Grant Funds Requested: $389,994 ($129,998 per year for three years) Matching Funds Provided: None Award Period:
1 October 2009 to 30 September 2012
3
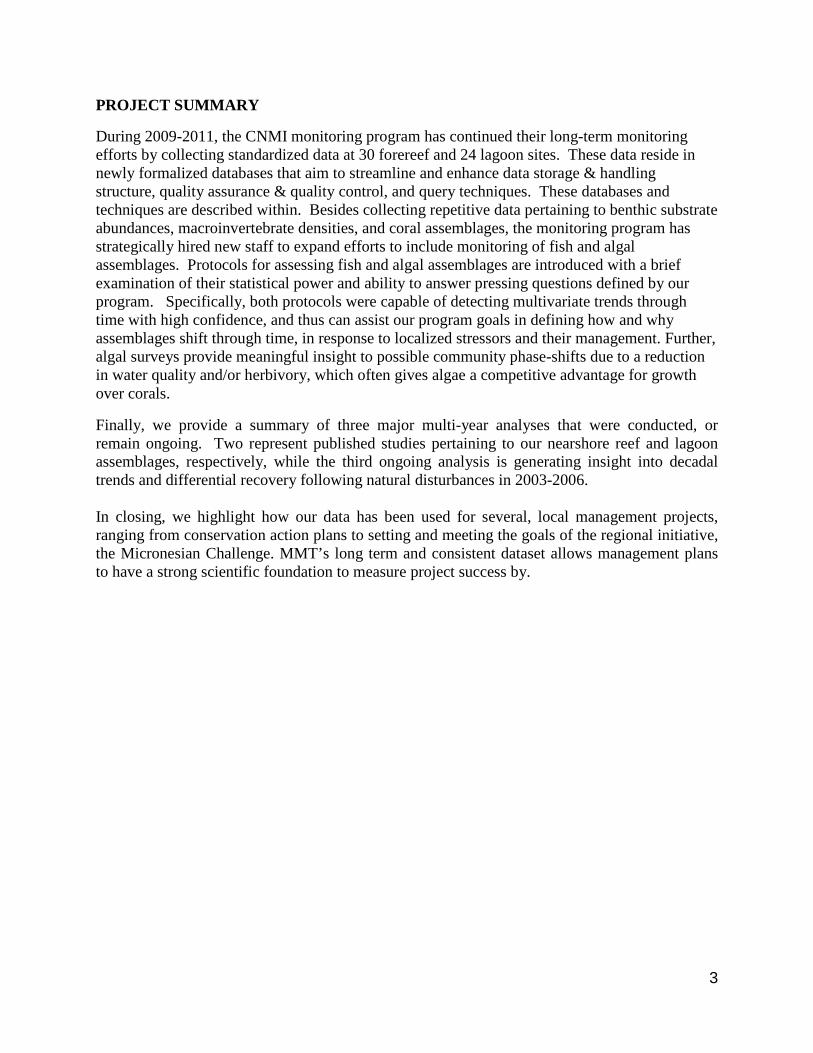
PROJECT SUMMARY
During 2009-2011, the CNMI monitoring program has continued their long-term monitoring efforts by collecting standardized data at 30 forereef and 24 lagoon sites. These data reside in newly formalized databases that aim to streamline and enhance data storage & handling structure, quality assurance & quality control, and query techniques. These databases and techniques are described within. Besides collecting repetitive data pertaining to benthic substrate abundances, macroinvertebrate densities, and coral assemblages, the monitoring program has strategically hired new staff to expand efforts to include monitoring of fish and algal assemblages. Protocols for assessing fish and algal assemblages are introduced with a brief examination of their statistical power and ability to answer pressing questions defined by our program. Specifically, both protocols were capable of detecting multivariate trends through time with high confidence, and thus can assist our program goals in defining how and why assemblages shift through time, in response to localized stressors and their management. Further, algal surveys provide meaningful insight to possible community phase-shifts due to a reduction in water quality and/or herbivory, which often gives algae a competitive advantage for growth over corals.
Finally, we provide a summary of three major multi-year analyses that were conducted, or remain ongoing. Two represent published studies pertaining to our nearshore reef and lagoon assemblages, respectively, while the third ongoing analysis is generating insight into decadal trends and differential recovery following natural disturbances in 2003-2006. In closing, we highlight how our data has been used for several, local management projects, ranging from conservation action plans to setting and meeting the goals of the regional initiative, the Micronesian Challenge. MMT’s long term and consistent dataset allows management plans to have a strong scientific foundation to measure project success by.
4
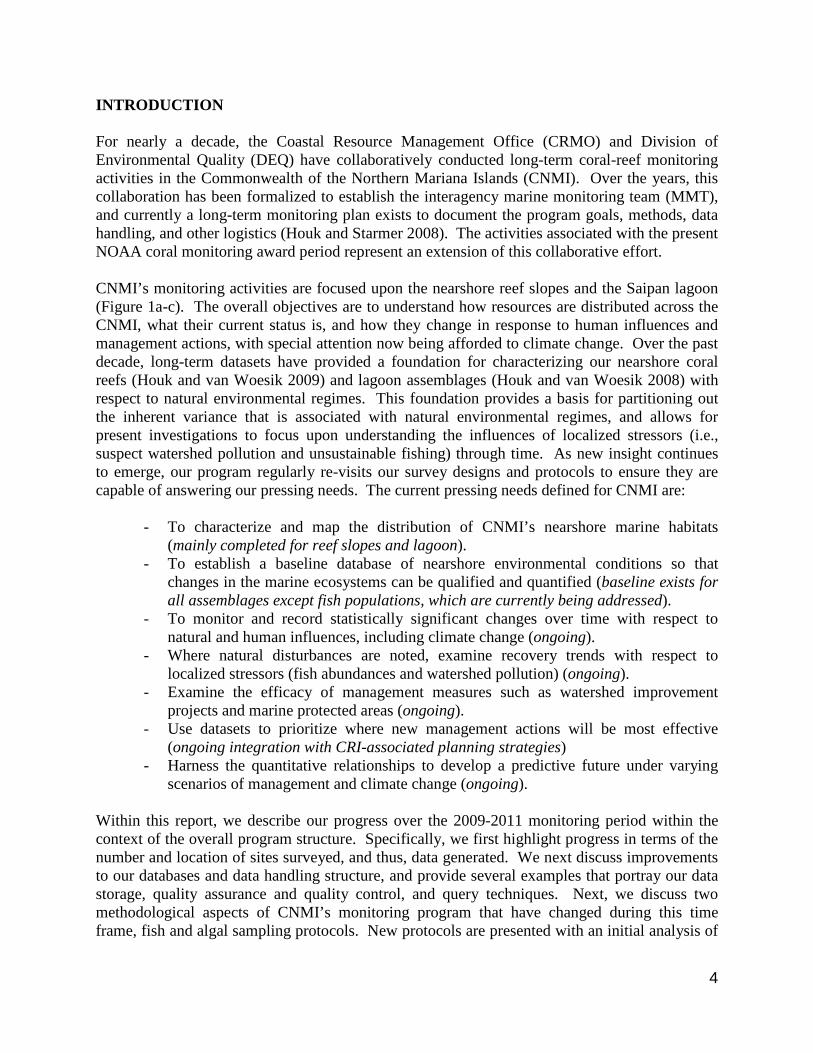
INTRODUCTION For nearly a decade, the Coastal Resource Management Office (CRMO) and Division of Environmental Quality (DEQ) have collaboratively conducted long-term coral-reef monitoring activities in the Commonwealth of the Northern Mariana Islands (CNMI). Over the years, this collaboration has been formalized to establish the interagency marine monitoring team (MMT), and currently a long-term monitoring plan exists to document the program goals, methods, data handling, and other logistics (Houk and Starmer 2008). The activities associated with the present NOAA coral monitoring award period represent an extension of this collaborative effort. CNMI’s monitoring activities are focused upon the nearshore reef slopes and the Saipan lagoon (Figure 1a-c). The overall objectives are to understand how resources are distributed across the CNMI, what their current status is, and how they change in response to human influences and management actions, with special attention now being afforded to climate change. Over the past decade, long-term datasets have provided a foundation for characterizing our nearshore coral reefs (Houk and van Woesik 2009) and lagoon assemblages (Houk and van Woesik 2008) with respect to natural environmental regimes. This foundation provides a basis for partitioning out the inherent variance that is associated with natural environmental regimes, and allows for present investigations to focus upon understanding the influences of localized stressors (i.e., suspect watershed pollution and unsustainable fishing) through time. As new insight continues to emerge, our program regularly re-visits our survey designs and protocols to ensure they are capable of answering our pressing needs. The current pressing needs defined for CNMI are:
- To characterize and map the distribution of CNMI’s nearshore marine habitats (mainly completed for reef slopes and lagoon).
- To establish a baseline database of nearshore environmental conditions so that changes in the marine ecosystems can be qualified and quantified (baseline exists for all assemblages except fish populations, which are currently being addressed).
- To monitor and record statistically significant changes over time with respect to natural and human influences, including climate change (ongoing).
- Where natural disturbances are noted, examine recovery trends with respect to localized stressors (fish abundances and watershed pollution) (ongoing).
- Examine the efficacy of management measures such as watershed improvement projects and marine protected areas (ongoing).
- Use datasets to prioritize where new management actions will be most effective (ongoing integration with CRI-associated planning strategies)
- Harness the quantitative relationships to develop a predictive future under varying scenarios of management and climate change (ongoing).
Within this report, we describe our progress over the 2009-2011 monitoring period within the context of the overall program structure. Specifically, we first highlight progress in terms of the number and location of sites surveyed, and thus, data generated. We next discuss improvements to our databases and data handling structure, and provide several examples that portray our data storage, quality assurance and quality control, and query techniques. Next, we discuss two methodological aspects of CNMI’s monitoring program that have changed during this time frame, fish and algal sampling protocols. New protocols are presented with an initial analysis of
5
their statistical ability to meet our goals. All other methods have remained stable and comparable through time. Finally, we highlight several completed and ongoing analyses of multi-year trends that were built from MMT data during this award period. Some have been published while others remain in preparation for future development. We close our report with a section defining how MMT data have been used for management planning and strategic action development, ranging from the Micronesia Challenge to numerous site-specific watershed management plans. Figure 1a-c. Maps showing the extent of CNMI MMT monitoring efforts: Nearshore coral-reef monitoring (a) is focused upon the islands of Saipan, Tinian, Aguijan, and Rota. Monitoring sites are stratified by exposure to wind and waves, as well as geomorphological reef type (furthered below). While the Saipan lagoon contains 19 unique ecological habitats (b), monitoring is focused upon two, staghorn Acropora (pink color) and Halodule seagrass (green). A recent analysis of Halodule habitats (c) found mixed ecological integrity across the lagoon, with red-yellow-green defining poor-to-improving integrity, respectively (furthered below).
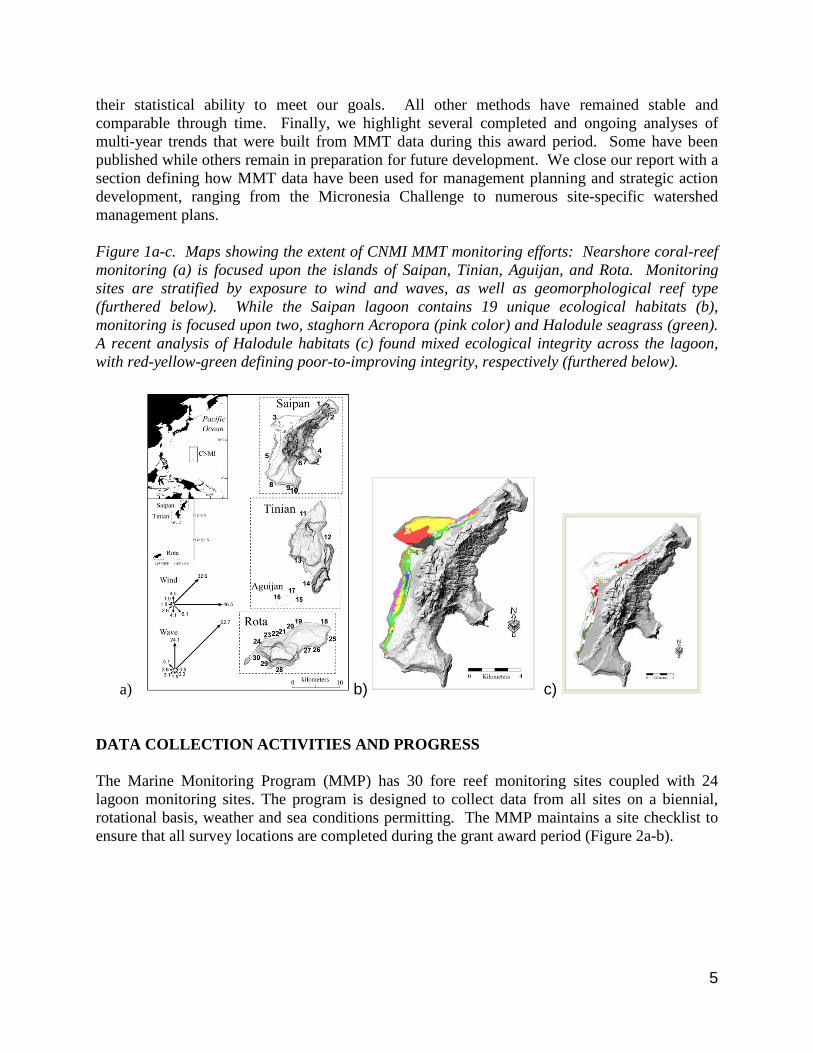
a) b) c) DATA COLLECTION ACTIVITIES AND PROGRESS The Marine Monitoring Program (MMP) has 30 fore reef monitoring sites coupled with 24 lagoon monitoring sites. The program is designed to collect data from all sites on a biennial, rotational basis, weather and sea conditions permitting. The MMP maintains a site checklist to ensure that all survey locations are completed during the grant award period (Figure 2a-b).
6
Figure 2a-b. Excel spreadsheets highlighting fore reef (a) and lagoon (b) monitoring locations. These checklists provide the MMP with and efficient means of understanding the distribution of program effort through time. a) Fore reef monitoring site list.
b) Lagoon monitoring site checklist.
7
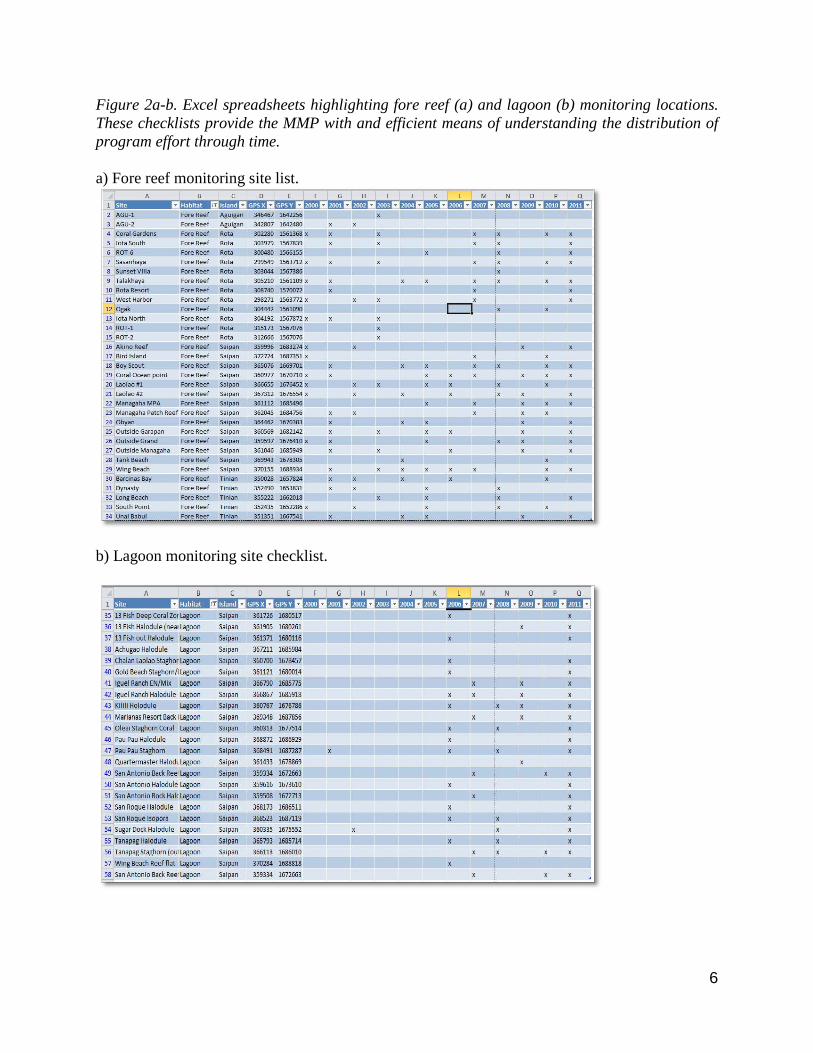
Existing database structure and QA/QC policies Databases reside in a Microsoft Excel® environment. Individual databases exist for each survey protocol, including: benthic substrate abundances, macroinvertebrate densities, coral assemblages, and during this grant period we’ve formalized databases for fish abundances and algal assemblages. These databases are populated by the individuals collecting field data, and undergo quality assurance & quality control (QA/QC) prior to being uploaded into the master database files. The QA/QC process is conducted by the biologists at DEQ and/or CRMO. Copies of all data are shared among members of the monitoring program through the free cloud-based program Dropbox®, while a permanent copy of all data is stored and backed up on several computers. When a user is interested in developing an inquiry on a database they simply move the file to their personal computer, leaving the database in the online storage. This practice prevents any manipulations to the database from overriding the original file. Spreadsheets in Excel provide the monitoring program with an inexpensive, efficient, and easily transferrable means to store, query, and subset data for use. For instance, validating data entry by using dropdown menus that only allow certain names and values is one simple approach to reduce the QA/QC time needed (Figures 3a-b). QA/QC measures are implemented frequently to ensure that when data is analyzed there are minimal errors entered into the database. Figure 3a-b. Microsoft Excel® spreadsheets provide the monitoring program with useful features for data entry such as data validation (a), data sorting (b).
a) b) UPDATED SURVEY PROTOCOLS AND PROGRAM STAFF As the monitoring program continues to grow, we aim to take advantage of all expertise that exists in CNMI that can be leveraged to assist MMP efforts. During this award period, two improvements to our program were realized. First, CRMO has hired two marine technicians, David Benavente and Rodney Camacho, who offer expertise in conducting standardized fish and algal assemblage surveys, as well as MMP data processing. Second, DEQ has hired a biologist, Steven M. Johnson under the U.S. EPA 319 grant to oversee marine monitoring efforts at DEQ including other coral reef efforts such as climate change adaptation, injury and mitigation, bleaching response, water quality, etc. Additionally, DEQ hired an ecologist, Dr. Ryan Okano under their American Recovery and Reinvestment Act award to improve watershed management
8
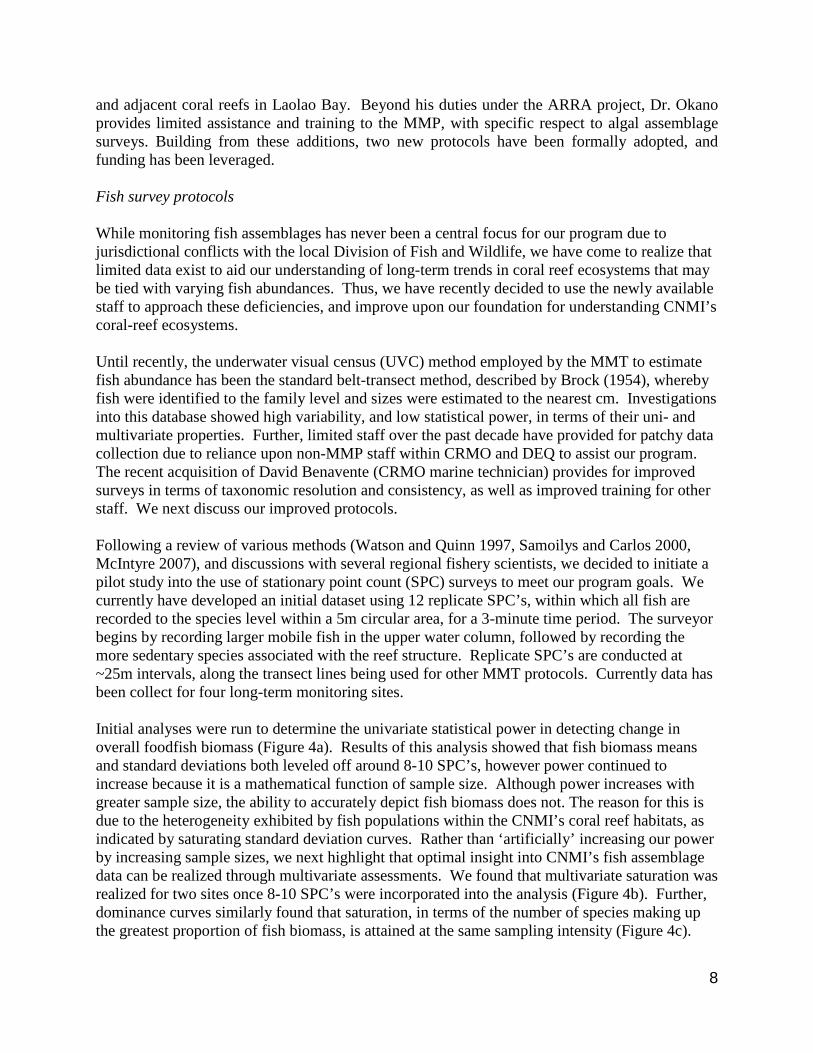
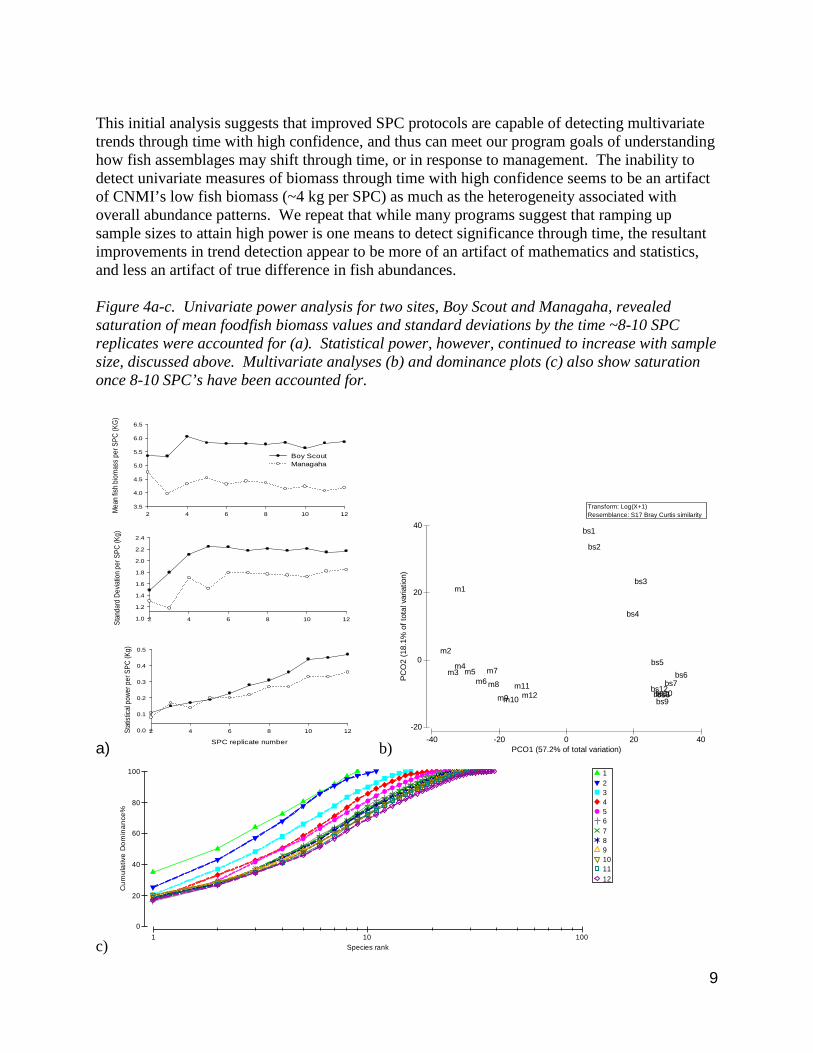
and adjacent coral reefs in Laolao Bay. Beyond his duties under the ARRA project, Dr. Okano provides limited assistance and training to the MMP, with specific respect to algal assemblage surveys. Building from these additions, two new protocols have been formally adopted, and funding has been leveraged. Fish survey protocols While monitoring fish assemblages has never been a central focus for our program due to jurisdictional conflicts with the local Division of Fish and Wildlife, we have come to realize that limited data exist to aid our understanding of long-term trends in coral reef ecosystems that may be tied with varying fish abundances. Thus, we have recently decided to use the newly available staff to approach these deficiencies, and improve upon our foundation for understanding CNMI’s coral-reef ecosystems. Until recently, the underwater visual census (UVC) method employed by the MMT to estimate fish abundance has been the standard belt-transect method, described by Brock (1954), whereby fish were identified to the family level and sizes were estimated to the nearest cm. Investigations into this database showed high variability, and low statistical power, in terms of their uni- and multivariate properties. Further, limited staff over the past decade have provided for patchy data collection due to reliance upon non-MMP staff within CRMO and DEQ to assist our program. The recent acquisition of David Benavente (CRMO marine technician) provides for improved surveys in terms of taxonomic resolution and consistency, as well as improved training for other staff. We next discuss our improved protocols. Following a review of various methods (Watson and Quinn 1997, Samoilys and Carlos 2000, McIntyre 2007), and discussions with several regional fishery scientists, we decided to initiate a pilot study into the use of stationary point count (SPC) surveys to meet our program goals. We currently have developed an initial dataset using 12 replicate SPC’s, within which all fish are recorded to the species level within a 5m circular area, for a 3-minute time period. The surveyor begins by recording larger mobile fish in the upper water column, followed by recording the more sedentary species associated with the reef structure. Replicate SPC’s are conducted at ~25m intervals, along the transect lines being used for other MMT protocols. Currently data has been collect for four long-term monitoring sites. Initial analyses were run to determine the univariate statistical power in detecting change in overall foodfish biomass (Figure 4a). Results of this analysis showed that fish biomass means and standard deviations both leveled off around 8-10 SPC’s, however power continued to increase because it is a mathematical function of sample size. Although power increases with greater sample size, the ability to accurately depict fish biomass does not. The reason for this is due to the heterogeneity exhibited by fish populations within the CNMI’s coral reef habitats, as indicated by saturating standard deviation curves. Rather than ‘artificially’ increasing our power by increasing sample sizes, we next highlight that optimal insight into CNMI’s fish assemblage data can be realized through multivariate assessments. We found that multivariate saturation was realized for two sites once 8-10 SPC’s were incorporated into the analysis (Figure 4b). Further, dominance curves similarly found that saturation, in terms of the number of species making up the greatest proportion of fish biomass, is attained at the same sampling intensity (Figure 4c).
9
This initial analysis suggests that improved SPC protocols are capable of detecting multivariate trends through time with high confidence, and thus can meet our program goals of understanding how fish assemblages may shift through time, or in response to management. The inability to detect univariate measures of biomass through time with high confidence seems to be an artifact of CNMI’s low fish biomass (~4 kg per SPC) as much as the heterogeneity associated with overall abundance patterns. We repeat that while many programs suggest that ramping up sample sizes to attain high power is one means to detect significance through time, the resultant improvements in trend detection appear to be more of an artifact of mathematics and statistics, and less an artifact of true difference in fish abundances. Figure 4a-c. Univariate power analysis for two sites, Boy Scout and Managaha, revealed saturation of mean foodfish biomass values and standard deviations by the time ~8-10 SPC replicates were accounted for (a). Statistical power, however, continued to increase with sample size, discussed above. Multivariate analyses (b) and dominance plots (c) also show saturation once 8-10 SPC’s have been accounted for.
a)
2 4 6 8 10 12Mea
n fis
h bi
omas
s pe
r SPC
(KG
)
3.5
4.0
4.5
5.0
5.5
6.0
6.5
Boy ScoutManagaha
2 4 6 8 10 12Stan
dard
Dev
iatio
n pe
r SPC
(Kg)
1.0
1.2
1.4
1.6
1.8
2.0
2.2
2.4
SPC replicate number
2 4 6 8 10 12Stat
istica
l pow
er p
er S
PC (K
g)
0.0
0.1
0.2
0.3
0.4
0.5
b)
c)
-40 -20 0 20 40PCO1 (57.2% of total variation)
-20
0
20
40
PC
O2
(18.
1% o
f tot
al v
aria
tion)
Transform: Log(X+1)Resemblance: S17 Bray Curtis similarity
bs1
bs2
bs3
bs4
bs5bs6
bs7bs8bs9bs10bs11
bs12
m1
m2
m3m4
m5m6
m7
m8
m9m10
m11m12
1 10 100Species rank
0
20
40
60
80
100
Cum
ulat
ive
Dom
inan
ce%
123456789101112
10
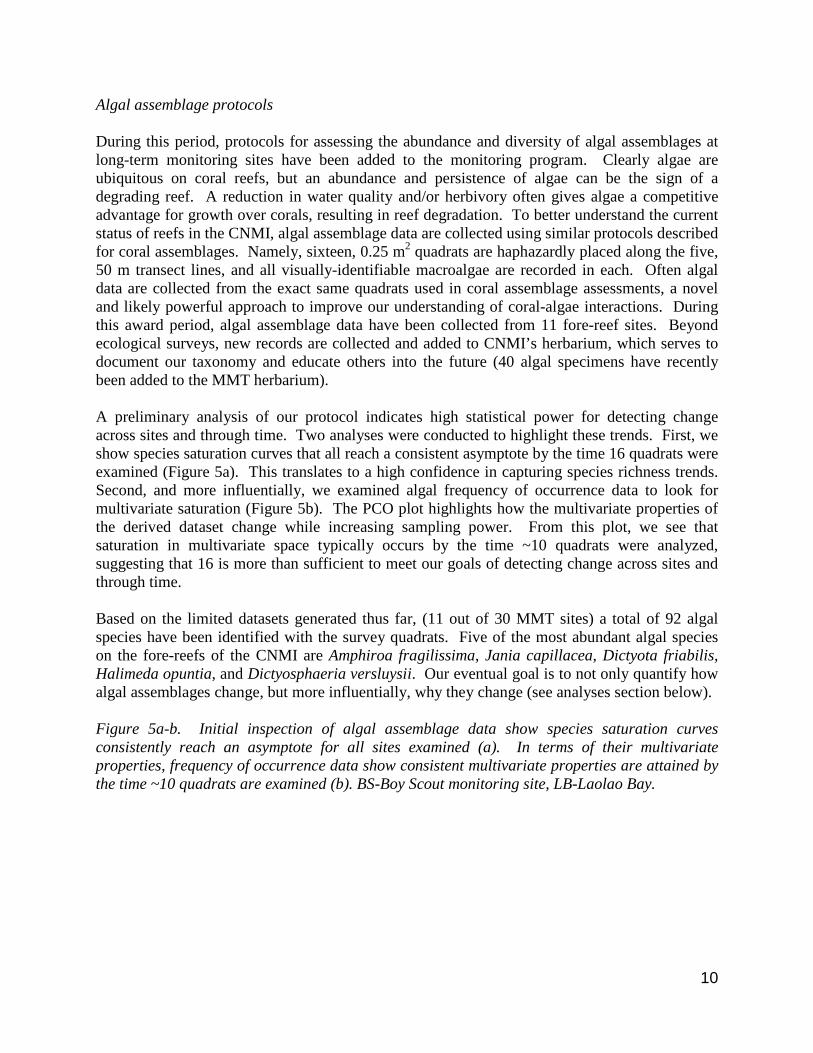
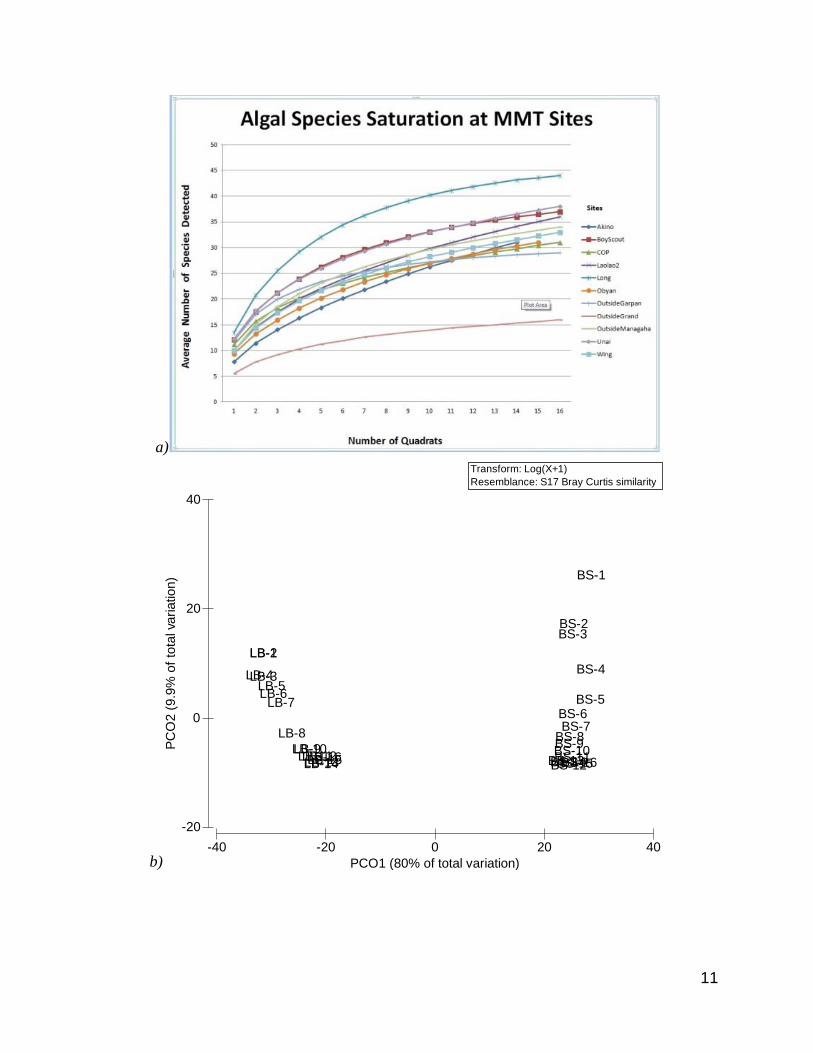
Algal assemblage protocols During this period, protocols for assessing the abundance and diversity of algal assemblages at long-term monitoring sites have been added to the monitoring program. Clearly algae are ubiquitous on coral reefs, but an abundance and persistence of algae can be the sign of a degrading reef. A reduction in water quality and/or herbivory often gives algae a competitive advantage for growth over corals, resulting in reef degradation. To better understand the current status of reefs in the CNMI, algal assemblage data are collected using similar protocols described for coral assemblages. Namely, sixteen, 0.25 m2 quadrats are haphazardly placed along the five, 50 m transect lines, and all visually-identifiable macroalgae are recorded in each. Often algal data are collected from the exact same quadrats used in coral assemblage assessments, a novel and likely powerful approach to improve our understanding of coral-algae interactions. During this award period, algal assemblage data have been collected from 11 fore-reef sites. Beyond ecological surveys, new records are collected and added to CNMI’s herbarium, which serves to document our taxonomy and educate others into the future (40 algal specimens have recently been added to the MMT herbarium). A preliminary analysis of our protocol indicates high statistical power for detecting change across sites and through time. Two analyses were conducted to highlight these trends. First, we show species saturation curves that all reach a consistent asymptote by the time 16 quadrats were examined (Figure 5a). This translates to a high confidence in capturing species richness trends. Second, and more influentially, we examined algal frequency of occurrence data to look for multivariate saturation (Figure 5b). The PCO plot highlights how the multivariate properties of the derived dataset change while increasing sampling power. From this plot, we see that saturation in multivariate space typically occurs by the time ~10 quadrats were analyzed, suggesting that 16 is more than sufficient to meet our goals of detecting change across sites and through time. Based on the limited datasets generated thus far, (11 out of 30 MMT sites) a total of 92 algal species have been identified with the survey quadrats. Five of the most abundant algal species on the fore-reefs of the CNMI are Amphiroa fragilissima, Jania capillacea, Dictyota friabilis, Halimeda opuntia, and Dictyosphaeria versluysii. Our eventual goal is to not only quantify how algal assemblages change, but more influentially, why they change (see analyses section below). Figure 5a-b. Initial inspection of algal assemblage data show species saturation curves consistently reach an asymptote for all sites examined (a). In terms of their multivariate properties, frequency of occurrence data show consistent multivariate properties are attained by the time ~10 quadrats are examined (b). BS-Boy Scout monitoring site, LB-Laolao Bay.
11
a)
b)
-40 -20 0 20 40PCO1 (80% of total variation)
-20
0
20
40
PCO
2 (9
.9%
of t
otal
var
iatio
n)
Transform: Log(X+1)Resemblance: S17 Bray Curtis similarity
BS-1
BS-2BS-3
BS-4
BS-5BS-6BS-7
BS-8BS-9BS-10BS-11BS-12BS-13BS-14BS-15BS-16
LB-1LB-2
LB-3LB-4LB-5LB-6
LB-7
LB-8LB-9LB-10LB-11LB-12LB-13LB-14LB-15LB-16
12
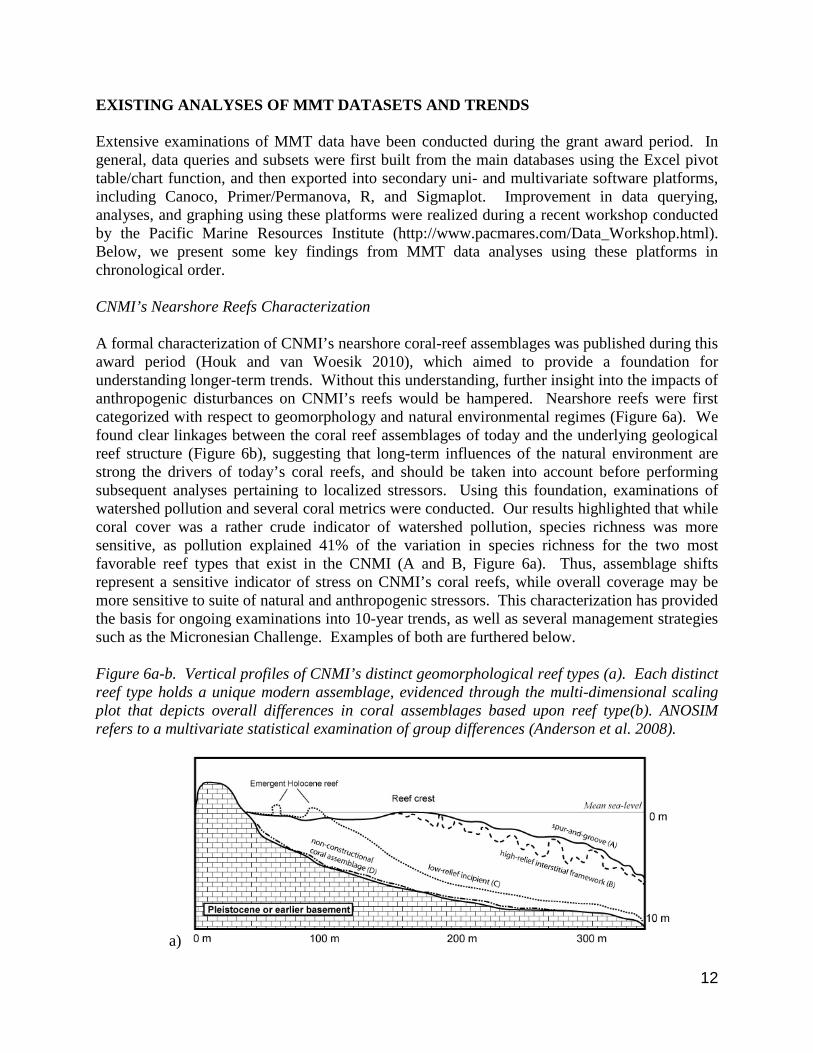
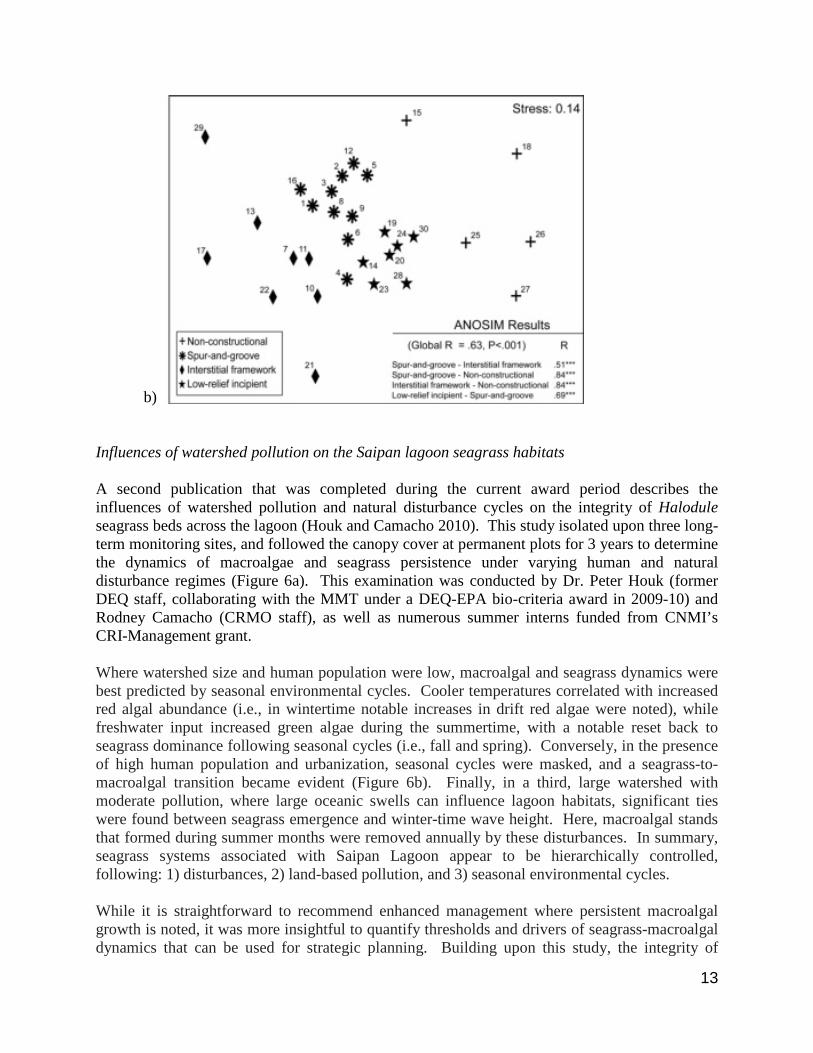
EXISTING ANALYSES OF MMT DATASETS AND TRENDS Extensive examinations of MMT data have been conducted during the grant award period. In general, data queries and subsets were first built from the main databases using the Excel pivot table/chart function, and then exported into secondary uni- and multivariate software platforms, including Canoco, Primer/Permanova, R, and Sigmaplot. Improvement in data querying, analyses, and graphing using these platforms were realized during a recent workshop conducted by the Pacific Marine Resources Institute (http://www.pacmares.com/Data_Workshop.html). Below, we present some key findings from MMT data analyses using these platforms in chronological order. CNMI’s Nearshore Reefs Characterization A formal characterization of CNMI’s nearshore coral-reef assemblages was published during this award period (Houk and van Woesik 2010), which aimed to provide a foundation for understanding longer-term trends. Without this understanding, further insight into the impacts of anthropogenic disturbances on CNMI’s reefs would be hampered. Nearshore reefs were first categorized with respect to geomorphology and natural environmental regimes (Figure 6a). We found clear linkages between the coral reef assemblages of today and the underlying geological reef structure (Figure 6b), suggesting that long-term influences of the natural environment are strong the drivers of today’s coral reefs, and should be taken into account before performing subsequent analyses pertaining to localized stressors. Using this foundation, examinations of watershed pollution and several coral metrics were conducted. Our results highlighted that while coral cover was a rather crude indicator of watershed pollution, species richness was more sensitive, as pollution explained 41% of the variation in species richness for the two most favorable reef types that exist in the CNMI (A and B, Figure 6a). Thus, assemblage shifts represent a sensitive indicator of stress on CNMI’s coral reefs, while overall coverage may be more sensitive to suite of natural and anthropogenic stressors. This characterization has provided the basis for ongoing examinations into 10-year trends, as well as several management strategies such as the Micronesian Challenge. Examples of both are furthered below. Figure 6a-b. Vertical profiles of CNMI’s distinct geomorphological reef types (a). Each distinct reef type holds a unique modern assemblage, evidenced through the multi-dimensional scaling plot that depicts overall differences in coral assemblages based upon reef type(b). ANOSIM refers to a multivariate statistical examination of group differences (Anderson et al. 2008).
a)
13
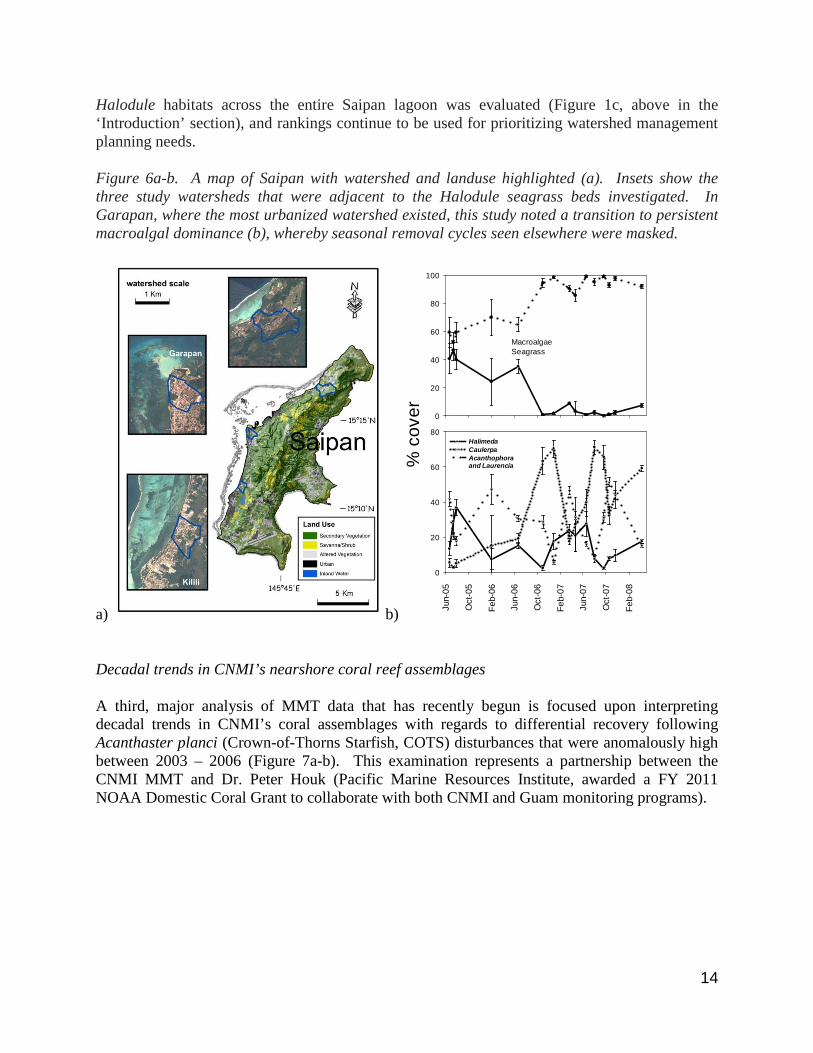
b) Influences of watershed pollution on the Saipan lagoon seagrass habitats A second publication that was completed during the current award period describes the influences of watershed pollution and natural disturbance cycles on the integrity of Halodule seagrass beds across the lagoon (Houk and Camacho 2010). This study isolated upon three long-term monitoring sites, and followed the canopy cover at permanent plots for 3 years to determine the dynamics of macroalgae and seagrass persistence under varying human and natural disturbance regimes (Figure 6a). This examination was conducted by Dr. Peter Houk (former DEQ staff, collaborating with the MMT under a DEQ-EPA bio-criteria award in 2009-10) and Rodney Camacho (CRMO staff), as well as numerous summer interns funded from CNMI’s CRI-Management grant. Where watershed size and human population were low, macroalgal and seagrass dynamics were best predicted by seasonal environmental cycles. Cooler temperatures correlated with increased red algal abundance (i.e., in wintertime notable increases in drift red algae were noted), while freshwater input increased green algae during the summertime, with a notable reset back to seagrass dominance following seasonal cycles (i.e., fall and spring). Conversely, in the presence of high human population and urbanization, seasonal cycles were masked, and a seagrass-to-macroalgal transition became evident (Figure 6b). Finally, in a third, large watershed with moderate pollution, where large oceanic swells can influence lagoon habitats, significant ties were found between seagrass emergence and winter-time wave height. Here, macroalgal stands that formed during summer months were removed annually by these disturbances. In summary, seagrass systems associated with Saipan Lagoon appear to be hierarchically controlled, following: 1) disturbances, 2) land-based pollution, and 3) seasonal environmental cycles. While it is straightforward to recommend enhanced management where persistent macroalgal growth is noted, it was more insightful to quantify thresholds and drivers of seagrass-macroalgal dynamics that can be used for strategic planning. Building upon this study, the integrity of
14
Halodule habitats across the entire Saipan lagoon was evaluated (Figure 1c, above in the ‘Introduction’ section), and rankings continue to be used for prioritizing watershed management planning needs. Figure 6a-b. A map of Saipan with watershed and landuse highlighted (a). Insets show the three study watersheds that were adjacent to the Halodule seagrass beds investigated. In Garapan, where the most urbanized watershed existed, this study noted a transition to persistent macroalgal dominance (b), whereby seasonal removal cycles seen elsewhere were masked.
a) b)
0
20
40
60
80
100
Jun-
05
Oct
-05
Feb-
06
Jun-
06
Oct
-06
Feb-
07
Jun-
07
Oct
-07
Feb-
08
% c
over
0
20
40
60
80Halimeda Caulerpa Acanthophora and Laurencia
Macroalgae Seagrass
Decadal trends in CNMI’s nearshore coral reef assemblages A third, major analysis of MMT data that has recently begun is focused upon interpreting decadal trends in CNMI’s coral assemblages with regards to differential recovery following Acanthaster planci (Crown-of-Thorns Starfish, COTS) disturbances that were anomalously high between 2003 – 2006 (Figure 7a-b). This examination represents a partnership between the CNMI MMT and Dr. Peter Houk (Pacific Marine Resources Institute, awarded a FY 2011 NOAA Domestic Coral Grant to collaborate with both CNMI and Guam monitoring programs).
15
Colony size (cm)0 - 2 2 - 4 4 - 8 8 - 16 16 - 32 32 - 64 > 64
Num
ber o
f col
onie
s
0
100
200
300
400
500
600
20032004200720082011
Note the return oflarger colonies not seen since 2003
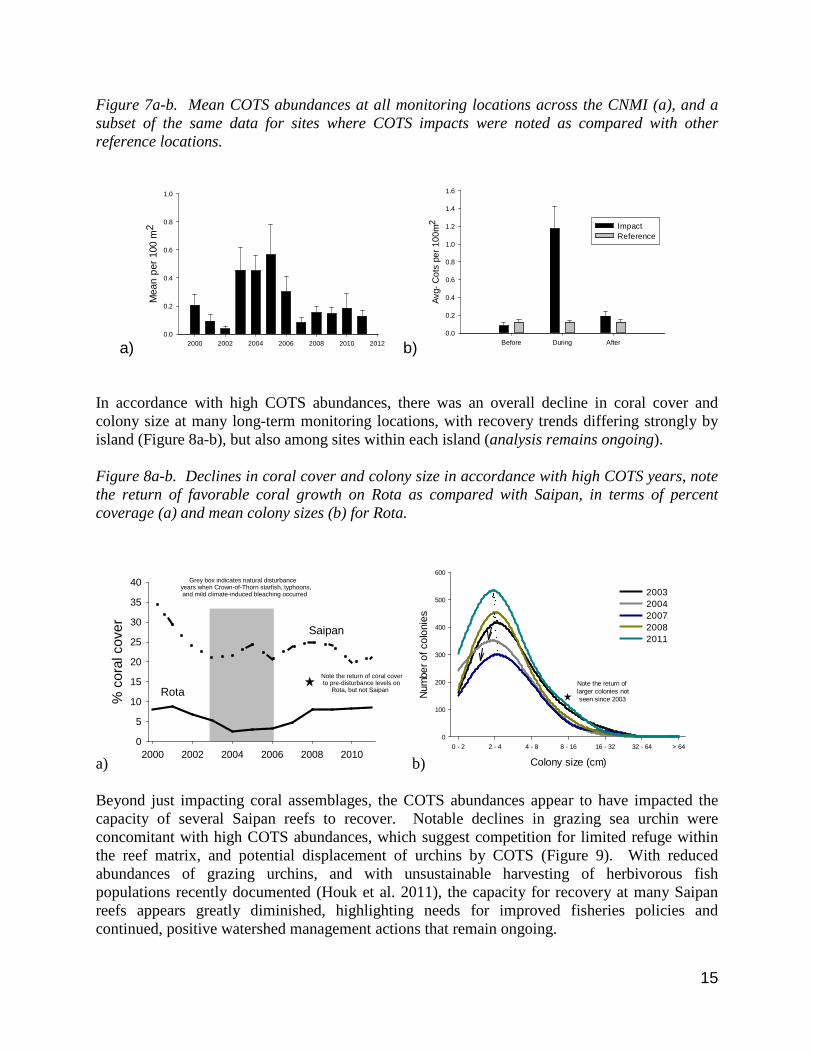
Figure 7a-b. Mean COTS abundances at all monitoring locations across the CNMI (a), and a subset of the same data for sites where COTS impacts were noted as compared with other reference locations.
a) 2000 2002 2004 2006 2008 2010 2012
Mea
n pe
r 100
m2
0.0
0.2
0.4
0.6
0.8
1.0
b) Before During After
Avg-
Cot
s pe
r 100
m2
0.0
0.2
0.4
0.6
0.8
1.0
1.2
1.4
1.6
ImpactReference
In accordance with high COTS abundances, there was an overall decline in coral cover and colony size at many long-term monitoring locations, with recovery trends differing strongly by island (Figure 8a-b), but also among sites within each island (analysis remains ongoing). Figure 8a-b. Declines in coral cover and colony size in accordance with high COTS years, note the return of favorable coral growth on Rota as compared with Saipan, in terms of percent coverage (a) and mean colony sizes (b) for Rota.
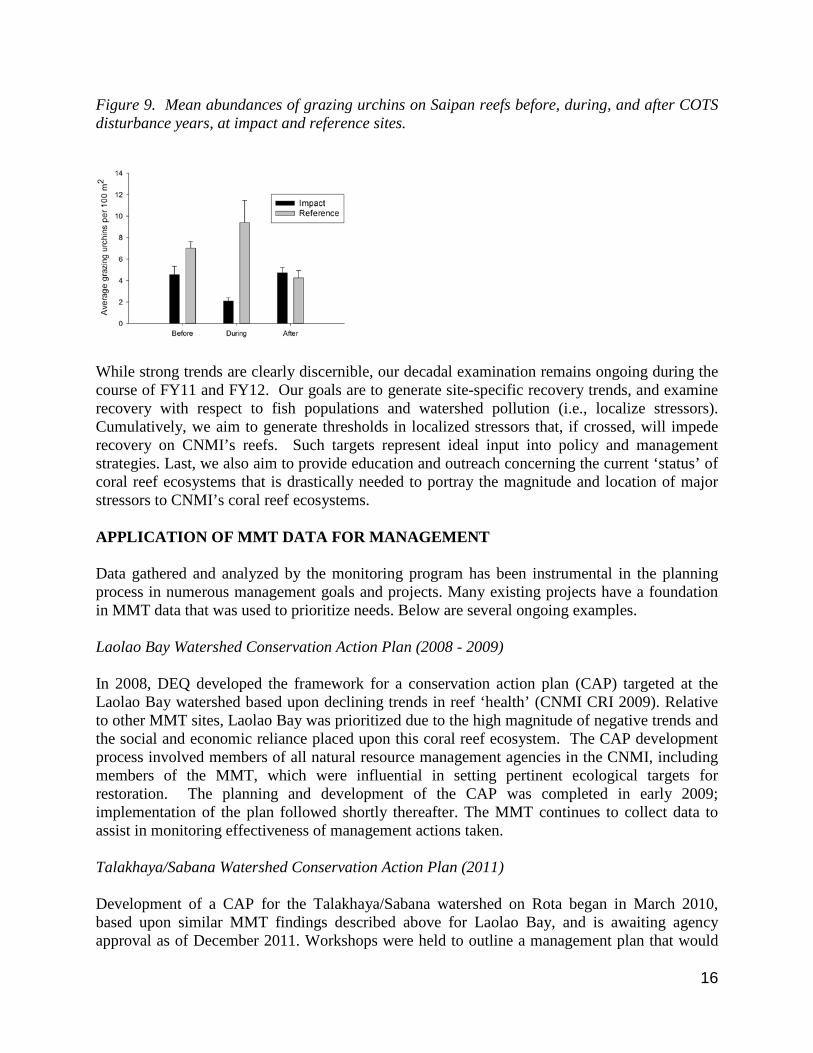
a) b) Beyond just impacting coral assemblages, the COTS abundances appear to have impacted the capacity of several Saipan reefs to recover. Notable declines in grazing sea urchin were concomitant with high COTS abundances, which suggest competition for limited refuge within the reef matrix, and potential displacement of urchins by COTS (Figure 9). With reduced abundances of grazing urchins, and with unsustainable harvesting of herbivorous fish populations recently documented (Houk et al. 2011), the capacity for recovery at many Saipan reefs appears greatly diminished, highlighting needs for improved fisheries policies and continued, positive watershed management actions that remain ongoing.
2000 2002 2004 2006 2008 2010
% c
oral
cov
er
0
5
10
15
20
25
30
35
40
Rota
Saipan
Grey box indicates natural disturbanceyears when Crown-of-Thorn starfish, typhoons, and mild climate-induced bleaching occurred
Note the return of coral cover to pre-disturbance levels on Rota, but not Saipan
16
Figure 9. Mean abundances of grazing urchins on Saipan reefs before, during, and after COTS disturbance years, at impact and reference sites.
While strong trends are clearly discernible, our decadal examination remains ongoing during the course of FY11 and FY12. Our goals are to generate site-specific recovery trends, and examine recovery with respect to fish populations and watershed pollution (i.e., localize stressors). Cumulatively, we aim to generate thresholds in localized stressors that, if crossed, will impede recovery on CNMI’s reefs. Such targets represent ideal input into policy and management strategies. Last, we also aim to provide education and outreach concerning the current ‘status’ of coral reef ecosystems that is drastically needed to portray the magnitude and location of major stressors to CNMI’s coral reef ecosystems. APPLICATION OF MMT DATA FOR MANAGEMENT Data gathered and analyzed by the monitoring program has been instrumental in the planning process in numerous management goals and projects. Many existing projects have a foundation in MMT data that was used to prioritize needs. Below are several ongoing examples. Laolao Bay Watershed Conservation Action Plan (2008 - 2009) In 2008, DEQ developed the framework for a conservation action plan (CAP) targeted at the Laolao Bay watershed based upon declining trends in reef ‘health’ (CNMI CRI 2009). Relative to other MMT sites, Laolao Bay was prioritized due to the high magnitude of negative trends and the social and economic reliance placed upon this coral reef ecosystem. The CAP development process involved members of all natural resource management agencies in the CNMI, including members of the MMT, which were influential in setting pertinent ecological targets for restoration. The planning and development of the CAP was completed in early 2009; implementation of the plan followed shortly thereafter. The MMT continues to collect data to assist in monitoring effectiveness of management actions taken. Talakhaya/Sabana Watershed Conservation Action Plan (2011) Development of a CAP for the Talakhaya/Sabana watershed on Rota began in March 2010, based upon similar MMT findings described above for Laolao Bay, and is awaiting agency approval as of December 2011. Workshops were held to outline a management plan that would
17
be developed by the various resource management agencies and stakeholders. This process revealed eight priority targets, one of which being coral reefs. The main threats to reef health were identified as sedimentation caused by soil erosion and unsustainable fishing. Coral ecosystem trends have been monitored by the MMT since 2000. Data highlight low condition reefs as compare with other sites on Rota, with recovery recently noted, that are being examined with respect to management activities. To support the goals of the CAP, surveys on these reefs were recently expanded to ensure that management targets are being accurately surveyed. Laolao Bay Road and Coastal Management Improvement Plan (2009-2011) As a part of the American Recovery and Reinvestment Act (ARRA), DEQ applied for and received a grant to improve infrastructure around Laolao Bay. Their grant application was aided by long-term MMT trends depicting declining coral reef condition, and their ability to document project success given positive changes in the watershed. Activities currently include revegetation of eroded upland areas, the paving and drainage improvements to Laolao Bay Drive, and installing stream crossing infrastructure to reduce sedimentation from the road. Intensive, pre-construction, project-based monitoring was conducted by DEQ and PMRI (Dr. Peter Houk), with collaboration by the MMP as described in the ARRA award. This intensive monitoring afforded a rare opportunity to re-survey over 50 transects established by the University of Guam Marine Laboratory in 1992 (Cheenis Pacific Company 1992). Through this rare opportunity, we found that ecological change in Laolao bay has been very substantial over the past 25 years. For example, the number of dominant coral species making up 70% of the coverage in standardized surveys has declined from 15 to 5, while macroalgae cover on the reef flats has increased by over 30% (http://www.pacmares.com/Laolao_Bay.html). Meanwhile, fish surveys revealed major declines in density for all major foodfish groups, and significant multivariate trends. Together, these translate to reduced fish function in Laolao, and highlight that beyond improving watershed pollution, enhanced fish populations are very likely needed to improve coral reef ‘condition’. In addition to the biological/ecological monitoring, the monitoring program is also assisting with the collection of water quality data from intermittent streams, reef flats, and a profile-tow of the entire bay. Trends in water quality are expected to be most responsive to watershed improvements. Science-based Goals for the CNMI’s Micronesia Challenge The Micronesia Challenge (MC) is a regional partnership developed across the five jurisdictions of Micronesia to effectively conserve 30% of marine resources and 20% of terrestrial resources. While most of the jurisdictions are currently determining if the MC goals are being met via an area-based approach, the CNMI is one of the few that are taking a deeper, science-based approach to evaluate success. In order to determine where the MC goals should be centered, CNMI determined that 30% of the reefs in each unique geomorphological reeftype (noted above) must be effectively conserved. We have defined effective conservation by two measures of the coral reef ecosystem: 1) a ratio of favorable-to-unfavorable benthic substrate abundance (i.e., coral and crustose coralline algae to turf and macroalgae), and 2) deviations from expected coral species richness patterns (described above as significant descriptors of watershed pollution). For
18
instance, the negative trends at Laolao were indicators leading us to select this site for our MC goals, and current monitoring trends will evaluate progress through time. CONCLUSION
Through the hard work of the MMT, valuable data has been collected documenting the status and trends of the coral reef communities of the CNMI. Rigorous analysis and insightful questions have allowed our program to answer old questions and we are now at the point where we can look at reef trends over the past decade. Once this is complete, we plan to focus on how climate change may affect our coral reefs and also look into similar decadal trends within the lagoon habitats. Lastly, managers will continue to utilize the MMT data to address the CNMI’s coral reef management priorities and the Micronesia Challenge.
19
REFERENCES Anderson M, Gorley R, Clarke K (2008) PERMANOVA+ for PRIMER: Guide to Software and Statistical Methods.
Plymouth, UK, 214pp PRIMER-E, Plymouth, UK, 214pp Brock, V. E. 1954, 'A preliminary report on a method of estimating reef fish populations', J.
Wildl. Management. 18:297-308. Cheenis Pacific Company (1992) Quantitative marine baseline survey. Biological resources and water quality. Bahia
Laulau and Unai Laulau Kattan areas, Saipan, Mariana Islands. In: Office CCRM (ed), Saipan, MP. Houk P, Camacho R (2010) Dynamics of seagrass and macroalgal assemblages in Saipan Lagoon, Western Pacific
Ocean: disturbances, pollution, and seasonal cycles. Botanica Marina 53:205-212 Houk P, Van Woesik R (2008) Dynamics of shallow-water assemblages in the Saipan Lagoon. Marine Ecology
Progress Series 356:39-50 Houk P, Rhodes K, Cuetos-Bueno J, Lindfield S, Fread V, Mcilwain J (2011) Commercial coral-reef fisheries across
Micronesia: A need for improving management. Coral reefs In press Houk P, Van Woesik R (2010) Coral assemblages and reef growth in the Commonwealth of the Northern Mariana
Islands (Western Pacific Ocean). Marine Ecology 31:318-329 Houk P, Starmer, J (2008) Marine and Water Quality Monitoring Plan for the Commonwealth of the Northern
Mariana Islands. Technical Report by the CNMI Division of Environmental Quality and Coastal Resource Management Office, Saipan, MP.
Houk P, Okano R, Iguel J, Camacho R, Johnson S (2011) Laolao Bay Road and Coastal Management Improvement
Project: Ecological and Water Quality Assessment. PMRI, DEQ, CRMO, Saipan, MP CNMI Coral Reef Initiative (2009) Laolao Bay Conservation Action Plan. In: Agencies CNRM (ed), Saipan, MP. CNMI Coral Reef Initiative (2011) Talakhaya/Sabana Conservation Action Plan. In: Agencies CNRM (ed), Saipan,
MP. McIntyre A.D., Eleftheriou A (2007). Methods For The Study Of Marine Benthos. Wiley-Blackwell. Samoilys M.A., Carlos G (2000). "Determining methods of underwater visual census for estimating the abundance
of coral reef fishes." Environmental Biology of Fishes. 57: 289-304. Watson R.A., Quinn T (1997). "Performance of transect and point count underwater visual census
methods."Ecological Modelling. 104: 103-112.