Embed Size (px)
Citation preview

CORAD Consortium for Rehabilitation &
Development (CARE,CRS, World Vision with ARC and Search for Common Ground)
PROMOTING LINKAGES FOR LIVELIHOOD SECURITY AND ECONOMIC DEVELOPMENT (LINKS)
with funding from USAID & UNDP
7/31/2008
CORAD Farmer Field Schools in Sierra Leone

A Livelihood Impact Assessment July 31, 2008


Evaluation of CORAD Farmers Field Schools
I. CONTENTS
I. CONTENTS ...................................................................................................................................... ii II. INTRODUCTION .............................................................................................................................. 1
A. CORAD ......................................................................................................................................... 1 B. CORAD Farmers Field Schools ...................................................................................................... 1 C. Methodology of FFS Assessment ................................................................................................. 3
i. Selection of Respondents ......................................................................................................... 3 ii. Questionnaire design and administration ................................................................................. 3 iii. The use of GPS equipments ................................................................................................. 4 iv. The Study Hypotheses ......................................................................................................... 4 v. Data entry and Analysis ............................................................................................................ 5 vi. Outline of the Report ........................................................................................................... 5
III. DEMOGRAPHIC PROFILE ................................................................................................................ 5 IV. LIVELIHOOD ACTIVITIES ................................................................................................................. 9 V. OUTREACH OF FARMERS FIELD SCHOOLS .................................................................................. 10 VI. IMPACT OF THE FARMERS FIELD SCHOOLS ................................................................................ 13
A. Use of Production Assets ............................................................................................................ 13 B. Adoption of Improved Technology ............................................................................................. 15
VII. Use of Soil Conservation Techniques .......................................................................................... 17 C. Impact on crop production and productivity ............................................................................... 19 D. Impact on Food Security ............................................................................................................. 24
VIII. SUMMARY AND CONCLUSIONS ............................................................................................... 26 IX. Bibliography .................................................................................................................................. 28 X. ANNEX 1 ........................................................................................................................................ 29
Page ii of 49

Evaluation of CORAD Farmers Field Schools List of Tables Table 1: Experiments conducted by CORAD Farmer Field Schools ............................................................ 2 Table 2: Mean Household size of beneficiary and non‐beneficiary farmers (Number of persons), 2008 ..... 6 Table 3: Average total crop area and average area for selected crops for households that cultivated the crop in 2007 (hectares) ............................................................................................................................ 19 Table 4: Avg. crop production per household (Kg) for households that grew a particular crop ................. 20 List of Figures Figure 1: Literacy among farmers .............................................................................................................. 6 Figure 2: Age distribution of Farmers ........................................................................................................ 7 Figure 3: Gender distribution of farmers .................................................................................................... 7 Figure 4: Construction of walls of dwellings ............................................................................................... 8 Figure 5: Roofing materials of dwellings .................................................................................................... 8 Figure 6: Most important source of livelihood ........................................................................................... 9 Figure 7: Most important crop contributing to household livelihood .......................................................... 9 Figure 8: Second most important crop contributing to household livelihood ........................................... 10 Figure 9: Knowledge of FFS among non‐participants .............................................................................. 11 Figure 10: What non‐participants say FFS does ....................................................................................... 11 Figure 11: Attempts by non‐participants to join FFS and reasons why they did not .................................. 12 Figure 12: Copying from FFS by non‐participants .................................................................................... 12 Figure 13: Farmers access to irrigation equipment ................................................................................... 13 Figure 14: Farmers access to irrigation equipment ................................................................................... 14 Figure 15: Access to processing equipment ............................................................................................. 14 Figure 16: Farmers access to storage facilities ......................................................................................... 15 Figure 17: Farmers access to improved varieties ...................................................................................... 15 Figure 18: Adoption of improved livestock breeds ................................................................................... 16 Figure 19: Farmers adopting agro‐chemicals ........................................................................................... 16 Figure 20: Farmers adoption of technical advice ...................................................................................... 17 Figure 21: Adoption of soil conservation practices ................................................................................... 18 Figure 22: Farmers source of soil conservation information ..................................................................... 18 Figure 23: Length of time farmers have practiced soil conservation techniques ....................................... 19 Figure 24: Major crops planted by farmers in 2007 .................................................................................. 20 Figure 25: Average crop yields in 2007 ..................................................................................................... 21 Figure 26: Increase in crop yields per field between 2004 and 2007 .......................................................... 21 Figure 27: Average % of crop production sold by households that made sales ......................................... 22 Figure 28: Average volume of products sold by households that made sales ........................................... 22 Figure 29: Average household income (value of agricultural production) ................................................. 23 Figure 30: Weighted average household production of processed products ............................................. 23 Figure 31: Average household income from sales of selected crops ......................................................... 24 Figure 32: Household perception of food security .................................................................................... 25 Figure 33: Household perception of changes in food security ‐ 2 .............................................................. 25 Figure 34: Household perceptions of changes in food security since 2004 ................................................ 26
Page iii of 49
Evaluation of CORAD Farmers Field Schools
Page iv of 49
Acronyms/Abbreviations CORAD Consortium for Rehabilitation and Development FANTA Food and Nutrition Technical Assistance FFS Farmer Field Schools HFIAS Household Food Insecurity Access Scale IVS Inland Valley Swamp LEAD Livelihood Expansion for Asset Development LINKS Promoting Linkages for Livelihood Security and Economic Development USAID United States Agency for International Development US United States of America

Evaluation of CORAD Farmers Field Schools
II. INTRODUCTION
A. CORAD
The Consortium for Rehabilitation and Development (CORAD) which has been working together since mid‐2003 is currently implementing two programs supported by a US Cash Grant and a Title II Grant to restore agricultural‐based livelihoods, improve food security and build community resiliency.
Building on the successes and lessons learned from a previous Title II program, CORAD is in its third year of implementing a 3 year USAID funded “Promoting Linkages for Livelihood Security and Economic Development” (LINKS) Program to expand economic activities in rural communities and to re‐establish agricultural input and output marketing linkages between these communities and the mezzo and national level market players.
The Livelihood Expansion for Asset Development (LEAD), the current Title II program, is specifically designed to add value to the LINKS program by building on the foundations established by a previous Title II program the Developmental Relief Program (DRP) in the rural areas in the agriculture and health sectors with new activities that leverage impact; specifically target and enable poor farmers and economically marginalized youth to undertake new or expanded livelihood activities; expand community resiliency with improved linkages to health services, community water and sanitation, agricultural infrastructure and community‐managed safety nets and to empower community‐based groups to practice and promote principles of good governance.
In its effort to build community resilience and ensure a market led development process CORAD has been using the Farmers Field School (FFS) as a vehicle for development in the implementation of both the LINKS and LEAD programs.
B. CORAD Farmers Field Schools1
The Farmers Field School (FFS) lies at the heart of the LINKS program both as the main coordination point for all LINK‐sponsored activities in the various communities and as an organization and technology training center. Farmer Field Schools have been set up by different Non‐governmental Organizations (NGOs) in various communities throughout the country, with varying degrees of success.
As operated by CORAD members, a FFS will comprise approximately 30 members, both men and women and will have an executive that is normally half men and half women. The group is set up with the assistance of CORAD field staff, although in many cases it would appear that field agents worked with pre‐existing groups. This is a sound methodology that avoids the issue of groups being set up for the sole purpose of receiving benefits, and promotes sustainability and ownership of group activities.
The CORAD field agent would work with an FFS directly for a period of one year. During that time, the group would decide on a limited number of agricultural trials that they wished to
1 Drawn mainly from the RAISE report, 2007
Page 1 of 49

Evaluation of CORAD Farmers Field Schools undertake and the field agent would assist in the setting up and implementation of those trials. Frequently such trials would include seed rate experiments, spacing trials, sowing method trials, variety trials, manuring trials and other simple aspects of agricultural production (Table 1). The field agent would provide improved seeds as necessary and would ensure that the trials were replicated, properly laid out and well managed. The FFS members would undertake all operations, including the laying out, sowing and subsequent weeding and observation. Results would be obtained at harvest time in the form of final yields.
Table 1: Experiments conducted by CORAD Farmer Field Schools
FFS Experiments Crops
Variety trials All crops especially Rice, Sweet Potato, Cassava, Vegetable, Maize
Appropriate crop combination Upland rice; Sweet Potato; Cassava, Pigeon Peas; Maize Method and procedure of land preparation
Sweet Potato; Cassava; Rice; Maize, vegetables
Plant population and density All crops Timeliness of weeding All crops Apical and stem planting techniques Cassava and Sweet Potato Appropriate and improved nursery practices
Oil Palm, Coffee, Cocoa, Vegetables
Economic use of planting materials Rice; Maize; Cassava; Sweet Potato; various seeds and nursery materials.
During the course of the year, the field agent would identify one or two potential facilitators in the group. At the end of the year, these facilitators would be trained to take charge of the group and would be tasked with setting up another two FFSs in adjacent communities. The field agent would then reduce his/her contact with the original FFS to monthly supervision, although in some cases (e.g. WVSL) the facilitators would not be supervised monthly, but would receive quarterly retraining at central points. This reduced transport costs.. Farmer facilitators would each receive a bicycle to assist them in their work, and would make individual arrangements with each community as regards payment for their services. This normally consisted of payment in kind, usually group work on the facilitators’ own farms.
The RAISE evaluation team observed that trials were carried out with a high degree of precision as regards laying out, seedbed preparation, timeliness, weeding and all other aspects of crop husbandry. These skills were directly passed to all group members and were then carried into their own crop production practices. The experiment served both to maintain members interest and as a vehicle for the demonstration of fundamental agricultural skills. The field agent was also able to pass on simple concepts of Inland Valley Swamp (IVS) development and water control, pest control, animation and community development, nutrition and food security, crop marketing and basic business principles during the course of weekly meetings with the group. At the same time, group cohesion was developed and could be carried into other community activities (e.g., group land clearance or group house‐building).
The establishment and growth of the FFS has varied from district to district, from community to community and from Links partner to partner. In Kailahun District, 52 FFS were established under the supervision of CRS in the following chiefdoms: Upper Bambara, Peje West, Penguia, Njaluahun, Peje Bongre, Yawei. In Kono District, 305 FFS were established during 2005 – 2007
Page 2 of 49

Evaluation of CORAD Farmers Field Schools under the supervision of World Vision in the following chiefdoms; Fiama, Lei, Gbane Kandor, Kameindor, Toli, Soa, Sandor. In Koinadugu District, 90 FFS were established under the supervision of CARE during 2005 – 2007 in the following chiefdoms; Wara Wara Yagala, Sengbeh, Dembelia Sinkunia, Folosaba Dembelia. In addition to the effort by CARE in Koinadugu, CRS also established 52 FFS in Diang, Nieni, Mongo and Sulima chiefdoms during the LINKS project period.
The most popular crops tried in the FFS in order of priority were lowland rice followed by cassava, vegetable and groundnut. Upland rice featured less prominently in Koinadugu compared with Kailahun and Kono. However, there is growing dominance of lowland rice cultivation as against upland rice. This trend has great environmental value as it will tend to protect the forests from slash and burn farming and environmental destruction.
C. Methodology of FFS Assessment
The following methodology was used in conducting the Assessment of the Farmers Field Schools.
1. Conducted a thorough literature review of project and other documents and conducted interviews with key stakeholders and managers of the CORAD FFS in order to get a full understanding of the operation of the projects, with emphasis on understanding the objectives, inputs, expected outputs and outcomes against which the progress achieved by the FFS are to be assessed.
2. From the review above a detailed list of questions and issues to be considered during the assessment were drafted, including a key set of hypothesis to be tested.
3. A representative sample of FFS was selected from each of the three Districts where CORAD FFS have been in operation and primary data collected by individual interviews of participating and non‐participating farmers. The questionnaire was designed to collect information on how far ideas being developed in the Schools are diffusing in surrounding farming communities, and critically to obtain information on the livelihood impact of FFS activities i.e. a quantitative evaluation of the impact of FFS activities and technologies on households’ productivity and food security.
i. Selection of Respondents
A statistical sample of 600 farmers (95% Confidence level, 4% margin of error), out of the 15,900 estimated total population of participants in the CORAD FFS was used in this study. A similar number of respondents were selected who were not members of the FFS. These were divided equally between farmers located in villages that had FFS (so called “Near” non‐participants) and those located around 10 – 20 Kms away who were not members of FFS (so called “Far” non‐participants). To select the 600 participants, the FFS were assigned numbers and arranged in numerical order. The numbers of farmers in a randomly generated list of 600 respondents that fell within a particular FFS were selected randomly by the enumerators
ii. Questionnaire design and administration
Questionnaires were used to collect information from the farmers (See Annex 1). The questionnaire focused on assessing the impact of FFS by analyzing any differences in the
Page 3 of 49

Evaluation of CORAD Farmers Field Schools household livelihood outcomes between participating and non‐participating farmers. To aid recall during the interview the year of the Local Government elections was used as the benchmark before the CORAD FFS program commenced (i.e. before 2004). The questionnaire is sub‐divided into seven different sections:
• Household information • Livelihood activities (crops, livestock, fishing, assets, farm diversification, soil
conservation, labor, marketing) • Livelihood outcomes (including the Household Food Insecurity Access Scale) • Participating households’ perceptions about FFS‐induced impacts • Non‐Participating households’ perceptions about recent changes • Outreach to Non‐FFS households • Field measurements
The main questionnaire was administered by the enumerators in the farmers homestead with Section C on the Household Food Insecurity Access scale (USAID, 2007) for measurement of food access being administered to the person usually preparing meals in the household, and field measurements being administered while standing in the farmers’ field.
Enumerators were staff of the CORAD partner organizations. To eliminate the possibility of bias staff were assigned to work outside the areas of their employing agency. Thus WVSL staff served as enumerators in Kailahun and Koinadugu but not in Kono District, while CARE staff members served as enumerators in Kono but not in Kailahun District. EDS deployed its own Associates as Supervisors to guide the enumerators and provide another level of independence in the process of data collection
iii. The use of GPS equipments
Global Positioning Equipments (GPS) were used for two purposes during the field survey. The first was to locate the survey village/homestead in order to allow mapping of the FFS villages and farms at a future date. The second was to measure the farmers’ fields using the field area measurement option in the GPS equipment. The second purpose was very critical as it aided farmer’s recall of their current output as well as the output from similar fields on of before 2004, the year CORAD FFS were initiated.
iv. The Study Hypotheses
Three null hypotheses guide the study. The first is that there is no difference in the levels of production and sales, livelihoods and food security, and access to and use of inputs between the FFS beneficiaries and non‐participating farmers in the program in 2008.
The second null hypothesis is that there is no difference in the levels of production and sales, livelihoods and food security, and access to and use of inputs for FFS beneficiaries between 2004 when the program started and 2008 when the assessment was conducted.
The third null hypothesis is that there was no spill over effect of the project benefits to non project sites during the four years of project implementation.
Page 4 of 49

Evaluation of CORAD Farmers Field Schools
v. Data entry and Analysis
Data entry formats were developed using the MS Excel software. Data was entered into the Excel database over a period of about one month by two Research Associates. The transcribed data was cross checked for quality and cleaned before analysis commenced. Data was analyzed and Tables and graphs were produced with MS Excel.
The impacts of CORAD FFS were analyzed based on differences emerging over time and across space, i.e. a comparison between i) the answers provided on what happened before 2004 and in 2008, and ii) between farmers that participated in the FFS Program and those who did not. The comparison between the responses provided by participating farmers in the Program and non‐participating farmers were crucial in the assessment of the FFS impact. The impact of the FFS was also assessed through the households’ perceptions of the program‐induced changes.
In order to assess the outreach of FFS, data from both “Near” and “Far” non‐FFS beneficiaries (sections E and F of the questionnaire) were compared with those from FFS participants
vi. Outline of the Report
The results are presented in three sections. The first section introduces the socio demographic characteristics of the FFS participating farmers and that of non‐participating farmers. The second section compares the livelihood activities of participating and non‐participating households. The spill‐over effect of the program to non‐participating farmers and perceptions of both participating and non‐participating farmers are presented in the third section. In the fourth section the impact of FFS on adoption of improved technologies, crop production and productivity and food security are discussed. Results of the survey based on comparisons between participating farmers in the FFS program and non‐participating farmers are presented. Cross sectional and longitudinal analyses are used to compare the present situation between farmers who participated in the program over the four year period and those that did not participate in the program.
III. DEMOGRAPHIC PROFILE
Table 2 shows the mean number of men and women above 15 years and children below 15 years in the FFS beneficiary and non‐beneficiary households. The number of men and women above 15 years is nearly the same in the beneficiary and non‐beneficiary households. Similarly the number of children below 15 years is the same in all three categories of farmer groups. There is no significant difference in the household size between the different categories, confirming the criteria that guided the selection of all categories of farmers’ i.e. similar population characteristics.
Page 5 of 49

Evaluation of CORAD Farmers Field Schools Table 2: Mean Household size of beneficiary and non‐beneficiary farmers (Number of persons), 2008
Mean Std Deviation
FFS Households Men over 15 years 2.60 1.80 Women over 15 Years 2.77 2.60 Children under 15 years 4.25 2.26
Non‐FFS Households (Nearby)
Men over 15 years 2.64 1.82 Women over 15 Years 2.59 1.81 Children under 15 years 4.03 2.25
Non‐FFS Households (Far off) Men over 15 years 2.43 1.91 Women over 15 Years 2.44 1.62 Children under 15 years 4.11 2.06
Among the beneficiary farmers (Figure 1), only 28 percent were literate while 72 percent were not literate. The proportion of literate farmers was lower (about 20%) among the non beneficiaries. These literacy rates compare unfavorably with the national average of 38.6% (Thomas, 2007) confirming the disadvantage nature of households in the CORAD project Districts.
Figure 1: Literacy among farmers
Figure 1: Literacy among farmers
0102030405060708090
FFS Near Far
Perc
ent o
f HH
LiterateIlliterate
The age distribution (Figure 2) somewhat follows a normal curve for both beneficiary and non‐beneficiary farmers. In all farmer categories the highest age interval frequency is between 26 and 50 years, almost equally divided between the youths (under 35 years) and the adults. However, the proportion of youths is no higher among FFS participants compared to the non‐participants, indicating that FFS membership is not skewed in favor of youths.
Page 6 of 49

Evaluation of CORAD Farmers Field Schools Figure 2: Age distribution of Farmers
Figure 2: Age distribution of Farmers
05
101520253035404550
15-25 yrs 26-35 yrs 36-50 yrs 51-65 yrs Over 65 yrs
Perc
ent o
f HH
FFSNearFar
Figure 3 shows the gender distribution of sample farmers indicating that about 40% of FFS farmers are female. It is roughly the same for non‐participants leaving in villages with FFS, but slightly higher (50%) among non‐participants living in villages without FFS. These results indicate that targeting for CORAD FFS has succeeded in getting participation in FFS to reflect the representation of female farmers in the area, i.e. men have not captured this development activity
Figure 3: Gender distribution of farmers
Figure 3: Gender distribution of Farmers
0
10
20
30
40
50
60
70
FFS Near Far
Per
cent
of H
H
FemaleMale
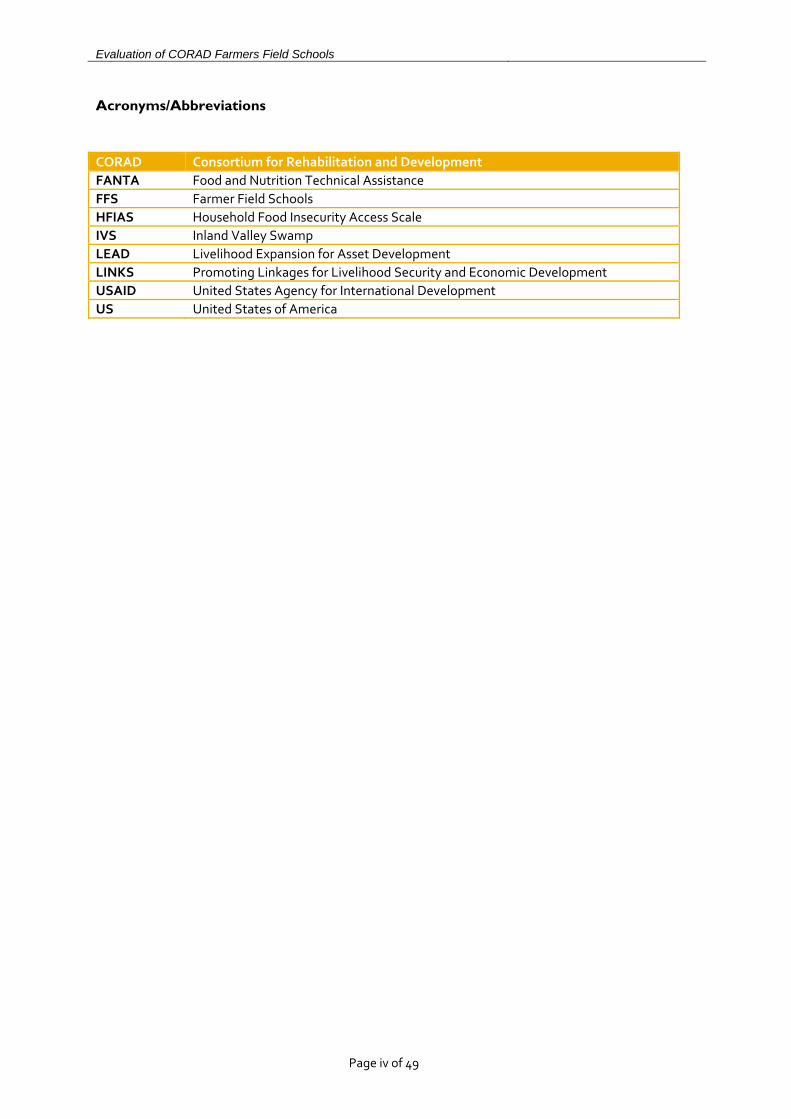
Figure 4 shows that mud is the most common material used for construction of dwellings, while Figure 5 shows that almost half of the dwellings are still roofed with thatch. Significantly, the proportion of dwellings with zinc roofing – an indication of the wealth status of a household, is no higher for FFS compared to non‐FFS households. This implies that whatever benefits have been derived by households from participating in FFS has not yet been translated into wealth acquisition.
Page 7 of 49
Evaluation of CORAD Farmers Field Schools Figure 4: Construction of walls of dwellings
Figure 4: Construction of Walls of Dwellings
0
10
20
30
40
50
60
70
80
90
Wood Mud Cement Others
Perc
ent o
f HH
FFSNearFar
Figure 5: Roofing materials of dwellings
Figure 5: Roofing Materials of Dwellings
0
10
20
30
40
50
60
FFS Near Far
Perc
ent o
f HH
ThatchZincOthers
Page 8 of 49

Evaluation of CORAD Farmers Field Schools IV. LIVELIHOOD ACTIVITIES
By far the main source of livelihood for both FFS beneficiary farmers and non‐beneficiary farmers is annual upland cropping with 70% or more of the farmers indicating that it as most important (Figure 6). Tree crops are a very distant second with just under 10% ranking them as most important. Among crops rice is ranked as the most important contributor to household livelihood by about 70% of farmers (Figure 7).
Figure 6: Most important source of livelihood
Figure 6: Most Important Source of Livelihood
01020
30405060
708090
UplandCrops
Tree Crops Livestock Fishing Off-farm Others
Per
cent
of H
H
FFSNearFar
Figure 7: Most important crop contributing to household livelihood
Figure 7: Most Important Crop contributing to Household Livelihood
01020304050607080
Oil Palm
CocoaCoffe
eRice
Maize
Cassava
Sweet P
ot
G-nuts Vegs
Others
Perc
ent o
f HH
FFSNearFar
The distribution of crops that ranked second in contribution to household livelihoods was more dispersed (Figure 8) with cassava ranked second as often as the tree crops in this tree crop belt of Sierra Leone. In general, there is no difference between participating and non‐participating household in the ranking of most important sources of livelihoods. It is important to note the
Page 9 of 49

Evaluation of CORAD Farmers Field Schools very low contribution of off –farm activities to household livelihoods, reinforcing the importance of farming in the CORAD focus districts
Figure 8: Second most important crop contributing to household livelihood
Figure 8: Second most important crop contributing to Household Livelihood
0
5
10
15
20
25
30
Oil Palm
CocoaCoffe
eRice
Maize
Cassava
Sweet P
ot
G-nuts Vegs
Others
Perc
ent o
f HH
FFSNearFar
V. OUTREACH OF FARMERS FIELD SCHOOLS
One of the most important issues relating to the impact and sustainability of investments in capacity building using FFS is the degree to which the benefits of such programs spread to non‐participating farmers. In addition to the need for counter factual assessments, i.e. an assessment of the degree to which changes observed among FFS farmers would have occurred anyway, the selection of non‐participating farmers was designed to determine the extent to which benefits from FFS have spilled over to non‐participants.
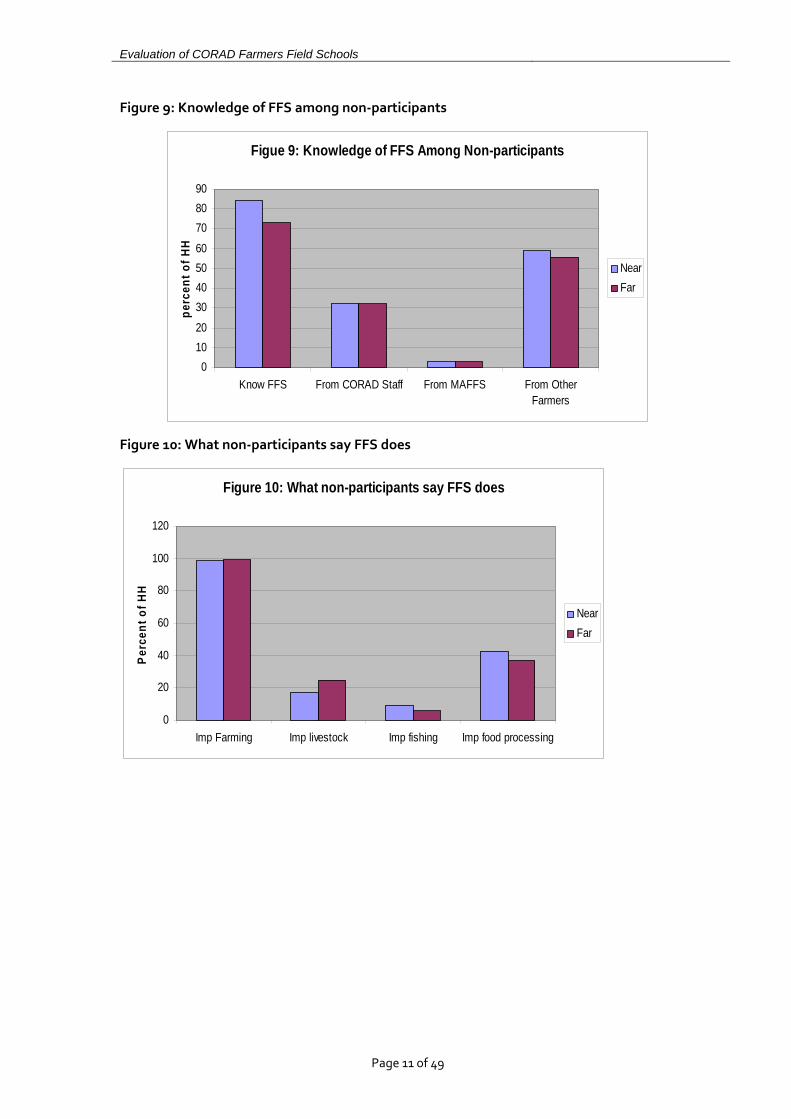
Non‐participants learn about FFS mainly from other farmers. Figure 9 shows that over 80% of farmers living in the same villages as FFS members know about the existence and activities of FFS. The proportion is only slightly lower for non‐participants in more distant villages (72%). About 60 percent of non‐participants learn about the FFS mainly from other farmers while the rest got information from CORAD staff. Ministry of Agriculture (MAFFS) extension staff are not relevant sources of information.
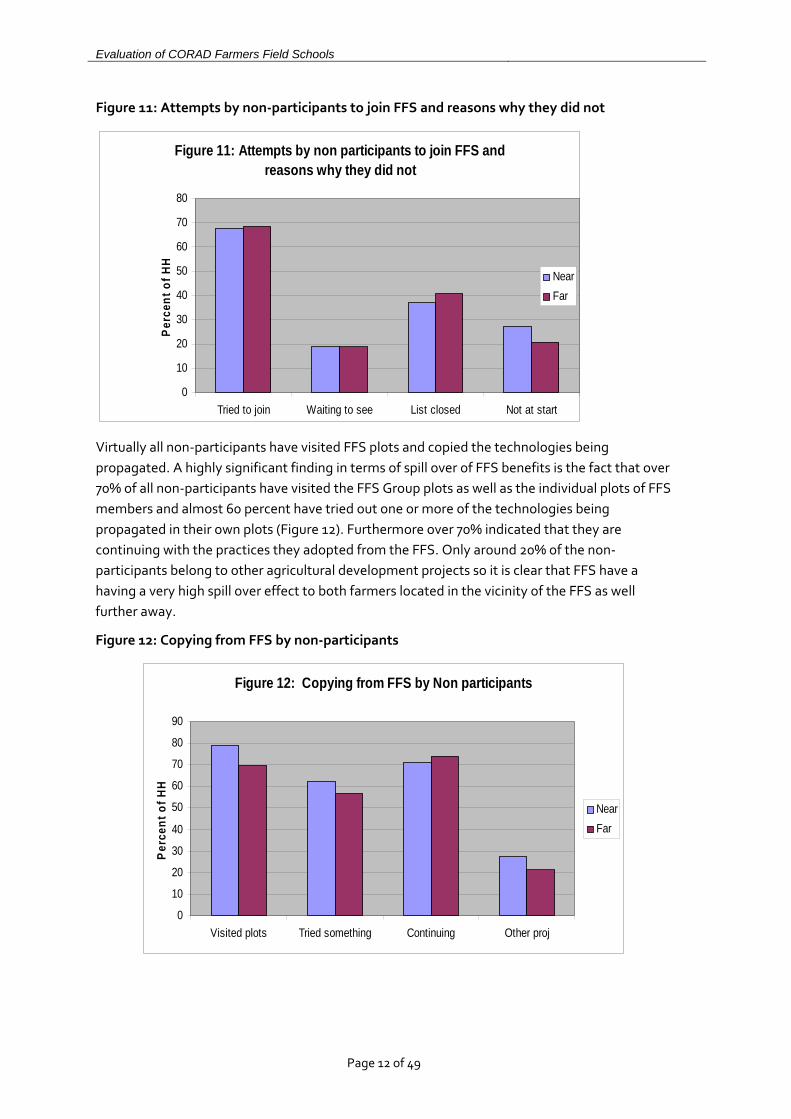
As far as non‐participants are concerned FFS help to improve farming and to a much lower extent to improve crop processing (Figure 10). Over 70% have attempted to join the FFS (Figure 11). They have not joined mainly because the lists were closed or they were out of the locality when members were being recruited into the FFS, although as expected, there was a small proportion (about 20%) that waited to see what the FFS would achieve before trying to join.
Page 10 of 49
Evaluation of CORAD Farmers Field Schools Figure 9: Knowledge of FFS among non‐participants
Figue 9: Knowledge of FFS Among Non-participants
01020
30405060
708090
Know FFS From CORAD Staff From MAFFS From OtherFarmers
perc
ent o
f HH
NearFar
Figure 10: What non‐participants say FFS does
Figure 10: What non-participants say FFS does
0
20
40
60
80
100
120
Imp Farming Imp livestock Imp fishing Imp food processing
Perc
ent o
f HH
NearFar
Page 11 of 49
Evaluation of CORAD Farmers Field Schools Figure 11: Attempts by non‐participants to join FFS and reasons why they did not
Figure 11: Attempts by non participants to join FFS and reasons why they did not
0
10
20
30
40
50
60
70
80
Tried to join Waiting to see List closed Not at start
Perc
ent o
f HH
NearFar
Virtually all non‐participants have visited FFS plots and copied the technologies being propagated. A highly significant finding in terms of spill over of FFS benefits is the fact that over 70% of all non‐participants have visited the FFS Group plots as well as the individual plots of FFS members and almost 60 percent have tried out one or more of the technologies being propagated in their own plots (Figure 12). Furthermore over 70% indicated that they are continuing with the practices they adopted from the FFS. Only around 20% of the non‐participants belong to other agricultural development projects so it is clear that FFS have a having a very high spill over effect to both farmers located in the vicinity of the FFS as well further away.
Figure 12: Copying from FFS by non‐participants
Figure 12: Copying from FFS by Non participants
0
10
20
30
40
50
60
70
80
90
Visited plots Tried something Continuing Other proj
Perc
ent o
f HH
NearFar
Page 12 of 49

Evaluation of CORAD Farmers Field Schools VI. IMPACT OF THE FARMERS FIELD SCHOOLS
A. Use of Production Assets
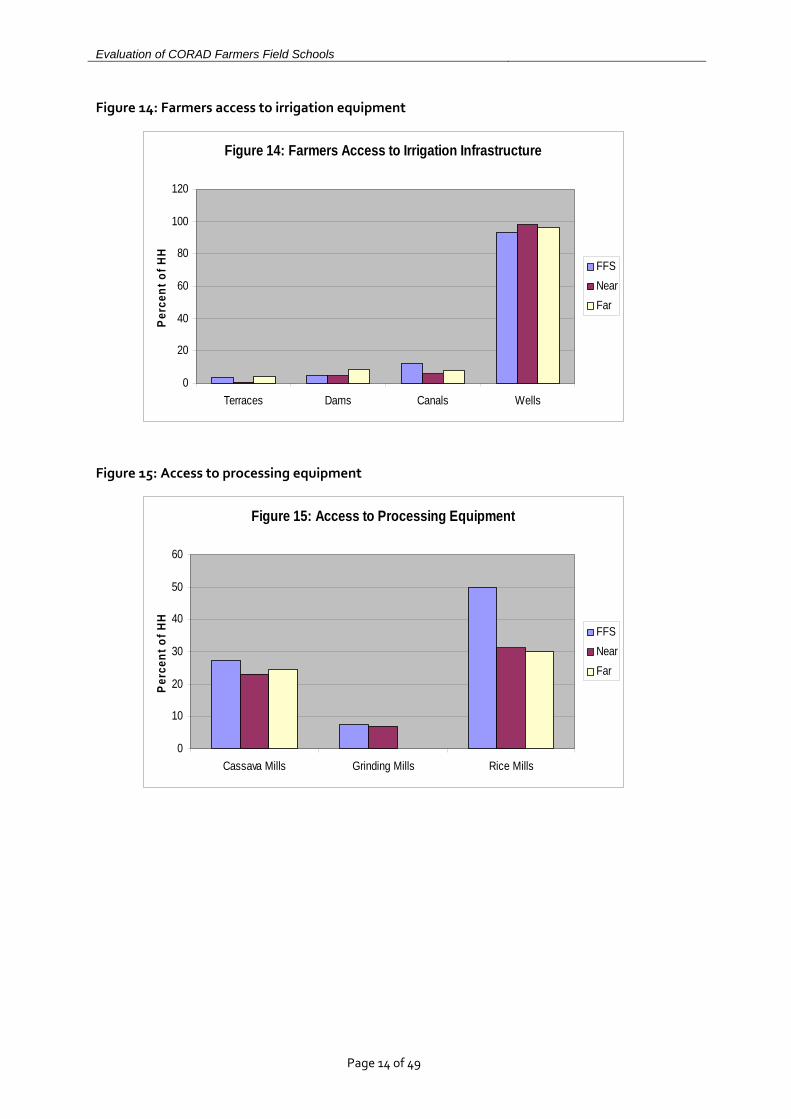
FFS farmers have not adopted irrigation techniques. Less than 15% percent of farmers reported that they had access to, or used irrigation equipment, with the proportion being lower for FFS farmers (Figure 13). Neither did they have access to such irrigation infrastructure as canals, the bedrock of improved Inland valley systems in Sierra Leone (Figure 14). And there was no difference in the use of irrigation infrastructure between participating and non‐participating farmers. This is surprising, considering that the most popular crop tried in the FFS is lowland rice, and implies that while FFS succeeded in propagating the adoption of improved lowland rice varieties, there was virtually no success in getting FFS farmers to adopt improved irrigation techniques.
Post harvest activities in CORAD FFS have not succeeded in significantly increasing farmer access. With regards to post harvest equipment, Figure 15 shows that 50% of FFS households had access to rice processing equipment compared to 30% of non‐participants. There was virtually no use of improved storage facilities (Figure 16) by participants and non‐participants, and there was equally low access to cassava processing equipment.
Figure 13: Farmers access to irrigation equipment
Figure 13: Farmers Access to Irrigation Equipment
0
2
4
6
8
10
12
14
Pump PVC Pipes
Per
cent
of H
H
FFSNearFar
Page 13 of 49
Evaluation of CORAD Farmers Field Schools Figure 14: Farmers access to irrigation equipment
Figure 14: Farmers Access to Irrigation Infrastructure
0
20
40
60
80
100
120
Terraces Dams Canals Wells
Perc
ent o
f HH
FFSNearFar
Figure 15: Access to processing equipment
Figure 15: Access to Processing Equipment
0
10
20
30
40
50
60
Cassava Mills Grinding Mills Rice Mills
Perc
ent o
f HH
FFSNearFar
Page 14 of 49

Evaluation of CORAD Farmers Field Schools Figure 16: Farmers access to storage facilities
B. Adoption of Improved Technology
CORAD FFS have succeeded in increasing farmers’ access to and use of improved varieties and fertilizers. One of the principal interventions of FFS was the conduct of variety trials for all annual crops aimed at demonstrating the benefits of improved varieties to farmers. Figure 17 shows that over 80% of FFS farmers compared to 50‐60% of non‐participants use improved rice varieties. Over 50% of FFS farmers also use improved cassava varieties. The proportion of households using improved sweet potato varieties and tree crop varieties is lower, mainly reflecting the lower percentage of households growing the crops. The relatively high use of improved varieties by non‐participants is a reflection of the spill over effects of the FFS as discussed earlier.
Figure 17: Farmers access to improved varieties
Figure 17: Farmers Access to Improved Varieties
0
10
20
30
40
50
60
70
80
90
Rice Cassava Sweet Pot Tree Crops
Perc
ent o
f HH
FFSNearFar
Page 15 of 49

Evaluation of CORAD Farmers Field Schools CORAD FFS interventions have missed the opportunity of using the livestock re‐stocking component to introduce improved breeds particularly of small ruminants into the target communities. Improved livestock breeds especially small ruminants are used to a much lower extent than improved crop varieties. Figure 18 shows that improve poultry breeds have been adopted by roughly the same proportion of participating and non‐participating households, although a slightly higher proportion of non‐participants have adopted layers. Use of improved breeds of other livestock is virtually non existent.
Figure 18: Adoption of improved livestock breeds
Figure 18: Adoption of Improved Livestock Breeds
0
10
20
30
40
50
60
Broilers Layers Goats Pigs Sheep
Perc
ent o
f HH
FFSNearFar
A high proportion of farmers now use some fertilizers. Figure 19 shows that about 70% of FFS farmers use fertilizers. Even among non‐participants, although the proportion using fertilizers was lower (40–60%), it was much higher than the national average. However, herbicides and insecticide were not much used, even in this, the Cocoa belt of Sierra Leone.
Figure 19: Farmers adopting agro‐chemicals
Figure 19: Farmers Adoption of Agro-chemicals
0
10
20
30
40
50
60
70
80
Fertilisers Herbicides Insecticides
perc
ent o
f HH
FFSNearFar
Page 16 of 49

Evaluation of CORAD Farmers Field Schools Farmers have adopted some improved crop cultural practices but not all proposed to them. Another important intervention of CORAD FFS are experiments aimed at improving cultural practices such as better timeliness of planting and weeding, better plant geometry and populations, etc. Figure 20 shows that over 75% of participants and 40‐60% of non‐participants reported that they have improved the timeliness of their cultural activities. However, the levels of adoption of two of the other key cultural practices – row planting and plant populations, are much lower (20‐30% for participants and less than 10% for non‐participants), clearly indicating that most farmers are not convinced that the additional labour demand of the interventions is worth the increased yields obtained because of the practices.
Figure 20: Farmers adoption of technical advice
Figure 20: Farmers Adoption of Technical Advice
0
10
20
30
40
50
60
70
80
90
Timeliness Row plant Plant Popln Weeding Pests
Perc
ent o
f HH
FFSNearFar
VII. Use of Soil Conservation Techniques
FFS Farmers have adopted soil conservation practices. Figure 21 shows that both participating and non‐participating households practice a number of soil conservation techniques propagated in CORAD FFS. The fact that farmers in FFS obtain the information from CORAD facilitators is clearly illustrated by the fact that over 80% reported CORAD as their source of information (Figure 22). FFS participants are passing such knowledge to non‐participants as indicated by the fact that 60% of such farmers obtain the information from other farmers – again confirming the high degree of spill over of FFS messages.
Figure 23 confirms that adoption of soil conservation techniques is as a result of FFS activities. Its shows that 70% of participating households started to put the techniques into practice since they joined the FFS in 2004/2005. The success of CORAD FFS to propagating soil conservation techniques is a major achievement.
Page 17 of 49

Evaluation of CORAD Farmers Field Schools Figure 21: Adoption of soil conservation practices
Figure 21: Adoption of Soil Conservation Practices
0102030405060708090
100
Some SoilCons
Contouring Cover Mulching Rotation Manure
Per
cent
of H
H
FFSNearFar
Figure 22: Farmers source of soil conservation information
Figure 22: Farmers Sources of Soil Conservation Information
0
10
20
30
40
50
60
70
80
90
CORAD Staff MAFFS Other Farmers
Perc
ent o
f HH
FFSNearFar
Page 18 of 49

Evaluation of CORAD Farmers Field Schools Figure 23: Length of time farmers have practiced soil conservation techniques
Figure 23: Length of Time Farmermers have Practiced Soil Conservation Techniques
0
10
20
30
40
50
60
70
80
Since 2004 Before 2004
Perc
ent o
f HH
FFSNearFar
C. Impact on crop production and productivity
The average farm sizes planted to selected crops by households that cultivated the crop are shown in Table 3. Vegetables were planted by the lowest percentage of households (Figure 24) and the crop areas for those who planted a given crop were also the lowest as expected, ranging from 0.19 ha for non‐participant households that had no knowledge of FFS activities to 0.49 ha for non‐participants located farther away from FFS locations
Table 3: Average total crop area and average area for selected crops for households that cultivated the crop in 2007 (hectares)
Upl Rice (paddy)
IVS Rice (paddy)
Cassava Vegs Oil Palm Coffee Cocoa Total
FFS Households 1.06 0.90 0.65 0.34 1.29 1.37 1.41 2.59
Non‐FFS Households (Nearby)
1.05 0.86 0.59 0.39 1.43 1.24 1.22 2.54
Non‐FFS Households (Far off)
1.18 0.81 0.88 0.49 1.48 1.23 1.27 2.68
Non‐FFS Households (no knowledge of FFS)
1.10 0.88 0.86 0.19 1.50 1.12 1.18 2.91
Global 1.08 0.87 0.68 0.38 1.37 1.30 1.33 2.59
Page 19 of 49

Evaluation of CORAD Farmers Field Schools Figure 24: Major crops planted by farmers in 2007
Figure 24: Major crops planted by farmers in 2007
0
10
20
30
40
50
60
70
80
FFS Near Far Global
Per
cent
of H
H
Upl RIVSCassVegsOPCofCoc
Upland and IVS rice were the most important crop cultivated by participating and non‐participating farmers with the proportion cultivating IVS rice (around 50%) being higher than the national average for Sierra Leone indicating the importance of the crop in the CORAD target communities. The differences between participating and non‐participating households in crops planted and average crop area are not statistically significant i.e. FFS participants did not cultivate significantly greater farm sizes than non‐participants. Average crop area is between 2.6 ha for all groups. The figure also shows the means for those households that reported to have no knowledge of FFS and can therefore be presumed to have copied nothing from the FFS. Average farm sizes and average crop area are no lower than for other non‐participants.
Average production per household of selected crops during the 2007 crop season is shown in Table 4 and crop yields2 in Figure 25. They show that FFS have had a significant impact on crop yields.
Table 4: Avg. crop production per household (Kg) for households that grew a particular crop
Upl Rice (paddy)
IVS Rice (paddy)
Cassava Vegs Oil Palm
Coffee Cocoa
FFS Households 462 587 826 244 152 196 194 Non‐FFS Households (Nearby)
486 678 1021 263 193 174 258
Non‐FFS Households (Far off)
669 448 766 266 199 181 190
Non‐FFS Households (no knowledge of FFS)
442 371 532 47 242 210 175
Global 508 593 876 253 174 186 212
2 Methodology Note: The figures on quantities of crops produced or sold should be interpreted with caution because they are derived by converting local units of measure to metriuc units and are therefor imprecise as local units e.g. “bags” varied in size and conversion factors were therfore difficult to standardize.
Page 20 of 49

Evaluation of CORAD Farmers Field Schools Figure 25: Average crop yields in 2007
Figure 25: Average Crop yields in 2007
0200400600800
100012001400160018002000
Upl Rice(paddy)
IVS Rice(paddy
Cass Vegs Oil P Coffee Cocoa
Kgs
/ha
FFSNearFarNKGlobal
Figure 25 shows that crop yields are significantly higher for participating and non‐participating households who have adopted FFS practices (compared to the farmers with no knowledge of FFS) for the crops for which FFS introduced improved technologies ‐ IVS rice, cassava and vegetables. The point is buttressed by the longitudinal analysis in Figure 26 which shows the yield increases between 2004 when the FFS came into operation and 2007, as recalled by farmers. While FFS participants have reported yield increases of 62‐82% in their principal crop fields, and non‐participants who know of the FFS and have adopted the practices have achieved average yield increases generally above 50%, non‐participants with no knowledge and contacts with the FFS have only recorded yield increases of 10‐15% since 2004. Thus, the FFS have had a major impact on crop productivity in the communities, and the impact has not been restricted only to participants in the FFS.
Figure 26: Increase in crop yields per field between 2004 and 2007
Figure 26: Increases in Crop Yields per field between 2004 and 2007
0
20
40
60
80
100
120
Upl 1 Upl 2 IVS1 IVS 2
Per
cent
FFSNearFarNK
Page 21 of 49

Evaluation of CORAD Farmers Field Schools
Figure 27 shows that vegetables, cassava and the tree crops serve more as commercial crops with the proportion of production sold being over 60 percent. However, even the staple food crop rice is an important cash crop with 40% of production being sold. There is no significant difference in sales between FFS participants and non‐participants (data not shown). Figure 28 shows the average volume of selected crops marketed by farmers.
Figure 27: Average % of crop production sold by households that made sales
Figure 27: Average percent of crop production sold by households that made sales
0102030405060708090
100
Rice Cassava Coffee Cocoa Oil Palm Vegs
Perc
ent
Figure 28: Average volume of products sold by households that made sales
Figure 28: Average volume of products sold by households that made sales
0
100
200
300
400
500
600
Rice (paddy) Cassava Coffee Cocoa Palm Oil Vegs
Kgs
Figure 29 shows the average household income from major crops produced in 2007.3 Rice (upland and IVS) was the major contributor to household income for all categories of
3 The figues show the weighted average value of household production for selected crops as opposed to the average for those households that produced a commodity reported earlier. Quantities produced were converted to values
Page 22 of 49

Evaluation of CORAD Farmers Field Schools
households except those with no association with FFS, for which the tree crops were the major contributors. Average household income from agriculture was higher for the households with no knowledge of FFS activities because of the contribution of the export tree crops.
Figure 29: Average household income (value of agricultural production)
Figure 29: Average Household Income (value of agricultural production)
0200,000400,000600,000800,000
1,000,0001,200,0001,400,0001,600,0001,800,000
Upl RIVS R
CassVeg
sOil P
Coffee
Cocoa
Total
Leon
es
FFSNearFarNKGlobal
Figure 30 shows the weighted average volume of gari, hulled rice and palm oil produced per household, and Figure 31 the income households derived from the sale of the products4.
Figure 30: Weighted average household production of processed products
Figure 30: Weighted average household production of processed products
0
50
100
150
200
250
300
Kg milled Uplrice
Kg milled IVSrice
Kg Gari Gals Palm Oil
FFSNearFarNKGlobal
using the following average prices per kg for 2007: milled rice ‐ Le 2,100, cassava – Le 285; vegetables Le 10,725; oil palm Le 3,767; coffee and cocoa – Le 3,850. . 4 Average production multiplied by the proportion of production sold (see Figure 27)
Page 23 of 49

Evaluation of CORAD Farmers Field Schools Figure 31: Average household income from sales of selected crops
Figure 31: Average household income from sales of selected crops
0
50000
100000
150000
200000
250000
Milled Uplrice
Milled IVSrice
Gari Palm Oil
Leon
es
FFSNearFarNKGlobal
D. Impact on Food Security
The battle for food security is not yet won. As indicated earlier the Household Food Insecurity Access Scale (HFIAS) was used to measure the level of food security of farmers. The main results are presented in Figures 32 and 33. Generally there are only very small, non significant differences between participating and non‐participating households. For example while 78% of participating farmers worried that the household would not have enough food to eat during the preceding four weeks, the proportion was 80‐84% among non‐participants, as for eating kinds of food not preferred (not preferred), eating a limited variety of foods (limited variety), eating foods that were not really wanted (not want), and eating smaller of fewer meals. An important finding is that despite the efforts of interventions of the FFS about half of all households, whether they are participants or not reported that during the preceding four weeks there was at least an occasion when there was no food of any kind in the household because of lack of resources to get food. Worse still, 40% of households had occasion for a member of the household to go to bed hungry, and 25% of households had an occasion when at least one member went a whole day and night without food. The battle to make farmers fully food secure is not yet fully won in the CORAD focus Districts
Page 24 of 49

Evaluation of CORAD Farmers Field Schools Figure 32: Household perception of food security
Figure 32: Houshold Preceptions of Food Security - 1
7072747678808284868890
Worry Not prefered Limited variety Not want
Perc
ent o
f HH
FFSNearFar
Figure 33: Household perception of changes in food security ‐ 2
Figure 33: House Perceptions of Chages Food Security - 2
0
10
20
30
40
50
60
70
80
90
Smaller meal Fewer meals No food Sleep hungry 24 hrs lack
Perc
ent o
f HH
FFSNearFar
However, farmers feel that food security is improving. A very positive finding is that households believe that aspects of their food security have improved since the debut of CORAD FFS in 2004. As shown in Figure 34, about 80% of FFS households reported that they eat more and better meals and feed more people. The proportion is lower among non‐participants (50‐60%) but encouragingly high
Page 25 of 49

Evaluation of CORAD Farmers Field Schools Figure 34: Household perceptions of changes in food security since 2004
Figure 34: Household Perceptions of Changes in Food Security since 2004
0102030405060708090
Eat more Eat better Feeds more
Per
cent
of H
H
FFSNearFar
VIII. SUMMARY AND CONCLUSIONS
The Farmer Field School (FFS) lies at the heart of the LINKS program both as the main coordination point for all LINK‐sponsored activities in the various communities and as an organization and technology training center. As operated by CORAD members, a FFS comprises approximately 30 members. The group is set up with the assistance of CORAD field staff who work with an FFS directly for a period of one year. During that time, the group would decide on a limited number of agricultural trials that they wished to undertake and the field agent would assist in the setting up and implementation of those trials. Frequently such trials would include seed rate experiments, spacing trials, sowing method trials, variety trials, manuring trials and other simple aspects of agricultural production. The field agent would provide improved seeds as necessary and would ensure that the trials were replicated, properly laid out and well managed. The FFS members undertake all operations, including the laying out, sowing and subsequent weeding and observation. Results would be obtained at harvest time in the form of final yields.
In this study the impact of FFS has been assessed by comparing the results obtained by participating and non‐participating households at the current time and since the onset of the program in 2004
Examination of the demographic characteristics and livelihood activities of participating and non‐participating households showed that there was no significant difference in the household size, housing structures, gender composition, etc between the different categories, confirming the criteria that guided the selection of all categories of farmers’ i.e. similar population characteristics.
The study has shown that FFS have a very high spill over effect to both farmers located in the vicinity of the FFS as well further away. The vast majority of non‐participating households in the same villages as FFS as well as farther a field, know of, and have adopted the improved
Page 26 of 49
Evaluation of CORAD Farmers Field Schools practices propagated in the FFS. They get information mainly from participating farmers and to a much less extent from CORAD field agents.
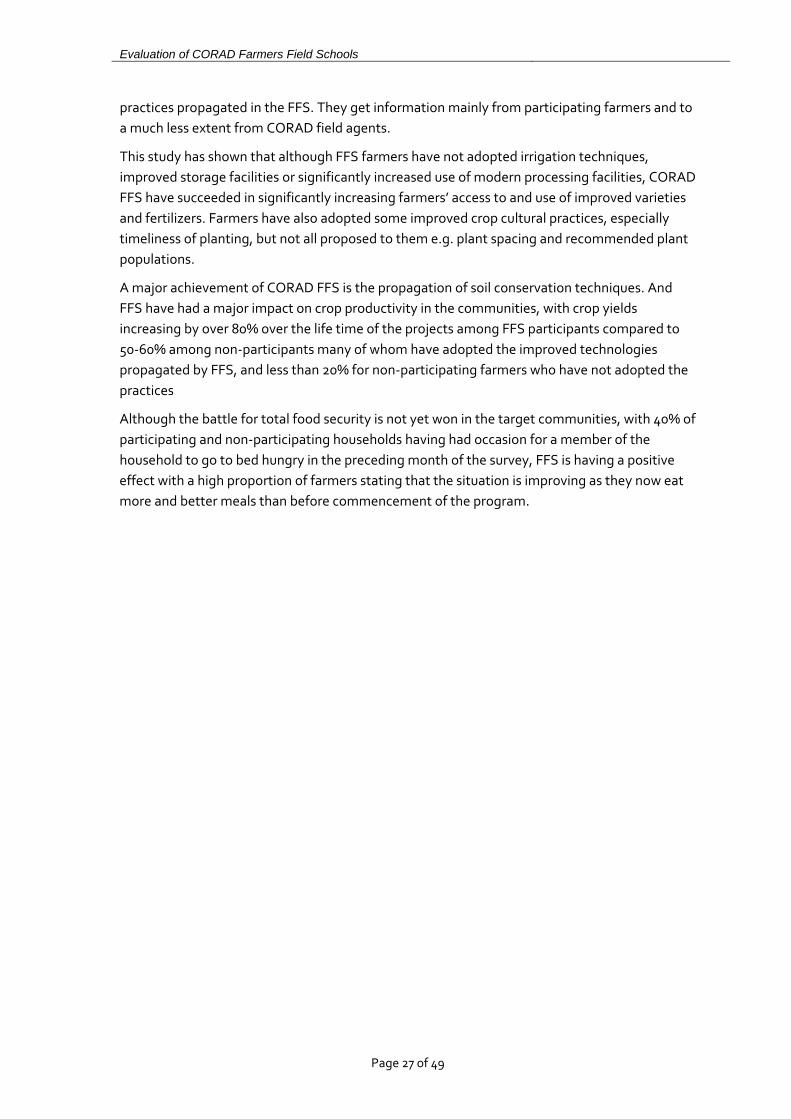
This study has shown that although FFS farmers have not adopted irrigation techniques, improved storage facilities or significantly increased use of modern processing facilities, CORAD FFS have succeeded in significantly increasing farmers’ access to and use of improved varieties and fertilizers. Farmers have also adopted some improved crop cultural practices, especially timeliness of planting, but not all proposed to them e.g. plant spacing and recommended plant populations.
A major achievement of CORAD FFS is the propagation of soil conservation techniques. And FFS have had a major impact on crop productivity in the communities, with crop yields increasing by over 80% over the life time of the projects among FFS participants compared to 50‐60% among non‐participants many of whom have adopted the improved technologies propagated by FFS, and less than 20% for non‐participating farmers who have not adopted the practices
Although the battle for total food security is not yet won in the target communities, with 40% of participating and non‐participating households having had occasion for a member of the household to go to bed hungry in the preceding month of the survey, FFS is having a positive effect with a high proportion of farmers stating that the situation is improving as they now eat more and better meals than before commencement of the program.
Page 27 of 49
Evaluation of CORAD Farmers Field Schools IX. Bibliography
Coates, J. S. (2007). Household Food Security Access Scale (HFIAS) for Measurement of Food Access. Washington DC: USAID, Food and Nutrition Technical Assistance (FANTA) Project. Academy of Educational Development. Weidemann Associates, Inc. (2007). Raise Plue Set Aside ICQ. Evaluation of the LINKS Program . Washington DC, USA: USAID. Thomas, A. O. (2007) Population profile of Sierra Leone
Page 28 of 49

Evaluation of CORAD Farmers Field Schools
X. ANNEX 1
Page 29 of 49

Evaluation of CORAD Farmers Field Schools
FFS IMPACT STUDY HOUSEHOLD QUESTIONNAIRE
Questionnaire N° |__|__|__|
GPS location of FFS village/site : _________N : __________W
SECTION 0 Questionnaire base data
VARIABLES RESPONSE OPTIONS CODE
01. Interview result 1 = Totally filled 2 = Partially filled 3 = Refused |__|
02. Time of interview Date: |__|__|__|__|__|__| Minutes: |__|__|__|
03. Household typology 1 = FFS Member 2 = Non-FFS, FFS Village 3 = Non-FFS, Non FFS Village
|__|
AGENT NAME CODE DATE
(day/month/year) SIGNATURE
04. Enumerator |__|__| |__|__|__|__|__|__|
05. Supervisor |__| |__|__|__|__|__|__|
06. Data clerk |__| |__|__|__|__|__|__|
VARIABLES RESPONSE OPTIONS CODE
07. District 1 = Kono 2 = Kailahun 3 = Koinadugu |__|
08. CORAD Sponsor 1 = WVSL 2 = CRS 3 = CARE |__|__|
9. Chiefdom Name Chiefdom: |__|__|
10. Village/Site Name Village/Site: |__|__|
11. FFS Name of FFS ________________________________ |__|
Page 30 of 49

Evaluation of CORAD Farmers Field Schools
Questions for all respondents
SECTION A. Household information QUESTIONS RESPONSE OPTIONS CODE
A1. Name of respondent
A2. Respondent role in the household 1 = household head 2 = spouse
3 = child 4 = other (specify)
|__|
A3. Approximate age 1 = 15-25 years 2 = 26-35 years 3 = 36-50 years 4 = 51-65 years 5 = > 65 years
|__|
A4. Sex 1 = male 0 = female |__|
A5. Education 1 = illiterate 0 = literate (can read, write and calculate) |__|
A6. N° men in household over 15 years count |__|__|
A7. N° women in HH over 15 years count |__|__|
A8. N° children in HH 15 years or less count |__|__|
A9. Dwelling walls 1 = wood 2 = mud 3 = cement blocks 4 = other (specify) _______________
|__|
A10. Dwelling roof 1 = thatch 2 = corrugated iron 3 = asbestos 4 = other (specify) _______________
|__|
SECTION B. Livelihood activities QUESTIONS RESPONSE OPTIONS CODE
B1. Which are your main sources of livelihood? (classify in order of importance) B1a. Upland Crop Farming
1 = most important as contribution to HH income
2 = 2nd most important 3 = 3rd most important
enter ‘99’ if not practiced
|__|__|
B1b. Tree Crop Farming |__|__|
B1c. Livestock raising |__|__|
B1d. Fishing |__|__|
B1e. Off-farm (specify) |__|__|
B1f. Other (specify) |__|__|
CROP PRODUCTION
B2. Which crops do you farm/practice/produce? (classify in order of importance) B2a. Oil Palm
1 = most important as contribution to HH income
2 = 2nd most important 3 = 3rd most important
enter ‘99’ if not practiced
|__|__|
B2b. Cocoa |__|__|
B2c. Coffee |__|__|
B2d. Rice |__|__|
B2e. Maize |__|__|
B2f. Cassava |__|__|
B2g. Sweet potato |__|__|
B2h. Groundnut |__|__|
B2i. Vegetables (specify) |__|__|
B2j. Other (specify) |__|__|
B3. How much did you produce from your 5 most important crops in the last cropping season, and
Page 31 of 49

Evaluation of CORAD Farmers Field Schools how much did you produce of it before 20045? (estimate)
Crop Total crop output per household
Local unit of measure Last crop season Before 20041
B3a. First (specify) |__|__| |__|__|__| |__|__|__|
B3b. Second (specify) |__|__| |__|__|__| |__|__|__|
B3c. Third (specify) |__|__| |__|__|__| |__|__|__|
B3d. Fourth (specify) |__|__| |__|__|__| |__|__|__|
B3e. Fifth (specify) |__|__| |__|__|__| |__|__|__|
B4. If your total production of the last cropping season is 10, how much did you consume and sell of it? (estimate)
Crop Consumed Sold Total
B4a. First (specify) |__|__| |__|__| 10
B4b. Second (specify) |__|__| |__|__| 10
B4c. Third (specify) |__|__| |__|__| 10
B4d. Fourth (specify) |__|__| |__|__| 10
B4e. Fifth (specify) |__|__| |__|__| 10
LIVESTOCK RAISING
B5. Which livestock do you raise?
(classify in order of importance) B5a. Cattle
1 = most important as contribution to HH income
2 = 2nd most important 3 = 3rd most important
enter ‘99’ if not practiced
|__|__|
B5b. Goats |__|__|
B5c. Sheep |__|__|
B5d. Pig |__|__|
B5e. Poultry |__|__|
B5f. Other (specify) |__|__|
B6. How many animals did you raise, and how many did you sell and loose (deaths) in 2007? (estimate)
Stock in 01/07 Sales Losses Stock in 12/07
B6a. Cattle |__|__| |__|__| |__|__| |__|__|
B6b. Goats |__|__| |__|__| |__|__| |__|__|
B6c. Sheep) |__|__| |__|__| |__|__| |__|__|
B6d. Pig |__|__|__| |__|__|__| |__|__|__| |__|__|__|
B6e. Poultry |__|__|__| |__|__|__| |__|__|__| |__|__|__|
B6f. Other (specify) |__|__| |__|__| |__|__| |__|__|
B6g. What were the losses due to?
1 = disease 2 = predators 3 = theft 4 = other (specify) ______________
|__|__| |__|__|
5 Use the year of the last Local Government elections as a memory prompt.
Page 32 of 49
Evaluation of CORAD Farmers Field Schools FISHING
B7. Do you practice fishing? 1 = yes 0 = no (skip to B9)
|__|
B7a. Where? (choose more than one option if relevant)
1 = dam 2 = lake 3 = river 4 = IVS 5 = pond
|__| |__| |__| |__| |__|
B7b. What do you do with your production? 1 = consumption 2 = sale 3 = both |__|
B8. How much fish did you produce and sell last year (2007)?
(estimate)
Fish species Produced Sold
Local unit of measure Quantity Local unit of measure Quantity
B8a. Tilapia (local name___________) |__|__| |__|__|__|__| |__|__| |__|__|__|__|
B8b. Catfish |__|__| |__|__|__|__| |__|__| |__|__|__|__|
B8c. Other (specify) |__|__| |__|__|__|__| |__|__| |__|__|__|__|
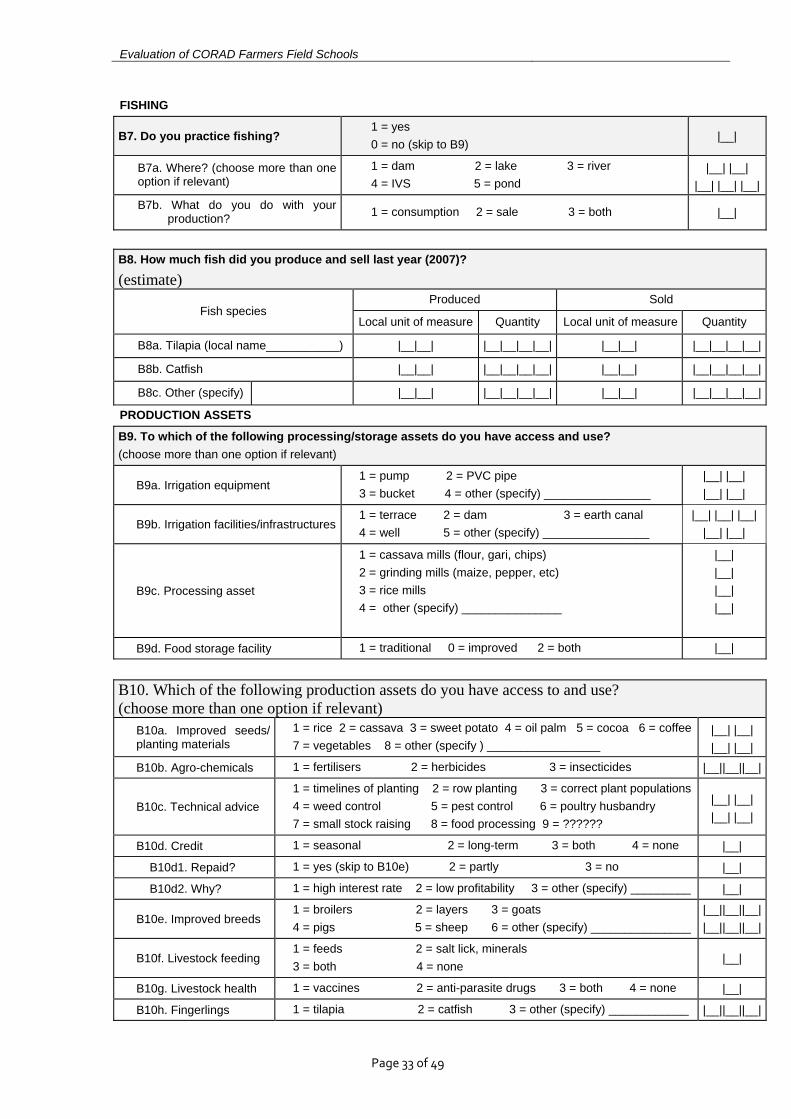
PRODUCTION ASSETS
B9. To which of the following processing/storage assets do you have access and use? (choose more than one option if relevant)
B9a. Irrigation equipment 1 = pump 2 = PVC pipe 3 = bucket 4 = other (specify) ________________
|__| |__| |__| |__|
B9b. Irrigation facilities/infrastructures1 = terrace 2 = dam 3 = earth canal 4 = well 5 = other (specify) ________________
|__| |__| |__| |__| |__|
B9c. Processing asset
1 = cassava mills (flour, gari, chips) 2 = grinding mills (maize, pepper, etc) 3 = rice mills 4 = other (specify) _______________
|__| |__| |__| |__|
B9d. Food storage facility 1 = traditional 0 = improved 2 = both |__|
B10. Which of the following production assets do you have access to and use? (choose more than one option if relevant)
B10a. Improved seeds/ planting materials
1 = rice 2 = cassava 3 = sweet potato 4 = oil palm 5 = cocoa 6 = coffee 7 = vegetables 8 = other (specify ) _________________
|__| |__| |__| |__|
B10b. Agro-chemicals 1 = fertilisers 2 = herbicides 3 = insecticides |__||__||__|
B10c. Technical advice 1 = timelines of planting 2 = row planting 3 = correct plant populations 4 = weed control 5 = pest control 6 = poultry husbandry 7 = small stock raising 8 = food processing 9 = ??????
|__| |__| |__| |__|
B10d. Credit 1 = seasonal 2 = long-term 3 = both 4 = none |__|
B10d1. Repaid? 1 = yes (skip to B10e) 2 = partly 3 = no |__|
B10d2. Why? 1 = high interest rate 2 = low profitability 3 = other (specify) _________ |__|
B10e. Improved breeds 1 = broilers 2 = layers 3 = goats 4 = pigs 5 = sheep 6 = other (specify) _______________
|__||__||__||__||__||__|
B10f. Livestock feeding 1 = feeds 2 = salt lick, minerals 3 = both 4 = none
|__|
B10g. Livestock health 1 = vaccines 2 = anti-parasite drugs 3 = both 4 = none |__|
B10h. Fingerlings 1 = tilapia 2 = catfish 3 = other (specify) ____________ |__||__||__|
Page 33 of 49

Evaluation of CORAD Farmers Field Schools
B10i. Fishery equipment 1 = nets 2 = gears 3 = twines 4 = other (specify) ___________________
|__| |__| |__| |__|
B10l. Fish feeding 1 = feeds 2 = lime and fertiliser 3 = both 4 = none |__|
FARM DIVERSIFICATION
B11. Did you farm any new crops/livestock last 3 years? (list three most important)
1 = yes 0 = no (skip to B12)
|__|
B11a. 1st crop/livestock specify)
|__|
B11b. 2nd crop/livestock (specify) |__|
B11c. 3rd crop/livestock (specify)
|__|
B11d. How did you learn about these new crops/livestock?
1 = CORAD staff 2 = MAFFS technicians 3 = other farmers/friends 4 = other (specify)________
|__| |__||__| |__|
B11e. How much of your farm do you put under new crops?
1 = all 2 = more than half 3 = less than half
|__|
B11f. Did you experience any problem with these new crops/livestock?
1 = yes 0 = no (skip to B11h)
|__|
B11g. Which one(s)? 1 = lack of funds 2 = difficult technique 3 = workload 4 = lack of market 5 = other (specify) __________________
|__| |__| |__| |__|
|__|
B11h. Will you keep on farming these new crops/livestock? 1 = yes 2 = no 3 = don’t know |__|
SOIL CONSERVATION
B12. Did you practice any soil conservation techniques in the last season? (choose more than one option if relevant)
1 = yes 0 = no (skip to B13)
|__|
B12a. Contour farming |__| B12b. Cover cropping |__|
B12c. Mulching |__| B12d. Crop rotation |__|
B12e. Manure application |__| B12f. Other (specify) _______________ |__|
B12g. How did you learn about these techniques?
1 = CORAD staff 2 = MAFFS technicians 3 = other farmers/friends 4 = other (specify)________
|__| |__| |__| |__|
B12h. How much of your farm do you put under soil conservation?
1 = all 2 = more than half 3 = less than half
|__|
B12i. Did you experience any problem associated with these techniques?
1 = yes 0 = no (skip to B12o)
|__|
B12j. Which one(s)? 1 = lack of funds 2 = inadequate land 3 = workload 4 = other (specify) _________________
|__| |__||__| |__|
B12k. For how long have you been doing these techniques? 1 = since 2004 2 = before 2004 |__|
B12l. Will you keep on practicing these techniques? 1 = yes 0 = no 3 = don’t know |__|
LABOUR
Page 34 of 49
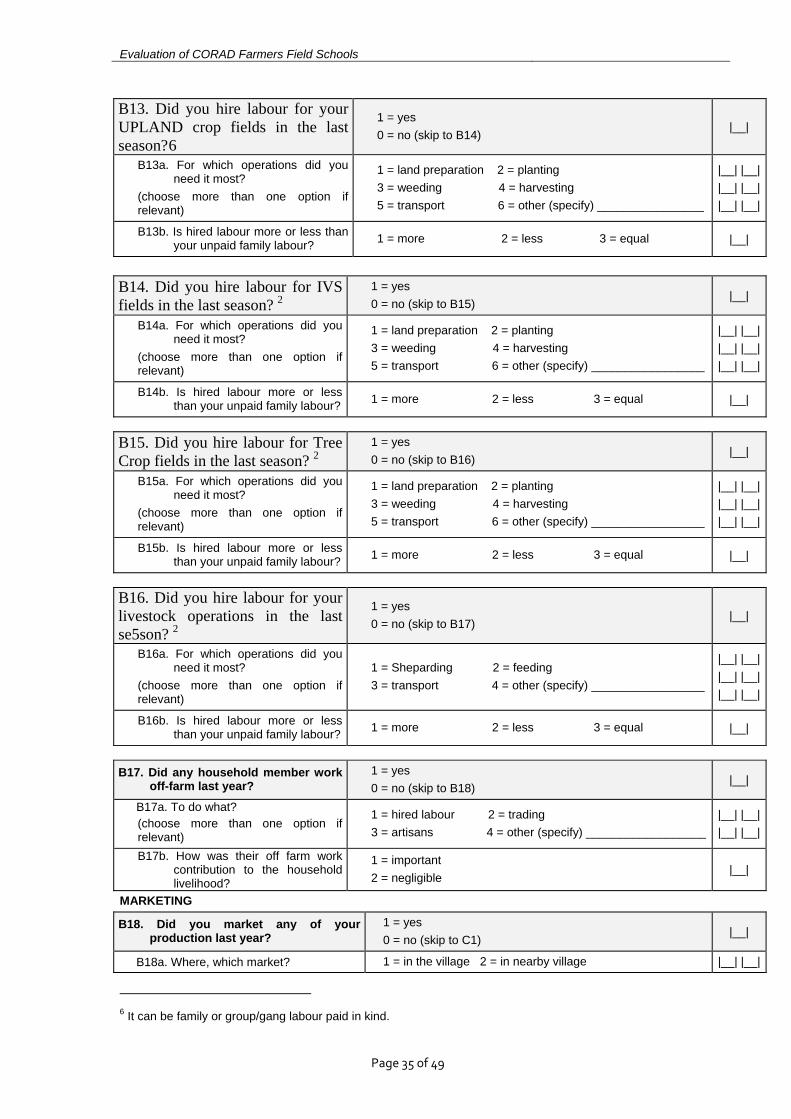
Evaluation of CORAD Farmers Field Schools B13. Did you hire labour for your UPLAND crop fields in the last season?6
1 = yes 0 = no (skip to B14)
|__|
B13a. For which operations did you need it most?
(choose more than one option if relevant)
1 = land preparation 2 = planting 3 = weeding 4 = harvesting 5 = transport 6 = other (specify) ________________
|__| |__||__| |__||__| |__|
B13b. Is hired labour more or less than your unpaid family labour? 1 = more 2 = less 3 = equal |__|
B14. Did you hire labour for IVS fields in the last season? 2
1 = yes 0 = no (skip to B15)
|__|
B14a. For which operations did you need it most?
(choose more than one option if relevant)
1 = land preparation 2 = planting 3 = weeding 4 = harvesting 5 = transport 6 = other (specify) _________________
|__| |__||__| |__||__| |__|
B14b. Is hired labour more or less than your unpaid family labour? 1 = more 2 = less 3 = equal |__|
B15. Did you hire labour for Tree Crop fields in the last season? 2
1 = yes 0 = no (skip to B16)
|__|
B15a. For which operations did you need it most?
(choose more than one option if relevant)
1 = land preparation 2 = planting 3 = weeding 4 = harvesting 5 = transport 6 = other (specify) _________________
|__| |__||__| |__||__| |__|
B15b. Is hired labour more or less than your unpaid family labour? 1 = more 2 = less 3 = equal |__|
B16. Did you hire labour for your livestock operations in the last se5son? 2
1 = yes 0 = no (skip to B17)
|__|
B16a. For which operations did you need it most?
(choose more than one option if relevant)
1 = Sheparding 2 = feeding 3 = transport 4 = other (specify) _________________
|__| |__||__| |__||__| |__|
B16b. Is hired labour more or less than your unpaid family labour? 1 = more 2 = less 3 = equal |__|
B17. Did any household member work
off-farm last year? 1 = yes 0 = no (skip to B18)
|__|
B17a. To do what? (choose more than one option if relevant)
1 = hired labour 2 = trading 3 = artisans 4 = other (specify) __________________
|__| |__||__| |__|
B17b. How was their off farm work contribution to the household livelihood?
1 = important 2 = negligible
|__|
MARKETING
B18. Did you market any of your production last year?
1 = yes 0 = no (skip to C1)
|__|
B18a. Where, which market? 1 = in the village 2 = in nearby village |__| |__|
6 It can be family or group/gang labour paid in kind.
Page 35 of 49

Evaluation of CORAD Farmers Field Schools
(choose more than one option if relevant) 3 = in town 4 = other (specify) ___________________ |__| |__|
B18b. Did you experience any difficulties in marketing your production?
1 = yes 2 = no (skip to C1)
|__|
B18c. What are they? (choose more than one option if relevant)
1 = storage 2 = transport 3 = low prices 4 = time/labour 5 = other (specify) _______________
|__||__| |__||__|
|__|
Page 36 of 49

Evaluation of CORAD Farmers Field Schools SECTION C. Food security The respondent for this section should be the person usually preparing meals in the household.
QUESTIONS RESPONSE OPTIONS CODE
C4. In the past four weeks, did you worry that your household would not have enough food?
1 = yes 0 = no (skip to C5)
|__|
C4a. How often did this happen? 1 = Rarely (1 or 2 in the past 4 weeks) 2 = Sometimes (3 to 10 times in the past 4 weeks) 3 = Often (> 10 times in the past 4 weeks)
|__|
C5. In the past four weeks, were you or any household member not able to eat the kinds of foods you preferred because of a lack of resources?
1 = yes 0 = no (skip to C6)
|__|
C5a. How often did this happen? 1 = Rarely (1 or 2 in the past 4 weeks) 2 = Sometimes (3 to 10 times in the past 4 weeks) 3 = Often (> 10 times in the past 4 weeks)
|__|
C6. In the past four weeks, did you or any household member have to eat a limited variety of foods due to a lack of resources?
1 = yes 0 = no (skip to C7)
|__|
C6a. How often did this happen? 1 = Rarely (1 or 2 in the past 4 weeks) 2 = Sometimes (3 to 10 times in the past 4 weeks) 3 = Often (> 10 times in the past 4 weeks)
|__|
C7. In the past four weeks, did you or any household member have to eat some foods that you really did not want to eat because of a lack of resources to obtain other types of food?
1 = yes 0 = no (skip to C8)
|__|
C7a. How often did this happen? 1 = Rarely (1 or 2 in the past 4 weeks) 2 = Sometimes (3 to 10 times in the past 4 weeks) 3 = Often (> 10 times in the past 4 weeks)
|__|
C8. In the past four weeks, did you or any household member have to eat a smaller meal than you felt you needed because there was not enough food?
1 = yes 0 = no (skip to C9)
|__|
C8a. How often did this happen? 1 = Rarely (1 or 2 in the past 4 weeks) 2 = Sometimes (3 to 10 times in the past 4 weeks) 3 = Often (> 10 times in the past 4 weeks)
|__|
C9. In the past four weeks, did you or any other household member have to eat fewer meals in a day because there was not enough food?
1 = yes 0 = no (skip to C10)
|__|
C9a. How often did this happen? 1 = Rarely (1 or 2 in the past 4 weeks) 2 = Sometimes (3 to 10 times in the past 4 weeks) 3 = Often (> 10 times in the past 4 weeks)
|__|
C10. In the past four weeks, was there ever no food to eat of any kind in your household because of lack of resources to get food?
1 = yes 0 = no (skip to C11)
|__|
C10a. How often did this happen? 1 = Rarely (1 or 2 in the past 4 weeks) 2 = Sometimes (3 to 10 times in the past 4 weeks) 3 = Often (> 10 times in the past 4 weeks)
|__|
C11. In the past four weeks, did you or any household member go to sleep at night hungry because there was not enough food?
1 = yes 0 = no (skip to C12)
|__|
C11a. How often did this happen? 1 = Rarely (1 or 2 in the past 4 weeks) 2 = Sometimes (3 to 10 times in the past 4 weeks) 3 = Often (> 10 times in the past 4 weeks)
|__|
C12. In the past four weeks, did you or any household member go a whole day and night without eating anything because there was not enough food?
1 = yes 0 = no
|__|
Page 37 of 49

Evaluation of CORAD Farmers Field Schools
C12a. How often did this happen? 1 = Rarely (1 or 2 in the past 4 weeks) 2 = Sometimes (3 to 10 times in the past 4 weeks) 3 = Often (> 10 times in the past 4 weeks)
|__|
Questions for Participating households only SECTION D. Households’ perceptions about FFS-induced
impacts
QUESTIONS RESPONSE OPTIONS CODE
D1. Since you have been involved in FFS, what do you think have been the main changes on your household livelihood?
D1a1 = household eats more every day 2 = eats less
0 = no change |__|
D1b1 = household eats better every day 2 = eats worse 0 = no change
|__|
D1c1 = household feeds more people 2 = feeds less
0 = no change |__|
D2. What are the main changes you think FFS brought about on your production activities?
D2a1 = production increased 2 = decreased 0 = no change
|__|
D2b1 = sales and revenues increased 2 = decreased 0 = no change
|__|
D2c1 = expenditures increased 2 = decreased 0 = no change
|__|
D2d1 = use better inputs than before7
2 = more inputs 0 = no change
|__|
D2e1 = workload has increased 2 = decreased 0 = no change
|__|
D2f1 = learned new techniques (crops, livestock, etc.) 0 = no change
|__|
D2g1 = access to commercial credit has increased 2 = decreased 0 = no change
|__|
D2h
Access to mutual aid grants (specify __________) 1 = has increased 2 = has decreased 0 = no change
|__|
D2i1 = access to improved IVS has increased 2 = decreased 0 = no change
|__|
7 Improved seeds, fertilisers, pesticides, agricultural tools.
Page 38 of 49

Evaluation of CORAD Farmers Field Schools
D2j1 = farm size has increased 2 = decreased 0 = no change
|__|
D2k1 = practice new activities (crops, livestock, etc.) 0 = same activities as before
|__|
D3. Other changes (specify)
Questions for non-participating households only
(in FFS and non-FFS villages)
SECTION E. Households’ perceptions about recent changes
QUESTIONS RESPONSE OPTIONS CODE
E1. Since 20048 did you experience changes on your household livelihood?
E1a1 = household eats more every day 2 = eats less
0 = no change |__|
E1b1 = household eats better every day 2 = eats worse 0 = no change
|__|
E1c1 = household feeds more people 2 = feeds less
0 = no change |__|
E2. What are the main changes you think came forward since 20045 on your production activities?
E2a1 = production increased 2 = decreased 0 = no change
|__|
E2b1 = sales and revenues increased 2 = decreased 0 = no change
|__|
E2c1 = expenditures increased 2 = decreased 0 = no change
|__|
E2d1 = use better inputs9 than before
2 = more inputs 0 = no change
|__|
E2e1 = workload has increased 2 = decreased 0 = no change
|__|
E2f1 = learned new techniques (crops, livestock, etc.) 0 = no change
|__|
E2g1 = access to commercial credit has increased 2 = decreased 0 = no change
|__|
8 Use the year of District Council elections as a memory prompt. 9 Improved seeds & planting material, fertilisers, pesticides, agricultural tools.
Page 39 of 49

Evaluation of CORAD Farmers Field Schools
E2h
Access to mutual aid grants (specify __________) 1 = has increased 2 = has decreased 0 = no change
|__|
E2i1 = access to improved IVS has increased 2 = decreased 0 = no change
|__|
E2j1 = farm size has increased 2 = decreased 0 = no change
|__|
E2k1 = practice new activities (crops, livestock, etc.) 0 = same activities as before
|__|
E3. Other changes (specify)
SECTION F. Outreach to non-FFS households
QUESTIONS RESPONSE OPTIONS CODE
F1. Do you know of the FFS? 1 = yes 0 = no (skip the entire section)
|__|
F2. How did you know of FFS? 1 = CORAD staff 2 = MAFFS Staff 3 = participating farmers 4 = Other (specify)________________
|__|
F3. Could you please describe what the FFS does? (choose more than one option if relevant)
1 = help to improve farming 2 = help to improve livestock raising
3 = help to improve fishing
4 = help to improve food processing 5 = other (specify) __________________ 6 = other (specify) __________________
|__| |__| |__| |__| |__| |__|
F4. Have you tried joining the FFS? 1 = yes 0 = no (skip to F6)
|__|
F5. Why didn’t you join? (choose more than one option if relevant)
2 = was told to wait as the list was closed 3 = was not there at the start 4 = other (specify) ____________________________________ 5 = other (specify) ____________________________________
|__| |__| |__| |__| |__|
F6. Have you visited the FFS plots? 1 = yes 0 = no (skip to F11)
|__|
F7. Have you tried by yourself anything that you have seen there on your farm?
1 = yes 0 = no (skip to F11)
|__|
F8. What did you try by yourself?
(choose more than one option if relevant)
1 = improved seeds/planting material 2 = improved livestock breeds 3 = new farming techniques 4 = use of fertilisers/chemicals 5 = new food processing techniques 6 = new livestock feeds, vaccinations and drugs 7 = new fishing techniques 8 = livestock fattening 9 = other (specify) ____________________________________
|__| |__| |__| |__| |__| |__| |__| |__| |__|
Page 40 of 49

Evaluation of CORAD Farmers Field Schools
Page 41 of 49
F9. With what results? 1 = bad 2 = fair 3 = good 4 = very good |__|
F10. Are you continuing the practice? 1 = yes 0 = no
|__|
F11. Do you belong to any other agricultural project?
1 = yes 0 = no (skip to F14)
|__|
F12. What have you done with the help of the project above? (choose more than one option if relevant)
1 = improved seeds 2 = improved breeds 3 = new farming techniques 4 = use of fertilisers/chemicals 5 = new food processing techniques 6 = new livestock feeds, vaccinations and drugs 7 = new fishing techniques 8 = livestock fattening 9 = other (specify) ____________________________________
|__| |__| |__| |__| |__| |__| |__| |__| |__|
F13. With what results? 1 = bad 2 = fair 3 = good 4 = very good |__|
F14. If possible, would you like to join the FFS next year?
1 = yes 0 = no
|__|

Evaluation of CORAD Farmers Field Schools Enterprise Development services Ltd
Page 42 of 49
10 Use the year of Local Government elections as a memory prompt; 8 Indicate conversion factor for unit of measure (e.g. bushel = 27.3 kgs, 1 bundle of cassava = ??)
G1. How much did you produce from your 5 most important fields in the last cropping season and how much did you get from this type of field before 2004?
1=owner 2=lease 3=sharecrop4=renter
Acres (GPS measurement)
Local unit measure, main crop8
Total output per plot
Last cropping season
Before 200410
Last cropping season
Before 20046
Last cropping season
Before 20046
Last cropping season
Before 20016
G1a. UPLAND/rain-fed land production, including Tree Crops
G3a1 – Plot 1 |__| |__|__| Main crop (specify)_________ Intercrop 1 (specify)________ Intercrop 2 (specify)________ Intercrop 3 (specify)________
|__|__|__| |__|__|__| |__|__|__| |__|__|__| |__|__|__| |__|__|__| |__|__|__| |__|__|__|
G3a2 – Plot 2 |__| |__|__| Main crop (specify)_________ Intercrop 1 (specify)________ Intercrop 2 (specify)________ Intercrop 3 (specify)________
|__|__|__| |__|__|__| |__|__|__| |__|__|__| |__|__|__| |__|__|__| |__|__|__| |__|__|__|
G3a3 – Plot 3 |__| |__|__| Main crop (specify)_________ Intercrop 1 (specify)________ Intercrop 2 (specify)________ Intercrop 3 (specify)________
|__|__|__| |__|__|__| |__|__|__| |__|__|__| |__|__|__| |__|__|__| |__|__|__| |__|__|__|
G3a4 – Plot 4 |__| |__|__| Main crop (specify)_________ Intercrop 1 (specify)________ Intercrop 2 (specify)________ Intercrop 3 (specify)________
|__|__|__| |__|__|__| |__|__|__| |__|__|__| |__|__|__| |__|__|__| |__|__|__| |__|__|__|
G3a5 – Plot 5 |__| |__|__| Main crop (specify)_________ Intercrop 1 (specify)________ Intercrop 2 (specify)________ Intercrop 3 (specify)________
|__|__|__| |__|__|__| |__|__|__| |__|__|__| |__|__|__| |__|__|__| |__|__|__| |__|__|__|
G3b. IVS/irrigated land production
G3b1 - Plot 1 |__| |__|__| Main crop (specify)_________ Intercrop 1 (specify)________ Intercrop 2 (specify)________ Intercrop 3 (specify)________
|__|__|__| |__|__|__| |__|__|__| |__|__|__| |__|__|__| |__|__|__| |__|__|__| |__|__|__|
G3b2 - Plot 2 |__| |__|__| Main crop (specify)_________ Intercrop 1 (specify)________ Intercrop 2 (specify)________ Intercrop 3 (specify)________
|__|__|__| |__|__|__| |__|__|__| |__|__|__| |__|__|__| |__|__|__| |__|__|__| |__|__|__|
G3b3 - Plot 3 |__| |__|__| Main crop (specify)_________ Intercrop 1 (specify)________ Intercrop 2 (specify)________ Intercrop 3 (specify)________
|__|__|__| |__|__|__| |__|__|__| |__|__|__| |__|__|__| |__|__|__| |__|__|__| |__|__|__|
G3b4 - Plot 4 |__| |__|__| Main crop (specify)_________ Intercrop 1 (specify)________ Intercrop 2 (specify)________ Intercrop 3 (specify)________

Evaluation of CORAD Farmers Field Schools Enterprise Development services Ltd
Page 43 of 49
|__|__|__| |__|__|__| |__|__|__| |__|__|__| |__|__|__| |__|__|__| |__|__|__|
|__|__|__|
G3b5 - Plot 5 |__| |__|__| Main crop (specify)_________ Intercrop 1 (specify)________ Intercrop 2 (specify)________ Intercrop 3 (specify)________