Embed Size (px)
Citation preview

Copyright. Unpublished Work. Raytheon Company.
Customer Success Is Our Mission is a registered trademark of Raytheon Company.
Tom Lienhard
September 08, 2015
Using Statistics to
Remove Defects and
Reduce Escapes

Project Definition: Reduce Rework by Reducing Defect Leakage
Currently, over 30% of the Engineering effort is consumed reworking products already deemed “fit-for-purpose”. A major contributor to this is defect leakage. Defect leakage is calculated as a percentage by summing the defects attributable to a specific phase that are detected in later phases divided by the total number of defects attributable to that phase. Defect leakage is a good indicator of the quality of the different phases of the development process. Defect leakage for the some development phases is as high as 75%, whereas our threshold is set at 20%. Not catching and correcting defects at the earliest point in the process leads to cost and budget over-runs due to excessive rework. By investigating what types of defects go undetected during the various phases, corrections can be introduced into the process to help identify the top defect types.
Overview
Engineering Effort
development
rework
Note: No Raytheon data is used and actual data has been modified to be notional

Thought Process Map
Process Map
Distributional Characterization of Data
Product Scorecard
DOE Conducted
Failure Mode and Effect Analysis
Results
Conclusion
Agenda
What Was Learned So Far
What Was Learned So Far – Part 2
Improvement Goal
What Was Learned So Far – Part 3
What Was Learned So Far – Part 4

Reduce SWDefect Leakage
Minimize Defectsfrom entering into
the SWdevelopment
process
Improve the in-phase defect
detection process
What is theprocess?
Process Mapcurrent process
What are thepossible
weaknesses?
FMEA/CEPostmortems
What is the currentleakage ?
Gather data What data?
My GreenBeltOther BlackBelts
What about older projects?No, data not available
unless using SSDP Rev C
Data fromProgram Tracking
System
Organize data toeffectively analyze
What data?What want to know?
Estimate reworkby phase
% Leakage by Phase/Total# by Phase/Totaeffort by Phase/Tota$ by Phase/TotaWhere introducedWhere found
How do wemeasure theprocess?
Look for differentrequirementsDifferent customersMultiple perspective
Involve multiple projectsMultiple disciplines
Use modified S/W WorkshhetWant more than just overall
percentage leaked(Scorecard.xls)
Defect #s, Types,Phase intro/Detected
Defined in SSDP Rev C
BARRIER-Lack of data?
Red - Question or expected result Blue - Answer or actual result
Out Of Scope
What is a defect?What is leakage?(Use definitionsfrom Scorecard)
Effort associated foreach cell of worksheet
BARRIER-Lack of data?
Use Industry Numbers for effort by phase(Bob Rova - Motorola,TI, Hughes)
How?
Is there one?SW4205760, Rev C
How Determine?What arex's, y's?
Howtell?
Severity, Occurrence, DetectionHighest RPN
What's important to "customer"What have we learned?
Data forFMEA
Underlined - Barrier
How well is itworking now?
(Org/RJ/NGC Scorecard.xls)
(Industry Costs.xls)
What is datashowing us?
Refine estimate as site databecomes available
Drill down into thedata/NEM/Control
Charts
Is the data anygood?
How good classification?How good categorize?
Validate MeasurementSystem MSE(KAPPA/ICC
or Nested Design)
DOE
Update process toensure data has
higher confidencerate/ train
NotAdequate
Improve the definition/classification of defectsTrain reviewers
What areimportant factors?
BARRIER-People's time
Time?Training?
Eval criteria?Process?
Attendees?
Determine actionBased on data Make and
communicateimprovements
Did change causeimprovement?
Set up controlplan and Use
Control Charts toMonitor
Effectiveness ofImprovements
Adequate
NewslettersLiaison Meetings
Common checklistsSQA Process Evals.Updated trainingReq't peopleRoles/respons.
BARRIER-Projects not
required to follow?
Roles& Respons upfrontStandard checklists
Better data collection systemConcentrate upfront
Resonable product sizeRight moderator
Appropriate teamAdequate checklistsProcess knowledge
(FMEA.xls)
X Bar R Chart shows prediction range by phaseShows variation within/between phasesPareto charts show defect types, where intro, found(X Bar Range and Pareto.xls)
BARRIER-People's time
BARRIER-People's time
Choice of factors
Design new processRedesign existing process
Stable process
Yes
Remove Common cause
Identify andRemove Special
Causes
No C Chart for processC Chart for phases
CharacterizeOptimizeProcess
Updated training, Common checklists, # of people, Moderator
Green - Update
ICC .88
TrainingExperienceNo Criteria
Thought Process Map – Where Are We Headed?

Peer ReviewPlanning
Product Review Review Meeting
C - Product to reviewS - Software PlansC - Team LeadC - Author
Review team - with assigned roles and responsibilitiesEvaluation criteriaNotice and agenda
S - Product for reviewC - Evaluation criteriaC - Reviewers roles and responsibilitiesC - Notice and agenda
Proposed defectsTime spent reviewing
S - Product for reviewC - Reviewers reviewed the productC - Review has adequate representationN - Proposed defects
Agree on and document defectsCapture review meeting metricsGain consensus on review outcome
Fit-for Purpose productPeer review records
ReworkProduct orDIsposition
Defects?
Rework
Rework Product
Disposition
S - Product to reworkS - Agreed to defectsS - Author
Corrected productDefect dispositionTime spent correcting
X - Critical (statistical proven critical)N - Noise (can't or choose not to control)S - SOP (the standard way to do it)C - Controllable (can be changed to see effect)
In-Phase PeerReview ProcessDraft Product
Review TeamSoftware Plans
"Fit-for-Purpose" ProductReview Records
Verify Dispositonof Agreed to
Defects
S - Product for reviewS - Agreed to defectsC - Reviewers
Dispositioned?
No
Yes
Process Map – Walk the Process

1 3
Severity9 - Defects go to customer6 - Defects cause rework3 - Data not collected1 - No harm/no foul
Occurrence:9 - Regular occurrence6 - Occurs more than occasionally3 - Occurs occasionally1 - Rare occurrence
Detection:9 - Nothing in place6 - Based on individuals3 - Check in place, usually works1 - Check in place & working
Look, alegend!
Failure Mode and Effect Analysis – How Can We Mess This Up?
Process or
Product Name:In-Phase Peer Review
Prepared by: Tom Lienhard &
TeamPage ____ of ____
Responsible:Tucson Software
Engineering Process GroupFMEA Date (Orig) 23 Sept 99 (Rev) 29 Sept 99
Process
Step/InputPotential Failure Mode Potential Failure Effects
S
E
V
Potential Causes
O
C
C
Current Controls
D
E
T
R
P
N
Actions
Recommended
What is the
process step/
Input under
investigation?
In what ways does the
process step go wrong?
What is the impact on the Key
Output Variables (Customer
Requirements) or internal
requirements?
What causes the process step
to go wrong?
What are the existing controls and
procedures (inspection and test)
that prevent eith the cause or the
Failure Mode? Should include an
SOP number.
What are the actions
for reducing the
occurrance of the
Cause, or improving
detection? Should
have actions only on
high RPN's or easy
fixes.
Peer Review
Planning
No Review Team identified
upfront w/review
package(roles &
responsibilities)
Product not reviewed by
appropriate disciplines6
SW plans do not require this
1
SEPG/SQA and peer review of
plans1 6
None
6
Lack of process awareness
6
Moderator to ensure review
package complete (contains
reviewers)6 216
Re-train moderator and
conduct process
evaluations
No product evaluation
criteria identified with
review package
Product not reviewed to
customer and/or process
requirements9
SW plans do not require this
1
SEPG/SQA and peer review of
plans 1 9
None
9
Lack of process awareness
6
Moderator to ensure review
package complete (contains review
criteria)6 324
Re-train moderator and
conduct process
evaluations
No notice or agenda with
review package
Team not able to give
adequate review time 6SW plans do not require this
1SEPG/SQA and peer review of
plans 1 6None
6
Lack of process awareness
6
Moderator to ensure review
package complete (contains notice
and agenda)6 216
Re-train moderator and
conduct process
evaluations
Product Review Product not reviewed Defects not found
9
Adequate time not given to
review 6
Moderator and SQD ensure
adequate time was given to review
product3 162
None - cultural thing
9
No or inadequate evaluation
criteria6
Moderator to ensure review
package complete (contains
evaluation criteria)9 486
Create generic
checklists for site (to
highest level) and
conduct process
evaluations
9
Inappropriate reviewers
6
Moderator to ensure appropriate
reviewers
9 486
Update command
media to identify
required participants on
notice & agenda and
conduct process
evluations
Metrics not captured Organization quantitative data
incorrect/incomplete 3SW plans do not require this
1SEPG/SQA and peer review of
plans 1 3None
3
Lack of process awareness
9
Moderator to ensure review
process followed (metrics
captured)6 162
Re-train moderator and
conduct process
evaluations

Potential causes factors with high RPN which kept showing up over and over on the FMEA:
• Inappropriate review team (“wrong” moderator, dominant, inexperienced, or yes-people made up the team)
• Lack of process awareness (both unintentional and deliberate)• No or inadequate review criteria (review what is there not what is missing,
biased review based on experience with phase)
Plan to minimize the occurrence and increase the detection:• Update the process to highlight required participants, their roles and
responsibilities on the Notice and Agenda• Roll-out Peer Review training• Have QA perform peer review process evaluations• Generate common evaluation criteria for all software products that can be used
across the entire organization
Use what was learned about factors as an input into DOE
What Was Learned, ….. So Far

Planning Customer Rqmts. Analysis
Design Implementation
Test Formal Test
Customer Before TOTAL Leaked
Planning29 0 0 0 0 0 0 0 29 0
Customer0 12 2 0 2 0 5 0 21 9
Rqmts. Analysis 0 0 61 14 29 26 71 1 202 141Design
0 0 1 323 82 29 38 2 475 151Implement
ation 0 0 1 5 220 43 44 10 323 97Test
0 0 0 2 1 249 30 0 282 30Formal
Test 0 0 0 0 0 13 597 0 610 0Customer Before 0 0 0 0 0 0 1 4 5 0
TOTAL 29 12 65 344 334 360 786 17 1947 428
Phase Detected
Pha
se I
ntro
duce
d
Number of defects identified by phase introduced and phase detected
Product Scorecard
Note: No Raytheon data is used and actual data has been modified to be notional

Planning Customer Rqmts. Analysis
Design Implementation
Test Formal Test
Customer Before
Planning0.07 0.1 0.19 0.17 0.67 1.23 1.4 0.54
Customer0.02 0.15 0.7 1 2.03 2.7 3.23 3.07
Rqmts. Analysis 0 0.1 0.12 0.86 1.13 1.6 0.79 1.65Design
0 0.11 0.13 0.13 0.1 0.8 3.13 2.64Implement
ation 0 0 0.17 0.1 0.7 2.1 2.02 2.33Test
0 0 0 0.08 0.03 0.08 0.15 0.16Formal
Test 0 0 0 0 0.04 0.18 0.25 0.58Customer
Before 0 0 0 0 0 0 2.7 3.4
Phase Detected
Pha
se I
ntro
duce
dCost to Detect and Correct Defects (in days)
Industry Standard*
* Motorola, Texas Instruments, Hughes Implementation of Six Sigma
Not All Defects Are Created Equal

Planning Customer Rqmts. Analysis
Design Implementation
Test Formal Test
Customer Before TOTAL Leaked
Planning2.03 0 0 0 0 0 0 0 2.03 0
Customer0 1.8 1.4 0 4.06 0 16.15 0 23.41 21.61
Rqmts. Analysis 0 0 7.32 12.04 32.77 41.6 56.09 0.79 150.61 143.29Design
0 0 0.13 41.99 8.2 23.2 118.94 5.28 197.74 155.75Implement
ation 0 0 0.17 0.5 154 90.3 88.88 23.3 357.15 203.15Test
0 0 0 0.16 0.03 19.92 4.5 0 24.61 4.69Formal
Test 0 0 0 0 0 2.34 149.25 0 151.59 2.34Customer
Before 0 0 0 0 0 0 2.7 13.6 16.3 13.6
TOTAL 2.03 1.8 9.02 54.69 199.06 177.36 436.51 42.97 923.44 544.43
Phase Detected
Pha
se I
ntro
duce
dCost of Rework Due to Defects (in Days)
Note: No Raytheon data is used and actual data has been modified to be notional

Introduced by Phase
0%
5%
10%
15%
20%
25%
30%
35%
Introduced by Phase
Using Pareto Charts We Know Where Defects Enter the Process . . . And Where Those Defects Are Detected by the Process . . .
Detected by Phase
0%
5%
10%
15%
20%
25%
30%
35%
40%
45%
Detected by Phase
High cost - product done
And Even Which Phases Are Hitting the Bottom Line
Rework by Phase (in days)
0
100
200
300
400
500
600
Rework
Rework due to Leakage
What We Learned…….• Formal test introduced > 30% of defects • Finding 58% of defects when
product is done (i.e., testing)• 3 Phases account for > 92% of rework
due to leakage
What We Learned…….• Formal test introduced > 30% of defects • Finding 58% of defects when
product is done (i.e., testing)• 3 Phases account for > 92% of rework
due to leakage
What Was Learned, ….. So Far (Part 2)

$0
$50,000
$100,000
$150,000
$200,000
$250,000
$300,000
$350,000
$400,000
Plannin
g
Custo
mer
Reqs A
nalys
is
Design
Imple
men
tatio
nTe
st
Form
al Te
st
Custo
mer
Bef
ore
Phase Detected
Cu
mu
lati
ve C
ost
s
Existing Detection
Improved Detection
Baseline defect cost profile
Goal defect cost profile
Same number of total defects introduced in the same phases
IMPACT ONBOTTOM LINE
Improvement Goal
Note: No Raytheon data is used and actual data has been modified to be notional

100
90
80
70
60
50
40
30
20
Per
cent
Def
e cts
Fou
nd I
n P
hase
Is the variation between or within subgroups?
Goal
Stable or Unstable?
Plan
ning
Cu s
t . Pl
an
Req
’ts
Des
i gn
Imp l
em.
Test
Form
al T
est
Cu s
t om
er
These 3 phases accountfor > 92% of rework
Distributional Characteristics of Data (Three Projects)

2520151050
1.0
0.5
0.0
Sample Number
Pro
port
ion
P Chart for In Phase
P=0.7678
3.0SL=1.000
-3.0SL=0.00E+00
Stability of Entire Process…
Not as easy as finding the best project and replicate

321
1.05
1.00
0.95
Sample Number
Pro
port
ion
P Chart for In Phase
P=1.0003.0SL=1.000-3.0SL=1.000
321
1.0
0.5
0.0
Sample Number
Pro
port
ion
P Chart for In Phase
P=0.5714
3.0SL=1.000
-3.0SL=0.00E+00
321
0.55
0.45
0.35
0.25
0.15
0.05
Sample Number
Pro
port
ion
P Chart for In Phase
P=0.3020
3.0SL=0.5198
-3.0SL=0.08420
321
0.8
0.7
0.6
0.5
Sample Number
Pro
port
ion
P Chart for In Phase
P=0.6800
3.0SL=0.7545
-3.0SL=0.6055
321
0.8
0.7
0.6
Sample Number
Pro
port
ion
P Chart for In Phase
P=0.6811
3.0SL=0.7997
-3.0SL=0.5625
321
1.0
0.9
0.8
Sample Number
Pro
port
ion
P Chart for In Phase
P=0.8830
3.0SL=0.9578
-3.0SL=0.8081
321
1.005
0.995
0.985
0.975
0.965
0.955
0.945
Sample Number
Pro
port
ion
P Chart for In Phase
P=0.9787
3.0SL=1.000
-3.0SL=0.9492
321
1.0
0.5
0.0
Sample Number
Pro
port
ion
P Chart for In Phase
P=0.8000
3.0SL=1.000
-3.0SL=0.00E+00
Looks pretty stable within subgroups (projects)...
Predictable to be between 0% - 100%Customer process, team
spun off to work this
….Then applied to Each Phase

8765432Subgroup 1
1101009080706050403020
Sa
mp
l e M
ea
n
1
1
1
X=74.46
3.0SL=92.36
-3.0SL=56.55
50
40
30
20
10
0
Sa
mp
l e R
an
ge
1
R=17.50
3.0SL=45.05
-3.0SL=0.00E+00
Displays range “within” the subgroups
Within Subgroups
Betw
een Subgroups
*Out-of-control range indicates special cause affecting customers’ process
Displays averages “between” the subgroups
How About Between the Subgroups?
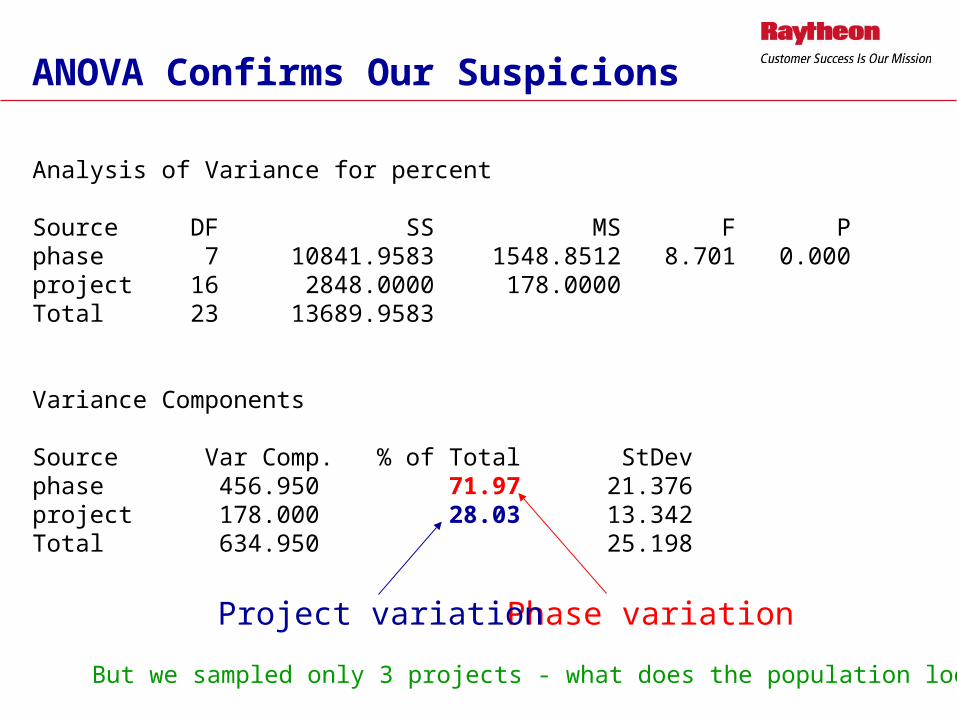
Analysis of Variance for percent
Source DF SS MS F Pphase 7 10841.9583 1548.8512 8.701 0.000project 16 2848.0000 178.0000Total 23 13689.9583
Variance Components
Source Var Comp. % of Total StDevphase 456.950 71.97 21.376project 178.000 28.03 13.342Total 634.950 25.198
Phase variationProject variation
But we sampled only 3 projects - what does the population look like?
ANOVA Confirms Our Suspicions

25 26 27 28 29 30 31
95% Confidence Interval for Mu
20 25 30 35
95% Confidence Interval for Median
Variable: Req
A-Squared:P-Value:
MeanStDevVarianceSkewnessKurtosisN
Minimum1st QuartileMedian3rd QuartileMaximum
20.6813
1.6737
25.0000
0.3380.200
28.6667 3.214610.3333
-1.54539
3
25.000025.000030.000031.000031.0000
36.6521
20.2026
31.0000
Anderson-Darling Normality Test
95% Confidence Interval for Mu
95% Confidence Interval for Sigma
95% Confidence Interval for Median
Descriptive Statistics
60 70 80 90 100
95% Confidence Interval for Mu
0 20 40 60 80 100 120 140
95% Confidence Interval for Median
Variable: Cust1
A-Squared:P-Value:
MeanStDevVarianceSkewnessKurtosisN
Minimum1st QuartileMedian3rd QuartileMaximum
7.512
13.237
55.000
0.4460.081
70.666725.4231646.3331.72000
3
55.000 55.000 57.000100.000100.000
133.821
159.777
100.000
Anderson-Darling Normality Test
95% Confidence Interval for Mu
95% Confidence Interval for Sigma
95% Confidence Interval for Median
Descriptive Statistics
55 60 65 70 75
95% Confidence Interval for Mu
40 50 60 70 80 90
95% Confidence Interval for Median
Variable: Design
A-Squared:P-Value:
MeanStDevVarianceSkewnessKurtosisN
Minimum1st QuartileMedian3rd QuartileMaximum
42.2518
4.8377
55.0000
0.2590.384
65.3333 9.291686.3333
-1.18512
3
55.000055.000068.000073.000073.0000
88.4149
58.3951
73.0000
Anderson-Darling Normality Test
95% Confidence Interval for Mu
95% Confidence Interval for Sigma
95% Confidence Interval for Median
Descriptive Statistics
65 67 69 71 73
95% Confidence Interval for Mu
60 70 80
95% Confidence Interval for Median
Variable: Implem
A-Squared:P-Value:
MeanStDevVarianceSkewnessKurtosisN
Minimum1st QuartileMedian3rd QuartileMaximum
58.6271
2.1042
65.0000
0.2120.536
68.6667 4.041516.3333
0.722109
3
65.000065.000068.000073.000073.0000
78.7062
25.3995
73.0000
Anderson-Darling Normality Test
95% Confidence Interval for Mu
95% Confidence Interval for Sigma
95% Confidence Interval for Median
Descriptive Statistics
82 84 86 88 90 92
95% Confidence Interval for Mu
72 82 92 102
95% Confidence Interval for Median
Variable: test
A-Squared:P-Value:
MeanStDevVarianceSkewnessKurtosisN
Minimum1st QuartileMedian3rd QuartileMaximum
73.985
2.868
82.000
0.1930.616
87.6667 5.507630.3333-2.7E-01
3
82.000 82.000 88.000 93.000 93.000
101.348
34.614
93.000
Anderson-Darling Normality Test
95% Confidence Interval for Mu
95% Confidence Interval for Sigma
95% Confidence Interval for Median
Descriptive Statistics
97 98 99
95% Confidence Interval for Mu
96 97 98 99 100 101
95% Confidence Interval for Median
Variable: Form Tst
A-Squared:P-Value:
MeanStDevVarianceSkewnessKurtosisN
Minimum1st QuartileMedian3rd QuartileMaximum
95.516
0.521
97.000
0.1890.631
98 110
3
97.000 97.000 98.000 99.000 99.000
100.484
6.285
99.000
Anderson-Darling Normality Test
95% Confidence Interval for Mu
95% Confidence Interval for Sigma
95% Confidence Interval for Median
Descriptive Statistics
Calculating Confidence Intervals...

phase
pe
rce
nt
Planning Cust. Reqs Design Implem Test FormalTst
Cust.
40
90
140
0
If I were a betting man…. the true population means are within these intervals
7
134
21
3742
88
59
78
74
101
96
100
14
139
100
Goal
...Gives Us Plausible Population Range

What Was Learned, ….. So Far (Part 3)
• Variation between the phases (72%) is greater than variation between projects (28%) • need to work largest source of variation - what changed between, what didn’t, etc.
• If no action is taken 95% confident that• the Requirements Phase will find between 21% - 37% of defects in phase• the Design Phase will find between 42% - 88% of defects in phase• the Implementation Phase will find 59% - 78% of defects in phase
80 %Threshold
100 %
SW Phase
Green -customer processRed - < 92 5 of reworkBlue - testing process

Four Factorsexperience (<2 yrs >2 yrs)training (No Yes)review criteria (None Checklist)number of reviewers (2 >2 )Block by Project culture, management style, schedule pressures
Sixteen Runs 25-1 Half fraction
Resolution V Mains compounded w/4ways, 2 w/3ways
Response Variablepercentage of defects which match EPG and project leads’
Limitations:Products reviewed were differentRestrictions on randomizationHard to find “team” fulfilling factor levels
Design of Experiments (DOE)

StdOrder RunOrder Program Experience Training Criteria Num People % Match1 1 -1 1 -1 -1 -1 705 2 -1 -1 -1 -1 1 553 3 -1 -1 -1 1 -1 307 4 -1 1 -1 1 1 602 5 -1 -1 1 -1 -1 706 6 -1 1 1 -1 1 804 7 -1 1 1 1 -1 658 8 -1 -1 1 1 1 609 9 1 -1 -1 -1 -1 4513 10 1 1 -1 -1 1 5515 11 1 -1 -1 1 1 3511 12 1 1 -1 1 -1 5514 13 1 -1 1 -1 1 8010 14 1 1 1 -1 -1 8012 15 1 -1 1 1 -1 5516 16 1 1 1 1 1 70
DOE Run Results

DOE Run Chart
161161
80
70
60
50
40
30
Observation
% M
atc
h
Run Chart for % Match
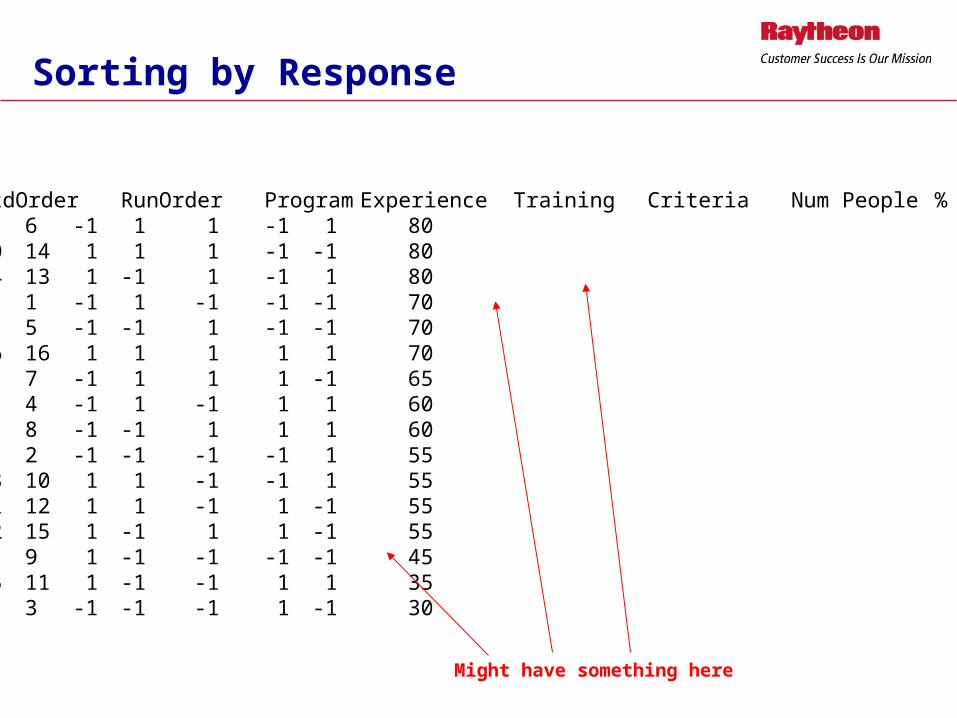
StdOrder RunOrder Program Experience Training Criteria Num People % Match6 6 -1 1 1 -1 1 8010 14 1 1 1 -1 -1 8014 13 1 -1 1 -1 1 801 1 -1 1 -1 -1 -1 702 5 -1 -1 1 -1 -1 7016 16 1 1 1 1 1 704 7 -1 1 1 1 -1 657 4 -1 1 -1 1 1 608 8 -1 -1 1 1 1 605 2 -1 -1 -1 -1 1 5513 10 1 1 -1 -1 1 5511 12 1 1 -1 1 -1 5512 15 1 -1 1 1 -1 559 9 1 -1 -1 -1 -1 4515 11 1 -1 -1 1 1 353 3 -1 -1 -1 1 -1 30
Might have something here
Sorting by Response

20100-10
1
0
-1
Effect
No
rmal
Sco
re
C
A
B
Normal Probability Plot of the Effects(response is % Match, Alpha = .10)
A: ExperienB: TrainingC: CriteriaD: Num Peop
151050
B
C
A
AB
AD
ACD
AC
D
CD
BD
BCD
BC
ABD
ABC
Pareto Chart of the Effects(response is % Match, Alpha = .10)
A: ExperienB: TrainingC: CriteriaD: Num Peop
Shows Training, Criteria, Experienceas the influential factors
Data looks pretty normal

Fractional Factorial FitEstimated Effects and Coefficients for % (coded units)
Term Effect CoefConstant 60.312 Program -1.875 -0.938 Experien 13.125 6.562 Training 19.375 9.687 Criteria -13.125 -6.562 Num Peop 3.125 1.562 Program*Experien -1.875 -0.937 Program*Training 4.375 2.187 Program*Criteria 1.875 0.937 Program*Num Peop -1.875 -0.937 Experien*Training -5.625 -2.812 Experien*Criteria 4.375 2.188 Experien*Num Peop -4.375 -2.187 Training*Criteria -1.875 -0.938 Training*Num Peop 1.875 0.937 Criteria*Num Peop 1.875 0.937
Analysis of Variance for % (coded units)
Source DF Seq SS Adj SS Adj MS F PMain Effects 5 2932.8 2932.8 586.56 * *2-Way Interactions 10 440.6 440.6 44.06 * *Residual Error 0 0.0 0.0 0.00Total 15 3373.4
Shows same thingTraining, Criteria, Experience
as the influential factors

Num PeopleCriteriaTrainingExperienceProgram
1-1 1-1 1-1 1-1 1-1
70
65
60
55
50
% M
atch
Main Effects Plot (data means) for % Match
Same data but not we knowwhether to set high or low
Whoa, what do we have here?
Process pretty robust toprogram, number of reviewers

1-11-11-11-11-1
80
60
4080
60
4080
60
4080
60
4080
60
40
Program
Experience
Training
Criteria
Num People
1
-1
1
-1
1
-1
1
-1
1
-1
Interaction Plot (data means) for % Match

What Was Learned, ….. So Far (Part 4)
Experience was no brainier - more is better
Training was no brainer - have to have it!
Number of people was eye opening - didn’t make too much difference Since more people cost more money, keep it at 2
Criteria was a shock
Need to do follow-up to see why this was counter-intuitive
Follow up revealed criteria limited the scope of the review,reviewed only what was there, did not use as intended

Don’t Spend a Dollar to Save a Dime
Other Measures Were Monitored, to Ensure a Known Balance Between Cost, Schedule and Quality

Thought Process Map - big benefit when reviewing project with others. Helps avoid heading down a dead end path before you even start. Makes you ask questions and identify barriers well before you actually get there. Much more critical than first thought. Is a pain to keep up to date
Process Map - get a feel for how the process is actually operating, not how it is designed to operate. Important to get a varying cross section of disciplines to get all point of views. Key to almost everything, need to know what x’s are involved in achieving Y
Pareto Chart - Bar chart ordered from largest to smallest. Helped immediately determine which itemsto focus improvements upon for the largest payback and where to ask initial questions.
Control Charts - Distinguishes special and common variation in the process. Helps todevelop appropriate action for the type of variation. Showed how process would perform if nothing done to improve it .
FMEA - Identified possible failures, severity, occurrence and delectability, and prioritized the actions that should be taken. Important to get cross sectional input and consensus. Influential factors were hard to miss.
S/W Worksheet (Product Scorecard) - Collects and categorizes defect data across software life cycle. Facilitates to baseline data and track improvement. Unmodified SW Worksheet doesn’t tell you everything you need to show improvement
Bottom line - Until the DOE all the tools were useful and we could see their value. They confirmed
what was already known. We were able to move forward confident that we were
working the right issues and had the metrics to back up my assumptions.
After the DOE a valuable lesson was learned. We do not know everything. If we
hadn’t used the data to run the DOE, we would have made things worse!!
DOE - Determined what factors were influential and were to set those factors. Showed that the obvious accepted conclusions are not always an improvement.
Tool Usage

Results

AFTER IMPROVEMENTS
PHASE DETECTED
PHASEPlanning Customer Rqmts.
Analysis
Design Implementa
tion
Test Formal
Test
Customer
Before TOTAL
IPlanning
235 2 0 3 0 0 0 0 240
NCustomer
0 22 22 7 4 0 0 0 55
TRqmts.
Analysis 0 1 161 13 7 2 0 0 184
RDesign
0 0 3 173 111 2 0 0 289
OImplementa
tion 0 0 0 2 342 20 0 1 365
DTest
0 0 0 2 2 22 1 0 27
UFormal
Test 0 0 0 0 0 0 2 1 3
CCustomer
Before 0 0 0 0 0 0 0 3 3
D TOTAL 235 25 186 200 466 46 3 5 1166
Planning Customer Rqmts. Analysis
Design Implementation
Test Formal Test
Customer Before TOTAL
Planning29 0 0 0 0 0 0 0 29
Customer0 12 2 0 2 0 5 0 21
Rqmts. Analysis 0 0 61 14 29 26 71 1 202Design
0 0 1 323 82 29 38 2 475Implement
ation 0 0 1 5 220 43 44 10 323Test
0 0 0 2 1 249 30 0 282Formal
Test 0 0 0 0 0 13 597 0 610Customer Before 0 0 0 0 0 0 1 4 5
TOTAL 29 12 65 344 334 360 786 17 1947
Number of defects identified by phase introduced/phase detected (from Product Scorecard)
Number of defects identified by phase introduced/phase detected (from Product Scorecard)
Note: No Raytheon data is used and
actual data has been modified to be notional

AFTER IMPROVEMENTS
PHASE DETECTED
PHASEPlanning Customer Rqmts.
Analysis
Design Implementa
tion
Test Formal
Test
Customer
Before TOTAL
IPlanning
98% 1% 0% 1% 0% 0% 0% 0% 21%
NCustomer
0% 40% 40% 13% 7% 0% 0% 0% 5%
TRqmts.
Analysis 0% 1% 88% 7% 4% 1% 0% 0% 16%
RDesign
0% 0% 1% 60% 38% 1% 0% 0% 25%
OImplementa
tion 0% 0% 0% 1% 94% 5% 0% 0% 31%
DTest
0% 0% 0% 7% 7% 81% 4% 0% 2%
UFormal
Test 0% 0% 0% 0% 0% 0% 67% 33% 0%
CCustomer
Before 0% 0% 0% 0% 0% 0% 0% 100% 0%
D TOTAL 20% 2% 16% 17% 40% 4% 0% 0% 100%
0%
0%10%
Planning Customer Rqmts.
Analysis
Design Implement
ation
Test Formal
Test
Customer
Before TOTALPlanning
100% 0% 0% 0% 0% 0% 0% 1%Customer
0% 57% 0% 10% 0% 24% 1%Rqmts.
Analysis 0% 0% 30% 7% 14% 13% 35% 0% 10%Design
0% 0% 0% 68% 17% 6% 8% 0% 24%Implement
ation 0% 0% 0% 2% 68% 13% 14% 3% 17%Test
0% 0% 0% 1% 0% 88% 11% 0% 14%Formal
Test 0% 0% 0% 0% 0% 2% 98% 0% 31%Customer
Before 0% 0% 0% 0% 0% 0% 20% 80% 0%
TOTAL 1% 1% 3% 18% 17% 18% 40% 1% 100%
Percentage of defects identified by phase introduced/phase detected (from Product Scorecard)
Percentage of defects identified by phase introduced/phase detected (from Product Scorecard)
Note: No Raytheon data is used and
actual data has been modified to be notional

PHASE DETECTED
PHASEPlanningCustomerRqmts.
AnalysisDesignImplementa
tionTest Formal
TestCustomer
Before TOTAL Leaked
IPlanning
16.45 2 0 0.51 0 0 0 0 18.96 2.51
NCustomer
0 3.3 15.4 7 8.12 0 0 0 33.82 30.52
TRqmts. Analysis 0 1 19.32 11.18 7.91 3.2 0 0 42.61 23.29
RDesign
0 0 0.39 22.49 11.1 1.6 0 0 35.58 13.09
OImplementa
tion 0 0 0 0.2 239.4 42 0 2.33 283.93 44.53
DTest
0 0 0 0.16 0.06 1.76 0.15 0 2.13 0.37
UFormal Test 0 0 0 0 0 0 0.5 0.58 1.08 0.58
CCustomer
Before 0 0 0 0 0 0 0 10.2 10.2 10.2
D TOTAL 16.45 6.3 35.11 41.54 266.59 48.56 0.65 13.11 428.31 125.09
Planning Customer Rqmts. Analysis
Design Implementation
Test Formal Test
Customer Before TOTAL Leaked
Planning2.03 0 0 0 0 0 0 0 2.03 0
Customer0 1.8 1.4 0 4.06 0 16.15 0 23.41 21.61
Rqmts. Analysis 0 0 7.32 12.04 32.77 41.6 56.09 0.79 150.61 143.29Design
0 0 0.13 41.99 8.2 23.2 118.94 5.28 197.74 155.75Implement
ation 0 0 0.17 0.5 154 90.3 88.88 23.3 357.15 203.15Test
0 0 0 0.16 0.03 19.92 4.5 0 24.61 4.69Formal
Test 0 0 0 0 0 2.34 149.25 0 151.59 2.34Customer
Before 0 0 0 0 0 0 2.7 13.6 16.3 13.6
TOTAL 2.03 1.8 9.02 54.69 199.06177.36436.51 42.97 923.44 544.43
AFTER IMPROVEMENTS
Cost of Rework due to Defects in Days (from Product Scorecard)
Cost of Rework due to Defects in Days (from Product Scorecard)
Note: No Raytheon data is used and
actual data has been modified to be notional

AFTER IMPROVEMENTS
87654321
1 0 0
9 0
8 0
7 0
6 0
5 0
4 0
3 0
2 0
C 4 4
Ba
se
line
Three Phases
87654321
1 0 0
9 0
8 0
7 0
6 0
5 0
4 0
3 0
2 0
C 5 1
Imp
ro
ve
d Three Phases
95% Confident That Two of the ThreePhase Will be World-Class. The ThirdHad Drastic Improvement
95% Confident That Two of the ThreePhase Will be World-Class. The ThirdHad Drastic Improvement
What happened here? Remember weare measuring % not #. We went from282 to 27, a huge improvement in rework $ and effort, but % wise it was a decline

AFTER IMPROVEMENTS
Rework Effort in Dollars by Phase
$0
$50,000
$100,000
$150,000
$200,000
$250,000
Plannin
g
Custom
er
Rqmts. A
nalys
is
Design
Implem
enta
tion
Test
Formal T
est
Custom
er B
efor
e
TOTAL
Software Development Phase
Do
llar
s
0%
10%
20%
30%
40%
50%
60%
70%
80%
90%
100%
Leaked Rework
In-Phase Rework
% Leaked
Cost of Rework due to DefectsCost of Rework due to Defects
Rework Effort in Dollars by Phase
$0
$50,000
$100,000
$150,000
$200,000
$250,000
Software Development Phase
0%
10%
20%
30%
40%
50%
60%
70%
80%
90%
100%
Leaked Rework
In-Phase Rework
% Leaked
$0
$50,000
$100,000
$150,000
$200,000
$250,000
$300,000
$350,000
$400,000
Planning Customer Reqs Analysis Design Implementation Test Formal Test CustomerBefore
Phase Detected
Existing Detection
Goal
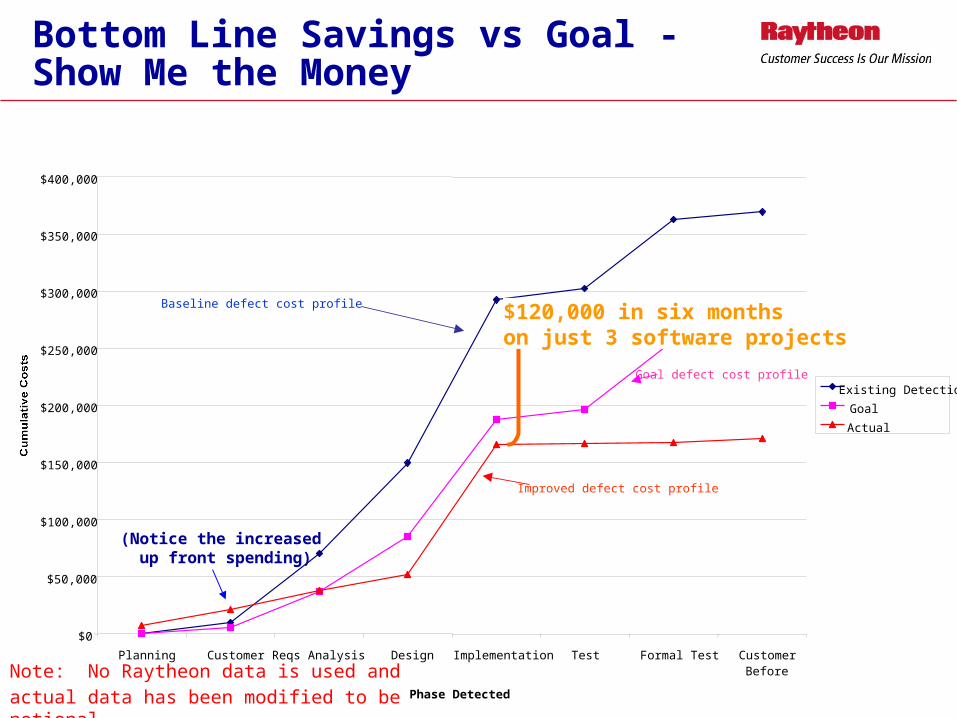
Actual
Baseline defect cost profile
Improved defect cost profile
Goal defect cost profile
$120,000 in six months on just 3 software projects
(Notice the increased up front spending)
Bottom Line Savings vs Goal - Show Me the Money
Note: No Raytheon data is used and
actual data has been modified to be notional

AFTER IMPROVEMENTS
Three Phase Where Project Concentrated(Three Phases With > 92% of Rework)Three Phase Where Project Concentrated(Three Phases With > 92% of Rework)
Recalculating the control limitsto see if there is significance….
654321
1.0
0.9
0.8
0.7
0.6
0.5
0.4
0.3
0.2
Sample Number
Pro
port
ion
P Chart for In Phase
P=0.5751
3.0SL=0.6845
-3.0SL=0.4658
654321
1.0
0.9
0.8
0.7
0.6
0.5
0.4
Sample Number
Pro
port
ion
P Chart for In Phase
P=0.6582
3.0SL=0.7419
-3.0SL=0.5745
654321
1.0
0.9
0.8
0.7
0.6
0.5
Sample Number
Pro
port
ion
P Chart for In Phase
P=0.8145
3.0SL=0.8756
-3.0SL=0.7535

654321
1.0
0.5
0.0
Sample Number
Pro
port
ion
P Chart for In Phase by Group
P=0.87503.0SL=0.9481
-3.0SL=0.8019
2
Control Limits for Requirements AnalysisPhase has no Overlap Whatsoever
Control Limits for Requirements AnalysisPhase has no Overlap Whatsoever
654321
1.0
0.9
0.8
0.7
0.6
0.5
0.4
Sample Number
Pro
port
ion
P Chart for In Phase by Group
P=0.6252
3.0SL=0.7106
-3.0SL=0.5398
2
Design Phase is More Interesting
Design Phase is More Interesting
654321
1.0
0.9
0.8
0.7
0.6
0.5
Sample Number
Pro
port
ion
P Chart for In Phase by Group
P=0.93733.0SL=0.9754
-3.0SL=0.8993
2
Control Limits for ImplementationPhase Have Significantly Changed
With Little Overlap
Control Limits for ImplementationPhase Have Significantly Changed
With Little Overlap
Range is much larger which widens the control limits.
However, looking at the scorecard, • only 1% of defects made it to test,
whereas before it was 14%. • Rework due to leakage was a
mere 13 days compared to 156 days!

• Make decisions based on data. • Experience is only one input parameter and can steer you wrong
• A few simple process changes resulted had BIG impact to bottom line!
• The three phases that were concentrated upon improved greatly• Two of the three are above the threshold
• Quick look at charts show that the process is now in control
• Just measuring the percentage of defect leakage is not the whole story• Test injected defects were significantly
reduced which resultedin a major cost savings
Conclusion:

Questions
For future questions the presenter contact information is:
Tom Lienhard [email protected]
520 663.6580