Embed Size (px)
Citation preview

Copyright © McGraw-Hill Companies, Inc. Permission required for reproduction or display.
1
Chapter 6
Microbial Growth
Copyright © McGraw-Hill Companies, Inc. Permission required for reproduction or display.
2
Growth• increase in cellular constituents that may
result in:– increase in cell number
• e.g., when microorganisms reproduce by budding or binary fission
– increase in cell size• e.g., coenocytic microorganisms have nuclear
divisions that are not accompanied by cell divisions
• microbiologists usually study population growth rather than growth of individual cells

Copyright © McGraw-Hill Companies, Inc. Permission required for reproduction or display.
3
The Growth Curve
• observed when microorganisms are cultivated in batch culture– culture incubated in a closed vessel
with a single batch of medium
• usually plotted as logarithm of cell number versus time
• usually has four distinct phases

Copyright © McGraw-Hill Companies, Inc. Permission required for reproduction or display.
4
Figure 6.1
no increase
maximal rate of divisionand population growth
population growth ceases
decline inpopulationsize

Copyright © McGraw-Hill Companies, Inc. Permission required for reproduction or display.
5
Lag Phase
• cell synthesizing new components– e.g., to replenish spent materials
– e.g., to adapt to new medium or other conditions
• varies in length– in some cases can be very short or even
absent
Copyright © McGraw-Hill Companies, Inc. Permission required for reproduction or display.
6
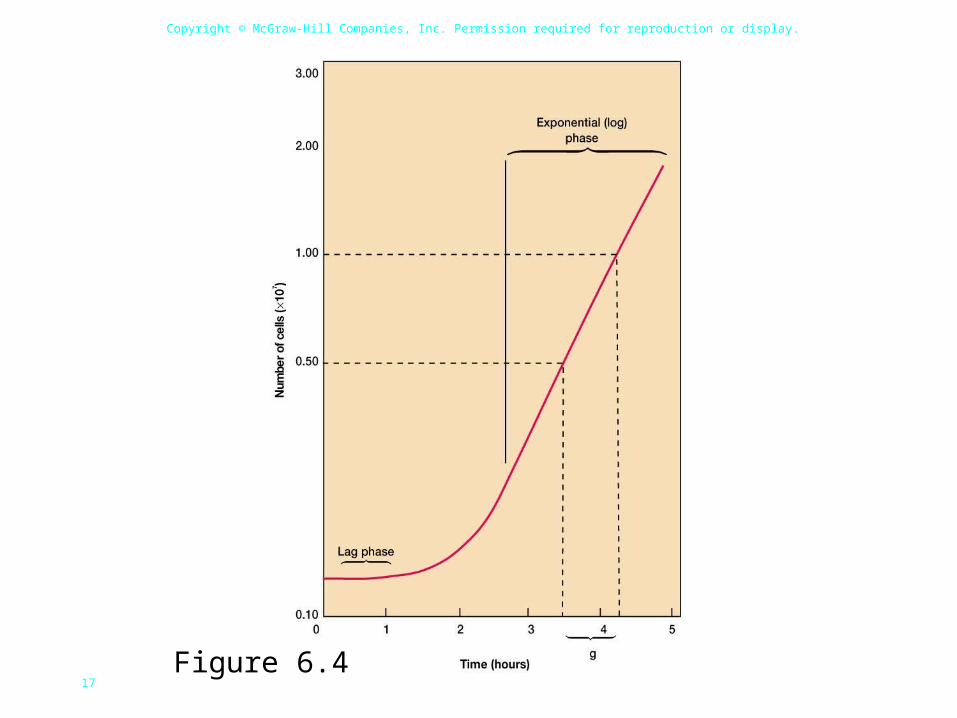
Exponential Phase
• also called log phase
• rate of growth is constant
• population is most uniform in terms of chemical and physical properties during this phase

Copyright © McGraw-Hill Companies, Inc. Permission required for reproduction or display.
7
cells are dividing and doubling in number at regular intervals
Copyright © McGraw-Hill Companies, Inc. Permission required for reproduction or display.
8
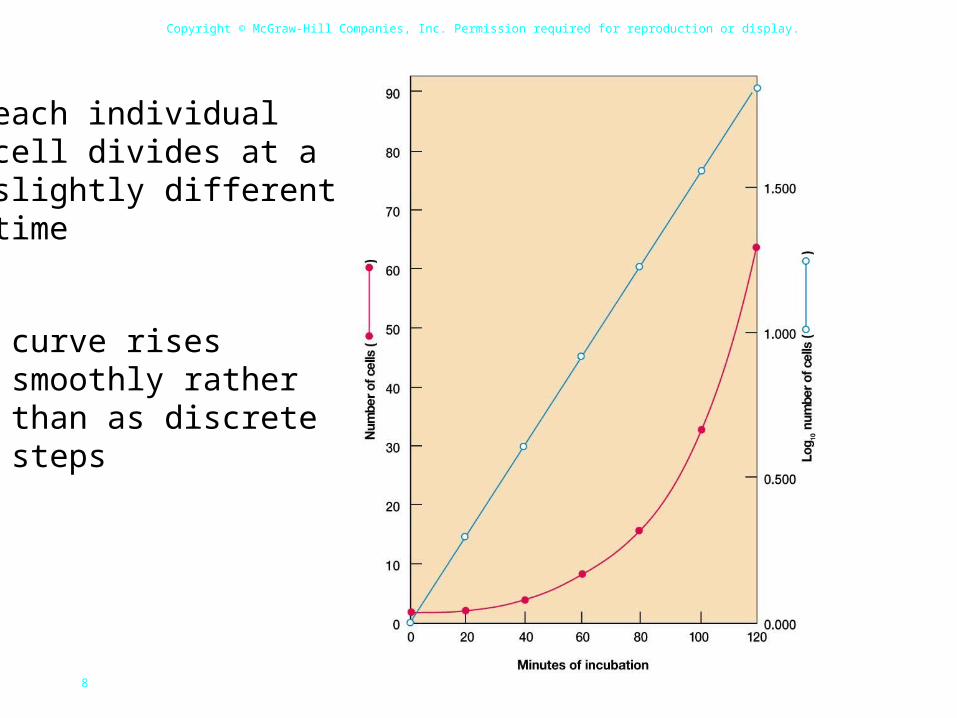
Figure 6.3
each individualcell divides at aslightly differenttime
curve risessmoothly ratherthan as discretesteps

Copyright © McGraw-Hill Companies, Inc. Permission required for reproduction or display.
9
Balanced growth
• during log phase, cells exhibit balanced growth– cellular constituents manufactured at
constant rates relative to each other
Copyright © McGraw-Hill Companies, Inc. Permission required for reproduction or display.
10
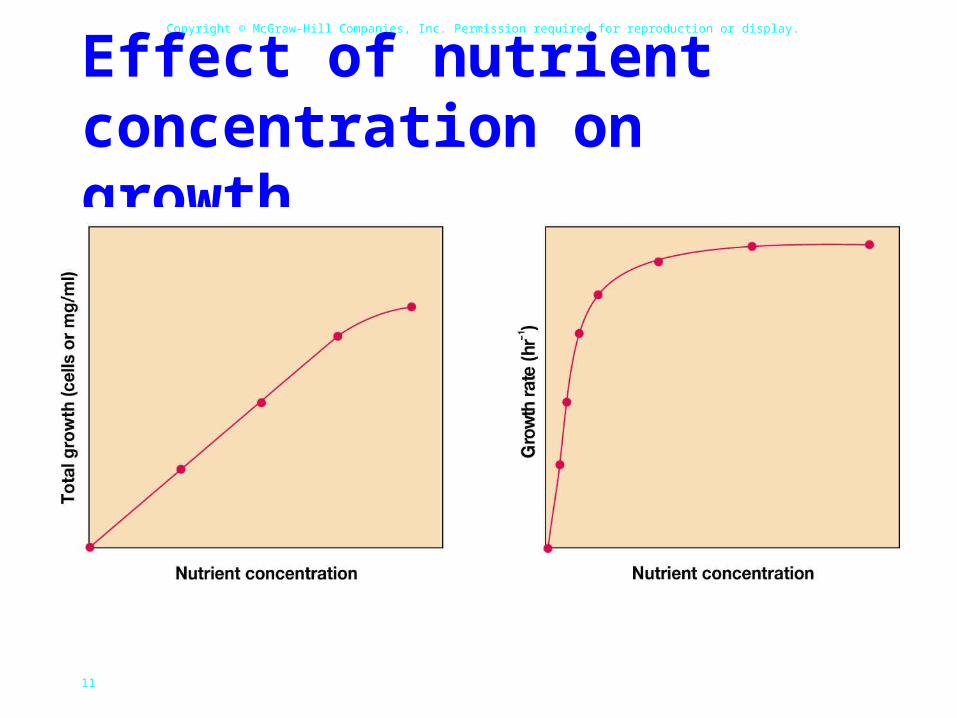
Unbalanced growth
• rates of synthesis of cell components vary relative to each other
• occurs under a variety of conditions– change in nutrient levels
• shift-up (poor medium to rich medium)• shift-down (rich medium to poor medium)
– change in environmental conditions
Copyright © McGraw-Hill Companies, Inc. Permission required for reproduction or display.
11
Effect of nutrient concentration on growth
Figure 6.2

Copyright © McGraw-Hill Companies, Inc. Permission required for reproduction or display.
12
Stationary Phase
• total number of viable cells remains constant– may occur because metabolically active
cells stop reproducing
– may occur because reproductive rate is balanced by death rate

Copyright © McGraw-Hill Companies, Inc. Permission required for reproduction or display.
13
Possible reasons for entry into stationary phase
• nutrient limitation
• limited oxygen availability
• toxic waste accumulation
• critical population density reached

Copyright © McGraw-Hill Companies, Inc. Permission required for reproduction or display.
14
Starvation responses• morphological changes
– e.g., endospore formation
• decrease in size, protoplast shrinkage, and nucleoid condensation
• production of starvation proteins• long-term survival• increased virulence

Copyright © McGraw-Hill Companies, Inc. Permission required for reproduction or display.
15
Death Phase
• cells dying, usually at exponential rate
• death– irreversible loss of ability to reproduce
• in some cases, death rate slows due to accumulation of resistant cells
Copyright © McGraw-Hill Companies, Inc. Permission required for reproduction or display.
16
The Mathematics of Growth
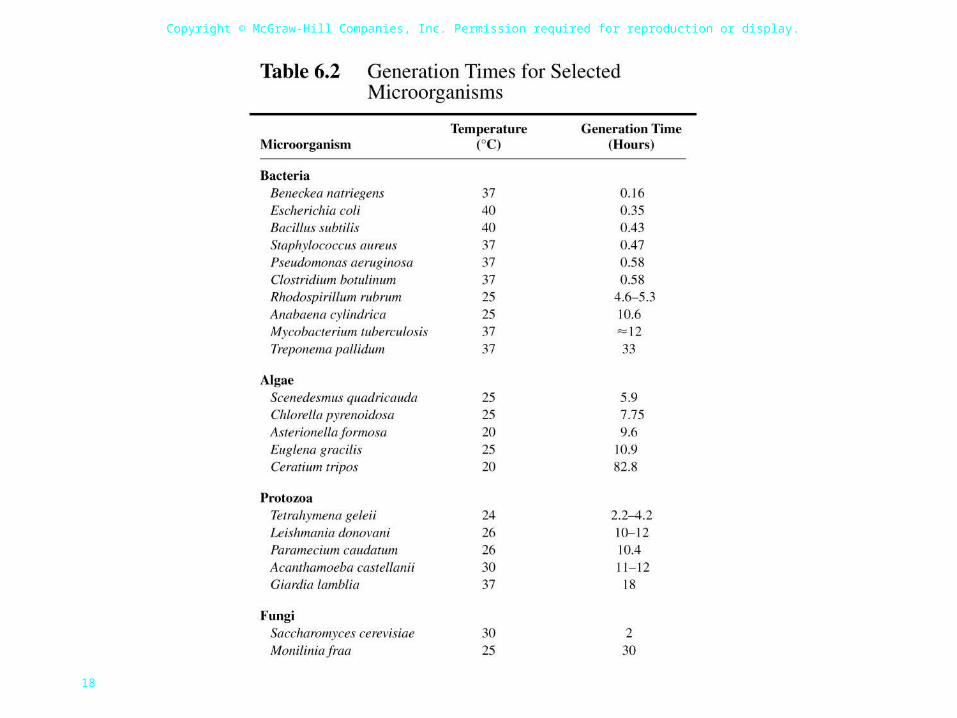
• generation (doubling) time– time required for the population to
double in size
• mean growth rate constant– number of generations per unit time
– usually expressed as generations per hour
Copyright © McGraw-Hill Companies, Inc. Permission required for reproduction or display.
17Figure 6.4
Copyright © McGraw-Hill Companies, Inc. Permission required for reproduction or display.
18
Copyright © McGraw-Hill Companies, Inc. Permission required for reproduction or display.
19
Measurement of Microbial Growth
• can measure changes in number of cells in a population
• can measure changes in mass of population
Copyright © McGraw-Hill Companies, Inc. Permission required for reproduction or display.
20
Measurement of Cell Numbers
• Direct cell counts– counting chambers
– electronic counters
– on membrane filters
• Viable cell counts– plating methods
– membrane filtration methods

Copyright © McGraw-Hill Companies, Inc. Permission required for reproduction or display.
21
Counting chambers• easy, inexpensive,
and quick• useful for
counting both eucaryotes and procaryotes
• cannot distinguish living from dead cells
Figure 6.5
Copyright © McGraw-Hill Companies, Inc. Permission required for reproduction or display.
22
Electronic counters
• microbial suspension forced through small orifice
• movement of microbe through orifice impacts electric current that flows through orifice
• instances of disruption of current are counted
Copyright © McGraw-Hill Companies, Inc. Permission required for reproduction or display.
23
Electronic counters…
• cannot distinguish living from dead cells
• quick and easy to use
• useful for large microorganisms and blood cells, but not procaryotes
Copyright © McGraw-Hill Companies, Inc. Permission required for reproduction or display.
24
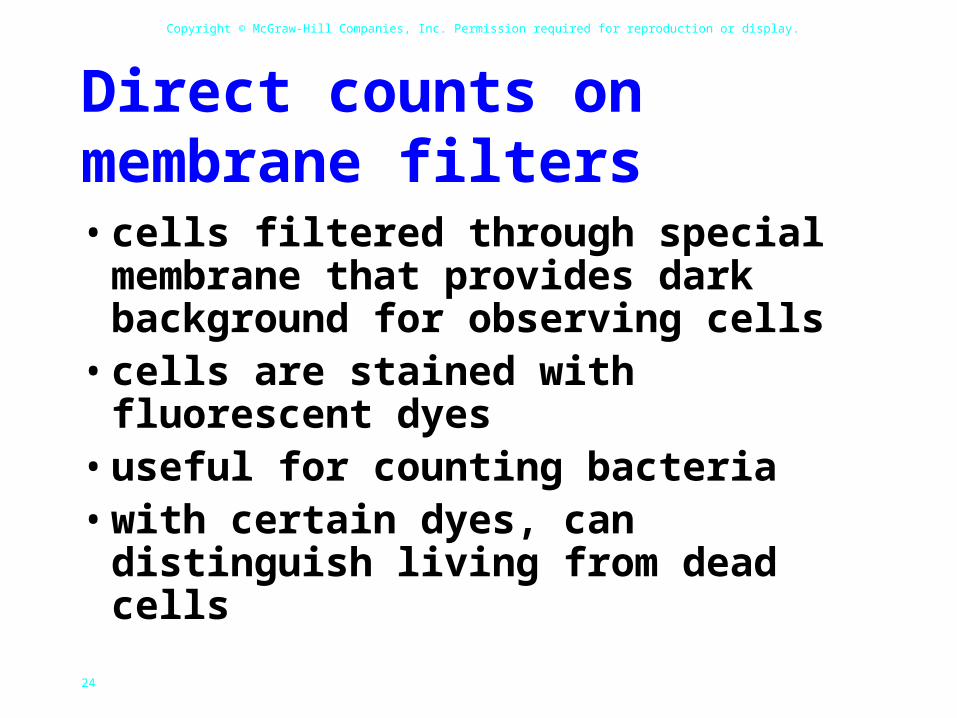
Direct counts on membrane filters• cells filtered through special
membrane that provides dark background for observing cells
• cells are stained with fluorescent dyes• useful for counting bacteria• with certain dyes, can distinguish
living from dead cells
Copyright © McGraw-Hill Companies, Inc. Permission required for reproduction or display.
25
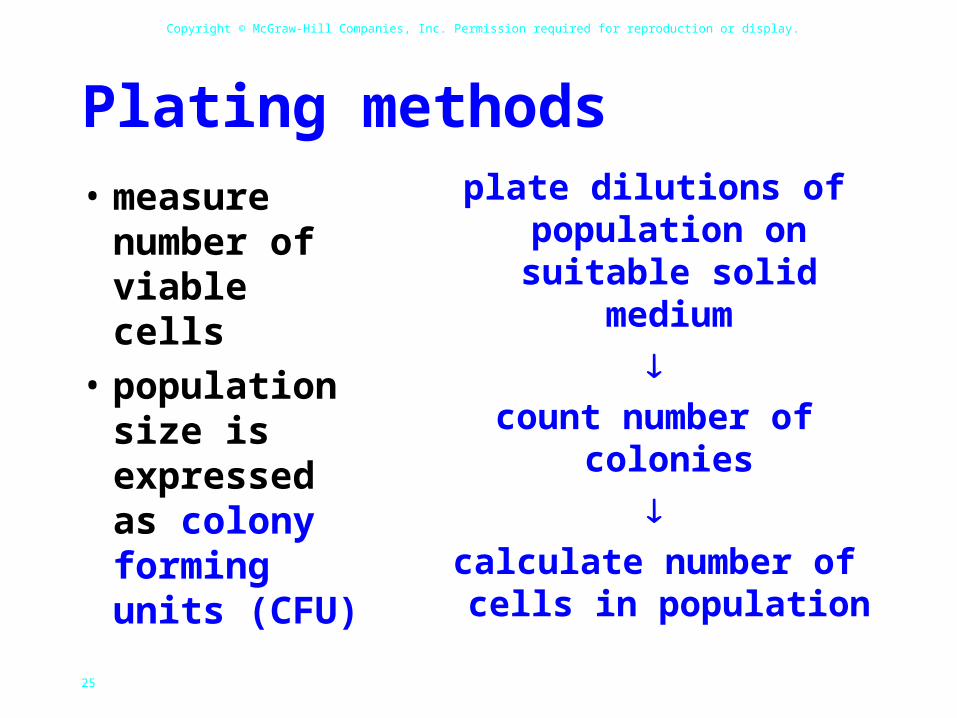
Plating methods
• measure number of viable cells
• population size is expressed as colony forming units (CFU)
plate dilutions of population on suitable
solid medium
count number of colonies
calculate number of cells
in population
Copyright © McGraw-Hill Companies, Inc. Permission required for reproduction or display.
26
Plating methods…
• simple and sensitive
• widely used for viable counts of microorganisms in food, water, and soil
• inaccurate results obtained if cells clump together
Copyright © McGraw-Hill Companies, Inc. Permission required for reproduction or display.
27
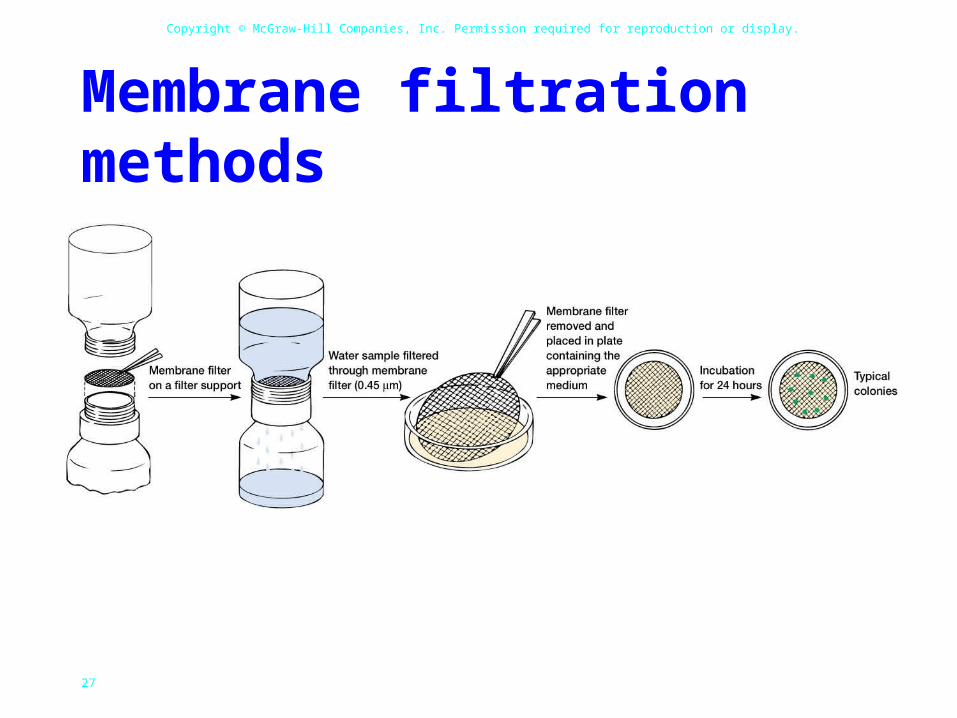
Membrane filtration methods
Figure 6.6especially useful for analyzing aquatic samples
Copyright © McGraw-Hill Companies, Inc. Permission required for reproduction or display.
28
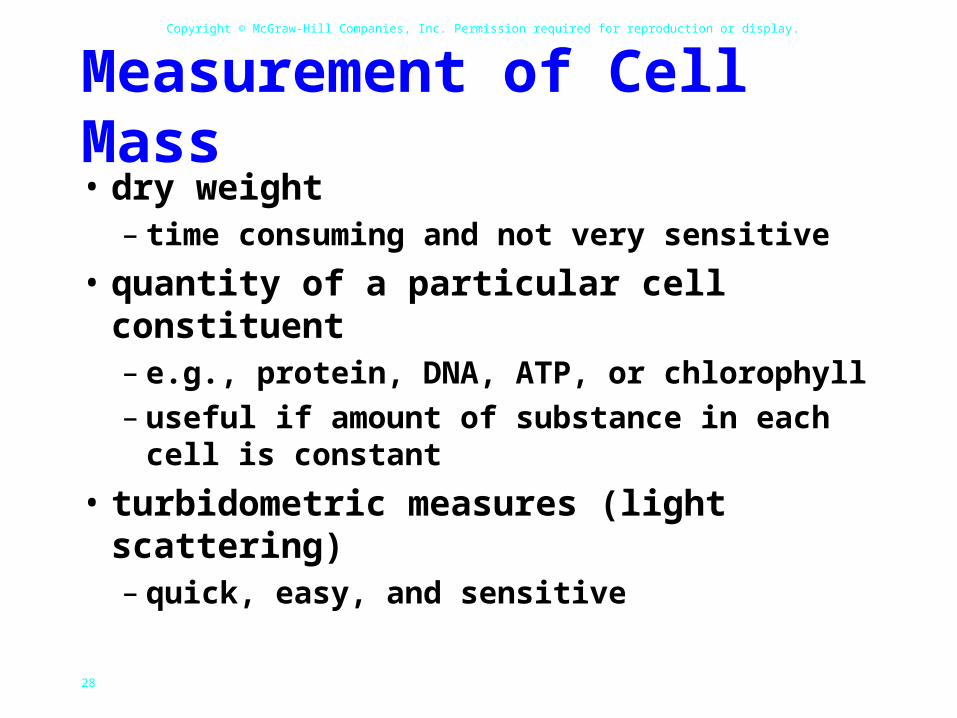
Measurement of Cell Mass• dry weight
– time consuming and not very sensitive
• quantity of a particular cell constituent– e.g., protein, DNA, ATP, or chlorophyll– useful if amount of substance in each cell is
constant
• turbidometric measures (light scattering)– quick, easy, and sensitive

Copyright © McGraw-Hill Companies, Inc. Permission required for reproduction or display.
29
Figure 6.8
more cells
more lightscattered
less lightdetected
Copyright © McGraw-Hill Companies, Inc. Permission required for reproduction or display.
30
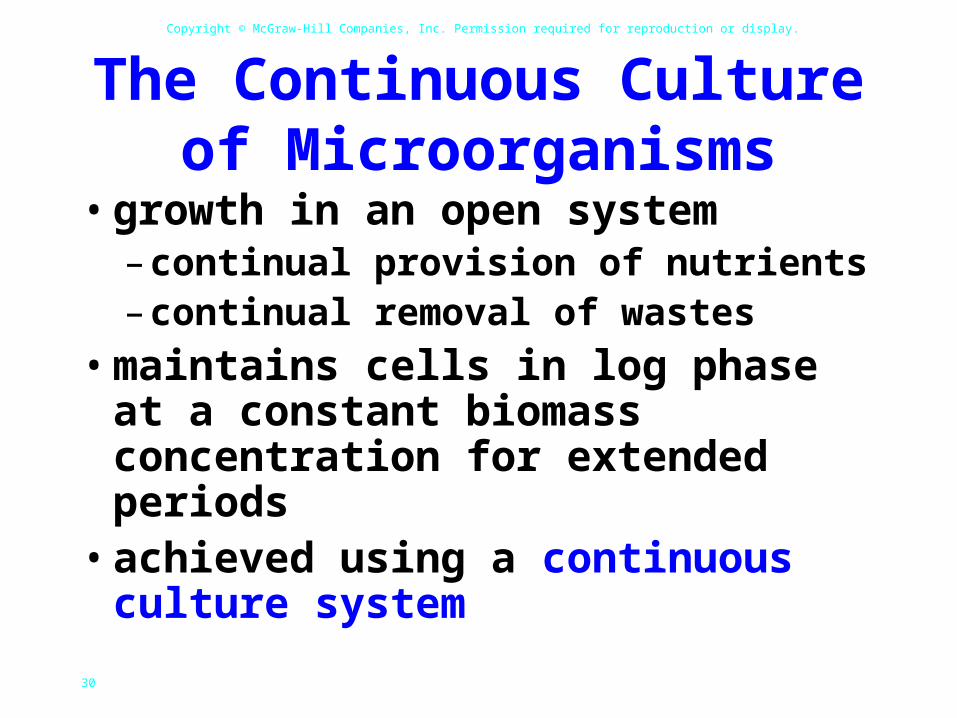
The Continuous Culture of Microorganisms
• growth in an open system– continual provision of nutrients– continual removal of wastes
• maintains cells in log phase at a constant biomass concentration for extended periods
• achieved using a continuous culture system

Copyright © McGraw-Hill Companies, Inc. Permission required for reproduction or display.
31
The Chemostat
• rate of incoming medium = rate of removal of medium from vessel
• an essential nutrient is in limiting quantities Figure 6.9
Copyright © McGraw-Hill Companies, Inc. Permission required for reproduction or display.
32
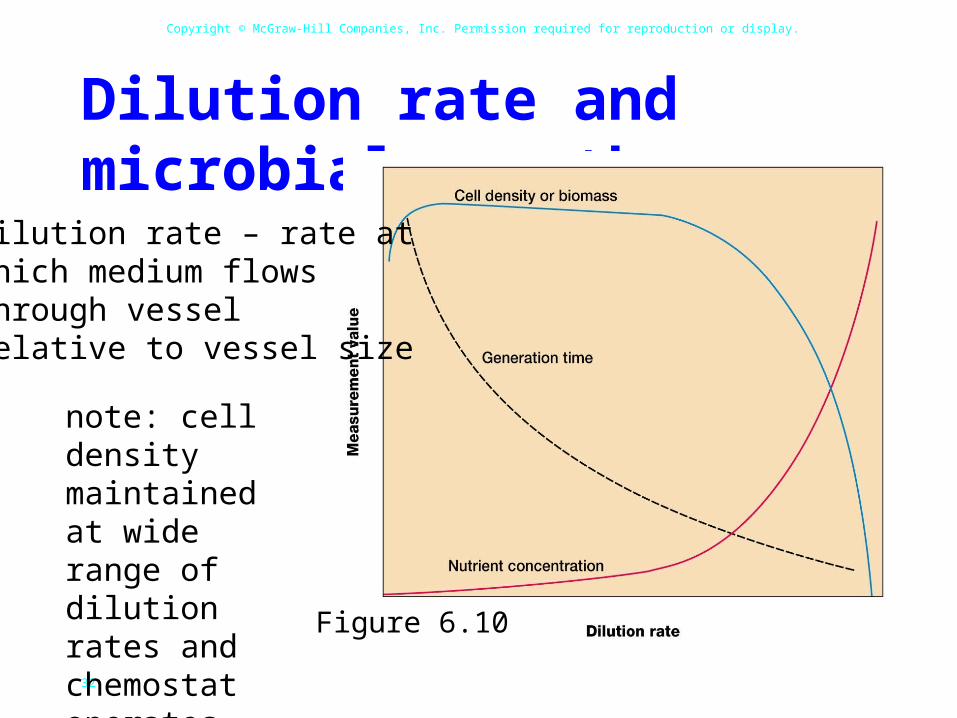
Dilution rate and microbial growth
Figure 6.10
dilution rate – rate atwhich medium flowsthrough vesselrelative to vessel size
note: cell densitymaintained at widerange of dilutionrates and chemostat operates best at low dilution rate
Copyright © McGraw-Hill Companies, Inc. Permission required for reproduction or display.
33
The Turbidostat
• regulates the flow rate of media through vessel to maintain a predetermined turbidity or cell density
• dilution rate varies• no limiting nutrient• turbidostat operates best at high
dilution rates

Copyright © McGraw-Hill Companies, Inc. Permission required for reproduction or display.
34
Importance of continuous culture methods• constant supply of cells in exponential
phase growing at a known rate• study of microbial growth at very low
nutrient concentrations, close to those present in natural environment
• study of interactions of microbes under conditions resembling those in aquatic environments
• food and industrial microbiology
Copyright © McGraw-Hill Companies, Inc. Permission required for reproduction or display.
35
The Influence of Environmental Factors on
Growth• most organisms grow in fairly
moderate environmental conditions
• extremophiles– grow under harsh conditions that
would kill most other organisms
Copyright © McGraw-Hill Companies, Inc. Permission required for reproduction or display.
36
Solutes and Water Activity
• water activity (aw)
– amount of water available to organisms
– reduced by interaction with solute molecules (osmotic effect)
higher [solute] lower aw
– reduced by adsorption to surfaces (matric effect)
Copyright © McGraw-Hill Companies, Inc. Permission required for reproduction or display.
37

Copyright © McGraw-Hill Companies, Inc. Permission required for reproduction or display.
38
Osmotolerant organisms• grow over wide ranges of water activity
• many use compatible solutes to increase their internal osmotic concentration– solutes that are compatible with metabolism
and growth
• some have proteins and membranes that require high solute concentrations for stability and activity

Copyright © McGraw-Hill Companies, Inc. Permission required for reproduction or display.
39
Effects of NaCl on microbial growth• halophiles
– grow optimally at >0.2 M
• extreme halophiles– require >2 M
Figure 6.11
Copyright © McGraw-Hill Companies, Inc. Permission required for reproduction or display.
40
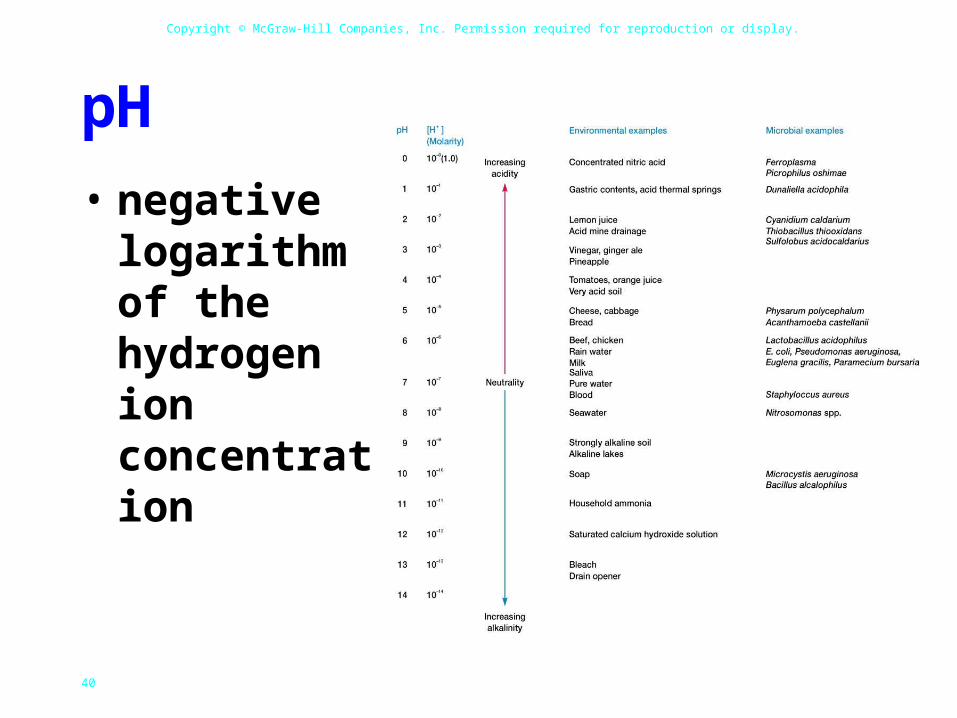
pH
• negative logarithm of the hydrogen ion concentration
Figure 6.12
Copyright © McGraw-Hill Companies, Inc. Permission required for reproduction or display.
41
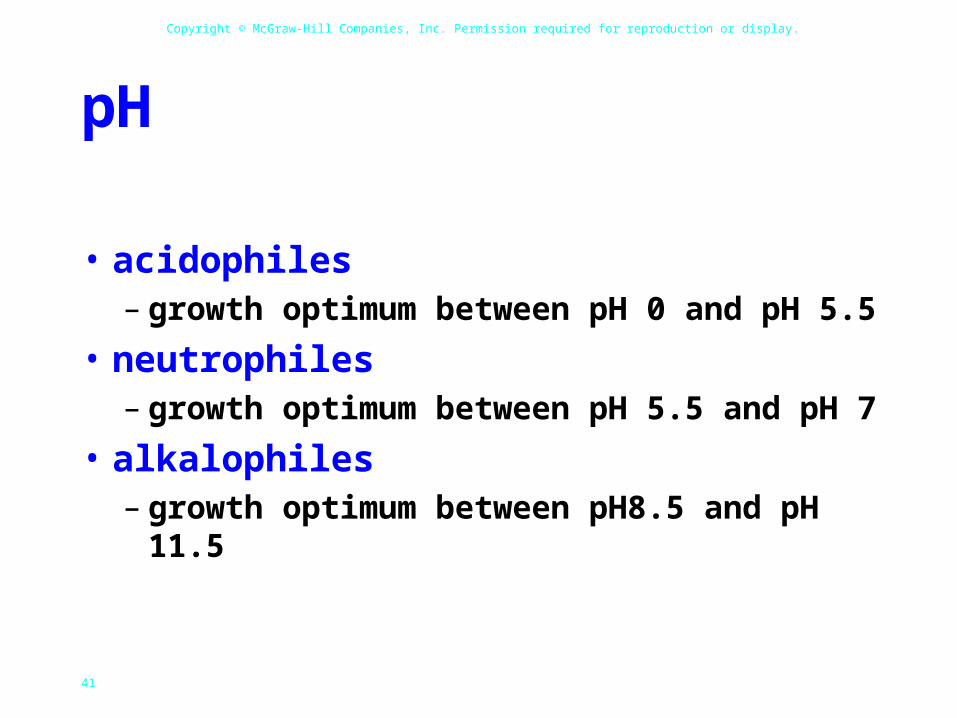
pH
• acidophiles– growth optimum between pH 0 and pH 5.5
• neutrophiles– growth optimum between pH 5.5 and pH 7
• alkalophiles– growth optimum between pH8.5 and pH 11.5

Copyright © McGraw-Hill Companies, Inc. Permission required for reproduction or display.
42
pH• most acidophiles and alkalophiles maintain an
internal pH near neutrality– some use proton/ion exchange mechanisms to do so
• some synthesize proteins that provide protection– e.g., acid-shock proteins
• many microorganisms change pH of their habitat by producing acidic or basic waste products– most media contain buffers to prevent growth
inhibition
Copyright © McGraw-Hill Companies, Inc. Permission required for reproduction or display.
43
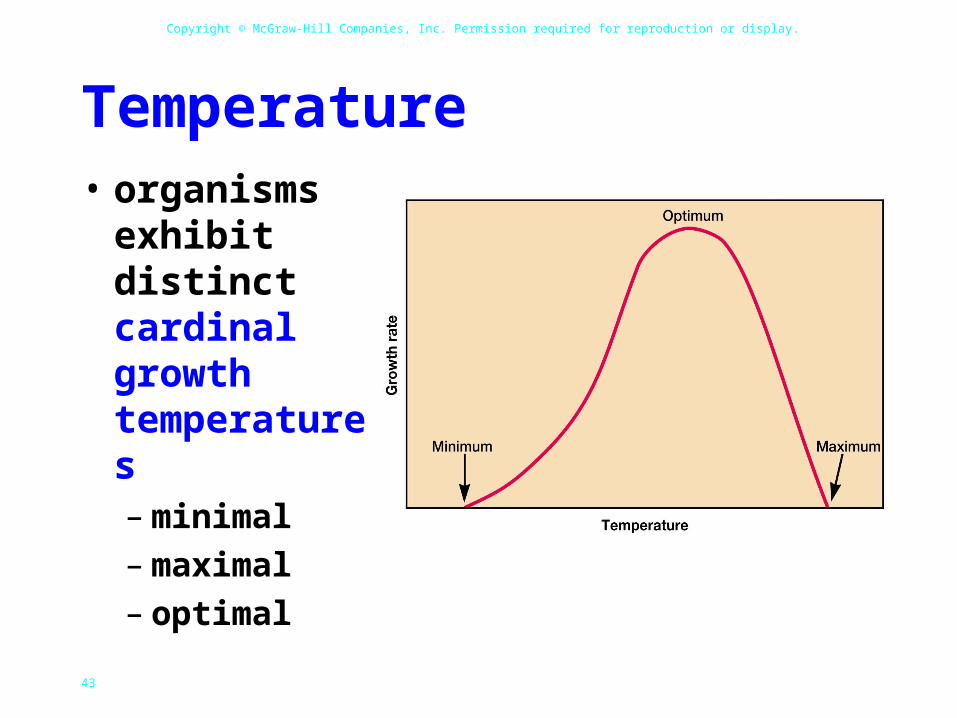
Temperature• organisms
exhibit distinct cardinal growth temperatures– minimal– maximal– optimal
Figure 6.13
Copyright © McGraw-Hill Companies, Inc. Permission required for reproduction or display.
44
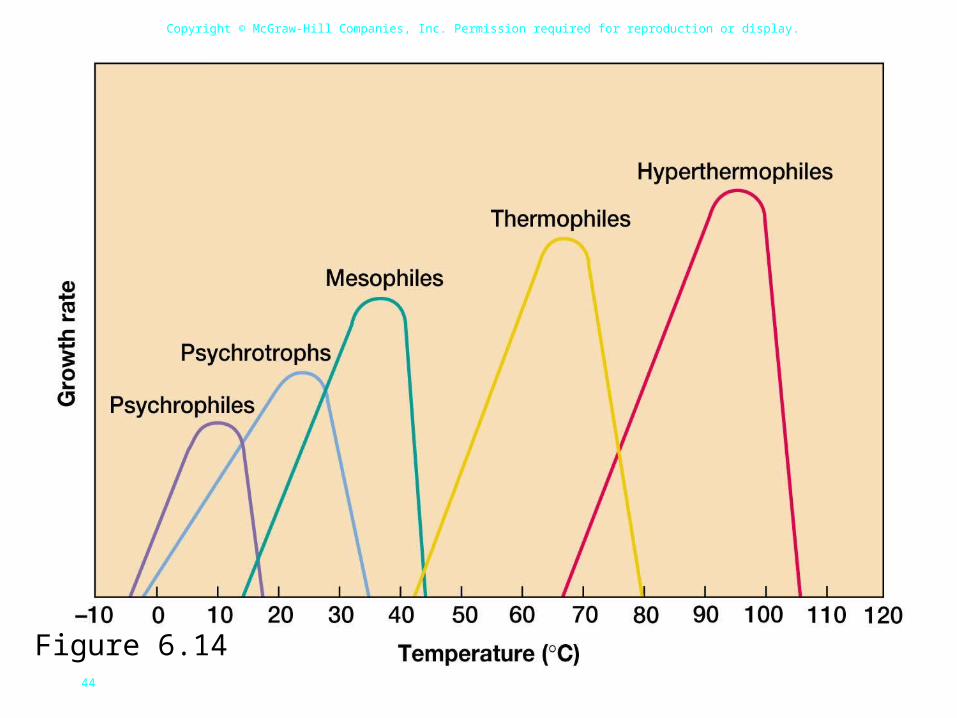
Figure 6.14
Copyright © McGraw-Hill Companies, Inc. Permission required for reproduction or display.
45
Adaptations of thermophiles• protein structure stabilized by a variety
of means – e.g., more H bonds– e.g., more proline– e.g., chaperones
• histone-like proteins stabilize DNA• membrane stabilized by variety of means
– e.g., more saturated, more branched and higher molecular weight lipids
– e.g., ether linkages (archaeal membranes)

Copyright © McGraw-Hill Companies, Inc. Permission required for reproduction or display.
46
Oxygen Concentration
Figure 6.15
needoxygen
preferoxygen
ignoreoxygen
oxygen istoxic
< 2 – 10%oxygen
Copyright © McGraw-Hill Companies, Inc. Permission required for reproduction or display.
47
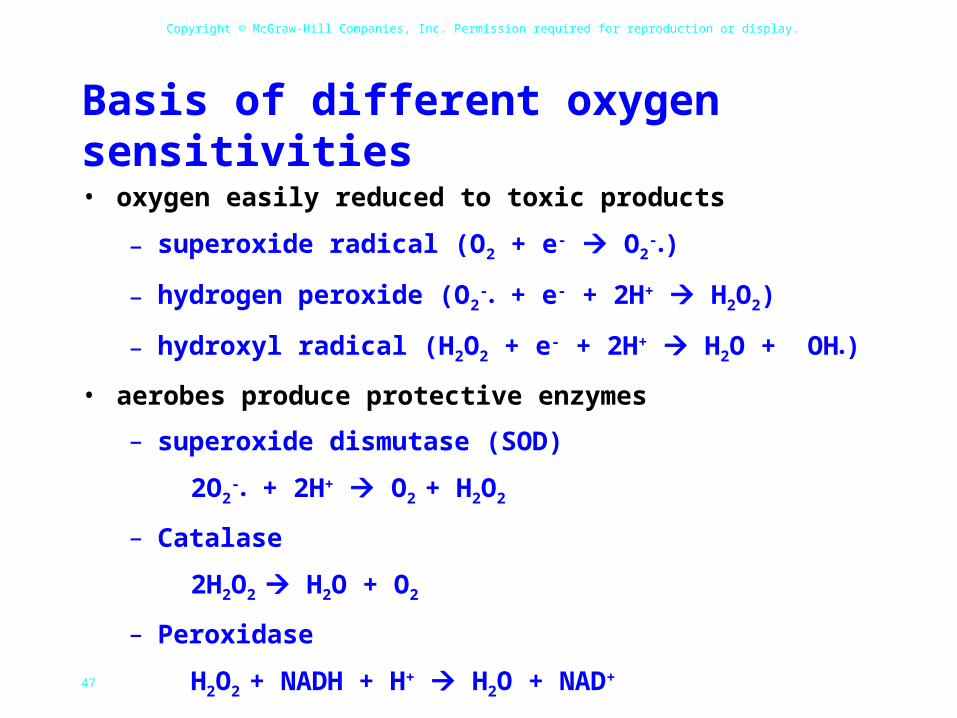
Basis of different oxygen sensitivities
• oxygen easily reduced to toxic products
– superoxide radical (O2 + e- O2-●)
– hydrogen peroxide (O2-● + e- + 2H+ H2O2)
– hydroxyl radical (H2O2 + e- + 2H+ H2O + OH●)
• aerobes produce protective enzymes
– superoxide dismutase (SOD)
2O2-● + 2H+ O2 + H2O2
– Catalase
2H2O2 H2O + O2
– Peroxidase
H2O2 + NADH + H+ H2O + NAD+

Copyright © McGraw-Hill Companies, Inc. Permission required for reproduction or display.
48
Figure 6.14

Copyright © McGraw-Hill Companies, Inc. Permission required for reproduction or display.
49
An Anaerobic Work Chamber and Incubator

Copyright © McGraw-Hill Companies, Inc. Permission required for reproduction or display.
50
GasPak anaerobic system
Copyright © McGraw-Hill Companies, Inc. Permission required for reproduction or display.
51
Pressure
• barotolerant organisms– adversely affected by increased
pressure, but not as severely as nontolerant organisms
• barophilic organisms– require or grow more rapidly in the
presence of increased pressure
Copyright © McGraw-Hill Companies, Inc. Permission required for reproduction or display.
52
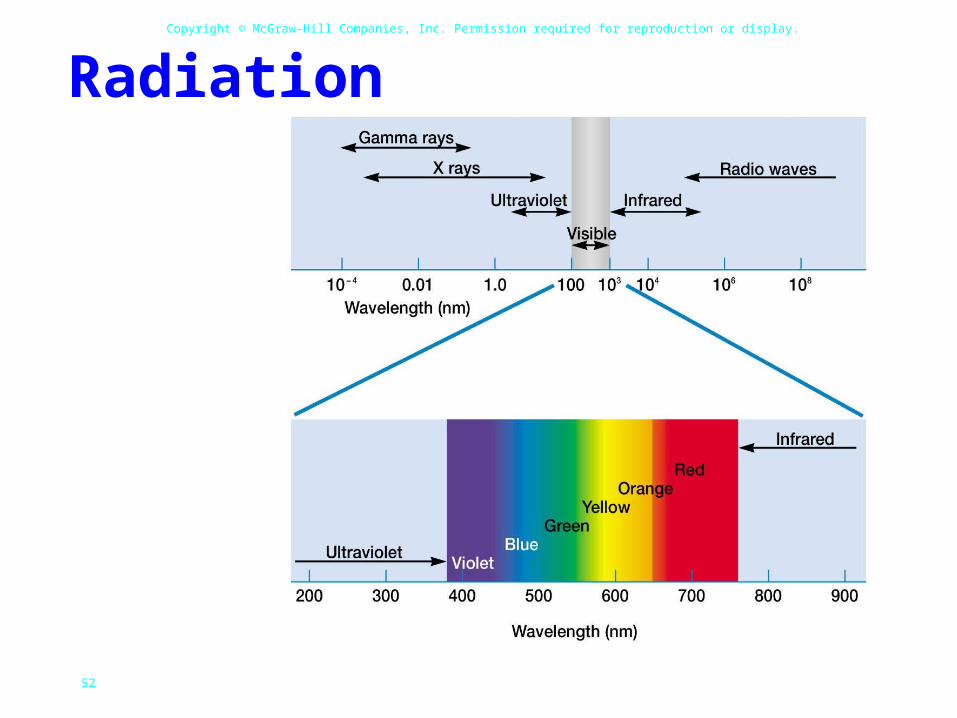
Radiation
Figure 6.18

Copyright © McGraw-Hill Companies, Inc. Permission required for reproduction or display.
53
Radiation damage
• ionizing radiation– x rays and gamma rays
– mutations death
– disrupts chemical structure of many molecules, including DNA• damage may be repaired by DNA repair
mechanisms
Copyright © McGraw-Hill Companies, Inc. Permission required for reproduction or display.
54
Radiation damage…
• ultraviolet (UV) radiation– mutations death– causes formation of thymine dimers in DNA– DNA damage can be repaired by two
mechanisms• photoreactivation – dimers split in presence of
light
• dark reactivation – dimers excised and replaced in absence of light

Copyright © McGraw-Hill Companies, Inc. Permission required for reproduction or display.
55
Radiation damage…
• visible light– at high intensities generates singlet
oxygen (1O2)
• powerful oxidizing agent
– carotenoid pigments• protect many light-exposed
microorganisms from photooxidation

Copyright © McGraw-Hill Companies, Inc. Permission required for reproduction or display.
56
Microbial Growth in Natural Environments
• microbial environments are complex, constantly changing, and may expose a microorganism to overlapping gradients of nutrients and environmental factors

Copyright © McGraw-Hill Companies, Inc. Permission required for reproduction or display.
57
Growth Limitation by Environmental Factors• Leibig’s law of the minimum
– total biomass of organism determined by nutrient present at lowest concentration
• Shelford’s law of tolerance– above or below certain environmental
limits, a microorganism will not grow, regardless of the nutrient supply

Copyright © McGraw-Hill Companies, Inc. Permission required for reproduction or display.
58
Responses to low nutrient levels• oligotrophic environments
• morphological changes to increase surface area and ability to absorb nutrients
• mechanisms to sequester certain nutrients

Copyright © McGraw-Hill Companies, Inc. Permission required for reproduction or display.
59
Counting Viable but Nonculturable Vegetative Procaryotes• stressed microorganisms can temporarily
lose ability to grow using normal cultivation methods
• microscopic and isotopic methods for counting viable but nonculturable cells have been developed
Copyright © McGraw-Hill Companies, Inc. Permission required for reproduction or display.
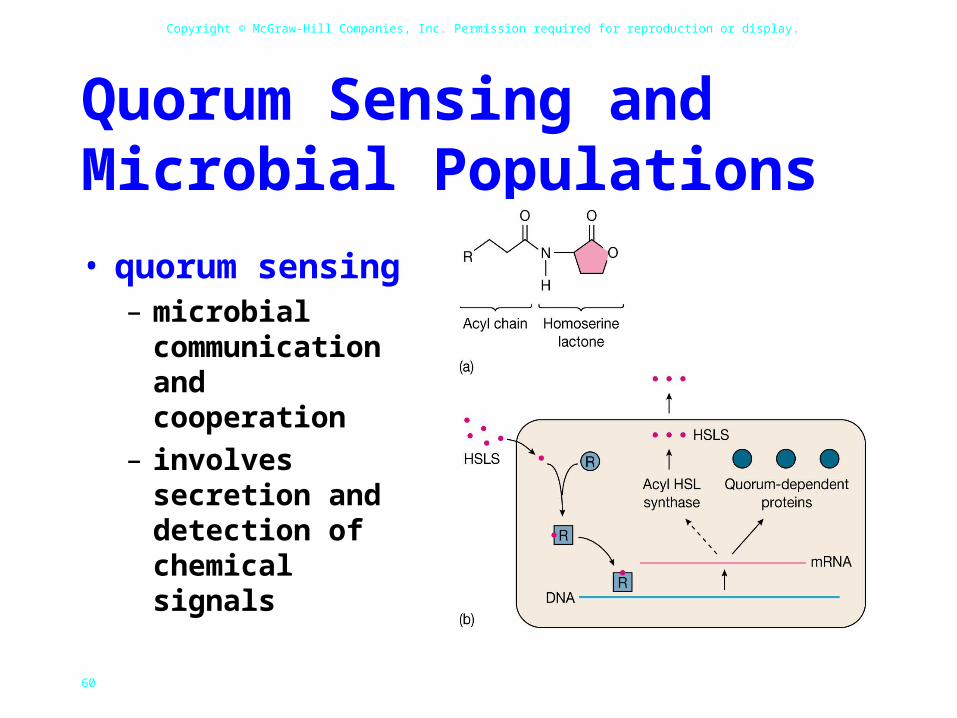
60
Quorum Sensing and Microbial Populations
• quorum sensing– microbial
communication and cooperation
– involves secretion and detection of chemical signals
Figure 6.20
Copyright © McGraw-Hill Companies, Inc. Permission required for reproduction or display.
61
Processes sensitive to quorum sensing: gram-negative bacteria• bioluminescence (Vibrio fischeri)• synthesis and release of virulence factors
(Pseudomonas aeruginosa)• conjugation (Agrobacterium tumefaciens)• antibiotic production (Erwinia carotovora,
Pseudomonas aureofaciens)• biofilm production (P. aeruginosa)
Copyright © McGraw-Hill Companies, Inc. Permission required for reproduction or display.
62
Quorum sensing: gram-positive bacteria• often mediated by oligopeptide pheromone• processes impacted by quorum sensing:
– mating (Enterococcus faecalis)– transformation competence (Streptococcus
pneumoniae)– sporulation (Bacillus subtilis)– production of virulence factors (Staphylococcus
aureus)– development of aerial mycelia (Streptomyces griseus)– antibiotic production (S. griseus)