Embed Size (px)
Citation preview

Copyright is owned by the Author of the thesis. Permission is given for a copy to be downloaded by an individual for the purpose of research and private study only. The thesis may not be reproduced elsewhere without the permission of the Author.
A Genetic Approach To Identify Mycobacterium
bovis Exported Protein Antigens
Suzanne Marie Borich
A thesis presented in partial fulfilment of the requirements for
the degree of Doctor of Philosophy in Molecular Biology
Massey University
October 1997
Abstract
A novel approach, combining phoA-fusion technology with T cell screening of a
recombinant cosmid library, was used to detect Mycobacterium bovis exported T cell
antigens. An M. bovis BCG library of phoA-fusions was constructed in Escherichia coli
and Mycobacterium smegmatis using the plasmid vector pJEM l1. The M. bovis BeG
DNA inserts from ten PhoA+ clones were partially sequenced and used to search
databases for similarities to known genes. These revealed similarities to a family of genes
coding for high temperature-requirement serine proteases and a Mycobacterium leprae
putative exported lipoprotein gene (pel).
The DNA inserts from PhoA+ clones were used to probe an M. bovis cosmid library
expressed in M. smegmatis to identify cosmids containing the full-length genes coding
for these exported proteins. Culture filtrates (CFs) prepared from selected M. smegmatis
recombinants (cosmids) were assayed for their ability to induce proliferation and IFN-"(
production from peripheral blood mononuclear cells (PBMCs) taken from M. bovis
BCG-immunised and non-immunised control cattle. Culture filtrates from two
recombinant M. smegmatis (cosmids 44 and 56) induced significant IFN-"(-production
and proliferation by PBMCs from immunised animals.
An exported protein gene, identified using the phoA -fusion technology, was subcloned
from cosmid 56 and its sequence determined and analysed. Database searches using the
deduced amino acid sequence of this gene revealed similarities to an M. leprae putative
exported lipoprotein (Pel) and a family of MalE maltose-binding proteins. The M. bovis
pel gene was shown to be expressed by recombinant M. smegmatis. Preliminary
evidence from this study indicates that the M. bovis Pel protein is recognised by antigen
specific lymphocytes from M. bovis BCG-immunised animals. The PBMCs taken from
11

M. bovis challenged and M. bovis BCG vaccinated / challenged cattle also recognised CF
from recombinant M. smegma tis expressing the pel gene in in vitro immunoassays.
The combined strategy of using phoA-gene fusions and T cell screening of CFs from a
recombinant M. bovis cosmid library proved a sensitive and rapid method for the
detection of potential M. bovis T cell antigens.
111

Acknowledgements
The research presented in this thesis was carried out in the Department of Veterinary
Pathology and Public Health, Massey University, with the guidance of my supervisors,
Alan Murray and Eamonn Gormley. I would like to thank them both for their ongoing
support, ideas and constructive criticism. Special thanks must also go to my unofficial
supervisor and mentor, Liz Carpenter, especially for her help with the immunological
component of my research, and to my ex-supervisor, Kevin Moriarty, who encouraged
me to undertake my PhD research in the Bovine Tuberculosis Research Laboratory. I am
also grateful to Professors Bill Manktelow, Colin Wilks, and Peter Stockdale, for their
encouragement and belief in my abilities.
I wish to acknowledge the Agricultural and Marketing Research and Development Trust
(AGMARDT) for their financial support in the form of a PhD studentship and their
generous research funding. This work could not have been carried out without that
support.
Special mention must also be made of the many people who contributed to this work by
providing invaluable technical assistance. I owe a great deal to my fellow co-workers,
Laurie Sandall, Linley Fray, Chris Dupont, Richard Johnson, and Jane Oliaro. These
wonderful people were always willing to provide technical assistance and advice, saving
me a great deal of time on numerous occasions. In particular, I must acknowledge that
the Northern blot analysis (demonstrating expression of the pel gene by recombinant M.
smegmatis) was carried out by Chris.
Assistance has not been limited to my colleagues at Massey University. I would
especially like to thank Dr. Bryce BuddIe for allowing me to use blood samples from his
M. bovis challenged cattle and results from his vaccine trial. I am also exu'emely grateful
IV

to Dr. Des Collins for providing the Bovine Tuberculosis Research Group with the M.
bovis cosmid library, and to Dr. Brigitte Gicquel for providing the pJEM l l vector.
My friends within the department also deserve a special mention. There are too many
people to acknowledge individually, but I would like to thank all those I worked and
socialised with for the fun times and memories. I will miss you all when I (finally) leave.
An extra special thank you must go to Eamonn for keeping me smiling through the
inevitable difficult patches. I am lucky to have such a good friend. Thanks also to my
terrific flatmates Julie, Murray, Ken and Caroline, who helped me to unwind each
evening and forget the stresses of the day. Finally, I particularly wish to thank my
parents for all their love and support over the years. Their kindness can never be repaid
and I hope I have made them proud.
v
Table of Contents
Abstract . . . . . . . . . . . . . . . . . . . . . . . . . . . . . . . . . . . .. . . . . . . . . . . . . . . . . . . . . . . . . . . . . . . . . . . . . . . . . . . . . . . . . . . . . . ii
Ackn owledgements . . . . . . . . . . . . . . . . . . . . . . . . . . . . . . . . . . . . . . . . . . . . . . . . . . . . . . . . . . . . . . . . . . . . . . . . . . . . . IV
Table of Contents . . . . . . . . . . . . . . . . . . . . . . . . . . . . . . . . . . . . . . . . . . . . . . . . . . . . . . . . . . . . ,. . . . . . .. . . . . . ... . .. VI
List of Figures. . . . . . . . . . . . . . . . . . . . ......... .............. ....... ......... .............. .......... Xl
List o f Tables. . . . . . . . . . . . . . . ....... ........... ....... ................... ....... ...... ....... ..... XlV
List of Abbreviations . . . . . . . . . . . . . . . . . . . . . . . . . . . . . . . . . . . . . . . . . . . . . . . . . . . . . . . . . . . . . . . . . . . . . . . . . . . xv
C hapter 1: Introduction. . . . . . . . . . . . . . . . . . . . . . . . . . . . . . . . . . . . . . . . . . . . . . . . . . . . 1
1 . 1 Tuberculosis . . . . . . . . . . . . . . . . . . . . . . . . . . . . . . . . . . . . . . . . . . . . . . . . . . . . . . . . . . . . . . . . . . . 2
1 . 1 . 1 Historical background. . . . . . . . . . . . . . . . . . . . . . . . . . . . . . . . . . . . . . . . . . . . . . . . 2
1 . 1 . 2 The Koch phenomenon. . . . . . . . . . . . . . . . . . . . . . . . . . . . . . . . . . . . . . . . . . . . . . . 2
1 . 1 .3 Mycobacterial classification . . . . . . . . . . . . . . . . . . . . . . . . . . . . . . . . . . . . . . . . . . 3
1 . 2 Bovine Tuberculosis . . . . . . . . . . . . . . . . . . . . . . . . . . . . . . . . . . . . . . . . . . . . . . . . . . . . . . . . . . 5
1 .2. 1 History . . . . . . . . . . . . . . . . . . . . . . . . . . . . . . . . . . . . . . . . . . . . . . . . . . . . . . . . . . . . . . . . . 5
1 .2 .2 Diagnosis and controL. . . . . . . . . .. . . . . . . . . . . . . . . . . . . . . . . . . . . . . . . . . . . . . 5
1 .2 .3 Bovine tuberculosis in New Zealand . . . . . . . . . . . . . . . . . . . . . . . . . . . . . . . 7
1 . 3 The Immune Response . . . . . . . . . . . . . . . . . . . . . . . . . . . . . . . . . . . . . . . . . . . . . . . . . . . . . . . 9
1 .3 . 1 Innate immunity . . . . . . . . . . . . . . . . . . . . . . . . . . . . . . . . . . . . . . . . . . . . . . . . . . . . . . . 9
1 .3 .2 Acquired immunity . . . . . . . . . . . . . . . . . . . . . . . . . . . . . . . . . . . . . . . . . . . . . . . . . . . 1 1
1 .3 .4 The bovine immune response . . . . . . . . . . . . . . . . . . . . . . . . . . . . . . . . . . . . . . . . 14
1 .4 The Mycobacterium bovis BCG Vaccine. . . . . . . . . . . . . . . . . . . . . . . . . . . . . . . . . . . 16
1 .4. 1 Mycobacterium bovis BCG. . . . . . . . . . . . . . . . . . . . . . . . . . . . . . . . . . . . . . . . . . 1 6
1 .4.2 Mycobacterium bovis BeG cattle vaccine trials . . . . . . . . . . . . . . . . . . . 17
1 .5 Mycobacterial Secreted Antigens . . . . . . . . . . . . . . . . . . . . . . . . . . . . . . . . . . . . . . . . . . . . 20
1 .5. 1 Evidence for the role of secreted proteins in protection against
tuberculosis . . . . . . . . . . . . . . . . . . . . . . . . . . . . . . . . . . . . . . . . . . . . . . . . . . . . . . . . . . . . . . . . . . . . 20
1 .5 .2 Protein export signals. . . . . . . . . . . . . . . . . . . . . . . . . . . . . . . . . . . . . . . . . . . . . . . . . 2 1
1 .5 .3 Mycobacte11al culture filtrate antigens . . . . . . . . . . . . . . . . . . . . . . . . . . . . .. 24
VI
1 .5 .4 Strategies for identifying secreted protein antigens . . . . . . . . . . . . . . . 27
1 .5 . 5 Scope of research . . . . . . . . . . . . . . . . . . . . . . . . . . . . . . . . . . . . . . . . . . . . . . . . . . . . . . 3 1
Chapter 2: Materials and Methods . . . . . . . . . . . . . . . . . . . . . . . . . . . . . . . . . . . . . . . . 3 2
2 . 1 B acterial Strains and Plasmids. . . . . . . . . . . . . . . . . . . . . . . . . . . . . . . . . . . . . . . . . .. . . . . 33
2 . 1 . 1 Bacterial strains used in this study . . . . . . . . . . . . . . . . . . . . . . . . . . . . . . . . . . 33
2. 1 .2 Plasmids used in this study . . . . . . . . . . . . . . . . . . . . . . . . . . . . . . . . . . . . . . . . . . 34
2 .2 DNA Extractions . . . . . . . . . . . . . . . . . . . . . . . . . . . . . . . . . . . . . . . . . . . . . . . . . . . . . . . . . . . . . 35
2 .2 . 1 Isolation of plasmid DNA from E. coli . . . . . . . . . . . . . . . . . . . . . . . . . . . . 35
2 .2 .2 Isolation of cosmid DNA from recombinant M. smegmatis . . . . . 35
2 .2 .3 Isolation of genomic DNA from mycobacteria . . . . . . . . . . . . . . . . . . . . 36
2 .3 DNA Manipulations and Library Construction . . . . . . . . . . . . . . . . . . . . . . . . . . . . 37
2 .3 . 1 Manipulations involving DNA . . . . . . . . . . . . . . . . . . . . . . . . . . . . . . . . . . . . . . 37
2 .3 .2 Construction of an M. bovis BCG library of phoA fusions . . . . . 37
2.4 Transformations . . . . . . . . . . . . . . . . . . . . . . . . . . . . . . . . . . . . . . . . . . . . . . . . . . . . . . . . . . . . . . . 39
2.4. 1 Transformation of E. coli . . . . . . . . . . . . . . . . . . . . . . . . . . . . . . . . . . . . . . . . . . . . 39
2.4 .2 Transformation of M. smegmatis . . . . . . . . . . . . . . . . . . . . . . . . . . . . . . . . . . . 39
2 .5 DNA Sequencing and PeR-Based Amplification . . . . . . . . . . . . . . . . . . . . . . . . . 40
2.5 . 1 PCR cycle sequencing . . . . . . . . . . . . . . . . . . . . . . . . . . . . . . . . . . . . . . . . . . . . . . . . 40
2 .5 .2 Sequence analysis. . . . . . . . . . . . . . . . . . . . . . . . . . . . . . . . . . . . . . . . . . . . . . . . . . . . . 40
2 .5 .3 PCR amplification of known genes from the M. bovis cosmid
library . . . . . . . . . . . . . . . . . . . . . . . . . . . . . . . . . . . . . . . . . . . . . . . . . . . . . . . . . . . . . . . . . . . . . . . . . . 41
2 .6 DNA Hybridisations . . . . . . . . . . . . . . . . . . . . . . . . . . . . . . . . . . . . . . . . . . . . . . . . . . . . . . . . . . 42
2 .6 . 1 Isolation and labelling of DNA probes . . . . . . . . . . . . . . . . . . . . . . . . . . . . . 42
2 .6 .2 Southern blot analysis . . . . . . . . . . . . . . . . . . . . . . . . . . . . . . . . . . . . . . . . . . . . . . . . 42
2 .6 .3 Colony hybridisation . . . . . . . . . . . . . . . . . . . . . . . . . . . . . . . . . . . . . . . . . . . . . . . . . 43
2 .7 Protein Preparations . . . . . . . . . . . . . . . . . . . . . . . . . . . . . . . . . . . . . . . . . . . . . . . . . . . . . . . . . . 44
2 .7 . 1 Preparation of culture filtrates . . . . . . . . . . . . . . . . . . . . . . . . . . . . . . . . . . . . . . . 44
2.7 . 2 Preparation of cell I ysates . . . . . . . . . . . . . . . . . . . . . . . . . . . . . . . . . . . . . . . . . . . . 45
2 . 8 Protein Analysis . . . . . . . . . . . . . . . . . . . . . . . . . . . . . . . . . . . . . . . . . . . . . . . . . . . . . . . . . . . . . . . 48
Vll
2 .8 . 1 Estimation of protein concentration . . . . . . . . . . . . . . . . . . . . . . . . . . . . . . . . . 48
2 . 8 .2 Alkaline phosphatase assays. . . . . . . . . . . . . . . . . . . . . . . . . . . . . . . . . . . . . . . . . 48
2 . 8 . 3 Protein analysis by SDS-PAGE and Western blotting. . . . . . . . . . . . 49
2 .9 Immunoassays . . . . . . . . . . . . . . . . . . . . . . . . . . . . . . . . . . . . . . . . . . . . . . . . . . . . . . . . . . . . . . . . . 5 1
2 .9 . 1 Immunisation of cattle with M . bovis BeG.. . . . . . . . . . . . . . . . . . . . . . . 5 1
2 .9 .2 Lymphocyte proliferation assays. . . . . . . . . . . . . . . . . . . . . . . . . . . . . . . . . . . . 5 1
2 .9 .3 I F N -y assays . . . . . . . . . . . . . . . . . . . . . . . . . . . . . . . . . . . . . . . . . . . . . . . . . . . . . . . . . . . 52
2. 1 0 Gene Expression Studies . . . . . . . . . . . . . . . . . . . . . . . . . . . . . . . . . . . . . . . . . . . . . . . . . .. . . 53
2. 1 0. 1 Isolation of total RNA from recombinant M. smegma tis . . . . . . . 53
2. 1 0.2 Northern blot analysis . . . . . . . . . . . . . . . . . . . . . . . . . . . . . . . . . . . . . . . . . . . . . . 53
Chapter 3: Identification And Analysis Of DNA Sequences Coding For
Protein Export Signals . . . . . . . . . . . . . . . . . . . . . . . . . . . . . . . . . . . . . . . . . . . . . . . . . . . . . . 54
3 . 1 Abstract . . . . . . . . . . . . . . . . . . . . . . . . . . . . . . . . . . . . . . . . . . . . . . . . . . . . . . . . . . . . . . . . . . . . . . . . 55
3 . 2 Introduction . . . . . . . . . . . . . . . . . . . . . . . . . . . . . . . . . . . . . . . . . . . . . . . . . . . . . . . . . . . . . . . . . . . . 56
3 . 3 Results . . . . . . . . . . . . . . . . . . . . . . . . . . . . . . . . . . . . . . . . . . . . . . . . . . . . . . . . . . . . . . . . . . . . . . . . . . 58
3 .3 . 1 Construction and screening of an M. bovis BCG library of
PhoA-fusions . . . . . . . . . . . . . . . . . . . . . . . . . . . . . . . . . . . . . . . . . . . . . . . . . . . . . . . . . . . . . . . . . . 58
3 . 3 .2 Strain distribution of genes encoding exported proteins. . . . . . . . . . 65
3 . 3 . 3 Partial sequencing of DNA inserts encoding exported proteins.. 67
3 .3 .4 Detection of PhoA fusion proteins from recombinant E. coli.. . . 75
3 .3 . 5 Detection of PhoA fusion proteins from recombinantM.
smegmatis by Western blot analysis . . . . . . . . . . . . . . . . . . . . . . . . . . . . . . . . . . . . . . . . 77
3 . 4 Discussion . . . . . . . . . . . . . . . . . . . . . . . . . . . . . . . . . . . . . . . . . . . . . . . . . . . . . . . . . . . . . . . . . . . . . 8 1
Chapter 4 : Identification Of Genes Encoding Exported Proteins In A n
M. bovis Cosmid Library................................................................ 8 5
4 . 1 Abstract . . . . . . . . . . . . . . . . . . . . . . . . . . . . . . . . . . . . . . . . . . . . . . . . . . . . . . . . . . . . . . . . . . . . . . . . 86
4 .2 Introduction . . . . . . . . . . . . . . . . . . . . . . . . . . . . . . . . . . . . . . . . . . . . . . . . . . . . . . . . . . . . . . . . . . . . 87
4 .3 Results . . . . . . . . . . . . . . . . . . . . . . . . . . . . . . . . . . . . . . . . . . . . . . . . . . . . . . . . . . . . . . . . . . . . . . . . . . 88
Vlll
4.3 . 1 Restriction endonuclease analysis of DNA from selected
cosmids . . . . . . . . . . . . . . . . . . . . . . . . . . . . . . . . . . . . . . . . . . . . . . . . . . . . . . . . . . . . . . . . . . . . . . . . . 88
4.3 . 2 Screening of an M. bovis cosmid library for genes encoding
exported proteins . . . . . . . . . . . . . . . . . . . . . . . . . . . . . . . . . . . . . . . . . . . . . . . . . . . . . . . . . . . . . 90
4 .3 .3 Identification of cosmids which contain genes coding for
known secreted antigens . . . . . . . . . . . . . . . . . . . . . . . . . . . . . . . . . . . . . . . . . . . . . . . . . . . . . 95
4 .3 .4 Western blot identification of the M. bovis secreted antigen
MPB64 in culture filtrate from recombinant M . smegmatis . . . . . . . . . . . . . 97
4 .3 .5 Screening culture filtrates from recombinant M. smegmatis
for antigens that stimulate T-Iymphocyte proliferation . . . . . . . . . . . . . . . . . . . 99
4.3 . 6 Screening culture filtrates from recombinant M. smegmatis
for antigens that induce IFN-y-production by peripheral blood
mononuclear cells . . . . . . . . . . . . . . . . . . . . . . . . . . . . . . . . . . . . . . . . . . . . . . . . . . . . . . . . . . . . . 103
4.4 Discussion . . . . . . . . . . . . . . . . . . . . . . . . . . . . . . . . . . . . . . . . . . . . . . . . . . . . . , . . . . . . . . . . . . . . . 106
Chapter 5 : Characterisation Of An M. bovis Putative Exported
Lipoprotein (Pel) With Homology To A Family Of Maltose-Binding
P r o t e i n s . . . . . . . . . . . . . . . . . . . . . . . . . . . . . . . . . . . . . . . . . . . . . . . . . . . . . . . . . . . . . . . . . . . . . . 110
5 . 1 Abstract . . . . . . . . . . . . . . . . . . . . . . . . . . . . . . . . . . . . . . . . . . . . . . . . . . . . . . . . . . . . . . . . . . . . . . . . 1 1 1
5 .2 Results . . . . . . . . . . . . . . . . . . . . . . . . . . . . . . . . . . . . . . . . . . . . . . . . . . . . . . . . . . . . . . . . . . . . . . . . . 1 12
5 .2 . 1 Subcloning of the M. bovis putative exported lipoprotein gene
from cosmid 56 . . . . . . . . . . . . . . . . . . . . . . . . . . . . . . . . . . . . . . . . . . . . . . . . . . . . . . . . . . . . . . . 1 12
5 .2 .2 Nucleotide sequence of the M. bovis pel gene . . . . . . . . . . . . . . . . . . . . 1 15
5 .2 .3 Similarity between the M. bovis Pel protein and a family of
maltose-binding proteins . . . . . . . . . . . . . . . . . . . . . . . . . . . . . . . . . . . . . . . . . . . . . . . . . . . . . . 1 20
5 .2 .4 The pel genes of M. leprae and M. bovis may be part of an
operon involved in maltose transport . . . . . . . . . . . . . . . . . . . . . . . . . . . . . . . . . . . . . . . 1 22
5 .2 .5 Species distribution of the M. bovis pel gene . . . . . . . . . . . . . . . . . . . . . . 1 27
5 .2 .6 Expression of the M . bovis pel gene . . . . . . . . . . . . . . . . . . . . . . . . . . . . . . . . 1 29
lX
5 .2 .7 Irnmunoscreening of CFs from recombinantM. smegma tis
containing the cosmid subclones . . . . . . . . . . . . . . . . . . . . . . . . . . . . . . . . . . . . . . . . . . . . 1 3 1
5 . 3 Discussion . . . . . . . . . . . . . . . . . . . . . . . . . . . . . . . . . . . . . . . . . . . . . . . . . . . . . . . . . . . . . . . . . . . . . 1 35
5 .4 Addendum . . . . . . . . . . . . . . . . . . . . . . . . . . . . . . . . . . . . . . . . . . . . . . . . . . . . . . . . . . . . . . . . . . . . . 140
Chapter 6: Immune Responses Of M. bovis Challenged �attle To
Culture Filtrate From Recombinant M. smegmatis Expressing The pel
G e n e . . . . . . . . . . . . . . . . . . . . . . . . . . . . . . . . . . . . . . . . . . . . . . . . . . . . . . . . . . . . . . . . . . . . . . . . . . 141
6 . 1 Abstract . . . . . . . . . . . . . . . . . . . . . . . . . . . . . . . . . . . . . . . . . . . . . . . . . . . . . . . . . . . . . . . . . . . . . . . . 1 42
6 .2 Introduction . . . . . . . . . . . . . . . . . . . . . . . . . . . . . . . . . . . . . . . . . . . . . . . . . . . . . . . . . . . . . . . . . . . . 1 43
6 . 3 Results . . . . . . . . . . . . . . . . . . . . . . . . . . . . . . . . . . . . . . . . . . . . . . . . . . . . . . . . . . . . . . . . . . . . . . . . . . 1 45
Immune recognition of eF from recombinant M . smegma tis
expressing the pel gene by PBMCs from M. bovis challenged
and M . bovis BCG vaccinated / challenged cattle . . . . . . . . . . . . . . . . . . . . . . . . . 145
6.4 Discussion . . . . . . . . . . . . . . . . . . . . . . . . . . . . . . . . . . . . . . . . . . . . . . . . . . . . . . . . . . . . . . . . . . . . . 1 53
Chapter 7: Discussion Overview . . . . . . . . . . . . . . . . . . . . . . . . . . . . . . . . . . . . . . . . . . 1 5 6
A ppendices: . . . . . . . . . . . . . . . . . . . . . . . . . . . . . . . . . . . . . . . . . . . . . . . . . . . . . . . . . . . . . . . . . 1 6 2
Appendix 1 : Reagen ts . . . . . . . . . . . . . . . . . . . . . . . . . . . . . . . . . . . . . . . . . . . . . . . . . . . . . . . . . . . . . . . 1 62
Appendix 2 : Oligonucleotide Primers . . . . . . . . . . . . . . . . . . . . . . . . . . . . . . . . . . . . . . . . . . . . . 1 64
(A) peR primers used to amplify M. bovis secreted protein genes . . . . . 1 64
(B) Oligonucleotide primers used to sequence the 1521 base pair M.
bovis BeG DNA insert of pM2 1 . . . . . . . . . . . . . . . . . . . . . . . . . . . . . . . . . . . . . . . . . . . . 1 65
(e) Oligonucleotide primers used to sequence M. bovis insert DNA
from subclone 56/2 . . . .. . . . . . . . . . . . . . . . . . . . . . . . . . . . . . . . . . . . . . . . . . . . . . . . . . . . . . . 1 66
Appendix 3 : Plasmid Insert DNA Sequences . . . . . . . . . . . . . . . . . . . . . . . . . . . . . . . . . . . . 1 67
Appendix 4: Research Objectives For Control Of Bovine Tuberculosis In
New Zealand . . . . . . . . . . . . . . . . . . . . . . . . . . . . . . . . . . . . . . . . . . . . . . . . . . . . . . . . . . . . . . . . . . . . . . . . . . 178
Appendix 5 : Sequence Submission To GenBank . . . . . . . . . . . . . . . . . . . . . . . . . . . . . . . 1 80
R e fe r e n c e s : . . . . . . . . . . . . . . . . . . . . . . . . . . . . . . . . . . . . . . . . . . . . . . . . . . . . . . . . . . . . . . . . . . . 182
x
List of Figures
Figure �
1 . 1 A phylogenetic tree displaying the evolutionary relationships among
species belonging to the genus Mycobacterium ............. :. . . . . . . . . . . . . . . . . 4
1 .2
3 . 1
General features of bacterial signal peptides of presecretory proteins . . . . . .
The E. coli-mycobacterial shuttle plasmid, pJEM l l . . . . . . . . . . . . . . . . . . . . . . . . . .
3 . 2 Construction of an M. bovis BCG library of phoA fusions using the
vector pJEM l l , and screening for clones expressing enzymatically active
23
57
PhoA fusion proteins. . . . . . . . . . . . . . . . . . . . . . . . . . . . . . . . . . . . . . . . . . . . . . . . . . . . . . . . . . . . . 59
3 . 3 PhoA+ (blue) recombinant E. coli restreaked for single colonies onto LB
agar plates containing XP and kanamycin . . . . . . . . . . . . . . . . . . . . . . . . . . . . . . . . . . . . .
3 .4 Restriction endonuclease analysis of plasmid DNA prepared from PhoA+
recombinant E. coli and a negative controL. . . . . . . . . . . . . . . . . . . . . . . . . . . . . . . . . . . .
3 . 5 PhoA+ recombinant M. smegmatis tum blue in the presence of the
chromogenic substrate, XP . . . . . . . . . . . . . . . . . . . . . . . . . . . . . . . . . . . . . . . . . . . . . . . . . . . . . .
3 .6 Restriction endonuclease analysis of plasmids that confer a PhoA+
phenotype on M. smegmatis . . . . . . . . . . . . . . . . . . . . . . . . . . . . . . . . . . . . . . . . . . . . . . . . . . . .
3 .7 Southern blot of Sal I digested M. bovis and M. bovis BCG genomic
DNA probed with radiolabelled insert DNA from pM3 . . . . . . . . . . . . . . . . . . . . . .
3 . 8 Comparison of ORFs from M. leprae and the M. bovis BCG DNA insert
from pM2 1 . . . . . . . . . . . . . . . . . . . . . . . . . . . . . . . . . . . . . . . . . . . . . . . . . . . . . . . . . . . . . . . . . . . . . . . . .
3 .9 The region of similarity between the pM2 M. bovis BCG DNA insert and
60
6 1
63
64
66
69
the M. tuberculosis htrA gene at the nucleotide and amino acid leveL... . . 7 1
3 . 10 Hydrophobicity analysis (Kyte-Doolittle) plots of deduced amino acid
sequences from ORFs in frame with phoA . . . . . . . . . . . . . . . . . . . . . . . . . . . . . . . . . . . . 73
3 . 1 1 Western blot analysis of PhoA fusion proteins from recombinant E. coli
lysate samples prepared from 25 ml cultures. . . . . . . . . . . . . . . . . . . . . . . . . . . . . . . . . . 76
Xl
Figure Page
3 . 12 Western blot analysis of PhoA fusion proteins from recombinant M .
smegmatis lysate samples prepared by scraping colonies from solid
m e d i a. . . . . . . . . . . . . . . . . . . . . . . . . . . . . . . . . . . . . . . . . . . . . . . . . . . . . . . . . . . . . . . . . . . . . . . . . . . . . . 79
3. 1 3 Western blot analysis of PhoA fusion proteins from M . smegmatis
(pM2 1 ) lysate and CF samples prepared from 1 L cultures . . . . . . . . . . . . . . . .
4. 1 Restriction endonuclease analysis of cosmid DNA prepared from ten
randomly selected recombinant E. coli . . . . . . . . . . . . . . . . . . . . . . . . . . . . . . . . . . . . . . . .
4.2 Screening the M. bovis cosmid library with insert DNA from PhoA+
80
89
c lones . . . . . . . . . . . . . . . . . . . . . . . . . . . . . . . . . . . . . . . . . . . . . . . . . . . . . . . . . . . . . . . ... . . . . . . . . . . . 92
4.3 Secondary screening of the M. bovis cosmid library using radiolabelled
insert DNA from pE14 as a p·robe . . . . . . . . . . . . . . . . . . . . . . . . . . . . . . . . . . . . . . . . . . . . .
4.4 Amplification by PCR of a 403 bp esat-6 fragment from M. bovis
93
genomic DNA and from cosmid 3 . . . . . . . . . . . . . . . . . . . . . . . . . . . . . . . . . . . . . . . . . . . . . 96
4.5 Western blot identification of MPB64 in CF from recombinant M .
slne g ma tis . . . . . . . . . . . . . . . . . . . . . . . . . . . . . . . . . . . . . . . . . . . . . . . . . . . . . . . . . . . . . . . . . . . . . . . . 98
4.6 IFN-y responses of PBMCs from two M. bovis BCO-immunised cattle
to ten recombinant M . smegmatis CF preparations. . . . . . . . . . . . . . . . . . . . . . . . . . 105
5 . 1 Southern blot of the M . bovis cosmid 56 subclones probed with insert
DNA from pM2 1 . . . . . . . . . . . . . . . . . . . . . . . . . . . . . . . . . . . . . . . . . . . . . . . . . . . . . . . . . . . . . . . . 1 14
5 .2 Nucleotide sequence of the gene encoding the M. bovis Pel protein . . . . . . 1 17
5 .3 Hydropathy analysis (Kyte-Doolittle) plot of the deduced amino acid
sequence of the M. bovis Pel protein. . . . . . . . . . . . . . . . . . . . . . . . . . . . . . . . . . . . . . . . . . 1 19
5 .4 Regions of sequence similarity between the M. bovis putative exported
lipoprotein and the Enterobacter aerogenes maltose-binding protein
p recursor . . . . . . . . . . . . . . . . . . . . . . . . . . . . . . . . . . . . . . . . . . . . . . . . . . . . . . . . . . . . . . . . . . . . . . . . . . 12 1
5 .5 Hydropathy analysis (Kyte-Doolittle) plots of the M. bovis Pel protein,
and the M. leprae Pel, MaIF, and MalO proteins. . . . . . . . . . . . . . . . . . . . . . . . . . . . 124
Xli
Figure Page
5 .6 Region of sequence similarity between the product of an ORF
downstream of the M. bovis pel gene and the M. leprae MalF protein. . . 1 25
5 .7 Genomic arrangement of a putative operon involved in maltose transport
in the M. leprae cosmid B 1 756. . . . . . . . . . . . . . . . . . . . . . . . . . . . . . . . . . . . . . . . . . . . . . . . 1 26
5 . 8 Southern blot of Eco RI-digested mycobacterial genomic DNA probed
with a 234 bp fragment from the M. bovis BCG insert of pM2 1
corresponding to part of the pel gene. . . . . . . . . . . . . . . . . . . . . . . . . . . . . . . . . . . . . . . . . 128
5 .9
5. 1 0
Expression o f the M. bovis pel gene . . . . . . . . . . . . . . . . . . . . . . . . . . . . . . . . . . . . . . . . . .
IFN-y responses of PBMCs from M. bovis BCG-immunised animals
( 1 2 and 15) and a non-immunised, control animal (30) to CF from M .
1 30
smegmatis recombinants containing the cosmid subclones. . . . . . . . . . . . . . . . 1 34
6 . 1 Proliferation of PBMCs from four M. bovis challenged cattle in
response to CF from recombinant M. smegmatis containing subclones
5 61 1 and 5 6/2 . . . . . . . . . . . . . . . . . . . . . . . . . . . . . . . . . . . . . . . . . . . . . . . . . . . . . . . . . . . . . . . . . . . . 149
6 .2 Proliferation of PBMCs from four M. bovis BCG-vaccinated / M .
bovis challenged cattle in response to CF from recombinant M .
smegmatis containing subclones 5611 and 56/2 . . . . . . . . . . . . . . . . . . . . . . . . . . . . .
6 .3 IFN-y responses of PBMCs from three M. bovis challenged cattle to
CF prepared from recombinant M. smegmatis containing subclones
1 50
5 6/1 and 56/2. . . . . . . . . . . . . . . . . . . . . . . . . . . . . . . . . . . .. . . . . . . . . . . . . . . . . . . . . . . . . . . . . . . . 1 5 1
6 .4 IFN-y responses of PBMCs from four M. bovis BCG-vaccinated / M .
bovis challenged cattle to CF from recombinant M . smegmatis
containing subclones 561 1 and 56/2. . . . . . . . . . . . . . . . . . . . . . . . . . . . . . . . . . . . . . . . . . . 1 52
Xlll
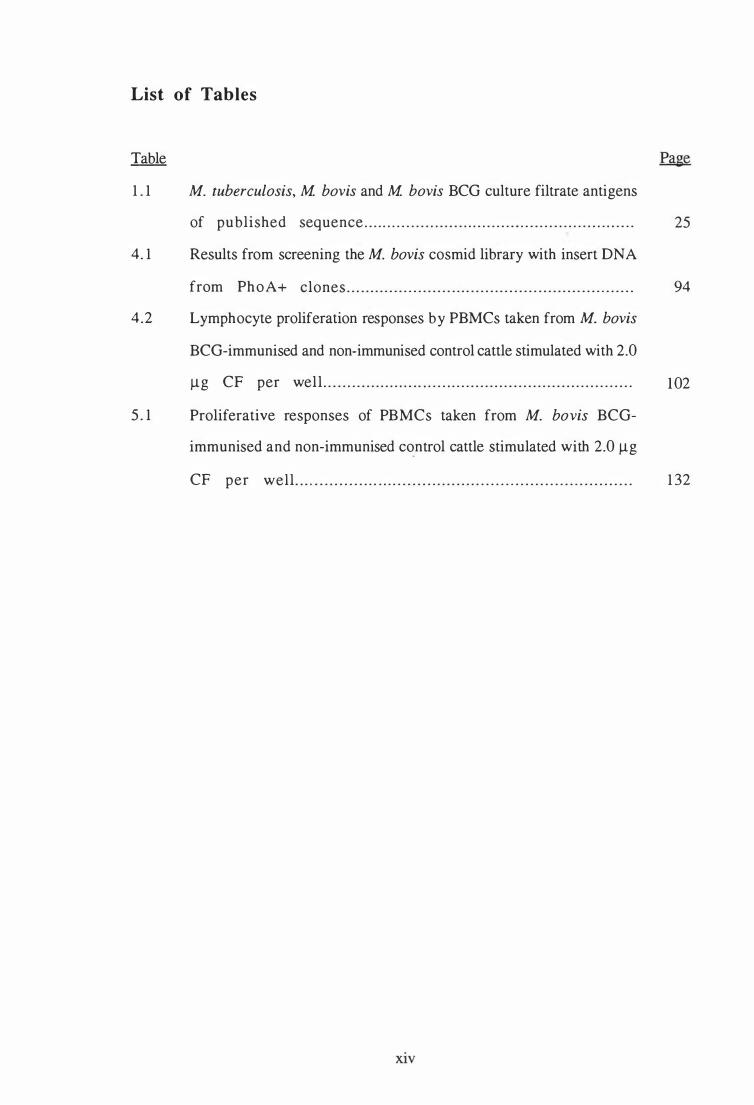
List of Tables
Table Page
1 .1 M . tuberculosis, M. bovis and M. bovis BCG culture filtrate antigens
of published sequence . . . . . . . . . . . . . . . . . . . . . . . . . . . . . . . . . . . . . . . . . . . . . . . . . . . . . . . . . 25
4.1 Results from screening the M. bovis cosmid library with insert DNA
from PhoA+ clones . . . . . . . . . . . . . . . . . . . . . . . . . . . . . . . . . . . . . . . . . . . . . . . . . . . . . . . . . . . . 94
4.2 Lymphocyte proliferation responses by PBMCs taken from M. bovis
BCG-immunised and non-immunised control cattle stimulated with 2.0
�g CF per well . . . . . . . . . . . . . . . . . . . . . .. . . . . . . . . . . . . . . . . . . . . . . . . . . . . . . . . . . . . . . . . . . 1 02
5 .1 Proliferative responses of PBMCs taken from M. bovis BCG
immunised and non-immunised control cattle stimulated with 2.0 �g
CF per well . . . . . . . . . . . . . . . . . . . . . . . . . . . . . . . . . . . . . . . . . . . . . . . . . . . . . . . . . . . . . . . . . . . . . 1 32
XIV
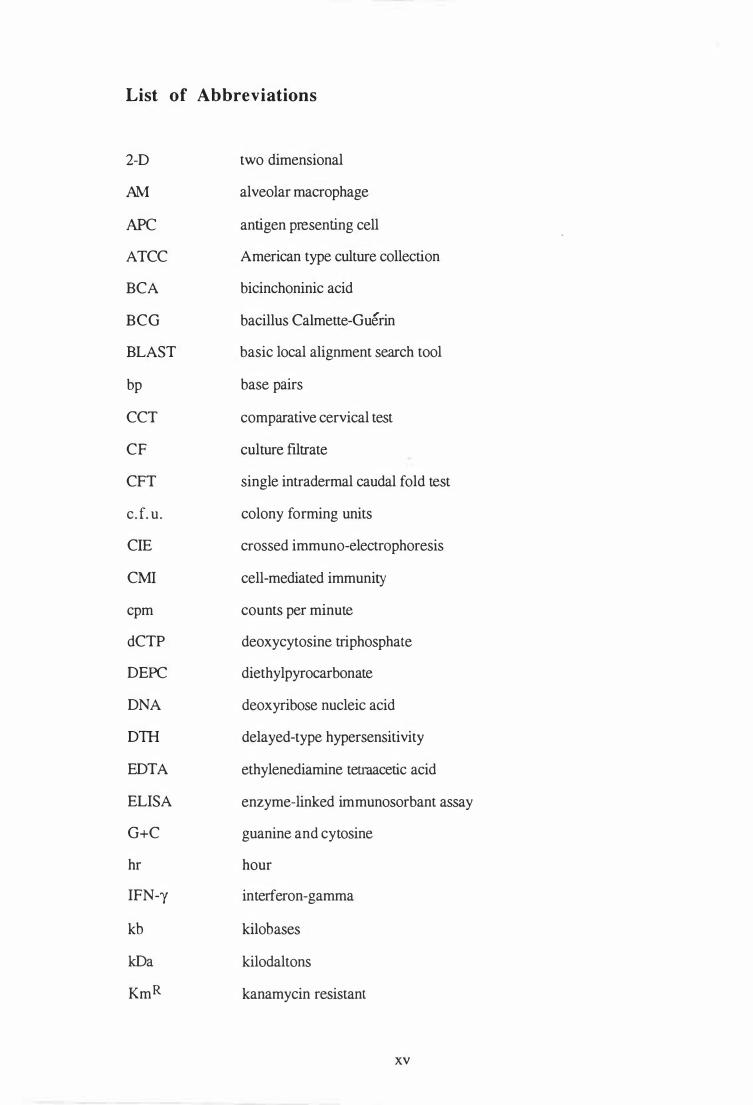
List of Abbreviations
2-D two dimensional
AM alveolar macrophage
APC antigen presenting cell
ATCC American type culture collection
BCA bicinchoninic acid
BCG bacillus Calmette-Guerin
BLAST basic local alignment search tool
bp base pairs
CCT comparative cervical test
CF culture ftltrate
CFT single intradermal caudal fold test
c.Lu. colony forming units
CIE crossed immuno-electrophoresis
CMI cell-mediated immunity
cpm counts per minute
dCTP deoxycytosine triphosphate
DEPC diethylpyrocarbonate
DNA deoxyribose nucleic acid
Dill delayed-type hypersensitivity
EDTA ethylenediamine tetraacetic acid
ELISA enzyme-linked immunosorbant assay
G+C guanine and cytosine
hr hour
IFN-y interferon-gamma
kb kilobases
kDa kilodaltons
KmR kanamycin resistant
xv
--- ---
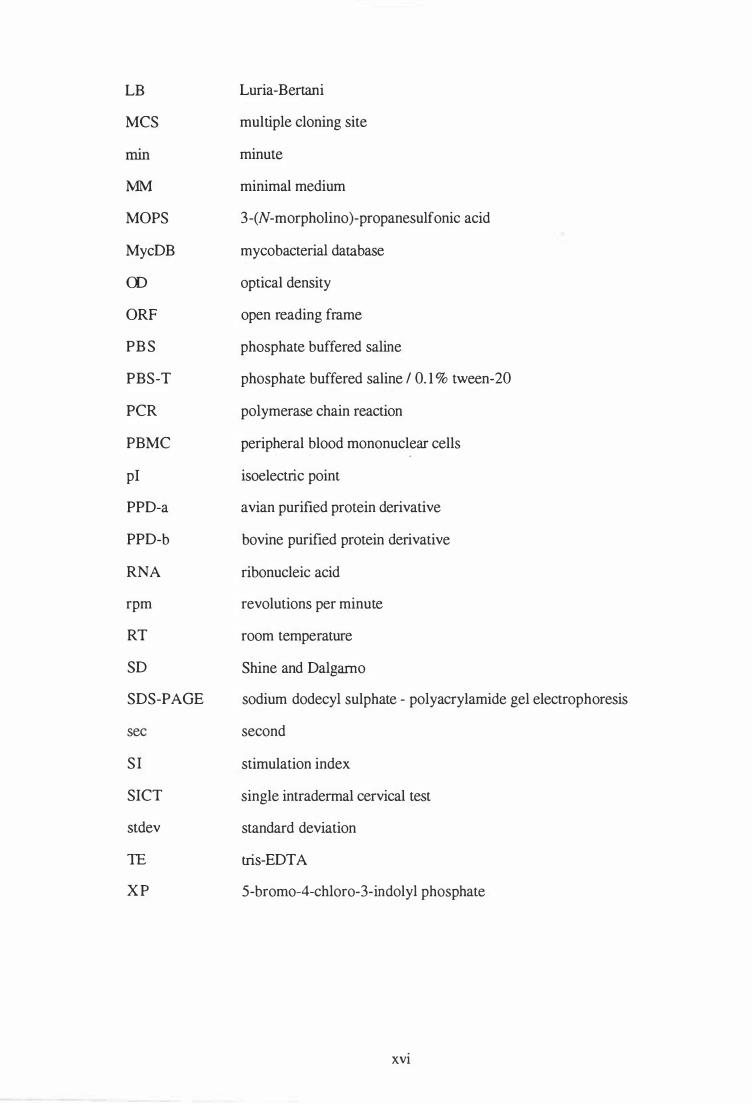
LB
MCS
mm
MM
MOPS
MycDB
())
ORF
PB S
PBS-T
PCR
PBMC
pI
PPD-a
PPD-b
RNA
rpm
RT
SD
SDS-PAGE
sec
SI
SICT
stdev
TE
X P
Luria-Bertani
multiple cloning site
minute
minimal medium
3-(N-morpholino )-propanesulfonic acid
mycobacterial database
optical density
open reading frame
phosphate buffered saline
phosphate buffered saline / 0. 1 % tween-20
polymerase chain reaction
peripheral blood mononuclear cells
isoelectric point
avian purified protein derivative
bovine purified protein derivative
ribonucleic acid
revolutions per minute
room temperature
Shine and Dalgarno
sodium dodecyl sulphate - polyacrylamide gel electrophoresis
second
stimulation index
single intradermal cervical test
standard deviation
tris-EDTA
5-bromo-4-chloro-3-indoly I phosphate
XVI

Chapter 1:
Introduction
1

1 . 1 Tuberculosis
1 . 1 . 1 Historical background
No other bacterial genus in history has caused as much human suffering as the genus
Mycobacterium. The term Mycobacterium was first used by Lehmann and Neumann in
1 896 to describe the causal agents of tuberculosis and leprosy (Goodfellow and Wayne,
1982). Lesions indicative of spinal tuberculosis have been found in Egyptian mummies
dating back to 3700 Be and on a 6000 year old skeleton (Morse et al, 1964, cited in
Daniel et ai. , 1994). Skeletal lesions characteristic of leprosy have been found on human
remains from AD550 (Grange, 1989).
Tuberculosis, originally known as "phthisis" (derived from the Greek "wasting away")
and later known as consumption (Daniel et ai. , 1994), was fIrst shown to be caused by a
transmissible agent by Jean-Antoine Villemin in 1 868. However, it wasn't until 1 882
that the tubercle bacillus was isolated by Robert Koch (Grange, 1989). The causative
organism of leprosy had already been described nine years previously by G. Annauer
Hansen but he was unable to culture the leprosy bacillus, which has still not been grown
in vitro to this day (Grange, 1989; Brooks et ai. , 199 1 ).
1.1.2 The Koch phenomenon
In 1891 Koch published an account of an immunological reaction, now referred to as the
"Koch Phenomenon", which distinguished between primary infection and re-infection
(Grange, 1 989; Brooks et ai. , 199 1 ). He reported that inoculation of healthy guinea-pigs
with virulent M. tuberculosis resulted in the formation of a hard nodule after 10- 1 4 days
which subsequently turned into an ulcer that rarely healed. In contrast, when M.
tuberculosis-infected guinea-pigs were inoculated with viable tubercle bacilli, a hard,
darkened swelling developed around the site of injection one to two days post-
2
inoculation. This sloughed off leaving an ulcer which rapidly healed. The same
immunological reaction also occurred when the inoculum was in the form of a
concentrated, heat-inactivated culture filtrate of the tubercle bacillus; a preparation now
known as "Old Tuberculin". Koch's inadvertent discovery of delayed hypersensitivity
laid the foundations for the development of the tuberculin skin test by Clemens von
Pirquet (von Pirquet 1 907 cited in Bothamley and Grange, 199 1 ).
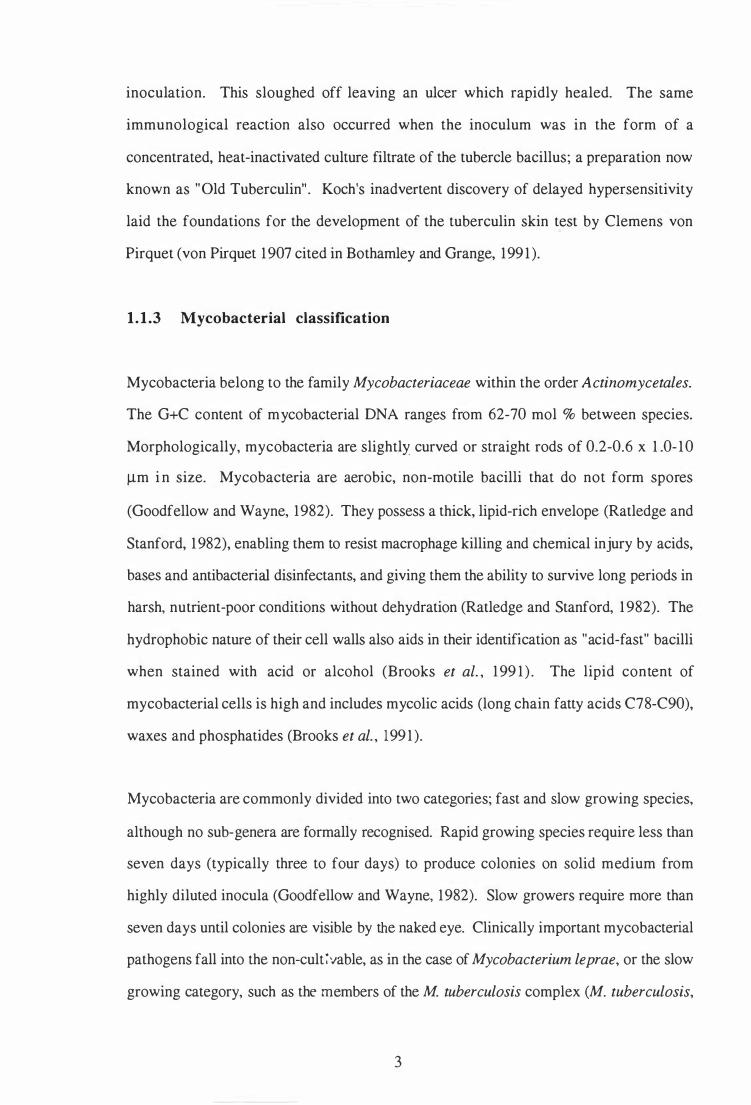
1.1.3 Mycobacterial classification
Mycobacteria belong to the family Mycobacteriaceae within the order Actinomycetales.
The G+C content of mycobacterial DNA ranges from 62-70 mol % between species.
Morphologically, mycobacteria are slightly curved or straight rods of 0.2-0.6 x 1 .0- 1 0
�m i n size. Mycobacteria are aerobic, non-motile bacilli that do not form spores
(Goodfellow and Wayne, 1982). They possess a thick, lipid-rich envelope (Ratledge and
Stanford, 1 982), enabling them to resist macrophage killing and chemical injury by acids,
bases and antibacterial disinfectants, and giving them the ability to survive long periods in
harsh, nutrient-poor conditions without dehydration (Ratledge and Stanford, 1 982). The
hydrophobic nature of their cell walls also aids in their identification as "acid-fast" bacilli
when stained with acid or alcohol (Brooks et ai. , 1 99 1 ) . The lipid content of
mycobacterial cells is high and includes mycolic acids (long chain fatty acids C78-C90),
waxes and phosphatides (Brooks et ai. , 199 1 ).
Mycobacteria are commonly divided into two categories; fast and slow growing species,
although no sub-genera are formally recognised. Rapid growing species require less than
seven days (typically three to four days) to produce colonies on solid medium from
highly diluted inocula (Goodfellow and Wayne, 1982). Slow growers require more than
seven days until colonies are visible by the naked eye. Clinically important mycobacterial
pathogens fall into the non-cult;vable, as in the case of Mycobacterium leprae, or the slow
growing category, such as the members of the M. tuberculosis complex (M. tuberculosis,
3
Mycobacterium bovis, Mycobacterium bovis BeG, Mycobacterium aJricanum and
Mycobacterium microti). While this complex is quite separate taxonomically from other
m ycobacteria, the distinction between its members is less clear prompting the suggestion
that they be classified as subspecies of a single species (Goodfellow and Wayne, 1 982).
Other slow growing mycobacterial pathogens include Mycobacterium avium,
Mycobacterium intracellulare, Mycobacterium paratuberculosis (M. avium subspecies
paratuberculosis) , Mycobacterium marinum, Mycobacterium scroJulaceum, and
Mycobacterium kansasii. Most of the fast growing mycobacteria, such as Mycobacterium
flavescens and Mycobacterium smegmatis, are non-pathogenic but the opportunistic
pathogens of the Mycobacterium Jortuitum complex (M. Jortuitum and Mycobacterium
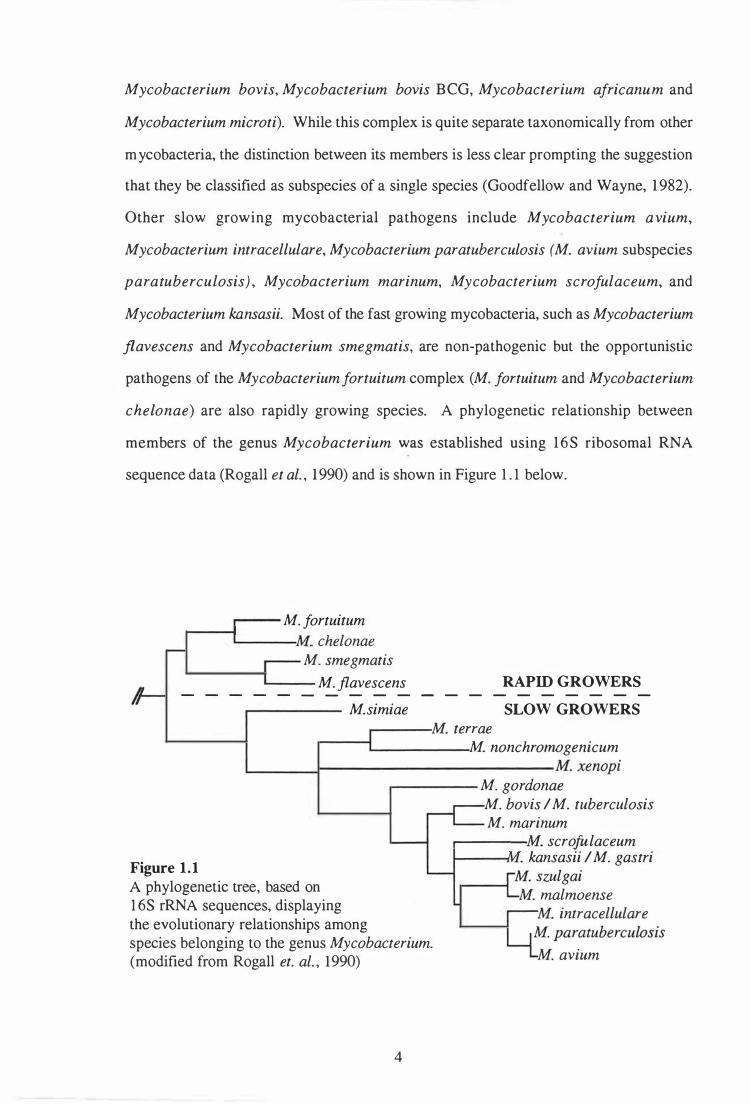
chelonae) are also rapidly growing species. A phylogenetic relationship between
members of the genus Mycobacterium was established using 1 6 S ribosomal RNA
sequence data (Rogall et ai. , 1990) and is shown in Figure 1 . 1 below .
..---- M. Jortuitum r---� L-----M. chelonae
M. smegmatis
'---- M. flavescens RAPID GROWERS ----- -------------
Figure 1 . 1
,..----- M.simiae SLOW GROWERS ,...----.M. terrae
...---� M. nonchromogenicum L-___ �--------------M. xenopi
...------ M. gordonae M. bovis / M. tuberculosis M. marinum
..----__ M. scrofulaceum t------j�Vl. kansasii / M. gastri
A phylogenetic tree, based on 1 6S rRNA sequences, displaying
M. szulgai r---� M. malmoense M. intracellulare
the evolutionary relationships among species belonging to the genus Mycobacterium. (modified from Rogall et. ai. , 1990)
4
M. avium

1 .2 Bovine Tuberculosis
1.2.1 History
Tuberculosis or "consumption" has been recognised in cattle since 1 4AD when the
condition was described by Columeela in northern Italy (Wood, 1 994). However, it
wasn't until Koch's discovery of the tubercle bacillus that the cause of this condition was
understood. In 1901 Koch claimed that bovine tuberculosis posed no threat to humans.
The controversy created by this unsubstantiated claim led to the establishment of a Royal
Commission to investigate the evidence. Based on the data accumulated over the next
decade, the Commission concluded that bovine tuberculosis posed a major threat to
human health (Grange, 1989). It is now known that the host-range of M. bovis is
virtually unrestricted in mammals and M. bovis can cause disease in humans that is
indistinguishable from disease caused by the genetically related M . tuberculosis. At
present, bovine tuberculosis represents a much lower public health risk than it did prior to
the introduction of carcass inspection at meat processing plants, and milk pasteurisation
procedures (Livingstone, 1992).
1.2.2 Diagnosis and control
The standard method for diagnosing bovine tuberculosis is the tuberculin skin test. Three
forms of this test are commonly used; the single intradermal caudal fold test (CFT), the
single intradermal cervical test (SICT), and the comparative cervical test (CCT) (Neill et
ai. , 1995). The CFf and SICT are conducted by intradermal injection of M. bovis
purified protein derivative (PPD) tuberculin into the caudal fold or cervical regions
respectively, with the site of injection being examined approximately 72 hours later for
signs of swelling and induration. The CCT is similar except that PPD tuberculins from
both M. bovis and M. avium are injected into the cervical region and the skin reactions to
each tuberculin are measured and compared. In New Zealand and Australia the CFf is
5

the standard tool for diagnosis of bovine tuberculosis, with the CCT being used as a
supplementary test for animals with borderline results in the initial test (Tweddle and
Livingstone, 1 994). Animals that have not come into contact with mycobacteria have no
immunological reaction to the skin test In contrast, cattle that have been infected with M.
bovis develop an indurated swelling. The induration indicates that the host's immune
system has previously encountered tuberculin antigens and has developed delayed-type
hypersensitivity (DTH; refer section 1 .3.2, Acquired immunity). Despite its widespread
use, the skin test is not an ideal diagnostic tool due to its inability to distinguish active
tuberculosis from past infection or sensitisation by environmental mycobacteria.
However, tuberculin skin testing is the universally accepted method for diagnosis of
bovine tuberculosis.
The general approach to control of bovine tuberculosis is one of diagnosis and slaughter
of tuberculin reactors. Movement control restrictions are then placed on herds containing
skin test-positive animals to prevent the spread of disease. Test and slaughter
programmes combined with movement control restrictions have been remarkably
successful in Australia, Britain, northern Europe and North America in reducing the
number of herds on movement control below the 0.2% internationally accepted level (de
Lacy, 1 995). However, the existence of wildlife reservoirs which contribute to the
spread of M. bovis infection in cattle has hindered the eradication of the disease in other
countries. The badger (Meles meles) has been identified as a wildlife reservoir of M.
bovis infection for cattle in the Republic of Ireland, Northern Ireland and the south-west
of England (Neill et al. , 1994; Hughes et al. , 1996). Red deer (Cervus elaphus) are also
a potential source of bovine infection in Britain and Ireland. In New Zealand, the
Australian brushtailed possum (Trichosurus vulpecula) is the major wildlife reservoir,
although other feral and wild animals may contribute to the transmission of M. bovis to
cattle (Ragg and Walker, 1995). Bovine tuberculosis also remains a problem in Brazil
and Argentina where pigs are commonly infected with M. bovis (Neill et al. , 1994).
6

1.2.3 Bovi ne tuberculosis in New Zealand
B ovine tuberculosis is thought to have been introduced into New Zealand along with
cattle in the early-, to mid-nineteenth century (Tweddle and Livingstone, 1994). It soon
became established in cattle and by the early twentieth century was considered a serious
public health risk. Tuberculin testing of dairy cattle was introduced on a voluntary basis
in 1 945 and became compulsory for town-supply dairy herds in 1956 (Tweddle and
Livingstone, 1994). Within five years this had been extended to all dairy herds and by
1 970 tuberculin testing of beef herds was also compulsory (Tweddle and Livingstone,
1 994). The test and slaughter program in conjunction with restrictions on the movement
of herds containing tuberculin reactors significantly reduced the incidence of disease over
most of the country. However, in a few geographically defmed areas bovine tuberculosis
remained a problem and re-infection was common (Tweddle and Livingstone, 1 994). It
was clear that cattle to cattle transmission was not the only source of re-infection and in
1 97 1 - 1972 the possum was identified as a major wildlife reservoir of M. bovis.
Possums were introduced into New Zealand for the fur trade in 1 858 and were a
protected species until 1 92 1 (de Lacy, 1995). Possums are presently considered pests
due to the damage they cause to New Zealand's agricultural industry and to the native
bush. The possum population has been estimated at anywhere between 50 and 100
million and an eighteen per cent annual kill must be achieved simply to maintain the
population at its current level (de Lacy, 1995). When poisoning of possums with sodium
monofluoroacetate ( l080) became part of the tuberculosis control program the number of
infected herds dropped steadily between 1977 and 1 98 1 (Tweddle and Livingstone,
1 994). However, the declining incidence of bovine tuberculosis prompted the
Government to reduce spending on possum control and the problem re-emerged
(Tweddle and Livingstone, 1994).
7
In 1 989 the Animal Health Board was established to oversee the campaign against bovine
tuberculosis (Tweddle and Livingstone, 1994). Concerns about overseas consumer
perceptions of New Zealand's bovine tuberculosis problem and maintenance of access to
export markets became the driving force behind the national tuberculosis eradication
program (Tweddle and Livingstone, 1994). By 199 1 the extent of the problem prompted
a major review of the tuberculosis control scheme. New Zealand was divided into
tuberculosis endemic and non-endemic (fringe, surveillance and tuberculosis
investigation) areas and new management practices were introduced (Tweddle and
Livingstone, 1994). Endemic areas were defined as those where infected wildlife are
found or believed to be present on the basis of epidemiological evidence from cattle
testing (Livingstone, 1992). Owing to the bush-covered nature of the land and the large
number of infected species, it is virtually impossible to eradicate tuberculosis from the six
endemic areas using current technology and resources (Tweddle and Livingstone, 1994).
While continuation of the test and slaughter programs, movement controls and possum
poisoning is vital to halt the spread of disease, research is seen as a pragmatic,
economical solution to New Zealand's bovine tuberculosis problem (Livingstone, 1992).
One of the research objectives is to develop a cost-effective, internationally acceptable
vaccine for possible use in cattle (see Appendix 4). In order to design a successful
vaccine, it is first necessary to understand the bovine immune response to M. bovis
infection.
8
1 . 3 The Immune Response
The immune response to mycobacteria involves a complex interplay between host,
pathogen and the environment, with the outcome being either resistance or disease. Many
of the symptoms of tuberculosis are not caused by the tubercle bacilli themselves, but by
the immune response of the host to the mycobacteria. Discovering factors that lead to a
protective immune response rather than the pathological function is of utmost importance
in anti-tuberculosis vaccine design.
1.3.1 Innate immunity
Innate, or natural immunity can be defined as the combined functions of physical barriers
to infection, cells, and soluble factors in the absence of antigen-specific or acquired
immunity (Brown et al. , 1994). It is immediate and has no immunological memory. The
physical baniers of innate immunity include the skin and mucous membranes. The
primary cellular component of innate immunity involves macrophages, neutrophils, and
natural killer cells (Brown et ai. , 1994). Soluble factors include gastric juice, saliva, the
components of the complement cascade, and cytokines, such as a- and �-interferons
(Goodman, 1 99 1; Rich and Ellner, 1994). The cell surface receptors and soluble protein
factors typically recognise carbohydrate structures, such as lipopolysaccharide (LPS)
which is a common constituent of Gram negative bacterial outer-membranes.
The first lines of defence against tuberculosis infection are mucous membranes.
Transmission of pulmonary tuberculosis is only possible when droplets between 2 and 5
11m in diameter which contain no more than three viable bacilli are inhaled into the lungs
(Dannenberg, 199 1 ) . Larger infectious particles settle on the mucosal surfaces of the
nasopharynx and the bronchial tree and are moved along by the cilia until they are
eventually swallowed (Dannenberg, 1989).
9
Any tubercle bacilli that pass the physical barriers of innate immunity and lodge on the
alveolar membranes are phagocytosed by resident alveolar macrophages (AM's).
Whether or not an initial infection develops is due to both the inherent microbicidal
properties of the AM and the virulence of the infecting bacilli (Dannenberg, 1989).
Phagocytosis may result in bacterial destruction, inhibition or intracellular multiplication.
The bacteria are released from the AM if it fails to control their multiplication and
neutrophils quickly arrive at the site of infection (Rich and Ellner, 1 994). Neutrophils
have been shown to be capable of killing M. tuberculosis in vitro (Brown et al. , 1987)
but the precise mechanism by which they do this is unknown. Blood-borne macrophages
(monocytes) are recruited to the focus of infection by the chemotactic factors released by
neutrophils in response to the mycobacterial infection (Rich and Ellner, 1 994). The
monocytes then phagocytose the released bacteria but these immature cells are generally
unable to restrict the growth of mycobacteria. Natural killer cells may also take part in the
early inducible, "non-immune" phase of tuberculosis infection by producing interferon
gamma (IFN-y) which activates macrophages to express microbicidal functions (Chan
and Kaufmann, 1994). During this stage of infection, cell death and tissue necrosis are
minimal and the bacilli are able to multiply logarithmically (Dannenberg, 199 1 ). If the
innate immune defences fail to rid the host of the mycobacterial pathogen, progress
towards disease will occur unless the adaptive, or acquired immune response can restrict
bacterial growth. However, the view that innate immunity provides only temporary and
incomplete anti-microbial host defence until the development of acquired immunity is too
simplistic. The innate and acquired arms of the immune system function in concert and
are not separate and unconnected mechanisms of host defence (Brown et al. , 1994;
Fearon and Locksley, 1 996).
10
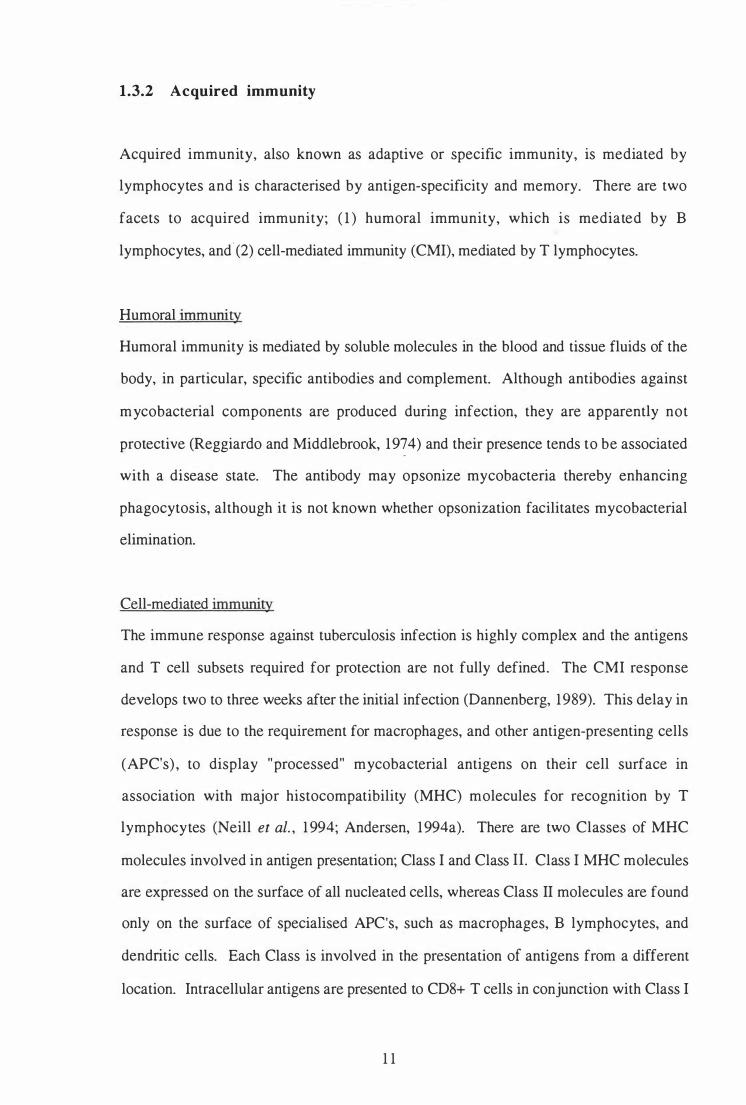
1.3.2 Acquired immunity
Acquired immunity, also known as adaptive or specific immunity, is mediated by
lymphocytes and is characterised by antigen-specificity and memory. There are two
facets to acquired immunity; ( 1 ) humoral immunity, which is mediated by B
lymphocytes, and" (2) cell-mediated immunity (CMI), mediated by T lymphocytes.
Humoral immunity
Humoral immunity is mediated by soluble molecules in the blood and tissue fluids of the
body, in particular, specific antibodies and complement. Although antibodies against
mycobacterial components are produced during infection, they are apparently not
protective (Reggiardo and Middlebrook, 1974) and their presence tends to be associated
with a disease state. The antibody may opsonize mycobacteria thereby enhancing
phagocytosis, although it is not known whether opsonization facilitates mycobacterial
elimination.
Cell-mediated immunity
The immune response against tuberculosis infection is highly complex and the antigens
and T cell subsets required for protection are not fully defined. The CMI response
develops two to three weeks after the initial infection (Dannenberg, 1989). This delay in
response is due to the requirement for macrophages, and other antigen-presenting cells
(APC's) , to display "processed" mycobacterial antigens on their cell surface in
association with major histocompatibility (MHC) molecules for recognition by T
lymphocytes (Neill et ai. , 1 994; Andersen, 1994a). There are two Classes of MHC
molecules involved in antigen presentation; Class I and Class ll. Class I MHC molecules
are expressed on the surface of all nucleated cells, whereas Class II molecules are found
only on the surface of specialised APC's, such as macrophages, B lymphocytes, and
dendritic cells. Each Class is involved in the presentation of antigens from a different
location. Intracellular antigens are presented to CD8+ T cells in conjunction with Class I
1 1
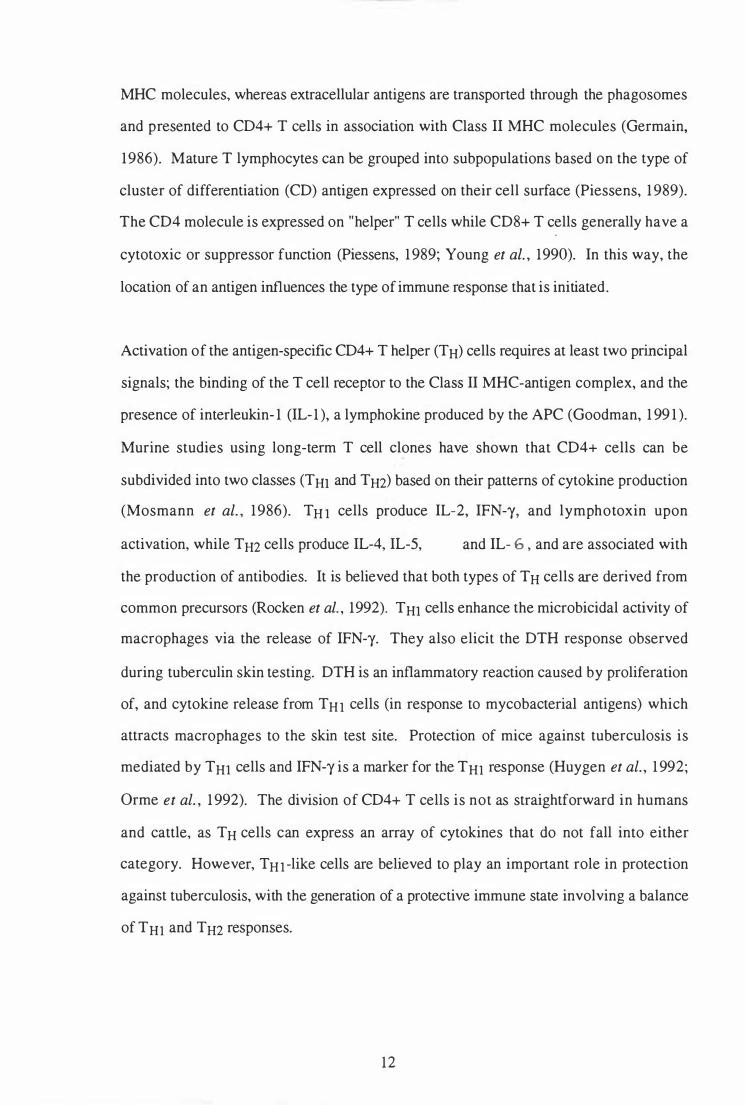
MHC molecules, whereas extracellular antigens are transported through the phagosomes
and presented to CD4+ T cells in association with Class II MHC molecules (Germain,
1986). Mature T lymphocytes can be grouped into subpopulations based on the type of
cluster of differentiation (CD) antigen expressed on their cell surface (Piessens, 1 989).
The CD4 molecule is expressed on "helper" T cells while CD8+ T cells generally have a
cytotoxic or suppressor function (Piessens, 1 989; Young et ai. , 1990). In this way, the
location of an antigen influences the type of immune response that is initiated.
Activation of the antigen-specific CD4+ T helper (TH) cells requires at least two principal
signals; the binding of the T cell receptor to the Class II MHC-antigen complex, and the
presence of interleukin- 1 (IL- 1 ), a lymphokine produced by the APC (Goodman, 1 99 1 ).
Murine studies using long-term T cell clones have shown that CD4+ cells can be
subdivided into two classes (THl and TH2) based on their patterns of cytokine production
(Mosmann et ai. , 1986). TH I cells produce IL-2, IFN-y, and lymphotoxin upon
activation, while TH2 cells produce IL-4, IL-5, and IL- 6 , and are associated with
the production of antibodies. It is believed that both types of TH cells are derived from
common precursors (Rocken et aI. , 1992). THl cells enhance the microbicidal activity of
macrophages via the release of IFN-y. They also elicit the DTH response observed
during tuberculin skin testing. DTH is an inflammatory reaction caused by proliferation
of, and cytokine release from THl cells (in response to mycobacterial antigens) which
attracts macro phages to the skin test site. Protection of mice against tuberculosis is
mediated by THI cells and IFN-y is a marker for the THl response (Huygen et ai. , 1 992;
Orme et ai. , 1 992). The division of CD4+ T cells is not as straightforward in humans
and cattle, as TH cells can express an array of cytokines that do not fall into either
category. However, THI -like cells are believed to play an important role in protection
against tuberculosis, with the generation of a protective immune state involving a balance
of THl and TH2 responses.
12
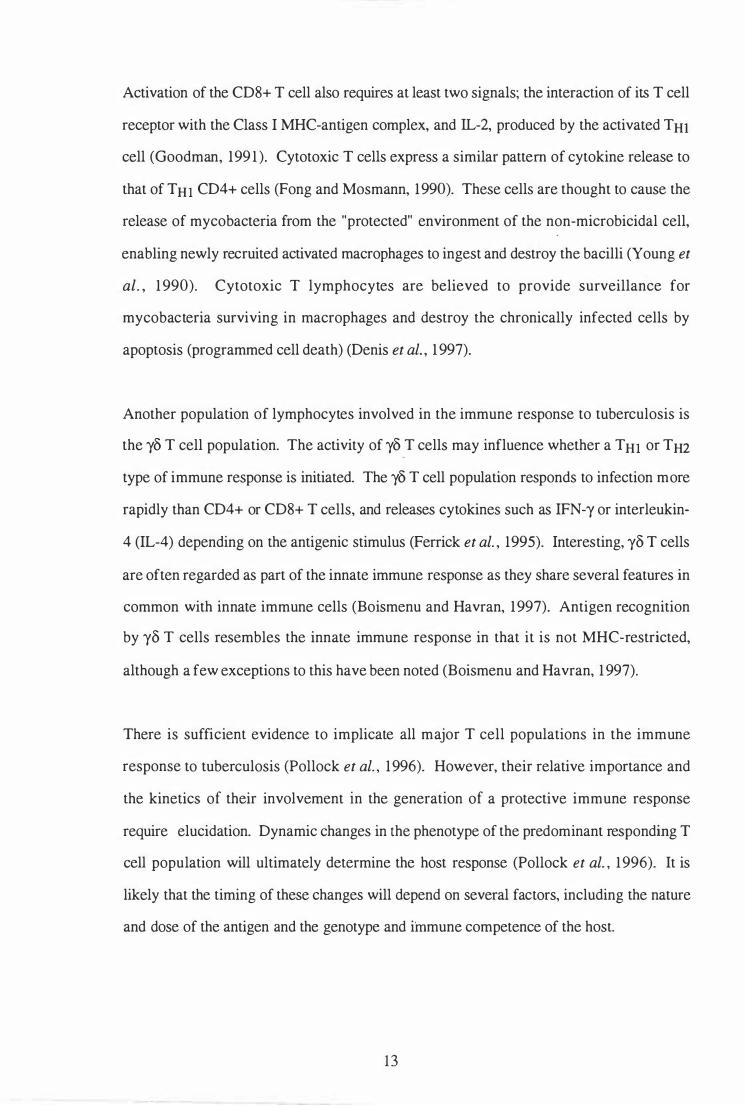
Activation of the CD8+ T cell also requires at least two signals; the interaction of its T cell
receptor with the Class I MHC-antigen complex, and IL-2, produced by the activated THl
cell (Goodman, 199 1 ). Cytotoxic T cells express a similar pattern of cytokine release to
that of THI CD4+ cells (Fong and Mosmann, 1990). These cells are thought to cause the
release of mycobacteria from the "protected" environment of the non-microbicidal cell,
enabling newly recruited activated macrophages to ingest and destroy the bacilli (Young et
al. , 1 990). Cytotoxic T lymphocytes are believed to provide surveillance for
mycobacteria surviving in macrophages and destroy the chronically infected cells by
apoptosis (programmed cell death) (Denis et ai. , 1 997).
Another population of lymphocytes involved in the immune response to tuberculosis is
the y8 T cell population. The activity of y8 T cells may influence whether a THI or TH2
type of immune response is initiated. The y8 T cell population responds to infection more
rapidly than CD4+ or CD8+ T cells, and releases cytokines such as IFN-y or interleukin-
4 (IL-4) depending on the antigenic stimulus (Ferrick et ai. , 1995). Interesting, y8 T cells
are often regarded as part of the innate immune response as they share several features in
common with innate immune cells (Boismenu and Havran, 1997). Antigen recognition
by y8 T cells resembles the innate immune response in that it is not MHC-restricted,
although a few exceptions to this have been noted (Boismenu and Havran, 1 997).
There is sufficient evidence to implicate all major T cell populations in the immune
response to tuberculosis (Pollock et ai. , 1996). However, their relative importance and
the kinetics of their involvement in the generation of a protective immune response
require elucidation. Dynamic changes in the phenotype of the predominant responding T
cell population will ultimately determine the host response (Pollock et ai. , 1996). It is
likely that the timing of these changes will depend on several factors, including the nature
and dose of the antigen and the genotype and immune competence of the host.
13
- - ----------
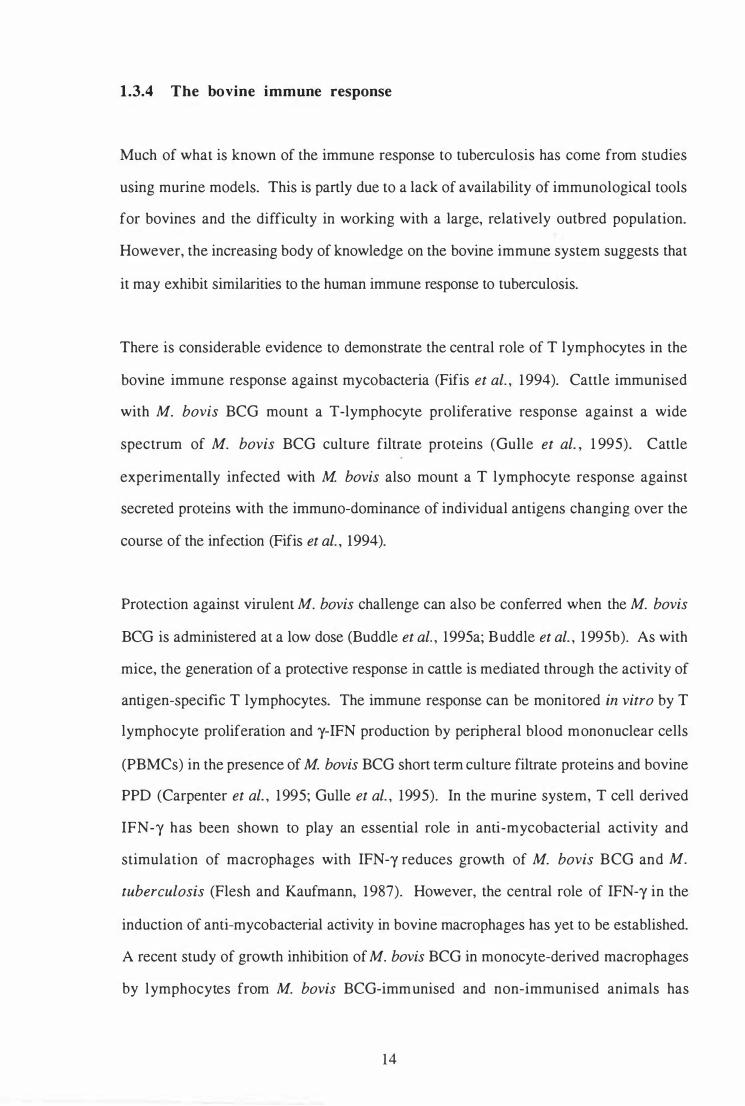
1.3.4 The bovine immune response
Much of what is known of the immune response to tuberculosis has come from studies
using murine models. This is partly due to a lack of availability of immunological tools
for bovines and the difficulty in working with a large, relatively outbred population.
However, the increasing body of knowledge on the bovine immune system suggests that
it may exhibit similarities to the human immune response to tuberculosis.
There is considerable evidence to demonstrate the central role of T lymphocytes in the
bovine immune response against mycobacteria (Fifis et ai. , 1994). Cattle immunised
with M . bovis BCG mount a T-lymphocyte proliferative response against a wide
spectrum of M . bovis BCG culture filtrate proteins (GuIle et al. , 1 995). Cattle
experimentally infected with M. bovis also mount a T lymphocyte response against
secreted proteins with the immuno-dominance of individual antigens changing over the
course of the infection (Fifis et ai. , 1994).
Protection against virulent M. bovis challenge can also be conferred when the M . bovis
BCG is administered at a low dose (BuddIe et ai. , 1995a; BuddIe et ai. , 1 995b). As with
mice, the generation of a protective response in cattle is mediated through the activity of
antigen-specific T lymphocytes. The immune response can be monitored in vitro by T
lymphocyte proliferation and y-IFN production by peripheral blood mononuclear cells
(PBMCs) in the presence of M. bovis BCG short term culture filtrate proteins and bovine
PPD (Carpenter et ai. , 1995; GuIle et ai. , 1995). In the murine system, T cell derived
IFN-y has been shown to play an essential role in anti-mycobacterial activity and
stimulation of macrophages with IFN-y reduces growth of M. bovis BCG and M .
tuberculosis (Flesh and Kaufmann, 1987). However, the central role of IFN-y in the
induction of anti-mycobacterial activity in bovine macrophages has yet to be established.
A recent study of growth inhibition of M. bovis BCG in monocyte-derived macrophages
by lymphocytes from M. bovis BCG-immunised and non-immunised animals has
14
indicated that lymphocyte-derived factors, in addition to IFN-y, are required to activate
macrophages to anti-mycobacterial activity (Carpenter et ai. , 1 997). In contrast, lung
derived macrophages treated with IFN-y alone, can restrict M. bovis BCG growth
(Aldwell et al. , 1997).
Cattle, like humans, appear to possess a high level of natural immunity to tuberculosis. It
has been found that y8 T cells make up 20-30% of peripheral blood T lymphocytes in
young calves, whereas they are a minority cell type in rodents and humans (Wyatt et al. ,
1 994). The finding that y8 T cells are the first subpopulation of circulating lymphocytes
to respond by clonal expansion after M. bovis infection provides evidence that y8 T cells
play a role in the immune response to bovine tuberculosis (Pollock et ai. , 1996). The
study by Pollock and colleagues suggestep that the lymphocyte response to M. bovis
infection comprises three phases; localisation of y8 T cells to developing lesions and
clonal expansion, followed by the sequential involvement of CD4+ and then CD8+ T
cells. A recent study investigating the sequential changes occurring at the site of
intradelmal injection of bovine PPD in tuberculin sensitive cattle also demonstrated the
involvement of y8 T cells in the immune response to bovine tuberculosis (Doherty et al. ,
1 996). Two distinct morphological changes were identified: ( 1 ) an infiltration of y8 T
cells and neutrophils between 6 and 24 hours post-injection, and (2) increased numbers
of infiltrating CD4+ cells, CD8+ cells, and macrophages between 24 and 72 hours post
injection (Doherty et al. , 1996). However, in spite of their involvement in the immune
response to bovine tuberculosis, it is not known if y8 T cells play any role in protective
immunity.
15

1 . 4 The Mycobacterium bovis BCG Vaccine
1.4.1 Mycobacterium bovis BCG
A notable event in the history of tuberculosis research was the development of the Bacille
Calmette-Guerin (BCG) vaccine strain. In 1908 Albert Calmette and Camille Guerin, at
the Institut Pasteur in Lille, isolated a virulent mycobacterium from a cow with
tuberculous mastitis and attenuated the purified strain by serial passage over thirteen years
on a glycerol-potato-bile medium (Young and Cole, 1 993; Huebner and Comstock,
1 994). M. bovis BCG was first used as an anti-tuberculosis vaccine for human infants in
192 1 (Grange, 1989) and is still used today in many countries and with people of all age
groups. It is generally recognised as one of the safest vaccines available although this
was seriously questioned after the 1939 tragedy in Lubeck, Germany, when 72 out of
25 1 M. bovis BCG-vaccinated children died of tuberculosis (Bloom and Fine, 1 994).
However, the M. bovis BCG vaccine strain was declared safe when the deaths were
shown to be caused by virulent M. tuberculosis. The current literature is conflicting as to
how this disaster occurred with reports of the vaccine being contaminated with virulent
M. tuberculosis (Collins, 1988; Bloom and Fine, 1994; Brewer and Colditz, 1 995), and
claims that a vial of virulent M. tuberculosis being used accidentally instead of M. bovis
BCG (Huebner, 1996). The efficacy of the M. bovis BCG vaccine in humans is
questionable as various trials have given conflicting results, ranging from 0 to 80%
protection (Fine, 1 989). This variability has been attributed to differences in prior
exposure to environmental mycobacteria, strain variation, genetic and nutritional
differences between populations, and climatic conditions (Fine, 1995).
Several physiological differences between virulent M. bovis and the attenuated M. bovis
BCG strains have been noted (Wayne and Kubica, 1986; Roberts et aI. , 1 99 1 ). For
example, M. bovis BCG grows well aerobically and on glycerinated media whereas
freshly isolated M. bovis grows poorly under these conditions, although M. bovis will
16
adapt to these conditions following repeated subculture (Wayne and Kubica, 1 986).
Significant differences also exist between various M. bovis BeG strains. It has been
suggested that M. bovis BeG strains be subdivided into two groups on the basis of their
secreted protein profiles (Abou-Zeid et ai. , 1 986). The two groups differ in the amount
of MPB70 secreted into the culture medium (Harboe and Nagai, 1 984), and by the
presence or absence of MPB64 (Harboe et ai. , 1 986). Differences between M. bovis
BeG strains in the mycolic acid patterns obtained by thin-layer chromatography have also
been observed (Minnikin et aI. , 1984). A recent study comparing the immune responses
of mice immunised with different M. bovis BeG strains demonstrated considerable
variation in the immunogenicity of the strains (Lagranderie et aI. , 1996). However, these
differences did not correlate with differences in lipid content or protein profiles.
In addition to the phenotypic and immunogenic differences between M. bovis and M.
bovis BeG, several gross genomic differences have been observed (Mahairas et aI. ,
1 996; Philipp et ai. , 1996). Although the genetic basis for its attenuation is unknown, a
recent study comparing virulent M. bovis and the vaccine strain M. bovis BeG using
subtractive hybridisation has revealed three large (approximately 10 kb) regions which are
deleted from M. bovis BeG (Mahairas et ai. , 1996). One region was absent from all M.
bovis BeG sub-strains and present in all virulent M. bovis isolates tested suggesting that
it may be the original attenuating mutation. However, the role, if any, this region plays in
virulence is yet to be established.
1 .4.2 Mycobacterium bovis BeG cattle vaccine trials
Trials to assess the effectiveness of the M. bovis BeG vaccine in controlling bovine
tuberculosis have been carried out since the development of the vaccine strain (reviewed
in Daborn and Grange, 1993). Many of the trials were inconclusive, although most
suggest a decrease in the severity of disease in vaccinated cattle (Haring et ai. , 1 930;
Waddington and Ellwood, 1972; Daborn and Grange, 1993). The lack of standardisation
17
of procedures made comparisons between trials difficult and numerous factors, such as
vaccine substrain, the dose and route of vaccination and challenge, and prior exposure to
environmental mycobacteria, must be considered when evaluating the results of each trial.
In particular, interpretation of results from many of the early vaccine trials was
complicated by the use of unnatural experimental infection systems. Cattle were
challenged with very high doses of M. bovis (0. 1 to 50 mg; approximately 106 to 5 x 10⁸
c.f.u .) by the intravenous, subcutaneous and oral routes (Haring et ai. , 1 930;
Waddington and Ellwood, 1972). This resulted in the experimentally infected cattle
developing generalised tuberculosis with large lesions at multiple sites. The natural
disease is rarely this severe and small tuberculous lesions are typically found at only one
or two sites (Crews, 199 1). Recently, inoculation of cattle by the intratracheal route with
a low dose of virulent M. bovis (500 c.f.u.) has been found to induce pathology similar
to that found in animals with naturally occurring disease (BuddIe et aI. , 1994). This
experimental M. bovis challenge system has enabled a more realistic assessment of the
protective capabilities of the M. bovis BCG vaccine.
Antigen dose is known to be critical in determining the type of immune response induced
and it has been suggested that low doses of M. bovis BCG may be more protective than
high doses (Bretscher, 1992). The majority of the cattle vaccination trials used high
vaccine doses, ranging from 107 to 109 c.f.u. of live M. bovis BCG (Haring et ai. , 1 930;
Waddington and Ellwood, 1972; Berggren, 1 98 1 ) . The efficacy of the M. bovis BCG
(Pasteur) vaccine was recently evaluated using low and medium vaccine doses ( lQ4 and
106 c.f.u. , respectively) administered by subcutaneous injection (BuddIe et aI. , 1995a).
The cattle were subjected to extensive post-mortem examination five to six months after
intratracheal challenge with a low dose (800 c.f.u.) of M. bovis. The proportion of
animals with tuberculous lesions in the lungs and lymph nodes was significantly lower in
the two vaccinated cattle groups than the control group, although there were no significant
differences between the low and medium dose vaccine groups. This study clearly
demonstrated that M. bovis BCG vaccination of calves could induce significant protection
1 8
against the development of tuberculous lesions (BuddIe et ai. , 1995a). In a follow-up
study, groups of cattle were vaccinated with either M. bovis BeG by the subcutaneous or
respiratory route or with a killed Mycobacterium vaccae preparation by the intradermal
route (BuddIe et aI. , 1 995b). The animals were subjected to extensive post-mortem
approximately five months after intratracheal challenge with 2 x 10³ c.f.u. of virulent M.
bovis, and the degree of protection against the development of lesions was assessed.
Killed M. vaccae induced no protection against virulent challenge. In contrast, both the
numbers of cattle with tuberculous lesions and the number of lesioned lymph nodes in
each animal were significantly less for the M. bovis BeG vaccinated animals than for the
unvaccinated animals. Similar levels of protection resulted from vaccination by the
subcutaneous or respiratory routes.
A frequently cited problem with M. bovis BeG-vaccination of cattle is that it induces
tuberculin reactivity thereby compromising the current diagnostic skin test. Therefore, if
M. bovis BeG proves effective in controlling bovine tuberculosis, improved diagnostic
tools must be developed to distinguish between vaccinated and infected animals.
19
1 . 5 Mycobacterial Secreted A ntigens
1 .5.1 Evidence for the role of secreted proteins in protection against
tuberculosis
The importance of secreted proteins as protective antigens against disease has been
established for several pathogenic bacteria. Inoculation with extracellular proteins of the
intracellular pathogen Legionella pneumophilia has been used to successfully protect
guinea pigs against Legionnaire's disease (Blander and Horwitz, 1989). More recently, a
recombinant aroA - Salmonella typhimurium vaccine expressing two Liste ria
nwnocytogenes antigens was found to protect mice against listeriosis when the antigens
were exported but not when they were expr�ssed as somatic proteins (Hess et at. , 1996).
The finding that vaccination with viable M. tuberculosis, but not non-living mycobacterial
preparations, results in the generation of protective T lymphocytes (Orme, 1 988a) is
consistent with the hypothesis that secreted proteins are responsible for protective
immunity against tuberculosis. It is considered that secreted antigens would be readily
available for presentation to T lymphocytes early after infection, whereas the release of
somatic antigens depends on prior killing and degradation of the infecting micro
organism. In support of this hypothesis, it has been shown that guinea pigs and mice
vaccinated with Mycobacterium tuberculosis extracellular proteins show some resistance
to virulent challenge (Hubbard et at. , 1992; Pal and Horwitz, 1992) and that mice can be
efficiently protected against virulent M. tuberculosis, by vaccination with a short-term M.
tuberculosis culture filtrate (CF) using an appropriate adjuvant (Andersen, 1994b).
20
1.5.2 Protein export signals
Exported (secreted and cell-associated) proteins transported by the general secretory
pathway are synthesised as presecretory proteins with an N-terminal signal peptide that is
necessary for translocation across the cytoplasmic membrane. During translocation, the
signal peptide is cleaved from the presecretory protein by a membrane-bound signal
peptidase. All known bacterial export signal pep tides share the same general features.
They are typically amino terminal, and have up to three domains, known as the "N", "H"
and "c" domains (Pugsley, 1993). The N domain, closest to the N terminus of the
presecretory protein, is polar and carries a net positive charge. The N domain of Gram
positive signal pep tides tends to be longer and more basic than signal pep tides from Gram
negative organisms (von Heijne, 1992). The N domain is followed by the H domain, or
hydrophobic core, consisting of a long alpha-helical stretch (> 8 residues) of hydrophobic
amino acids. The H domain frequently ends with an helix-breaking amino acid (proline
or glycine) . The C domain is less hydrophobic than the H domain and carries the
cleavage signals recognised by the signal peptidase (Pugsley, 1 993).
Two types of bacterial signal peptidases that cleave the majority of exported proteins have
been identified; LepB (SPase I) and LspA (SPase II or lipoprotein signal peptidase)
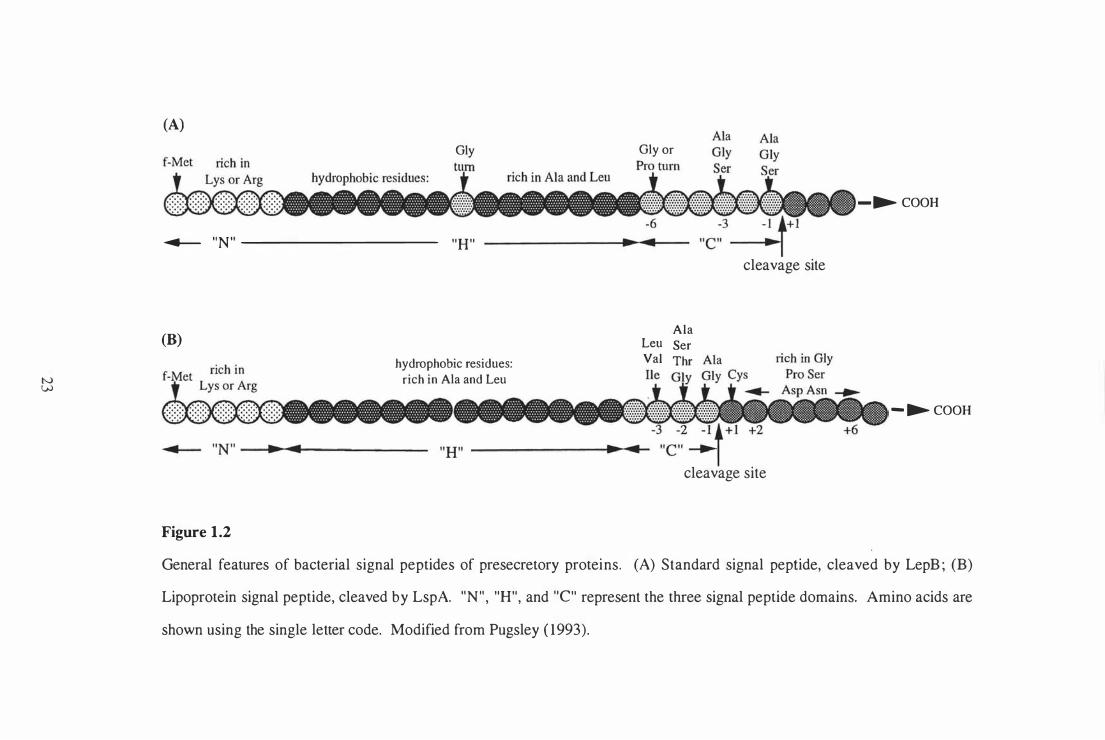
(Pugsley, 1 993). A diagrammatic representation of the two types of signal pep tides
cleaved by these signal peptidases, is shown in Figure 1 .2. The majority of signal
pep tides are cleaved by LepB, which recognises sequences with small amino acids
(usually alanine or glycine) at positions - 1 and -3 with respect to the cleavage site. A
turn-inducing glycine or proline residue is typically found at position -6 with respect to
the cleavage site. A glycine-turn is also commonly found within the H domain of
standard signal peptides.
Lipoprotein signal peptides (Figure 1 .2) are removed following cleavage by LspA. LspA
cleaves only those presecretory proteins with a cysteine residue immediately after the
2 1
cleavage site. The N-terminal cysteine residue is covalently modified with a glyceride
thioether group which anchors the mature lipoprotein to the cell membrane (Hantke and
Braun, 1973). Lipoprotein signal peptides tend to be shorter and more hydrophobic than
standard signal pep tides, and lack the turn-promoting residue commonly found at the end
of the H domain (von Heijne, 1989). Lipoproteins have a four residue LspA consensus
sequence (L,V,I) (A,S,T,G) (G,A) . C at positions -3 to + 1 with respect to the cleavage
site (von Heijne, 1989). Lipoprotein signal peptides require at least one match to this
consensus in the first two positions and a precise match in positions - 1 and + 1 .
Lipoproteins also have a high incidence of turn-promoting residues (glycine, proline,
serine, asparagine, and aspartic acid) downstream of the cleavage site (positions +2 to
+6) (von Heijne, 1989). The C domain of lipoprotein signal peptides is apolar and is
somewhat shorter than the largely polar C domain of standard signal peptides.
A third bacterial signal peptidase, type IV prepilin peptidase, has been identified
(Pugsley, 1 993). Unlike LepB and LspA, type IV prepilin peptidase cleaves signal
pep tides on the cytoplasmic side of the cytoplasmic membrane (Pugsley, 1 993). Very
few signal peptides are cleaved by this peptidase, which recognises the consensus
sequence Q (R,K) G t (F,M) at positions -3 to + 1 with respect to the cleavage site.
Cleavage occurs between the N and H domains and thus type IV prepilin signal peptides
have no C domain.
22
tv W
(A) Gly
� " N " --II'-�"'---------- "H"
(B)
hydrophobic residues: rich in Ala and Leu
Gly or
Ala Leu Ser Val Thr
"C" --� cleavage site
� " N " --.--... --.------- "H" --------II ... � ........ "c" � cleavage site
Figure 1.2
-� COOH
- � COOH
General features of bacterial signal pep tides of presecretory proteins. (A) Standard signal peptide, cleaved by LepB ; (B)
Lipoprotein signal peptide, cleaved by LspA. " N " , "H", and "c" represent the three signal peptide domains. Amino acids are
shown using the single letter code. Modified from Pugsley ( 1993).
1.5.3 Mycobacterial culture filtrate antigens
The characterisation of protein antigens is a major focus of tuberculosis research, not only
for the identification of antigens as potential vaccine candidates but to identify species
specific or immunodominant antigens for use as diagnostic reagents. Approximately 30
mycobacterial CF antigens have been characterised to date using several different
approaches. However, the function of the majority of these proteins is unknown and
judging by the large number of proteins observed on 2D gels of mycobacterial culture
filtrates (CFs) (GuIle et aI. , 1995), a great many more antigens remain uncharacterised.
The nomenclature of protein antigens can be confusing, as some antigens are referred to
by more than one name. The classification of mycobacterial protein antigens was
extensively reviewed by Young et al. in 1992 and the properties of mycobacterial proteins
were summarised with respect to their immunological significance. This review, which
gave each antigen a code number, attempted to eliminate the confusion over
nomenclature, and an integrated mycobacterial database, MycDB, has been constructed
using the same antigen codes (Bergh and Cole, 1994).
Table 1 . 1 lists the M. tuberculosis and M. bovis or M. bovis BCG CF antigens of known
sequence to date. Several antigens present in mycobacterial culture filtrates do not have
signal pep tides and are therefore not exported via the general secretory (i.e. signal
peptide-dependant) pathway. Such antigens include ESAT-6, superoxide dismutase
(SOD), L-alanine dehydrogenase, Des, and members of the heat shock protein family.
The number of CF antigens which have been characterised is growing rapidly due to the
wide range of approaches now available for identifying secreted protein antigens.
24
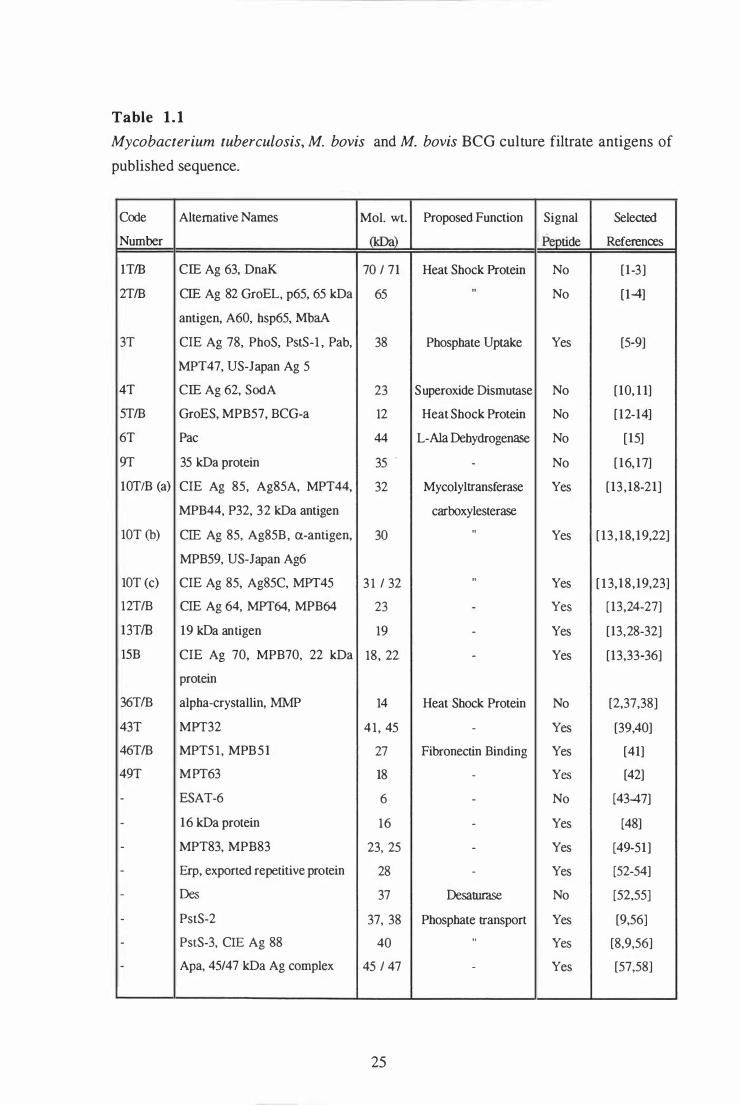
Table 1.1
Mycobacterium tuberculosis, M. bovis and M. bovis BeG culture filtrate antigens of
published sequence.
Code Alternative Names Mol. wt. Proposed Function Signal Selected
Number Jl<Q& P�tide References
lTlB CIE Ag 63, DnaK 70 / 71 Heat Shock Protein No [1-3]
2TIB CIE Ag 82 GroEL, p65, 65 kDa 65 "
No [1-4]
antigen, A60, hsp65, MbaA 3T CIE Ag 78, PhoS, PstS-l , Pab, 38 Phosphate Uptake Yes [5-9]
MPT47, US-Japan Ag 5
4T CIE Ag 62, SodA 23 Superoxide Dismutase No [10, 1 1]
5TIB GroES, MPB57, BCG-a 12 Heat Shock Protein No [12-14]
6T Pac 44 L-Ala Dehydrogenase No [15]
9T 35 kDa protein 35 - - No [ 16, 17]
lOTtB (a) CIE Ag 85, Ag85A, MPT44, 32 Mycolyltransferase Yes [13 ,18-21]
MPB44, P32, 32 kDa antigen carboxylesterase
lOT (b) CIE Ag 85, Ag85B, a-antigen, 30 "
Yes [ 1 3 , 1 8, 19,22]
MPB59, US-Japan Ag6
lOT (c) CIE Ag 85, Ag85C, MPT45 3 1 / 32 "
Yes [ l 3, 1 8,19,23]
12TIB CIE Ag 64, MPT64, MPB64 23 - Yes [ 13,24-27]
13TfB 19 kDa antigen 19 - Yes [13,28-32]
15B CIE Ag 70, MPB70, 22 kDa 18, 22 - Yes [13,33-36]
protein
36TfB alpha-crystallin, MMP 14 Heat Shock Protein No [2,37,38]
43T MPT32 41 , 45 - Yes [39,40]
46TIB MPT5 1 , MPB51 27 Fibronectin Binding Yes [41]
49T MPT63 18 - Yes [42]
- ESAT-6 6 - No [43-47]
- 16 kDa protein 16 - Yes [48]
- MPT83, MPB83 23, 25 - Yes [49-51]
- Erp, exported repetitive protein 28 - Yes [52-54]
- Des 37 Desaturase No [52,55]
- PstS-2 37, 38 Phosphate transport Yes [9,56]
- PstS-3, CIE Ag 88 40 " Yes [8,9,56]
- Apa, 45/47 kDa Ag complex 45 / 47 - Yes [57,58]
25
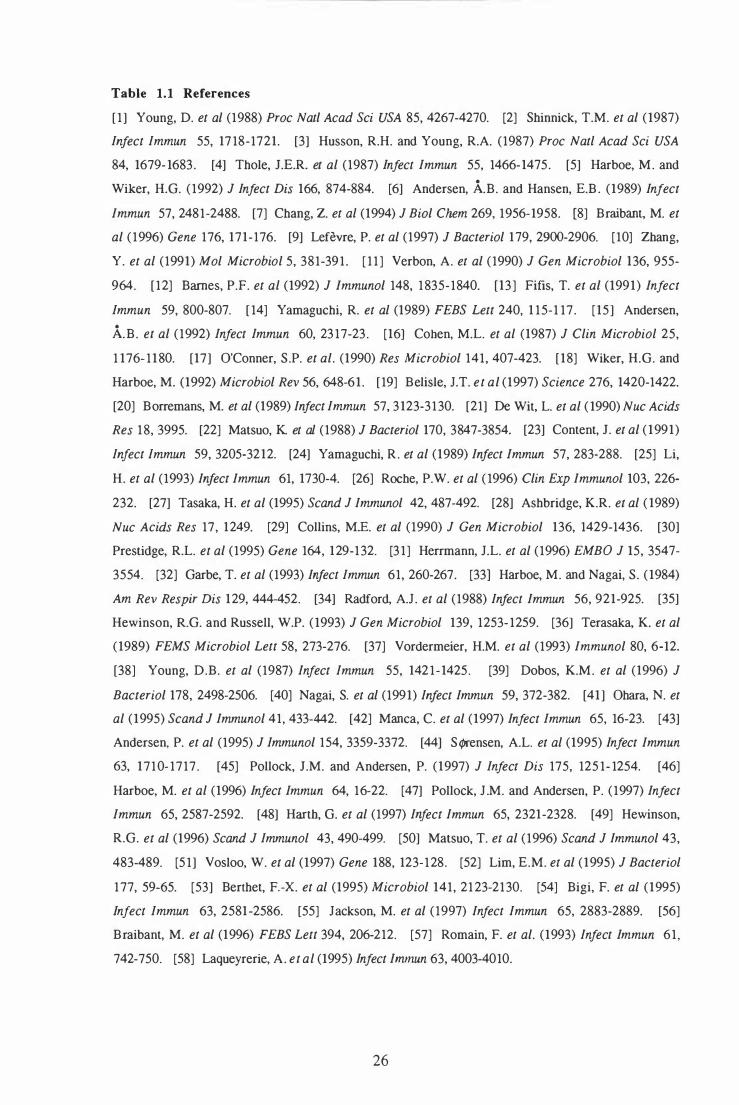
Table 1.1 References [ 1 ] Young, D. et al (1988) Proc Natl Acad Sci USA 85, 4267-4270. [2] Sbinnick, T.M. et al ( 1987)
Infect Immun 55, 17 18-1721. [3] Husson, R.H. and Young, R.A. (1987) Proc Natl Acad Sci USA
84, 1679- 1683 . [4] Tbole, J.E.R. et al (1987) Infect Immun 55, 1466-1475 . [5] Harboe, M. and
Wiker, H.G. (1992) J Infect Dis 166, 874-884. [6] Andersen, A.B. and Hansen, E.B . (1989) Infect
Immun 57, 2481-2488. [7] Cbang, Z. et al (1994) J Biol Chem 269, 1956-1958. [8] Braibant, M. et
al ( 1 996) Gene 176, 171-176. [9] Lefevre, P. et al (1997) J Bacteriol 1 79, 2900-2906. [10] Zhang,
Y. et al (1991) Mol Microbiol 5, 381-39 1 . [ 1 1 ] Verbon, A. et al ( 1990) J Gen Microbiol l36, 955-
964. [ 1 2] Barnes, P.F. et al (1992) J Immunol 148, 1 835-1840. [ l3] Fifis, T. et al (1991) Infect
Immun 59, 800-807. [ 14] Yamagucbi, R. et al (1989) FEBS Lett 240, 1 1 5-1 17 . [ 15 ] Andersen,
A.B . et al ( 1992) Infect Immun 60, 23 17-23 . [16] Cohen, M.L. et al (1987) J Clin Microbiol 25,
1 176- 1 1 80. [17] O'Conner, S.P. et al. (1990) Res Microbiol 141, 407-423. [ 18] Wiker, H.G. and
Harboe, M. (1992) Microbiol Rev 56, 648-61 . [ 19] Belisle, J.T. et al (1997) Science 276, 1420-1422.
[20] Borremans, M. et al (1989) Infect Immun 57, 3 123-31 30. [21] De Wit, L. et al ( 1990) Nuc Acids
Res 1 8, 3995. [22] Matsuo, K. et al (1988) J Bacteriol 170, 3847-3854. [23] Content, J. et al ( 1 991)
Infect Immun 59, 3205-3212. [24] Yamagucbi, R . et al (1989) Infect Immun 57, 283-288. [25] Li,
H. et al (1993) Infect Immun 61, 1730-4. [26] Rocbe, P.W. et al ( 1996) Clin Exp Immunol 103, 226-
232. [27] Tasaka, H. et al (1995) Scand J Immunol 42, 487-492. [28] Asbbridge, K.R. et al ( 1989)
Nuc Acids Res 17, 1 249. [29] Collins, ME. et al (1990) J Gen Microbiol 136, 1429-1436. [30]
Prestidge, R.L. et al (1995) Gene 164, 1 29-1 32. [3 1 ] Herrmann, J.L. et al (1996) EMBO J 15, 3547-
3554. [32) Garbe, T. et al (1993) Infect Immun 61, 260-267. [33) Harboe, M. and Nagai, S . ( 1984)
Am Rev Respir Dis 1 29, 444-452. [34] Radford, A.J . et al (1988) Infect Immun 56, 921-925. [35]
Hewinson, RG. and Russell, W.P. ( 1993) J Gen Microbiol 139, 1253- 1259. [36] Terasaka, K. et al
( 1989) FEMS Microbiol Lett 58, 273-276. [37) Vordermeier, H.M. et al (1993) Immunol 80, 6-12.
[38] Young, D.B. et al (1987) Infect Immun 55, 142 1 - 1425 . [39] Dobos, K.M. et al (1996) J Bacteriol 178, 2498-2506. [40] Nagai, S. et al (1991) Infect Immun 59, 372-382. [41 ] Obara. N. et
al ( 1995) Scand J Immunol 41 , 433-442. [42] Manca, C. et al (1997) Infect Immun 65, 16-23. [43]
Andersen, P. et al (1995) J Immunol 154, 3359-3372. [44] S</Kensen, A.L. et al (1995) Infect Immun
63, 1 71 0- 1717 . [45] Pollock, J.M. and Andersen, P. ( 1997) J Infect Dis 175, 125 1- 1254. [46]
Harboe, M. et al (1996) Infect Immun 64, 16-22. [47] Pollock, J .M. and Andersen, P. (1997) Infect
Immun 65, 2587-2592. [48] Harth, G. et al (1997) Infect Immun 65, 2321-2328. [49] Hewinson,
R.G. et al (1996) Scand J Immunol 43, 490-499. [50] Matsuo, T. et al ( 1996) Scand J Immunol 43,
483-489. [5 1 ] Vosloo, W. et al (1997) Gene 188, 123-1 28. [52] Lim, E.M. et al ( 1995) J Bacteriol
1 77, 59-65. [53] Bertbet, F.-x. et al (1995) Microbiol 141, 21 23-21 30. [54] Bigi, F. et al ( 1995)
Infect Immun 63, 2581 -2586. [55] Jackson, M. et al ( 1997) Infect Immun 65, 2883-2889. [56]
Braibant, M. et al (1996) FEBS Lett 394, 206-212. [57] Romain, F. et al. (1993) Infect Immun 61 ,
742-750. [58] Laqueyrerie, A. et al (1995) Infect Immun 63, 4003-4010.
26
The protein profile of mycobacterial CF can vary considerably in composition according
to the culture conditions (Abou-Zeid et aI. , 1988; De Bruyn et al., 1989: Andersen et al.,
1 99 1 ) . In addition, continued growth beyond mid-log phase often results in
contamination of the CF with cytoplasmic proteins, such as Hsp65 and isocitrate
dehydrogenase (Abou-Zeid et al. , 1988; Andersen et al., 1 99 1 ). These cytoplasmic
proteins can be used as markers to monitor autolysis, and thus give an indication of the
quality of the CF preparation. A short-term CF with minimal bacterial lysis comprises
proteins that are actively secreted from mycobacteria during the first few days of culture,
as well as exported proteins of the cell wall that are gradually released during bacterial
growth (Andersen et al., 199 1). The gradual release of the exported lipoprotein antigens
PstS- l and MPB83 into the culture medium (Andersen et al., 199 1 ; Harboe et aI., 1998),
suggests that both cell-associated and purely extracellular forms of these lipoproteins may
exist.
Quantitative comparison of protein distribution in mycobacterial CF's and sonicate
fractions has been used to study the secretion efficacies of various proteins (Wiker et aI.,
199 1 ). Wiker and colleagues used a localization index (LI) for each expressed protein,
which is defined as follows: LI = concentration (percentage) of total protein in CF /
concentration (percentage) of total protein in sonicate. Cytoplasmic proteins have an LI
value of near zero, while the LI values of actively exported proteins vary between 5 and
1000. Among those exported proteins studied, the PstS- l lipoprotein had the lowest LI
value (LI = 5) (Wiker et al., 199 1). It has been suggested that the variation in LI values
of known exported proteins may be due to differences in secretion efficiency or
differences in tendency to adhere to the cell surface (Wiker et al., 199 1).
References (this page)
(1) Abou-Zeid, C. et al (1988) J Gen Micro ill. 53 1 -538. (2) Andersen, P. et al (1991) Infect
Immun �(6), 1905-1910. (3) De Bruyn, J. et al (1989) J Gen Micro ill, 79-84. (4) Harboe, M. et
al (1998) Infect Immun 6Q(1), 289-296. (5) Wiker, H.G. et al (1991) J Gen Micro ill 875-884.
26 b
1.5.4 Strategies for identifying secreted protein antigens
Conventional strategies
Initial strategies aimed at identifying protein antigens were based on biochemical
fractionation procedures. In 1949, Seibert made the first attempt at purifying individual
mycobacterial antigens by chemical fractionation (reviewed by Daniel and Janicki, 1978).
However, the three "purified" proteins described by Seibert were later shown to contain
mixtures of proteins (Daniel and Janicki, 1978). Over the next two to three decades,
many different fractionation methods were used in an attempt to isolate mycobacterial
antigens, but only partial purification was achieved with any single approach (Daniel and
Janicki, 1978). Recognising the need to classify these antigens, Janicki and colleagues
proposed a reference system for mycobacterial antigens based on immuno-electrophoretic
separation of culture filtrate antigens (Janicki et ai. , 197 1 ) . Eleven antigens were
identified and named US-Japan Antigens 1 - 1 1 . This reference system was improved
with the technique of crossed immuno-electrophoresis (CIE) using rabbit anti-BCG
hyperimmune sera (Closs et ai. , 1980). Culture filtrate antigens identified using this
approach include MPB64, MPB70, PhoS, the 85-complex antigens, and the heat-shock
proteins DnaK and GroEL. While these approaches have identified many secreted
proteins and laid the foundations for study of mycobacterial culture filtrate antigens, they
have two main drawbacks. Firstly, they focused upon B cell antigens, despite the B cell
response not being considered of key importance in protection against tuberculosis.
Secondly, having identified a B cell antigen, the coding gene remains to be identified.
The gene coding for the ex antigen (antigen 85-B) has been successfully cloned using an
oligonucleotide probe based upon N-terminal amino acid sequence data (Matsuo et ai. ,
1 988). This indirect approach for identifying genes coding for secreted antigens has also
been used with the CF proteins MPB64, MPB70, and GroES (Terasaka et ai. , 1 989;
Yamaguchi et aI. , 1989a; Yamaguchi et aI. , 1989b).
27

Antibody screening of genomic libraries in Escherichia coli
A breakthrough in the identification of mycobacterial antigens occurred when the first
Agt 1 1 expression library containing recombinant DNA from M. tuberculosis was
screened for sequences that encoded specific antigens detected by monoclonal antibodies
(Young et al. , 1985). Using this system, mycobacterial antigens, expressed as fusions
with f3-galactosidase, are detected by immunoblotting of phage plaques. Other studies
have applied this strategy using monoclonal antibodies and sera from hyperimmune
animals or human tuberculosis patients, and in a few cases, the antigens have been
characterised (Young et al. , 1987 ; Cherayil and Young, 1 988; Radford et al. , 1988). The
advantage of this strategy is that the molecular tools are available for E. coli and large
numbers of clones can be easily screened. However, this system has several
disadvantages:
( 1 ) It relies on the random cloning of DNA fragments downstream of E. coli promoters.
(2) It is difficult to distinguish between intracellular and extracellular m ycobacterial
antigens as proteins are detected in E. coli lysates.
(3) Proteins are identified by screening for B cell epitopes.
(4) The E. coli clones cannot easily be screened with T cells. Only one laboratory has
repOlted success with screening a Agt l l expression library for T cell antigens (Mustafa et
al. , 1 988). In this study, the screening of 1 8,000 recombinants yielded a single T cell
clone ! Other laboratories have reported E. coli lysates to contain products which inhibit T
cell proliferation (Averill et al. , 1993).
(5) If post-translational modifications, such as glycosylation, are required for T cell
reactivity, then these T cell antigens will not be detected.
T cell screening of fractionated culture filtrate antigens
A number of strategies aimed at identifying mycobacterial secreted protein antigens have
been based upon simple fractionation of CF proteins and testing of protein fractions in
immunoassays. The technique of 2-D T cell Western blotting relies on elution of CF
proteins following separation by 2-D gel electrophoresis into 96-well tissue culture plates,
28
and directly testing these samples in lymphocyte proliferation assays (GuIle et ai. , 1 993).
Proliferation of bovine T cells in response to fractionated lysate and CF proteins was
examined using this strategy and a marked heterogeneity of responses was observed
(GuIle et ai. , 1 995). However, none of the antigens identified in this study were purified
or characterised. An alternative fractionation strategy, based on elution of proteins from
SDS-polyacrylamide gels, also enabled direct testing of fractions in cellular assays
(Andersen and Heron, 1 993). This approach was successfully used to screen size
fractionated M. tuberculosis CF proteins to identify two major T cell antigens; the ESAT-
6 protein and the previously characterised 85-B antigen (Andersen et ai. , 1 995).
Following its identification using this strategy, the ESAT-6 protein was purified and the
gene cloned (S<j>rensen et aI. , 1995). These strategies have the advantage that they focus
directly on identifying T cell antigens, rather than B cell antigens which must then be
evaluated for their T cell reactivity. Dose-response studies are also feasible and enable the
optimal concentration of antigens to be established. However, identifying the genes
coding for novel T cell antigens requires a return to conventional strategies such as
biochemical purification and N-terminal sequencing of the protein, designing
oligonucleotide probes based on protein sequence data, or screening expression libraries
with antibodies.
Heterologous expression of M. bovis and M. tuberculosis genes in M. smegmatis
Heterologous expression systems using an M. smegmatis host have proved extremely
useful for the study of mycobacterial secreted protein antigens. They have several
advantages over E. coli expression systems, such as Agt1 1 libraries. The major benefit is
that most of the gene expression signals of slow-growing mycobacteria are recognised,
enabling expression of M. bovis and M. tuberculosis genes from their natural promoters
(Bashyam et aI. , 1 996). In addition, extracellular proteins from M. bovis and M.
tuberculosis are produced by recombinant M. sm,egmatis in a form similar to the native
protein and secreted into the culture medium, facilitating purification and direct testing in
immunoassays (Laqueyrerie et ai. , 1995 ; Roche et ai. , 1 996; Harth et ai. , 1997). Most
29
reports using M. smegmatis heterologous expressIOn systems have focused on
characterising previously identified exported protein antigens. However, two novel
strategies based on identifying mycobacterial exported proteins and antigens by using M.
smegmatis heterologous expression systems have been described (Averill et ai. , 1 993;
Lim et ai. , 1995).
A novel strategy for identifying secreted T cell antigens using an M. smegma tis
heterologous expression system was described by Averill and colleagues. An M. bovis
BCG cosmid library expressed in M. smegma tis was screened for T cell stimulatory
antigens using PBMCs from healthy tuberculin positive donors (Averill et ai. , 1 993).
Culture filtrates were prepared from thirty of the M. smegmatis recombinants and tested
in lymphocyte proliferation assays following analysis by SDS-PAGE. Unique protein
bands in three recombinant CFs were observed on SDS-polyacrylamide gels and several
CFs induced proliferation of donor lymphocytes. This strategy has also been used to
identify bovine T cell antigens from an M. bovis cosmid library in M. smegmatis
(Gormley et ai. , 1994; Carpenter et at. , 1995). There are a number of advantages to this
strategy. In addition to the benefits of M. smegmatis heterologous expression systems
described above, the large insert sizes of individual recombinant cosmids enables the
entire M. bovis genome to be screened for T cell-reactive antigens in as few as 350
clones. The large insert size also allows gene clusters, or operons, to be expressed
(Belisle et ai. , 1 99 1 ). When a T cell-stimulatory recombinant CF has been identified
using this simple screening system, the gene responsible for the observed immune
response can be easily located by subcloning of the cosmid DNA inserts and re-testing
CF from the subclones in immunoassays.
A genetic approach for identifying genes coding for exported proteins was recently
adapted for use in mycobacteria (Lim et ai. , 1995). Mycobacterial DNA sequences that
direct protein export can be identified by taking advantage of gene fusions to a reporter
phoA gene of E. coli. The PhoA periplasmic enzyme alkaline phosphatase becomes
30
active when exported across the cytoplasmic membrane to the periplasmic space. Only
recombinants that contain DNA inserts with a functional promoter, transcriptional start
site and signal sequence (in the correct orientation and reading frame) produce
enzymatically active PhoA fusion proteins (Hoffman and Wright, 1 985). These clones
can readily be detected as they turn blue in the presence of the chromogenic substrate 5-
bromo-4-chloro-3-indolyl phosphate (XP). The phoA-fusion technology has been used
to identify two novel M. tuberculosis exported proteins, Des and Erp (Berthet et al. ,
1995; Jackson et aI. , 1997). While this approach has proven highly successful for the
identification of novel mycobacterial genes coding for exported proteins, it provides no
information on the antigenicity of newly identified proteins. It could, therefore, be more
powerful when combined with approaches for identifying T cell antigens.
1.5.5 Scope of research
To date, no strategies for screening exported mycobacterial proteins identified using the
phoA-fusion technology for T cell antigens have been reported. The research presented
in this thesis describes a genetic approach for identifying novel M. bovis I M. bovis BeG
exported T cell antigens, based on the phoA-fusion technology combined with T cell
screening of an M. bovis cosmid library. The rationale behind this approach was to
exploit the phoA reporter gene system to identify novel M. bovis BCG sequences
directing protein export and map the full-length genes on M. bovis cosmids. Culture
filtrates from recombinant M. smegmatis containing these cosmids can then be screened
for their ability to induce an antigen-specific T cell response. Specifically, the ability of
CFs from the selected M. smegmatis recombinants to induce IFN-y-production and
proliferation by PBMCs from M. bovis BCG-immunised and non-immunised control
cattle was investigated. It was hoped that this strategy could be used to identify and
characterise novel M. bovis exported T cell antigens involved in the cell-mediated immune
response to tuberculosis.
3 1

Chapter 2:
Materials and Methods
32
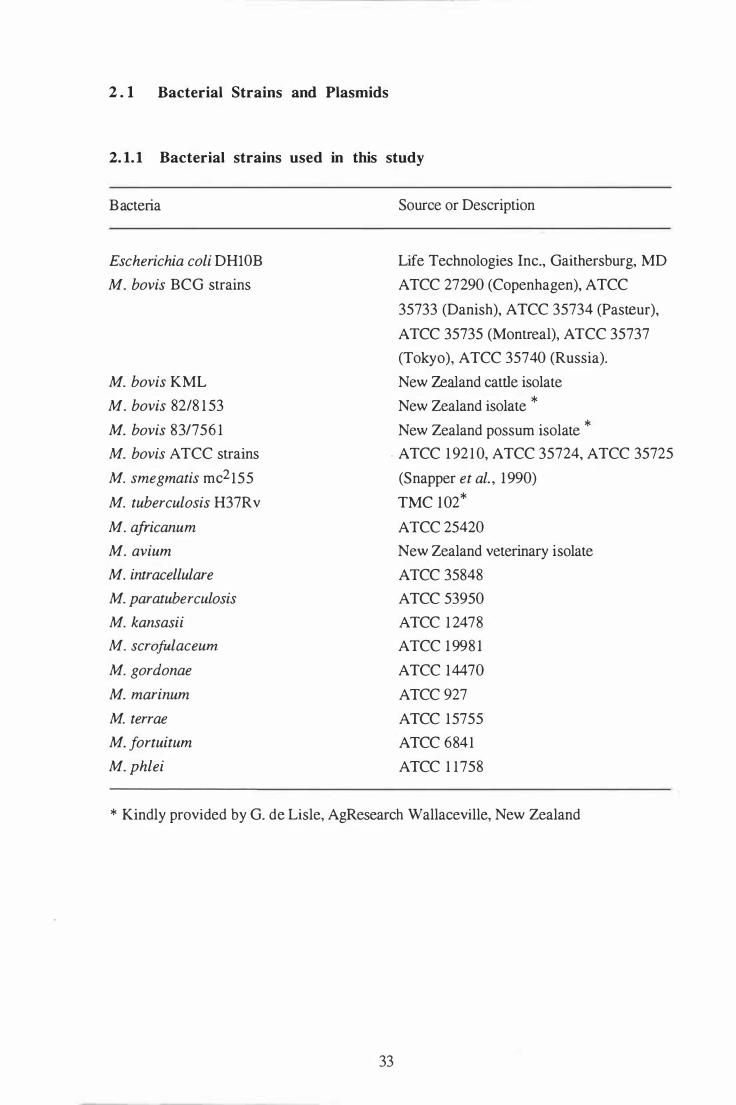
2 . 1 Bacterial Strains and Plasmids
2.1.1 Bacterial strains used in this study
Bacteria
Escherichia coli DHlOB
M. bovis BCG strains
M. bovis KML
M. bovis 82/8 1 53
M. bovis 831756 1
M. bovis A TCC strains
M. smegmatis mc2155
M. tuberculosis H37Rv
M. africanum
M. avium
M. intracellulare
M. paratuberculosis
M. kansasii
M. scrofulaceum
M. gordonae
M. marinum
M. terrae
M. jortuitum
M. phlei
Source or Description
Life Technologies Inc., Gaithersburg, MD
ATCC 27290 (Copenhagen), ATCC
35733 (Danish), ATCC 35734 (Pasteur),
A TCC 35735 (Montreal), A TCC 35737
(Tokyo), ATCC 35740 (Russia).
New Zealand cattle isolate
New Zealand isolate *
New Zealand possum isolate *
- ATCC 1 92 1 0, ATCC 35724, ATCC 35725
(Snapper et ai. , 1990)
TMC 1 02*
ATCC 25420
New Zealand veterinary isolate
ATCC 35848
ATCC 53950
ATCC 1 2478
ATCC 1 998 1
ATCC 14470
ATCC 927
ATCC 15755
ATCC 6841
ATCC 1 1758
* Kindly provided by G. de Lisle, AgResearch Wallaceville, New Zealand
33
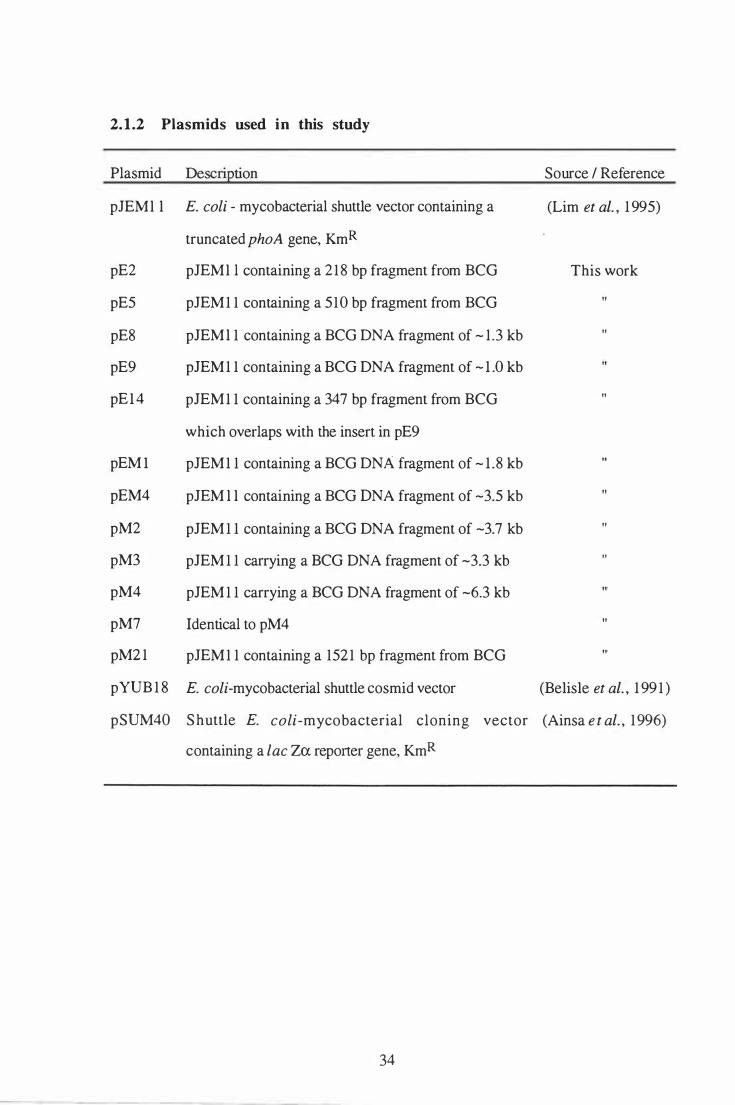
2.1.2 Plasmids used in this study
Plasmid Description
pJEMl l E. coli - mycobacterial shuttle vector containing a
truncated phoA gene, KmR
pE2 pJEMl l containing a 2 18 bp fragment from BeG
pE5 pJEM 1 1 containing a 510 bp fragment from BeG
pE8 pJEM l 1 containing a BeG DNA fragment of - 1 .3 kb
pE9 pJEM 1 1 containing a BeG DNA fragment of - 1 .0 kb
pE1 4
pEM I
pEM4
pM2
pM3
pM4
pM7
pM2 1
pYUB 1 8
pJEM 1 1 containing a 347 bp fragment from BeG
which overlaps with the insert in pE9
pJEM 1 1 containing a BeG DNA fragment of - 1 .8 kb
pJEM l l containing a BeG DNA fragment of -3.5 kb
pJEM 1 1 containing a BeG DNA fragment of -3.7 kb
pJEM 1 1 carrying a BeG DNA fragment of -3.3 kb
pJEM 1 1 carrying a BeG DNA fragment of -6.3 kb
Identical to pM4
pJEM 1 1 containing a 152 1 bp fragment from BeG
E. coli-mycobacterial shuttle cosmid vector
Source / Reference
(Lim et ai. , 1 995)
This work
"
"
"
"
"
"
"
(Belisle et ai. , 1 99 1 )
pSUM40 S huttle E. coli-mycobacterial cloning vector (Ainsa e t ai. , 1996)
containing a lac Za reporter gene, KmR
34
2 . 2 DNA Extractions
2.2.1 Isolation of plasmid DNA from E. coli
Recombinant E. coli were grown overnight at 37°C in 5 ml of LB broth containing
kanamycin. Plasmids were isolated from E. coli by alkaline lysis (Sambrook et ai. ,
1 989) or by using the QIAprep-spin Plasmid Miniprep Kit (QIAGEN, Hildon,
Germany).
2.2.2 Isolation of cosmid DNA from recombinant M. smegmatis
M. smegmatis recombinant cosmid cultures were grown at 370C to stationary phase in
7H9 Middlebrook medium supplemented with ADC enrichment (Difco, Detroit, USA)
and 20 �glml kanamycin (Sigma, St. Louis). Cosmid DNA was extracted based on a
method described by Wilson et al ( 1995). Briefly, cultures were incubated for 2 hrs in
1 00 �glml cycloserine, prior to pelleting by centrifugation. The cells were resuspended
in 40 mM Tris-acetate / 2 mM EDT A (pH 7 .9) and lysed in 20 mM Tris / 1 % SDS (pH
1 2.3). The cell lysates were heated to 300C for 10 mins, followed by 600C for 20 mins,
then cooled to RT. The DNA was extracted twice with phenol:chloroform :isoamyl
alcohol (25:24: 1 ) in the presence of 50 mM NaCI. Following the addition of 0.5
volumes of 7 .5 M ammonium acetate, the sample was centrifuged to remove
contaminants. The DNA was precipitated with an equal volume of isopropanol and
washed with 70% ethanol. Cosmids were electroporated into E. coli and transform ants
selected on LB / kanamycin plates. The isolated transform ants were then grown in LB
broth containing kanamycin, and the cosmids extracted using the standard alkaline lysis
method (Sambrook et ai. , 1989). Plasmid DNA was extracted from M. smegmatis in the
same manner.
35
2.2.3 Isolation of genomic DNA from mycobacteria
The m ycobacterial species and strains used in this study are l isted in Table 2. 1 .
Mycobacterial cultures were routinely grown in 100 ml of 7H9 Middlebrook medium
supplemented with ADC enrichment (Difco, Detroit, USA) with constant shaking at
370C. Cultures were grown for approximately 3 days or 3 weeks, for rapid- and slow
growing mycobacteria, respectively. Prior to DNA extraction, cultures were heat treated
at 700C for 2 hrs. When cool, streptomycin was added to a final concentration of 100
j.l.g/ml and cultures were left to stand for one hour. Cells were harvested by
centrifugation at 5,000 x g for 20 min, washed in pre-lysis solution (25% sucrose, 50
mM Tris pH 8 .0, 25 mM EDTA), and incubated at 370C for 2 hrs in 1 .5 ml lysis solution
(500 j.l.g/ml lysozyme in pre-lysis solution) .. A 4.0 ml solution containing 1 00 mM Tris
pH 8 .0, 1 .0% SDS and 400 j.l.g/ml proteinase K was added and incubation continued at
550C for 2 hr. After addition of 0. 1 ml of 5 M NaCI, the DNA was extracted with
phenol-chloroform, and ethanol precipitated at -20oC for 30 m in. The DNA was
centrifuged at 1 2,000 rpm for 40 min in a microcentrifuge, washed in 70% ethanol,
vacuum dried and resuspended in 0.2 ml of TE buffer (Appendix 1 ) .
36
- - -------
2 . 3 DNA Manipulations and Library Construction
2.3.1 Manipulations involving DNA
Ligations, restriction digests and electrophoresis of DNA were all carried out as described
in Sambrook et al ( 1989) in accordance with the manufacturers' instructions. Restriction
endonucleases and T4 DNA ligase were purchased from Boehringer Mannheim Ltd,
Mannheim, Germany.
2.3.2 Construction of an M. bovis BCG library of phoA fusions
E. coli DH I OB cells were transformed with the pJEM l l plasmid vector. Large scale
purification of pJEM 1 1 was carried out by cesium chloride / ethidium bromide
equilibrium centrifugation, based on a method described in Current Protocols In
Molecular Biology (Heilig et al. , 1 994). Cultures of E. coli (pJEM l l) were grown
overnight in LB medium ( 1 50 ml) containing 20 �g/ml kanamycin. The cells were
pelleted by centrifugation at 5,000 rpm for 20 mins at 40C in a G SA rotor (Sorvall RC5
Cenuifuge, Du Pont). Following repeated washing with TE buffer, the cells were
resuspended in 1 2 ml of 25% sucrose / 50 mM Tris / 40 mM EDTA (pH 8.0)
supplemented with 1 .25 mglml lysozyme and 1 .5 �glml RNAse and incubated on ice for
1 5 mins. A 7 .5 ml volume of 250 mM EDTA (pH 8.0) was added and the cells were
incubated on ice for 15 mins. The cells were lysed by addition of 2.5 ml of 5% Triton X-
100 / 50 mM Tris / 0.2 M EDTA (pH 8.0) and left on ice for a further 45 mins. Insoluble
cellular debris was pelle ted by centrifugation (Sorvall SS34 rotor, 1 5,000 rpm for 90
mins at 40C). The supernatant was incubated at 650C for 1 5 mins and then centrifuged at
7,000 rpm for 1 5 mins at 4oC, using an SS34 rotor. The supernatants were collected and
1/3 volume of 40% polyethylene glycol / 2 M NaCI added to precipitate the DNA. The
DNA was pelleted, resuspended in 15 ml TE buffer, and stored at 40C overnight. After
warming the DNA solution to RT, 12.5 g of CsCI was added slowly while stirring. A
37
blank solution of 50 g CsC! per 60 ml TE was made to top up the DNA solution to the
neck of the ultra-centrifuge tube (Nalgene Ultra Plus, Nalge Nunc International,
Rochester, New York) and provide a balance tube. Ethidium bromide was added to both
the DNA solution and the blank at a concentration of 0.67 mg/ml. Equilibrium
centrifugation was carried out using a Type Ti70 fixed angle in a Beckman L8-70
Ultracentrifuge at 62,000 rpm for 22 hrs 15 mins. The speed of the ultracentrifuge was
reduced to 40,000 rpm before stopping after a total of 24 hrs. Under UV illumination,
the ultracentrifuge tube was punctured with a 2 1 gauge needle just below the concentrated
plasmid DNA band (below the chromosomal DNA band), and the plasmid DNA
collected. The pJEM l l plasmid DNA was washed with an equal volume of TE-saturated
isopropanol, and the isopropanol layer, containing the ethidium bromide, was discarded.
After four washes, 3 ml TE buffer and 4 ml isopropanol were added to 1 ml of plasmid
DNA and the sample frozen at -20oC for 75 mins. The DNA was pelleted at 14,000 rpm
for 20 mins at 40C in a microfuge (Centrifuge 5402, Eppendorf). The DNA pellet was
washed twice with 70% ethanol and resuspended in 200 �l TE buffer. Approximately 1
�g of CsCI-purified pJEM 1 1 vector was linearised with the restriction enzyme Bam HI
and dephosphorylated using E. coli alkaline phosphatase (Pharmacia Biotech, Uppsala,
Sweden) according to the manufacturer's instructions.
Genomic DNA was isolated from M. bovis BCG (Pasteur) and partially digested with
Sau 3AI( - 1 U per 2 .5 �g DNA) for 2.5 mins at 370C. Following electrophoresis, DNA
fragments between 200 and 3000 base pairs were excised from a 1 % low melting point
agarose gel and purified using GELase (Epicentre Technologies, Madison, Wisconsin)
according to the manufacturer's instructions. The M. bovis BCG DNA fragments were
ligated into the compatible Bam HI site of pJEM I I with T4 DNA ligase for 1 6 hrs at
4oC.
38
2 . 4 Transformations
2.4.1 Transformation of E. coli
E. coli ElectroMAX DH l OB cells (GIBCO BRL, Life Technologies, Inc. ) were
transformed with purified plasmid DNA by electroporation according to the
manufacturer's instructions. The following electroporation conditions were used with the
B io-Rad Gene Pulser apparatus (Bio-Rad Laboratories, Richmond, CA): cells with a 0.2
cm electrode gap, 2.5 kV, 25 1lF capacitance, and 200 ohms resistance.
2.4.2 Transformation of M. smegmatis
M. smegma tis mc2 155 cells were grown to stationary phase in Middlebrook 7H9/ADC
broth containing 0.055% Tween-80 at 370C in an orbital shaker. Cultures were diluted
1 :200 with 200 ml fresh medium and grown to mid-log phase (approximately 1 6- 1 8 hrs).
The cultures were chilled on ice for 30 min then washed twice with ice cold distilled
water by centrifugation at approximately 1 100 x g for 10 min at 4OC. Cells were washed
once with ice cold 10% glycerol and resuspended to a final volume of 1 .5 to 2.0 ml.
Transformation of 100 III aliquots of competent M. smegmatis cells was carried out by
electroporation. The electroporation conditions were the same as described for E. coli
except transfOlmed M. smegmatis were incubated for 3 hrs at 37°C instead of I hr prior
to plating on selective media.
39
2 . 5 DNA Sequencing and PCR-Based Amplification
2.5.1 PCR cycle sequencing
The DNA inserts from the pJEM l 1 plasmid constructs were partially or completely
sequenced using the Perkin Elmer AmpliCyc1e™ Sequencing Kit according to the
manufacturer's instructions, using [a-33PJ-dCTP label. Labelled DNA fragments were
separated on 6% polyacrylamide I urea sequencing gels using BRL Model S2 sequencing
gel electrophoresis apparatus (Life Technologies, Inc., Gaithersburg, MD). Plasmid
DNA of high purity was prepared from recombinant E. coli using the QIAprep-spin
Plasmid Miniprep Kit (QIAGEN, Hilden, Germany). DNA primers were designed to the
non-coding strand of phoA (plimer pJ6) and the coding strand of the terminator sequence
(plimer pJ7) on the pJEM 1 1 vector. Sequencing was carried out in a stepwise manner by
designing new primers (Appendix 2B and C) to the newly acquired sequences. Primers
were designed and tested for suitability using GeneWorks (release 2.45, IntelliGenetics,
Inc. California) PCR Primer Report. Sequencing contigs were built up using the
Gene Works Sequencing Project document.
2.5.2 Sequence analysis
DNA and Protein databases were searched using the BLAST algorithm (Altschul et ai. ,
1 990) to identify similarities between the insert DNA and previously identified
sequences. The BLAST + BEAUTY algorithm (Worley et ai. , 1995) was also used to
search databases for sequence similarities and structural motifs. A DNA database
containing sequence data from the Sanger Centre (Tuberculosis BLAST server;
http ://www.sanger.ac.uklProjects/ M_tubercuiosislbiascserver.shtml) was also searched
using M. bovis I M. bovis BCG insert sequences to identify similarities to the M.
tuberculosis genome. The Sanger Centre database contains M. tuberculosis sequences
submitted to the EMBL-database, unsubmitted finished sequences, and unfinished
40
sequence contigs over a 1000 bases. The GeneWorks programme (release 2.45,
IntelliGenetics, Inc. California) was used for all other sequence analyses.
2.5.3 peR amplification of known genes from the M. bovis cosmid
library
PCR oligonucleotide primers were designed with the aid of the GeneWorks software
package based on the DNA sequences of genes coding for known mycobacterial secreted
antigens (Appendix 2A). The PCR reactions were carried out using Taq D N A
polymerase (Boehringer Mannheim) according to the manufacturer's instructions, in the
presence of 1 .5 mM MgCl2 in a 50 III volume. The following cycling parameters were
used: 950C for 3 min, followed by 30 cycles of 950C for 30 sec, 600C for 30 sec, and
72°C for 60 sec, with an extended elongation step (720C for 5 m in) for the final cycle.
Amplification reactions were carried out in a Perkin Elmer 9600 PCR machine.
The PCR amplification products ( 10 III samples of each PCR reaction) were analysed by
electrophoresis on a 1 .2% agarose gel. The molecular size of the amplification products
was estimated by comparison with <!>X 174 RF DNA / Hae III fragments (GIBCO BRL,
Life Technologies).
4 1
2 . 6 DNA Hybridisations
2.6.1 Isolation and labelling of DNA probes
Plasmid DNA was isolated and purified from recombinant Escherichia coli DHIOB cells
by alkaline lysis (Sam brook et aI. , 1989). The DNA inserts were purified from the
pJEM 1 1 vector by digestion with the restriction enzymes Kpn I and Apa I. Following
electrophoresis, the DNA fragments were eluted from a 1 % low melting point agarose gel
using a GELase kit (Epicentre Technologies Corporation, Madison, Wisconsin).
Restriction fragments were labelled with [a.32p]-dCTP using the RTS RadPrime DNA
labelling system (GIBCO BRL, Life Technologies). This system is based upon the
random primer labelling method and produces probes with specific activities of greater
than 1 09 cpm/Jlg (Feinberg and Vogelstein, 1983). The nick-translated DNA fragments
were separated from unincorporated radiolabelled nucleotides using a NICK column
(Pharmacia Biotech, Uppsala, Sweden).
2.6.2 Southern blot analysis
DNA restriction digests were size-fractionated on 1 .0% agarose gels by electrophoresis
and blotted onto nylon membrane (Hybond-N, Amersham International, U.K.). The
DNA was fixed to the nylon membrane by U.V. irradiation. Hybridisation was carried
out using Rapid-hyb buffer (Amersham) as recommended by the manufacturer. The
membrane was incubated at 650C for 4 hr in the rapid hybridisation buffer containing 50-
100 JlI of [a.32P]-labelled probe. Washes were carried out in 2 x SSC (Appendix 1 ),
0. 1 % SDS at RT for 1 0 min, followed by 1 x SSC, 0. 1 % SDS at 650C for 2 x 1 5 min.
To re-use Southern blots, the membranes were incubated at 450C for 30 min in 0.4 M
NaOH and then transferred to a solution containing 0. 1 x SSC, 0. 1 % SDS, 0.2 M Tris
HCI pH 7.5 for 1 5 min. Autoradiographs were prepared by exposure to X-ray film
42
(Kodak X-Omat AR) at -75°C for at least 1 6 hrs in the presence of a single intensifying
screen.
2.6.3 Colony hybridisation
Colony hybridisation was carried out using nylon membrane discs (Hybond-N+ Nucleic
Acid Transfer Membrane discs, 0.45 Ilm removal rating; Arnersham, Little Chalfont,
England). Recombinant M. smegmatis (cosmids) colonies were patched onto nylon
membrane discs placed on top of 7H l O agar plates containing Middlebrook OADC
enrichment (Difco, Detroit, USA) and 30 Ilg/ml kanamycin. Following overnight
incubation at 37°C, the M. smegmatis recombinants were lysed by floating discs on a
solution containing 0.5 M NaOH and 1 .5 M. NaCl. Membrane discs were neutralised in
1 M Tris / 1 . 5 M NaCl / pH 7.5 and the DNA was fixed by placing discs in a microwave
oven for 1 min.
43
2 . 7 Protein Preparations
2.7.1 Preparation of culture filtrates
The M. bovis cosmid library was constructed as described previously (Wilson and
Collins, 1 996) and kindly provided by Dr. D.M. Collins. High molecular weight M.
bovis genomic DNA was partially digested with Sau 3A1and the fragments separated by
centrifugation on a 10-40% sucrose density gradient. Fragments of 30-40 kb were
ligated into the compatible Bam HI cloning site of the pYUB 1 8 vector, packaged into
phage particles and electroporated into E. coli. The cosmid library was extracted from the
pooled kanamycin-resistant transformants and electroporated into M. smegmatis.
Approximately 350 M. smegmatis recombinants were patched onto 7 H l O agar plates
containing Middlebrook OADC enrichment (Difco, Detroit, USA) and 30 Ilg/ml
kanamycin and stored as glycerol stocks. Cosmid DNA was extracted from all 350
clones and used to transform E. coli by electroporation to facilitate analysis.
Recombinant M. smegmatis were cultured in a modified version of Middlebrook 7H9
(Difco, Detroit). The broth was made up as a minimal medium (MM) by leaving out the
ADC enrichment and tween-80. Following autoclaving, the medium was supplemented
with 0.2% dextrose. Cultures were initially grown to stationary phase in 5 ml of MM +
dextrose containing 20 Ilg/ml kanamycin at 370C and then inoculated 1 :40 into fresh
medium and grown for 5 days. The cells were removed by centrifugation at 5000 x g for
10 min and the culture supernatant filtered through a 0.2 Ilm membrane (Millipore,
Bedford). The culture fIltrate (CF) was then concentrated on a 'centriplus' filter with a 3
kDa cut-off (Amicon Division, Beverly, USA) to a final volume of approximately 1 .5 m!.
Protein concentrations were determined using a BCA colouninetric m icro assay kit
(Pierce, Rockford).
44
Culture filtrate of M. bovis BCG (Pasteur) was prepared based on the method described
by GuIle et al ( 1995). Briefly, M. bovis BCG was grown in modified Sauton's medium
on an orbital shaker for 14 days. Following removal of bacteria by centrifugation and
filtering of the supernatant through a 0.2 �m membrane (Sartolab P20, Sartorius AG,
Goettingen), the CF was concentrated in a stirred ultrafiltration cell with a 10 kDa cut-off
filter (YMlO: Amicon Division, Beverly, USA) to a final volume of approximately 2.5
m!. The concentrated CF was washed three times with double-distilled water, and Tris
HCI (pH 8.8) and MgCl2 were added to final concentrations of 20 mM and 2 mM,
respectively. The CF was then treated with 2 �glml DNAse I and 1 �glml RNAse for 10
mins at RT.
To prepare CF samples of recombinant M. smegmatis clones (pM21 and pJEM 1 1 ) from
1 L cultures, recombinants were initially grown in 10 ml of Middlebrook 7H9-ADC
(Difco, Detroit) containing 20 �g/ml kanamycin at 370C on an orbital shaker for 4 days.
Cultures were washed three times with 7H9-MM supplemented with 0.2% dextrose and
kanamycin at 37°C by centrifugation at 3000 x g for 1 0 min at RT. The washed
recombinant M. smegmatis were inoculated into 1 L of fresh 7H9-MM medium
containing dextrose and kanamycin and grown incubated with constant shaking at 370C
for 7 days. Cells were pelleted by centrifugation at 5000 x g for 10 min and the culture
supernatant filtered through a 0.2 �m membrane (Sartolab P20, Sartorius AG,
Goettingen). The CF was concentrated using a stirred ultrafiltration cell with a 10 kDa
cut-off filter to a final volume of approximately 2.5 ml.
2.7.2 Preparation of cell Iysates
E. coli lysates
Recombinant E. coli clones were grown in LB culture medium supplemented with 20
�g/ml kanamycin at 370C on an orbital shaker for approximately 7 hrs. Cultures were
inoculated 1 : 1 000 into 25 ml of fresh medium and grown overnight. The cells were
45
washed twice with 25 mM Tris-HCI / 2 mM MgCl2 (pH 7.0) buffer by centrifugation at
3000 x g for 1 0 min at 4oC, and resuspended in 5.0 ml of wash buffer. Cells were
sonicated on ice for 4 x 1 min at 30 sec intervals using an XL-2020 Sonicator (Heat
Systems Inc., Farmingdale, NY) on setting 3.5. Insoluble debris was pelleted at 1 4,000
rpm for 1 0 min at 4°C in a microfuge and the supernatants collected. When necessary,
proteins were concentrated by precipitation with 8 volumes of acetone at -20OC overnight
(Powell, 1 994). A non-recombinant E. coli DH l OB lysate control sample was prepared
according to the above protocol from a 25 ml culture in the absence of kanamycin.
M. smegmatis lysates
Lysate samples of recombinant M. smegmatis clones (pM2 1 and pJEM l l ) prepared from
1 L cultures were grown as described in section 2.7. 1 . Cell pellets were resuspended in
20 ml fresh 7H9-MM medium containing 100 Jlglml cycloserine and incubated at 370C
overnight. The cells were washed twice in phosphate buffered saline (PBS; pH 7 .4) by
centrifugation at 3000 x g for 10 min at 4°C, and resuspended in 5.0 ml of PBS
containing 10 Jlglml lysozyme. Cells were sonicated on ice for 5 x 1 min at 30 sec
intervals using an XL-2020 Sonicator with microtip on setting 3.5. Approximately 200
units of DNase I (BRL, Life Technologies, Auckland) and 40 JlI of 500 mM EDT A (pH
8 .5) were added to the cell lysates. Insoluble cellular debris was removed by
centrifugation at 14,000 rpm for 10 min at 40C in a microfuge.
Recombinant M. smegmatis lysate samples were also prepared from cells scraped from
solid media. The M. smegmatis recombinants were streaked from glycerol stocks onto
LB / kanamycin plates and grown at 370C for three to four days. Colonies were scraped
from plates in a 1 .5 ml volume of PBS (pH 7.4) using a glass rod. The cells were
pelle ted in a microfuge and the supernatants (extra-cellular wash samples) removed. The
M. smegnUltis cells were washed twice with PBS (pH 7 .4) and resuspended in 1 ml of
PBS. Crude cell lysates were prepared by sonication on ice for 2 x 1 5 secs at 1 5 sec
intervals using an XL-2020 Sonicator with microtip on setting 3.5. Samples (20 JlI)
46

- - -- - - ------
were boiled in SDS-polyacrylamide gel loading buffer (Appendix 1 ) , pelleted in a
microfuge, and the supernatants analysed on SDS-polyacrylamide gels.
47
2 . 8 Protein Analysis
2.8.1 Estimation of protein concentration
The protein concentrations of CFs from recombinant M. smegmatis and M. bovis BCG
were estimated in duplicate using the BCA Protein Estimation Assay (Pierce, Rockford)
according to the manufacturer's instructions. The BCA assay is based upon a colour
change resulting from a complex formed between Cu+ and bicinchoninic acid (Smith et
ai. , 1 985). The Cu+ is produced by oxidation of cysteine, tyrosine, and tryptophan
residues, and by a temperature-dependent reaction of peptide bonds with Cu2+.
2.8.2 Alkaline phosphatase assays .
Crude extracts of recombinant M. smegmatis were prepared from freshly streaked
colonies scraped from LB I kanamycin plates in a small volume of phosphate buffered
saline (PBS). Cells were pelleted by centrifugation and the supernatants removed for
assay. Cells were washed twice with PBS then resuspended in 5 ml 1 M Tris-HCl (pH
8.0) and disrupted for 2 x 1 5 secs at 1 5 second intervals using a sonicator with microtip
on 3.5 setting. Alkaline phosphatase assays were carried out on sonicated extracts based
on a method previously described by Kremer et al ( 1995). Sonicated extracts ( 1 00 pI
aliquots) were assayed in 900 JlI of 1M Tris-HC1 (pH 8.0) and 1 00 JlI of 20 mM p
nitrophenylphosphate (Sigma, St. Louis). Enzyme reactions were carried out in triplicate
at 37°C in the dark. Assay reactions were stopped by the addition of 100 III of 1 M
K2HP04, and the optical density was measured at 420 nm. A standard curve was
constructed over a range of 5 .0 x 10-5 to 1 .7 x 1 0-3 PhoA units using E. coli alkaline
phosphatase (Pharmacia Biotech, Uppsala, Sweden). The protein concentration of each
sample was measured to allow for direct comparison between samples.
48
Alkaline phosphatase activity was also detected, but not quantified, in recombinant E. coli
and M. smegmatis colonies grown on solid media containing the chromogenic substrate
5-bromo-4-chloro-3-indolyl phosphate (XP) (Sigma, St. Louis).
2.8.3 Protein analysis by SDS-PAGE and Western blotting
Protein separation was carried out on 8.0% or 10.0% polyacrylamide gels (SDS-PAGE)
with a 5% stacking gel of pH 6.8. The electrophoresis buffer consisted of 192 mM
glycine, 25 mM Tris and 0.03% SDS (Laemmli, 1970). Broad range molecular weight
proteins were used as size standards (Bio-Rad Laboratories, Auckland). Proteins were
visualised by staining with Coomassie Brilliant Blue R-250, followed by silver-staining.
For Western blotting experiments to detect PhoA fusion proteins, protein samples were
run on an SDS-polyacrylamide gel and transferred onto nitrocellulose membranes (0.2
J..lm pore size; Micro Filtration Systems, USA) using a mini-Transblot apparatus (Bio
Rad Laboratories, Auckland) at 20 V for 60 mins. Approximately 60 J..lg and 1 20 J..lg of
lysate samples from recombinant E. coli and M. smegmatis, respectively, and 1 50 J..lg of
the recombinant M. smegmatis CF samples were loaded on the gels. Rainbow molecular
weight standards (Amersham) were run on gels alongside protein samples. The
membranes were incubated in a 2% milk powder solution in PBS / 0. 1 % Tween-20 (PBS
T) for 2 hrs at RT to block sites without bound protein. Membranes were incubated with
rabbit anti-E. coli alkaline phosphatase IgG (# 200-41 34, Rockland, Gilbertsville, USA)
diluted 1 :5 ,000 at 40C overnight. Following washing with PBS-T, membranes were
incubated with goat anti-mouse IgG-alkaline phosphatase conjugate (# 1 00H-8826;
Sigma, St Louis) diluted 1 :2,500 at RT for 1 hr. The membranes were washed twice
with PBS-T and once with substrate buffer ( 1 00 mM Tris / 100 mM NaCl / 10 mM
MgCI2). Protein bands detected by the antibody were visualised by the addition of 50
J..lglml XP and 0.01 % nitro-blue tetrazolium as substrates (Sigma, St. Louis).
49

For the Western blot experiment used to detect MPB64 in CF samples from M. bovis and
recombinant M. smegmatis, rabbit anti-MPB64 polyclonal sera (kindly supplied by P.R.
Wood, CSIRO, Parkville, Australia) was used at a 1 :500 dilution, and goat anti-rabbit
IgG alkaline phosphatase conjugate (# A 14 1 8; Sigma, St Louis) was used at a 1 :2,500
dilution.
50
2 . 9 Immunoassays
2.9.1 Immunisation of cattle with M. bovis BeG
All cattle used in this study were selected on the basis of low responses to M. smegma tis
CF and avian purified protein derivative (PPD-a), as measured by lymphocyte
proliferation. Four male yearling Freisians (animals 5, 12 , 1 5 and 2 1 ) were injected
subcutaneously on two occasions, 1 0 weeks apart, with approximately 1 05 c.f.u. of M.
bovis BCG (Pasteur) in PBS. Animals 5 and 12 were given a third immunisation 26
weeks after the second immunisation, as their immune responses to M. bovis BCG CF
had diminished. Control cattle were age and sex-matched non-immunised animals.
2.9.2 Lymphocyte proliferation assays
Peripheral blood mononuclear cells (PBMCs) were separated from heparinised blood
samples by density centrifugation over lymphoprep (density = 1 .077 glml; Nycomed
Ph arm a As. , Oslo, Norway). The PBMes were washed by centrifugation three times in
PBS and resuspended at a concentration of 2 x 10⁶ / ml in supplemented RPMI- 1 640
culture medium (Gibco BRL, Auckland, New Zealand) (GuIle et aI. , 1995). The
PBMCs were cultured in quadruplicate wells of 96-well flat-bottomed micro titre plates
(Nunc, Roskilde) in the presence of recombinant M. smegmatis culture filtrate proteins,
in a total volume of 200 �l. The cells were incubated at 370C in a humidified atmosphere
of 5% C02 for 5 days. Proliferation was detected by pulsing each well with 0.5 �Ci of
[3H] thymidine (Amersham, Sydney, Australia) for the final 1 6 hrs. Cells were
harvested on to glass fibre filter-mats (Pharmacia, Turku, Finland) and the incorporated
radioactivity measured in an LKB 1 205 Betaplate liquid scintillation counter. Results
were expressed as the mean counts per minute (cpm), or as stimulation indices (SI),
which are the mean cpm of replicate stimulated wells divided by the cpm of non-
5 1
stimulated wells. Values outside the median value of replicate wells +/- 50% were
disregarded when calculating the mean cpm and SI as recommended (Stone et ai. , 199 1 ).
2.9.3 IFN-y assays
Peripheral blood mononuclear cells were prepared and incubated with CF samples from
recombinant M. smegmatis as described for the lymphocyte proliferation assay.
Supernatant (50 Ill) was harvested from each of the replicate culture wells on day 5 of
incubation, pooled, and frozen at -200C until required. The presence of IFN-y in the
supernatants was determined in duplicate using a sandwich enzyme immunoassay for
bovine IFN-y (Commonwealth Serum Laboratories, Parkville, Australia) (Rothel et ai. ,
1 990).
The IFN-y concentration of the recombinant positive control IFN-y sample supplied with
the ELISA kit was determined using a standard curve of recombinant bovine IFN-y
(kindly supplied by Ciba-Geigy, Basel, Switzerland). The optical densities of sample
wells were measured at 450 nm, and the IFN-y concentrations (units/ml) calculated using
a standard curve of the IFN-y positive control sample supplied with the kit.
52
2 . 1 0 Gene Expression Studies
2.10.1 Isolation of total RNA from recombinant M. smegmatis
Recombinant M. snzegmatis (subclones 5611 and 56/2) cultures were grown at 370e to
late log phase (00 670 nm = 0.9) in LB medium supplemented with 0.5% glycerol,
0.2% Tween 80 and 20 �glml kanamycin. Total RNA was extracted from 3 ml cultures
using an RNA isolation kit (High Pure, Boehlinger Mannheim, Mannheim, Germany)
according to the manufacturer's instluctions.
2.10.2 Northern blot analysis
The RNA was electrophoresed and transferred to a nylon membrane as described in
Rueger et ai, 1 996. Approximately 15 �g of each RNA preparation was run on a 1 %
agarose-MOPS formaldehyde gel (Appendix 1 ) using 1 x MOPS running buffer
(Appendix 1 ) containing 1 mg/ml ethidium bromide. An RNA size standard (GrneO
BRL, Life Technologies) was run alongside the mycobacterial RNA samples. Following
electrophoresis, the gel was equilibrated in 20 x sse and transferred to a nylon
membrane. The RNA was fixed to the membrane by UV illumination. A 234 bp
fragment of the pel gene was generated by digestion of pM21 with Kpn I and Pvu II and
labelled as described in section 2.6. 1 . Hybridisation was carried out for 16 hrs at 650e
using 1 50 �l of [a.32PJ-Iabelled probe in approximately 7 ml of pre-warmed Rapid-hyb
buffer (Amersham International, U.K.). Two, 30 min washes at 650e were carried out
in each of the following solutions: 1 x sse / 0. 1 % SDS, followed by 0.7 x sse / 0. 1 %
SDS, and 0. 1 x sse / 0. 1 % SDS. Autoradiographs were prepared by exposure to X-ray
film (Kodak BioMax MR) at -75oe for 7 hrs in the presence of a single intensifying
screen.
53

Chapter 3:
Identification And Analysis
Of DNA Sequences Coding For
Protein Export Signals
54
3. 1 Abstract
An M. bovis BCG library of phoA -fusions was constructed using the E. coli /
mycobacterial shuttle vector pJEM l 1 . Recombinant E. coli and M. smegmatis
expressing enzymatically active PhoA fusions were identified by plating transformed cells
onto media containing the substrate XP. M. bovis BCG DNA inserts from selected blue
colonies were partially sequenced. One sequence contained an ORF identical to an M.
leprae ORF. A second ORF showed similarity to a family of high temperature
requirement serine proteases.
The PhoA fusion proteins encoded by the M. bovis BCG/pJEM l l plasmid constructs
were detected in E. coli lysate samples by probing Western blots with anti-PhoA
antibody. The antibodies detected proteins in all samples from PhoA+ recombinants.
These protein bands were of higher molecular weight than those detected in the non
recombinant E. coli lysate sample and the PhoA positive control.
PhoA fusion proteins were also examined in recombinant M. smegmatis. The antibody
detected proteins in each PhoA+ lysate sample. Culture filtrate and lysate samples
prepared from I L cultures of selected recombinant M. smegmatis were also analysed by
Western blotting for the presence of PhoA fusions. The antibody detected two protein
bands of the similar molecular weight in a recombinant M. smegma tis CF and lysate
sample. These bands were absent from control samples.
ss
3 . 2 Introduction
The secreted antigens of M. tuberculosis, M. bovis and M. bovis BeG are of particular
interest in view of their capacity to induce a protective immune response (Orme, 1 988a;
Andersen et aI. , 1 99 1 ). Exported proteins which remain attached to the cell membrane
may also play an important role in infection, during the interactions of the mycobacterium
with the host cell. In spite of their importance, relatively few exported (secreted and cell
membrane-associated) proteins have been characterised. This is primarily due to the
difficulties associated with screening large numbers of proteins and relating immune
responses to individual antigens and their coding genes. An alternative strategy is to
firstly identify genes which code for exported proteins and determine whether the gene
products possess T cell epitopes. Genes encoding such exported proteins can be
identified by creating a library of fusions to a reporter phoA gene, coding for the E. coli
periplasmic enzyme alkaline phosphatase. The enzyme is synthesised as a precursor
monomer which contains a signal peptide at the N-terminus. The signal peptide is
removed during export to the periplasmic space and two mature monomers dimerize to
form the active enzyme. As PhoA retained in the cytoplasm is enzymatically inactive
(Derman et aI. , 1 993), only PhoA fusions which contain signal peptides will be detected
in alkaline phosphatase assays.
An E. coli-mycobacteria shuttle plasmid, pJEM l l (Figure 3. 1 ), has been constructed for
the purpose of screening mycobacteria-phoA gene fusion libraries for sequences that
direct export of alkaline phosphatase (Lim et aI. , 1995). The plasmid contains both E.
coli and mycobacterial origins of replication, a truncated phoA gene (devoid of a
promoter, start codon and signal sequence) downstream of a cloning site, and a
kanamycin resistance gene as a selectable marker. This vector has been used to construct
a library of M. tuberculosis phoA fusions (Lim et aI. , 1995). Twelve inserts coding for
sequences directing protein export were identified. The open reading frames (ORFs)
included those coding for the exported 19-kDa lipoprotein, a homologue of the 28-kDa
56
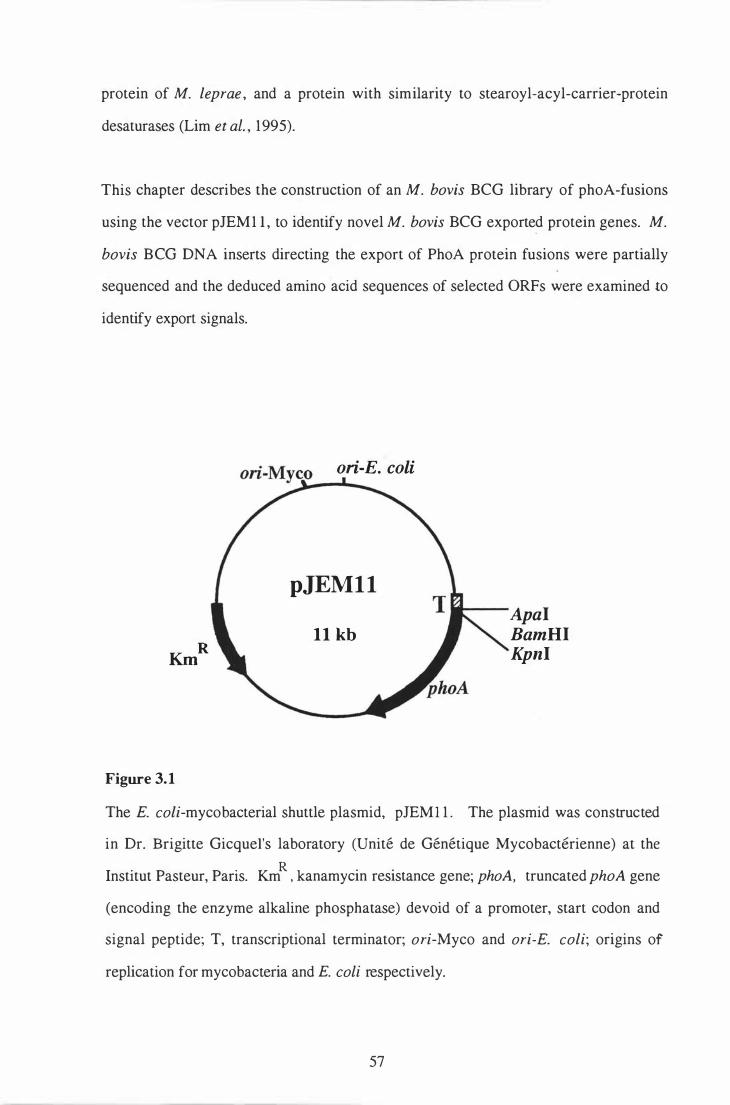
protein of M. leprae , and a protein with similarity to stearoyl-acyl-carrier-protein
desaturases (Lim et aI. , 1995).
This chapter describes the construction of an M. bovis BeG library of phoA-fusions
using the vector pJEM 1 1 , to identify novel M. bovis BeG exported protein genes. M.
bovis BeG DNA inserts directing the export of PhoA protein fusions were partially
sequenced and the deduced amino acid sequences of selected ORFs were examined to
identify export signals.
KmR
Figure 3.1
ori-E. coli
pJEMll
11 kb ApaI BamHI KpnI
The E. coli-mycobacterial shuttle plasmid, pJEM l 1 . The plasmid was constructed
in Dr. Brigitte Gicquel's laboratory (Unite de Genetique Mycobacterienne) at the
Institut Pasteur, Paris. KmR
, kanamycin resistance gene; phoA, truncated phoA gene
(encoding the enzyme alkaline phosphatase) devoid of a promoter, start codon and
signal peptide; T, transcriptional terminator; ori-Myco and ori-E. coli; origins of
replication for mycobacteria and E. coli respectively.
57
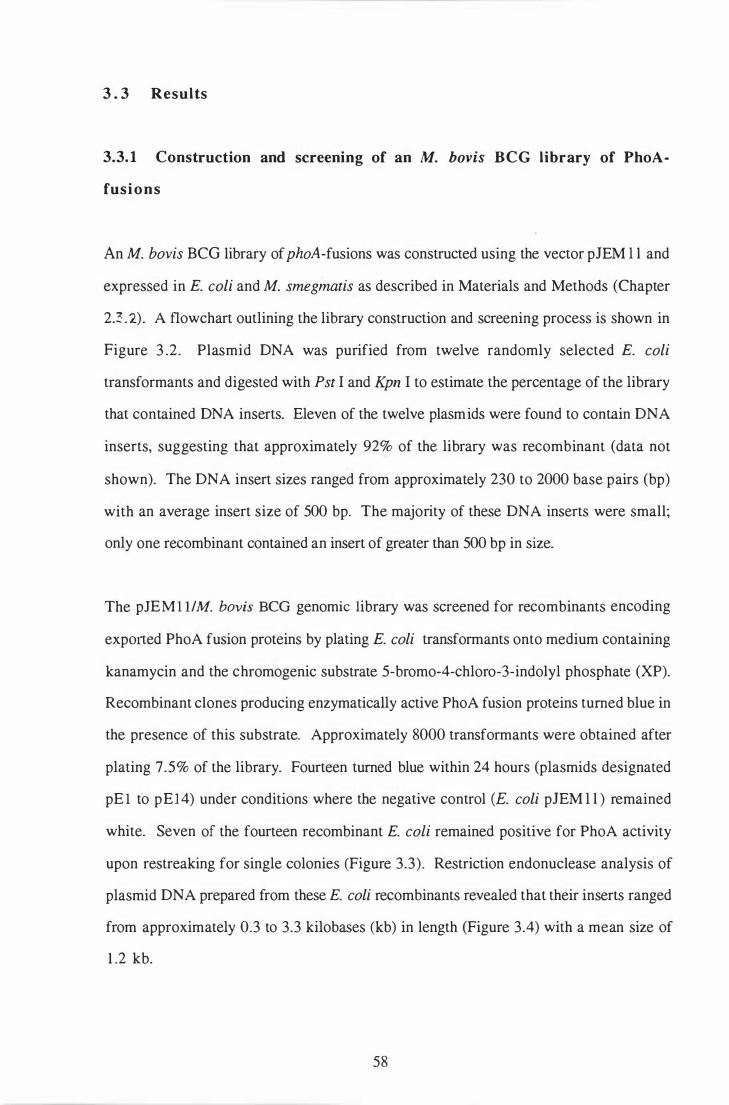
3 . 3 Results
3.3. 1 Construction and screening of an M. bovis BCG library of PhoA
fusi ons
An M. bovis BCG library of phoA-fusions was constructed using the vector pJEM l l and
expressed in E. coli and M. smegmatis as described in Materials and Methods (Chapter
2.3 . 2) . A flowchart outlining the library construction and screening process is shown in
Figure 3 .2. Plasmid DNA was purified from twelve randomly selected E. coli
transformants and digested with Pst I and Kpn I to estimate the percentage of the library
that contained DNA inserts. Eleven of the twelve plasm ids were found to contain DNA
inserts, suggesting that approximately 92% of the library was recombinant (data not
shown). The DNA insert sizes ranged from approximately 230 to 2000 base pairs (bp)
with an average insert size of 500 bp. The majority of these DNA inserts were small;
only one recombinant contained an insert of greater than 500 bp in size.
The pJEM l l/M. bovis BeG genomic library was screened for recombinants encoding
expOlted PhoA fusion proteins by plating E. coli transform ants onto medium containing
kanamycin and the chromogenic substrate 5-bromo-4-chloro-3-indolyl phosphate (XP).
Recombinant clones producing enzymatically active PhoA fusion proteins turned blue in
the presence of this substrate. Approximately 8000 transformants were obtained after
plating 7.5% of the library. Fourteen turned blue within 24 hours (plasmids designated
pE l to pE14) under conditions where the negative control (E. coli pJEM l l ) remained
white. Seven of the fourteen recombinant E. coli remained positive for PhoA activity
upon restreaking for single colonies (Figure 3.3). Restriction endonuclease analysis of
plasmid DNA prepared from these E. coli recombinants revealed that their inserts ranged
from approximately 0.3 to 3.3 kilobases (kb) in length (Figure 3.4) with a mean size of
1 .2 kb.
58
Sau 3A partial digest of M. bovis + BeG cbromosomal DNA
Size fractionate on agarose gel
Prepare
Purify DNA fragments (200-3000 bp) from agarose
ligate
plasmid DNA from each stable blue transformant (7)
Prepare plasmid DNA from
pooled white transformants
" � Transform M. smegmatis mc2155 with pJEMI l1BCG library
Select for PhoA + (blue) clones on LB / Kan / XP media
Figure 3.2
! W Purify DNA from stable PhoA+ (blue)
M. smegmatis transformants (7 )
lIDl Transform E. coli with DNA
from blue M. smegmatis
pJEMl l 0 o 0 0
BamHI digest I Dephosphorylate ,
00 Prepare D plasmid DNA
Construction of an M. bovis BCG library of phoA fusions using the
vector pJEM 1 1 , and screening for clones expressing enzymatically
active PhoA fusion proteins.
59
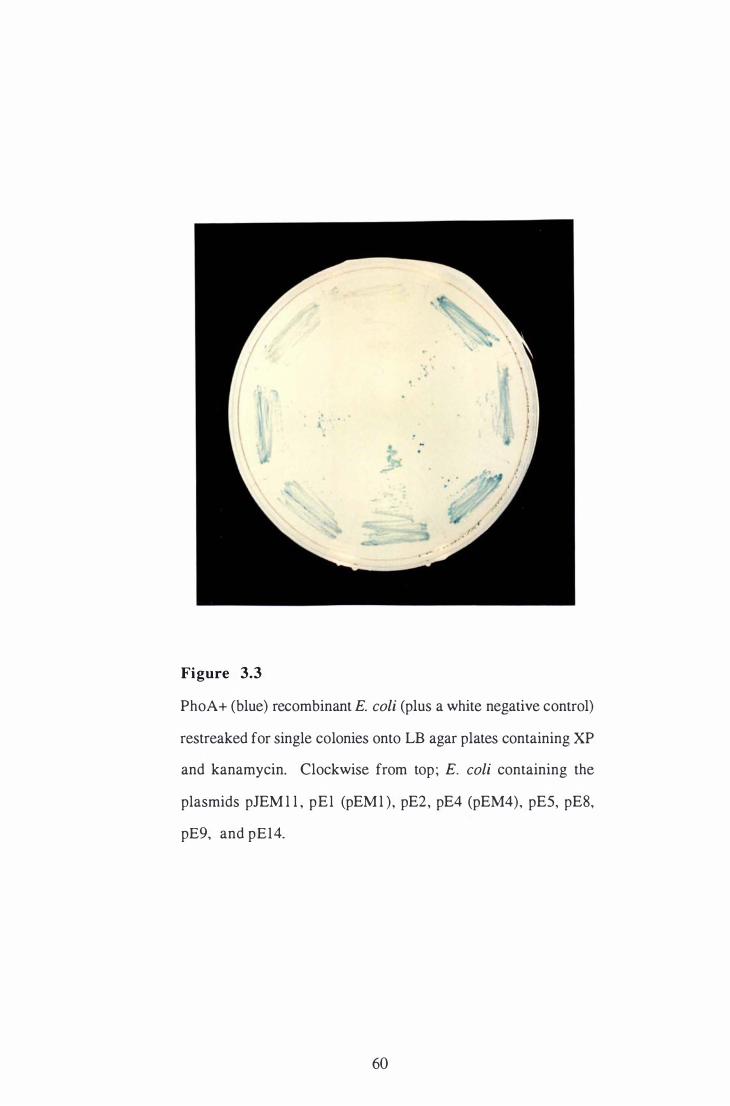
Figure 3.3
PhoA+ (blue) recombinant E. coli (plus a white negative control)
restreaked for single colonies onto LB agar plates containing XP
and kanamycin. Clockwise from top ; E. coli containing the
plasmids pJEM l l , pEl (pEM l ), pE2, pE4 (pEM4), pE5, pE8,
pE9, and pE14.
60
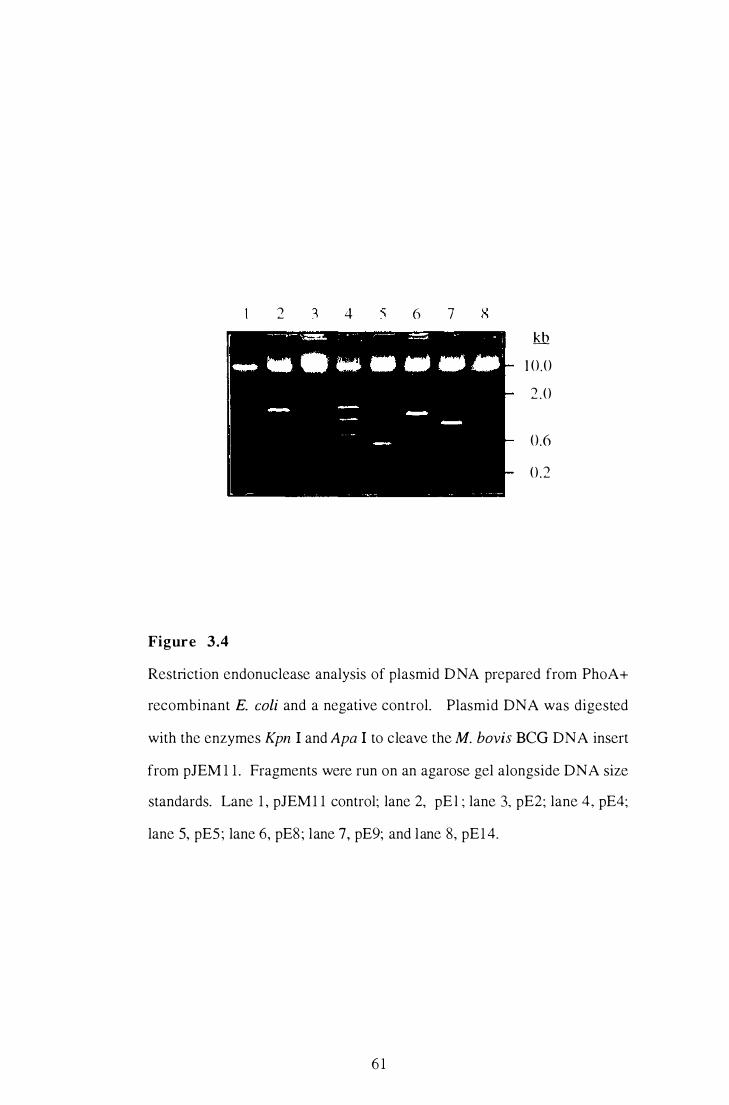
2 4 6
Figure 3.4
7 kh
1 0.0 2 . 0
0.6
0 .2
Restriction endonuclease analysis of plasmid DNA prepared from PhoA+
recombinant E. coli and a negative control. Plasmid DNA was digested
with the enzymes Kpn I and Apa I to cleave the M. bovis BeG DNA insert
from pIEM 1 1 . Fragments were run on an agarose gel alongside DNA size
standards. Lane 1 , pIEM 1 1 control; lane 2, pE l ; lane 3, pE2; lane 4, pE4;
lane 5, pES; lane 6, pE8 ; lane 7, pE9; and lane 8, pE1 4.
6 1
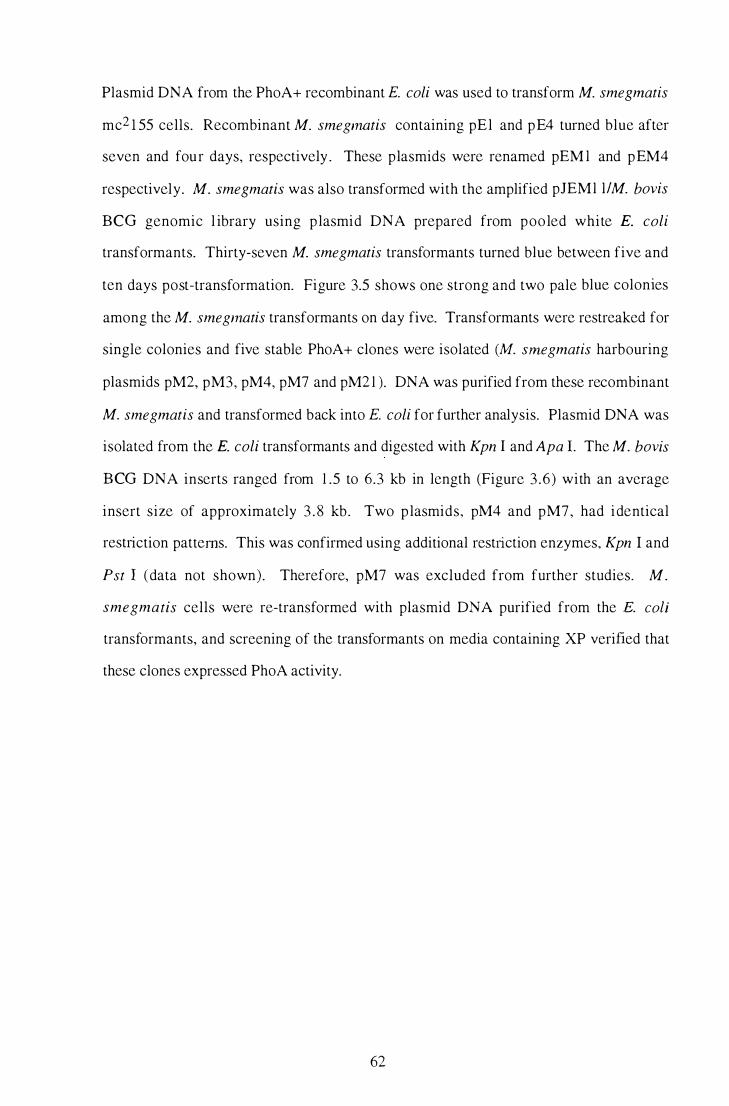
Plasmid DNA from the PhoA+ recombinant E. coli was used to transform M. smegmatis
mc2 1 55 cells. Recombinant M. smegmatis containing pEl and p E4 turned blue after
seven and fou r days, respectively . These plasmids were renamed pEM l and p EM4
respectively. M. smegmatis was also transformed with the amplified pJEMl llM. bovis
BCG genomic l ibrary using p lasmid DNA prepared from pooled white E. coli
transform ants. Thirty-seven M. smegmatis transformants turned blue between five and
ten days post-transformation. Figure 3.5 shows one strong and two pale blue colonies
among the M. smegmatis transformants on day five. Transformants were restreaked for
single colonies and five stable PhoA+ clones were isolated (M. srnegmatis harbouring
plasmids pM2, pM3, pM4, pM7 and pM2 1 ). DNA was purified from these recombinant
M. smegma tis and transformed back into E. coli for further analysis. Plasmid DNA was
isolated from the E. coli transformants and digested with Kpn I and Apa 1. The M. bovis
BCG DNA inserts ranged from 1 .5 to 6.3 kb in length (Figure 3 .6) with an average
insert size of approximately 3 . 8 kb. Two p lasmids, pM4 and pM7, had identical
restriction patterns. This was confirmed using additional restl1ction enzymes, Kpn I and
Pst I (data not shown). Therefore, pM7 was excluded from further studies. M.
smegma tis cells were re-transformed with plasmid DNA purified from the E. coli
transformants, and screening of the transformants on media containing XP verified that
these clones expressed PhoA activity.
62
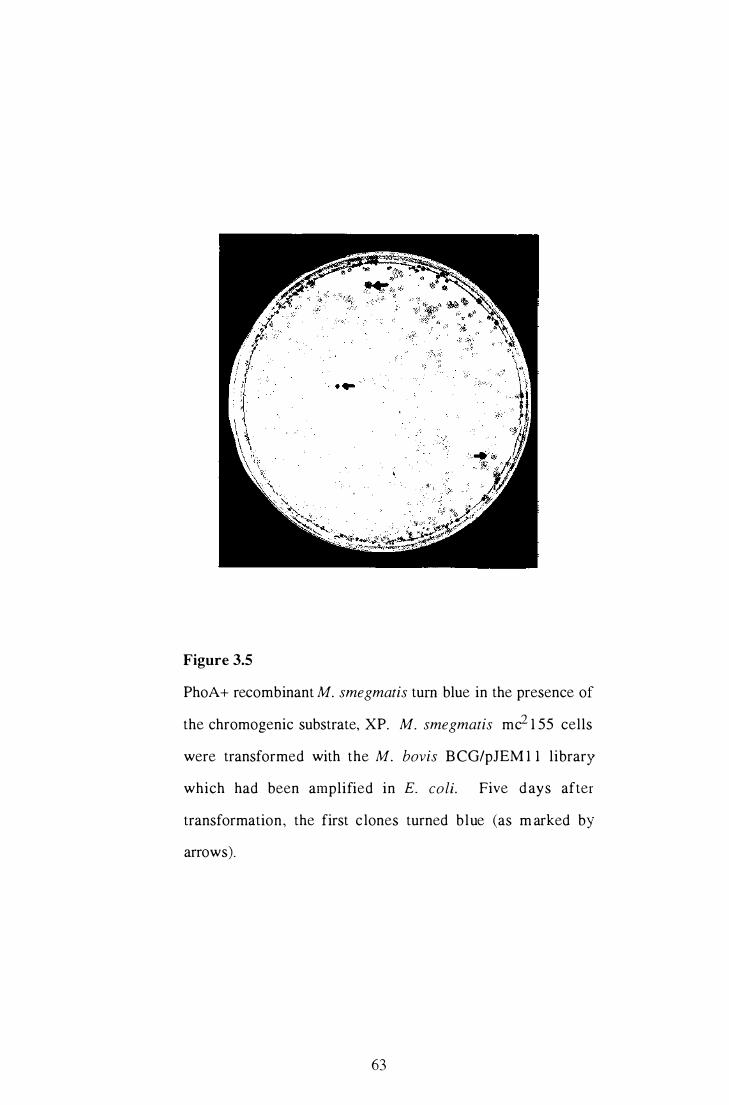
Figure 3.5
PhoA+ recombinant M. smegma tis tum blue in the presence of
the chromogenic substrate, XP. M. smegmatis mc2 1 55 cells
were transformed with the M. bovis BCG/pJEM 1 1 library
which had been amplified in E. coli. Five d ays after
transformation, the first c lones turned blue (as m arked by
arrows).
63
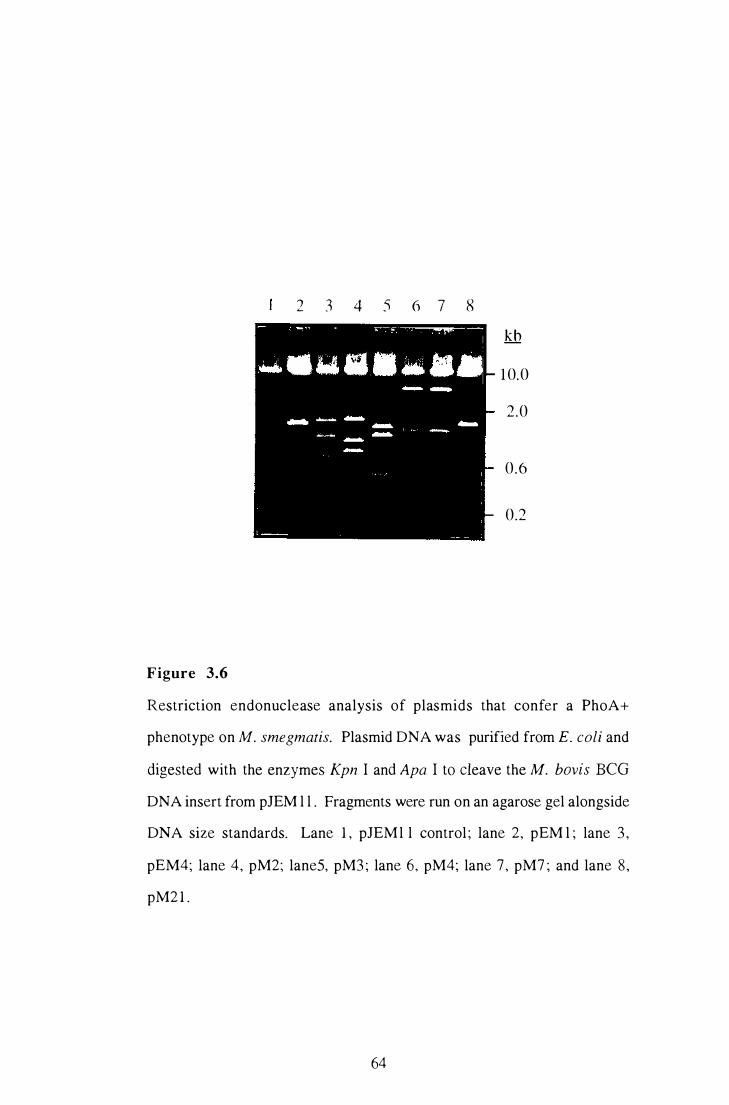
2 :1 4 S 6 7 8
Figure 3.6
kh
1 0.0
2 .0
0.6
0.2
Restriction endonuclease analysis of plasmids that confer a PhoA+
phenotype on M. smegmatis. Plasmid DNA was purified from E. coli and
digested with the enzymes Kpn I and Apa I to cleave the M. bovis BeG
DNA insert from pJEM l l . Fragments were run on an agarose gel alongside
DNA size standards. Lane 1 , pJEM l l control ; lane 2, pEM l ; lane 3 ,
pEM4; lane 4, pM2; laneS, pM3 ; lane 6, pM4; lane 7 , pM7 ; and lane 8,
pM2 1 .
64
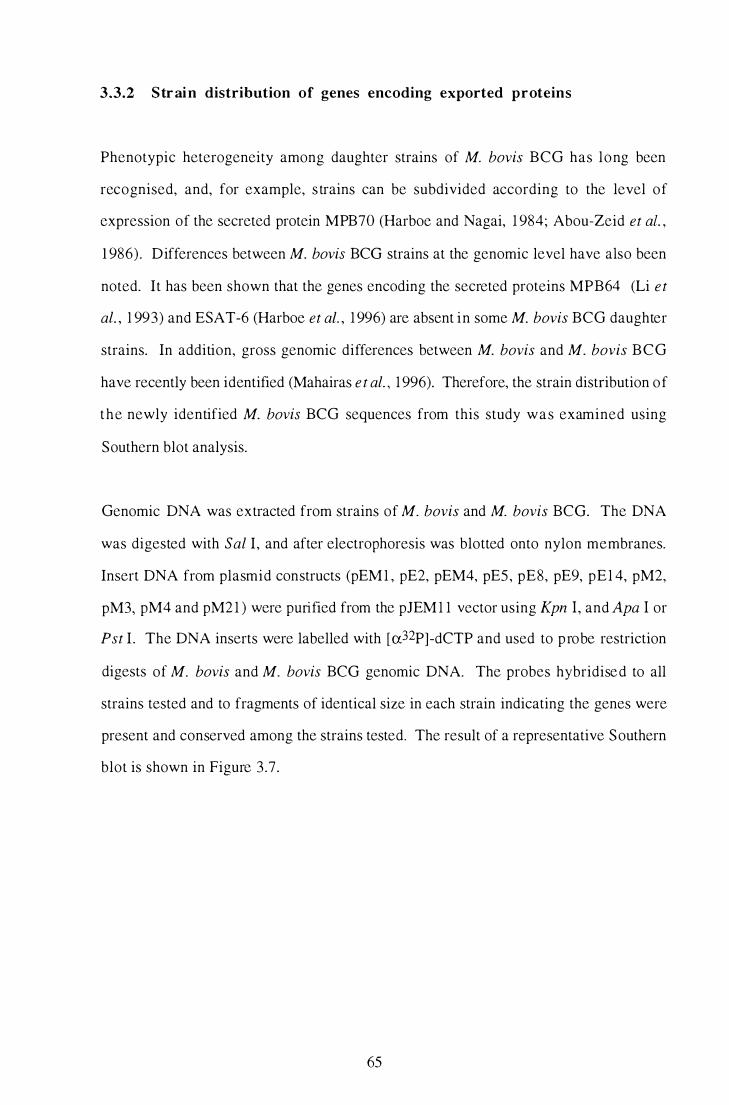
3.3.2 Str ai n distribution of genes encoding exported proteins
Phenotypic heterogeneity among daughter strains of M. bovis BeG has long been
recognised, and, for example, s trains can be subdivided according to the level of
expression of the secreted protein MPB70 (Harboe and Nagai, 1 984; Abou-Zeid et at. ,
1 986) . Differences between M. bovis BeG strains at the genomic level have also been
noted. It has been shown that the genes encoding the secreted proteins MPB64 (Li et
ai. , 1 993) and ESAT-6 (Harboe et aI. , 1 996) are absent in some M. bovis BeG daughter
strains. In addition, gross genomic differences between M. bovis and M. bovis BeG
have recently been identified (Mahairas et ai. , 1 996). Therefore, the strain distribution of
the newly identified M. bovis BeG sequences from this study was examined using
Southern blot analysis.
Genomic DNA was extracted from strains of M. bovis and M. bovis BCG. The DNA
was digested with Sal I, and after electrophoresis was blotted onto nylon membranes.
Insert DNA from plasmid constructs (pEM 1 , pE2, pEM4, pES , pE8, pE9, pE1 4, pM2,
pM3, pM4 and pM2 1 ) were pUlified from the pJEM 1 1 vector using Kpn I, and Apa I or
Pst I. The DNA inserts were labelled with [a32P]-dCTP and used to p robe restriction
digests of M. bovis and M. bovis BCG genomic DNA. The probes hybridised to all
strains tested and to fragments of identical size in each strain indicating the genes were
present and conserved among the strains tested. The result of a representative Southern
blot is shown in Figure 3.7.
65
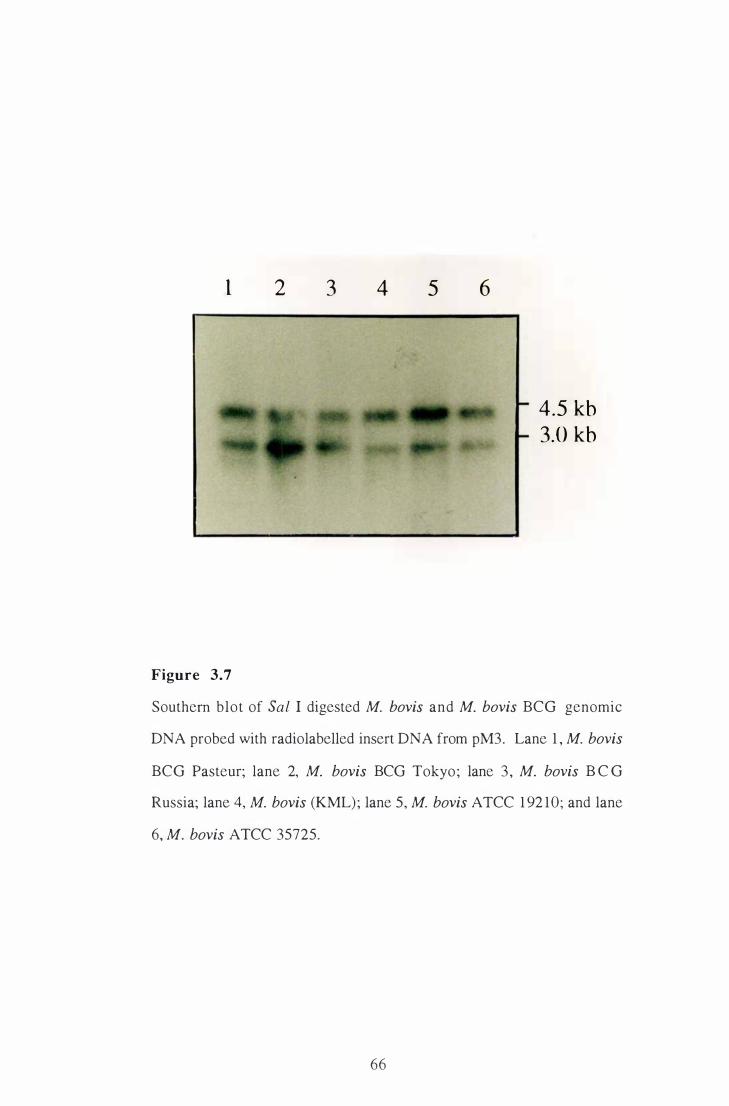
1 2 3
Figure 3.7
4 5 6
4.5 kb 3.0 kb
Southern blot of Sal I digested M. bovis and M. bovis BCG genomic
DNA probed with radiolabelled insert DNA from pM3. Lane 1 , M. bovis
BCG Pasteur; lane 2, M. bovis BCG Tokyo ; lane 3 , M. bovis B C G
Russia; lane 4, M. bovis (KML) ; lane 5, M. bovis ATCC 1 92 10; and lane
6, M. bovis A TCC 35725.
66
3.3.3 Partial sequencing of DNA inserts encoding exported proteins
Several M. tuberculosis, M. bovis and M. bovis BCG culture filtrate antigens have been
characterised through cloning and sequencing of their coding genes (refer to Table 1 . 1 ,
Chapter 1 ) . The majority of these are actively secreted from the cell and analysis of their
N-terminal amino acid sequences reveals features characteristic of the signal peptides
required for protein export. Exceptions include L-alanine dehydrogenase (Andersen et
aI. , 1 992a), superoxide dismutase (Zhang et ai. , 1 99 1 ), ESAT-6 (S<j>rensen et aI. , 1 995),
and Des (Jackson et ai. , 1 997), all of which appear to be actively secreted across the cell
membrane in the absence of a recognisable signal peptide.
The junctions between phoA and selected M. bovis BCG DNA inserts were sequenced to
identify the ORFs responsible for expression of the PhoA fusions. The deduced amino
acid sequences of selected PhoA fusions were also examined for putative signals
directing protein export. DNA and protein databases were searched using the B LAST
algorithm ( Altschul et aI. , 1990) to identify similarities between the insert DNA and
previously determined sequences. Insert DNA sequence data are presented in Appendix
3 .
Identification of a vhoA-fusion with similarity to a putative 1 .4 kb gene from M. teprae
Sequencing o f the insert DNA of pM2 1 revealed an ORF in frame with phoA . When
compared in database searches, the ORF showed approximately 75% similarity to the
nucleotide sequence of an uncharacterised M. /eprae ORF (coding sequence 28,586-
29,995) from cosmid B 1 756 (Genbank accession # U 1 5 1 80) (Figure 3 .8A) . The
putative start of the pM2 1 ORF lies 554 or 560 bases upstream from the point of fusion
to phoA depending on whether the translation initiation codon is AUG or GUG. The
amino acid sequences of the putative M. leprae 469 amino acid product (u 1756V) and the
M. bovis BeG homologue were compared (Figure 3 .8B) . B oth proteins have the
hydrophobic stretch of amino acids near their N-termini that is characteristic of signal
67
peptides (Pugsley, 1 993). The M. leprae and M. bovis BCG putative signal peptides
have several features in common with lipoprotein signal peptides ; (a) a cysteine residue
immediately after a potential signal peptidase cleavage site, (b) hydrophobic residues
within the l iN" domain, and (c) lack of a glycine or proline residue that is typically found
at or around position -6 with respect to the cleavage site. A homology search using the
B LAST algorithm (Altschul et al. , 1 990) , combined with the BEAUTY algorithm for
predicting structural motifs (Worley et ai. , 1 995), identified prokaryotic membrane
lipoprotein lipid attachment consensus sites in both the M. leprae and M. bovis BeG
sequences, suggesting that these putative proteins might be exported lipoproteins. A
putative ribosomal binding site was observed upstream of the M. bovis BCG ORE
68
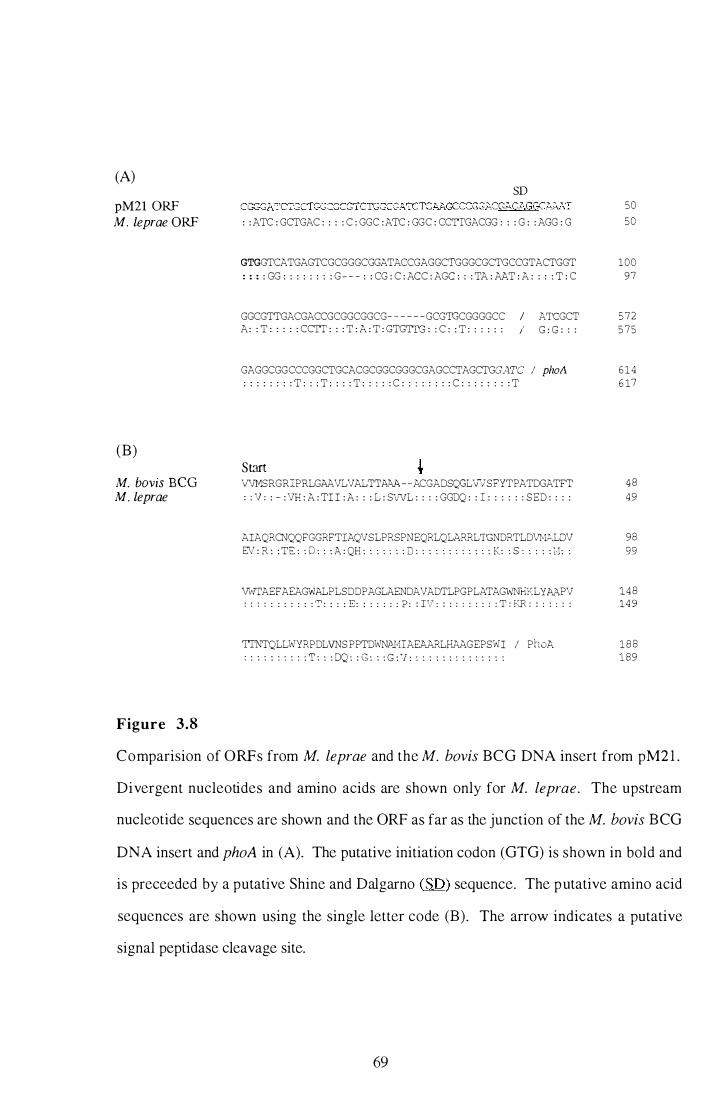
(A)
pM21 0RF M. teprae ORF
(B)
M. bovis BeG M. teprae
Figure 3.8
SD CGGGATCTGCTGGCGCGTCTGGCGATCTGAAGCCCGGACGAGAGGCAAAT
: : ATC : GCTGAC : : : : C : GGC : ATC : GGC : CCTTGACGG : : : G : : AGG : G
50
50
GTGGTCATGAGTCGCGGGCGGATACCGAGGCTGGGCGCTGCCGTACTGGT 1 0 0
: : : : GG : : : : : : : : G- - - : : CG : C : ACC : AGC : : : TA : AAT : A : : : : T : C 97
GGCGTTGACGACCGCGGCGGCG- - - - - -GCGTGCGGGGCC / ATCGCT 5 7 2
A : : T : : : : : CCTT : : : T : A : T : GTGTTG : : C : : T : : : : : : / G : G : : : 5 7 5
GAGGCGGCCCGGCTGCACGCGGCGGGCGAGCCTAGCTGGATC / phoA 6 1 4
: : : : : : : : T : : : T : : : : T : : : : : C : : : : : : : : C : : : : : : : : T 6 17
Start v\TMSRGRIPRLGAAVLVALTTAA�--ACGADSQGLvvSFYTPATDGATFT
: : V : : - : VH : A : TI I : A : : : L : SWL : : : : GGDQ : : 1 : : : : : : SED : : : :
4 8
49
AIAQRCNQQFGGRFT1AQVSLPRSPNEQRLQLARRLTGNDRTLDVMP.L8V 98
Elf : R : : TE : : iJ : : : A : QH : : : : : : : 0 : : : : : : : : : : : : K: : S : : : : : M: : 99
VW�AEFAEAGWALPLSDDPAGLAENDAVADTLPGPLATAG��KLYpAPV 1 4 8
: : : : : : : : : : : T : : : : E : : : : : : : ? : : IV : : : : : : : : : : T : KR : : : : : : : 149
TTNTQLLWYRPDLVNS PPTDWNN�1AEAARLHAAGEPSWI / PhoA 1 8 8
: : : : : : : : : : T : : : DQ : : G : : : G : V : : : : : : : : : : : : : : : 189
Comparision of ORFs from M. leprae and the M. bovis BCG DNA insert from pM2 1 .
Divergent nucleotides and amino acids are shown only for M. ieprae. The upstream
nucleotide sequences are shown and the ORF as far as the junction of the M. bovis BCG
DNA insert and phoA in (A). The putative initiation codon (GTG) is shown in bold and
is preceeded by a putative Shine and Dalgarno (SD) sequence. The putative amino acid
sequences are shown using the single letter code (B). The arrow indicates a putative
signal peptidase cleavage site.
69
Identification of an ORF with homology to a family of high-temperature-requirement
serine proteases
The insert DNA sequences of pM2 was partially determined on one strand . Database
searches using the B LAST algorithm with the pM2 insert revealed regions of high
similarity to the htrA gene of M. tuberculosis (69% over 1 50 bases) (Wu et ai. , 1 997),
and to an ORF within an M. Zeprae cosmid (B 1 756, Genbank accession # U 1 5 1 80 ;
coding sequence 2 1 ,036-22,637), named htrA . (64% over 1 50 bases) . The database
search also identified lesser similarity to h trA genes from E. coli, S a lmon ella
typhimuriwn, Brucella abortus, Yersinia enterocolitica, and Pseudonwnas aeruginosa.
The reading frame of the pM2 phoA -fusion was determined and the predicted amino acid
sequence of the pM2-encoded peptide was also similar to the deduced protein sequence of
M. tuberculosis HtrA (Figure 3.9). The M. bovis BeG putative HtrA protein contains
the motif Gly-Asn-Ser-Gly-Gly-Ala-Leu which matches the consensus sequence for the
catalytic domain of serine proteases (Boucher et ai. , 1 996) . The htrA family of genes
code for exported , stress-response serine proteases that function by degrading
abnormally folded proteins, thus preventing their accumulation to toxic levels within cells
(Davies and Lin, 1988 ; Strauch et al. , 1 989) . The E. coli htrA gene is identical to degP,
a periplasmic space protease (Lipinska et ai. , 1989).
70
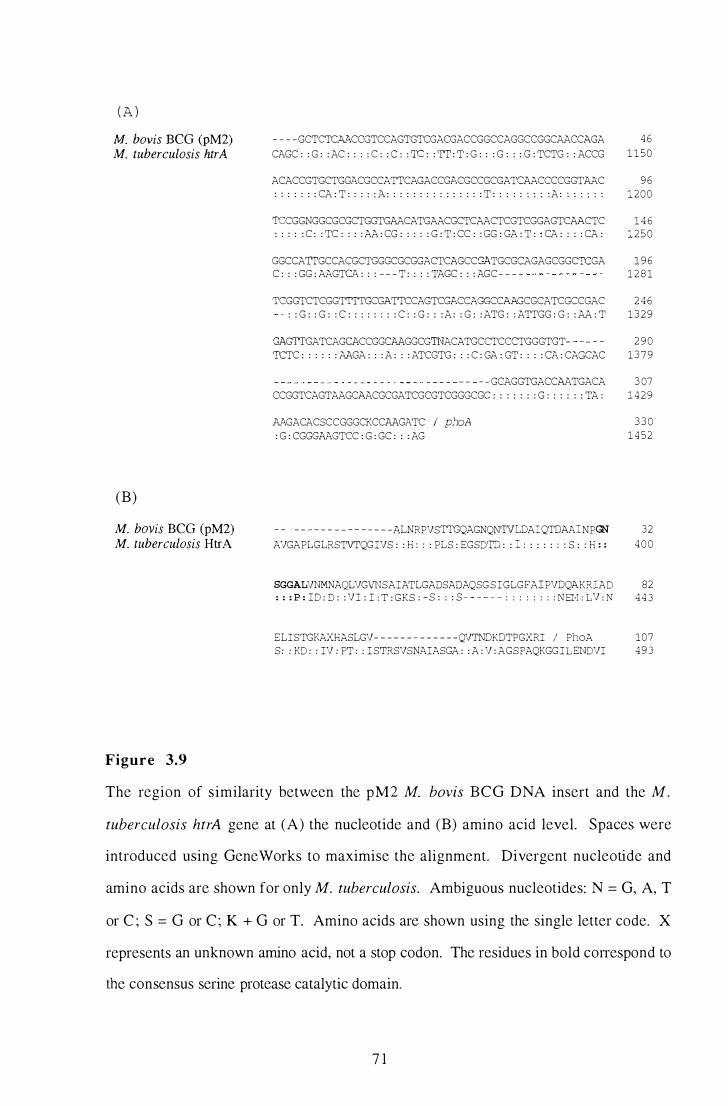
( A ) M. bovis BCG (pM2) M. tuberculosis htrA
(B)
M. bovis BCG (pM2) M. tuberculosis HtrA
Figure 3.9
- - - -GCTcTC.�CCGTCCAGTGTCGACGACCGGCCAGGCCGGCAACCAGA
CAGC : : G : : AC : : : : c : : c : : TC : : TI : T : G : : : G : : : G : TCTG : : ACCG
4 6
1 1 50
ACACCGTGCTGGACGCCATICAGACCGACGCCGCGATCAACCCCGGTAAC 9 6
: : : : : : : CA : T : : : : : A : : : : : : : : : : : : : : : T : : : : : : : : : A : : : : : : : 1 2 0 0
TCCGGNGGCGCGCTGGTGAACATGAACGCTCAACTCGTCGGAGTCAACTC 1 4 6
: : : : : C : : TC : : : : AA : CG : : : : : G : T : CC : : GG : GA : T : : CA : : : : CA : 1 2 5 0
GGCCATIGCCACGCTGGGCGCGGACTCAGCCGATGCGCAGAGCGGCTCGA 1 9 6
C : : : GG : AAGTCA : : : - - - T : : : : TAGC : : : AGC- - - - 1 2 8 1
TCGGTCTCGGTTITGCGATICCAGTCGACCAGGCCAAGCGCATCGCCGAC 2 4 6
: : G : : G : : C : : : : : : : : C : : G : : : A : : G : : ATG : : ATTGG : G : : AA : T 1 3 2 9
GAGTTGATCAGCACCGGCAAGGCGTNACATGCCTCCCTGGGTGT- - - - - 2 9 0
TCTC : : : : : : AAGA : : : A : : : ATCGTG : : : C : GA : GT : : : : CA : CAGCAC 1 3 7 9
- - - - GCAGGTGACCAATGACA 3 07
CCGGTCAGTAAGCAACGCGATCGCGTCGGGCGC : : : : : : : G : : : : : : TA : 1 4 2 9
.�GACACSCCGGGCKCCAAGATC I pheA 3 3 0
: G : CGGGAAGTCC : G : GC : : : AG 1 4 52
- - - - - - - - - - - - - - - - -l".LNRPVSTTGQAGNQN'IVLDA1QTDAA1NPGN
AVGAPLGLRSTVTQGIVS : : H : : : PLS : EGSD'rJ : : 1 : : : : : : o S : : H : :
32
4 0 0
SGGALVNMNAQLVG\�SAIATLGADSADAQSG S IGLGFA1 PVDQAKR1AD 82
: : : P : ID : D : : VI : I : T : GKS : - S : : : S - - - - - : : : : : : : : NEM : LV : N 4 4 3
ELISTGKAXHASLGV- - - - - - - - - - - - -QVTNDKDTPGXRI / PheA 107
S: : KD : : IV : PT : : I STRSVSNAIASGA : : A : V : AGSPAQKGGILENDVI 4 9 3
The region of similarity between the pM2 M. bovis BCG DNA insert and the M.
tuberculosis htrA gene at (A) the nucleotide and (B) amino acid level. Spaces were
introduced using GeneWorks to maximise the alignment. Divergent nucleotide and
amino acids are shown for only M. tuberculosis. Ambiguous nuc1eotides: N = G, A, T
or C ; S = G or C; K + G or T. Amino acids are shown using the single letter code. X
represents an unknown amino acid, not a stop codon. The residues in bold correspond to
the consensus serine protease catalytic domain.
7 1
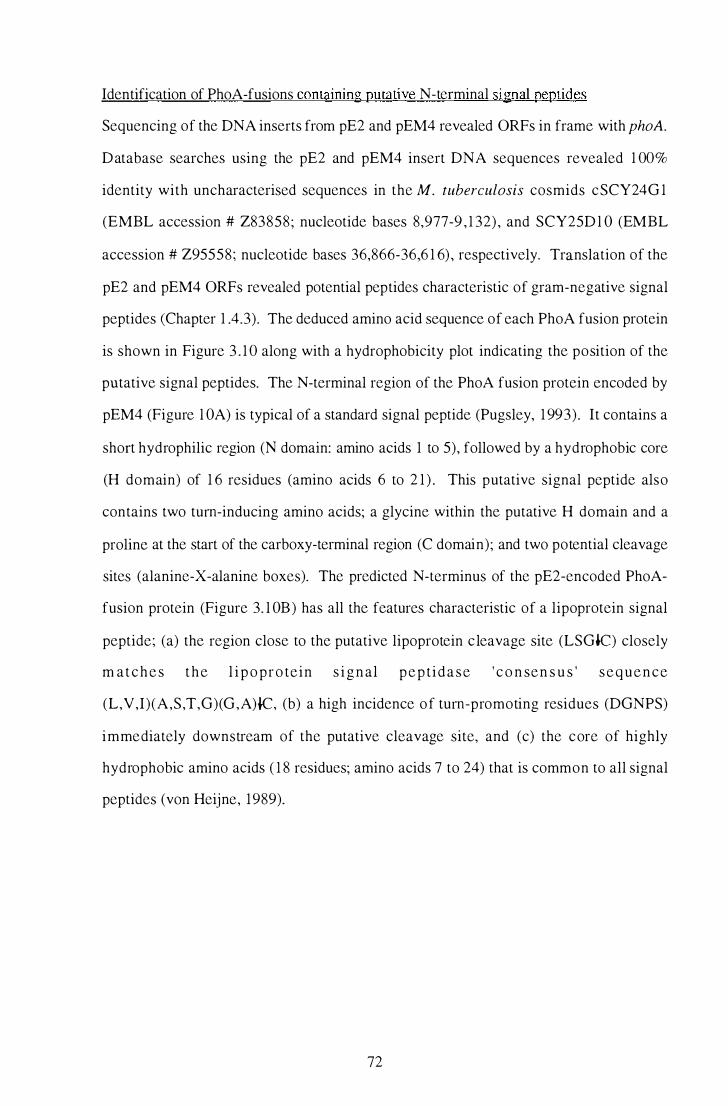
Identification of PhoA-fusions containing putative N-terminal signal peptides
Sequencing of the DNA inserts from pE2 and pEM4 revealed ORFs in frame with phoA.
Database searches using the pE2 and pEM4 insert DNA sequences revealed 1 00%
identity with uncharacterised sequences in the M. tuberculosis cosmids cSCY24G 1
(EMBL accession # Z83858; nucleotide bases 8,977-9 , 1 32) , and SCY25D l O (EMBL
accession # Z95558; nucleotide bases 36,866-36,6 1 6) , respectively. Translation of the
pE2 and pEM4 ORFs revealed potential pep tides characteristic of gram-negative signal
peptides (Chapter 1 .4.3). The deduced amino acid sequence of each PhoA fusion protein
is shown in Figure 3 . 1 0 along with a hydrophobicity plot indicating the position of the
putative signal peptides. The N-terminal region of the PhoA fusion protein encoded by
pEM4 (Figure l OA) is typical of a standard signal peptide (Pugsley, 1 993) . It contains a
short hydrophilic region (N domain: amino acids 1 to 5), followed by a hydrophobic core
(H domain) of 1 6 residues (amino acids 6 to 2 1 ) . This putative signal peptide also
contains two tum-inducing amino acids; a glycine within the putative H domain and a
proline at the start of the carboxy-terminal region (C domain); and two potential cleavage
sites (alanine-X-alanine boxes). The predicted N-terminus of the pE2-encoded PhoA
fusion protein (Figure 3. l OB ) has all the features characteristic of a lipoprotein signal
peptide; (a) the region close to the putative lipoprotein c leavage site (LSGK:) closely
m at c h e s t h e l i p o pr o tein s i g n al p e p tidase ' c o n sen s u s ' s e q u e n c e
(L,V,I)(A,S,T,G)(G,A)K, (b) a high incidence o f tum-promoting residues (DGNPS)
immediately downstream of the putative cleavage site, and (c) the core of highly
hydrophobic amino acids ( 1 8 residues; amino acids 7 to 24) that is common to all signal
peptides (von Heijne, 1989).
72
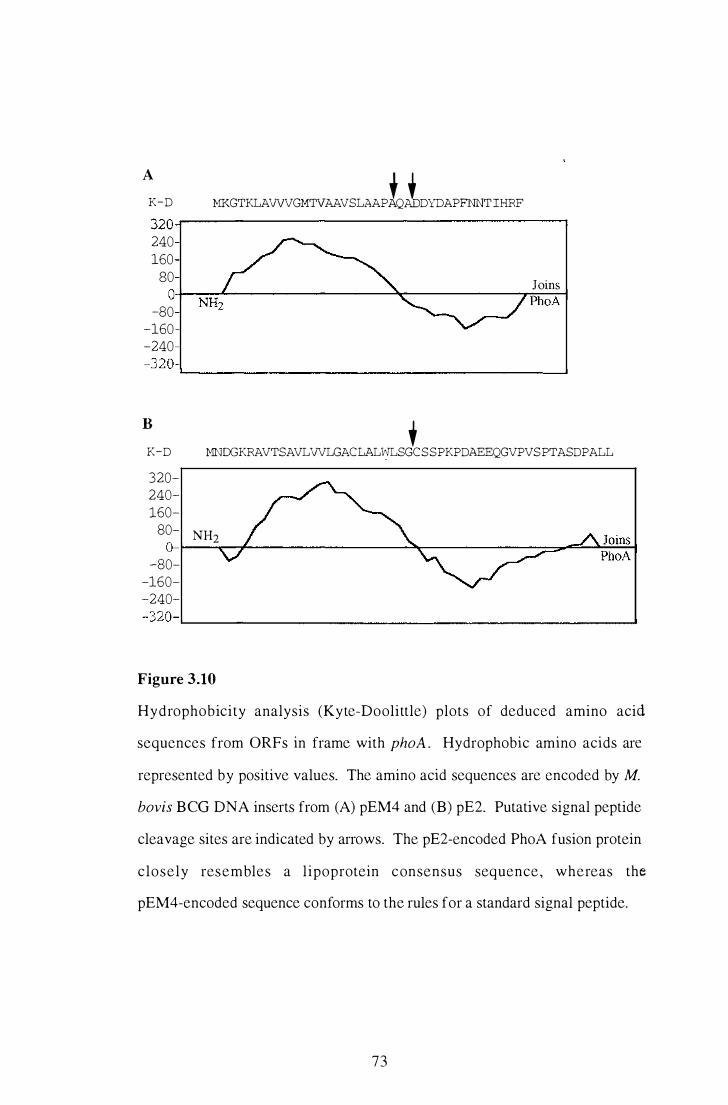
A
MKGTKLAVVVGMTVAAVSLAAPlQllDYDAPFNNTIHRF K-D 320�--------------------------------------' 240 160
00 J� O+-��------------------�------------,r,PMh�o�A� -80
-160 -240 -320 � ____________________________________ �
B
K-D 320-240-160-
, MNDGKRAVTSAVLVVLGACLALWLSGCSSPKPDAEEQGVPVSPTASDPALL
80- NH2 Joins O-r---��------------------�------------����Ph�o�A� -80-
-160--240--320-� ____________________________________________ �
Figure 3.10
Hydrophobicity analysis (Kyte-Doolittle) plots of deduced amino acid
sequences from ORFs in frame with phoA . Hydrophobic amino acids are
represented by positive values. The amino acid sequences are encoded by M.
bovis BeG DNA inserts from (A) pEM4 and (B) pE2. Putative signal peptide
cleavage sites are indicated by arrows. The pE2-encoded PhoA fusion protein
closely resembles a l ipoprotein consensus sequence , whereas the
pEM4-encoded sequence conforms to the rules for a standard signal peptide.
73
PhoA fusion proteins encoded by pE5, pE9 and pE14 1ack recognisable signal peptides
DNA sequencing of pE9 and pE 14 revealed overlapping insert sequences containing a
single ORF fused in frame with phoA (see Appendix 3) . The ORF in pE9 extends for a
further 60 nucleotides (equivalent of 20 amino acid residues) downstream of the point
where pE 1 4 j oins to phoA. These sequences are identical to a 528 base uncharacterised
ORF within the M. tuberculosis cosmid Y78 (EMBL accession # Z77 1 65 ; coding
sequence 3 ,404-3,934) . A putative Shine and Dalgarno sequence was located upstream
of the ORF. Analysis of the translated product of the pE9 and pE 1 4 ORF revealed no
hydrophobic stretches of amino acids that might function as a signal peptide.
The complete DNA insert from pE5 was sequenced on both strands and databases were
searched for similarities to known sequences. Nucleotides 1 to 3 5 1 of the 509 base pair
insert were identical to a sequence located within the M. tuberculosis cosmid SCY20G9
(EMBL accession # Z77 1 62 ; nucleotides 33,270-33,620) . In contrast, nucleotides 352-
509 showed no similarity to any database sequences. A Sau 3AIsite exists at the point
where the identity to the M. tuberculosis cosmid ends, suggesting that two Sau 3 A
fragments were ligated together during construction of the M. bovis BCG library. This
was supported by the observation that oligonucleotide primers, designed to the flanking
regions of the Sau 3A site in the M. tuberculosis cosmid sequence, yielded a PCR
amplification product of the predicted size (based on the M. tuberculosis sequence) from
M. bovis B eG genomic DNA (data not shown). An ORF was identified that was in
frame with phoA and spanned the Sau 3A junction of the hybrid insert. Hydrophobicity
analysis of the translated ORF revealed no recognisable signal peptide.
74
3.3.4 Detection of PhoA fusion proteins from recombinant E. coli
The m olecular weights of the PhoA fusion proteins were determined by probing lysate
samples of recombinant E. coli with rabbit anti-PhoA antibodies. Lysate samples of
seven PhoA+ E. coli transform ants and a non-recombinant control were prepared from
25 m l overnight cultures. Cells were washed twice by centrifugation and resuspended in
5 ml of buffer. The cells were lysed by sonication and the insoluble cellular debris
removed by centrifugation. The protein concentration of each E. coli lysate sam ple was
determined. Lysate samples were separated on an SDS-polyacrylamide gel and
transfen'ed to a nitrocellulose membrane. The blot was probed with polyclonal antibodies
raised against E. coli PhoA (Rockland, Pennsylvania). In each recombinant E. coli lysate
sample, the antibody probe detected more than one protein (Figure 3 . 1 1 ) . A protein band
of 54 kDa was detected in each sample, including the E. coli control. Commercially
purified PhoA was run on the gel as a positive control and also had an apparent molecular
mass of 54 kDa. However, additional higher molecular weight bands were observed in
the recombinant E. coli samples, ranging in size from 77 kDa (pE9) to a doublet of
approximately 5 8 and 6 1 kDa in pEM 1 , pEM4, and pES. The predicted and observed
molecular weights of the PhoA fusion proteins were compared. The predicted molecular
weight of the unprocessed pE9-encoded PhoA fusion protein is approximately 68 kDa, 9
kDa smaller than the observed fusion protein.
The predicted molecular weight of the unprocessed pE14-encoded PhoA fusion protein
(-65 kDa) is also smaller than the observed molecular weight (-7 1 kDa) . However, the
58/6 1 kDa doublet protein bands observed in the E. coli (pEM4) sample are similar to the
predicted mature and unprocessed fOlms of the pEM4-encoded PhoA fusion protein. The
observed molecular weight of the pE2-encoded fusion protein also m atches that predicted
for the unprocessed protein. The existence of multiple forms of each PhoA fusion
protein suggests they may have been post-translationally modified, possibly by
proteolytic degradation. No protein bands of less than 54 kDa were observed, indicating
that proteolysis appeared to be limited to the M. bovis BCG-encoded polypeptide.
75
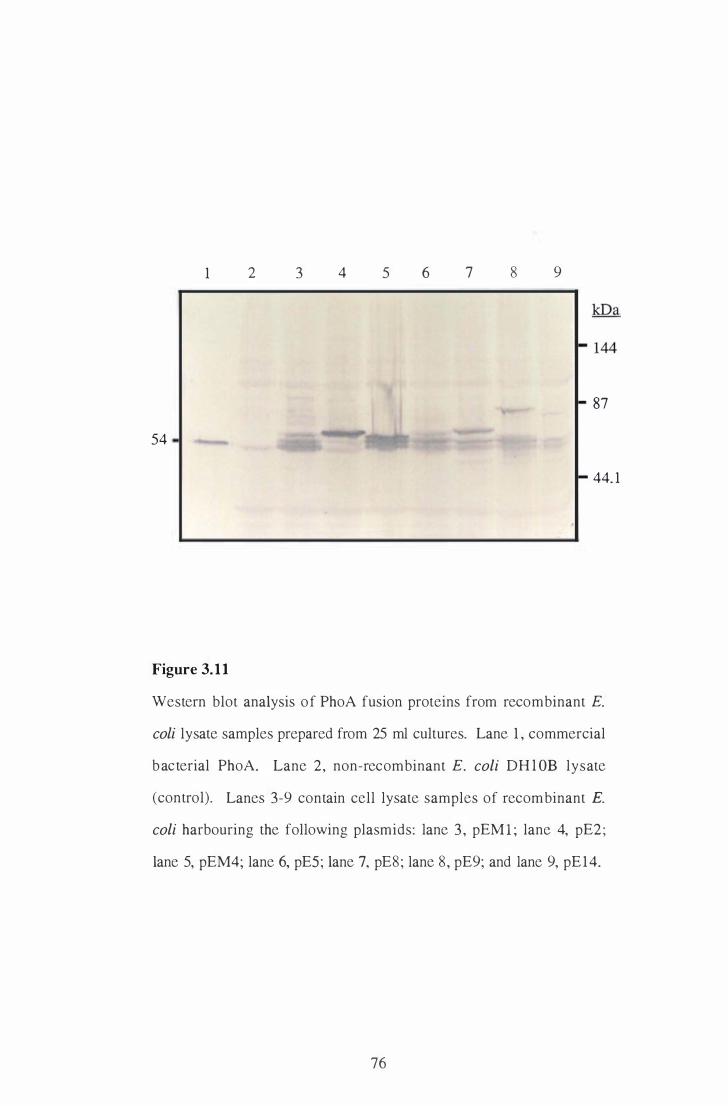
1 2 3 4 5 6 7 8 9
� 87
54 - [ l
I- 44. 1
Figure 3.1 1
Western blot analysis o f PhoA fusion proteins from recombinant E.
coLi lysate samples prepared from 25 ml cultures. Lane 1 , commercial
bacterial PhoA. Lane 2, non-recombinant E. coli DH l OB lysate
(control). Lanes 3-9 contain cell lysate samples of recombinant E.
coli harbouring the following plasmids: lane 3 , pEM 1 ; lane 4, pE2 ;
lane 5, pEM4; lane 6, pES ; lane 7, pE8 ; lane 8 , pE9; and lane 9, pE 1 4.
76
3.3.5 Detection of PhoA fusion proteins from recombinant M. smegmatis
by Western blot analysis
Signal pep tides are required for the translocation of exported proteins across the
cytoplasmic membrane. In Gram-negative E. coli, alkaline phosphatase is exported to the
periplasmic space which lies between the cell's inner and outer membranes. However,
the G ram-positive bacterium Mycobacterium smegmatis, has a single cell membrane
beneath a thick, lipid-rich cell wall. This raises the question as to the fate of PhoA fusion
proteins in this Gram-positive host. The exported fusion proteins m ay be secreted
through the cell wall into the culture medium or remain associated with the cell membrane
or cell wall. To determine the location of the PhoA fusion proteins from blue (phoA+)
recombinant M. smegmatis, cell lysates and CF were subjected to Western blotting using
anti-PhoA antibodies.
Recombinant M. smegmatis colonies were scraped from agar plates and resuspended in a
small volume of buffer. The cells were pelleted in a microcentrifuge and the supernatant
(extracellular wash) removed. The cell pellets were resuspended in buffer and lysed by
sonication. The protein concentration of recombinant M. smegmatis lysates and
extracellular wash samples was detelmined. Quantitative PhoA assays revealed that <1 %
of the PhoA activity was present in the extracellular wash fraction (data not shown).
Lysate samples were size fractionated by SDS-PAGE immediately following sonication
to m inimise protein degradation. The Western blots were probed with anti-PhoA
antibodies. Three common protein bands were detected in lanes containing lysate
samples from each recombinant M. smegmatis clone with a PhoA+ phenotype (Figure
3 . 1 2) . The higher molecular weight band in each lane was approximately 54 kDa, the
same apparent molecular weight as purified PhoA. The lower molecular weight bands
were of similar size to breakdown products observed in the lane containing a commercial
PhoA sample. In M. smegmatis samples containing pEM l , pEM4 and pM2 the anti
PhoA antibody also bound to larger proteins, suggesting that the antibody was detecting
77
full length PhoA fusion products. The PhoA fusion protein encoded by pEM ! had a
molecular weight of approximately 90 kDa. Two additional M. smegmatis (pEM4)
proteins were detected; one of approximately 60 kDa, the predicted molecular weight of
the pEM4-encoded fusion protein, and another of approximately 1 00 kDa. In M.
smegmatis (pM2), a protein band of approximately 95 kDa was also observed.
In addition to the plate scraping procedure, CFs from liquid cultures of recombinant M.
smegma tis were also analysed by Western blotting to determine if any of the fusion
proteins was secreted into the culture medium. Culture filtrate and lysate samples were
prepared from 1 L cultures of M. smegmatis (pJEM l l ) and (pM2 1 ) and separated by
SDS-PAGE. Proteins were transferred to nitrocellulose and probed with anti-PhoA
antibodies to detect the fusion proteins expressed by M. smegmatis (pM2 l ) . The
antibody detected three weak protein bands of the similar molecular weight in the M.
smegmatis (pM2 1 ) CF and lysate sample (Figure 3 . 1 3) . These bands were absent from
both M. sntegmatis (pJEM l l ) control samples. This indicated that the proteins were
encoded by the insert DNA of pM2 1 . However, the visualised proteins were of
approximately equal or lower molecular weight compared to the commercial PhoA
sample. This result suggests that there may be proteolytic degradation of the fusion
protein encoded by pM2 1 .
7 8
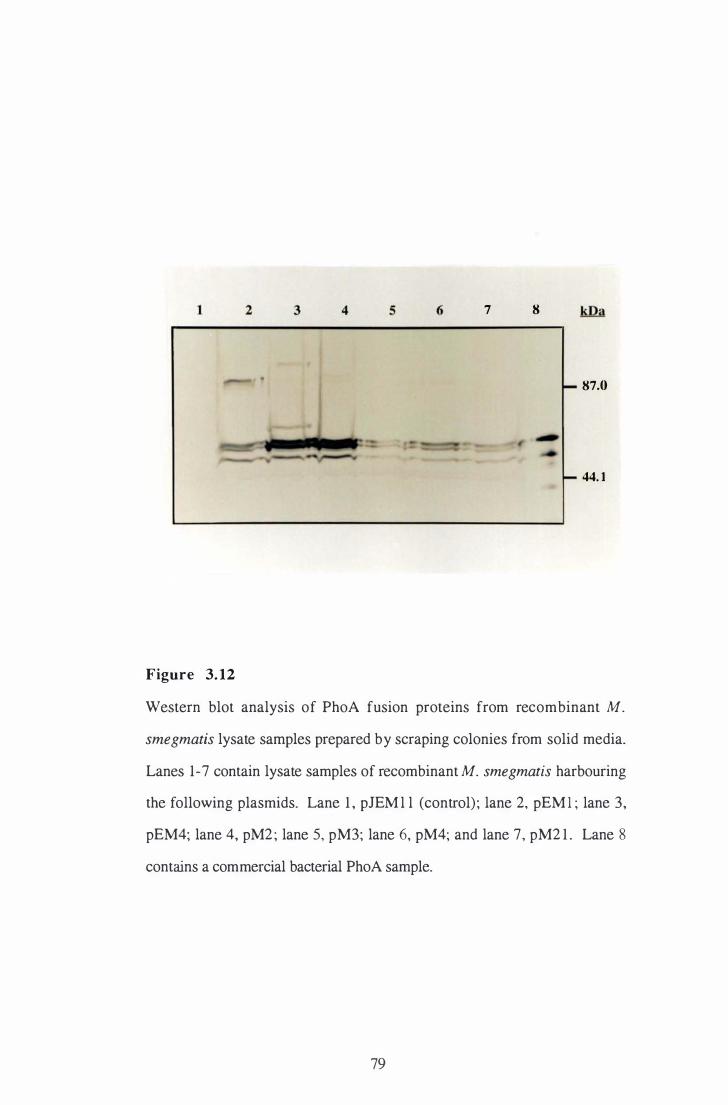
1 2 3 4 5 6 7 8
87.0
44. 1
Figure 3. 12
Western blot analysis of PhoA fusion proteins from recombinant M.
smegmatis lysate samples prepared by scraping colonies from solid media.
Lanes 1-7 contain lysate samples of recombinant M. smegmatis harbouring
the following plasmids. Lane 1 , pJEM l l (control) ; lane 2, pEM l ; lane 3,
pEM4; lane 4, pM2 ; lane 5, pM3; lane 6, pM4; and lane 7, pM2 1 . Lane 8
contains a commercial bacterial PhoA sample.
79
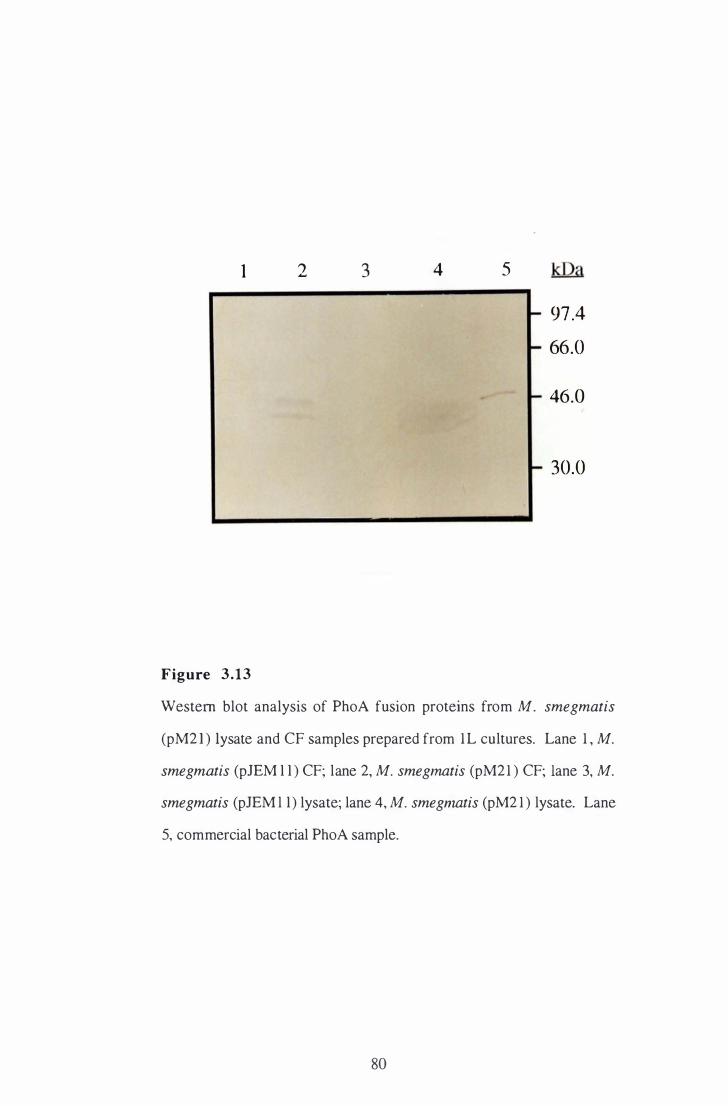
1 2 3
Figure 3 . 1 3
4 5 kDa
� 97 .4
� 66.0
- 46.0
� 30.0
Western blot analysis of PhoA fusion proteins from M. smegmatis
(pM2 1 ) lysate and CF samples prepared from 1 L cultures. Lane 1 , M.
smegmatis (pJEM l l ) CF; lane 2, M. smegmatis (pM2 1 ) CF; lane 3, M.
smegmatis (pJEM l l ) lysate; lane 4, M. smegmatis (pM2 1 ) lysate. Lane
5, commercial bacterial PhoA sample.
80
3 . 4 D i scussion
In this study, an M. bovis BCG library of phoA fusions was constructed using pJEM l l
and the DNA sequences encoding exported proteins were analysed. The gene l ibrary was
transformed and analysed in both M. smegmatis and E. coli. Approximately 8000 E. coli
transform ants were obtained upon plating out 7 .5% of the library, 14 of which expressed
enzymatically active PhoA fusion proteins, as indicated by their blue colour on media
containing XP. Twelve of the pJEM l l lM. bovis B CG plasmids prepared from blue E.
coli transform ants conferred a PhoA- phenotype on M. smegma tis. One possible
explanation is that these PhoA-fusions are expressed and translocated across the cell
membrane of M. smegmatis but they are unable to assume a conformation necessary for
enzyme activity. Alternatively, they may contain cryptic export signals that are not
recognised by the M. smegmatis export machinery. An additional 37 blue (PhoA+) M.
smegmatis clones were observed following transformation with plasmid DNA prepared
from the pooled white E. coli transformants. This result is consistent with previous
studies (Clark-Curtiss et aI. , 1 985; Das Gupta et aI. , 1 993; Bashyam et aI. , 1 996) which
have shown that M. smegmatis is a more permissive host for expression of M. bovis
BCG genes than E. coli.
M. bovis BeG DNA inserts from plasmids expressing enzymatically active PhoA fusion
proteins were partially sequenced and used to search databases for similarities to known
genes . Database searches revealed similarities to a family of high temperature
requirement (HtrA) serine proteases (pM2), a putative 1 .4 kb lipoprotein gene from M.
leprae (pM2 1 ) , and several uncharacterised M. tuberculosis ORFs. The M. bovis BeG
DNA insert of plasmid pM2 showed similarity to a htrA gene of M. tuberculosis (WU et
aI. , 1 997) and htrA genes from several different bacterial species (Lipinska et aI. , 1988;
Johnson et ai. , 1 99 1 ). The HtrA proteins belong to a family of stress-response serine
proteases, and multiple htrA genes have been identified within the same species (Waller
and Sauer, 1996). On the basis of the level of similarity of the M. bovis BCG pM2 insert
8 1
sequence to the M. tuberculosis htrA gene (69% over 1 50 bases) , i t is likely that multiple
htrA genes are also present in mycobacteria. HtrA pro teases prevent toxic accumulation
of incorrectly folded proteins, including heat denatured and oxidatively damaged proteins
(Davies and Lin, 1988 ; Strauch and Beckwith, 1988 ; Boucher et at. , 1 996). The htrA
genes of B. abortus and S. typhimurium have been directly implicated in bacterial
virulence and survival within macrophages (Johnson et aI. , 1 99 1 ; Elzer et ai. , 1 994). It
is p ossible that the product of the M. bovis BCG putative htrA gene identified in this
study may also play a role in bacterial survival within macrophages. The mycobacterial
HtrA-like proteases may contribute to defence against toxic effects of reactive
intermediates generated by host macrophages. Further characterisation of the M. bovis
BCG putative H trA protein identified in this work is necessary to determine if this
exported protein plays a role in intracellular survival.
The complete M. bovis BCG DNA insert of pM2 1 was sequenced and used to search
DNA and protein databases. This M. bovis BCG insert was found to be highly similar to
the nucleotide sequence of an uncharacterised M. leprae ORF contained within cosmid
B 1756. Sequence analysis of the putative 469 amino acid product (u1756V) and its M.
bovis BCG homologue suggest that they are exported lipoproteins and contain consensus
membrane lipid attachment sites (Pugsley, 1993; Worley et ai. , 1 995). If the putative M.
bovis BeG protein is a lipoprotein, it is not necessarily present in a cell-associated form
only, as the 1 9 kDa lipoprotein of M. tuberculosis is released into the culture medium
(Fifis et aI. , 1 99 1 ) . Western blot analysis of M. smegma tis (pM2 1 ) samples revealed
multiple alkaline phosphatase-sized products in both the cell lysate and CF samples,
suggesting that a soluble, secreted form of the putative M. bovis BCG lipoprotein may
exist.
The remaining plasmids conferring a PhoA+ phenotype contained DNA sequences which
showed no similarity to previously characterised genes. Two plasmids (pE2 and pEM4)
encoded PhoA fusion proteins with consensus signal peptides. However, two of the
82
BCG DNA inserts (pE5 and pE14) encoded enzymatically active PhoA fusion proteins
with no recognisable signal peptides. Neither fusion protein contains the hydrophobic
core near the predicted N-terminus that is characteristic of a signal peptide. It is unclear
how these gene fusions confer a PhoA+ phenotype on their E. coli hosts. One possibility
is that cryptic export signals, located at the N-terminal region, facilitate interaction with
the E. coli export machinery, allowing translocation across the cytoplasmic membrane.
Protein secretion in the absence of a consensus signal peptide is known to occur in
mycobacteria. The M. tuberculosis secreted proteins SOD (Zhang et ai. , 1 99 1 ) , L
alanine dehydrogenase (Andersen et aI. , 1 992a), ESAT-6 (S<j>rensen et aI. , 1 995) , and
Des (Jackson et ai. , 1 997) lack recognisable signal sequences and yet appear to be
actively secreted from the cell. This suggests that a signal peptide-independent
mechanism of protein export may exist in mycobacteria. These secreted proteins, when
expressed in E. coli may function in a similar manner.
The PhoA fusion proteins expressed by the PhoA+ E. coli recombinants were identified
by probing Western blots of cell lysates with anti-PhoA antibodies. Multiple protein
bands were detected by the antibody in each recombinant E. coli sample, suggesting that
they represent breakdown products of the full-length fusion proteins. Western blots of
lysates and CFs from PhoA+ M. smegmatis recombinants using anti-PhoA antibodies
also revealed products of a similar size to purified PhoA. In E. coli and M. smegmatis,
PhoA hybrid proteins can be subjected to proteolysis, releasing alkaline phosphatase
sized degradation products (Manoil and Beckwith, 1 985; Lim et a!. , 1 995). In E. coli,
mutants unable to generate these breakdown products are defective in the periplasmic
protease, DegP (Strauch and Beckwith, 1988) . The DegP protein degrades unstable
PhoA fusion proteins to yield smaller, conformationally stable products with alkaline
phosphatase activity (Strauch and Beckwith, 1 988) . Exported fusion proteins also
appear to be susceptible to proteolytic breakdown in M. smegmatis (Winter, pers.
comm. , 1 996). The detection of multiple protein bands in E. coli and M. smegma tis in
this study is consistent with a post-translational degradation of the PhoA fusion proteins.
83
It was noted that the molecular weight of the final breakdown product was similar to
native alkaline phosphatase, suggesting that the fusion proteins had been degraded to the
smallest stable form. However, it is possible that the screening system only detects those
fusion proteins that can form stable and PhoA active proteins. The generation of unstable
fusion proteins may lead to degradation which destroys PhoA activity. In this screening
system, these would be recorded as PhoA- and thus would be indistinguishable from
fusion proteins lacking export signals. It is unclear whether the degradation of fusion
proteins is related to the primary polypeptide sequence. However, the fact that the M.
bovis BeG m oiety of the fusion proteins are different in their predicted amino acid
composition suggests that conformation may be the main determinant for protein stability.
Because of the instability associated with the fusion proteins identified in this study, the
DNA inselts were used to screen for the full-length coding sequences in a cosmid library
of M. bovis.
84

Chapter 4:
Identification Of Genes
Encoding Exported Proteins
In An M. bovis Cosmid Library
85
4 . 1 Abstract
A cosmid library of M. bovis, expressed in M. smegmatis, was screened for the presence
of genes coding for exported proteins. In the first instance, the cosmid l ibrary was
screened using PCR primers generated against several genes coding for previously
characterised secreted antigens. Cosmids containing the genes coding for the 8 5-B
antigen, PhoS , MPB64, MPB70, and ESAT-6 were identified. Western blot analysis of
culture filtrate (CF) from the recombinant M. smegmatis containing the mpb64 gene
revealed that the M. bovis MPB64 antigen was expressed and secreted from M.
smegmatis.
The DNA inserts from the PhoA+ clones (described in chapter 3) were used to screen the
cosmid library to locate the complete genes coding for these expOlted proteins. Selected
recombinant M. smegmatis containing cosmid genes coding for novel M. bovis exported
proteins were grown in culture and the supernatants collected. The CFs were assayed for
their ability to induce proliferation and IFN-,),-production from peripheral blood
mononuclear cells (PBMCs) taken from M. bovis BCG-immunised cattle. Proliferative
responses to the recombinant M. smegmatis (cosmid) CFs were highly v ariable. In
contrast, the IFN-')' responses were more consistent, and two of the CF samples (cosmids
44 and 56) induced high levels of IFN-,),-production from PBMCs taken from two M.
bovis BCG-immunised animals. Southern blot analysis, in conjunction with sequence
data from one of the PhoA+ clones (pM2 1 ), revealed that cosmid 56 contained sequences
with similatity to an M. leprae ORF encoding a putative expol1ed lipoprotein.
86
4 . 2 Introduction
The identification of secreted M. bovis antigens and their coding genes constitutes a
rational approach for development of a novel vaccine against bovine tuberculosis.
Results from two dimensional gel electrophoresis of M. bovis BCG CFs have revealed a
large number of secreted proteins which can stimulate proliferation of lymphocytes from
M. bovis BCG-immunised cattle (Gulle et aI. , 1 995) . This suggests that immunised
cattle may provide a good model system to study antigen recognition and lymphocyte
responses. A novel screening system has been described by Averill et al. ( 1 993) using
CFs delived from an M. bovis BCG cosmid library in M. smegmatis to identify antigens
that induce T-cell proliferation from human tuberculin-positive donors . Thirty
recombinant c lones were tested and three produced secreted proteins with T-cell
stimulatory activity (Averill et al. , 1 993). A similar approach has been employed in this
laboratory to identify cosmid clones coding for bovine T cell antigens (Carpenter et al. ,
1 995). Culture filtrates prepared from an M. bovis cosmid library in M. smegma tis were
incubated with PBMCs taken from M. bovis BCG-immunised cattle to identify
recombinants encoding antigens that stimulated proliferation and/or IFN-y-production by
T lymphocytes. The screening system was optimised to distinguish between M. bovis
and M. smegmatis secreted proteins.
In the previous chapter, an M. bovis BCG library of PhoA fusions was screened for
sequences coding for protein export signals. These sequences may represent partial
genes fused to phoA. The protein analysis results indicated that the fusion polypeptides
were partially degraded in E. coli and M. smegmatis. This chapter describes the
screening of an M. bovis cosmid library with insert DNA from the PhoA+ clones to
locate the complete genes. Culture filtrates from the recombinant M. smegma tis
containing these exported protein genes were used to stimulate PBMCs from M. bovis
BCG-immunised cattle to identify recombinants encoding T-cell antigens. Antigen
recognition was measured by the proliferative response and IFN-y secretion by PBMCs
taken from immunised and control cattle.
87
4 . 3 Resu l ts
4.3. 1 Restriction endonuclease analysis of DNA from selected cosmids
An M. bovis cosmid library was constructed at AgResearch, Wallace ville (Wilson and
Collins, 1 996) using an E coli-mycobacterial shuttle cosmid provided by Dr. W .R .
Jacobs from the Albert Einstein College of Medicine, New York (Belisle et ai. , 1 99 1 ) .
Mycobacterial DNA fragments of 35-40 kb were cloned into the cosmid vector pYUB 1 8
(Wilson and Collins, 1 996).
The cosmid library was first transfonned into E. coli by electroporation with selection for
kanamycin resistance. Subsequent transformation of the library into M. smegmatis
yielded 356 transformants. C osmid DNA was extracted from ten randomly selected
recombinant E. coli. The DNA was digested with Eco RI and the restriction patterns of
each cosmid were compared (Figure 4. 1 ) . Ten different banding patterns were observed,
suggesting that all the cosmids contained different DNA inserts. The common band at
approximately 5 kb was found to correspond to the pYUB 1 8 vector (data not shown).
The c osmid inserts appeared to range from 25 to 35 kb in size, although they may be
larger than this as some higher bands might represent more than one DNA fragment.
88
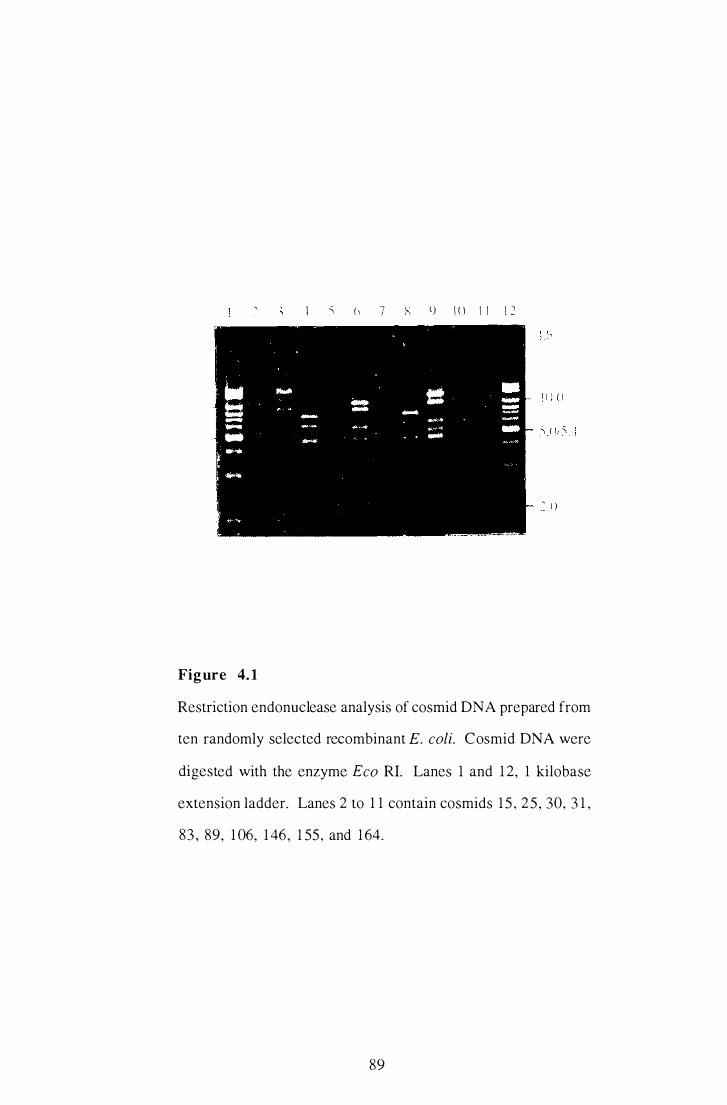
I " h 7 :-: (j I ( ) I I 1 1
Fig ure 4. 1
Restriction endonuclease analysis of cosmid DNA prepared from
ten randomly selected recombinant E. coli. Cosmid DNA were
digested with the enzyme Eco RI. Lanes 1 and 1 2, 1 kilobase
extension ladder. Lanes 2 to 1 1 contain cosmids 15 , 25 , 30, 3 1 ,
83 , 89, 1 06, 1 46, 1 55, and 1 64.
89
4.3.2 S creeni ng of an M. bovis cosmid l i b rary for genes encodi n g
exported proteins
After transformation of the library into M. smegmatis, the recombinants were patched
onto H ybond-N+ Nucleic Acid Transfer Membrane discs (Amersham, Little Chalfont,
England) and placed on top of 7H I O / OADC media containing kanamycin. Following in
situ lysis of colonies, the membranes were probed with radio labelled insert DNA from
PhoA+ clones. In some experiments up to four insert DNA probes were pooled and used
to screen the cosmid library in a single step. Figure 4.2 shows an autoradiograph of the
cosmid library screened with pooled probes made from the DNA inserts of pEM l , pE2,
pE5, and pE1 4. The DNA probes hybridised strongly to nine recombinant M. smegmatis
(cosmids 2, 23 , 45, 68, 86, 208, 209, 226, and 336). These cosmids were selected for
secondary screening with the individual DNA probes.
The DNA was extracted from positive M. smegmatis recombinants and transformed into
E. coli. The cosmid DNA was purified and digested with Eco RI and Hin dIll .
Digestion of cosmids 68 and 226 produced identical restriction patterns and the use of a
third restriction endonuclease confirmed that these cosmids were identical (data not
shown). Eco RI digests of cosmids containing different inserts were run on agarose gels
alongside Sal I-digested M. bovis (KML) genomic DNA and blotted onto a nylon
membrane. The Southern blots were probed with [a32p] -dCTP-labelled insert DNA
from the PhoA+ clones. A representative Southern blot of cosmids selected for
secondary screening is shown in Figure 4.3 (probed with pE 14 insert DNA). The pE1 4
insert DNA probe hybridised to restriction fragments from M. bovis genomic DNA, and
cosmids 68 and 336. The hybridisation signal intensities differed due to uneven sample
loading. The restriction fragments from cosmids 68 and 336 were different sizes,
approximately 9.5 and 7.0 kb, respectively. In addition , restriction endonuclease
analysis of these cosmids revealed common bands (data not shown). This indicated that
these cosmids may contain overlapping sequences, and that the different sized bands on
90
the Southern blot may reflect the position of the junction between the insert DNA and the
cosmid vector. Three recombinants that were positive in the plimary screening (cosmids
45, 86, and 226) were excluded from this secondary screening for the following reasons.
Cosmid 45 was unstable in E. coli and transformants did not grow in liquid cultures.
Restriction endonuclease analysis revealed that cosmid 86 had lost its DNA insert, and
cosmid 226 contained the same DNA inseI1 as cosmid 68 (data not shown).
Cosmids identified by probing Southern blots with insert DNA from the PhoA+ clones
are listed in Table 4. 1 . For each DNA insert probe, one hyblidising cosmid was selected
for study_ Selected cosmids are indicated by an asterisk (*) in Table 4. 1 .
9 1
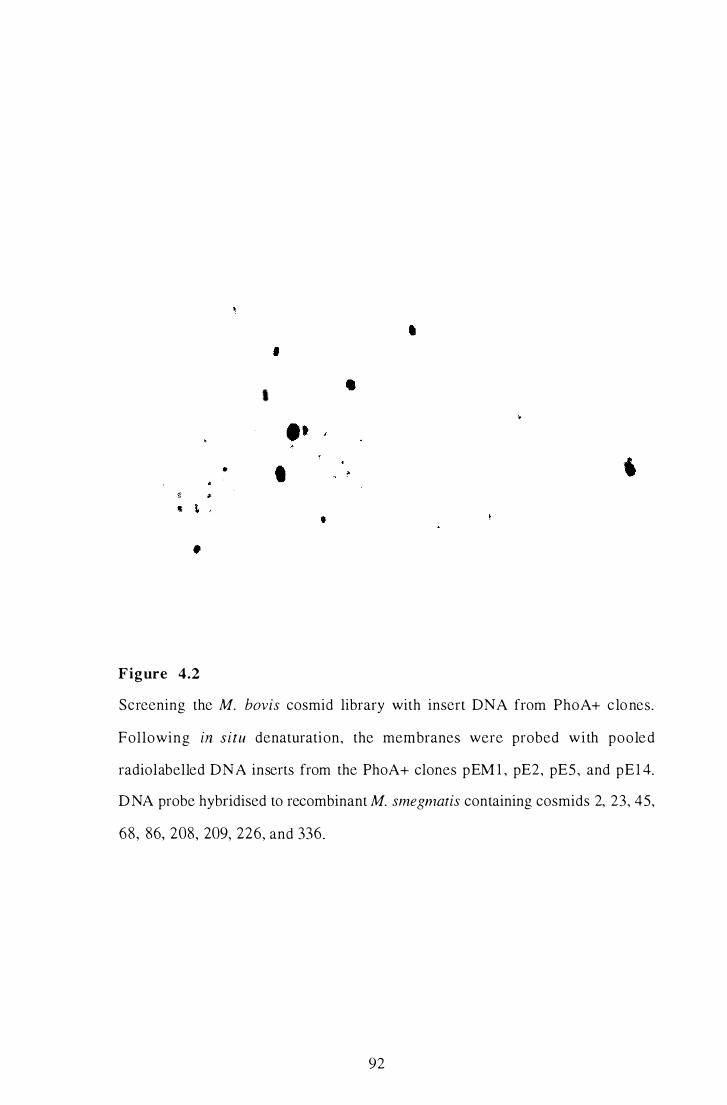
, ,
•
Figure 4.2
•
•
• •
•
Screening the M. bovis cosmid library with insert DNA from PhoA+ c lo nes.
Following in situ denaturation, the membranes were probed with pooled
radiolabelled DNA inserts from the PhoA+ clones pEM l , pE2, pES , and pE1 4.
D NA probe hyblidised to recombinant M. smegnwtis containing cosmids 2, 23, 45,
68, 86, 208, 209, 226, and 336.
92
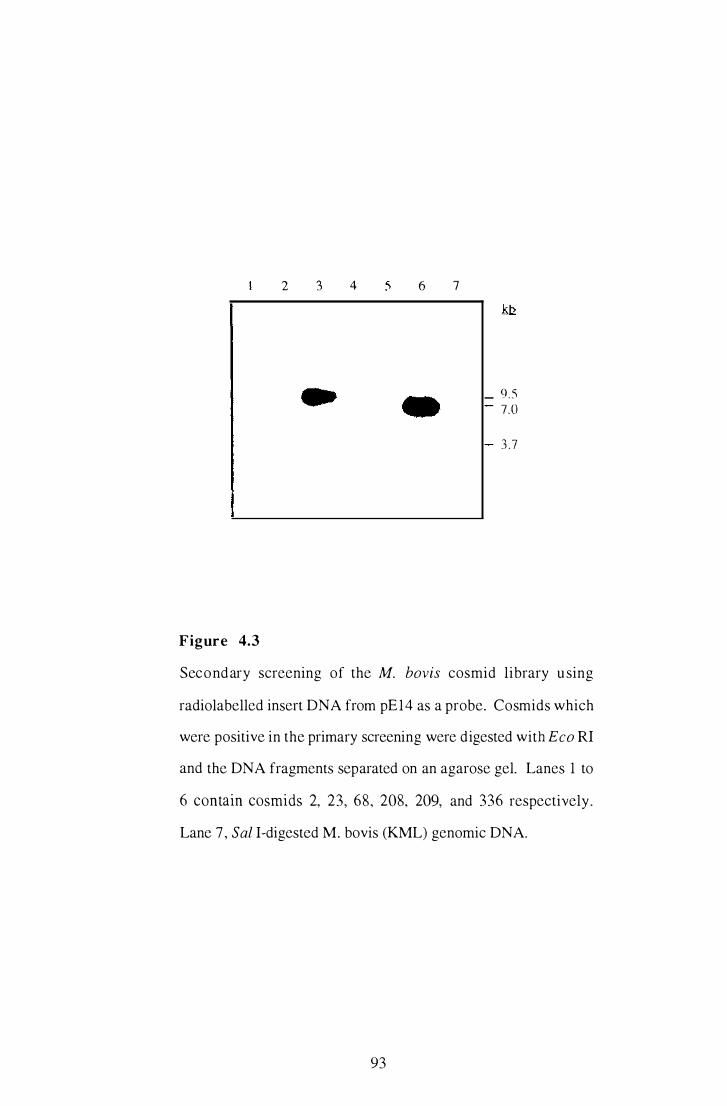
2 3 4
Figure 4.3
6 7
- 9.5 7.0
3 . 7
Secondary screening of the M. bovis cosmid library u sing
radiolabelled insert DNA from pE14 as a probe. Cosmids which
were positive in the primary screening were digested with Eco RI
and the DNA fragments separated on an agarose gel. Lanes 1 to
6 contain cosmids 2, 23, 68, 208, 209, and 336 respectively.
Lane 7 , Sal I-digested M. bovis (KML) genomic DNA.
93
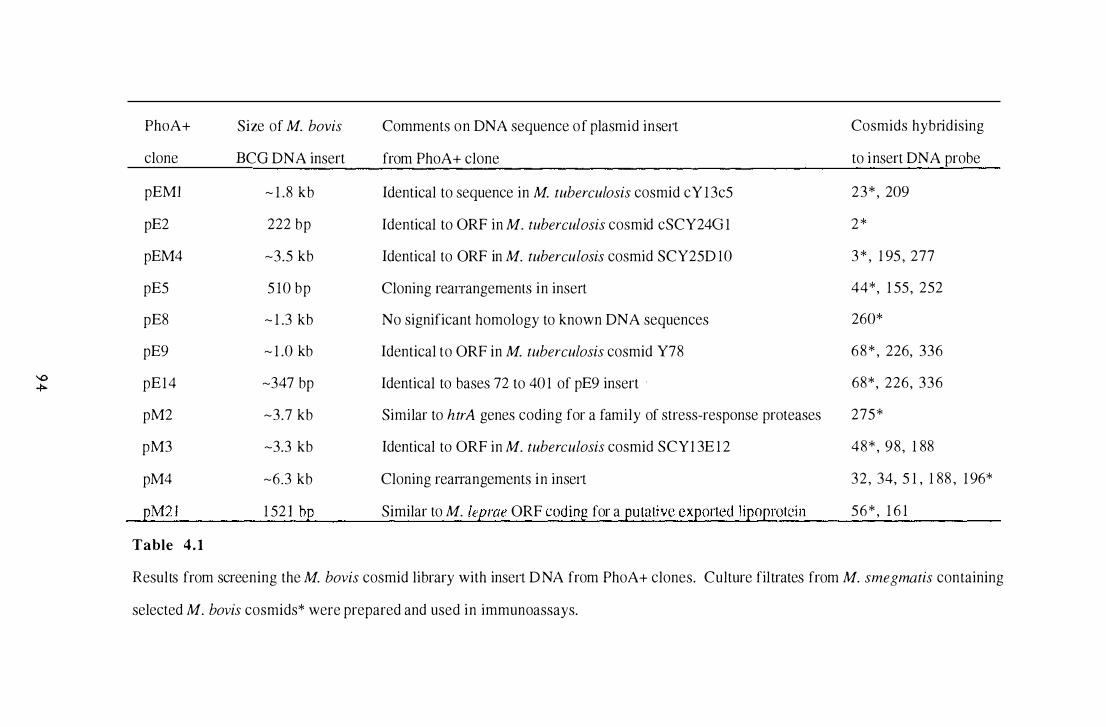
'-0 4>-
PhoA+ Size of M. bovis
clone BCG DNA insert
pEM! - 1 . 8 kb
pE2 222 bp
pEM4 -3.5 kb
pE5 5 1 0 bp
pE8 - 1 .3 kb
pE9 - 1 .0 kb
pE 1 4 -347 bp
pM2 -3.7 kb
pM3 -3.3 kb
pM4 -6.3 kb
pM2 1 1 52 1 bp
Table 4 . 1
Comments o n DNA sequence o f plasmid insert
from PhoA+ clone
Identical to sequence in M. tuberculosis cosmid c Y 1 3c5
Identical to ORF in M. tuberculosis cosmid cSCY24G 1
Identical to ORF in M. tuberculosis cosmid SCY25D 1 0
Cloning reaITangements in inselt
No significant homology to known DNA sequences
Identical to ORF in M. tuberculosis cosmid Y78
Identical to bases 72 to 40 1 of pE9 insert .
Similar to htrA genes coding for a family of stress-response proteases
Identical to ORF in M. tuberculosis cosmid SCY 1 3E 1 2
Cloning rean'angements i n inselt
Similar to M. leprae ORF coding for a putative expOlted lipoprotein
Cosmids hyblidising
to i nsert DNA probe
2 3 * , 209
2 *
3 * , 1 95 , 277
44*, 1 55 , 252
260*
6 8 * , 226, 336
68*, 226, 336
275 *
4 8 * , 9 8 , 1 88
3 2 , 34, 5 1 , 1 88 , 1 96*
5 6 * , 1 6 1
Results from screening the M. bovis cosmid library with inselt D NA from PhoA+ clones. Culture filtrates from M. smegma tis containing
selected M. bovis cosmids* were prepared and used in immunoassays.
4.3.3 Identification of cosmids which contain genes codin g for known
secreted antigens
Almost thirty genes encoding M. bovis and M. bovis BCG culture filtrate proteins have
been cloned and sequenced to date (Table 1 . 1 , Chapter 1 ) . Many of these code for
proteins which are bovine T-cell antigens (Fifis et al. , 1 994) . The cosmid l ibrary was
screened for the presence of the previously characterised secreted antigens MPB 70,
ESAT-6, 85-B and PhoS. peR primers (Appendix 2A) were generated against the genes
encoding these secreted proteins. DNA prepared from 200 recombinant M. smegmatis
was pooled into groups of ten and subjected to PCR amplification. Each primer pair
amplified a product the same size as the M. bovis genomic DNA product, from one of the
DNA pools (data not shown). The individual cosmids from these pools were rescreened
by PCR. Cosmids 3 , 7, 1 5 , and 79 were found to contain the genes esat-6, mpb 70,
phoS, and 85-B respectively.
Selected cosmids which were positive from screening with the DNA insel1s from PhoA+
clones (see Table 4. 1 ) were also screened by peR using primers (Appendix 2A)
generated against a panel of ten genes (85-A , 85-B, 85-C, mpb70, mpb64, esat-6, apa,
sodA , phoS, and the 19 kDa antigen gene). The amplified DNA fragments were
compared in size to the products obtained following peR of M. bovis genomic DNA
with the same primers. With the MPB64 and ESAT-6 PCR primer pairs, products of
identical size to the M. bovis PCR products were amplified from cosmid 260 and cosmid
3, respectively. Southern blot screening of the library with pEM4 revealed hybridising
sequences in cosmids 3, 195 and 277. Each of these cosmids was subjected to PCR
using the ESAT-6 primers. The results indicated that the esat-6 gene is contained in
cosmid 3 , but is absent from cosmids 195 and 277 (Figure 4.4).
95
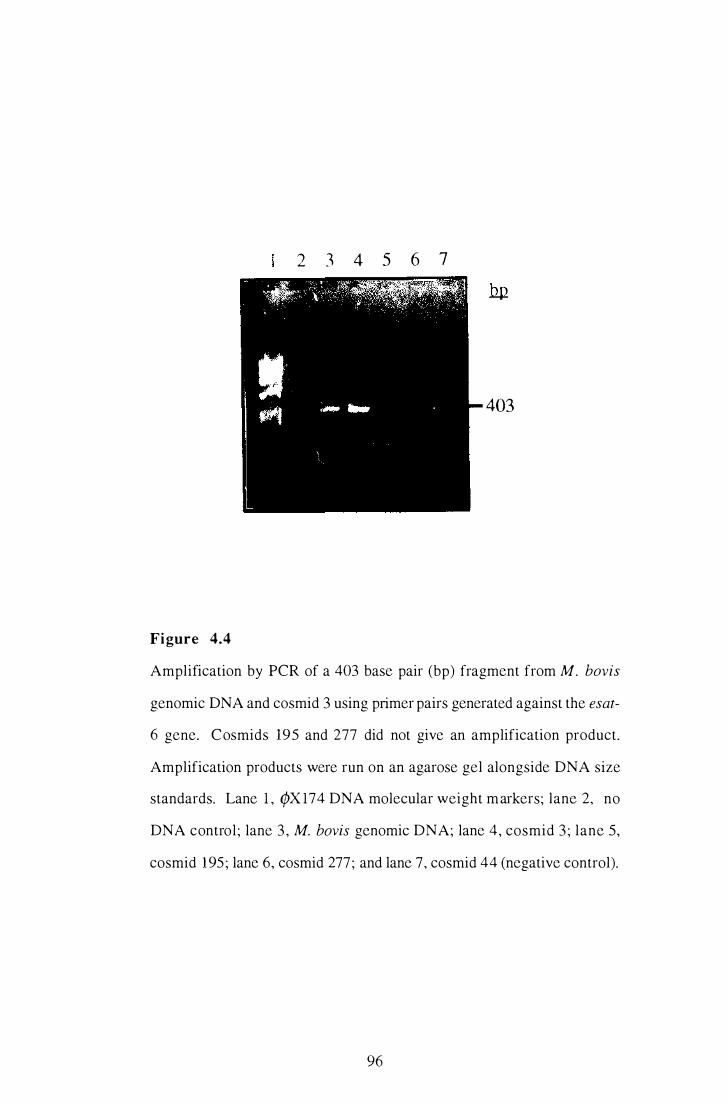
2 J 4 5 6 7
403
Fi gure 4.4
Amplification by PCR of a 403 base pair (bp) fragment from M. bovis
genomic DNA and cosmid 3 using primer pairs generated against the esat-
6 gene. Cosmids 195 and 277 did not give an amplification product.
Amplification products were run on an agarose gel alongside DNA size
standards. Lane 1 , CPX 174 DNA molecular weight m arkers; lane 2, no
DNA control; lane 3 , M. bovis genomic DNA; lane 4, cosmid 3 ; lane 5,
cosmid 1 95 ; lane 6, cosmid 277; and lane 7, cosmid 44 (negative control).
96
4.3.4 Western blot identification of the M. bovis secreted antigen MPB64
in culture filtrate from recombinant M. smegmatis
Western blot analysis was carried out on a recombinant M. smegmatis CF sample to
determine if M. bovis proteins could be synthesised and secreted into the culture medium
from M. smegmatis. The results from the PCR experiments revealed that the gene coding
for the secreted protein MPB64 was located on cosmid 260. Culture filtrates were
prepared from M. smegmatis (cosmid 260) , and a randomly selected recombinant (M.
smegmatis containing cosmid 44) as a negative control. Culture filtrate was also prepared
from M. bovis (strain KML). The proteins in each CF sample were separated by SDS
PAGE in duplicate. One half of the gel was silver-stained to ensure even sample loading
(data not shown), and the duplicate samples were transferred to a nitrocellulose
membrane. The membrane was probed with rabbit polyclonal antibodies raised against
MPB64. The antibody probe bound to a protein of approximately 26 kDa in CF from M.
smeg matis (cosmid 260) and M. bovis (Figure 4.5) . An additional protein of
approximately 22.5 kDa was observed in the M. bovis CF sample. No proteins were
detected in CF from the negative control, M. smegmatis (cosmid 44).
97
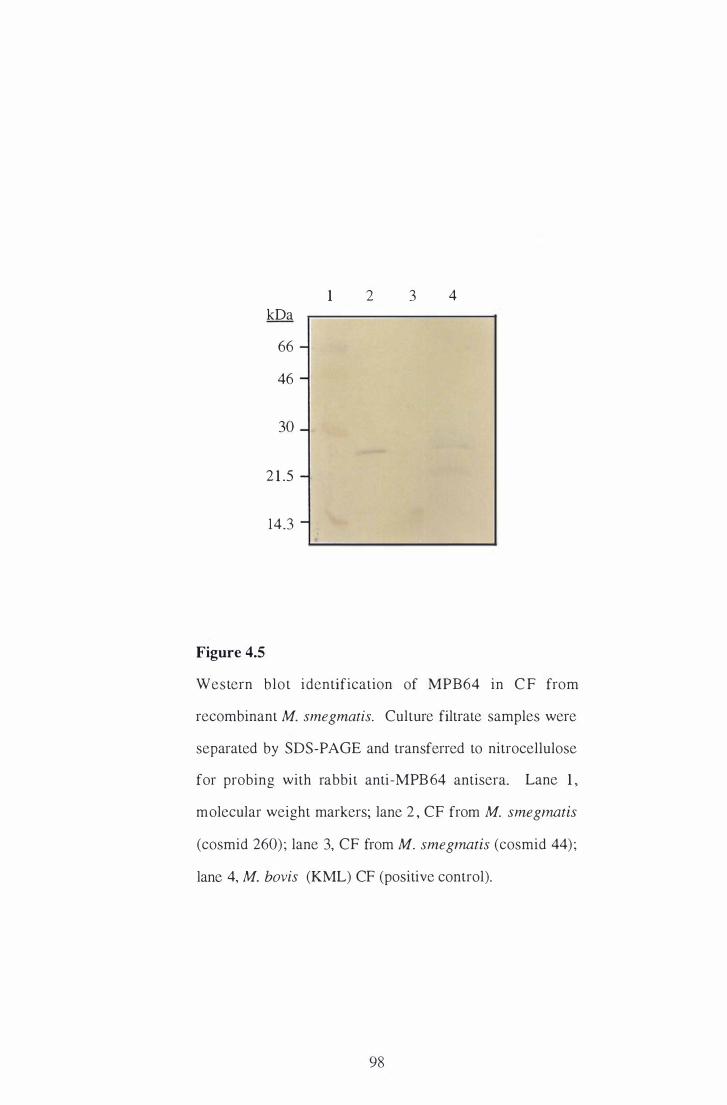
1 2 3 4 kDa
66 -
46 -
30 -
2 1 .5 -
14.3 -
Figure 4.5
Western blot identification of MPB64 in C F from
recombinant M. smegmatis. Culture filtrate samples were
separated by SDS-PAGE and transferred to nitrocellulose
for probing with rabbit anti-MPB 64 antisera. Lane 1 ,
molecular weight markers; lane 2 , CF from M. smegmatis
(cosmid 260) ; lane 3, CF from M. smegmatis (cosmid 44) ;
lane 4, M. bovis (KML) CF (positive control).
98
4.3.5 S creenin g culture fi ltrates from recombinant M. smegmatis for
antigens that stimulate T -lymphocyte proliferation
The development of a cell-mediated immune (CMI) response against tuberculosis
involves the stimulation of T lymphocytes by mycobacterial antigens which are processed
and presented on the surface of antigen-presenting cells. The recognition of antigens can
be measured through the activity of antigen-specific T lymphocytes, and monitored in
vitro by T lymphocyte proliferation and IFN-y production.
Culture filtrates from the selected M. smegmatis recombinants were tested in vitro for
their ability to stimulate proliferation of PBMCs taken from M. bovis B CG-immunised
cattle. Pelipheral blood mononuclear cells from two control cattle (animals 8 and 23)
were also incubated with the CFs to monitor cross reactive T lymphocyte responses. The
animals used in the study were selected on the basis of their low T cell reactivity against
bovine and avian purified protein derivative (PPD-b and PPD-a, respectively), and M.
smegma tis CF (Gormley et ai. , 1 996). Four cattle (animals 5 , 1 2, 1 5 and 2 1 ) were
immunised subcutaneously on two occasions, 1 0 weeks apart, with approximately 105
c .f. u. of M. bovis B CG (Pasteur). The immune responses of the anim als were
monitored throughout the study by lymphocyte proliferation and production of IFN-y in
response to M. bovis BCG CF, PPD-b and PPD-a (Gormley et ai. , 1996). Peripheral
blood mononuclear cells from animals 2 1 (immunised) and 23 (control) had consistently
high background levels of proliferation (i .e. proliferation in the absence of added
antigen). This created a bias in the stimulation indices (SI's) for the recombinant M.
smegmatis and M. bovis BCG CFs, making it difficult to assess the immune responses.
The proliferative responses to M. bovis BCG CF varied greatly between the immunised
animals and the non-immunised control (Table 4.2). Peripheral blood mononuclear cells
from the immunised animals (5, 1 2, and 15) consistently proliferated in response to M.
bovis BCG CF, with SI's ranging from 1 2 to 470. In contrast, no proliferation above
99
background (SI < 1 .0) was observed when PBMCs taken from the control (animal 8)
were incubated with M. bovis BCG CF.
Culture filtrates from M. smegmatis and M. smegmatis (pYUB I 8) were not used as
negative controls as they induced high levels of lymphocyte proliferation compared to
CFs from M. smegma tis recombinants containing cosmids with DNA inserts (Carpenter
and G ormley, pers. comm. , 1 995). The experiments were internally controlled by
comparing responses induced by individual cosmid CF samples.
The selected M. smegmatis recombinants were grown in minimal media and CFs
prepared. Proliferation assays were initially calTied out using three concentrations of the
CF proteins, 0.2, 0 .5 , and 2.0 j..tg/well. The strongest proliferative response by the
PBMCs taken from immunised cattle was at 2.0 j..tg/weU, whereas cells from the control
animals remained unresponsive to the CF samples at this concentration. Subsequent
experiments were carried out using 2.0 j..tg CF per well ( 10 j..tg/ml).
Differences in the proliferative responses of PBMCs from the immunised animals were
observed over time, both in terms of which CF antigens were recognised and the
magnitude of the responses (Table 4.2). The proliferation SI's for PBMCs from
immunised animals in the presence of the recombinant M. smegmatis CF samples peaked
at 20 weeks after the booster immunisation. Culture filtrate from M. smegmatis (cosmids
1 96, 260 and 275) induced high levels of proliferation by PBMCs from animal 1 5 at 25
weeks post boost. These CF samples were not tested at 20 weeks after the booster
immunisation. The PBMCs from three immunised animals proliferated strongly in
response to CF from M. smegmatis (cosmids 44, 48 and 56) compared with the
responses to the other recombinant M. smegmatis CF samples. In contrast, the
proliferative responses to CF from M. smegma tis (cosmid 23) were consistently low
compared to other CF samples. Culture filtrate from M. smegmatis (cosmid 260), which
contained the MPB64 protein, also induced low proliferative responses compared to CFs
1 00
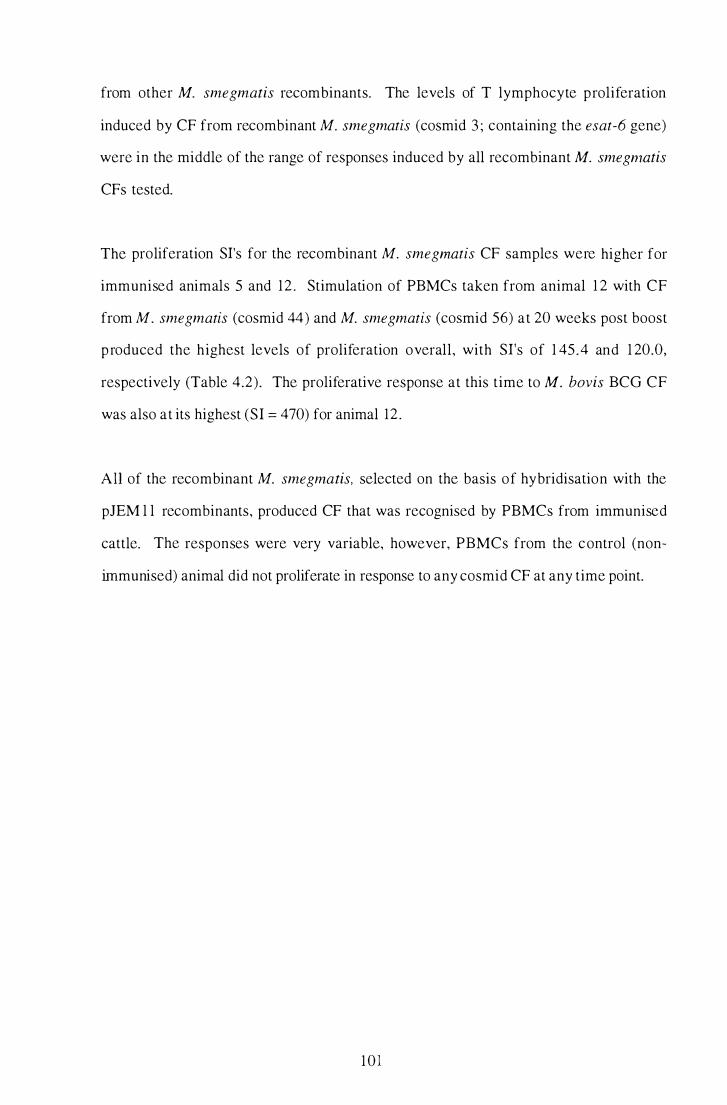
from other M. smegmatis recombinants. The levels of T lymphocyte proliferation
induced by CF from recombinant M. smegmatis (cosmid 3 ; containing the esat-6 gene)
were in the middle of the range of responses induced by all recombinant M. smegnwtis
CFs tested.
The proliferation S1's for the recombinant M. smegnwtis CF samples were higher for
immunised animals 5 and 12 . Stimulation of PBMCs taken from animal 1 2 with CF
from M. smegmatis (cosmid 44) and M. smegmatis (cosmid 56) at 20 weeks post boost
p roduced the highest levels of proliferation overall , with S1's of 1 45 .4 and 1 20.0,
respectively (Table 4.2). The proliferative response at this time to M. bovis BCG CF
was also at its highest (SI = 470) for animal 12 .
All of the recombinant M. smegma tis, selected on the basis of hybridisation with the
pJEM l l recombinants, produced CF that was recognised by PBMCs from immunised
cattle. The responses were very variable, however, PBMCs from the c ontrol (non
irnmunised) animal did not proliferate in response to any cosmid CF at any time point.
1 0 l
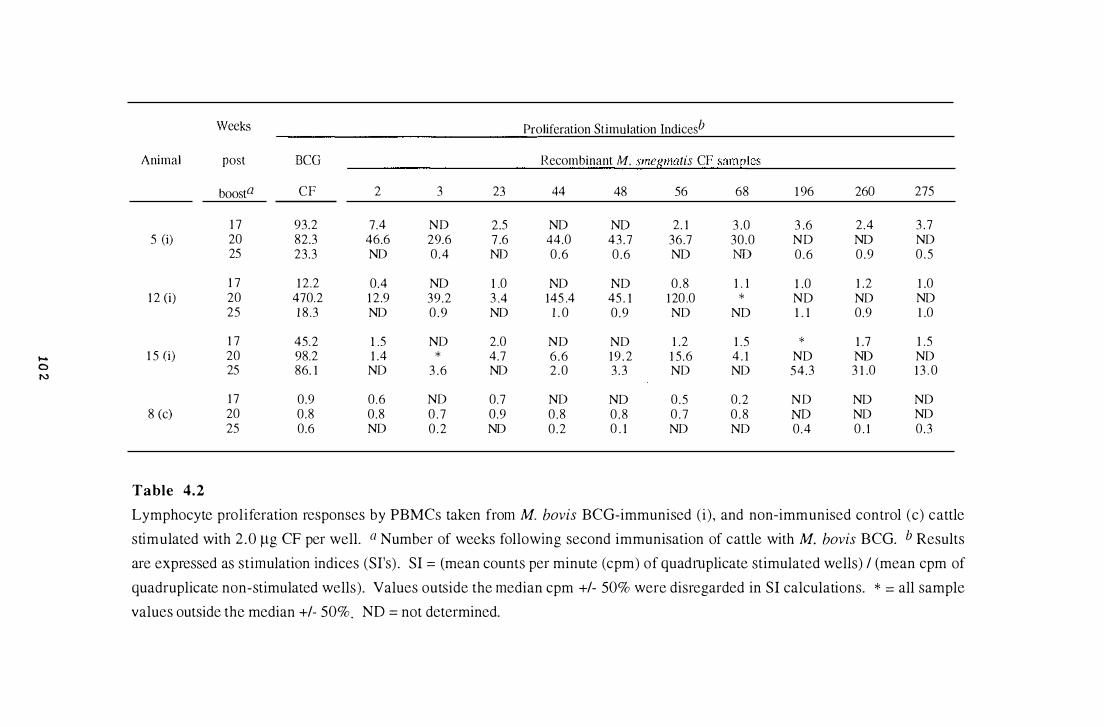
..... 0 N
Weeks Proliferation Stimulation Indiccsb
Animal post BCG Recombinant M. smegma tis CF samples
boosta CF 2 3 23 44 48 56 68 1 96 260 275
1 7 93.2 7.4 ND 2.5 NO NO 2. 1 3 .0 3 .6 2.4 3 .7 5 (i) 20 82.3 46.6 29.6 7 .6 44.0 43 .7 36.7 30.0 NO NO ND
25 23.3 ND 0 .4 ND 0 .6 0 .6 NO NO 0 .6 0 .9 0 .5
1 7 1 2.2 0.4 NO 1 .0 ND NO 0 . 8 1 . 1 1 .0 1 .2 1 .0 1 2 (i) 20 470.2 1 2.9 39.2 3 .4 145 .4 45 . 1 1 20 .0 * NO ND NO
25 1 8 .3 ND 0 . 9 ND 1 . 0 0 .9 ND NO 1 . 1 0.9 1 .0
1 7 45.2 1 .5 ND 2.0 ND ND 1 .2 1 . 5 * 1 .7 1 .5 1 5 (i) 20 98.2 1 .4 * 4.7 6 .6 1 9 . 2 1 5.6 4 . 1 NO ND ND
25 86. 1 ND 3 .6 ND 2 .0 3 .3 ND ND 54.3 3 1 .0 1 3 . 0
1 7 0.9 0.6 ND 0.7 ND NO 0.5 0 .2 N D NO ND 8 (c) 20 0.8 0.8 0 . 7 0.9 0 .8 0 . 8 0 . 7 0 . 8 NO ND ND
25 0.6 ND 0 .2 ND 0.2 0 . 1 ND ND 0.4 0 . 1 0 .3
Table 4.2
Lymphocyte proliferation responses by PBMCs taken from M. bovis BCG-immunised (i), and non-immunised control (c) cattle
stimulated with 2 .0 Ilg CF per well. a Number of weeks following second immunisation of cattle with M. bovis BCG. b Results
are expressed as stimulation indices (SI's) . SI = (mean counts per minute (cpm) of quadmplicate stimulated wells) / (mean cpm of
quadruplicate non-stimulated wells). Values outside the median cpm +/- 50% were disregarded in SI calculations. * = all sample
values outside the median +/- 50%. NO = not determined.
4.3.6 Screening culture filtrates from recombinant M. smegma tis for
antigens that induce IFN-,,{-production by peripheral blood mononuclear
ce l l s
Studies i n mice suggest that T lymphocyte proliferation alone i s not a reliable indicator of
a CMI response against mycobacterial infection (Andersen et ai. , 1992b; Orme et ai. ,
1 992). T cell recognition of antigens can also be monitored in vitro by IFN-"{ production
which is considered a more reliable measure of the CMI response.
Culture filtrates from the selected M. smegmatis recombinants were tested for their ability
to induce IFN-,,{-production by PBMCs taken from M. bovis BCG-immunised animals.
Proliferation assay supernatants were harvested from five day cultures and supernatants
from quadruplicate 2.0 jlg CF samples were pooled. The pooled supernatants were
assayed in duplicate for the presence of IFN-y, using a sandwich ELISA.
The results of IFN-,,{-production by PBMCs from two M. bovis BCG-immunised cattle
(animals 1 2 and 1 5) in response to the ten selected recombinant M. slnegmatis CF
samples are shown in Figure 4.6. As with the proliferative responses, IFN-,,{-production
by PBMCs from immunised cattle varied over time in response to the recombinant M.
smegma tis CF samples. The CF from M. smegmatis (cosmids 44) and M. smegmatis
(cosmid 56) induced high levels of IFN-,,{-production by PBMCs from both immunised
animals. The levels of IFN-"{ production were highest in response to C F from
recombinant M. smegmatis harbouring cosmids 44 and 56 (> 1 0 units/ml). A high level
of IFN-"{ production (approximately 1 1 units/ml) was also observed in response to CF
from M. smegmatis (cosmid 48) with animal 15 . In contrast, low levels of IFN-"{ « 4
units/ml) were produced in response to CF from recombinant M. smegmatis containing
cosmids 23 and 275 with PBMCs from M. bovis BCG-immunised cattle. Culture
filtrate from recombinant M. smegmatis harboUling cosmid 260 (shown by Western blot
analysis to contain the MPB64 protein) induced low levels of IFN-,,{-production « 3 .2
103

units/ml). Moderate levels of IFN-y « 7.5 units/ml) were produced in response to CF
from M. smegnwtis (cosmid 3) . Cosmid 3 has been shown to contain the esat-6 gene,
although it is not known whether the ESAT-6 protein is present in the CF of M .
smegmatis (cosmid 3).
Peripheral blood mononuclear cells from the two immunised cattle consistently produced
IFN-y in the presence of M. bovis BCG CF proteins, ranging between approximately 27
and 1 57 IFN-y units/ml . IFN-y-production by PBMCs taken from a non-immunised
control animal was significantly lower, with less than or equal to 7 .5 IFN-y units/ml
produced in response to M. bovis BCG CF proteins.
1 04
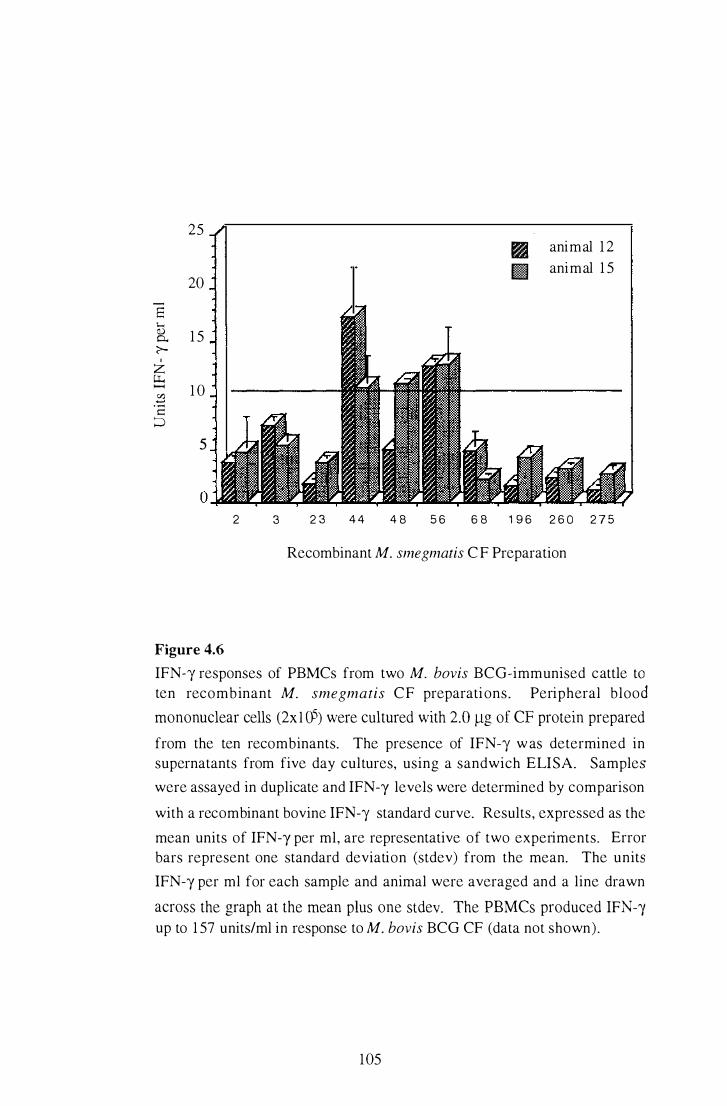
25
,. animal 1 2
II animal 1 5 20
....... E l-; 0) 1 5 0.. ?-
, Z (.I., - 1 0 C/J ..... ·2 �
5
o 2 3 2 3 4 4 4 8 5 6 6 8 1 9 6 2 6 0 2 7 5
Recombinant M. smegmatis C F Preparation
Figure 4.6
IFN-,,{ responses of PBMCs from two M. bovis BCG-immunised cattle to ten recombinant M. smegma tis CF preparations. Peripheral blood
mononuclear cells (2x l cP) were cultured with 2.0 ).lg of CF protein prepared
from the ten recombinants. The presence of IFN-"{ w as determined in supernatants from five day cultures, using a sandwich ELISA. Samples
were assayed in duplicate and IFN-"{ levels were determined by comparison
with a recombinant bovine IFN-"{ standard curve. Results, expressed as the
mean units of IFN-"{ per ml, are representative of two experiments. Error bars represent one standard deviation (stdev) from the mean. The units
IFN-y per ml for each sample and animal were averaged and a line drawn
across the graph at the mean plus one stdev. The PBMCs produced IFN-y up to 1 57 units/ml in response to M. bovis BCG CF (data not shown) .
105
4 . 4 D i s c u s s i o n
An M. bovis cosmid library expressed in M. smegmatis was screened for the presence of
genes coding for exported proteins. Western b lot analysis revealed that M. bovis
proteins could be synthesised and secreted into the medium from M. smegmatis. Culture
filtrates from M. smegmatis recombinants containing M. bovis genes coding for exported
proteins were screened for the presence of T cell antigens, as measured by their ability to
induce proliferation and IFN-y-production by PBMCs taken from M. bovis BCG-
immunised cattle.
PCR amplification was used to identify cosmids containing the genes coding for the
previously characterised secreted antigens ESAT-6, MPB64, MPB70, 85-B and PhoS.
The esat-6 and mpb64 genes were mapped to cosmids 3 and 260 respectively. These
cosmids were also identified by screening the library with insert DNA from PhoA+
clones. This provided evidence that more than one exported protein gene could be
present on a single cosmid insert, and thus questioned the contribution of single or
mUltiple proteins to observed immune responses. To determine if known M. bovis
secreted antigens were expressed and secreted by their M. smegmatis hosts, CF from M.
smegmatis (cosmid 260) was subjected to Westem blot analysis. A 26 kDa protein band
was detected by the anti-MPB64 polyclonal antibodies in the M. smegmatis (cosmid 260)
and M. bovis CF samples. This is similar to the molecular weight of recombinant
MPB64 I MPT64 produced by recombinant M. smegma tis in other studies (Tasaka et ai. ,
1 995 ; Roche et ai. , 1 996). In these studies. the size and tertiary conformation of
recombinant MPT64/MPB64 were the same as the native form of the protein. Western
blot analysis has also revealed that recombinant 85-B antigen is expressed and secreted
by M. smegmatis (cosmid 79) and is the same molecular weight as the native M. bovis
BCG protein (Gormley et ai. , 1 996). The results of the Western blot experiments carried
out in this study, indicate that the cosmid-encoded M. bovis secreted proteins are not
degraded by their M. smegmatis host, in contrast to the PhoA fusion proteins examined
1 06
in Chapter 3 . This provided evidence that stably formed proteins were more resistant to
degradation by host proteases compared to fusion polypeptides.
Short-term CFs of M. tuberculosis and M. bovis are major targets of T cell responses to
these mycobacteria. The MPT64 protein is present in M. tuberculosis CFs, and is
recognised by tuberculosis patients but not M. bovis BCG vaccinated humans (Roche et
at. , 1 994). The MPB64 protein is also a major target for immune recognition in M.
bovis-infected cattle (Fifis et ai. , 1 994). The M. bovis BCG (Pasteur) strain used to
immunise the animals in this study, has previously been shown to lack the mpb64 gene
(Li et a I. , 1 993). Therefore any immune responses to CFs from M. smegma tis (cosmid
260) would presumably be directed against other protein components of the CF. In spite
of the observation that recombinant MPB64 was secreted in sufficient quantities to be
detected by antibodies, the levels of proliferation and IFN-y-production by PBMCs taken
from immunised animals were low compared to other recombinant M. smegmatis CF
samples tested. Similar results were obtained with CF from recombinant M. smegmatis
(cosmid 3 ; containing the esat-6 gene). The esat-6 gene is also known to be deleted from
M. bovis BCG (Harboe et aI. , 1 996). These results suggest that CF prepared from M.
smegmatis (cosmid 3) and M. smegma tis (cosmid 260) do not contain antigens which
induce strong immune responses in these immunised animals.
The CFs prepared from the recombinant M. smegnUltis selected by hybridisation to insert
DNA from PhoA+ clones were screened for their ability to induce proliferation and IFN
y-production by PBMCs taken from M. bovis BCG-immunised and non-immunised
control cattle. Culture filtrates from M. smegmatis (cosmid 44) and M. smegmatis
(cosmid 56) induced IFN-y-production by PBMCs from two M. bovis BCG-immunised
animals. The CF from these M. smegmatis recombinants were also able to induce
proliferation of lymphocytes from all M. bovis BCG-immunised cattle tested. It is likely,
therefore, that CF preparations from M. smegmatis (cosmid 44) and M. smegmatis
(cosmid 56) contain one or more cosmid-encoded T cell antigens. Protein analysis by
107
SDS-PAGE did not reveal any visible differences between the M. smegmatis
recombinants, indicating that the secreted recombinant proteins represent a small
propOltion of the total CF protein.
V ariation was observed in the immune responses of the immunised anim als to the
individual recombinant M. smegmatis CF samples. This heterogeneity of responses was
not u nexpec ted in relatively outbred animals such as cattle, and has previously been
observed in M. bovis BCG-immunised animals (Carpenter and Gormley, pel's. comm.,
1 995) and M. bovis-infected cattle (Fifis et aI. , 1 994). In the Fifis study using M. bovis
infected cattle, there was also considerable variation in the responses to purified M. bovis
antigens over time, with different antigens being recognised at different stages of the
infection.
In general, the magnitude of the T cell proliferative responses induced by each CF
preparation correlated with the IFN-)' responses. Culture filtrates from M. smegmatis
(cosmid 44) and M. smegmatis (cosmid 56) induced the highest responses in both the
proliferation and IFN-)' assays, whereas CF from M. smegmatis (cosmid 23) induced
minimal responses in each assay . In a study using M. bovis infected cattle, IFN-),
responses have been shown to be highly reproducible (Rothel et ai. , 1 992). While the
results of the IFN-)' assays in the present study showed some variability between animals
and over time, they were more consistent than the lymphocyte proliferation assays. This
suggests that IFN-),-production by PBMCs from M. bovis BCG-immunised animals is a
more reliable measure of T cell reactivity than lymphocyte proliferation.
The observation that recom binant M. smegmatis CF samples (cosmids 44 and 56)
induced the highest responses in both the proliferation and IFN-)' assays demonstrated
the usefulness of the M. smegmatis expression system for the detection of T lymphocyte
reactive antigens. Although the recom binant M. smegmatis CFs contained a complex
mixture of proteins, the screening system could distinguish between M. smegmatis
1 08
proteins and M. bovis antigens. This was also true when the magnitude of individual
animal's responses varied. This might have been expected as the immunised animals
used in this study were chosen on the basis of low lymphocyte reactivity against M.
smegmatis CF proteins. Following immunisation and routine testing of CMI responses,
the cross-reactive responses to M. smegmatis and M. smegmatis (pYUB I 8) wer. found to
be considerably greater than responses to randomly selected M. smegmatis containing
pYUB 1 8 with M. bovis DNA inserts (Carpenter et ai. , 1 995). It is possible that the
increased genetic load on the host M. smegmatis containing large inserts could alter the
synthesis and secretion patterns of host native proteins.
Many of the previously characterised mycobacterial antigens were originally detected by
screening with antisera taken from tuberculin positive patients (Amara and
Satchidanandam, 1996), or with monoclonal antibodies generated against mycobacterial
proteins (Young et al. , 1 985). More direct approaches involving biochemical
fractionation of CF proteins and assaying directly for T cell activity have resulted in the
detection of several immunodominant antigens. Recombinant cosmid libraries, as
described in this study, offer an alternative, convenient method of antigen detection. The
large insert sizes provide an advantage over conventional plasmid or phage libralies in
that relatively few clones are necessary for full representation of a complete genome.
When the library is cloned in a heterologous, but related host, the probability is increased
that the gene expression signals will be recognised. In addition, protein export signals
and signals involved in post-translational modifications may also function in the
alternative host. The identification of secreted antigens in CFs prepared from
recombinant M. smegmatis demonstrates the potential of this heterologous expression
system for the analysis of a wide range of M. bovis secreted antigens.
109

Chapter 5 :
Characterisation Of A n M. bovis
Putative Exported Lipoprotein (Pel)
With Homology To A Family Of
Mal tose-B i nding Proteins
1 10
5 . 1 Abstract
This chapter describes the characterisation of an M. bovis putative exported lipoprotein
(Pel). The pel gene was subcloned from cosmid 56 of the M. bovis cosmid library, and
its nucleotide sequence determined and analysed. Database searches with the predicted
amino acid sequence of M. bovis Pel revealed similarity to an M. leprae putative
lipoprotein and a family of maltose-binding proteins. A search of adjacent genes in M.
leprae revealed two ORFs, coding for putative maltose transport proteins, located
downstream of the pel homologue. The start of an ORF, with similarity to a putative M.
Zeprae maltose transport protein, was identified downstream of the M. bovis pel gene.
Analysis of loci regulating maltose and maltodextrin transport in other bacteria suggested
that the M. bovis pel gene and its M. leprae homologue may be part of an operon
involved in maltose and maltodextrin transport. Southern blot analysis indicated that both
slow and fast-growing mycobacterial species contain sequences related to the pel gene.
The M. bovis pel gene was expressed by recombinant M. smegmatis as shown by
Northern blot analysis.
M. smegmatis recombinants containing the M. bovis pel gene and a randomly selected,
cloned M. bovis DNA fragment were grown in culture and the supernatants collected.
The CFs were tested in vitro for their ability to induce proliferation and IFN-,,{-production
by PBMCs taken from M. bovis BCG-immunised and non-immunised, control cattle.
The level of IFN-,,{-production by PBMCs from one of the M. bovis BCG-immunised
animals was two-fold higher in the presence of CF from the recombinant expressing the
pel gene.
1 1 1
5 . 2 Resu l ts
5.2. 1 S ubcloning of the M. bovis putative exported lipop rotein gene
from cosmid 56
The pSUM family of Mycobacterium I E. coli shuttle vectors contain seven unique
cloning sites, a kanamycin resistance gene, and a lacZa reporter gene for screening for
recombinants in E. coli (Ainsa et al. , 1996). The universal M 1 3 sequencing primers can
be used to obtain insert DNA sequences adjacent to the multiple cloning site (MCS).
The plasmid construct pM2 1 contains a 1 .5 kb M. bovis BCG DNA insert cloned into the
pJEM l l vector (Chapter 3). DNA sequence analysis showed that the pM2 1 plasmid
contains a partial Qutative �xported lipoprotein (pel) gene fused to phoA. S outhern blot
analysis revealed that the pel gene is located on cosmid 56 of the M. bovis cosmid
library. A restriction map of the pM21 insert DNA was generated to identify potentially
suitable enzymes for subcloning the full length gene from cosmid 56. Five restriction
enzymes (Bam HI, Cia I, Hin dill, Sph I and Xba I) which did not cut w ithin the pM2 1
ORF o r its immediate upstream region were compatible with sites in the MCS o f the
pSUM vectors. Cosmid 56 DNA was purified from recombinant E. coli and digested
with these five restriction enzymes. A randomly selected cosmid was also digested to
serve as a negative control. Following electrophoresis, the DNA fragments were blotted
onto nylon membranes and probed with radiolabelled insert DNA from pM21 . The probe
hybridised to a single DNA fragment in each digested cosmid 56 sample. The smallest
fragment to which the probe hybridised, a Cia I-fragment of approximately 8 .3 kilobases
(kb), was selected for subcloning.
DNA fragments generated by Cia I-digestion of cosmid 56 were separated by
electrophoresis. Two fragments, of approximately 8 .3 and 1 0 kb, were excised together
and purified from the agarose gel. The Cla I-fragments were ligated into CZa I-digested,
1 1 2
dephosphorylated pSUM40, and used to transform E. coli. The two cosmid subclones
(subclones 561 1 and 5612) were isolated and purified from recombinant E. coli. Southern
blot analysis of the subclones 561 1 and 56/2 was carried out to determine which subclone
contained the exported lipoprotein gene (Figure 5 . 1 ) . The pM2 1 insert D NA probe
hybridised to the DNA insert of subclone 5612 (approximately 8 .3 kb). A fragment of
identical size in the cosmid 56 control sample, and a larger fragment (>10 kb) in the Cia
I-digested M. bovis genomic DNA control also hybridised to the DNA probe. No bands
were observed in the lanes containing the digests of subclone 56/ 1 or the randomly
selected cosmid (negative control). This indicated that subclone 56/2 contained the M.
bovis equivalent sequence of at least part of the M. bovis BeG DNA sequence of the
pM2 1 insert.
To determine if the full length pel gene was present in subclone 56/2, the universal M 1 3
sequencing primers were used to sequence the ends o f the DNA insert. Database
searches using sequence data generated with the M l 3 reverse primer revealed similarity to
sequences in an M. leprae cosmid (B 1 7 56) that contained an hom ologous pel gene.
These sequences mapped approximately 5 .65 kb downstream from the 3' end of the pel
gene. Sequence obtained with the M 1 3 forward primer showed similarity to the
pAL5000 sequence from M. Jortuitum, suggesting that part of the p YUB 1 8 cosmid
vector w as contained within the -8.3 kb Cia I-fragment insert of sub clone 56/2. This
explained the size differences between the observed M. bovis genomic DNA Cia 1-
fragment, and the cosmid 56 and subclone 5612 fragments (Figure 5 . 1 ) . DNA
sequencing of subclone 56/2, using a primer designed to hybridise approximately 600
nucleotides upstream of the pM2 1 ORF (pel-phoA), confirmed that M. bovis DNA
sequences upstream of the pel gene were identical to the M. bovis BeG sequences of the
pM2 1 insert.
1 I 3
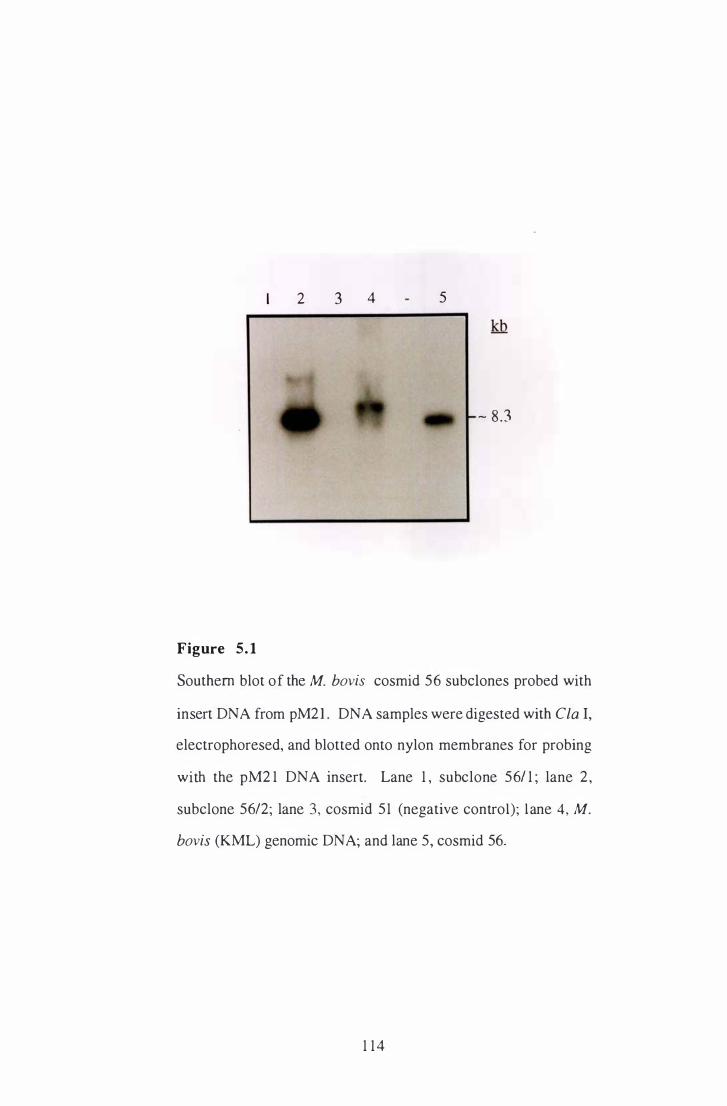
1 2
Figure 5. 1
3 4 5
- 8.3
Southern blot of the M. bovis cosmid 56 subclones probed with
insert DNA from pM21 . DNA samples were digested with Cia I,
electrophoresed, and blotted onto nylon membranes for probing
with the pM2 1 DNA insert. Lane 1 , subclone 561 1 ; lane 2 ,
subclone 56/2; lane 3, cosmid 51 (negative control); lane 4, M.
bovis (KML) genomic DNA; and lane 5, cosmid 56.
1 1 4
5.2.2 N ucleotide sequence of the M. bovis pel gene
The complete nucleotide sequence of the pel gene located in subclone 56/2 was
determi ned on both strands using PCR cycle sequencing. Oligonucleotide primers
designed to sequence the M. bovis BCG pM2 1 insert (Appendix 2B) were used to
sequence the corresponding region of the M. bovis DNA insert of subclone 56/2. The
M. bovis and M. bovis BCG sequences were identical over the 1254 nucleotide bases
common to the pM2 1 and subclone 56/2 DNA inserts. Additional oligonucleotide
primers were generated based on the available sequence data (Appendix 2C), and the full
length gene was sequenced in a stepwise manner using subclone 56/2 DNA as a template
for PCR cycle-sequencing.
The nucleotide and deduced amino acid sequences of the M. bovis Pel protein are shown
in Figure 5.2. The M. bovis 1 404 bp ORF extends from a putative GTG start codon at
position 3 6 1 to a TGA stop codon at position 1 825. A potential Shine-Dalgarno (SD)
motif (GAGAGG) is located at position -6 with respect to the putative GTG start codon.
A secon d potential start codon (ATG) is found at position 367 , 1 2 bases downstream
from the potential SD sequence. The G+C content of the ORF (66. 1 %) is consistent with
the global G+C content observed in the mycobacterial genome.
The M. bovis ORF potentially codes for a 468 amino acid polypeptide with a putative
lipoprotein signal peptide of 25 amino acids. The sequence adjacent to the putative
cleavage site (AAA .J.C) is consistent with the lipoprotein signal peptidase consensus
(L,VJ)(A,S,T,G)(G,A) {- C (von Heijne, 1989). The calculated molecular mass of the
polypeptide precursor is 49.8 kDa, and the mature Pel protein is 47 .3 kDa. This is of
similar size to the homologous M. leprae 1407 bp ORF, which encodes a 469 amino acid
polypeptide precursor with a 26 amino acid putative signal peptide. The M. leprae Pel
precursor contains a sequence (VLA t C) similar to the lipoprotein signal peptidase
consensus. The M. leprae Pel homologue polypeptide precursor has a calculated
1 1 5
molecular mass of 50.5 kDa, and the mature protein is 47 .8 kDa. Alignment of the M.
bovis and M. leprae ORFs indicates that they are 76% identical at the nucleotide level.
The deduced amino acid sequences are 78% identical and 88% similar between species.
The amino acid composition of the full-length M. bovis Pel protein reveals a high
percentage ( 1 6%) of alanine residues. The next most abundant amino acid is leucine at
9 .8%, followed by valine, threonine, proline and glycine, which each make up 7 . 1 to
7 .5% of the protein. These amino acids contain non-polar side chains, with the exception
of threonine which has an uncharged, polar side chain. A hydrophobicity plot, based on
the Kyte-Doolittle predictions is shown in Figure 5 .3 . The N-terminal p utative signal
peptide is the m ost hydrophobic region of the protein, and is followed by a relatively
hydrophilic region of approximately 175 amino acid residues. The middle section of the
primary sequence (amino acids 200 to 360) is predominantly hydrophobic, although three
weakly hydrophilic domains are evident. The remaining C-terminal protein sequence is
predominantly hydrophilic with the exception of a hydrophobic stretch of approximately
20 residues.
The predicted isoelectric point (pI) of the mature 47 kDa Pel protein is 4 .94. Two
dimensional gel electrophoresis of CF from M. bovis BCG has revealed that the majority
of secreted proteins have a pI values between 4.5 and 6.0 (Gulie et al. , 1 995) . A cluster
of proteins has been observed between 45 and 50 kDa at approximately pH 4.9.
1 1 6
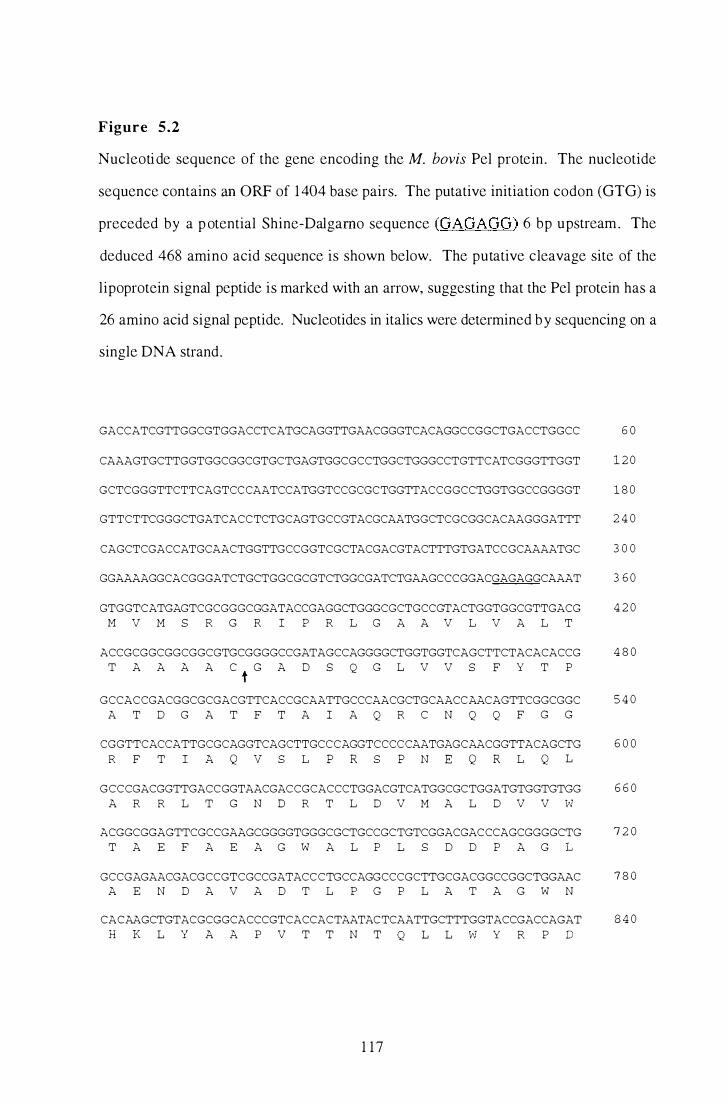
Figure 5.2
Nucleotide sequence of the gene encoding the M. bovis Pel protein. The nucleotide
sequence contains an ORF of 1 404 base pairs. The putative initiation codon (GTG) is
preceded by a p otential Shine-Dalgamo sequence (GAGAGG) 6 bp upstream. The
deduced 468 amino acid sequence is shown below. The putative cleavage site of the
lipoprotein signal peptide is marked with an arrow, suggesting that the Pel protein has a
26 amino acid signal peptide. Nuc1eotides in italics were determined b y sequencing on a
single DNA strand.
GACCATCGTTGGCGTGGACCTCATGCAGGTTGAACGGGTCACAGGCCGGCTGACCTGGCC 6 0
CAAAGTGCTTGGTGGCGGCGTGCTGAGTGGCGCCTGGCTGGGCCTGTTCATCGGGTTGGT 1 2 0
GCTCGGGTTCTTCAGTCCCAATCCATGGTCCGCGCTGGTTACCGGCCTGGTGGCCGGGGT 1 8 0
GTTCTTCGGGCTGATCACC TCTGCAGTGCCGTACGCAATGGCTCGCGGCACAAGGGATTT 2 4 0
CAGCTCGACCATGCAACTGGTTGCCGGTCGCTACGACGTACTTTGTGATCCGCAAAATGC 3 0 0
GGAAAAGGCACGGGATCTGCTGGCGCGTCTGGCGATCTGAAGCCCGGACGAGAGGCAAAT 3 6 0
GTGGTCATGAGTCGCGGGCGGATACCGAGGCTGGGCGCTGCCGTACTGGTGGCGTTGACG 4 2 0
M V M S R G R I P R L G A A V L V A L T
ACCGCGGCGGCGGCGTGCGGGGCCGATAGCCAGGGGCTGGTGGTCAGCTTCTACACACCG 4 8 0
T A A A A C t G A D S Q G L V V S F Y T P
GCCACCGACGGCGCGACGTTCACCGCAATTGCCCAACGCTGCAACCAACAGTTCGGCGGC 5 4 0
A T D G A T F T A I A Q R C N Q Q F G G
CGGTTCACCATTGCGCAGGTCAGCTTGCCCAGGTCCCCCAATGAGCAACGGTTACAGCTG 6 0 0
R F T I A Q v S L P R S P N E Q R L Q L
GCCCGACGGTTGACCGGTAACGACCGCACCCTGGACGTCATGGCGCTGGATGTGGTGTGG 6 6 0
A R R L T G N D R T L D V M A L D V V W
ACGGCGGAGTTCGCCGAAGCGGGGTGGGCGCTGCCGCTGTCGGACGACCCAGCGGGGCTG 7 2 0
T A E F A E A G W A L P L S D D P A G L
GCCGAGAACGACGCCGTCGCCGATACC C TGCCAGGCCCGCTTGCGACGGCCGGCTGGAAC 7 8 0
A E N D A V A D T L P G P L A T A G W N
CACAAGCTGTACGCGGCACCCGTCACCACTAATACTCAATTGCTTTGGTACCGACCAGAT 8 4 0
H K L Y A A P V T T N T Q L L W Y R P D
1 1 7
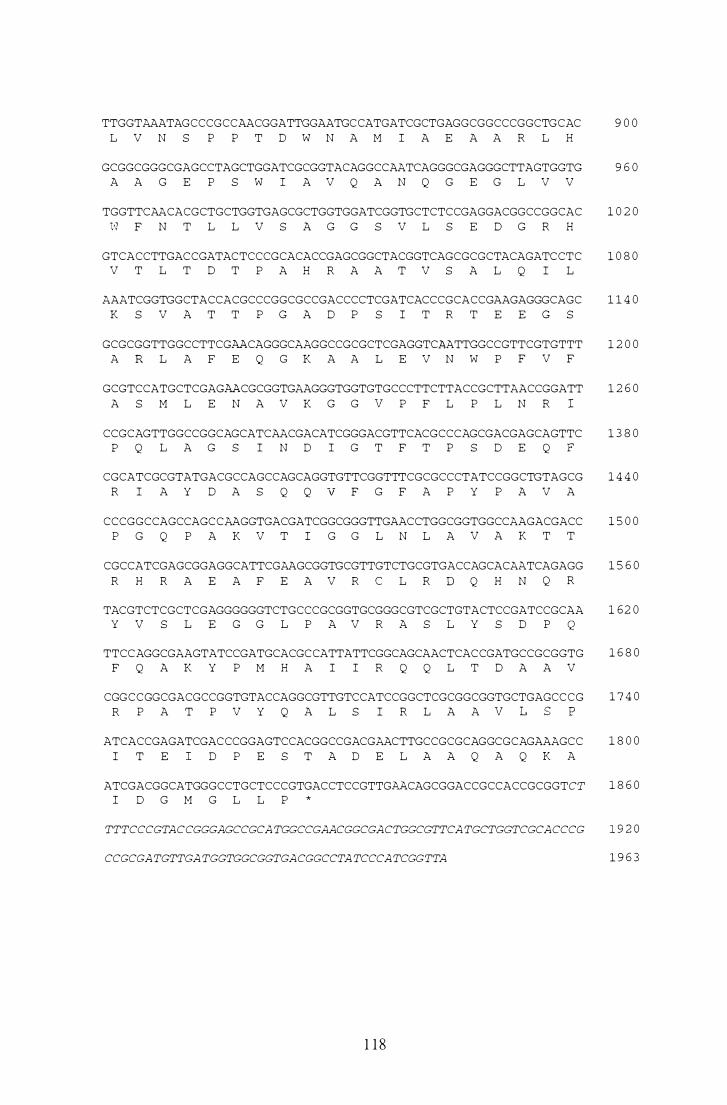
TTGGTAAATAGCCCGCCAACGGATTGGAATGCCATGATCGCTGAGGCGGCCCGGCTGCAC 9 0 0
L V N S P P T D W N A M I A E A A R L H
GCGGCGGGCGAGCCTAGCTGGATCGCGGTACAGGCCAATCAGGGCGAGGGCTTAGTGGTG 9 6 0
A A G E P S W I A V Q A N Q G E G L V V
TGGTTCAACACGCTGCTGGTGAGCGCTGGTGGATCGGTGCTCTCCGAGGACGGCCGGCAC 1 0 2 0
W F N T L L V S A G G S V L S E D G R H
GTCACCTTGACCGATACTCCCGCACACCGAGCGGCTACGGTCAGCGCGCTACAGATCCTC 1 0 8 0
V T L T D T P A H R A A T V S A L Q I L
AAATCGGTGGCTACCACGCCCGGCGCCGACCCCTCGATCACCCGCACCGAAGAGGGCAGC 1 1 4 0
K S V A T T P G A D P S I T R T E E G S
GCGCGGTTGGCCTTCGAACAGGGCAAGGCCGCGCTCGAGGTCAATTGGCCGTTCGTGTTT 1 2 0 0
A R L A F E Q G K A A L E V N W P F V F
GCGTCCATGCTCGAGAACGCGGTGAAGGGTGGTGTGCCCTTCTTACCGCTTAACCGGATT 1 2 6 0
A S M L E N A V K G G V P F L P L N R I
CCGCAGTTGGCCGGCAGCATCAACGACATCGGGACGTTCACGCCCAGCGACGAGCAGTTC 1 3 8 0
P Q L A G S I N D I G T F T P S D E Q F
CGCATCGCGTATGACGCCAGCCAGCAGGTGTTCGGTTTCGCGCCCTATCCGGCTGTAGCG 1 4 4 0
R I A Y D A S Q Q v F G F A P Y P A V A
CCCGGCCAGCCAGCCAAGGTGACGATCGGCGGGTTGAACCTGGCGGTGGCCAAGACGACC 1 5 0 0
P G Q P A K V T I G G L N L A V A K T T
CGCCATCGAGCGGAGGCATTCGAAGCGGTGCGTTGTCTGCGTGACCAGCACAATCAGAGG 1 5 6 0
R H R A E A F E A V R C L R D Q H N Q R
TACGTCTCGCTCGAGGGGGGTCTGCCCGCGGTGCGGGCGTCGCTGTACTCCGATCCGCAA 1 6 2 0
Y V S L E G G L P A V R A S L Y S D P Q
TTCC AGGCGAAGTATCCGATGCACGCCATTATTCGGCAGCAACTCACCGATGCCGCGGTG 1 6 8 0
F Q A K Y P M H A I I R Q Q L T D A A V
CGGCCGGCGACGCCGGTGTACCAGGCGTTGTCCATCCGGCTCGCGGCGGTGCTGAGCCCG 1 7 4 0
R P A T P V Y Q A L S I R L A A V L S P
ATCACCGAGATCGACCCGGAGTCCACGGCCGACGAACTTGCCGCGCAGGCGCAGAAAGCC 1 8 0 0
I T E l D P E S T A D E L A A Q A Q K A
ATCGACGGCATGGGCCTGCTCCCGTGACCTCCGTTG.�CAGCGGACCGCCACCGCGGTCT 1 8 6 0
I D G M G L L P *
TTTCCCGTACCGGGAGCCGCA TGGCCGAACGGCGACTGGCGTTCA TGCTGGTCGCACCCG 1 9 2 0
CCGCGATGTTGA TGGTGGCGGTGACGGCCTA TCCCATCGGTTA 1 9 6 3
1 1 8
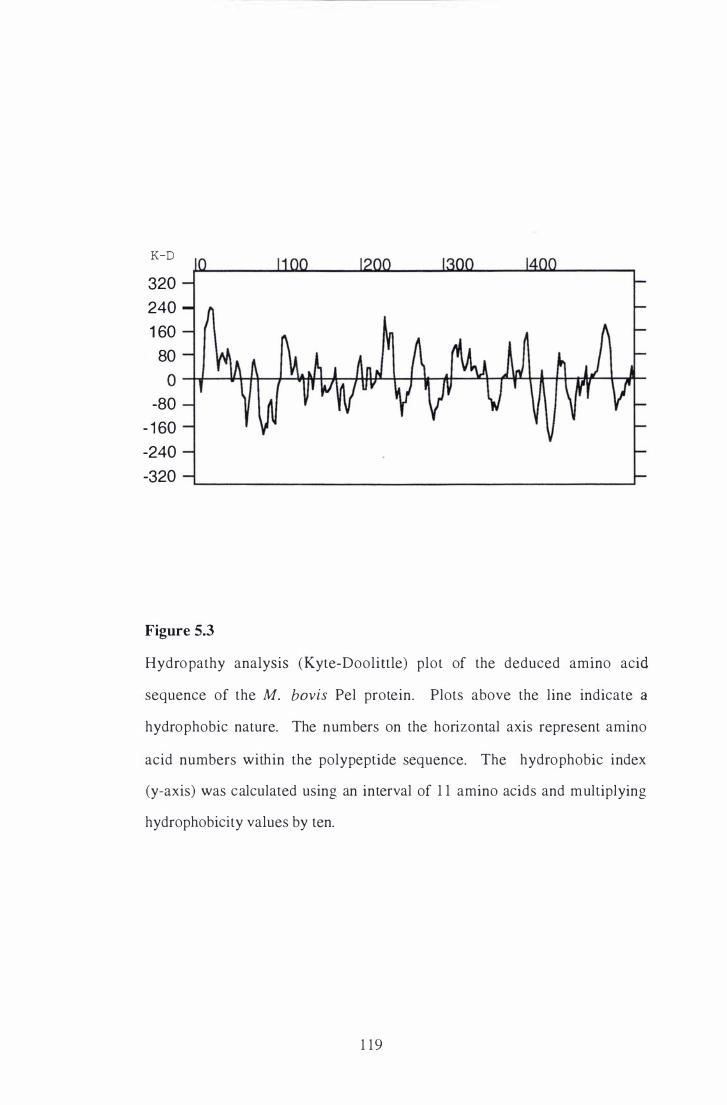
K-D
320 240 1 60
80 0��������-+������9-�����-+�
-80 - 1 60 -240 -320
Figure 5.3
Hydropathy analysis (Kyte-Doolittle) plot of the deduced ammo acid
sequence of the M. bovis Pel protein. Plots above the line indicate a
hydrophobic nature. The numbers on the horizontal axis represent amino
acid numbers within the polypeptide sequence. The hydrophobic index
(y-axis) was calculated using an interval of 1 1 amino acids and multiplying
hydrophobicity values by ten.
1 19
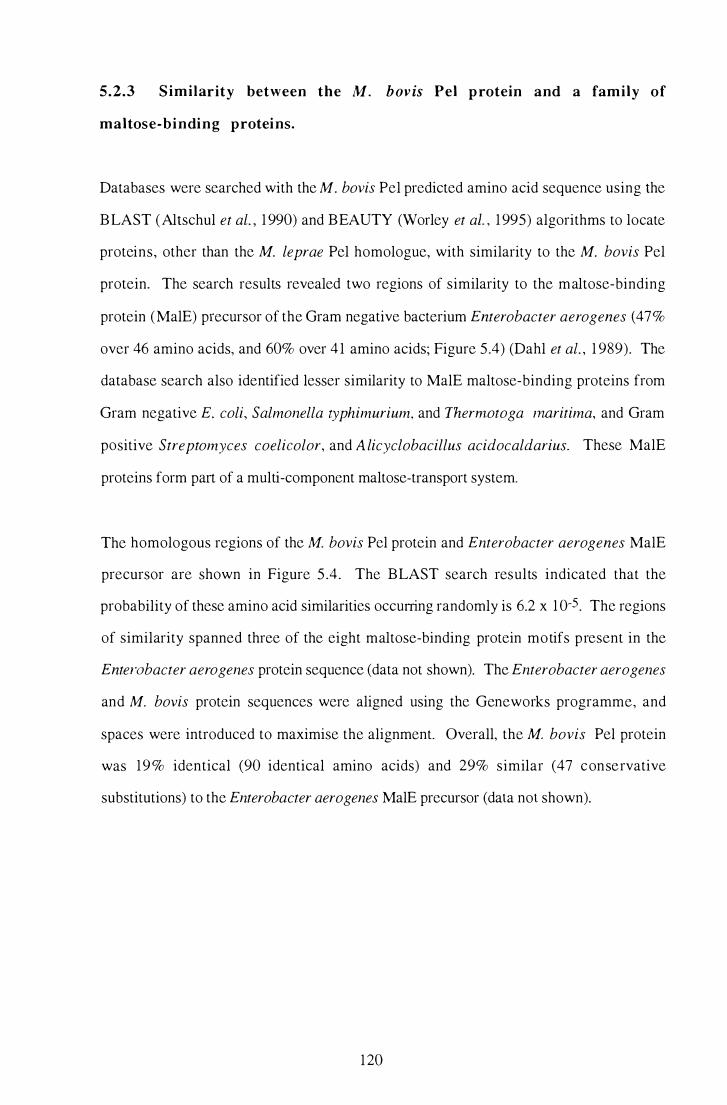
5.2.3 Similarity between the M. bovis Pel p rotein and a family of
maltose-bi ndi n g protei ns.
Databases were searched with the M. bovis Pel predicted amino acid sequence using the
B LAST ( Altschul et ai. , 1 990) and BEAUTY (Worley et aI. , 1 995) algorithms to locate
proteins, other than the M. leprae Pel homologue, with similarity to the M. bovis Pel
protein. The search results revealed two regions of similarity to the maltose-binding
protein (MalE) precursor of the Gram negative bacterium Enterobacter aerogenes (47%
over 46 amino acids, and 60% over 41 amino acids; Figure 5.4) (Dahl et aI. , 1 989). The
database search also identified lesser similarity to MalE maltose-binding proteins from
Gram negative E. coli, Salmonella typhimurium, and Thermotoga maritima, and Gram
positive Streptomyces coelieolor, and A licyclobacillus acidocaldarius. These MalE
proteins form paI1 of a multi-component maltose-transport system.
The homologous regions of the M. bovis Pel protein and Enterobacter aerogenes MalE
precursor are shown in Figure 5 .4. The BLAST search results indicated that the
probability of these amino acid similarities occuning randomly is 6.2 x 1 0-5. The regions
of similarity spanned three of the eight maltose-binding protein motifs present in the
Enterobacter aerogenes protein sequence (data not shown). The Enterobacter aerogenes
and M. bovis protein sequences were aligned using the Geneworks programme, and
spaces were introduced to maximise the alignment. Overall, the M. bovis Pel protein
was 19% identical (90 identical amino acids) and 29% similar (47 conservative
substitutions) to the Enterobacter aerogenes MalE precursor (data not shown).
1 20
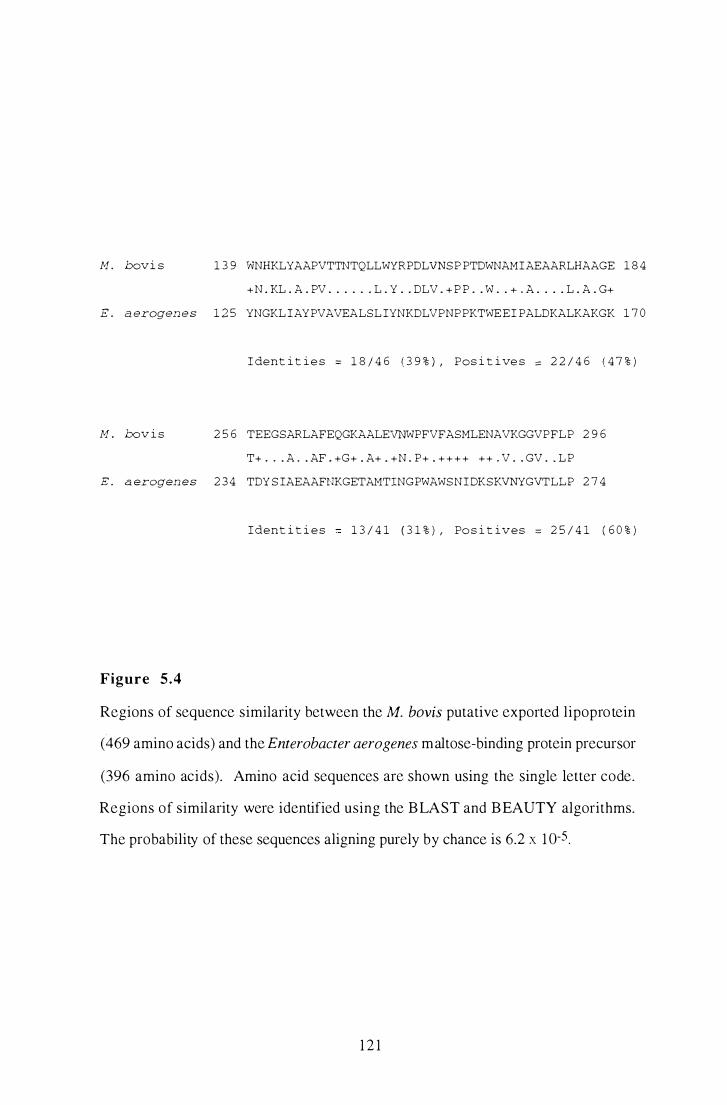
M . bovi s 1 3 9 WNHKLYAAPVTTNTQLLWYRPDLVNS P PTDWNAMIAEAARLHAAGE 1 8 4
+ N . KL . A . PV . . . . . . L . Y . . DLV . + P P . . W . . + . A . . . . L . A . G+
E . a erogen es 1 2 5 YNGKL IAY PVAVEALSL IYNKDLVPNP PKTWE E I PALDKALKAKGK 1 7 0
M . bov i s
I dent i t i e s ::; 1 8 / 4 6 ( 3 9 % ) , Pos i t i ve s � 2 2 / 4 6 ( 4 7 % )
2 5 6 TEEGSARLAFEQGKAALEVNWPFVFASMLENAVKGGVPFL P 2 9 6
T+ . . . A . . AF . +G+ . A+ . + N . P+ . + + + + + + . V . . GV . . L P
E . a erogen es 2 3 4 TDY S IAEAAFNKGETAMTINGPWAWS N I DKSKVNYGVTLLP 2 7 4
I dent i t i e s 1 3 / 4 1 ( 3 1 % ) , Po s i t ives ::; 2 5 / 4 1 ( 6 0 % )
Figure 5.4
Regions of sequence similarity between the M. bovis putative exported lipoprotein
(469 amino acids) and the Enterobacter aerogenes maltose-binding protein precursor
(396 amino acids). Amino acid sequences are shown using the single letter code.
Regions of similarity were identified using the B LAST and B EAUTY algorithms.
The probability of these sequences aligning purely by chance is 6.2 x 1 0-5.
1 2 1
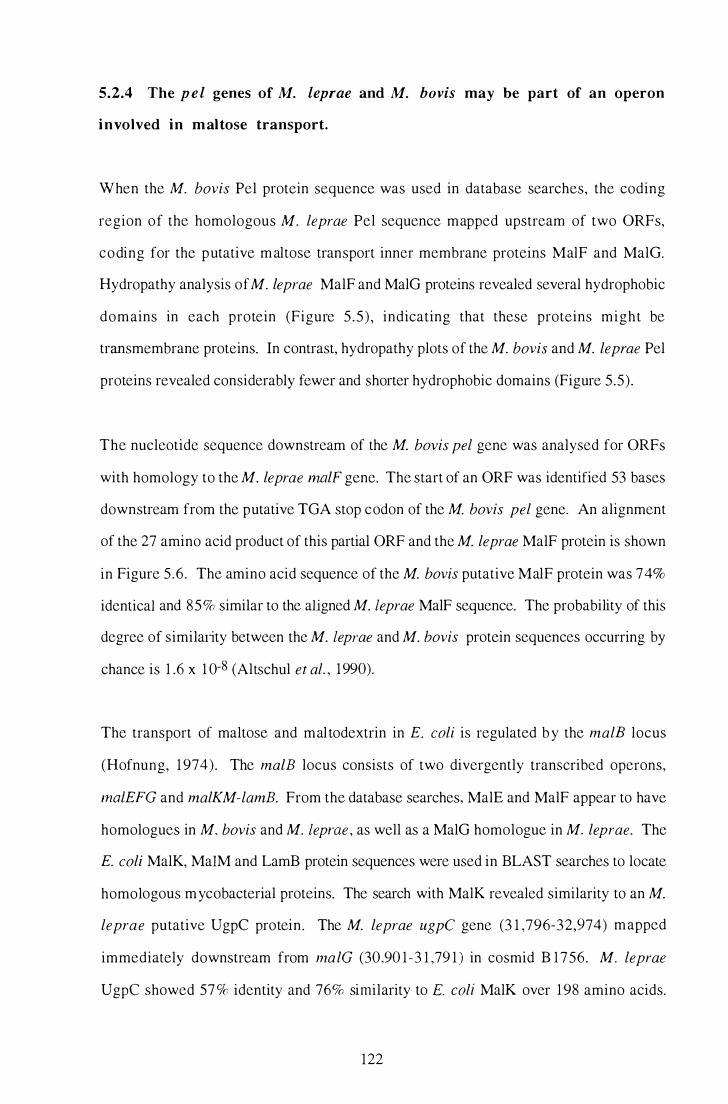
5.2.4 The p e l genes of M. leprae and M. bovis may be part of an operon
involved in m altose transport.
When the M. bovis Pel protein sequence was used in database searches, the coding
region of the homologous M. leprae Pel sequence mapped upstream of two ORFs,
coding for the putative m altose transport inner membrane proteins MalF and MalG.
Hydropathy analysis of M. leprae MalF and MalG proteins revealed several hydrophobic
domains in each protein (Figure 5 .5) , indicating that these proteins might be
transmembrane proteins. In contrast, hydropathy plots of the M. bovis and M. leprae Pel
proteins revealed considerably fewer and shorter hydrophobic domains (Figure 5.5).
The nucleotide sequence downstream of the M. bovis pel gene was analysed for ORFs
with homology to the M. leprae l1uzlF gene. The start of an ORF was identified 53 bases
downstream from the putative TGA stop codon of the M. bovis pel gene. An alignment
of the 27 amino acid product of this partial ORF and the M. leprae MalF protein is shown
in Figure 5.6 . The amino acid sequence of the M. bovis putative MalF protein was 74%
identical and 85% similar to the aligned M. teprae MalF sequence. The probability of this
degree of similality between the M. teprae and M. bovis protein sequences occurring by
chance is 1 .6 x 1 0-8 (Altschul et al. , 1990).
The transport of maltose and maltodextrin in E. coli is regulated b y the malE locus
(Hofnung, 1 974). The malB locus consists of two divergently transcribed operons,
malEFG and malKM-lamB. From the database searches, MalE and MalF appear to have
homologues in M. bovis and M. teprae , as well as a MalG homologue in M. leprae. The
E. coli MalK, MaIM and LamB protein sequences were used in BLAST searches to locate
homologous m ycobacterial proteins. The search with MalK revealed similarity to an M.
leprae putative Ugpe protein. The M. leprae ugpC gene (3 1 ,796-32,974) m apped
immediately downstream from malG (30,90 1-3 1 ,79 1 ) in cosmid B 1 756. M. leprae
Ugpe showed 57 % identity and 76% similarity to E. coli MalK over 1 98 amino acids.
122

The probability of this similarity occun·ing purely by chance is 6.0 x 1 0-85. The relative
map positions of the pel , l11£llF, malG, and ugpC genes within the M. leprae genome are
shown in Figure 5.7.
123
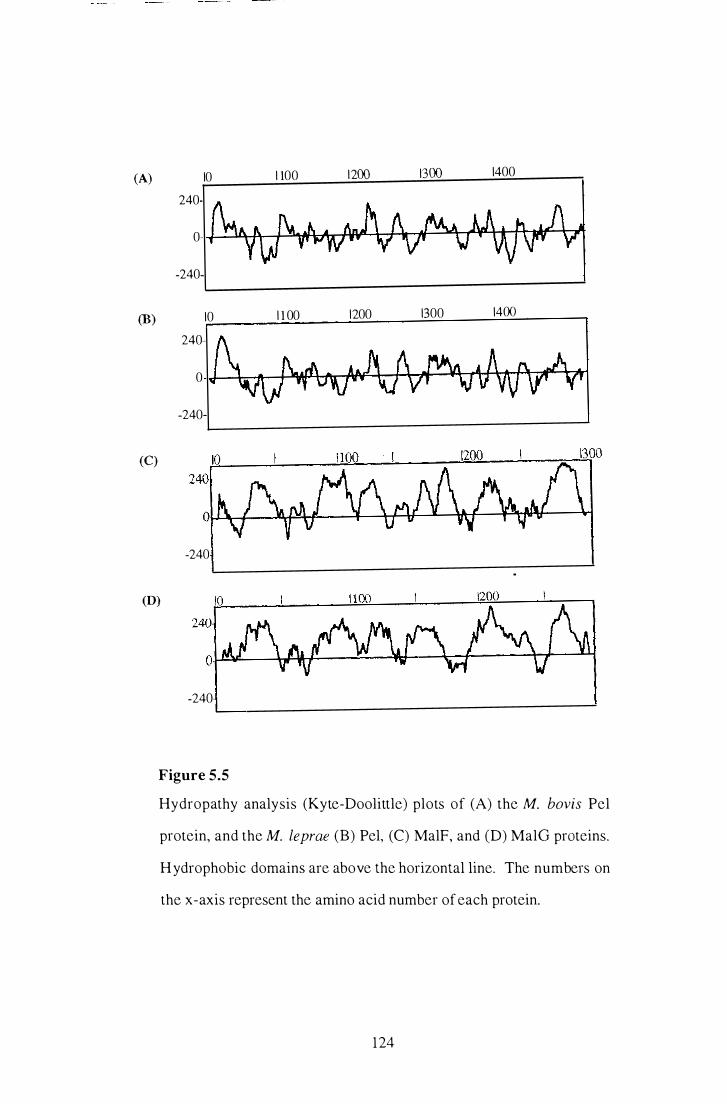
- - �- - - - - - - - ---
(A) 10 1 100 1200 1300 1400
240
0
-240-
(B) 10 1 1 00 1200 1300 1400
240
0
-240-
(C)
-240
(D)
-240
Figure 5.5
Hydropathy analysis (Kyte-Doolittle) plots of (A) the M. bovis Pel
protein, and the M. leprae (B) Pel, (C) MalF, and CD) MalO proteins.
H ydrophobic domains are above the horizontal line. The numbers on
the x-axis represent the amino acid number of each protein.
124
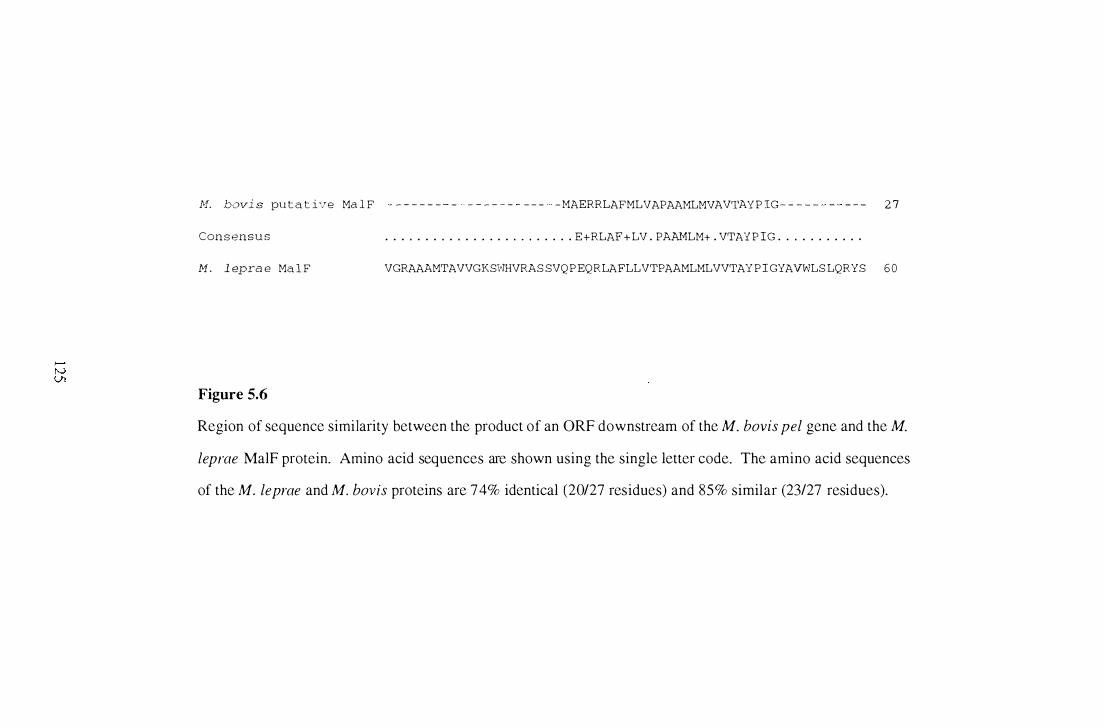
M. bovi s pu t a t ive Ma l F - - - - - - - - - - - - - - - - - MAERRLAFMLVAPAAMLMVAVTAY P IG - - - - - - - - - 2 7
Con s en s u s . . . . . . . . . . . . . . . . . . . . . . . . E+RLAF + LV . PAN1LM+ . VTAY P IG . . . . . . . . . . .
M . l epra e Ma l F VGRAAAMTAVVGKSWHVRAS SVQ P EQRLAFLLVTPAAMLMLVVTAY P I GYAVWLS LQRYS 6 0
Figure 5.6
Region of sequence similarity between the product of an ORF downstream of the M. bovis pel gene and the M.
leprae MalF protein. Amino acid sequences are shown using the single letter code. The amino acid sequences
of the M. leprae and M. bovis proteins are 74% identical (20/27 residues) and 85% similar (23/27 residues).
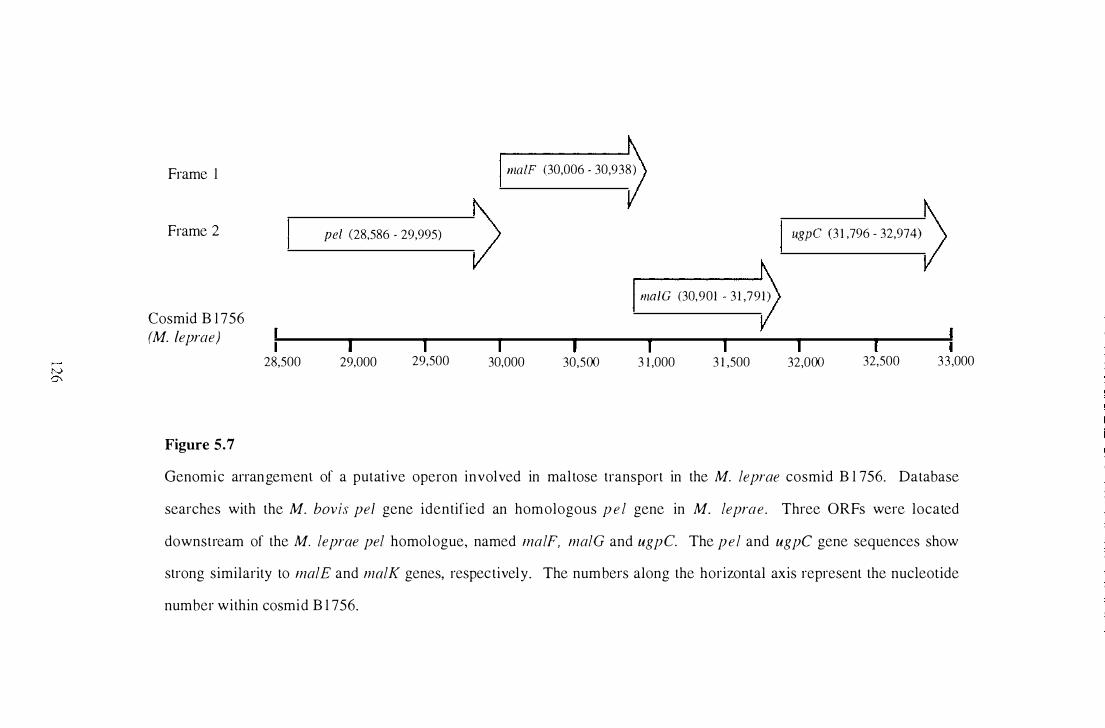
Frame 1
Frame 2
Cosmid B 1 756 (M. /eprae)
Figure 5.7
28,500
pel (28,586 · 29,995)
I 29,000
I 29,500
malF (30,006 30,938)
I 30,000
I 30,500
malG (30,901 · 3 1 ,79 1 )
I 3 1 ,000
I 3 1 ,500
ugpC (3 1 ,796 - 32,974)
I 32,000
I 32,500 33,000
Genomic arrangement of a putative operon involved in maltose transport in the M. leprae cosmid B 1 756. Database
searches with the M. bovis pel gene identified an homologous p e l gene in M. leprae. Three ORFs were located
downstream of the M. leprae pel homologue, named malF, malO and ugpc. The pel and ugpC gene sequences show
strong similarity to malE and malK genes, respectively. The numbers along the horizontal axis represent the nucleotide
number within cosmid B 1 756.
5.2.5 Species distribution of the M. bovis p e l gene
To determine if mycobacteria, other than M. leprae, contained gene sequences related to
pel, 1 5 species of m ycobacteria were examined by Southern blot analysis. Genomic
DNA were prepared from the mycobacteria and Eco RI-digested D NA fragments were
transferred to nylon membranes following electrophoresis. The membrane was probed,
using high stringency hybridisation conditions, with a 234 bp fragment of the pel gene,
generated by digestion of pM2 1 with Kpn I and Pvu II. Exposure of the Southern blot
membrane to X-ray film for seven days revealed that all the mycobac terial species tested
contained sequences which hybridised to the partial pel gene probe (Figure 5 .8 ) . The
probe hybridised strongly to DNA fragments of identical size (approximately 6.0 kb) in
the M. bovis, M. bovis BeG, and M. tuberculosis samples. M. avium, M. intracellulare
and M. paratuberculosis DNA fragments of approximately 7 kb hybridised weakly to the
partial pel gene probe. The probe hybridised weakly to DNA fragments of greater than or
equal to 1 5 kb in the remaining mycobacterial samples.
1 27
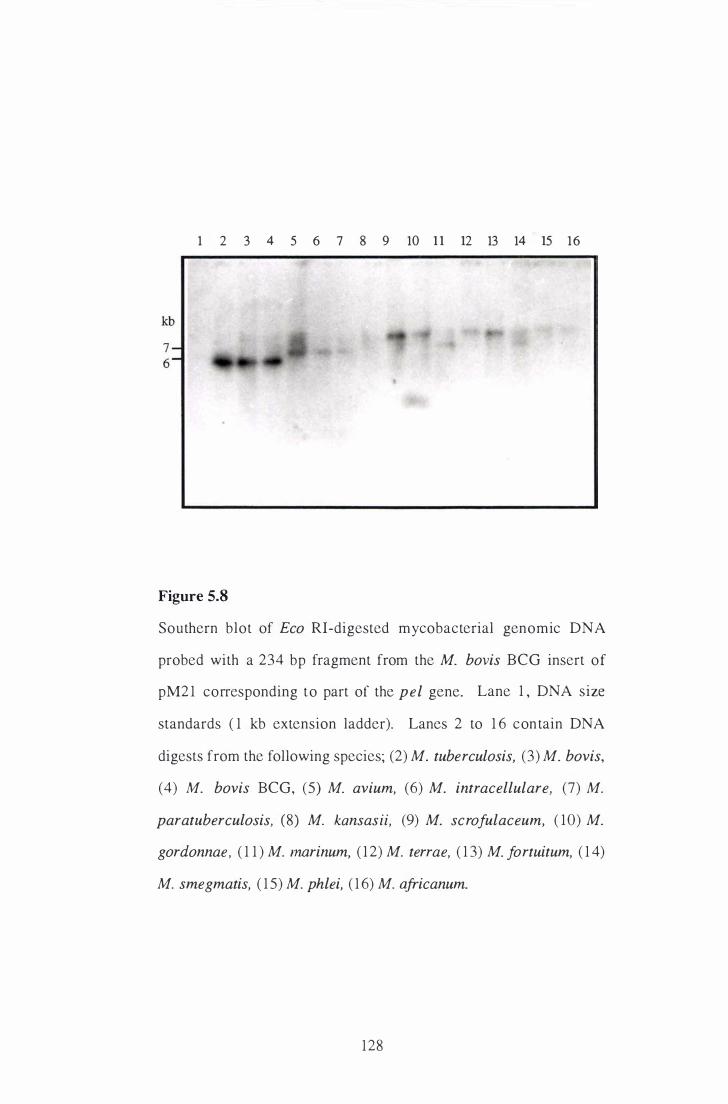
1 2 3 4 5 6 7 8 9 10 1 1 12 13 14 15 16
Figure 5.8
Southern blot of Eco RI-digested mycobacterial genomic DNA
probed with a 234 bp fragment from the M. bovis BCG insert of
pM2 1 corresponding to part of the pel gene. Lane 1 , DNA size
standards ( 1 kb extension ladder). Lanes 2 to 1 6 contain DNA
digests from the following species; (2) M. tuberculosis, (3) M. bovis,
(4) M. bovis BCG, (5) M. avium, (6) M. intracellulare, (7) M.
paratuberculosis, (8) M. kansas ii, (9) M. scrofulaceum, ( 10) M.
gordonnae, ( 1 1 ) M. nwrinum, ( 1 2) M. terrae, ( 1 3) M. fortuitum, ( 1 4)
M. smegmatis, ( 1 5) M. ph lei, ( 1 6) M. africanum.
128
5.2.6 Expression of the M. bovis pel gene
The PhoA+ phenotype of M. smegnwtis (pM21 ) , and Western b lot analysis provided
evidence that the pel/phoA gene fusion was expressed by recombinant M. smegmatis
(Chapter 3) . To demonstrate expression of the full-length ( 1 404 bp) pel gene by
recombinant M. smegma tis, Northern blot analysis was carried out using RNA samples
prepared from the cosmid subc1ones. Total RNA from M. smegmatis (subc lones 561 1
and 5612) was transferred to a nylon membrane following electrophoresis and probed
with a radiolabelled 234 bp restriction fragment of the pel gene. A broad band of
approximately 1 250 to 1 700 nucleotides was observed in the lane containing an M.
smegmatis ( subclone 56/2) RNA sample (Figure 5.9B) . The identified transcript is
sufficiently large to encode the pel gene ( 1404 bp) . The probe did not hybridise to RNA
from the control sample. In other experiments, contaminating DNA in RNA samples was
shown not to interfere with Northern blot results (data not shown), indicating that the
probe hybridised to an RNA transcript of the pel gene.
1 29
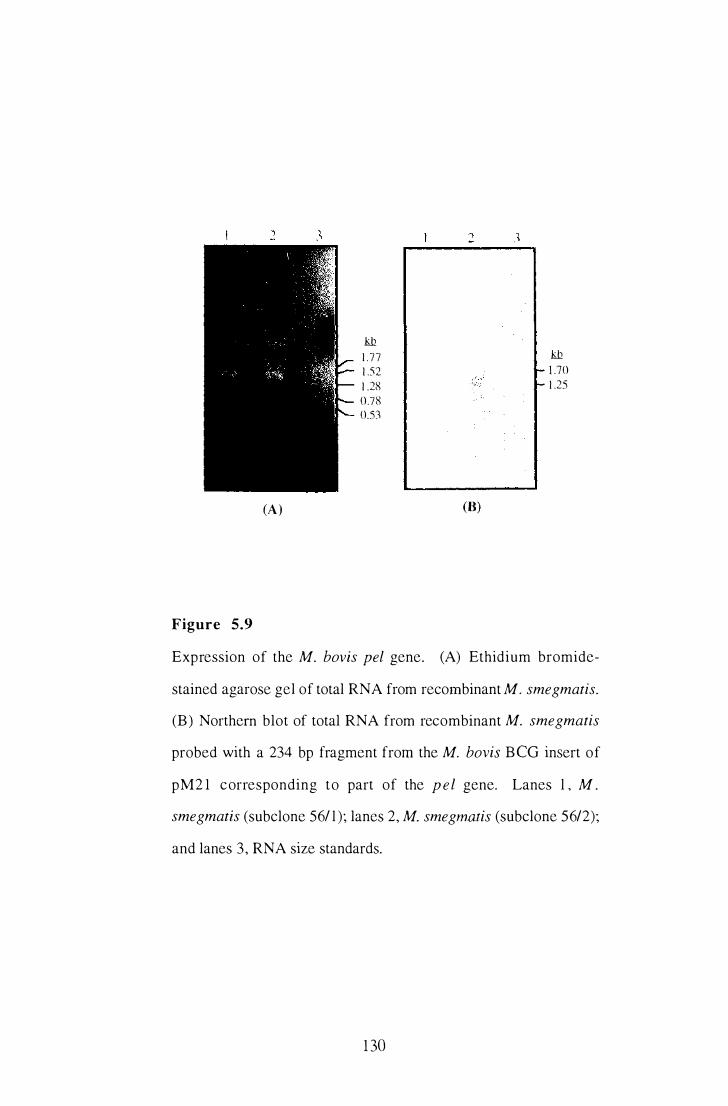
(A)
Figure 5.9
---------- - - - - - -- - - - -
kh 1 . 7 7 kh 1 .52 1 .70 1 .28 1 .25 0.78 0.53
(8)
Expression of the M. bovis pel gene. (A) Ethidium bromide-
stained agarose gel of total RNA from recombinant M. smegmatis.
(B) Northern blot of total RNA from recombinant M. smegmatis
probed with a 234 bp fragment from the M. bovis B eG insert of
pM2 1 corresponding to part of the p e l gene. Lanes 1 , M .
smegmatis (subclone 561 1 )� lanes 2, M. smegmatis (subclone 56/2);
and lanes 3 , RNA size standards.
1 30
5.2.7 Immunoscreeni ng of CFs from recombinant M. smegmatis
containing the cosmid subclones
Culture filtrates from the recombinant M. smegmatis cosmid subclones were tested in
vitro for their ability to stimulate proliferation and IFN-y-production by PBMCs taken
from two M. bovis BCG-immunised cattle (animals 12 and 1 5). The immunised animals
used in these experiments were selected on the basis of their high T cell reactivity against
M. smegmatis (cosmid 56) CF (Chapter 4). Pelipheral blood mononuclear cells from a
non-immunised control animal (30) were also incubated with the CFs to monitor cross
reactive T lymphocyte responses.
The lymphocyte proliferation and IFN-y assay experiments were internally controlled by
comparing responses between CF samples from the subclone 56/2 (containing the pel
gene) and subclone 56/ 1 (containing a randomly selected similar sized DNA insert).
Recombinant M. smegmatis containing subclones 56/ 1 and 56/2 were grown in minimal
media and CFs prepared. Culture filtrates from the recombinant M. smegmatis and M.
bovis BCG were assayed at a concentration of 2.0 j.l.g per well ( 1 0 j.l.g/ml). The
proliferative responses to M. bovis BCG CF varied greatly between the two immunised
animals (Table 5. 1 ). The PBMCs from immunised animal 1 2 proliferated strongly in
response to M. bovis BCG CF (SI = 275) compared to PBMCs from immunised animal
1 5 (SI of 5.8) . No proliferation above background levels (SI = 0.5) was observed by
PBMCs from the control in response to CF from M. bovis BCG. The proliferation SI's
for PBMCs incubated with CF from M. smegmatis (subclone 56/2) were low (SI < 2) for
all three animals and were not significantly different from those induced by CF from the
negative control, recombinant M. smegmatis containing subclone 5611 (Table 5. 1 ).
1 3 1
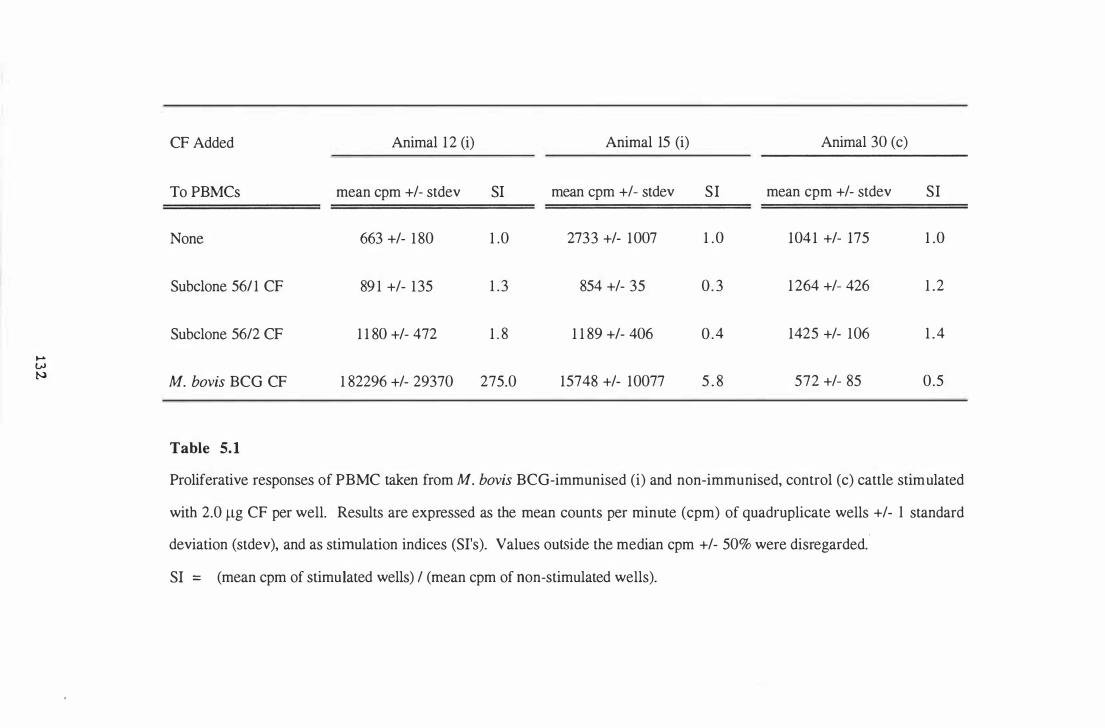
� l"J t-l
CF Added Animal 12 (i) Animal 15 (i) Animal 30 (c)
To PBMCs mean cpm +/- stdev SI mean cpm +/- stdev SI mean cpm +/- stdev SI
None 663 +/- 1 80 1 .0 2733 +/- 1007 1 .0 104 1 +/- 175 1 .0
Subclone 561 1 CF 89 1 +/- 135 1 .3 854 +/- 35 0 . 3 1 264 +/- 426 1 .2
Subclone 56/2 CF 1 1 80 +/- 472 1 . 8 1 1 89 +/- 406 0 .4 1425 +/- 106 1 .4
M. bovis BCG CF 1 82296 +/- 29370 275.0 15748 +/- 10077 5 . 8 572 +/- 85 0.5
Table 5.1
Proliferative responses of PBMC taken from M. bovis BCG-immunised (i) and non-immunised, control (c) cattle stimulated
with 2.0 Ilg CF per well. Results are expressed as the mean counts per minute (cpm) of quadtuplicate wells +/- 1 standard
deviation (stdev), and as stimulation indices (SI's). Values outside the median cpm +/- 50% were disregarded.
SI = (mean cpm of stimulated wells) / (mean cpm of non-stimulated wells).
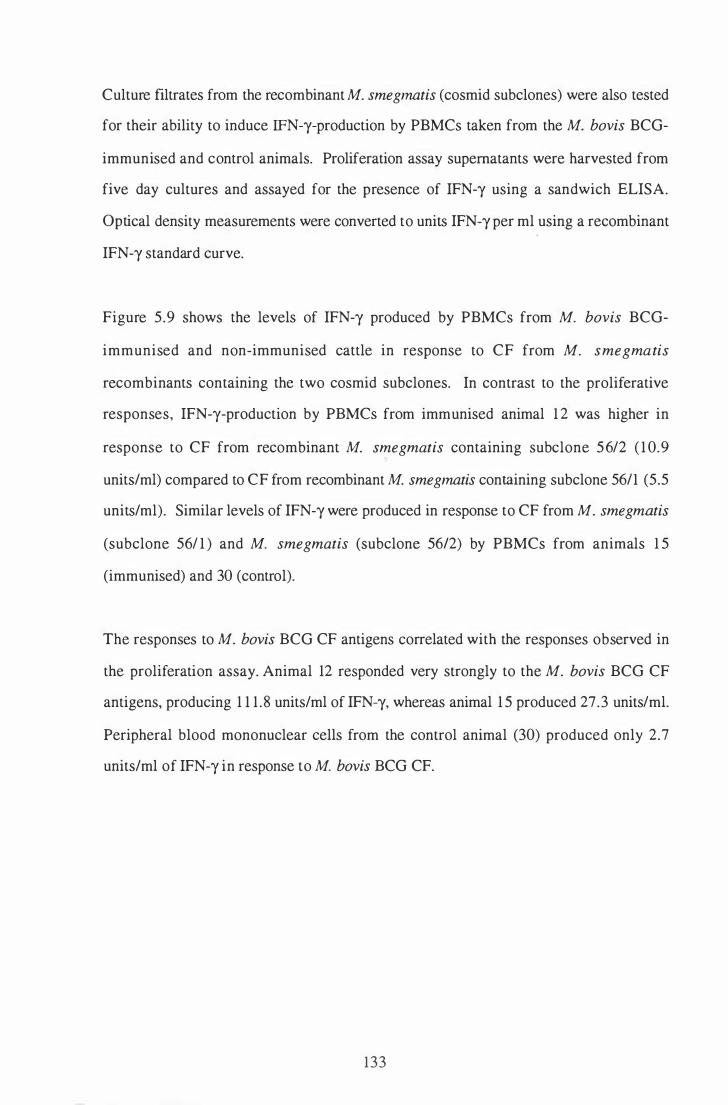
Culture filtrates from the recombinant M. smegmatis (cosmid subclones) were also tested
for their ability to induce IFN-y-production by PBMCs taken from the M. bovis BCG
immunised and control animals. Proliferation assay supernatants were harvested from
five day cultures and assayed for the presence of IFN-y using a sandwich ELISA.
Optical density measurements were converted to units IFN-y per ml using a recombinant
IFN-y standard curve.
Figure 5.9 shows the levels of IFN-y produced by PBMCs from M. bovis BCG
immunised and non-immunised cattle in response to CF from M. smegmatis
recombinants containing the two cosmid subclones. In contrast to the proliferative
responses, IFN-y-production by PBMCs from immunised animal 1 2 was higher in
response to CF from recombinant M. smegmatis containing sub clone 5 6/2 ( 1 0.9
units/ml) compared to CF from recombinant M. smegmatis containing subclone 56/1 (5.5
units/ml). Similar levels of IFN-y were produced in response to CF from M. smegmatis
(subclone 56/ 1 ) and M. smegmatis (subclone 5612) by PBMCs from animals 1 5
(immunised) and 30 (control).
The responses to M. bovis BCG CF antigens correlated with the responses observed in
the proliferation assay. Animal 12 responded very strongly to the M. bovis BCG CF
antigens, producing 1 1 1 .8 units/ml of IFN-y, whereas animal 1 5 produced 27.3 units/ml.
Peripheral blood mononuclear cells from the control animal (30) produced only 2.7
units/ml of IFN-y in response to M. bovis BCG CF.
133
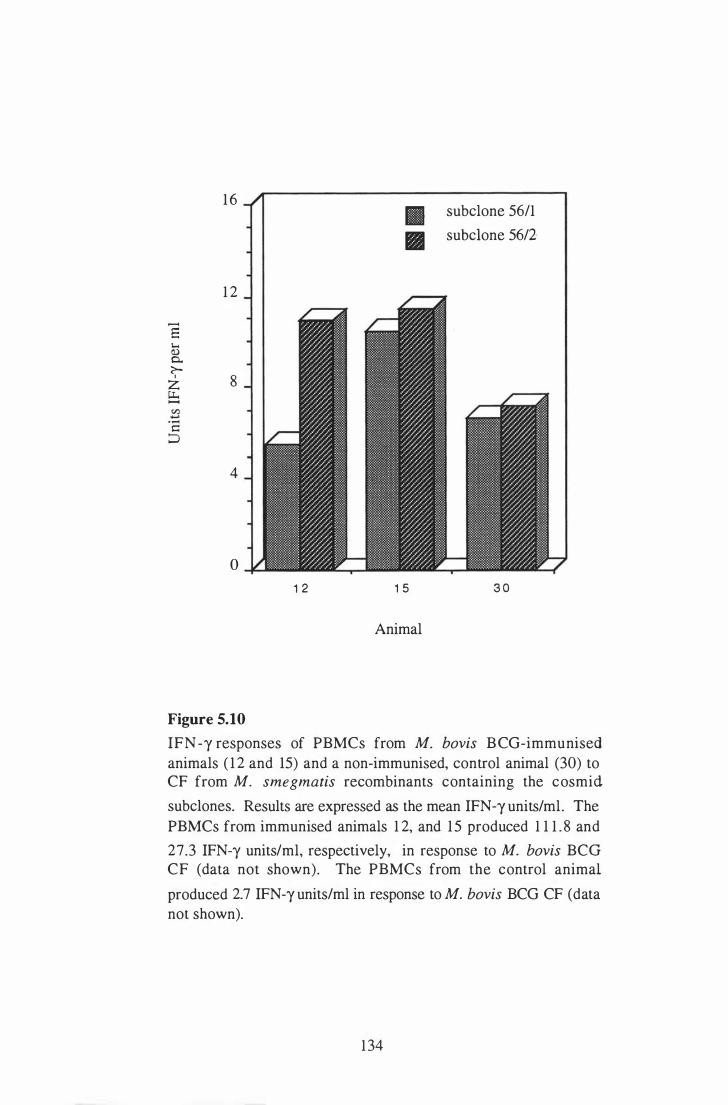
1 6 subclone 56/1 II
II subclone 56/2
1 2
....... a I-< Q.) 0.. c-
o 8 Z � ...... V) � .-c:: �
4
o
1 2 1 5 3 0
Animal
Figure 5.10
IFN -y responses of PBMCs from M. bovis B CG-immunised animals ( 1 2 and 15) and a non-immunised, control animal (30) to CF from M. smegmatis recombinants containing the cosmid
subclones. Results are expressed as the mean IFN-y units/ml. The PBMCs from immunised animals 1 2, and 1 5 produced 1 1 1 . 8 and
27.3 IFN-y units/ml, respectively, in response to M. bovis BeG CF (data not shown). The PBMCs from the control animal
produced 2.7 IFN-y units/ml in response to M. bovis BCG CF (data not shown).
134
5 . 3 Discussion
The immunoassays carried out on CF from selected recombinant M. smegmatis from the
M. bovis cosmid library indicated that CF from M. smegnwtis (cosmid 56) contained one
or more potential T cell antigens (Chapter 4). DNA sequence and Southern blot analyses
demonstrated that cosmid 56 contained a gene (pel) coding for an M. bovis putative
exported lipoprotein with similarity to the product of an uncharacterised ORF in M.
leprae.
The M. bovis pel gene was cloned, and its sequence determined and analysed. The pel
gene was predicted to encode a 468 amino acid polypeptide. Cleavage of the putative 25
amino acid putative lipoprotein signal peptide would yield a mature Pel protein with a
calculated molecular mass of 47.3 kDa. Database searches using the M. bovis Pel protein
sequence revealed similarity to an M. leprae Pel homologue and MalE maltose-binding
proteins of Gram negative and Gram positive bacteria. These sequence similarities raised
the question as to whether Pel was a maltose-binding protein. In E. coli, the malE gene
is part of the malEFG operon, one of two operons of the malE locus regulating maltose
transport (Hofnung, 1974). The malE gene encodes the periplasmic maltose-binding
protein, MalE. The nwlF and malG genes encode the cytoplasmic membrane components
of the transpOlt system, MalF and MalG, respectively. Other evidence for the potential
involvement of Pel in maltose transport carne from the observation that the M. leprae pel
gene homologue mapped upstream of putative malF and malG genes. Hydropathy
analysis of the M. /eprae putative MalF and MalG proteins revealed several hydrophobic
domains consistent with a cytoplasmic transmembrane location for these proteins. DNA
sequence analysis revealed the start of a second ORF 53 bp downstream of the M. bovis
pel gene. The deduced amino acid sequence of this ORF was 85% similar to the M.
/eprae putative MalF protein. The high level of conservation between the M. /eprae and
M. bovis pel and putative malF genes, together with the similar organisation of these
1 35
genes in M. Leprae and E. coLi, suggests that the M. bovis peL gene may be part of a
mycobacterial maLEFG operon.
The second operon in the E. coli maLB locus regulating maltose and maltodextrin
transport is divergently transcribed and comprises the maLK, LamB and maLM genes
(Gilson et al. , 1986). The maLK gene product, MaIK, is located on the inner surface of
the cytoplasmic membrane in association with MalF and MalG (Shuman and Silhavy,
198 1 ). The E. coli LamB gene codes for the outer membrane protein LamB. MalM, the
product of the E. coLi maLM gene, is a periplasmic protein of unknown function.
Database searches with the E. coLi LamB and MaIM protein sequences revealed no
similarity to mycobacterial proteins. However, database searches with the E. coLi MalK
sequence revealed strong similarity to a family of A TP-binding transport proteins,
including the M. Leprae putative glycerol-3-phosphate transport ATP-binding protein,
Ugpc. Complementation studies in E. coli indicate that UgpC and MalK are functionally
exchangeable (Hekstra and Tommassen, 1993). Therefore, it is possible that the putative
ugpC gene of M. Leprae is in fact a cytoplasmic membrane-associated component of an
M. Leprae maltose and maltodextrin transport system. Interestingly, the M. Leprae ugpC
gene maps immediately downstream from maLG in the same orientation. If M. Zeprae
ugpC is involved in maltose transport, the maLE locus in mycobacteria may contain a
single operon with four genes; malE (peL), maLF, maLG, and maLK (ugpC). This is
highly speculative, but plausible in view of the genomic organisation of M. Leprae.
Although malEFG operons have been described for Gram positive organisms, a
homologue of the MalK protein has not previously been described downstream of the
maLEFG operon.
Periplasmic binding-protein dependent transport systems, including those for maltose and
maltodextrins, have been well characterised in Gram negative bacteria (Shuman, 1987).
The substrate-binding components of these systems are exported through the cytoplasmic
membrane into the periplasmic space. In Gram positive organisms the exported
1 36
substrate-binding components of analogous transport systems appear to be attached to the
cytoplasmic membrane via an N-telminal lipo-amino acid anchor (Gilson et ai. , 1988). A
large number of lipoproteins involved in solute transport have been identified in Gram
positive bacteria (reviewed in Sutcliffe and Russell, 1995). Five exported lipoproteins
found in member species of the M. tuberculosis complex, MPT83, the 19 kDa antigen,
and PstS- 1 , PstS-2, and PstS-3 have been characterised. While the function of MPT83
and the 1 9 kDa antigen is not known, the PstS antigens are a family of structurally
homologous phosphate-binding proteins (Lefevre et ai. , 1 997). Evidence for the role of
PstS- 1 in phosphate transport came from a recent study which demonstrated inhibition of
phosphate uptake by M. bovis BCG using a monoclonal antibody directed against PstS- 1
(Braibant et aI. , 1996) . The finding that the exported M. bovis Pel protein has a
lipoprotein signal peptidase consensus sequence is consistent with Pel being the binding
protein component of a maltose and maltodextrin transport system. Although Pel is an
exported protein, it is not clear if it would be released by the cell from its lipid anchor.
The MPT83 putative lipoprotein is predominantly cell-associated as shown by
immunoblotting cell lysates and CFs prepared from recombinant M. smegmatis
containing the mpt83 gene (Hewinson et aI. , 1996). The three PstS proteins have also
been located on the surface of M. bovis BCG by using flow cytometry (Lefevre et aI. ,
1 997). However, the 19 kDa and PstS exported lipoproteins of M. tuberculosis are
found in the culture medium during growth, and have been shown to stimulate cell
mediated immune responses in animal models (Young and Garbe, 1 99 1 ). It remains to
be determined if these lipoproteins are released from the mycobacterial cell in vivo.
Southern blot analysis of the distribution of pel among slow and fast growing
mycobacterial species indicated that this gene may be present and moderately conserved
in all mycobacteria. Under the hybridisation conditions used, the pel gene probe
hybridised strongly to DNA from members of the M. tuberculosis complex, and weakly
to DNA fragments from all other mycobactetia tested. Maltose transport systems are
137
ubiquitous among bacteria and the data from this experiment suggest that the regulatory
genes are also conserved among mycobacteria.
Northern blot analysis provided evidence that the pel gene was expressed by recombinant
M. smegma tis (subclone 56/2). The size of the RNA transcript detected by the pel gene
probe (between 1 250 and 1 700 nucleotides) is consistent with the predicted length of the
gene ( 1 404 bp). Although no larger transcripts were identified by Northern blotting, this
does not exclude the possibility that the pel gene is expressed as part of an operon.
Processing of the RNA transcript of the maltose regulon has been reported in the Gram
positive bacterium Streptococcus pneumoniae, yielding an RNA molecule which includes
the first gene in the operon and a larger fragment spanning the two downstream genes
(Puyet and Espinosa, 1993).
The presence of the pel and putative maLF genes, and the probable presence of malG and
malK genes on the M. bovis cosmid subclone 56/2 make it unlikely that genes coding for
other exported proteins would be present in the 8.3 kb DNA insert of subclone 56/2. A
search of the available insert DNA sequence for ORFs did not reveal any with
recognisable signal peptides. Therefore, it is probable that Pel would be the only M.
bovis-encoded protein in CF from recombinant M. smegmatis (subclone 56/2).
Culture filtrate from recombinant M. smegmatis containing the M. bovis pel gene was
assayed for its ability to induce proliferation and IFN-y-production by PBMCs from M.
bovis BCG-immunised and control cattle. Minimal proliferative responses were
observed with CF from M. smegmatis containing the M. bovis pel gene with PBMCs
from all animals tested. However, PBMCs from one of the M. bovis BCG-immunised
cattle (animal 1 2) produced two-fold greater IFN-y in response to CF from M. smegmatis
(subclone 56/2), containing the pel gene, compared to CF from the M. smegmatis
(subclone 56/ 1 ) negative control. The PBMCs from the second immunised animal ( 15)
and the non-immunised control animal produced comparable levels of IFN-y in response
1 38
to CF samples from the two M. smegmatis recombinants (cosmid subclones). The IFN
y produced by PBMCs from the control animal in response to the recombinant M.
smegmatis CFs may represent a cross-reactive response to proteins from environmental
mycobacteria (e.g. M. aviwn). Alternatively, the CF proteins may be stimulating a
subset of non-antigen specific lymphocytes. One possibility is that the CF antigens are
stimulating innate T cells present in the PBMCs. These may include populations of y8 T
cells and natural killer cells which are known to be involved in the innate immune
responses (Trinchieri, 1990; Barnes et ai. , 1994). In humans, y8 cells isolated from
healthy tuberculin-negative individuals respond to M. tuberculosis demonstrating their
innate capacity to recognise mycobacterial antigens without prior exposure (Pfeffer et ai. ,
1 990). M. tuberculosis-reactive y8 T cell clones have been found to produce IFN-y
(Barnes et ai. , 1 994), and in young calves, y8 T cells make up 20-30% of all peripheral
blood T cells (Wyatt et ai. , 1994).
While the biological function of the M. bovis Pel protein remains to be proven, the
proposed maltose transport function seems likely based on its sequence similarity with
bacterial MalE maltose-binding proteins. Synthesis of these proteins is normally induced
either in the presence of the substrate or derepressed under conditions of nutrient
starvation (Chapon, 1982). Following phagocytosis, the ingested mycobacterium would
require nutrients in order to survive. The ability to rapidly synthesise and secrete
substrate-binding transport proteins would be essential for uptake of available nutrients.
This would render these proteins as available targets for a host cell antigen specific
response. Although the role of Pel in the immune response to M. bovis infection requires
elucidation, it is possible that it could be a dominant antigen early after phagocytosis.
139
5 . 4 Addendum
The nucleotide sequence of the M. bovis pel gene and flanking sequences (shown in
Figure 5 .2) was used to search the Sanger Centre M. tuberculosis DNA database for
similarities. The M. bovis pel gene and flanking sequences were 99.9% similar to an
incomplete M. tuberculosis sequence deposited in the database in mid-September, 1 997.
To determine if the M. tuberculosis genome encoded homologues of M. leprae MaIF,
MalG and U gpC, the amino acid sequences of these proteins were used to search the
translated M. tuberculosis DNA database. The translated M. tuberculosis DNA sequence
showed greater than 8 1 % identity and 88% similarity to the amino acid sequences of the
three M. leprae proteins. The three M. tuberculosis ORFs, encoding the MalF, MalG and
U gpC proteins, mapped immediately downstream of the M. tuberculosis pel gene
homologue. The order of these ORFs was the same as the corresponding ORFs in M.
leprae (see Figure 5.7). The finding that the genomic arrangement of pel, malF, malG
and ugpC is highly conserved between M. leprae and M. tuberculosis provides
supporting evidence for a proposed maltose transport locus.
1 40
Chapter 6 :
Immune Responses Of M. bovis Challenged Cattle
To Culture Filtrate From Recombinant
M. smegmatis Expressing The pel Gene
1 4 1
6 . 1 Abstract
Culture filtrate from recombinant M. smegmatis containing the pel gene (cosmid 56 and
subclone 56/2) contains antigens that are recognised by M. bovis BCG-immunised cattle.
To extend this observation, immune responses of PBMCs from four .M. bovis challenged
and four M. bovis BCG vaccinated / M. bovis challenged cattle to CF from M. smegmatis
(sub clone 5612) were assessed. When compared to the sub clone 56/ 1 CF control sample,
CF from M. smegmatis (subclone 56/2) induced greater immune responses by PBMCs
from three challenged cattle (animals 25, 37 and 64) and two vaccinated / challenged cattle
(animals 7 2 and 75). This provides further evidence that CF from recombinant M.
smegmatis expressing the pel gene contains a T cell antigen. The immune responses did
not appear to correlate with lesion formation or protection among the animals tested.
142
6 . 2 Introduction
Studies assessing the ability of M. bovis BCG vaccination to induce protective immunity
in cattle have shown that, under carefully controlled conditions, vaccination with a low
dose can afford a significant level of protection against virulent M. bovis challenge
(BuddIe et aI. , 1995a). It has also been shown that T cells from calves vaccinated with
viable M. bovis BCG are able to recognise a wide spectrum of M. bovis secreted proteins
(Gulle et ai. , 1995). Natural hosts for tuberculosis such as cattle therefore offer a good
model system to identify antigens which might serve as diagnostic agents by examining
the antigen-specific lymphocyte responses of vaccinated and M. bovis-infected animals.
Vaccination of cattle with M. bovis BCG potentially complicates the use of skin testing as
a diagnostic tool, and as yet there is no single, rapid and cost-effective diagnostic test that
can distinguish vaccinated and vaccinated / infected animals. This has lead to studies to
evaluate the use of single antigens as potential diagnostic agents or as components of a
novel vaccine. In chapter 4 of this work, CFs from selected M. smegmatis recombinants
(identified by hybridisation to insert DNA from PhoA+ clones) were screened for their
potential as T cell antigens in M. bovis BCG-immunised cattle. The screening system
detected one or more bovine T cell antigens in CF from M. smegmatis (cosmid 56),
which contained the M. bovis BCG pel gene. The pel gene was subcloned into pSUM40
and CF from recombinant M. smegmatis expressing the subcloned pel gene tested in
immunoassays using PBMCs from M. bovis BCG-immunised cattle. The level of IFN-y
produced by PBMCs from one immunised animal in response to CF from recombinant
M. smegmatis expressing the pel gene was two-fold greater than the level induced by CF
from M. smegma tis containing a plasmid with randomly selected DNA insert of similar
size. This chapter extends these studies to examine responses to CF from recombinant
M. smegmatis expressing the pel gene by PBMCs from M. bovis challenged and M.
bovis BCG vaccinated / M. bovis challenged cattle.
1 43
A rigorously controlled M. bovis BCG cattle vaccination trial has recently been carried
out at AgResearch Wallaceville by Dr. Bryce BuddIe. Groups of animals were vaccinated
with low dose (approximately 105 c.f.u.) M. bovis BCG or experimentally infected with
M. bovis. At four to eight weeks post-vaccination with M. bovis BCG some of these
animals were challenged intratracheally with M. bovis. There were four different groups
of animals in the trial: ( 1 ) control-unvaccinated, (2) M. bovis BCG vaccinated, (3) M.
bovis challenged, and (4) M. bovis BCG vaccinated / M. bovis challenged. B lood
samples were made available to our laboratory to test the responses (T lymphocyte
proliferation and IFN-y-production) against CFs prepared from recombinant M.
smegmatis containing M. bovis genes, including pel. The aim of the experiments
described in this chapter was to determine if CF from recombinant M. smegmatis
expressing the pel gene could be recognised by PBMCs from M. bovis challenged
animals. It was also of interest to determine if the CF could distinguish between the M.
bovis challenged and M. bovis BCG vaccinated / M. bovis challenged groups of animals
on the basis of differing PBMC proliferation and IFN-y responses.
144
6 . 3 Results
Immune recognition of CF from recombinant M. smegmatis expressing the
p e l gene by PBMCs from M. bovis challenged and M. bovis B C G
vaccinated / challenged cattle.
Blood samples from four M. bovis challenged, and four M. bovis BCG vaccinated /
challenged cattle, collected 1 5 weeks post challenge, were used in experiments to test
lymphocyte responses to CF from recombinant M. smegma tis expressing the pel gene.
Blood samples from the other two groups of cattle (unvaccinated controls and M. bovis
BCG vaccinated) were not available for comparison at this time.
Approximately 2 x 1 05 PBMCs were stimulated with 5.0 J.1g/well CF samples derived
from the recombinant M. smegma tis (cosmid subclones). Proliferative responses to CF
from M. smegmatis harbouring subclone 56/2 (expressing the pel gene) were compared
to responses induced by CF from M. smegma tis harbouring subclone 56/ 1 (containing a
randomly selected 10 kb M. bovis DNA insert).
The proliferative responses of the unvaccinated, M. bovis challenged animals to CFs
from the cosmid subclones are shown in Figure 6. L The PBMCs from three of the four
challenged cattle (animals 25 , 37 and 64) were most responsive to the M. smegmatis
(subclone 5612) CF sample. The mean thymidine incorporation by PBMCs from animal
25 stimulated with CF from subclone 56/2 was 5.9-fold higher than with CF from
subclone 56/ 1 , and 2A-fold higher than incorporation by unstimulated cells. With animal
37, the proliferation induced by CF from M. smegmatis (subclone 5612) was nearly
double ( L 8-fold higher) that induced by the control CF sample. The proliferative
response of PBMCs from animal 64 to CF from M. smegmatis (subclone 56/2) was 2.5-
fold higher than with CF from M. smegnUltis (subclone) 56/ 1 . Animal 30 was the only
unvaccinated, M. bovis challenged animal to respond similarly to the two CF samples.
145
The proliferative responses of PBMCs from the M. bovis BCG vaccinated / M. bovis
challenged animals to CFs from the cosmid subclones are shown in Figure 6.2. One of
the four vaccinated / challenged cattle (animal 75) was highly responsive to the M.
smegmatis (subclone 56/2) CF sample. The mean thymidine incorporation was 6.7-fold
higher in the presence of CF from subclone 56/2 than when stimulated with CF from
subclone 56/ 1 . The levels of proliferation by PBMCs from the other three cattle (animals
55 , 59 and 72) were not significantly different between the two recombinant M.
smegmatis CF samples. However, the magnitude of these responses relative to the
background response (proliferation in the absence of added antigen) showed considerable
variation. Lymphocyte proliferation induced by the recombinant M. smegmatis CF
samples was approximately 2- and 4-fold greater than the background proliferation for
animals 59 and 72, respectively. In contrast, the proliferation of PBMCs from animal 55,
when stimulated with recombinant M. smegmatis CFs, was approximately 1 65-fold
greater than proliferation in the absence of added antigen.
The mean background levels of thymidine incorporation by PBMCs from the eight
animals (Figures 6. 1 and 6.2) varied considerably, ranging from 386 cpm (animal 30) to
9,632 cpm (animal 64). Similarly, the proliferative responses to the negative control CF
sample (M. smegmatis harbouring subclone 56/ 1 ) showed large variation between
animals, ranging from 744 cpm (animal 25) to 92,979 cpm (animal 55).
In addition to examining the proliferative responses to CF samples from the recombinant
M. smegnzatis (cosmid subclones), the CFs were tested for their ability to induce IFN-y
production by PBMCs from M. bovis challenged and M. bovis BCG vaccinated /
challenged cattle. Proliferation assay supernatants were harvested from five day cultures,
pooled, and assayed in duplicate for the presence of IFN-y using a sandwich ELISA.
The optical densities (OD) of the duplicate samples were measured at 450 nm and the
averages calculated.
146
Figure 6.3 shows the levels of IFN-y produced by PBMCs from three unvaccinated, M.
bovis challenged cattle in response to CF from M. smegma tis recombinants containing
subclones 56/ 1 and 56/2. Supernatants from the fourth challenged animal (animal 37)
were unavailable for assay. The IFN-y-production by PBMCs from challenged animal 25
was significantly higher in response to CF from recombinant M. smegma tis containing
subclone 56/2 (00450 > 2.7) compared to CF from recombinant M. smegmatis
containing subclone 56/1 (00450 = 0.56). As found in the proliferation assay, animal 25
did not respond above background to CF from M. smegmatis (subclone 56/1) . Similar
levels of IFN-y were produced in response to CF from the two M. smegmatis
recombinants by PBMCs from animals 30 and 64. However, animal 64, which
responded more strongly to the subclone 56/2 CF sample in the proliferation assay,
produced IFN-y levels above the range me.asurable by ELISA in response to both CF
samples, so possible differences in responses would not be not detected. There was
insufficient culture supernatant to repeat the assay using diluted samples.
The IFN-y produced by PBMCs from the four M. bovis BCG vaccinated / M. bovis
challenged animals in response to CFs from the cosmid subclones are shown in Figure
6.4. The IFN-y-production by PBMCs from animal 75 was higher in response to the M.
smegmatis (subclone 56/2) CF sample (OD450 = 1 .76) compared to the M. smegmatis
(subclone 56/ 1 ) CF sample (00450 = 0.82). The response induced by CF from
recombinant M. smegm£ltis containing subclone 56/2 was also higher than the response
to CF from subclone 56/1 for animal 72. However, unstimulated cells from this animal
also produced very high levels of IFN-y (OD450 = 1 . 89). With animals 55 and 59,
similar levels of IFN-y were produced by PBMCs in response to CF from subclones 56/ 1
and 56/2. The levels of IFN-y produced by PBMCs from animal 55 in response to the
recombinant M. smegmatis CF samples were above the range measurable by ELISA.
1 47
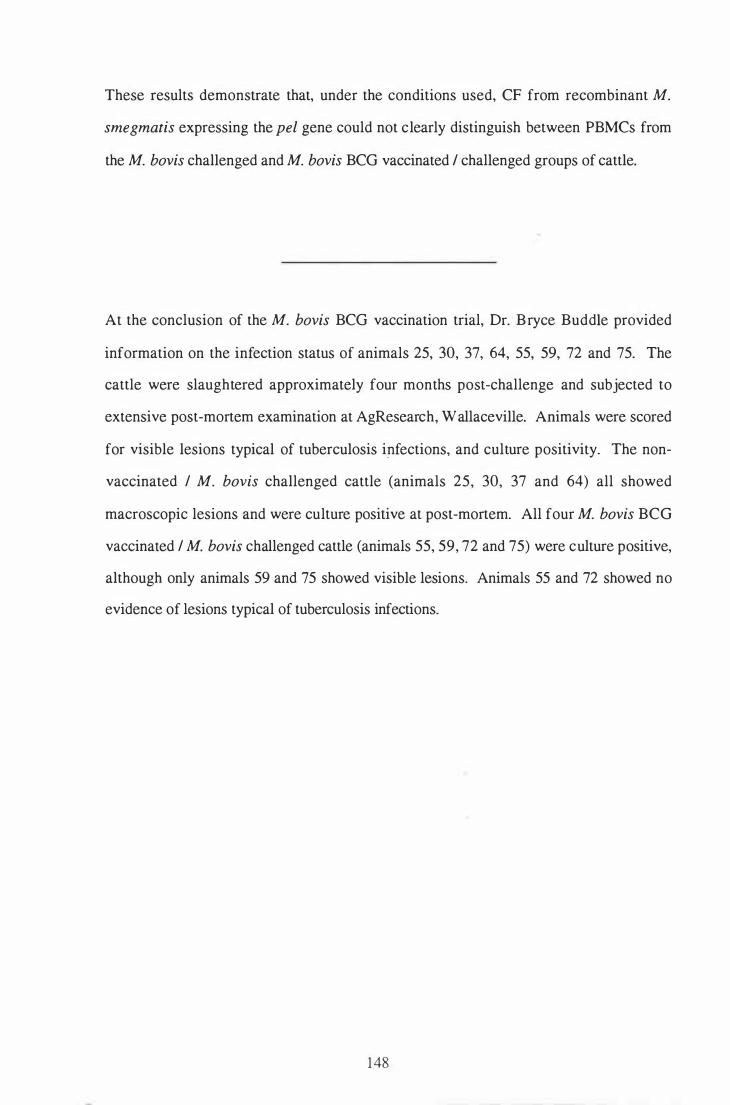
These results demonstrate that, under the conditions used, CF from recombinant M.
smegmatis expressing the pel gene could not clearly distinguish between PBMCs from
the M. bovis challenged and M. bovis BCG vaccinated / challenged groups of cattle.
At the conclusion of the M. bovis BCG vaccination trial, Dr. · B ryce BuddIe provided
information on the infection status of animals 25, 30, 37, 64, 55, 59, 72 and 75. The
cattle were slaughtered approximately four months post-challenge and subjected to
extensive post-mortem examination at AgResearch, Wallaceville. Animals were scored
for visible lesions typical of tuberculosis i!1fections, and culture positivity. The non
vaccinated / M. bovis challenged cattle (animals 25, 30, 37 and 64) all showed
macroscopic lesions and were culture positive at post-mortem. All four M. bovis BCG
vaccinated / M. bovis challenged cattle (animals 55, 59, 72 and 75) were culture positive,
although only animals 59 and 75 showed visible lesions. Animals 55 and 72 showed no
evidence of lesions typical of tuberculosis infections.
148
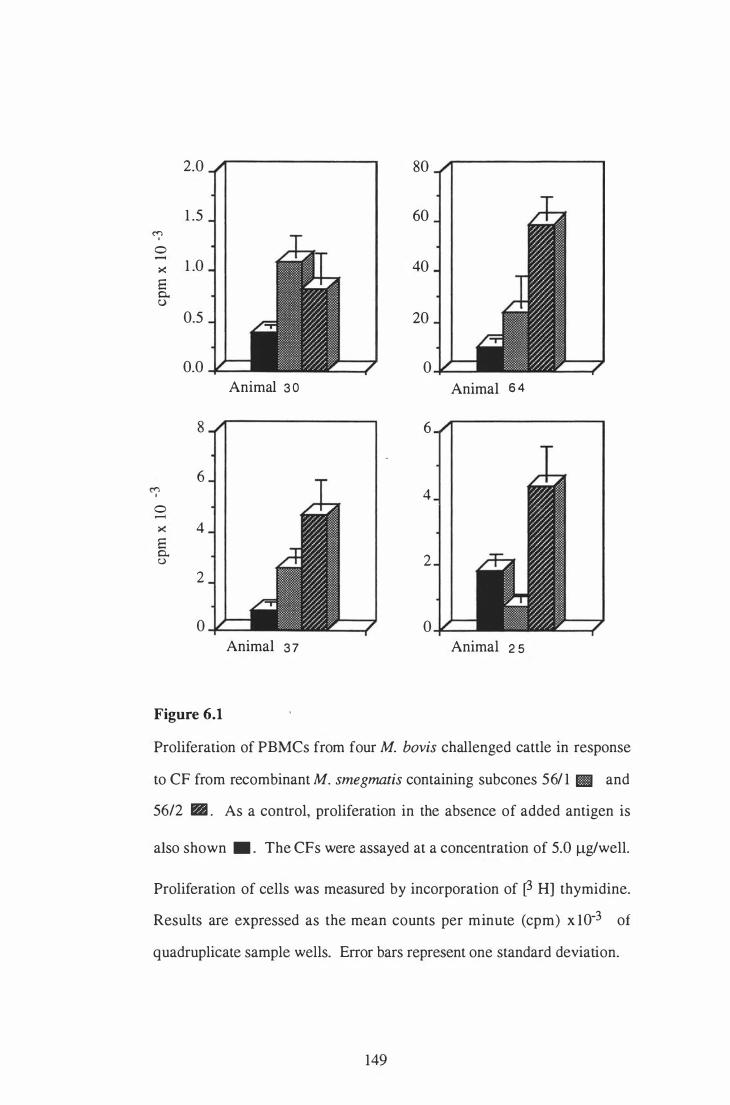
2.0 80
1 .5 60 <"( 0 -
>< 1 .0 40 8 0.. 0
0.5 20
0.0 0 Animal 3 0 Animal 6 4
8 6
6 «"l 4 I
0 -
>< 4 8 0.. 2 u
2
0 0 Animal 3 7 Animal 2 5
Figure 6.1
Proliferation of PBMCs from four M. bovis challenged cattle in response
to CF from recombinant M. smegmatis containing subcones 561 1 IlIIII and
5612 II1II . As a control, proliferation in the absence of added antigen is
also shown • . The CFs were assayed at a concentration of 5.0 Ilglwell.
Proliferation of cells was measured by incorporation of r H] thymidine.
Results are expressed as the mean counts per minute (cpm) x lO-3 of
quadruplicate sample wells. Error bars represent one standard deviation.
149
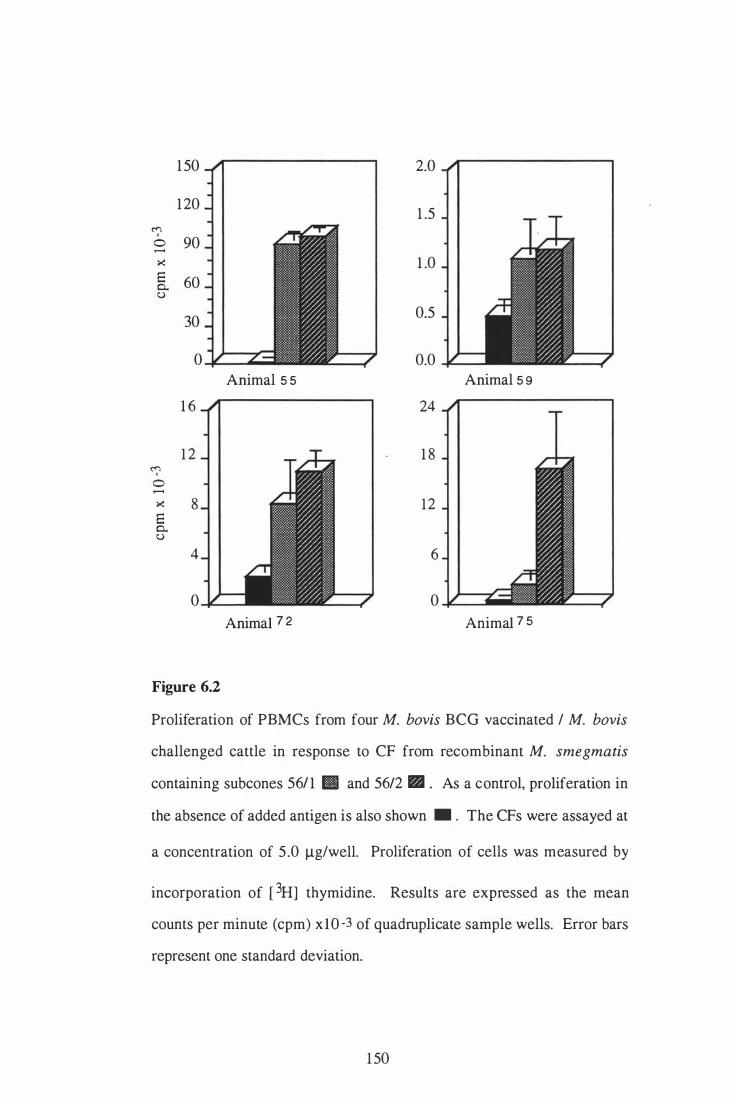
1 50 2.0
1 20 1 .5
<";l 0 ...... 90 >< 1 .0 S 60 0.. U
30 0.5
0 0.0 Animal 5 5 Animal 5 9
1 6 24
1 2 1 8 � , 0 ......
>< 8 12 S 0.. U
4 6
0 0 Animal 7 2 Animal 7 5
Figure 6.2
Proliferation of PBMCs from four M. bovis BCG vaccinated / M. bovis
challenged cattle in response to CF from recombinant M. smegma tis
containing subcones 561 1 11'1 and 56/2 II . As a control, proliferation in
the absence of added antigen is also shown • . The CFs were assayed at
a concentration of 5 .0 Ilg/well. Proliferation of cells was measured by
incorporation of [ 3H] thymidine. Results are expressed as the mean
counts per minute (cpm) x lO -3 of quadruplicate sample wells. Error bars
represent one standard deviation.
1 50
3
2
§ 1
o 2 5 3 0 6 4
Animal
Figure 6.3
IFN-y responses of PBMCs (2x10 5 ) from three M. bovis challenged
cattle to CF prepared from recombinant M. smegmatis containing
subclones 5611 111 and 56/2 III. IFN-y-production in the absence of
added is antigen is also shown • . The CFs were assayed at a
concentration of 5.0 Ilglwell. IFN-y was detected in culture
supernatants using a sandwich ELISA. The optical densities (OD's)
of samples were measured at 450 nm (maximum OD=2.7).
1 5 1
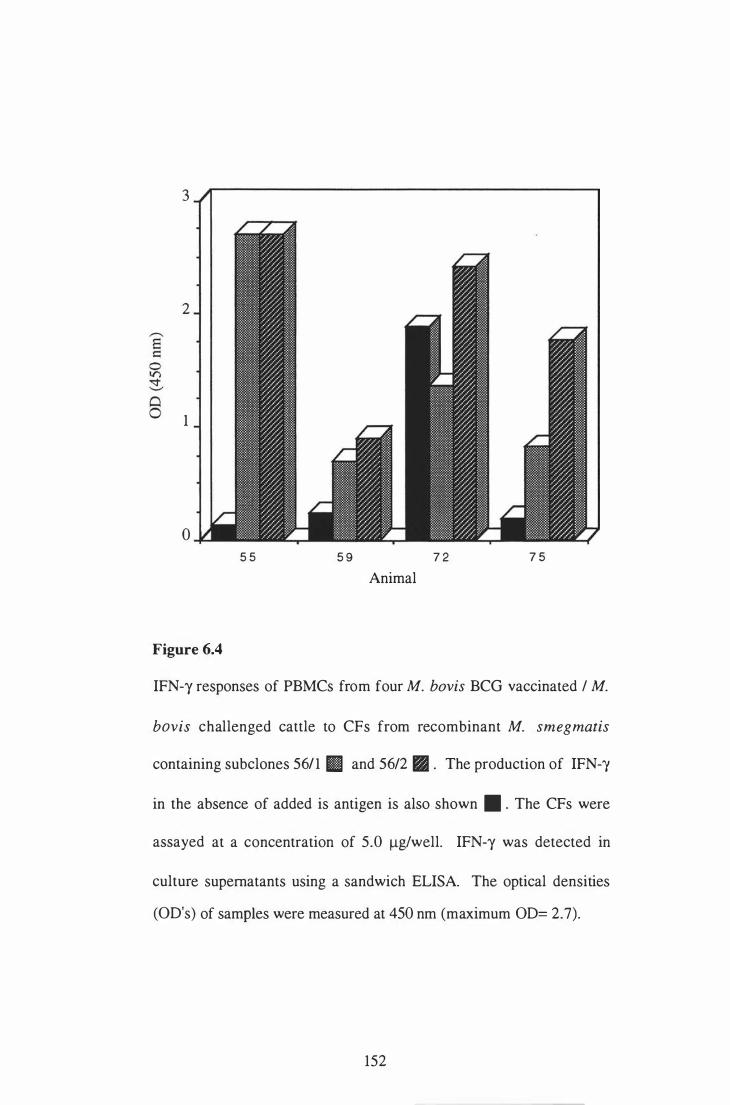
3
2
1
o 5 5 5 9 7 2 7 5
Animal
Figure 6.4
IFN-y responses of PBMCs from four M. bovis BCG vaccinated / M.
bovis challenged cattle to CFs from recombinant M. smegmatis
containing subclones 5611 111 and 56/2 11 . The production of IFN--y
in the absence of added is antigen is also shown • . The CFs were
assayed at a concentration of 5.0 IJ.glwell. IFN-y was detected in
culture supernatants using a sandwich ELISA. The optical densities
(OD's) of samples were measured at 450 nm (maximum OD= 2.7).
152
6 . 4 Discussion
Current diagnosis for bovine tuberculosis is carried out by intradermal testing with
purified protein derivative (PPD). The PPD preparation is a poorly defined mycobacterial
extract containing numerous antigens which can cause a lack of specificity. Comparative
intradermal testing has improved the specificity of diagnosis by taking into account cross
reactive responses to environmental mycobacteria such as M. avium (Monaghan et ai. ,
1994). An alternative diagnostic test, based on in vitro measurement of IFN-"( in
response to PPD has been developed that is both rapid and highly sensitive (Wood et ai. ,
199 1 ) . Results demonstrating the protective capacity of M. bovis BCG in bovines
(BuddIe et ai. , 1995a) have opened the possibility that M. bovis BCG could be used as a
vaccine to control bovine tuberculosis. However, if the M. bovis BCG vaccine is to be
used in cattle, it will be necessary to distinguish between M. bovis infected and M. bovis
BCG vaccinated cattle. In recent years, progress has been made in evaluating the
diagnostic potential of single antigens, including those specific to member species of the
M. tuberculosis complex (Wood et ai. , 1992; Pollock and Andersen, 1997a)
The results from the immunoassays using CF preparations from recombinant M.
smegmatis containing the pel gene (cosmid 56 and subclone 56/2) indicate that the CF
was recognised by M. bovis BCG-immunised animals. The CF from M. smegmatis
(subclone 56/2) were then used to compare the responses of M. bovis challenged and M.
bovis BCG vaccinated / challenged animals. At 1 5 weeks post-challenge, under the
conditions used in these experiments, CF from recombinant M. smegmatis expressing the
pel gene could not clearly distinguish between PBMCs from the M. bovis challenged and
M. bovis BCG vaccinated / challenged groups of cattle. When compared to the subclone
561 1 CF sample, CF from M. smegmatis (subclone 56/2) induced greater immune
responses by PBMCs from three challenged animals and two vaccinated / challenged
animals. The immune responses did not appear to correlate with lesion formation or
protection among the animals tested. It is possible that the concentrations of antigens in
1 53
the recombinant M. smegmatis CF were outside the optimal range required for detecting
discriminatory immune responses. In an independent study carried out in this laboratory,
dose-response expeliments demonstrated that the immune responses from PBMCs are
optimal within a narrow range of concentrations of the recombinant M. smegmatis CF
(Carpenter et ai. , 1995). A study measuring proliferative responses to purified M. bovis
antigens by PBMCs from experimentally infected cattle reported the optimal concentration
range to be 2- 1 ° !lg/ml (Fifis et al. , 1994). The concentration of the Pel protein would be
considerably less than this in the 5.0 !lg/ml M. smegma tis (sub clone 5612) CF sample
used in the experiments described in this chapter.
The M. tuberculosis complex-specific ESAT-6 protein has also been used as a single
antigen to assess the immune responses in cattle experimentally infected with M. bovis
(Pollock and Andersen, 1 997a). The magnitude of the immune responses to a low
molecular mass « 10 kDa) fraction of M. tuberculosis CF (containing ESAT-6) from M.
bovis infected M. bovis animals varied over time, post-infection (Pollock and Andersen,
1 997b). This variation in the magnitude of responses over time has also been repOlted in
a study measuring immune responses to purified M. bovis antigens by experimentally
infected cattle over a 3 year time course (Fifis et ai. , 1994). One of the pUlified antigens,
MPB70, induced at least a lO-fold difference in IFN-y-production by PBMCs at different
stages of infection. The CF from recombinant M. smegmatis expressing the pel gene was
tested at a single time point, 15 weeks post infection, which may not be the optimal time
for distinguishing between the immune responses of M. bovis challenged and M. bovis
BCG vaccinated / challenged cattle. The Fifis study demonstrated that different antigens
were immunodominant at different stages of infection, suggesting that a combination of
antigens may be required for use in a cellular diagnostic test. The results of this study
indicate that CF from recombinant M. smegmatis expressing the pel gene is recognised by
PBMCs from both M. bovis challenged and M. bovis BCG vaccinated / challenged
animals. Given the changing profile of immunodominance dUling M. bovis infection, it
154

would be necessary to test different concentrations of the Pel protein over a period of
many months to evaluate its potential as an immunodiagnostic reagent.
155

Chapter 7 :
Discussion Overview
1 56

The aim of the work presented in this thesis was to apply a novel two-step approach to
the identification of M. bovis exported proteins with potential T lymphocyte reactivity. In
combining the phoA-fusion methodology with cosmid library T cell screening, the impact
of the limitations imposed by each of these systems was minimised, and their individual
benefits combined to form a powerful strategy for identifying novel exported M. bovis T
cell antigens. The identificatiori'fthe M. bovis Pel protein demonstrates the power of
combining these strategies to identify potential novel T cell antigens.
The development, in recent years, of heterologous expression systems has greatly
enhanced the ability to carry out genetic manipulation and analysis in mycobacteria.
Expression of genes from slow-growing, pathogenic mycobacteria, such as M. bovis, in
the fast-growing M. smegmatis allows for gene expression signals to be recognised in a
related host. In addition, processing and post-translational modification pathways are
likely to be conserved and the structural integrity of the recombinant protein may be
similar, if not identical, to the native form. Several M. tuberculosis and M. bovis
secreted proteins have been expressed in M. smegmatis and purified, including the 19
kDa antigen, MPB64 and MPT64, and antigens 85-A and 85-B (Garbe e t ai. , 1 993 ;
Tasaka et ai. , 1995; Roche et ai. , 1996; Harth et ai. , 1997) These recombinant proteins
displayed similar antigenicity to the native form of the proteins and appeared identical on
SDS-polyacrylamide gels.
The development of phoA-fusion technology has provided a rapid technique to identify
mycobacterial exported protein genes (Lim et ai. , 1995). This represents a particularly
useful advance in mycobacterial technology as extracellular proteins are the focus of much
attention as targets of the cell-mediated immune response. In the present study, the
phoA-fusion strategy was used to identify M. bovis BeG genes coding for exported
proteins. Analysis of the deduced amino acid sequences of five of the PhoA fusion
157
proteins revealed that three fusions contained recognisable signal peptides. This
suggested that the phoA-fusion technology was identifying proteins exported by the
general secretory pathway (i.e. signal peptide-dependent export) as well as proteins
exported by other mechanisms. Evidence to support the existence of a signal peptide
independent export pathway comes from another study using phoA-fusion technology, in
which an enzymatically active PhoA fusion with the M. tuberculosis Des protein showed
no structural similarity to known signal peptides at its N-terminal region (Jackson et al. ,
1 997). The SOD, L-alanine dehydrogenase, and ESAT-6 proteins also lack recognisable
signal peptides, yet are present in short-term mycobacterial culture filtrates (Zhang et al. ,
1 99 1 ; Andersen et al. , 1 992a; S<j>rensen et al. , 1995). The signals required for protein
export by a signal peptide-independent export pathway are not known, although it is
possible that these might be contained within the mature protein sequence.
The M. bovis BeG DNA inserts from ten recombinant plasmids expressing enzymatically
active PhoA fusion proteins were partially sequenced and used to search databases for
similarities to known genes. Database searches revealed similarities to a family of high
temperature requirement (HtrA) serine proteases, a putative 1 .4 kb lipoprotein gene (pel)
from M. leprae, and uncharacterised M. tuberculosis ORFs. All ten sequences represent
potentially novel exported protein genes.
Analyses of enzymatically active PhoA fusion proteins on Western blots suggested that
the PhoA fusion proteins may have been post-translationally modified, possibly by
proteolytic degradation. The E. coli periplasmic protease DegP has been shown to
degrade PhoA fusion proteins to yield smaller products with PhoA activity (Strauch and
Beckwith, 1988). Mycobacterial homologues of the DegP protein have been identified
(Cameron et al. , 1 994; Wu et ai. , 1997), including one in this study; HtrA, partially
encoded by the plasmid pM2.
158
Although the phoA-fusion technology has been successfully applied in this study to
identify M. bovis BCG genes coding for exported proteins, there are limitations to its
usefulness.
( 1 ) The cloning of random fragments increases the possibility that non-contiguous DNA
fragments will be cloned in the same DNA vector resulting in hybrid genes.
(2) The difficulty in obtaining full length, stable fusion products in E. coli and M.
smegma tis.
(3) Charactelisation of sequences identified using phoA fusions requires locating the full
length genes.
To overcome these limitations, this technology can be combined with other
complementary systems for identifying exported protein antigens.
By using the insert DNA sequences from PhoA+ clones to screen an M. bovis cosmid
library in M. smegmatis for full-length exported protein genes, the advantages of phoA
fusion and recombinant cosmid libraries are combined. The large insert sizes present in
cosmid libraries increase the probability of locating full-length genes and their regulatory
regions on a single cosmid. The large insert sizes also enable entire operons to be
expressed, allowing identification of genes which might not be expressed in conventional
expression libraries. By working with full-length recombinant proteins rather than
protein fusions, protein instability is less of a problem. Recombinant M. bovis secreted
antigens in CFs prepared from an M. bovis cosmid library in M. smegmatis are likely to
be similar to the native proteins in terms of processing, post-translational modifications,
and T cell recognition. A novel strategy for identifying secreted T cell antigens was
described by Averill and colleagues, who screened culture filtrates from an M. bovis
BCG cosmid library in M. smegmatis with PBMCs from human tuberculin-positive
donors (Averill et ai. , 1 993). Three potentially novel antigens were identified following
screening of CF prepared from 10% of the cosmid library. A similar approach has been
successfully used in this laboratory to identify bovine T cell antigens (Carpenter et ai. ,
1 995).
159
The screening of CFs from the recombinant M. bovis cosmid library provided a sensitive
and rapid method for detecting a potential T cell antigen encoded by the pel gene. The M.
bovis pel gene codes for a llutative �xported lipoprotein. The pel gene was subcloned
from cosmid 56 of the M. bovis cosmid library and its sequence determined and
analysed. Database searches using the deduced amino acid sequence of Pel revealed
similarities to an M. leprae putative exported lipoprotein and a family of MalE maltose
binding proteins. In other bacteria, the malE gene is part of one of two operons
regulating the transport of maltose and maltodextrins (Hofnung, 1974). Analysis of
DNA sequences adjacent to the M. bovis pel gene and its M. leprae homologue, and their
use in database searches, suggested that pel may be palt of an operon involved in the
transport of maltose and maltodextrins in .mycobacteria. The synthesis of substrate
binding proteins, such as MalE, is normally induced in the presence of the substrate or
derepressed under conditions of nutrient starvation (Chapon, 1 982). However, the
function of these mycobacterial transport proteins synthesised de novo is unclear.
Lipoproteins make up only a subset of secreted proteins of mycobacteria and may be
important in mediating interactions between the mycobacteria and the host cell. If
essential nutrients are in limited supply within the host cell then competition with high
affinity binding transporter proteins exported by the mycobacterium might reduce the
availability of the same nutrients for metabolism by the host. Conversely, a targeted
immune response against such transporter proteins would reduce the fitness of the
bacterium and restore the availability of nutrients to the host.
Preliminary evidence from this study indicates that the Pel protein is recognised by
antigen-specific lymphocytes from M. bovis BCG-immunised animals. The PBMCs
taken from M. bovis challenged and M. bovis BCG vaccinated / challenged cattle also
recognised CF potentially containing the Pel protein in in vitro immunoassays. However,
the magnitude of the responses were not sufficient to distinguish between M. bovis
challenged and M. bovis BCG vaccinated / challenged animals. Whether these responses
160

affect the viability of M. bovis / M. bovis BeG inside macrophages remains to be
determined. The development of improved targeted gene disruption protocols in
mycobacteria should greatly increase the understanding of the role of such exported
proteins in pathogen / host interactions. In addition, a deeper understanding of the nature
of the immune responses directed towards exported proteins will further the knowledge
of how host cells successfully control intracellular parasites. It should also lead to the
development of novel vaccines and therapeutic agents designed to eliminate important
diseases, such as tuberculosis, in humans and cattle.
161
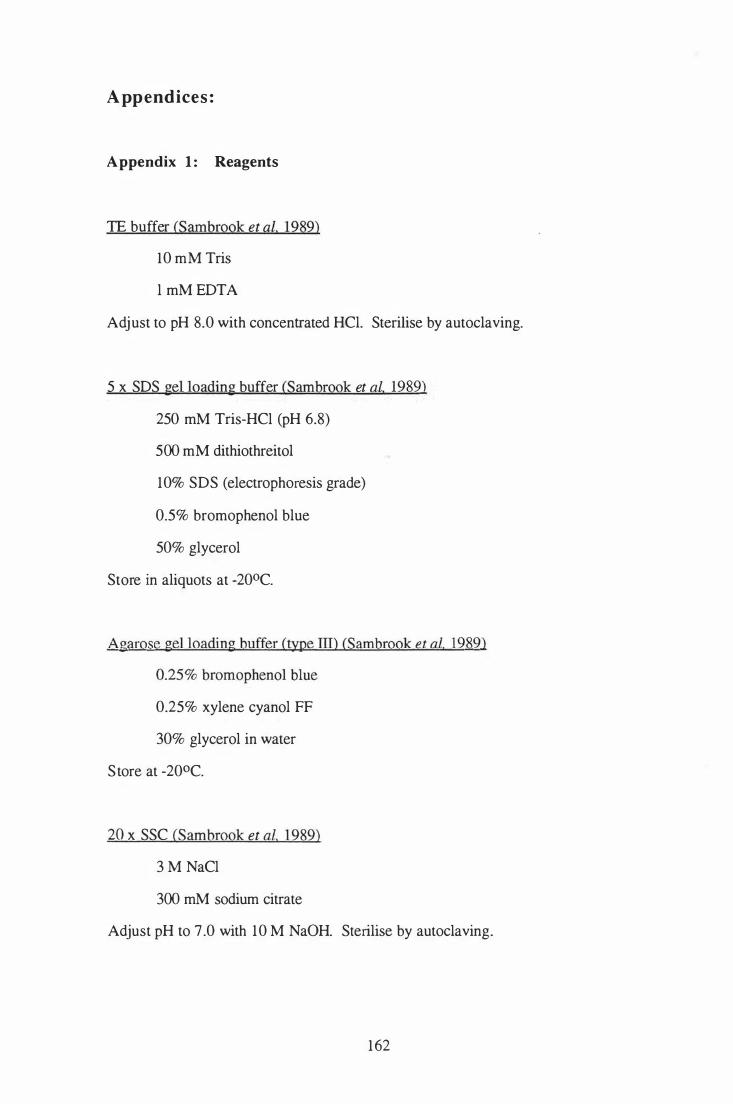
A ppendices :
Appendix 1 : Reagents
TE buffer (Sambrook et al, 1989)
10 mM Tris
I mM EDTA
Adjust to pH 8.0 with concentrated HCl. Sterilise by autoclaving.
5 x SDS gel loading buffer (Sambrook et al. 1989)
250 mM Tris-HCI (pH 6.8)
500 mM dithiothreitol
10% SDS (electrophoresis grade)
0.5% bromophenol blue
50% glycerol
Store in aliquots at -20OC.
Agarose gel loading buffer (type III) (Sambrook et al. 1989)
0.25% bromophenol blue
0.25% xylene cyanol FF
30% glycerol in water
Store at -20°C.
20 x SSC (Sambrook et al, 1989)
3 M NaCl
300 mM sodium citrate
Adjust pH to 7 .0 with 10 M NaOH. Sterilise by autoclaving.
162
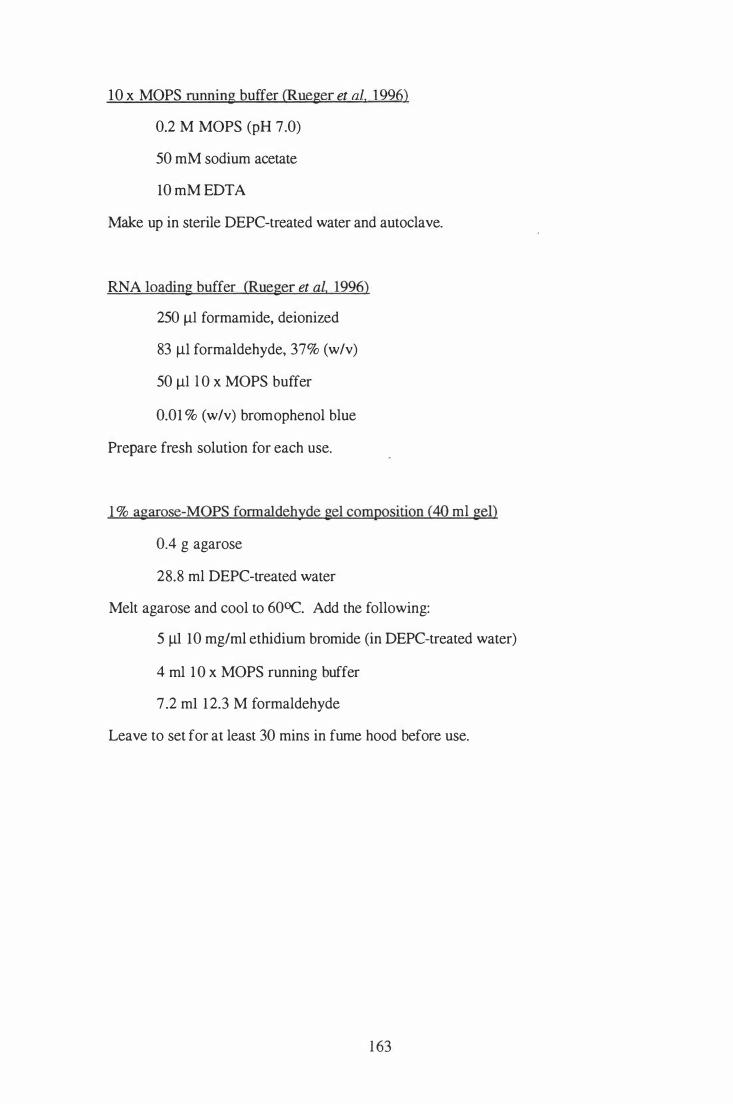
10 x MOPS running buffer (Rueger et al, 1996)
0.2 M MOPS (pH 7.0)
50 mM sodium acetate
10 mM EDTA
Make up in sterile DEPC-treated water and autoclave.
RNA loading buffer (Rueger et al, 1996)
250 � formam ide, deionized
83 III formaldehyde, 37% (w/v)
50 � l O x MOPS buffer
0.01 % (w/v) bromophenol blue
Prepare fresh solution for each use.
1 % agarose-MOPS formaldehyde gel composition (40 ml gel)
0.4 g agarose
28.8 ml DEPC-treated water
Melt agarose and cool to 60OC. Add the following:
5 111 10 mg/ml ethidium bromide (in DEPC-treated water)
4 mI l O x MOPS running buffer
7 .2 m1 12.3 M formaldehyde
Leave to set for at least 30 mins in fume hood before use.
1 63
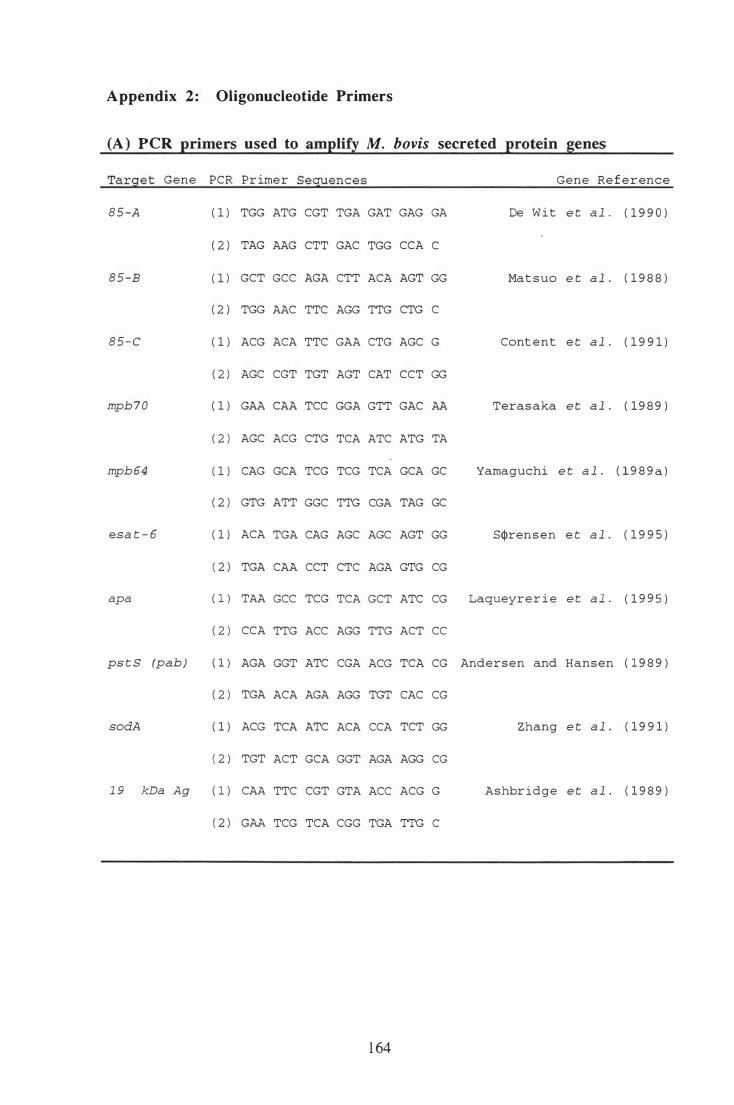
Appendix 2 : Oligonucleotide Primers
(A) peR primers used to amplify M. bovis secreted protein genes
Target Gene PCR Pr ime r Sequences Gene Re f e r ence
8 5 -A ( 1 ) TGG ATG CGT TGA GAT GAG GA De W i t e t a l . ( 1 9 9 0 )
( 2 ) TAG AAG CTT GAC TGG CCA C
8 5 -B ( 1 ) GCT GCC AGA CTT ACA AGT GG Mat suo e t a l . ( 1 9 8 8 )
( 2 ) TGG AAC TTC AGG TTG CTG C
8 5 - C ( 1 ) ACG ACA TTC GAA CTG AGC G Cont ent e t a l . ( 1 9 9 1 )
( 2 ) AGC CGT TGT AGT CAT CCT GG
mpb 7 0 ( 1 ) GAA CAA TCC GGA GTT GAC AA Teras aka e t a l . ( 1 9 8 9 )
( 2 ) AGC ACG CTG TCA ATC ATG TA
mpb 64 ( 1 ) CAG GCA TCG TCG TCA GCA GC Yamaguchi e t a l . ( 1 9 8 9 a )
( 2 ) GTG ATT GGC TTG CGA TAG GC
esa t - 6 ( 1 ) ACA TGA CAG AGC AGC AGT GG S<j>ren sen e t a l . ( 1 9 9 5 )
( 2 ) TGA CAA CCT CTC AGA GTG CG
apa ( 1 ) TAA GCC TCG TCA GCT ATC CG Laqueyre r i e e t a l . ( 1 9 9 5 )
( 2 ) CCA TTG ACC AGG TTG ACT CC
ps t s (pab ) ( 1 ) AGA GGT ATC CGA ACG TCA CG Andersen and Hansen ( 1 9 8 9 )
( 2 ) TGA ACA AGA AGG TGT CAC CG
sodA ( 1 ) ACG TCA ATC ACA CCA TCT GG Zhang e t a l . ( 1 9 9 1 )
( 2 ) TGT ACT GCA GGT AGA AGG CG
1 9 kDa Ag ( 1 ) CAA TTC CGT GTA ACC ACG G Ashbr idge e t a l . ( 1 9 8 9 )
( 2 ) GAA TCG TCA CGG TGA TTG C
1 64
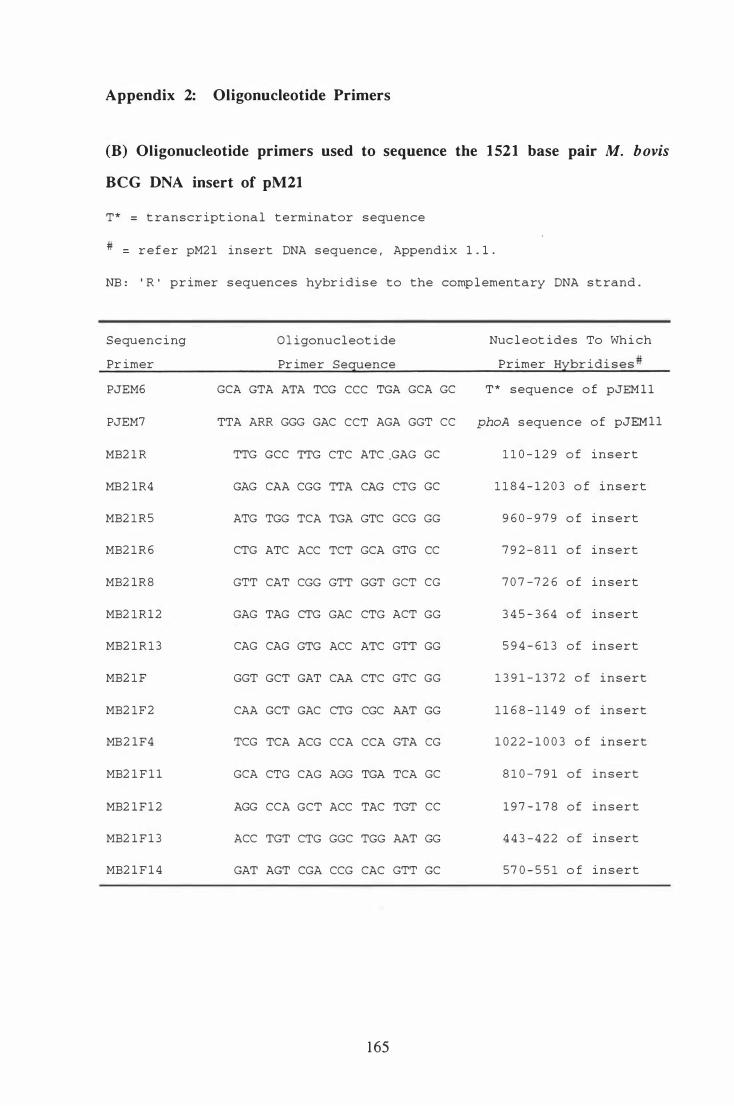
Appendix 2: Oligonucleotide Primers
(B) Oligonucleotide primers used to sequence the 1 521 base pair M. bovis
BeG DNA insert of pM21
T* = t ranscr ipt iona l terminator sequence
# - r e f e r pM2 1 insert DNA sequence , Append ix 1 . 1 .
NB : ' R ' pr imer s equences hybr i d i s e to the comp l ementary DNA s t rand .
Sequenc i ng O l igonucleot i de Nuc l eot ides To Wh i ch
Pr imer Pr ime r Seg;uence Primer Hlbr i d i s e s #
PJEM6 GCA GTA ATA TCG CCC TGA GCA GC T * sequence o f pJEM 1 1
PJEM7 TTA ARR GGG GAC CCT AGA GGT CC phoA s equence o f pJEM 1 1
MB2 1 R TTG GCC TTG CTC ATC .GAG GC 1 1 0 - 1 2 9 o f insert
MB2 1R4 GAG CAA CGG TTA CAG CTG GC 1 1 8 4 - 1 2 0 3 o f i n s e r t
MB2 1 R 5 ATG TGG TCA TGA GTC GCG GG 9 6 0 - 9 7 9 o f i n s e r t
MB2 1 R 6 CTG ATC ACC TCT GCA GTG CC 7 9 2 - 8 1 1 o f insert
MB2 1R8 GTT CAT CGG GTT GGT GCT CG 7 0 7 - 7 2 6 o f insert
MB2 1 R 1 2 GAG TAG CTG GAC CTG ACT GG 3 4 5 - 3 6 4 o f insert
MB2 1 R 1 3 CAG CAG GTG ACC ATC GTT GG 5 9 4 - 6 1 3 o f insert
MB2 1 F GGT GCT GAT CAA CTC GTC GG 1 3 9 1 - 1 3 7 2 o f insert
MB2 1F2 CAA GCT GAC CTG CGC AAT GG 1 1 6 8 - 1 1 4 9 o f insert
MB2 1 F4 TCG TCA ACG CCA CCA GTA CG 1 0 2 2 - 1 0 0 3 o f insert
MB2 1 F 1 1 GCA CTG CAG AGG TGA TCA GC 8 1 0 - 7 9 1 o f insert
MB2 1 F 1 2 AGG CCA GCT ACC TAC TGT CC 1 9 7 - 1 7 8 o f i n s e r t
MB2 1 F 1 3 ACC TGT CTG GGC TGG AAT GG 4 4 3 - 4 2 2 o f insert
MB2 1 F 1 4 GAT AGT CGA CCG CAC GTT GC 57 0 - 5 5 1 o f insert
165
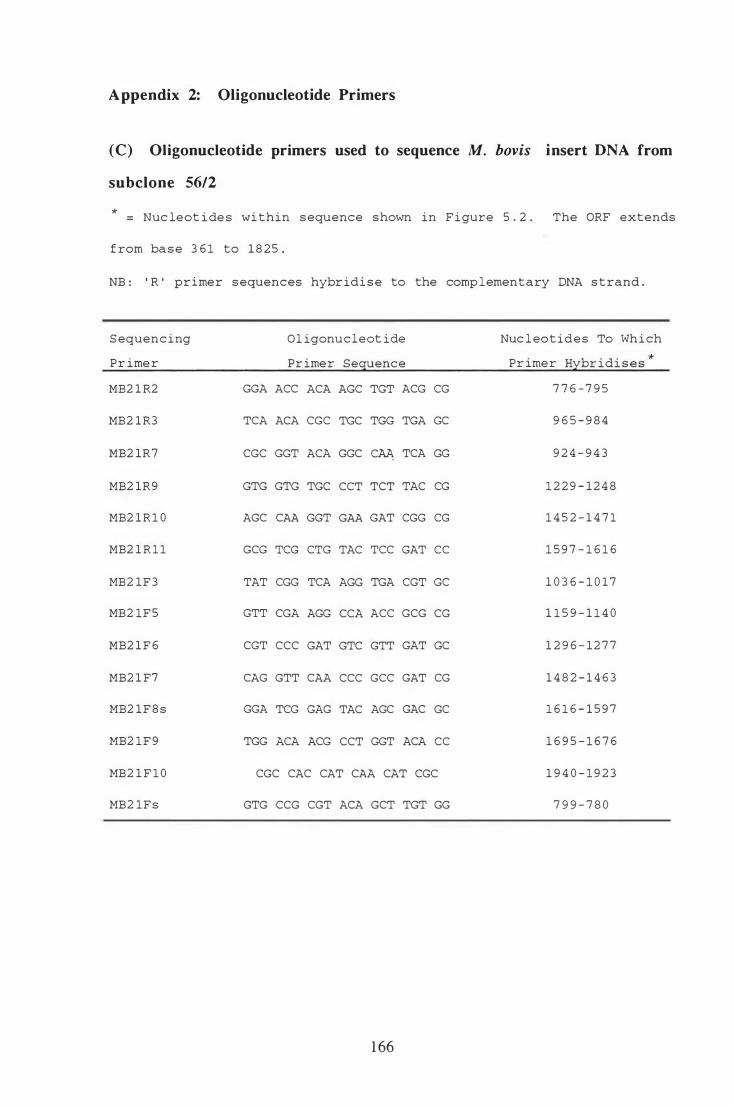
Appendix 2: Oligonucleotide Primers
(C) Oligonucleotide primers used to sequence M. bovis insert DNA from
subclone 56/2
* = Nuc leot i de s wi thin s equence shown in F i gure 5 . 2 . The ORF extends
f rom ba s e 3 6 1 to 1 8 2 5 .
NB : ' R ' pr ime r s equences hybr id i s e to the comp l ementary DNA s t rand .
S equencing Ol igonucleot ide Nuc l eotides To Wh i ch
P r ime r Pr ime r Sesuence Pr ime r H�br i d i s e s *
MB2 1 R2 GGA ACC ACA AGC TGT ACG CG 7 7 6 - 7 9 5
MB2 1 R3 TCA ACA CGC TGC TGG TGA GC 9 6 5 - 9 8 4
MB2 1R7 CGC GGT ACA GGC CM TCA GG 9 2 4 - 9 4 3
MB2 1R9 GTG GTG TGC CCT TCT TAC CG 1 2 2 9 - 1 2 4 8
MB2 1 R 1 0 AGC CAA GGT GAA GAT CGG CG 1 4 5 2 - 1 4 7 1
MB2 1 R 1 1 GCG TCG CTG TAC TCC GAT CC 1 5 9 7 - 1 6 1 6
MB2 1 F 3 TAT CGG TCA AGG TGA CGT GC 1 0 3 6 - 1 0 1 7
MB2 1 F 5 GTT CGA AGG CCA ACC GCG CG 1 1 5 9 - 1 1 4 0
MB2 1 F 6 CGT CCC GAT GTC GTT GAT GC 1 2 9 6 - 1 2 7 7
MB2 1 F7 CAG GTT CAA CCC GCC GAT CG 1 4 8 2 - 1 4 6 3
MB2 1 F 8 s GGA TCG GAG TAC AGC GAC GC 1 6 1 6 - 1 5 9 7
MB2 1 F 9 TGG ACA ACG CCT GGT ACA CC 1 6 9 5 - 1 6 7 6
MB2 1 F 1 0 CGC CAC CAT CAA CAT CGC 1 9 4 0 - 1 9 2 3
MB2 1 F s GTG CCG CGT ACA GCT TGT GG 7 9 9 - 7 8 0
1 66
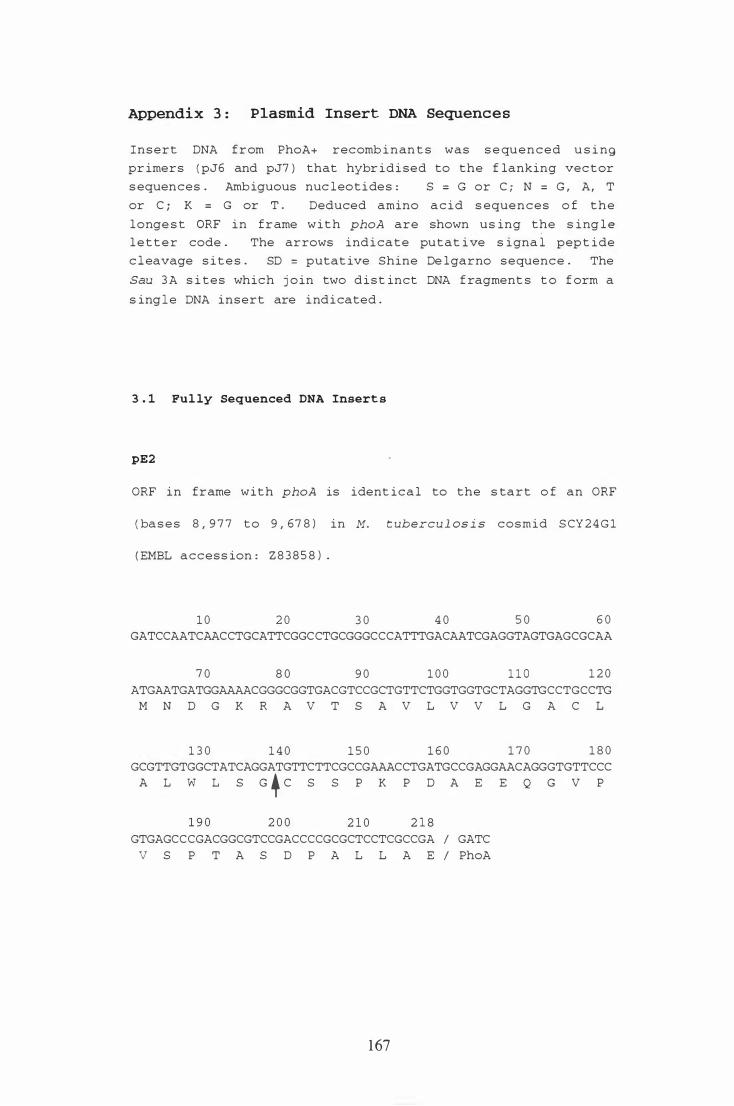
Appendix 3 : Plasmid Insert DNA Sequences
I n s e r t DNA f r om PhoA+ recomb i n an t s was s e qu e n c e d u s i ng
pr imers ( pJ6 and pJ7 ) that hybr idi sed to the f lanking vec t or
s equences . Amb iguous nuc l eo t i de s : S = G or C ; N = G , A , T
or C ; K = G or T . Deduced amino a c i d s eque n c e s o f t h e
l onge s t ORF i n f r ame w i t h phoA are shown u s ing the s i ng l e
l e t t e r code . The ar rows ind i ca t e pu tat i ve s i gna l pep t i de
c l eavage s i t e s . SD = putat ive Shine De l garno s equenc e . The
Sau 3 A s i t e s which j o in two d i s t inct DNA f ragment s t o f orm a
s ing l e DNA insert are i nd i cated .
3 . 1 Ful ly Sequenced DNA Insert s
pE2
ORF i n frame with phoA is ident i c a l to the s ta r t o f an ORF
( ba s e s 8 , 9 7 7 t o 9 , 6 7 8 ) in M. t ubercu l os i s cosmid S CY 2 4 G 1
( EMBL access ion : Z 8 3 8 5 8 ) .
1 0 2 0 3 0 4 0 5 0 6 0
GATCCAATCAACCTGCATTCGGCCTGCGGGCCCATTTGACAATCGAGGTAGTGAGCGCAA
7 0 8 0 9 0 1 0 0 l l O 1 2 0
ATGAATGATGGAAAACGGGCGGTGACGTCCGCTGTTCTGGTGGTGCTAGGTGCCTGCCTG M N D G K R A V T S A V L V V L G A C L
1 3 0 1 4 0 1 5 0 1 6 0 1 7 0 1 8 0
GCGTTGTGGCTATCAGGATGTTCTTCGCCGAAACCTGATGCCGAGGAACAGGGTGTTCCC A L W L S G + C S S P K P D A E E Q G V P
1 9 0 2 0 0 2 1 0 2 1 8
GTGAGCCCGACGGCGTCCGACCCCGCGCTCCTCGCCGA I GATC
V S P T A S D P A L L A E I PhoA
167
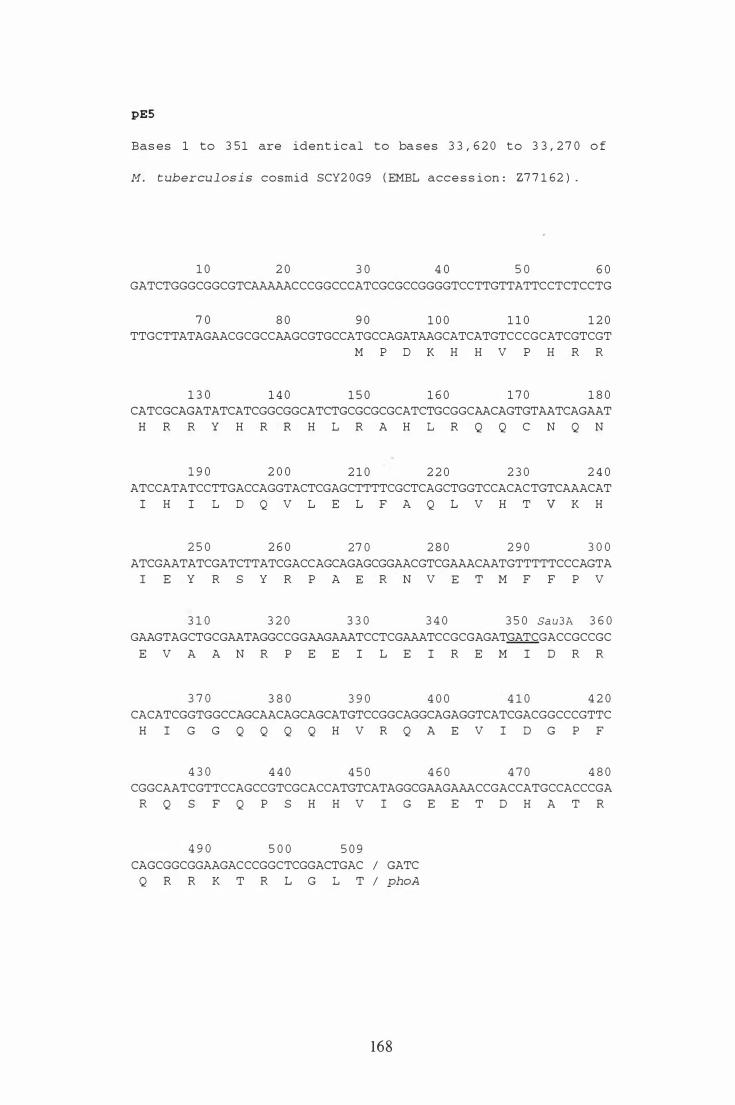
pES
Bas es 1 to 3 5 1 are ident ical to ba ses 3 3 , 6 2 0 to 3 3 , 2 7 0 o f
M . t ubercu l os i s cosmid SCY2 0G9 ( EMBL acce s s ion : Z7 7 1 6 2 ) .
1 0 2 0 3 0 4 0 5 0 6 0
GATCTGGGCGGCGTCAAAAACCCGGCCCATCGCGCCGGGGTCCTTGTTATTCCTCTCCTG
7 0 8 0 9 0 1 0 0 1 1 0 1 2 0 TTGCTTATAGAACGCGCCAAGCGTGCCATGCCAGATAAGCATCATGTCCCGCATCGTCGT
M P D K H H V P H R R
1 3 0 1 4 0 1 5 0 1 6 0 1 7 0 1 8 0 CATCGCAGATATCATCGGCGGCATCTGCGCGCGCATCTGCGGCAACAGTGTAATCAGAAT
H R R Y H R R H L R A H L R Q Q C N Q N
1 9 0 2 0 0 2 1 0 2 2 0 2 3 0 2 4 0 ATCCATATCCTTGACCAGGTACTCGAGCTTTTCGCTCAGCTGGTCCACACTGTCAAACAT
I H I L D Q V L E L F A Q L V H T V K H
2 5 0 2 6 0 27 0 2 8 0 2 9 0 3 0 0
ATCGAATATCGATCTTATCGACCAGCAGAGCGGAACGTCGAAACAATGTTTTTCCCAGTA l E Y R S Y R P A E R N V E T M F F P V
3 1 0 3 2 0 3 3 0 3 4 0 3 5 0 Sa u3A 3 6 0
GAAGTAGCTGCGAATAGGCCGGAAGAAATCCTCGAAATCCGCGAGATGATCGACCGCCGC
E V A A N R P E E I L E I R E M I D R R
3 7 0 3 8 0 3 9 0 4 0 0 4 1 0 4 2 0
CACATCGGTGGCCAGCAACAGCAGCATGTCCGGCAGGCAGAGGTCATCGACGGCCCGTTC H I G G Q Q Q Q H V R Q A E V I D G P F
4 3 0 4 4 0 4 5 0 4 6 0 4 7 0 4 8 0 CGGCAATCGTTCCAGCCGTCGCACCATGTCATAGGCGAAGAAACCGACCATGCCACCCGA
R Q S F Q P S H H V I G E E T D H A T R
4 9 0 5 0 0 5 0 9 CAGCGGCGGAAGACCCGGCTCGGACTGAC / GATC
Q R R K T R L G L T / phoA
168
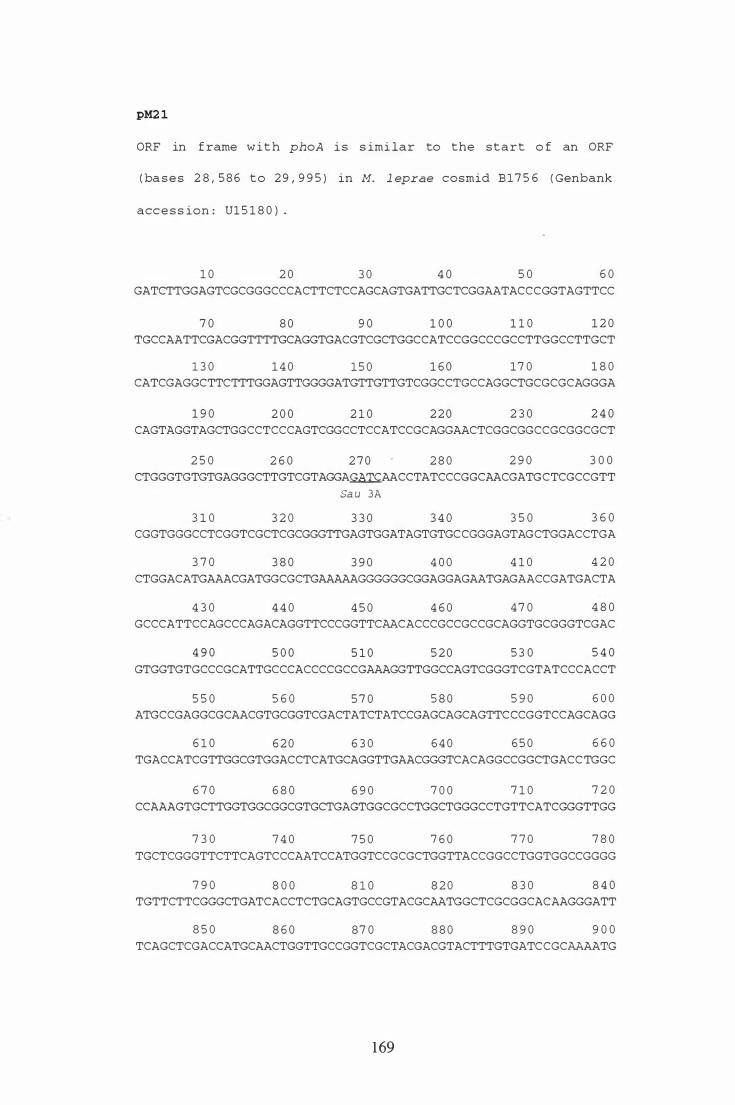
pM2 1
ORF in f rame w i t h phoA i s s imi lar to the start o f an ORF
( ba s e s 2 8 , 5 8 6 to 2 9 , 9 9 5 ) in M. l eprae cosmid B 1 7 5 6 ( Genbank
acc e s s ion : U1 5 1 8 0 ) .
1 0 2 0 3 0 4 0 5 0 6 0
GATCTTGGAGTCGCGGGCCCACTTCTCCAGCAGTGATTGCTCGGAATACCCGGTAGTTCC
7 0 8 0 9 0 1 0 0 1 1 0 1 2 0
TGCCAATTCGACGGTTTTGCAGGTGACGTCGCTGGCCATCCGGCCCGCCTTGGCCTTGCT
1 3 0 1 4 0 1 5 0 1 6 0 1 7 0 1 8 0
CATCGAGGCTTCTTTGGAGTTGGGGATGTTGTTGTCGGCCTGCCAGGCTGCGCGCAGGGA
1 9 0 2 0 0 2 1 0 2 2 0 2 3 0 2 4 0
CAGTAGGTAGCTGGCCTCCCAGTCGGCCTCCATCCGCAGGAACTCGGCGGCCGCGGCGCT
2 5 0 2 6 0 2 7 0 2 8 0 2 9 0 3 0 0
CTGGGTGTGTGAGGGCTTGTCGTAGGA�AACCTATCCCGGCAACGATGCTCGCCGTT
Sa u 3A
3 1 0 3 2 0 3 3 0 3 4 0 3 5 0 3 6 0
CGGTGGGCCTCGGTCGCTCGCGGGTTGAGTGGATAGTGTGCCGGGAGTAGCTGGACCTGA
3 7 0 3 8 0 3 9 0 4 0 0 4 1 0 4 2 0
CTGGACATGAAACGATGGCGCTGAAAAAGGGGGGCGGAGGAGAATGAGAACCGATGACTA
4 3 0 4 4 0 4 5 0 4 6 0 4 7 0 4 8 0
GCCCATTCCAGCCCAGACAGGTTCCCGGTTCAACACCCGCCGCCGCAGGTGCGGGTCGAC
4 9 0 5 0 0 5 1 0 5 2 0 5 3 0 5 4 0
GTGGTGTGCCCGCATTGCCCACCCCGCCGAAAGGTTGGCCAGTCGGGTCGTATCCCACCT
5 5 0 5 6 0 5 7 0 5 8 0 5 9 0 6 0 0
ATGCCGAGGCGCAACGTGCGGTCGACTATCTATCCGAGCAGCAGTTCCCGGTCCAGCAGG
6 1 0 6 2 0 6 3 0 6 4 0 6 5 0 6 6 0
TGACCATCGTTGGCGTGGACCTCATGCAGGTTGAACGGGTCACAGGCCGGCTGACC TGGC
6 7 0 6 8 0 6 9 0 7 0 0 7 1 0 7 2 0
CCAAAGTGCTTGGTGGCGGCGTGCTGAGTGGCGCCTGGCTGGGCCTGTTCATCGGGTTGG
7 3 0 7 4 0 7 5 0 7 6 0 7 7 0 7 8 0
TGCTCGGGTTCTTCAGTCCCAATCCATGGTCCGCGCTGGTTACCGGCCTGGTGGCCGGGG
7 9 0 8 0 0 8 1 0 8 2 0 8 3 0 8 4 0
TGTTCTTCGGGCTGATCACCTCTGCAGTGCCGTACGCAATGGCTCGCGGCACAAGGGATT
8 5 0 8 6 0 87 0 8 8 0 8 9 0 9 0 0
TCAGCTCGACCATGCAACTGGTTGCCGGTCGCTACGACGTACTTTGTGATCCGCAAAATG
169
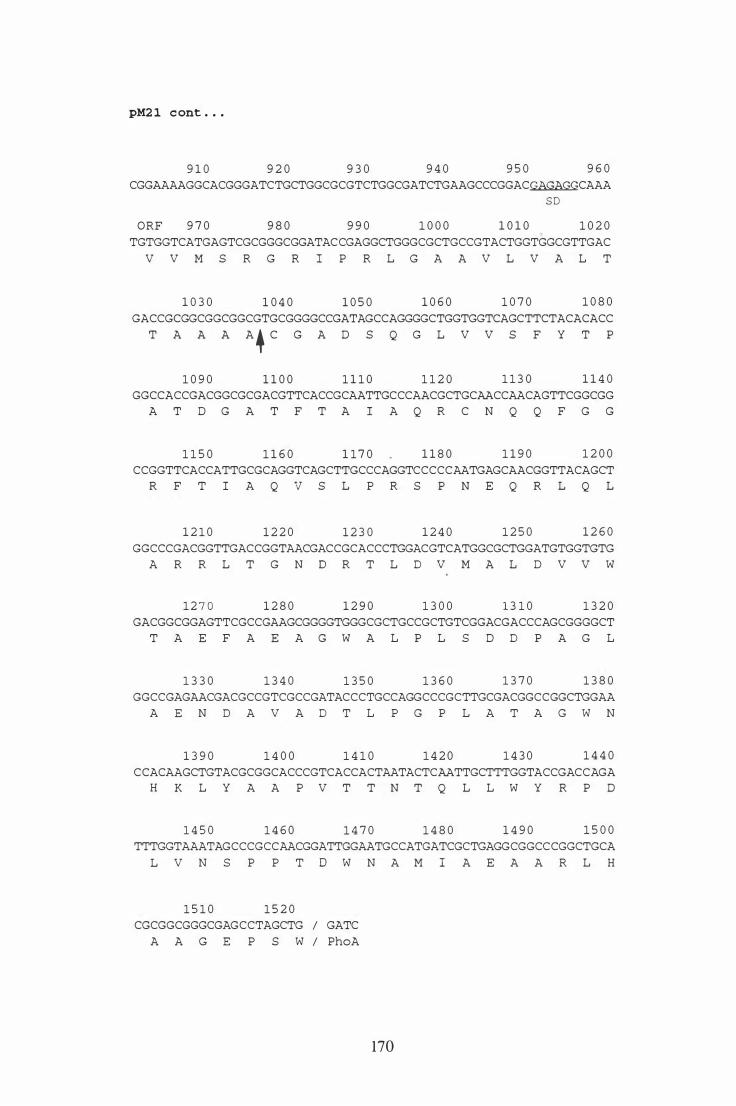
pM2 1 c ont . . .
9 1 0 9 2 0 9 3 0 9 4 0 9 5 0 9 6 0
CGGAAAAGGCACGGGATCTGCTGGCGCGTCTGGCGATCTGAAGCCCGGACGAGAGGCAAA SO
ORF 9 7 0 9 8 0 9 9 0 1 0 0 0 1 0 1 0 1 0 2 0
TGTGGTCATGAGTCGCGGGCGGATACCGAGGCTGGGCGCTGCCGTACTGGTGGCGTTGAC
V V M S R G R I P R L G A A V L V A L T
1 0 3 0 1 0 4 0 1 0 5 0 1 0 6 0 1 0 7 0 1 0 8 0
GACCGCGGCGGCGGCGTGCGGGGCCGATAGCCAGGGGCTGGTGGTCAGCTTCTACACACC
T A A A A4 C G A D S Q G L V V S F Y T P
1 0 9 0 1 1 0 0 1 1 1 0 1 1 2 0 1 1 3 0 1 1 4 0
GGCCACCGACGGCGCGACGTTCACCGCAATTGCCCAACGCTGCAACCAACAGTTCGGCGG A T D G A T F T A I A Q R C N Q Q F G G
1 1 5 0 1 1 6 0 1 1 7 0 1 1 8 0 1 1 9 0 1 2 0 0
CCGGTTCACCATTGCGCAGGTCAGCTTGCCCAGGTCCCCCAATGAGCAACGGTTACAGCT R F T I A Q v S L P R S P N E Q R L Q L
1 2 1 0 1 2 2 0 1 2 3 0 1 2 4 0 1 2 5 0 1 2 6 0
GGCCCGACGGTTGACCGGTAACGACCGCACCCTGGACGTCATGGCGCTGGATGTGGTGTG A R R L T G N O R T L 0 V M A L D V V W
1 2 7 0 1 2 8 0 1 2 9 0 1 3 0 0 1 3 1 0 1 3 2 0 GACGGCGGAGTTCGCCGAAGCGGGGTGGGCGCTGCCGCTGTCGGACGACCCAGCGGGGCT
T A E F A E A G W A L P L S D 0 P A G L
1 3 3 0 1 3 4 0 1 3 5 0 1 3 6 0 1 3 7 0 1 3 8 0
GGCCGAGAACGACGCCGTCGCCGATACCCTGCCAGGCCCGCTTGCGACGGCCGGCTGGAA A E N D A V A 0 T L P G P L A T A G W N
1 3 9 0 1 4 0 0 1 4 1 0 1 4 2 0 1 4 3 0 1 4 4 0
CCACAAGCTGTACGCGGCACCCGTCACCACTAATACTCAATTGCTTTGGTACCGACCAGA H K L Y A A P V T T N T Q L L W Y R P D
1 4 5 0 1 4 6 0 1 4 7 0 1 4 8 0 1 4 9 0 1 5 0 0
TTTGGTAAATAGCCCGCCAACGGATTGGAATGCCATGATCGCTGAGGCGGCCCGGCTGCA
L V N S P P T O W N A M I A E A A R L H
1 5 1 0 1 5 2 0 CGCGGCGGGCGAGCCTAGCTG / GATC
A A G E P S W / PhoA
170
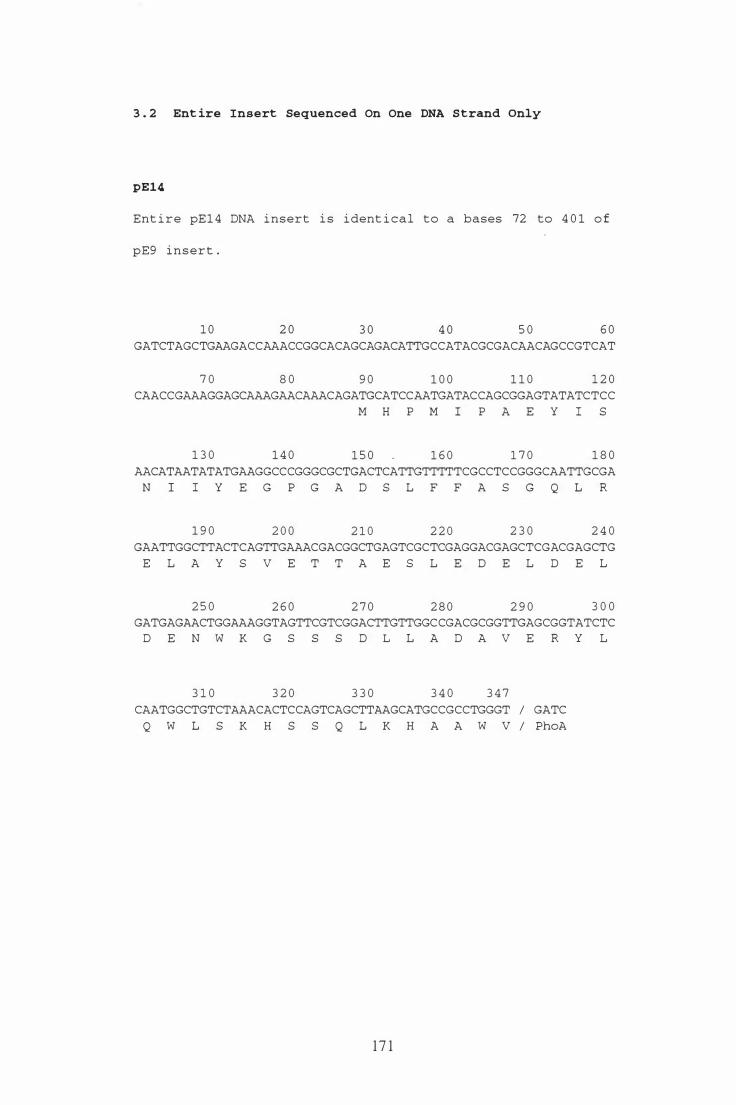
3 . 2 Ent ire Insert Sequenced On One DNA S trand only
pEl4
Ent i r e pE 1 4 DNA i nsert i s i dent i cal to a bases 72 to 4 0 1 o f
pE9 i nsert .
1 0 2 0 3 0 4 0 5 0 6 0
GATCTAGCTGAAGACCAAACCGGCACAGCAGACATTGCCATACGCGACAACAGCCGTCAT
7 0 8 0 9 0 1 0 0 1 1 0 1 2 0
CAACCGAAAGGAGCAAAGAACAAACAGATGCATCCAATGATACCAGCGGAGTATATCTCC M H P M I P A E Y I S
1 3 0 1 4 0 1 5 0 1 6 0 1 7 0 1 8 0
AACATAATATATGAAGGCCCGGGCGCTGACTCATTGTTTTTCGCCTCCGGGCAATTGCGA N I l Y E G P G A D S L F F A S G Q L R
1 9 0 2 0 0 2 1 0 2 2 0 2 3 0 2 4 0
GAATTGGCTTACTCAGTTGAAACGACGGCTGAGTCGCTCGAGGACGAGCTCGACGAGCTG
E L A Y S V E T T A E S L E D E L D E L
2 5 0 2 6 0 2 7 0 2 8 0 2 9 0 3 0 0
GATGAGAACTGGAAAGGTAGTTCGTCGGACTTGTTGGCCGACGCGGTTGAGCGGTATCTC D E N W K G S S S D L L A D A V E R Y L
3 1 0 3 2 0 3 3 0 3 4 0 3 4 7
CAATGGCTGTCTAAACACTCCAGTCAGCTTAAGCATGCCGCCTGGGT / GATC
Q W L S K H S S Q L K H A A W V / PhoA
17 1
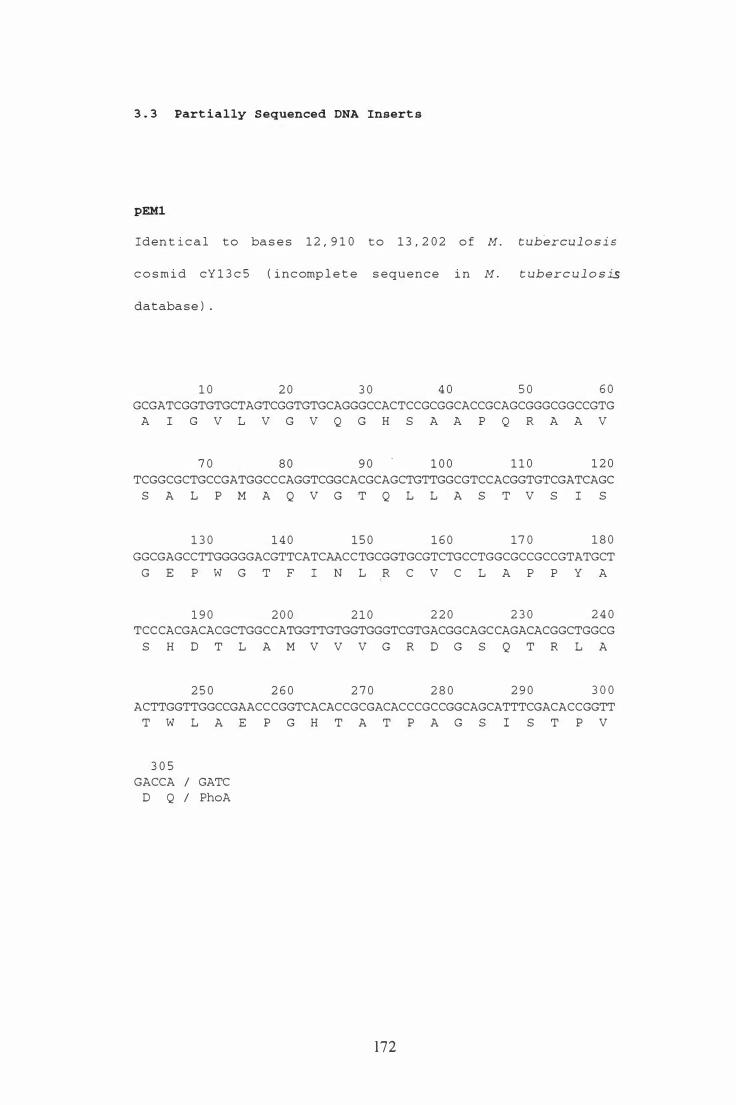
3 . 3 Part i a l ly S equenced DNA Insert s
pEMl
Iden t i c a l t o ba s e s 1 2 , 9 1 0 t o 1 3 , 2 0 2 o f M . t ubercu l o s i s
c o s m i d cY 1 3 c 5 ( i nc omp l e t e s equence i n M . t ub e r c u l o s is
database ) .
1 0 2 0 3 0 4 0 5 0 6 0
GCGATCGGTGTGCTAGTCGGTGTGCAGGGCCACTCCGCGGCACCGCAGCGGGCGGCCGTG A I G V L V G V Q G H S A A P Q R A A V
7 0 8 0 9 0 1 0 0 1 1 0 1 2 0
TCGGCGCTGCCGATGGCCCAGGTCGGCACGCAGCTGTTGGCGTCCACGGTGTCGATCAGC S A L P M A Q V G T Q L L A S T V S I S
1 3 0 1 4 0 1 5 0 1 6 0 1 7 0 1 8 0
GGCGAGCCTTGGGGGACGTTCATCAACCTGCGGTGCGTCTGCCTGGCGCCGCCGTATGCT
G E P W G T F I N L ,R C V C L A P P Y A
1 9 0 2 0 0 2 1 0 2 2 0 2 3 0 2 4 0 TCCCACGACACGCTGGCCATGGTTGTGGTGGGTCGTGACGGCAGCCAGACACGGCTGGCG
S H D T L A M V V V G R D G S Q T R L A
2 5 0 2 6 0 2 7 0 2 8 0 2 9 0 3 0 0
ACTTGGTTGGCCGAACCCGGTCACACCGCGACACCCGCCGGCAGCATTTCGACACCGGTT T W L A E P G H T A T P A G S I S T P V
3 0 5 GACCA / GATC
D Q / PhoA
l72
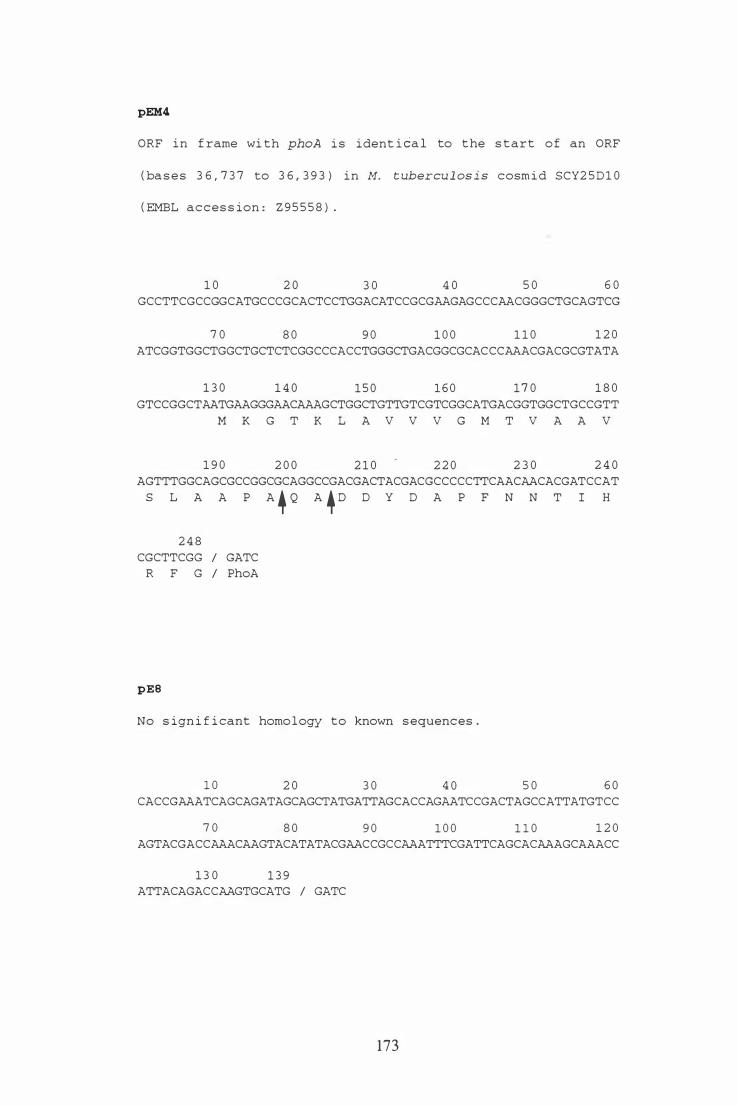
pEM4
ORF i n f rame wi th phoA i s ident i ca l to the s t art o f an ORF
( ba s e s 3 6 , 7 3 7 to 3 6 , 3 9 3 ) i n M. t ubercu l os i s cosm i d SCY2 5 D 1 0
( EMBL acces s ion : Z 9 5 5 5 8 ) .
1 0 2 0 3 0 4 0 5 0 6 0
GCCTTCGCCGGCATGCCCGCACTCCTGGACATCCGCGAAGAGCCCAACGGGCTGCAGTCG
7 0 8 0 9 0 1 0 0 1 1 0 1 2 0
ATCGGTGGCTGGCTGCTCTCGGCCCACCTGGGCTGACGGCGCACCCAAACGACGCGTATA
1 3 0 1 4 0 1 5 0 1 6 0 1 7 0 1 8 0
GTCCGGCTAATGAAGGGAACAAAGCTGGCTGTTGTCGTCGGCATGACGGTGGCTGCCGTT
M K G T K L A V V V G M T V A A V
1 9 0 2 0 0 2 1 0 2 2 0 2 3 0 2 4 0
AGTTTGGCAGCGCCGGCGCAGGCCGACGACTACGACGCCCCCTTCAACAACACGATCCAT
S L A A P A � Q A � D D Y D A P F N N T I H
2 4 8
CGCTTCGG / GATC R F G / PhoA
pES
No s ign i f i cant homo l ogy to known s equences .
1 0 2 0 3 0 4 0 5 0 6 0 CACCGAAATCAGCAGATAGCAGCTATGATTAGCACCAGAATCCGACTAGCCATTATGTCC
7 0 8 0 9 0 1 0 0 1 1 0 1 2 0 AGTACGACCAAACAAGTACATATACGAACCGCCAAATTTCGATTCAGCACAAAGCAAACC
1 3 0 1 3 9 ATTACAGACCAAGTGCATG / GATC
173
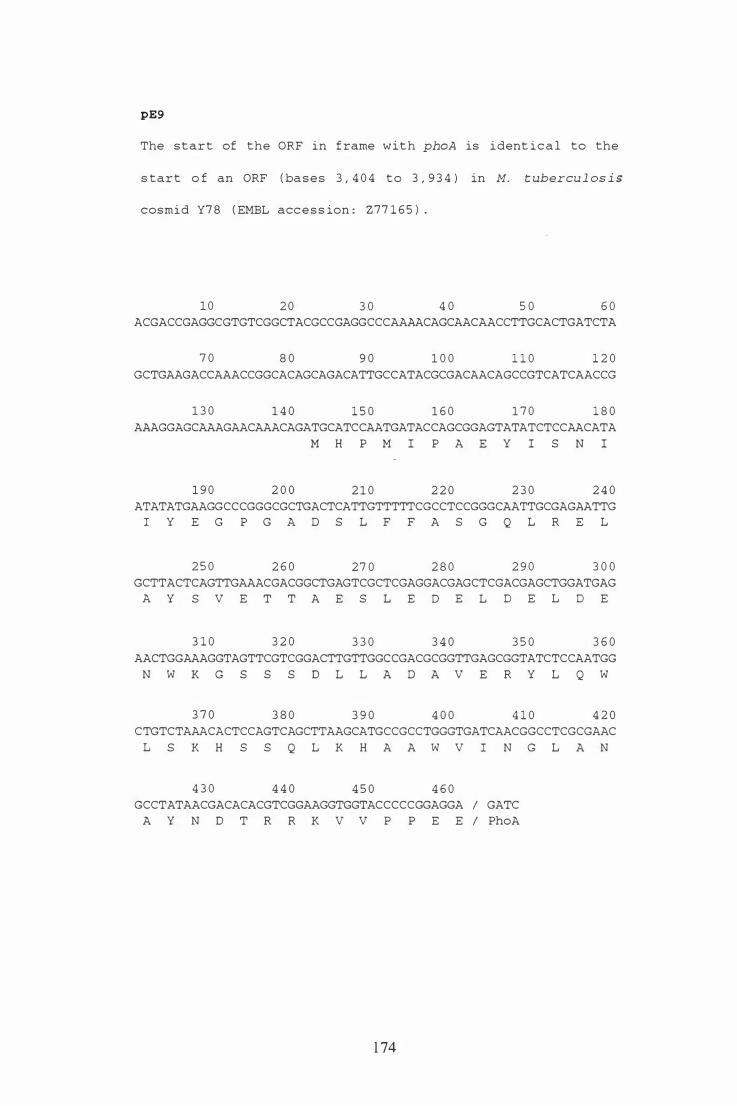
pE9
The start of the ORF in f rame w i t h phoA is i dent i c a l to the
s ta r t o f an ORF ( ba s e s 3 , 4 0 4 to 3 , 9 3 4 ) in M. t ubercu l os i s
cosmi d Y7 8 ( EMBL acc e s s ion : Z 7 7 1 6 5 ) .
1 0 2 0 3 0 4 0 5 0 6 0 ACGACCGAGGCGTGTCGGCTACGCCGAGGCCCAAAACAGCAACAACCTTGCACTGATCTA
7 0 8 0 9 0 1 0 0 1 1 0 1 2 0
GCTGAAGACCAAACCGGCACAGCAGACATTGCCATACGCGACAACAGCCGTCATCAACCG
1 3 0 1 4 0 1 5 0 1 6 0 1 7 0 1 8 0
AAAGGAGCAAAGAACAAACAGATGCATCCAATGATACCAGCGGAGTATATCTCCAACATA
M H P M I P A E Y I S N I
1 9 0 2 0 0 2 1 0 2 2 0 2 3 0 2 4 0
ATATATGAAGGCCCGGGCGCTGACTCATTGTTTTTCGCCTCCGGGCAATTGCGAGAATTG l Y E G P G A D S L F F A S G Q L R E L
2 5 0 2 6 0 2 7 0 2 8 0 2 9 0 3 0 0
GCTTACTCAGTTGAAACGACGGCTGAGTCGCTCGAGGACGAGCTCGACGAGCTGGATGAG A Y S V E T T A E S L E D E L 0 E L 0 E
3 1 0 3 2 0 3 3 0 3 4 0 3 5 0 3 6 0
AACTGGAAAGGTAGTTCGTCGGACTTGTTGGCCGACGCGGTTGAGCGGTATCTCCAATGG
N W K G S S S O L L A D A V E R Y L Q W
3 7 0 3 8 0 3 9 0 4 0 0 4 1 0 4 2 0 CTGTCTAAACACTCCAGTCAGCTTAAGCATGCCGCCTGGGTGATCAACGGCCTCGCGAAC
L S K H S S Q L K H A A W V I N G L A N
4 3 0 4 4 0 4 5 0 4 6 0 GCCTATAACGACACACGTCGGAAGGTGGTACCCCCGGAGGA I GATC
A Y N O T R R K V V P P E E I PhoA
1 74
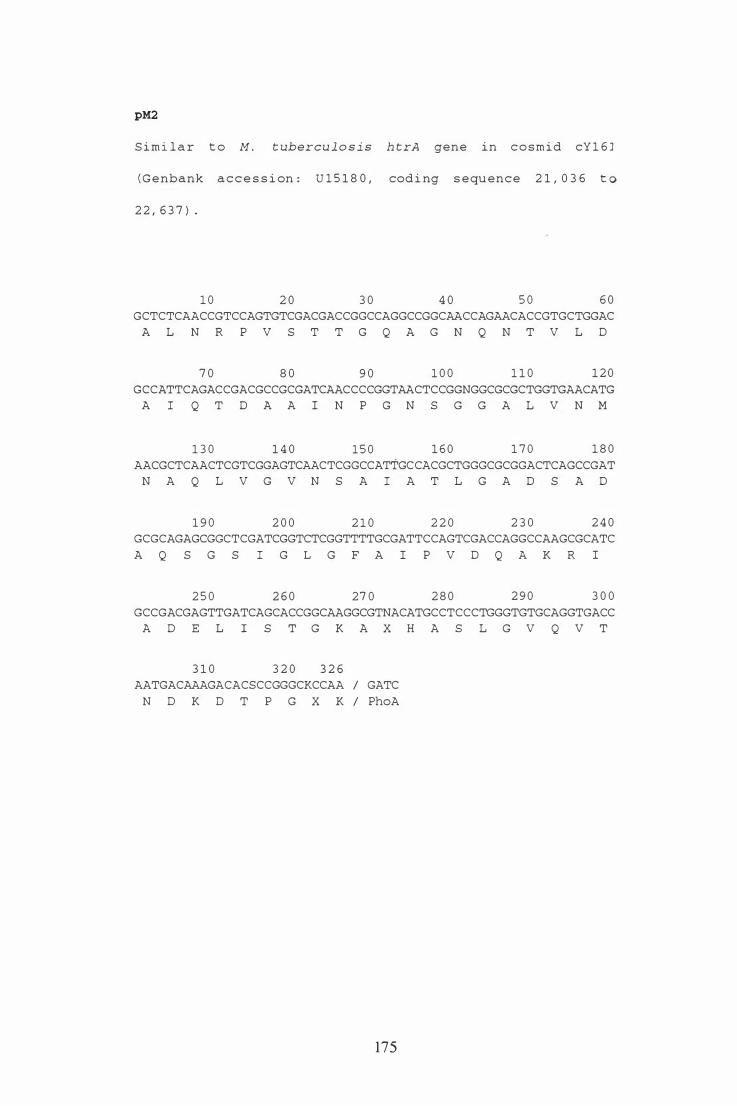
pM2
S i m i l a r t o M . t ubercu l o s i s h t rA gene i n c o s m i d cY 1 6 J
( G e nbank a c c e s s i on : U 1 5 1 8 0 , cod i ng s e qu ence 2 1 , 0 3 6 t o
2 2 , 6 3 7 ) .
1 0 2 0 3 0 4 0 5 0 6 0
GCTCTCAACCGTCCAGTGTCGACGACCGGCCAGGCCGGCAACCAGAACACCGTGCTGGAC A L N R P V S T T G Q A G N Q N T V L D
7 0 8 0 9 0 1 0 0 1 1 0 1 2 0
GCCATTCAGACCGACGCCGCGATCAACCCCGGTAACTCCGGNGGCGCGCTGGTGAACATG A I Q T D A A I N P G N S G G A L V N M
1 3 0 1 4 0 1 5 0 1 6 0 1 7 0 1 8 0
AACGCTCAACTCGTCGGAGTCAACTCGGCCATTGCCACGCTGGGCGCGGACTCAGCCGAT N A Q L V G V N S A I A T L G A D S A D
1 9 0 2 0 0 2 1 0 2 2 0 2 3 0 2 4 0 GCGCAGAGCGGCTCGATCGGTCTCGGTTTTGCGATTCCAGTCGACCAGGCCAAGCGCATC
A Q S G S I G L G F A I P V D Q A K R I
2 5 0 2 6 0 27 0 2 8 0 2 9 0 3 0 0
GCCGACGAGTTGATCAGCACCGGCAAGGCGTNACATGCCTCCCTGGGTGTGCAGGTGACC A D E L 1 S T G K A X H A S L G V Q V T
3 1 0 3 2 0 3 2 6 AATGACAAAGACACSCCGGGCKCCAA / GATC
N D K D T P G X K / PhoA
175
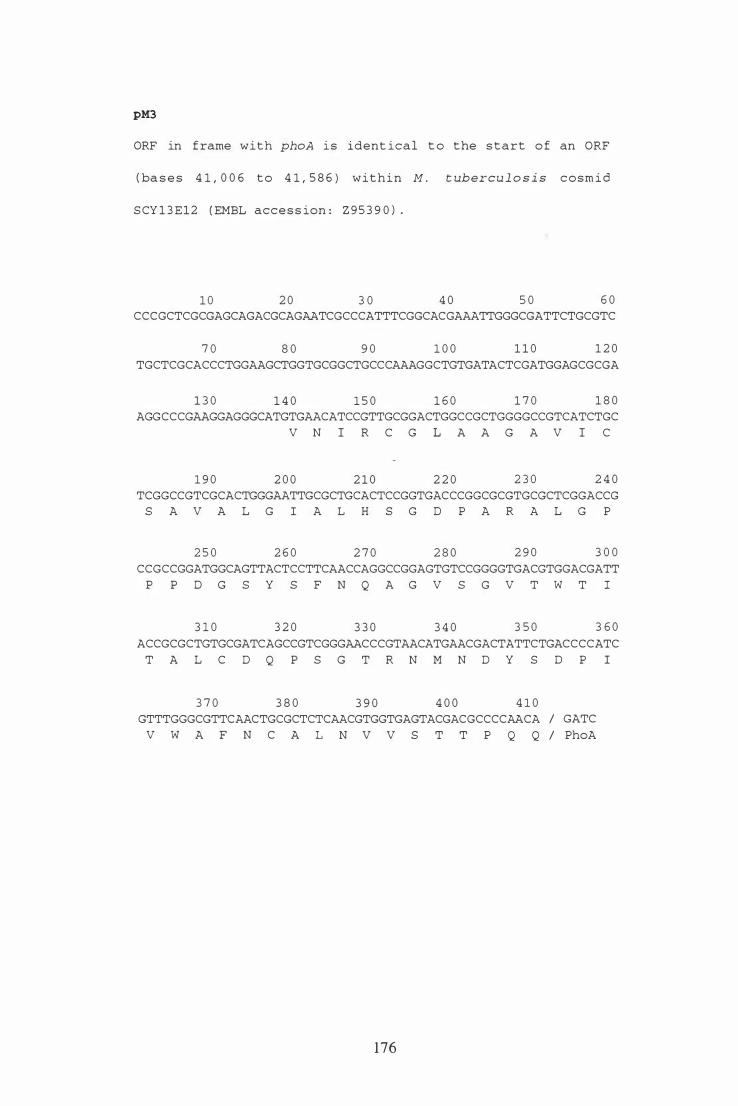
pM3
ORF in f rame with phoA i s ident ical t o the s t art o f an ORF
( ba s e s 4 1 , 0 0 6 t o 4 1 , 5 8 6 ) w i t h i n M . t ubercu l o s i s c o sm i d
S CY 1 3 E 1 2 ( EMBL acce s s ion : Z 9 5 3 9 0 ) .
1 0 2 0 3 0 4 0 5 0 6 0 CCCGCTCGCGAGCAGACGCAGAATCGCCCATTTCGGCACGAAATTGGGCGATTCTGCGTC
7 0 8 0 9 0 1 0 0 1 1 0 1 2 0
TGCTCGCACCCTGGAAGCTGGTGCGGCTGCCCAAAGGCTGTGATACTCGATGGAGCGCGA
1 3 0 1 4 0 1 5 0 1 6 0 1 7 0 1 8 0 AGGCCCGAAGGAGGGCATGTGAACATCCGTTGCGGACTGGCCGCTGGGGCCGTCATCTGC
V N I R C G L A A G A V I C
1 9 0 2 0 0 2 1 0 2 2 0 2 3 0 2 4 0
TCGGCCGTCGCACTGGGAATTGCGCTGCACTCCGGTGACCCGGCGCGTGCGCTCGGACCG S A V A L G I A L H S G D P A R A L G P
2 5 0 2 6 0 2 7 0 2 8 0 2 9 0 3 0 0
CCGCCGGATGGCAGTTACTCCTTCAACCAGGCCGGAGTGTCCGGGGTGACGTGGACGATT
P P D G S Y S F N Q A G V S G V T W T I
3 1 0 3 2 0 3 3 0 3 4 0 3 5 0 3 6 0
ACCGCGCTGTGCGATCAGCCGTCGGGAACCCGTAACATGAACGACTATTCTGACCCCATC
T A L C D Q P S G T R N M N D Y S D P I
3 7 0 3 8 0 3 9 0 4 0 0 4 1 0 GTTTGGGCGTTCAACTGCGCTCTCAACGTGGTGAGTACGACGCCCCAACA / GATC
V W A F N C A L N V V S T T P Q Q / PhoA
176
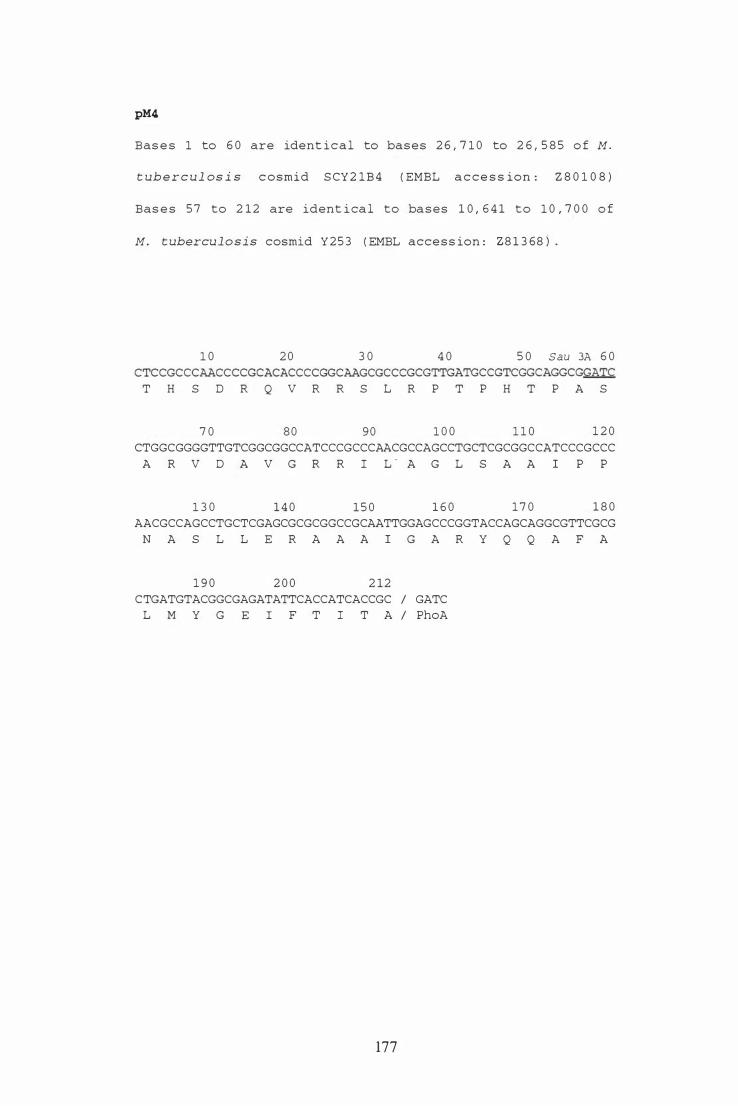
pM4
Bas e s 1 to 6 0 are ident i c a l to bas e s 2 6 , 7 1 0 to 2 6 , 5 8 5 o f M .
t ub e r c u l os i s c o smid S CY 2 1 B 4 ( EMBL a c c e s s ion : Z 8 0 1 0 8 )
Bas e s 5 7 to 2 1 2 are ident i ca l to ba s e s 1 0 , 6 4 1 to 1 0 , 7 0 0 o f
M . t ubercu l o s i s cosmid Y 2 5 3 ( EMBL acce s s ion : Z 8 1 3 68 ) .
1 0 2 0 3 0 4 0 5 0 Sau 3A 6 0 CTCCGCCCAACCCCGCACACCCCGGCAAGCGCCCGCGTTGATGCCGTCGGCAGGCGGATC
T H S D R Q V R R S L R P T P H T P A S
7 0 8 0 9 0 1 0 0 1 1 0 1 2 0
CTGGCGGGGTTGTCGGCGGCCATCCCGCCCAACGCCAGCCTGCTCGCGGCCATCCCGCCC
A R V D A V G R R I L A G L S A A I P P
1 3 0 1 4 0 1 5 0 1 6 0 1 7 0 1 8 0
AACGCCAGCCTGCTCGAGCGCGCGGCCGCAATTGGAGCCCGGTACCAGCAGGCGTTCGCG N A S L L E R A A A I G A R Y Q Q A F A
1 9 0 2 0 0 2 1 2 CTGATGTACGGCGAGATATTCACCATCACCGC / GATC
L M Y G E l F T I T A / PhoA
177

Appendix 4: Research Objectives For Control Of Bovine Tuberculosis In
New Zealand
In 1 99 1 the Possum and Bovine Tuberculosis Control National Science Strategy
Committee (NSSC) was established to identify and co-ordinate national priorities for
possum and tuberculosis research in New Zealand (Wright, 1 995). Research objectives
were divided into three phases based on the expected time required for adequate
information to become available (Livingstone, 1992) . Research programmes have been
developed to address the specific objectives set for each phase of research.
The objective of short term research (five years) is to identify effective methods to prevent
the spread of bovine tuberculosis into economically important tuberculosis-free areas of
New Zealand (Livingstone, 1992). Many shOlt tenn research programmes have a strong
epidemiological focus and relevant aspects of possum ecology and possum/cattle
interactions have also been identified as areas worthy of further investigation
(Livingstone, 1 992) . Another priority for short term research is to develop new
environmentally acceptable possum toxins, attractants, and bait presentation methods to
increase the efficiency and effectiveness of possum control operations (Wright, 1 995).
Research on methods for monitoring the effectiveness of control operations is also
necessary (Wlight, 1995).
The goal of the medium term research is to find the means to enable animal products from
endemic areas to compete internationally (Livingstone, 1 992). Outcomes of medium term
research projects are expected within ten years (Wright, 1995). The major emphasis of
medium tenTI research is to develop a cost-effective, internationally acceptable vaccine for
cattle and deer, and perhaps possums (Livingstone, 1992). Vaccine-bas�d research is
divided into two impOltant areas; 1 ) the reassessment of the efficacy of the M. bovis BCG
vaccine and 2) the development of a subunit-based vaccine against bovine tuberculosis.
In addition, research on the pathogenesis and diagnosis of bovine tuberculosis is also a
178

priority (Wright, 1995). Certain epidemiological projects also fit into the time frame for
medium term research (Wright, 1995).
Long term research is aimed at identifying a cost-effective, humane, environmentally safe
method of eradicating tuberculosis from possums, preferably by eradicating the possum
population (Livingstone, 1992). Research into the scientific feasibility of biological
control of possums, the type of control most likely to be successful, and biological
control safety issues are of highest priority (Wright, 1995). The results of such research
are expected within fifteen years, although the possum problem in transmission of bovine
tuberculosis is unlikely to be solved in the next twenty years (Wright, 1995).
179
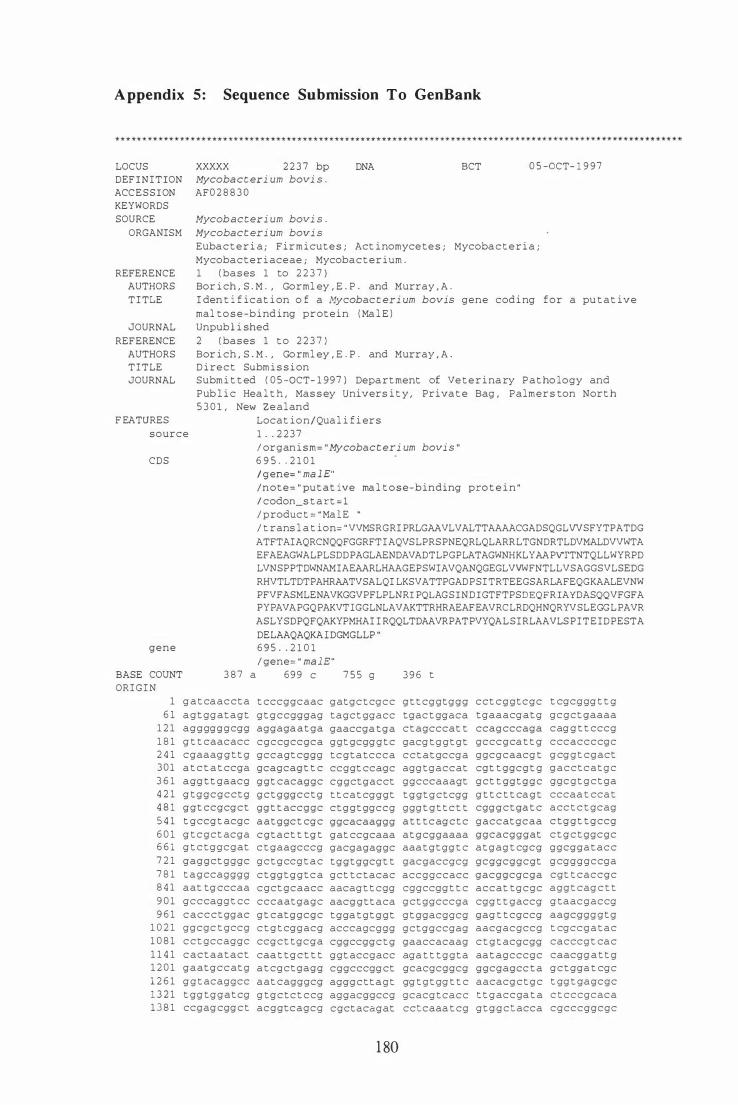
Appendix 5: Sequence Submission To GenBank
LOCUS
DEF I N I T ION
ACC E S S I ON
KEYWORDS
SOURCE
ORGANISM
REFERENCE
AUTHORS
T I TLE
JOURNAL
REF ERENCE
AUTHORS
T I TLE
JOURNAL
F EATURES
xxxxx 2 2 3 7 bp
Mycoba ct eri um bovi s .
AF 0 2 8 8 3 0
Mycobacteri um bovi s .
Mycobact eri um bovi s
DNA BCT 0 5 -0CT- 1 9 9 7
Euba c t e r i a ; F i r m i cu t e s ; Act i nomyce t e s ; Mycoba c t e r i a ;
Mycoba c t e r i aceae ; Mycoba c t e r i um .
1 ( ba s es 1 to 2 2 3 7 )
Bor i ch , S . M . , Go rml ey , E . P . and Murray , A .
I den t i f i ca t i on o f a Mycobac t eri um bovis gene cod i ng f o r a pu t a t ive
mal t o s e -b i nd ing protein ( Ma l E )
Unpubl i shed
2 ( bases 1 t o 2 2 3 7 )
Bor i ch , S . M . , Go rm l ey , E . P . and MurraY , A .
D i re c t Subm i s s i on
Subm i t t ed ( 0 5 - 0CT- 1 9 9 7 ) Depa r t ment of Ve t e r i na ry P a t ho logy and
Pub l i c Hea l t h , Mas s ey Univers i t y , Priva t e Bag , P a l m e r s ton Nor t h
5 3 0 1 , New Z e a l and
Loca t i o n / Qua l i f i ers
source 1 . . 2 2 3 7
l organ i s m= " Mycobact eri um bovi s "
6 9 5 . . 2 1 0 1 CDS
gene
BASE COUNT 3 8 7 a
ORI G I N
1 g a t ca a c c t a
6 1 a g t gg a t a g t
1 2 1 aggggggcgg
1 8 1 g t t caacacc
2 4 1 cgaaag g t t g
3 0 1 a t c t a t ccga
3 6 1 a gg t t gaacg
4 2 1 g t ggcgcctg
4 8 1 g g t ccgcg c t
5 4 1 t g ccg t acgc
6 0 1 g t c g c t acga
6 6 1 g t c tggcgat
7 2 1 gaggct gggc
7 8 1 t a g ccagggg
8 4 1 a a t tg cccaa
9 0 1 g c c cagg t cc
9 6 1 c a c c c t ggac
1 0 2 1 ggcgc t gccg
1 0 8 1 c c t gccaggc
1 1 4 1 c a c t a a t a c t
1 2 0 1 g a a t g c c a t g
1 2 6 1 g g t acaggcc
1 3 2 1 t gg t g g a t cg
1 3 8 1 ccgag cgg c t
I gene= " ma l E"
I n o t e = " pu t a t ive ma l t o s e - b inding pro t e i n "
I codon_s t a rt = l
I p roduc t = " Ma l E "
I t rans l a t ion= " VVMSRGRI PRLGMVLVALTTAAAACGADSQGLWSFYTPATDG
ATFTAIAQRCNQQFGGRFT I AQVS LPRS PNEQRLQLARRLTGNDRTLDVMALDVVWTA
EFAEAGWALPLSDD PAGLAENDAVADTLPGPLATAGWNHKLYM PVTTNTQLLWYRPD
LVNSPPTDWNAMIAEMRLHAAGEPSWIAVQANQGEGLVVWFNTLLVSAGGSVLSEDG
RHVTLTDTPAHRMTVSALQI LKSVATTPGAD PSI TRTEEGSARLAFEQGKAALEVNW
PFVFASMLENAVKGGVPFLPLNRI PQLAG S I N D I GTFTPSDEQFR IAYDASQQVFGFA
PYPAVA PGQ PAKVT IGGLNLAVAKTTRHRAEAF EAVRC LRDQHNQRYVSLEGG L PAVR
ASLYSDPQFQAKYPMHAI I RQQLTDAAVRPAT PVYQA L S I RLAAVLS P I T E I D PESTA
DELAAQAQKA I DGMGLLP "
6 9 5 . . 2 1 0 1
I gene= " ma l E "
6 9 9 c 7 5 5 9 3 9 6 t
t cccggcaac gatgc t cg c c g t t cggtggg c c t cggtcgc t cgcggg t t g
g t g c cgggag tagc t ggacc tgac t ggaca tgaaacg a t g gcgct gaaaa
aggaga a t ga gaaccga t g a c t agccca t t ccag cccaga cag g t t cccg
cgccgccgca ggt gcgg g t c gacg t g g t g t gcccgca t t g c ccaccccgc
gccagt cggg t c g t a tccca c c t a t gc cg a ggcg caacg t g cg g t cgact
gcagcag t t c ccggt ccagc agg tgaccat cg t t ggcg t g g a c c t c a t g c
g g t cacaggc cggctgacct ggcccaaagt g c t t gg t g g c ggc g t g c t ga
g c t ggg c c t g t t ca t cgggt t g g t g c t cgg g t t c t t ca g t cccaa t cca t
gg t t accggc c t g g t ggccg ggg t g t t c t t cgg g c t ga t c a cc t c t gcag
a a t ggc t cg c ggcacaaggg a t t t c ag c t c gaccatgcaa c t g g t t g ccg
c g t a c t t t g t gat ccgcaaa a t g cggaaaa ggcacgggat c t g c t ggcgc
c t gaagcccg gacgagaggc aaa t g t gg t c a t g ag t cgcg ggcgga t a c c
g c t g ccg t a c t g g t ggcg t t gacgaccgcg gcggcggcgt g cggggccga
c t gg t g g t c a gct t c t acac accggccacc gacggcgcga cgt t caccgc
cgct gcaacc aacag t t cgg cggccgg t t c acca t t g cgc agg t cag c t t
cccaatgagc aacg g t t a ca g c t ggcccga cgg t t gaccg g taacgaccg
g t catggcgc t gga t g t g g t g t ggacggcg gag t t cgccg aagcggg g t g
c t g t cggacg acccagcggg gctggccgag aacgacgccg t cgccga t a c
ccg c t tgcga cggccgg c t g gaaccacaag c t g t acgcgg cacccg t ca c
caa t t g c t t t ggt accgacc aga t t t g g t a aa t agcccgc caacgg a t t g
a t cg c t gagg cggcccgg ct gcacgcggcg ggcgagcc t a g c t gga t cgc
a a t cagggcg aggg c t t a g t gg t g t gg t t c aacacg c t g c t gg t gagcgc
g t g c t c t c cg aggacggccg gcacg t ca c c t t g accga t a c t cccgcaca
acggtcagcg cgctacagat cctcaaa t cg g t g g c t acca cgcccggcgc
1 80

1 4 4 1 cgacccctcg a t cacccgca ccgaagaggg cagcgcgcgg t t gg c c t t cg aacagggcaa 1 5 0 1 ggccgcgctc gaggtcaa t t ggccgttcgt gtt tgcgtcc a t g c t cgaga acgcgg t gaa 1 5 6 1 gggtgg t g t g c c c t t c t tac cg c t t aaccg ga t t ccgcag t t ggccggca gcat caacga 1 6 2 1 c a t cgggacg t t cacgccca gcgacgagca gtt ccgca t c gcg t a tgacg ccagccagca 1 6 8 1 g g t g t t cggt t t cgcgccct at ccggc t g t agcgcccggc cagccagcca aggt gacgat 1 7 4 1 cggcggg t tg aacc tggcgg tggccaagac gacccgccat cgagcggagg cat t cgaagc 1 8 0 1 g g t gcg t tgt c tgcgt gacc agcacaa t ca gagg tacg t c t cg c t cgagg gggg t c tgcc 1 8 6 1 cgcgg tgcgg gcg t cgctgt actccga t cc gcaa t t ccag gcgaag t a t c cga tgcacgc 1 9 2 1 cat ta t t cgg cagcaactca ccga tgccgc ggtgcggccg gcgacgccgg t g t a ccaggc 1 9 8 1 g t t gt ccatc cggc tcgcgg cggtgct gag cccgatcacc gagat cgacc cggag t ccac 2 0 4 1 ggccgacgaa c t t g ccgcgc aggcgcagaa agcca t cgac ggca tgggcc . tgct cccgtg 2 1 0 1 a c c t ccg t t g aacagcggac cgccaccgcg g t c t t t t ccc g t a ccgggag ccgcatggcc 2 1 6 1 gaacggcgac tggcgttcat gc tggtcgca cccgccgcga t g t t gatggt ggcgg tgacg 2 2 2 1 gcctat ccca t cg g t t a
I I
1 8 1
References:
Abou-Zeid, c., 1. Smith, J. Grange, J. Steele and G. Rook ( 1986). Subdivision of
daughter strains of Bacille Calmette-Guerin (BCG) according to secreted protein patterns.
Journal of General Microbiology ill, 3047-3053.
Ainsa, J .A. , C. Martin, M. Cabeza, F. de la Cruz and M.V. Mendiola ( 1 996).
Construction of a family of Mycobacterium / Escherichia coli shuttle vectors derived from
pAL5000 and pACYC 1 84: their use for cloning an antibiotic-resistance gene from
Mycobacteriumfortuitum Gene lli(1-2), 23-26.
Aldwell, F.E., D.N. Wedlock and B.M. BuddIe ( 1997). Sequential activation of alveolar
macrophages by IFN-y and LPS is required for enhanced growth inhibition of virulent
Mycobacterium bovis but not M. bovis BCG. Immunology and Cell Biology 75 , 1 6 1 -
1 66.
Amara, R.R. and V. Satchidanandam ( 1996). Analysis of genomic DNA expression
library of Mycobacterium tuberculosis using tuberculosis patient sera: evidence for
modulation of host immune response. Infection and Immunity M(9), 3765-377 1 .
Altschul, S.F., W. Gish, W . Miller, E.W. Myers and DJ. Lipman ( 1 990). Basic local
alignment search tool. Journal of Molecular Biology 2 15, 403-410.
Andersen, A. .B. ( 1994a). Mycobacterium tuberculosis proteins - structure, function, and
immunological relevance. Danish Medical Bulletin �(2), 205-21 5.
o
Andersen, A.B., P. Andersen and L. Ljungqvist ( 1 992a). Structure and function of a
40,OOO-molecular-weight protein antigen of Mycobacterium tuberculosis. Infection and
Immunity @(6), 23 17-2323.
1 82
•
Andersen, A.B . and E.B. Hansen ( 1989). Structure and mapping of antigenic domains
of protein antigen b, a 38,OOO-molecular-weight protein of Mycobacterium tuberculosis.
Infection and Immunity 51(8), 248 1 -2488.
Andersen, P. ( 1 994b). Effective vaccination of mice against Mycobacterium tuberculosis
infection with a soluble mixture of secreted mycobacterial proteins. Infection and
Immunity .62(6), 2536-2544 .
• Andersen, P., A.B. Andersen, A.L. S<j>rensen and S. Nagai ( 1995). Recall of long-lived
immunity to Mycobacterium tuberculosis infection in mice. Journal of Immunology
1 54(7), 3359-3372.
Andersen, P., D. Askgaard, A. Gottshau, J .. Bennedsen, S. Nagai and I. Heron ( 1 992b).
Identification of immunodominant antigens during infection with Mycobacterium
tuberculosis. Scandinavian Journal of Immunology .3Q., 823-83 1 .
Andersen, P., D . Askgaard, L. Ljungqvist, M.W. Bentzon and I . Heron ( 1 99 1 ). T-cell
proliferative response to antigens secreted by Mycobacterium tuberculosis. Infection and
Immunity 59(4), 1 558- 1 563.
Andersen, P. and I. Heron ( 1 993). Simultaneous electroelution of whole SDS
polyacrylamide gels for the direct cellular analysis of complex protein mixtures. Journal
of Immunological Methods lQl( 1), 29-39.
Ashbridge, K.R., R.J. Booth, J.D. Watson and R.B . Lathigra ( 1 989). Nucleotide
sequence of the 1 9kDa antigen gene from Mycobacterium tuberculosis. Nucleic Acids
Research 12(3), 1 249.
Averill, L.E., U. Cavallo , R.S. Wallis, W.H. Boom, M. Bona, M. Mincek, L.
Pascopella, W.R. Jacobs, Jr. and J.J. Ellner ( 1993). Screening of a cosmid library of
1 83
Mycobacterium bovis BCG in Mycobacterium smegma tis for novel T-cell stimulatory
antigens. Research in Microbiology 144, 349-362.
B arnes, P.F., R.L. Modlin and J.J. Ellner ( 1 994). T-cell responses and cytokines.
Tuberculosis: Pathogenesis, Protection, and Control. B. R. B loom, Ed. American
Society for Microbiology Press, Washington D.C., 4 17-435.
Bashyam, M.D., D. Kaushal, S.K. Das Gupta and AK. Tyagi ( 1996). A study of the
mycobacterial transcriptional apparatus: identification of novel features in promoter
elements. Journal of Bacteriology ill(16), 4847-4853.
Belisle, J.T. , L. Pasco pella, J.M. Inamine, P.J. Brennan and W.R. Jacobs, Jr. ( 1 99 1 ).
Isolation and expression of a gene cluster responsible for biosynthesis of the
glycopeptidolipid antigens of Mycobacterium avium. Journal of Bacteriology ID(2 1) ,
699 1 -6997 .
Berggren, S .A ( 198 1 ) . Field experiment with BCG vaccine in Malawi. British
Veterinary Journal 1 37 ( 1 ), 88-94.
Bergh, S . and S.T. Cole ( 1 994). MycDB : An integrated mycobacterial database.
Molecular Microbiology 12(4), 5 17-534.
Berthet, F.-X. , J. Rauzier, E.M. Lim, W. Philipp, B. Gicquel and D. Portnoi ( 1 995).
Characterization of the Mycobacterium tuberculosis erp gene encoding a potential cell
surface protein with repetitive structures. Microbiology 141 (9), 2 1 23-2 1 30.
Blander, S.J. and M.A Horwitz ( 1989). Vaccination with the major secretory protein of
Legionella pneumophila induces cell-mediated and protective immunity in a guinea pig
model of Legionnaires' Disease. Journal of Experimental Medicine l62., 69 1 -705.
1 84
Bloom, B .R. and P.E.M. Fine ( 1 994). The BCG experience: Implications for future
vaccines against tuberculosis. Tuberculosis: Pathogenesis, Protection, and Control. B. R.
Bloom, Ed. American Society for Microbiology Press, Washington D.C., 53 1 -557.
Boismenu, R. and W.L. Havran ( 1997). An innate view of "(8 T cells. Current Opinion
in Immunology 2, 57-63.
Bothamley, G.H. and J.M. Grange ( 199 1 ) . The Koch phenomenon and delayed
hypersensitivity: 1 89 1 - 1 99 1 . Tubercle Tl, 7- 1 1 .
Boucher, J.e., J. Martinez-Salazar, MJ. Schurr, M.H. Mudd, H. Yu and V. Deretic
( 1 996). Two distinct loci affecting conversion to mucoidy in Pseudomonas aeruginosa in
cystic fibrosis encode homo logs of the serine protease HtrA Journal of Bacteriology
1 78 (2), 5 1 1 -523.
Braibant, M., P. Lefevre, L. de Wit, P. Peirs, J. Ooms, K. Huygen, AB. Andersen and
J. Content ( 1 996). A Mycobacterium tuberculosis gene cluster encoding proteins of a
phosphate transporter homologous to the Escherichia coli Pst system. Gene ill, 1 7 1 -
1 76.
Brewer, T.F. and G.A Colditz ( 1 995). Relationship between Bacille Calmette-Guerin
(BCG) strains and the efficacy of BCG vaccine in the prevention of tuberculosis. Clinical
Infectious Diseases 20(1 ), 1 26- 1 35.
Brooks, G.F., J.S. Butel and L.N. Omston, Eds. ( 199 1 ) . Mycobacteria. Jarwetz,
Melnick and Adelberg 's Medical Microbiology, Appleton and Lange ( 1 9th edn), 272-
279.
Brown, AE., T.J. Holzer and B.R. Andersen ( 1987). Capacity of human neutrophils to
kill Mycobacterium tuberculosis. The Joumal of Infectious Diseases l5.Q(6), 985-989.
1 85
Brown, E. , J.P. Atkinson and D.T. Fearon ( 1994). Innate immunity: 50 ways to kill a
microbe. Current Opinion in Immunology Q, 73-74.
B uddIe, B .M. , F.E. Aldwell, A. Pfeffer, G.W. de Lisle and L.A. Corner ( 1994).
Experimental Mycobacterium bovis infection of cattle: Effect of dose of M. bovis and
pregnancy on immune responses and distribution of lesions. New Zealand Veterinary
]oumaI 42, 1 67- 172.
B uddIe, B .M., G.W. de Lisle, A. Pfeffer and F.E. Aldwell ( 1 995a). Immunological
responses and protection against Mycobacterium bovis in calves vaccinated with a low
dose of BCG. Vaccine l3.(1 2), 1 123- 1 1 30.
BuddIe, B.M., D. Keen, G. Thomson, G. Jowett, A.R. McCarthy, J. Heslop, G.W. de
Lisle, J .L. Stanford and F.E. Aldwell ( 1 995b) . Protection of cattle from bovine
tuberculosis by vaccination with BCG by the respiratory or subcutaneous route, but not
by vaccination with killed Mycobacterium vaccae. Research In Veterinary Science �, 10-
1 6 .
Cameron, R.M. , K. Stevenson, N.F. Inglis, J . Klausen and J.M. Sharp ( 1 994).
Identification and characterisation of a putative serine protease expressed in vivo by
Mycobacterium avium subsp. paratuberculosis. Microbiology .HQ, 1977- 1982.
Carpenter, E., L. Fray and E. Gormley ( 1997). Cellular responses and Mycobacterium
bovis BCG growth inhibition by bovine lymphocytes. Immunology and Cell Biology. In
Press.
Carpenter, E.A. , L.M. Fray, LJ. Sandall, R.P. Kawakami, D.M. Collins and E.P.
Gormley ( 1995). Identification of bovine T cell stimulatory antigens using a cosmid
library of Mycobacterium bovis in Mycobacterium smegmatis. New Zealand Veterinary
]oumal 41, 360-364.
1 86
Carpenter, E.A. and E.P. Gormley ( 1 995). Personal communication. Massey
University, Palmerston North.
Chan, J. and S.H.E. Kaufmann ( 1 994). Immune mechanisms of protection.
Tuberculosis: Pathogenesis, Protection, and Control. B. R. Bloom, Ed. American
Society for Microbiology Press, Washington D.C., 389-415 .
Chapon, C. ( 1982). Role of the catabolite activator protein in the maltose regulon of
Escherichia coli. Journal of Bacteriology .l.1Q(2), 722-729.
Cherayil, BJ. and R.A. Young ( 1988). A 28-kDa protein from Mycobacterium leprae is
a target of the human antibody response in lepromatous leprosy. Journal of Immunology
14 1 , 4370-4375.
Clark-Curtiss, J.E., W.R. Jacobs, Jr. , M.A. Docherty, L.R. Richie and R. Curtiss, III
( 1985). Molecular analysis of DNA and construction of genomic libraries of
Mycobacterium leprae. Journal of Bacteriology l6.l(3), 1093- 1 102.
Closs, 0., M. Harboe, N.H. Axelsen, K. Bunch-Christensen and M. Magnusson
( 1980). The antigens of M. bovis BCG studied by crossed immunoelectrophoresis: a
reference system. Scandinavian Journal of Immunology 12, 249-263.
Collins, F.M. ( 1988). Immunology of mycobacterial infections. The Reticuloendothelial
System: A Comprehensive Treatise. M. R. Escobar and J. P. Utz, Eds. Plenum Press,
New York, lQ, 125- 177.
Content, J . , A. de la Cuvellerie, L. De Wit, V. Vincent-Levy-Frebault, J . Ooms and J.
De Bruyn ( 199 1 ) . The genes coding for the antigen 85 complexes of Mycobacterium
tuberculosis and Mycobacterium bovis BCG are members of a gene family: cloning,
sequence determination, and genomic organization of the gene coding for antigen 85-C of
M. tuberculosis. Infection and Immunity 59(9), 3205-32 12.
1 87

Crews, K.B . ( 199 1 ). Post-mortem findings in bovine tuberculosis reactors. Surveillance
lR( 1 ), 1 5- 1 6.
Dabom, c.J. and J.M. Grange ( 1 993). HIV / AIDS and its implications for the control
of animal tuberculosis. British Veterinary Journal 149(5), 405-417 .
Dahl, M .K. , E . Francoz, W. Saurin, W. Boos, M.D. Manson and M. Hofnung ( 1989).
Comparison of sequences from the maLB regions of SaLmonella typhimurium and
Enterobacter aerogenes with Escherichia coli K12 : a potential new regulatory site in the
interoperonic region. Molecular and GeneraL Genetics ill, 199-207.
Daniel, T.M., J .H . Bates and K.A. Downes ( 1 994). History of tuberculosis.
Tuberculosis: Pathogenesis, Protection, and Control. B. R. B loom, Ed. American
Society for Microbiology Press, Washington D.C., 1 3-24.
Daniel, T.M. and B .W. Janicki ( 1 978). Mycobacterial antigens: a review of their
isolation, chemistry, and immunological properties. Microbiological Reviews 42, 84-
1 1 3 .
Dannenberg, A.M., Jf. ( 1989). Immune mechanisms in the pathogenesis of pulmonary
tuberculosis. Reviews Of Infectious Diseases ll(Suppl. 2), S269-S378 .
Dannenberg, A.M. , Jf. ( 1 99 1 ) . Delayed-type hypersensitivity and cell-mediated
immunity in the pathogenesis of tuberculosis. Immunology Today 1 2(7), 228-233.
Das Gupta, S.K. , M.D. Bashyam and A.K. Tyagi ( 1 993). Cloning and assessment of
mycobacterial promoters by using a plasmid shuttle vector. Journal of Bacteriology
175( 1 6) , 5 1 86-5 192.
188
Davies, K.l.A. and S.W. Lin ( 1988). Degradation of oxidatively denatured proteins in
Escherichia coli. Free Radicals In Biology And Medicine �, 2 15-223.
de Lacy, H. ( 1995). TB times: Breaching the peace in Maruia. North and South , 1 30-
1 37 .
De Wit, L. , A. de la Cuvellerie, 1. Ooms and 1. Content ( 1990). Nucleotide sequence of
the 32 kDa-protein gene (antigen 85A) of Mycobacterium bovis BCG. Nucleic A cids
Research 18., 3995.
Denis, 0., E. Lozes and K. Huygen ( 1997). Induction of cytotoxic T-cell responses
against culture fIltrate antigens in Mycobacterium bovis bacillus Calrnette-Guerin-infected
mice. Infection and Immunity &(2), 676-684.
Derman, A.I . , W.A. Prinz, D. Belin and I. Beckwith ( 1 993). Mutations that allow
disulfide bond formation in the cytoplasm of Escherichia coli. Science 262, 1744- 1747.
Doherty, M.L., H.F. Bassett, P.I. Quinn, W.e. Davis and A.P. Kelly ( 1 996). A
sequential study of the bovine tuberculin reaction. Immunology .81, 9- 14.
Elzer, P.H. , R.W. Phillips, M.E. Kovach, K.M. Peterson and Roop, R.M., II. ( 1994).
Characterization and genetic complementation of a Brucella abortus high-temperature
requirement A (htrA) deletion mutant. Infection and Immunity �(l O), 4 1 35-4 139.
Fearon, D. and R.M. Locksley ( 1996). The instructive role of innate immunity in the
acquired immune response. Science 272(5258), 50-54.
Feinberg, A.P. and B. Vogelstein ( 1983). A technique for radiolabeling DNA restriction
endonuclease fragments to high specific activity. Analytical Biochemistry ill, 6- 1 3.
1 89
Ferrick, D.A., M.D. Schrenzel, T. Mulvania, B . HsIeh, W.G. Ferlin and H. Lepper
( 1995). Differential production of interferon-y and interleukin-4 in response to Th1 - and
Th2-stimulating pathogens by yo T cells in vivo. Nature 373, 255-257
Fifis, T., L.A Corner, J.S. Rothel and P.R. Wood ( 1994). Cellular and humoral
immune responses of cattle to purified Mycobacterium bovis antigens. Scandinavian
Journal of Immunology 32(3), 267-274.
Fifis, T., C. Costopoulos, Al. Radford, A. Bacic and P.R. Wood ( 1 99 1 ) . Purification
and characterisation of major antigens from a Mycobacterium bovis culture filtrate.
Infection and Immunity 59, 800-807.
Fine, P.E.M. ( 1989). The BCG story: Lessons from the past and implications for the
future. Review of Infectious Diseases ll(Supplement 2), S353-S359.
Fine, P.E.M. ( 1 995) . Variation in protection by BCG: Implications of and for
heterologous immunity. The Lancet .3.46.(18 Nov.), 1 339- 1 345.
Flesh, 1. and S.H.E. Kaufmann ( 1987). Mycobacterial growth inhibition by interferon
y-activated bone marrow macrophages and differential susceptibility among strains of
Mycobacterium tuberculosis. Journal of Immunology l.3.8., 4408-44 13 .
Fong, T.A and T.R. Mosmann ( 1 990). Alloreactive murine CD8+ T cell clones secrete
the Th 1 pattern of cytokines. Journal of Immunology 144(5), 1744- 1752.
Garbe, T., D. Harris, M. Vordermeier, R. Lathigra, 1. Ivanyi and D. Young ( 1993).
Expression of the Mycobacterium tuberculosis 19-kilodalton antigen in Mycobacterium
sl1tegmatis : immunological analysis and evidence of glycosylation. Infection and
Immunity .6.l(1) , 260-267.
190

Germain, R.N. ( 1986). The ins and outs of antigen processing and presentation. Nature
322(608 1 ), 687-689.
Gilson, E., G. Alloing, T. Schmidt, 1.-P. Claverys, R. Dudler and M. Hofnung ( 1 988).
Evidence for high affinity binding-protein dependent transport systems in Gram-positive
bacteria and in MycopLasma. The EMBO JoumaL l(1 2), 397 1 -3974.
Gilson, E. , 1.P. Rousset, A. Charbit, D. Penin and M. Hofnung ( 1986). maLM, a new
gene of the maltose regulon in Escherichia coli K12. I. maLM is the last gene of the malK
LamB operon and encodes a periplasmic protein. Journal of MoLecular Biology 1 9 1 , 303-
3 1 1 .
Goodfellow, M. and L.G. Wayne ( 1982). Taxonomy and nomenclature. The BioLogy of
the Mycobacteria. C. Ratledge and 1. Stanford, Eds. Academic Press, London, 1, 47 1 -
52 1 .
Goodman, 1.W. ( 199 1) . The immune response. Basic and Clinical Immunology. D. P.
Sites and A. I. Terr, Eds. Appleton and Lange, Connecticut, 33-44.
Gormley, E.P. , E. Carpenter and A. Murray ( 1994). The use of a Mycobacterium bovis
cosmid library to identify T cell stimulating proteins relevant to the protection of cattle
against tuberculosis. WHO / FAO / OlE Consultation on Animal Tuberculosis Vaccines.
W orId Health Organization, Geneva, Switzerland.
Gormley, E.P., A. Murray and E.A. Carpenter ( 1996). Identification of Mycobacterium
bovis T cell antigens in culture filtrates of recombinant Mycobacterium smegmatis.
Immune protection against bovine tuberculosis. Annual Report, Bovine Tuberculosis
Research Laboratory, Massey University, Palmerston North, New Zealand , 1 3-25.
Grange, 1.M. ( 1989). Mycobacterial disease in the world. The Molecular Biology O/ The
Mycobacteria. C. Ratledge et ai. , Eds. Academic Press, London, .3., 3-36.
191
GuIle, H., L.M. Fray, E.P. Gormley, A. Murray and K.M. Moriarty (995). Responses
of bovine T cells to fractionated lysate and culture filtrate proteins of Mycobacterium
bovis BCG. Veterinary Immunology and Immunopathology 48., 1 83- 1 90.
GuIle, H., S.H.E. Kaufmann and K. Moriarty (993). Rapid electroelution of two
dimensionally separated protein mixtures: Its use in in vivo assays of T cell activities.
Electrophoresis 14, 902-908.
Hantke, K. and V. Braun ( 1 973). Covalent binding of lipid to protein. Diglyceride and
amide-linked fatty acid at the N-terminal end of the murein lipoprotein of the Escherichia
coli outer membrane. European Journal of Biochemistry 256, 3 125-3 1 29.
Harboe, M., S. Hagai, M.E. Patarroyo, M.L. Torres, C. Ramirez and N. Cruz (986).
Properties of proteins MPB64, MPB70, and MPB80 of Mycobacterium bovis BCG.
Infection and Immunity 52( 1 ), 293-302.
Harboe, M. and S. Nagai (984). MPB70, a unique antigen of Mycobacterium bovis
BCG. American Review of Respiratory Diseases 1 29, 444-452.
Harboe, M. , T. Oettinger, H.G. Wiker, I. Rosenkrands and P. Andersen ( 1 996).
Evidence for occurrence of the ESAT-6 protein in Mycobacterium tuberculosis and
virulent Mycobacterium bovis and for its absence in Mycobacterium bovis BCG.
Infection and Immunity MO), 16-22.
Haring, C.M., J. Traum, F.M. Hayes and B .S . Henry ( 930). Vaccination of calves
against tuberculosis with Calmette-Guerin culture, BCG. Hilgardia .4( 2), 307-394.
Harth, G. , B.-Y. Lee and M.A. Horwitz ( 997). High-level heterologous expression
and secretion in rapidly growing non-pathogenic mycobacteria of four major
192
Mycobacterium tuberculosis extracellular proteins considered to be leading vaccine
candidates and drug targets. Infection and Immunity .6,5.(6), 232 1 -2328.
Heilig, J .S . , K. Lech and R. Brent ( 1 994). Purification of plasmid DNA by CsCI /
ethidium bromide equilibrium centrifugation. Current Protocols In Molecular Biology. F.
A. Ausubel et al. , Eds. John Wiley & Sons, New York, 1 .7 .6- 1 .7 .8 .
Hekstra, D. and 1 . Tommassen ( 1993). Functional exchangeability of the ABC proteins
of the periplasmic binding protein-dependent transport systems U gp and Mal of
Escherichia coli. Journal of Bacteriology ill, 6546-6552.
Hess, J. , I. Gentschev, D. Miko, M. Welzel, C. Ladel, W. Goebel and S .H.E.
Kaufmann ( 1996). Superior efficacy of- secreted over somatic antigen display in
recombinant Salmonella vaccine induced protection against listeriosis. Proceedings of the
National Academy of Sciences USA 23.(4), 1458- 1463.
Hewinson, R.G., S .L. Michell, W.P. Russell, R.A. McAdam and W.J. Jacobs ( 1 996).
Molecular characterization of MPT83: a seroreactive antigen of Mycobacte rium
tuberculosis with homology to MPT70. Scandinavian Journal of Immunology 4}(5),
490-499.
Hoffman, C.S. and A. Wright ( 1 985). Fusions of secreted proteins to alkaline
phosphatase: an approach for studying protein secretion. Proceedings of the National
Academy of Sciences USA .82.( 1 5), 5 1 07-5 1 1 1 .
Hofnung, M. ( 1 974). Divergent operons and the genetic structure of the maltose B
region in Escherichia coli K12. Genetics 76, 169- 1 84.
Hubbard, R.D., C.M. Flory and F.M. Collins ( 1992). Immunization of mice with
mycobacterial culture filtrate proteins. Clinical and Experimental Immunology E1, 94-98.
193
Huebner, R.E. ( 1 996). BCG vaccination in the control of tuberculosis. Tuberculosis. T.
M. Shinnick, Ed. Springer-Verlag, Berlin. ill, 263-282.
Huebner, R.E. and G.W. Comstock ( 1 994). BCG vaccine. Tuberculosis: Current
Concepts and Treatment. L. N. Friedman, Ed. CRC Press, Boca Raton, Florida, 335-
348.
Hughes, M.S. , S.D. Neill and M.S. Rogers ( 1 996). Vaccination of the badger (Meles
meles) against Mycobacterium bovis. Veterinary Microbiology 21, 363-379.
Huygen, K.D., D. Abramowicz, P. Vandenbussche, F. Jacobs, J. DeBruyn, A. Kentos,
A. Drowart, J.P. VanVooren and M. Goldman ( 1 992). Spleen cell cytokine secretion in
Mycobacterium bovis BCG infected mice. Injection and Immunity m, 2880-2886.
Jackson, M. , D. Portnoi·, D. Catheline, L. Dumail, J. Rauzier, P. Legrand and B .
Gicquel ( 1 997). Mycobacterium tuberculosis Des protein: an immunodominant target for
the humoral response of tuberculosis patients. Injection and Immunity 65(7), 2883-2889.
Janicki, B .W . , S.D. Chaparas, T.M. Daniel, G.P. Kubica, G.L. Wright, Jr. and G.S.
Yee ( 1 97 1) . A reference system for antigens of Mycobacterium tuberculosis. American
Review oj Respiratory Disease .liM, 602-604.
Johnson, K. , I. Charles, G. Dougan, D. Pickard, P. Q'Gaora, G. Costa, T. Ali, I.
Miller and C. Hormaeche ( 199 1 ) . The role of a stress-response protein in Salmonella
typhimurium virulence. Molecular Microbiology .5.(2), 401 -407 .
Kremer, L. , A. Baulard, J. Estaquier, J . Content, A. Capron and C. Locht ( 1995).
Analysis of the Mycobacterium tuberculosis 8SA antigen promoter region. Journal oj
Bacteriology 177(3), 642-653.
194
Laemmli, U .K. ( 1 970). Cleavage of structural proteins during the assembly of the head
of bacteriophage T4. Nature 298, 476-478.
Lagranderie, M.R.R., A-M. Balazuc, E. Deriaud, CD. Leclerc and M. Gheorghiu
( 1 996) . Comparison of immune responses of mice immunised with five different
Mycobacterium bovis BCG vaccine strains. Infection and Immunity 64(1 ) , 1 -9.
Laqueyrerie, A, P. Militzer, F. Romain, K. Eiglmeier, S . Cole and G. Marchal ( 1 995).
Cloning, sequencing, and expression of the apa gene coding for the Mycobacterium
tuberculosis 45/47-kilodalton secreted antigen complex. Infection and Immunity Q3.( 1O),
4003-40 10 .
Lefevre, P . , M. Braibant, L . de Wit, M. Kalai, D. Roeper, J. Grotzinger, J.P. Delville,
P. Peirs, 1. Ooms, K. Huygen and J. Content ( 1 997). Three different putative phosphate
transport receptors are encoded by the Mycobacterium tuberculosis genome and are
present at the surface of Mycobacterium bovis BCG. Journal of Bacteriology 1 79 (9),
2900-2906.
Li, H . , J.C Ulstrup, T.<\> . Jonassen, K. Melby, S. Nagai and M. Harboe ( 1 993) .
Evidence for absence of the MPB64 gene in some substrains of Mycobacterium bovis
BCG. Infection and Immunity .6.l(5), 1730- 1 734.
Lim, E.M. , J. Rauzier, J. Timm, G. Ton·ea, A Murray, B . Gicquel and D. Portnoi'
( 1 995). Identification of Mycobacterium tuberculosis DNA sequences encoding exported
proteins by using phoA gene fusions. Journal of Bacteriology 1 77 ( 1 ), 59-65.
Lipinska, B . , O. Fayet, L. B aird and C Georgopoulos ( 1 989) . Identification,
characterization, and mapping of the Escherichia coli htrA gene, whose product is
essential for bacterial growth only at elevated temperatures. Journal of Bacteriology
1 7 1 (3), 1 574- 1 584.
195
Lipinska, B . , S . Sharma and C. Georgopoulos ( 1 988). Sequence analysis and regulation
of the htrA gene of Escherichia coli: a cr32-independent mechanism of heat-inducible
transcription. Nucleic Acids Research .l.6.(2 1) , 1 0053- 1 0067.
Livingstone, P.G. ( 1 992). Tuberculosis in New Zealand - CUlTent status and control
policies. Surveillance 19( 1 ), 14- 1 8.
M ahairas, G .G. , P.J. Sabo, M.J. Hickey, D.C. Singh and C.K. Stover ( 1 996).
Molecular analysis of the genetic differences between Mycobacterium bovis BCG and
virulent M. bovis. Journal of Bacteriology 1 78(5), 1274- 1 282.
Manoil, C. and J. Beckwith ( 1 985). TnphoA : a transposon probe for protein export
signals. Proceedings of the National Academy of Sciences USA .82(23), 8 1 29-8 1 33.
Matsuo, K. , R. Yamaguchi, A Yamazaki, H. Tasaka and T. Yamada ( 1 988) . Cloning
and expression of the Mycobacterium bovis BeG gene for extracellular a antigen.
Journal of Bacteriology 1 70(9), 3847-3854.
Minnikin, D.E. , J.H. Parlett, M. Magnussen, Ridell, M. and A Lind ( 1984). Mycolic
acid patterns of representatives of Mycobacterium bovis BCG. Journal of General
Microbiology l3Q, 2733-2736.
Monaghan, M.L., M.L. Doherty, J.D. Collins, I.F. Kazda and PJ. Quinn ( 1 994). The
tuberculin test. Veterinary Microbiology 4fl( 1 -2), 1 1 1- 1 24.
M osmann, T.R., H. Cherwins, M.W. Bond, M.A. Giedlin and R.L. Coffman ( 1 986).
Two types of murine T-cell clone. 1. Definition according to profiles of lymphokine
activities and secreted proteins. Journal of Immunology .uQ(7), 2348-2357 .
Mustafa, A S. , F. Of tung, A Deggeral, H.K. Gill, R.A Young and T. Godal ( 1 98 8).
Gene isolation with human T lymphocyte probes. Isolation of a gene that expresses an
196
epitope recognized by T cell specific for Mycobacterium bovis BCG and pathogenic
m ycobacteria. Journal of Immunology 14 1 (8), 2729-2733.
Neill, S . , J . Hanna, A. Clements, 1. Cassidy, J. Pollock and D.G. B ryson ( 1 995).
D iagnosing tuberculosis in animals. Tuberculosis in wildlife and domestic animals.
Second International Conference on Mycobacterium bovis. F. Griffin and G. de Lisle,
Eds. University of Otago Press, Dunedin, 300-303.
Neill, S .D . , J.M. Pollock, D.B. Bryson and J. Hanna ( 1 994) . Pathogenesis of
Mycobacterium bovis infection in cattle. Veterinary Microbiology 1:Q, 41 -52.
Orme, I .M. ( l 988a). Induction of nonspecific acquired resistance and delayed-type
hypersensitivity, but not specific acquired resistance, in mice inoculated with killed
mycobacterial vaccines. Infection and Immunity 26.(1 2) , 33 10-33 1 2.
Orme, LM. ( l 988b). Characteristics and specificity of acquired immunologic memory to
Mycobacterium tuberculosis. Journal of Immunology 1.4Q, 3589-3593.
Orme, LM. , E.S. Miller, A.D. Roberts, S.K. Furney, J.P. Griffin, K.M. Dobos, D.
Chi, B . Rivoire and P.J. Brennan ( 1 992). T lymphocytes mediating protection and
cellular cytolysis during the course of Mycobacterium tuberculosis infection. Journal of
Immunology lAB.( I ), 1 89- 196.
Pal , P.G. and M.A. Horwitz ( 1 992) . Immunization with extracellular proteins of
Mycobacterium tuberculosis induces cell-mediated immune responses and substantial
protective immunity in a guinea pig model of pulmonary tuberculosis. Infection and
Immunity 6.Q( 1 1 ) , 478 1 -4792.
Pfeffer, K. , B . Schoel, H. GuIle, S.H.E. Kaufmann and H. Wagner ( 1 990) . Primary
responses of human T cells to mycobacteria: a frequent set of gamma-delta T cells are
197
stimulated by protease-resistant ligands. European Journal of Immunology 2Q., 1 175-
1 1 79.
Philipp, W.J., S. Nair, G. Guglielmi, M. Lagranderie, B. Gicquel and S .T. Cole
( 1 996). Physical mapping of Mycobacterium bovis BCG Pasteur reveals differences
from the genome map of Mycobacterium tuberculosis H37Rv and from M. bovis.
Microbiology 142( 1 1 ), 3 1 35-3 145.
Piessens, W.F. ( 1989). Introduction to the immunology of tuberculosis. Reviews of
Infectious Diseases ll(Suppl. 2), S436-S442.
Pollock, J.M. and P. Andersen ( 1997a). The potential of the ESAT-6 antigen secreted by
virulent mycobacteria for specific diagnosis of tuberculosis. The Journal of Infectious
Diseases ill, 125 1 - 1 254.
Pollock, 1.M. and P. Andersen ( 1997b). Predominant recognition of the ESAT-6 protein
in the first phase of infection with Mycobacterium bovis in cattle. Infection and Immunity
.6.5.(7), 2587-2592.
Pollock, J .M., D.A. Pollock, D.G. Campbell, R.M. Girvin and A.D. Crockard ( 1996).
Dynamic changes in circulating and antigen-responsive T-cell subpopulations post
Mycobacterium bovis infection in cattle. Immunology Bl, 236-241 .
Powell, L.D. ( 1 994). Inhibition of N-linked glycosylation. Current Protocols in
Immunology. 1. E. Coligan et al., Eds. John Wiley & Sons, New York, 8 . 14. 1 -8 . 1 4.9.
Pugsley, A.P. ( 1 993). The complete general secretory pathway in gram-negative
bacteria. Microbiological Reviews 57( 1 ) , 50- 108.
198
Puyet, A. and M. Espinosa ( 1993). Structure of the maltodextrin-uptake locus of
Streptococcus pneumoniae. Correlation to the Escherichia coli maltose regulon. Journal
of Molecular Biology 2.3.Q, 800-8 1 1 .
Radford, A.J. , B .J. Duffield and P. Plackett ( 1988) . Cloning of a species-specific
antigen of Mycobacterium bovis. Infection and Immunity 56(4), 92 1 -925.
Ragg, J. and R. Walker ( 1 995). The association of tuberculous (Mycobacterium bovis)
ferrets (Mus tela furo) with Tb infected cattle and deer herds in Canterbury and Otago.
Tuberculosis in Wildlife and Domestic Animals. Second International Conference on
Mycobacterium bovis. , F. Griffin and G. de Lisle, Eds. University of Otago Press,
Dunedin, 297.
Ratledge, C. and J.L. Stanford ( 1 982). Introduction. The Biology of the Mycobacteria.
C. Ratledge and J. L. Stanford, Eds. Academic Press, London, 1, 1 -6.
Reggiardo, Z. and G. Middlebrook ( 1 974) . Failure of passive serum transfer of
immunity against aerogenic tuberculosis in rabbits. Proceedings of the Society for
Experimental Biology and Medicine 145, 173- 1 75.
Rich, E.A. and lJ. Ellner ( 1994). Pathogenesis of tuberculosis. Tuberculosis: Current
Concepts and Treannent. L. N. Friedman, Ed. CRC Press, Boca Raton, Florida, 27-5 1 .
Roberts, G.D. , E.W. Koneman and Y.K. Kim ( 1 99 1 ) . Mycobacterium. Manual of
Clinical Microbiology. A. Barlow et al. , Eds. American Society for Microbiology Press,
Washington D.C., 304-339.
Roche, P.W. , lA. Triccas, D.A. Avery, T. Fifis, H. Billman-Jacobe and W.J. Britton
( 1 994). Differential T-cell responses to mycobacteria-secreted proteins distinguish
between Bacillus Calmette-Guerin vaccination and infection with Mycobacterium
tuberculosis. Journal of Infectious Diseases J1Q, 1326- 1 330.
199
Roche, P.W., N. Winter, lA. Triccas, e.G. Feng and W.J. Britton ( 1996). Expression
of Mycobacterium tuberculosis MPT64 in recombinant Myco. smegmatis: purification,
immunogenicity and application to skin tests for tuberculosis. Clinical and Experimental
Immunology lQ.3., 226-232.
Rocken, M., J.-H. Saurat and e. Hauser ( 1992). A common precursor for CD4+ T cells
producing IL-2 or IL-4. Journal of Immunology ill, 103 1 - 1036.
RogaU, T. , J. Wolters, T. Flohr and E.e. Bottger ( 1990). Towards a phylogeny and
definition of species at the molecular level within the genus Mycobacterium. International
Journal of Systematic Bacteriology .4Q(4), 323-330.
Rothel, J.S. , S.L. Jones, L.A. Corner, le. Cox and P.R. Wood ( 1990). A sandwich
enzyme immunoassay for bovine interferon-y and its use for the detection of tuberculosis
in cattle. Australian Veterinary Journal .61(4), 1 34- 137 .
Rothel, J.S . , S.L. Jones, L.A. Corner, J.e. Cox and P.R. Wood ( 1 992). The gamma
interferon assay for diagnosis of bovine tuberculosis in cattle: conditions affecting the
production of gamma-interferon in whole blood culture. Australian Veterinary Journal m,
1 -4.
Rueger, B . , J. Thalhammer, I. Obermaier and S . Gruenewald-Janho ( 1 996).
Experimental procedure for the detection of a rare human mRNA with the DIG system.
Biochemica }, 35-38.
Sambrook, J., E.F. Fritsch and T. Maniatis, Eds. ( 1 989). Molecular cloning: a
laboratory manual. Cold Spling Harbor, Cold Spring Harbor Laboratory.
200
Shuman, H.A. ( 1 987). The genetics of active transport in bacteria. Annual Review of
Genetics 21, 1 55- 177.
Shuman, H.A. and T.J. Silhavy ( 19 8 1 ). Identification of the malK gene product: a
peripheral membrane component of the Escherichia coli maltose transport system. Journal
of Biological Chemistry 256, 560-562.
Smith , P.K. , R.I. Krohn, G.T. Hermanson, A.K. Mallia, F.H. G artner, M.D.
Provenzano, E.K. Fujimoto, N.M. Goeke, B .J. Olson and D .C. Klenk ( 1 985).
Measurement of protein using bicinchoninic acid. Analytical Biochemistry 1 50( 1) , 76-85.
Snapper, S .B . , R.E. Melton, S. Mustafa, T. Kieser and W.R. Jacobs, Jr. ( 1 990).
Isolation and characterization of efficient plasmid transformation m utants of
Mycobacterium smegmatis. Molecular Microbiology 1( 1 1) , 19 1 1 - 1 9 19.
S q, rensen, A.L., S. Nagai, G . Houen, P. Andersen and A.B . Andersen ( 1 995).
Purification and characterization of a low-molecular-mass T-cell antigen secreted by
Mycobacterium tuberculosis. Infection and Immunity Q3.(5), 1 7 10- 1 7 17 .
Stone, A.A., J.E. Schwartz, H. Valdimarsdottir, A. Napoli, J .M. Neale and D.S. Cox
( 199 1 ) . An alternative statistical treatment for summarizing the central tendency of
replicate assay data. Journal of Immunological Methods l3.6., 1 1 1 - 1 1 7.
Strauch, K.L. and J. Beckwith ( 1988). An Escherichia coli mutation preventing
degradation of abnormal peri plasmic proteins. Proceedings of the National Academy of
Sciences USA 85, 1 576- 1 580.
Strauch, K.L., K. Johnson and J. Beckwith ( 1989). Characterisation of degP, a gene
required for proteolysis in the cell envelope and essential for growth of Escherichia coli at
high temperature. Journal of Bacteriology 1 7 1 , 2689-2696.
20 1
Sutcliffe, I.e. and R.R.B. Russell ( 1 995). Lipoproteins of Gram-positive bacteria.
Journal of Bacteriology 177(5), 1 123- 1 128.
Tasaka, H . , E. Shigeto, K. Maysuo, R. Yamaguchi, S. Haga, A. Yamazali, T.
Yamazaki, S. Nagai and R.M. Nakamura ( 1 995). Secretion of MPB64 antigen by a
recombinant clone of Mycobacterium smegmatis: characterisation and application for the
diagnosis of tuberculosis. Scandinavian Joumal of Immunology 42, 487-492.
Terasaka, K. , R. Yamaguchi, K. Matsuo, A. Yamazaki, S. Nagai and T. Yamada
( 1 989). Complete nucleotide sequence of immunogenic protein MPB70 from
Mycobacterium bovis BCG. FEMS Microbiology Letters 58, 273-276.
Tlinchieri, G. ( 1 990). Biology of natural killer cells. Advances in Immunology 47, 1 87-
376.
Tweddle, N.E. and P. Livingstone ( 1994). Bovine tuberculosis control and eradication
programs in Australia and New Zealand. Veterinary Microbiology 40, 23-39.
von Heijne, G. ( 1 989). The structure of signal peptides from bacterial lipoproteins.
Protein Engineering 2{7), 53 1 -534.
von Heijne, G. ( 1992). Membrane protein structure prediction. Hydrophobicity analysis
and the positive-inside rule. Journal of Molecular Biology 225, 487-494.
Waddington, F.'G. and D.e. Ellwood ( 1972). An experiment to challenge the resistance
to tuberculosis in B .e.G. vaccinated cattle in Malawi. British Veterinary Journal m(1 1 ),
54 1 -552.
Waller, P.R.H. and R.T Sauer ( 1 996). Characterization of degQ and degS, Escherichia
coli genes encoding homologs of the DegP protease. Journal of Bacteriology 1 78 (4),
1 1 46- 1 1 53.
202
Wayne, L.G. and G.P. Kubica ( 1 986). The Mycobacteria. Bergey 's Manual of
Systematic Bacteriology. P. H. A. Sneath, Ed. Williams and Wilkins, B altimore, 2.,
1435 - 1 457.
Wilson, TM. and D.M. Collins ( 1996). ahpC, a gene involved in isoniazid resistance of
the Mycobacterium tuberculosis complex. Molecular Microbiology 19(5), 1 025- 1034.
Wilson, T.M., G .W. de Lisle and D.M. Collins ( 1 995). Effect of inhA and katG on
isoniazid resistance and virulence of Mycobacterium bovis. Molecular Microbiology 12,
1009- 1 0 1 5 .
Winter, N. ( 1996). Personal Communication. Institut Pasteur, Paris.
Wood, P. ( 1 994). Editorial. Veterinary Microbiology �(1 -2), VII.
Wood, P.R., L.A. Corner, J .S. Rothel, C. Baldock, S .L. Jones, D.B. Cousins, B .S .
McCOlmick, B .R. Francis, J . Creeper and N.E. Tweddle ( 199 1 ) . Field comparisons of
the interferon-gamma assay and the intradermal tuberculin test for the diagnosis of bovine
tuberculosis. Australian Veterinary Journal Q.a, 286-290.
Wood, P.R., L.A. Corner, J. S . Rothel, J.L. Ripper, T Fifis, B .S . McCormic, B .
Francis, L . Melville, K . Small, K. De Witte, J. Tolson, TJ. Ryan, G.W. de Lisle, J.e.
Cox and S.L. Jones ( 1992). A field evaluation of serological and cellular diagnostic tests
for bovine tuberculosis. Veterinary Microbiology 11.. 7 1 -79.
Worley, K.e., B.A. Wiese and R.F. Smith ( 1 995). BEAUTY: an enhanced BLAST
based search tool that integrates multiple biological information resources into sequence
similarity search results. Genome Research 2, 173- 1 84.
203
Wright, D . ( 1995) . A national strategy for research into tuberculosis control.
Tuberculosis in Wildlife and Domestic Animals. Second International Conference on
Mycobacterium bovis. F. Griffin and G. de Lisle, Eds. University of Otago Press,
Dunedin, 367-370.
WU, Q. -L . , D. Kong, K. Lam and R.N. Husson ( 1 997). A mycobacterial
extracytoplasmic function sigma factor involved in survival following stress. Journal of
Bacteriology 112(9), 2922-2929.
Wyatt, C .R. , C. Madruga, e. Cluff, S. Parish, M.J. Hamilton, W. Goff and W.e.
Davis ( 1 994). Differential distribution of y8 T-cell receptor lymphocyte subpopulations
in blood and spleen of young and adult cattle. Veterinary Immunology and
Immunopathology 1Q, 1 87-99.
Yamaguchi, R., K. Matsuo, A. Yamazaki, C. Abe, S. Nagai, K. Terasaka and T.
Yamada ( 1989a). Cloning and characterization of the gene for immunogenic protein
MPB64 of Mycobacterium bovis BCG. Infection and Immunity 57( 1 ) , 283-288.
Yamaguchi, R. , K. Matsuo, A. Yamazaki, S . Nagai, K. Terasaka and T. Yamada
( 1989b). Immunogenic protein MPB57 from Mycobacterium bovis BCG: molecular
cloning, nucleotide sequence and expression. FEBS Letters 240( 1 ,2), 1 15- 1 17.
Young, D. , T. Garbe, R. Lathigra and e. Abou-Zeid ( 1990). Protein antigens: structure,
function and regulation. Molecular Biology of the Mycobacteria. J. McFadden, Ed.
Surrey University Press, London, 1 -35.
Young, D .B . and S .T. Cole ( 1 993). Leprosy, tuberculosis, and the new genetics.
Journal of Bacteriology 175( 1 ), 1 -6.
Young, D .B . and T.R. Garbe ( 199 1 ). Lipoprotein antigens of Mycobacterium
tuberculosis. Research in Microbiology 142( 1 ), 55-65.
204
Young, D .B . , S .H.E . Kaufmann, P.W.M. Hermans and J .E.R. Thole ( 1 992).
Mycobacterial protein antigens: a compilation. Molecular Microbiology Q(2), 1 33-145.
Young, D.B . , L. Kent and R.A. Young ( 1 987) . Screening of a recombinant
mycobacterial DNA library with polyclonal antiserum and molecular weight analysis of
expressed antigens. Infection and Immunity �(6), 142 1 - 1425.
Young, R.A., B.R. Bloom, C.M. Grosskinsky, J. Ivanyi, D. Thomas and R.W. Davis
( 1 985). Dissection of Mycobacterium tuberculosis antigens using recombinant DNA.
Proceedings of the National Academy of Sciences USA .82(9), 2583-2587.
Zhang, Y., R. Lathigra, T. Garbe, D. Catty- and D. Young ( 1 99 1 ) . Genetic analysis of
superoxide dismutase, the 23 kilodalton antigen of Mycobacterium tuberculosis.
Molecular Microbiology 5{2), 38 1 -39 1 .
205