Embed Size (px)
Citation preview

Page | i
Copyright is owned by the Author of the thesis. Permission is given for a copy to be
downloaded by an individual for the purpose of research and private study only. The
thesis, or part of it, may not be reproduced elsewhere without the permission of the
Author.
Page | ii
DEVELOPMENT OF EXPANDED SNACK FOODS CONTAINING PUMPKIN FLOUR AND
CORN GRITS USING EXTRUSION TECHNOLOGY
A thesis presented in partial fulfilment of the requirements for the degree of
Doctor of Philosophy
at Massey University, Palmerston North, New Zealand
NORFEZAH MD NOR 2013

Page | iii
Abstract
The production of expanded snack foods using vegetable powder as an ingredient in
ready-to-eat food is rare. In view of its natural desirable colour, flavour, sweetness and
health benefits, pumpkin was chosen as an additive to the traditional corn grits or rice
used as the basis of an extrusion expanded snack or breakfast food concept.
Pumpkins also have a large range of uses as a potentially valuable food for humans
and animals. However, they are an underutilised product. This study was undertaken to
demonstrate the potential of pumpkin products as additives in expanded snack food
products. Processing the fresh pumpkin into flour dramatically extends the shelf life and
makes the ingredient available throughout the year. The flour is more convenient for
extrusion as it is stored and handled as a dry powder. Research was conducted to
produce and characterise pumpkin flour made by convection oven and freeze drying of
a pumpkin fractions such as peel, pulp (rind), flesh and seed. The flour was combined
with corn grits in various proportions up to a maximum of 20% w/w. After determining
suitable processing conditions and the maximum acceptable concentration of pumpkin
flour for an edible product, the effect of process parameters on product quality were
determined. Finally the product was optimised using response surface methodology
(RSM). The proximate compositions of pumpkin flour from convection oven and freeze
drying were as expected identical to commercial pumpkin flour. The carbohydrate
content ranged between 69.8 and 89%, protein ranged between 1.3 and 21%, and fat
between 0.03 - 0.53%. Pumpkin flour produced by freeze drying revealed L, a and b
values higher than in commercial pumpkin flour, indicating that the flour was lighter in
colour and appeared more orange than that oven dried. The effect of varying pumpkin
flour proportion at two mass flow rates of 7.5kg/hr and 8.5kg/hr revealed that mass flow
rate did not have any significant correlation to the extrusion parameters and the final
quality of the expanded snack product. However, a high quality final product can be
achieved at all mass flow rates with less than 20% pumpkin flour incorporated into the
blend. Varying the proportion of pumpkin flour between 5% and 20% in combination
with corn grits using screw speeds of 250rpm and 350rpm showed that, increasing the
proportion of pumpkin flour to 20% significantly (P<0.05) decreased specific
mechanical energy (SME) and torque. The extruded pellets using a 20% blend of
pumpkin with corn grits were harder, more denser and less expanded than those made
with higher proportions of corn grits. The crispiness and hardness of the final product
was not closely related to the number or area of bubbles present in the structure.
Screw speed did not significantly (P>0.05) affect the specific mechanical energy (SME)
Page | iv
or the physical characteristics of the final product. Hardness seemed to be due to
bubble wall stiffness i.e. effectively the thickness and rigidity of the set starchy matrix.
Response surface methodology (RSM) was predicted four solutions for optimum
conditions which can be achieved at barrel temperature ranging from 165°C to 167°C
at a constant feed rate of 10.50kg/hr and pumpkin flour percentage ranged from 16% to
17%. With these conditions, the optimum SME of 0.15 was achieved and this product
had a maximum radial expansion of 11.00%, hardness less than 142.0N with a total
carotenoid content of 2.07ppm to 2.13ppm. Sensory analysis revealed most consumers
preferred expanded snack products containing 5% pumpkin flour and produced by
extruding at a barrel temperature of 170°C and mass flow rate of 12.0kg/hr. The
panellists indicated that they would buy this product due to its acceptable taste, texture,
odour and overall product characteristics. However, the expanded snack with 15%
pumpkin flour was found to have highest total carotenoid content (5.78ppm) and
protein content (28.8%) after processing and may have been, in nutritional terms, the
best product. The slowly digestible starch (SDS) value and carbohydrate content of this
product was found at 97.03mg/g and 59.29% respectively. From this work useful
information regarding pumpkin flour and its application in extruded expanded snack
production was obtained. This work has the potential to diversify the application of
pumpkin flour and offer new uses for pumpkin in the food industry.

Page | v
Acknowledgements
First and foremost, thanks to GOD who made all things possible.
I would like to express my sincere gratitude to my chief supervisor, Dr Alistair Carr for
his supervision, encouragement, support and precious time. I am indebted to Mr. Allan
Hardacre for his direction, assistance, guidance, expertise and moreover the joy and
enthusiasm he has for this research, which was precious and motivational for me, even
during tough time throughout the study. Not to forget, Professor Charles Brennan for
his long distance guidance, support, valuable input and involvement from the beginning
of the study particularly.
This study could not have been achieved without financial support from The Ministry of
Higher Education Malaysia, Universiti Teknologi MARA Malaysia (UiTM), Universiti
Teknologi MARA,Penang Malaysia and a Postgraduate Grant from the Institute of
Food, Nutrition and Human Health ( IFNHH), Massey University, New Zealand.
Thank you to the Graduate Research School (GRS), Massey University and my thanks
also go to all staff at the International Student Office, Massey University.
I would like to acknowledge Plant & Food Research, Palmerston North, Andrew
McNaughthon (University of Otago) for technical advice and support and Cedenco
Food Ltd for supplying the pumpkin flour.
I am also thankful to all IFNHH Staff; Mr. Garry Radford, Mr. Steve Glasgow, Ms.
Mitchell Tamehaena, Mr.Matt Levin and Mr Steve Chambers.
Appreciation also goes to Associate Professor Dr Mohamad Abdullah Hemdi,
Associate Professor Abd Azis Abd Majid, Dr Zaibunissa Abdul Haiyee, Associate
Professor Dr Zainal Samicho, Mrs. Saidatul Afzan Abd Aziz, Mrs. Noriza Ishak,
Ms.Anida Ismail, Ms. Nurul Huda Hashim and All Colleagues at Faculty of Hotel and
Tourism Management, UiTM Shah Alam and UiTM, Penang for their continuous
support and contributions towards completion of this thesis.
A special thanks to Haslinda Hassan for her encouragement, and a shoulder to cry on
through thick and thin along this journey. I am extremely grateful to Zeinab Deghan
Shoar, Lakshmi ,Khaizura, Azira, Haza, Asmad, Farihan, Sara, Yen and all friends in
postgraduate room 1.33 for their encouragement and help.

Page | vi
I am deeply grateful and indebted to my ever loving husband, Mr Jaafar Omar and my
angel daughter Nurul Izzati for their unconditional love, continuing encouragement and
wisdom and their inspiration in every aspect of my life.
Blessing to my family, my Dad Md Nor, mom Hamisah, Rizal, Azli, Ain, Aini and Farah
for their constant encouragement, motivations and endless guidance and love. Last but
not least, thanks to my mother in law Hamedah and all family in law.
Finally I offer my regards and blessing to all those who supported me in any respect
during the completion of this study.
NNorfezah Md Nor Autumn 2013

Page | vii
In Memory
Aminah Hashim (mom)
Nurul Izzah Jaafar (daughter)
Som Mat (grandma)
Omar Osman (father in law)

Page | viii
Table of Contents
Abstract……… .............................................................................................................. iii
Acknowledgements ....................................................................................................... v
Table of Contents ....................................................................................................... viii
List of Tables.. ............................................................................................................ xvi
List of Figures ............................................................................................................. xix
List of Peer-Reviewed Publications, Conference Proceedings and Presentation ...... xxiv
Chapter 1: Introduction .............................................................................................. 1
1.1 Background of the Study .......................................................................... 1
1.2 Purpose of The Study ............................................................................... 2
1.3 Significance and Rationale of Study ......................................................... 3
1.4 Research Aims and Objectives................................................................. 3
1.5 Overview Outline ...................................................................................... 4
1.6 Thesis Outline .......................................................................................... 6
Chapter 2: Literature Review ..................................................................................... 7
2.1 Introduction .............................................................................................. 7
2.2 Snack Foods ............................................................................................ 8
2.3 The Snack Food Market ......................................................................... 10
2.3.1 Sweet and Savoury Snacks Market in Malaysia ..................................... 12

Page | ix
2.3.2 Sweet and Savoury Snacks Market in New Zealand .............................. 12
2.3.3 Sweet and Savoury Snacks Market in Australia ..................................... 12
2.3.4 Sweet and Savoury Snacks Market in the United Kingdom .................... 12
2.3.5 Sweet and Savoury Snacks Market in the United States ........................ 13
2.4 Extruded Food Products ......................................................................... 13
2.5 Extrusion ................................................................................................ 14
2.5.1 Introduction ............................................................................................ 14
2.5.2 Definitions of Extrusion ........................................................................... 14
2.5.3 Background and Development of Extruder ............................................. 14
2.5.4 Types of Extruder ................................................................................... 15
2.5.4.1 Single-Screw Extruder ..................................................................... 16
2.5.4.2 Twin- Screw Extruder ...................................................................... 17
2.5.5 Comparison of Single Screw and Twin Screw Extruders ........................ 19
2.5.6 Principles of Extrusion Cooking .............................................................. 19
2.5.6.1 Variables and Parameters Involved In Extrusion Processing ........... 20
2.5.6.2 Factors Influencing the Extrusion Process ....................................... 21
2.5.6.2.1 Mass Flow Rate ........................................................................... 21
2.5.6.2.2 Screw Speed ............................................................................... 22
2.5.6.3 Bubble Formation During Extrusion ................................................. 22
2.6 Raw Materials For Extrusion .................................................................. 23
2.6.1 Pumpkin ................................................................................................. 23
Page | x
2.6.1.1 Introduction ..................................................................................... 23
2.6.1.2 Pumpkin Structure ........................................................................... 26
2.6.1.3 Plant Species .................................................................................. 26
2.6.1.4 Nutritional Value of Pumpkin ........................................................... 27
2.6.1.5 Food Products Containing Pumpkin Fractions ................................. 29
2.6.1.6 Commercial Pumpkin Products in New Zealand and Australia ........ 30
2.6.2 Corn ....................................................................................................... 31
2.6.2.1 Introduction ..................................................................................... 31
2.6.2.2 Corn Kernel Structure and Types .................................................... 31
2.6.2.3 Corn for Food Industry Processing .................................................. 32
2.6.2.4 Dry Milled Corn Fractions ................................................................ 33
2.6.2.5 Dry Milled Corn Fractions for Extruded Snack Processing ............... 33
2.6.2.6 Nutritional Value of Dry Milled Corn Fractions ................................. 33
2.6.3 Nutrient Components: Chemical and Nutritional Changes in Food During
Extrusion ................................................................................................ 34
2.6.3.1 Carbohydrate ................................................................................... 34
2.6.3.1.1 Starch .......................................................................................... 34
2.6.3.1.2 Starch Structure Changes during Extrusion ................................. 36
2.6.3.1.3 Fibre ............................................................................................ 36
2.6.3.2 Protein ............................................................................................. 37
2.6.3.3 Lipids ............................................................................................... 37

Page | xi
Chapter 3: Characterisation and Production of Pumpkin Flour ................................. 38
3.1 Introduction ............................................................................................ 38
3.2 Materials and Methods ........................................................................... 38
3.2.1 Raw Materials ........................................................................................ 38
3.2.2 Sample Preparation ................................................................................ 38
3.2.2.1 Pumpkin Flour Production Using Convection Oven ......................... 38
3.2.2.2 Pumpkin Flour Production Using Freeze Drying .............................. 39
3.2.3 Proximate Analysis ................................................................................. 39
3.2.4 Colour Measurement .............................................................................. 39
3.2.5 Statistical Analysis.................................................................................. 40
3.3 Results and Discussion .......................................................................... 40
3.3.1 Characterisation of Pumpkin and Pumpkin Flour Production .................. 40
3.3.2 Raw Pumpkin ......................................................................................... 41
3.3.3 Pumpkin Flour Production ...................................................................... 42
3.3.4 Proximate Composition of Raw Pumpkin and Pumpkin Flour ................. 44
3.3.5 Commercial Pumpkin Flour .................................................................... 46
3.3.6 Colour Value of Raw Pumpkin and Pumpkin Flour ................................. 46
3.4 Conclusion ............................................................................................. 48
Chapter 4: Preliminary Extrusion Processing of Pumpkin-Corn Grits Expanded
Snacks ................................................................................................... 49
4.1 Introduction ............................................................................................ 49

Page | xii
4.2 Materials and Methods ........................................................................... 49
4.2.1 Extrusion Process .................................................................................. 49
4.2.2 Basic Recipes for Expanded Snack Product .......................................... 49
4.2.3 Extrusion Conditions .............................................................................. 50
4.2.4 Product Characteristics .......................................................................... 51
4.2.4.1 Colour Measurement ....................................................................... 51
4.2.4.2 Expansion Ratio .............................................................................. 51
4.2.4.3 Product Density ............................................................................... 52
4.2.4.4 Product Texture ............................................................................... 52
4.3 Results and Discussion .......................................................................... 53
4.3.1 Extrusion Parameters for the Expanded Snack Product ......................... 54
4.3.2 Product Characteristics .......................................................................... 56
4.3.2.1 Colour Value of Expanded Snack Products of Pumpkin Flour mixed
with Corn Grits ................................................................................. 56
4.3.2.2 Expansion Ratio of Expanded Snack Products of Pumpkin Flour with
Corn Grits ........................................................................................ 57
4.3.2.3 Bulk Density of Expanded Snack Products made of Pumpkin Flour
and Corn Grits ................................................................................. 59
4.3.2.4 Texture of Expanded Snack Products made of Pumpkin Flour with
Corn Grits ........................................................................................ 61
4.3.3 Expanded Snacks made of Pumpkin Flour mixed with Corn Grits .......... 63
4.3.4 Conclusion ............................................................................................. 66
Page | xiii
Chapter 5: The effect of varying the proportion of pumpkin flour at two mass flow
rates and at two screw speeds on processing parameters and the physical
characteristics of the extruded product. .................................................. 67
5.1 Introduction ............................................................................................ 67
5.2 Materials and Methods ........................................................................... 68
5.2.1 Raw Materials ........................................................................................ 68
5.2.2 Pasting Properties (RVA) ....................................................................... 68
5.2.3 Extrusion Processing .............................................................................. 69
5.2.3.1 Extrusion at constant screw speed with two mass flow rate ............. 69
5.2.3.2 Extrusion at Two Screw Speeds with Constant Mass Flow Rate ..... 70
5.2.4 Physical Characteristics ......................................................................... 71
5.2.5 Texture Analysis of Product Mapping ..................................................... 71
5.2.6 Statistical Analysis.................................................................................. 72
5.3 Results and Discussion .......................................................................... 72
5.3.1 Pasting Properties of Raw Ingredients (pumpkin flour-Cedenco) ............ 72
5.3.2 Extrusion at Constant Screw Speed with Two Mass Flow Rate .............. 75
5.3.3 Extrusion at Two Screw Speeds with Constant Mass Flow Rate ............ 78
5.3.3.1 Extrusion Parameters ...................................................................... 78
5.3.3.2 Physical Characteristics of Extruded Products ................................. 81
5.3.3.3 Expansion Ratio and Hardness of Expanded Snack Product ........... 82
5.3.3.4 Density of Expanded Snack Product ............................................... 83
5.3.3.5 Pearson Correlation Interrelationship .............................................. 85
Page | xiv
5.3.4 Texture Analysis of Product Mapping ..................................................... 86
5.4 Conclusion ............................................................................................. 87
Chapter 6: Product Optimisation .............................................................................. 89
6.1 Introduction ............................................................................................ 89
6.2 Materials and Methods ........................................................................... 90
6.2.1 Extrusion Conditions .............................................................................. 90
6.2.2 Experimental Design .............................................................................. 90
6.2.3 Extrusion Parameters Analysis ............................................................... 92
6.2.4 Product Analysis .................................................................................... 92
6.2.5 Total Carotenoid Analysis....................................................................... 93
6.2.5.1 Total Carotenoid Standard Curve .................................................... 93
6.3 Results and Discussion .......................................................................... 93
6.3.1 Extrusion Parameters ............................................................................. 93
6.3.2 Product Characteristics .......................................................................... 98
6.4 Summary of Results and Optimisation.................................................. 109
6.5 Conclusion ........................................................................................... 113
Chapter 7: Final Product Quality ............................................................................ 114
7.1 Background .......................................................................................... 114
7.2 Materials and Methods ......................................................................... 117
7.2.1 Extrusion Conditions ............................................................................ 117
7.2.2 Total Carotenoid Analysis..................................................................... 118
Page | xv
7.2.3 Starch Digestibility ................................................................................ 118
7.2.4 Proximate Composition ........................................................................ 119
7.2.5 Sensory Evaluation .............................................................................. 119
7.2.6 Microstructure of Expanded Snack Product .......................................... 119
7.3 Results and Discussion ........................................................................ 122
7.3.1 Total Carotenoid Content ..................................................................... 122
7.3.2 Starch Digestibility ................................................................................ 124
7.3.3 Pearson’s Correlation of Proximate Composition ................................. 128
7.3.4 Sensory Evaluation .............................................................................. 128
7.3.5 Microstructure of Expanded Snack Product .......................................... 134
7.4 Conclusion ........................................................................................... 135
Chapter 8: Overall Conclusion, Limitations and Further Research ......................... 136
8.1 Overall Conclusion ............................................................................... 136
8.2 Limitations and Recommendations ....................................................... 137
8.3 Further Research ................................................................................. 138
References…. ........................................................................................................... 139
Appendices…. .......................................................................................................... 158

Page | xvi
List of Tables
Table 2-1 : Summary of current research on vegetable and fruit inclusion during
extrusion processing ..................................................................................................... 8
Table 2-2 : Summary of research on snack food vegetable enrichment ........................ 9
Table 2-3 : Examples of extruded food products produced by extrusion ..................... 13
Table 2-4 : Brief history of extrusion development (Riaz, 2000) .................................. 15
Table 2-5 : Functions of Extruder Sections ................................................................ 17
Table 2-6 : Comparison of single screw and twin screw extruders ............................. 19
Table 2-7 : Proximate composition, Total dietary fibre and energy of raw pumpkin
(edible part),(USDA National Nutrient Database For Standard Reference, 2005) ....... 28
Table 2-8 : Summary of food products containing pumpkin fractions ......................... 30
Table 2-9 : Kernel structures and their functions ........................................................ 32
Table 2-10 : Summary of corn uses in food industry processing (Serna-Saldivar,
Gomez, & Rooney, 2001) ........................................................................................... 32
Table 2-11 : Typical yields of corn dry-milled fractions ................................................ 33
Table 2-12 : Composition of dry-milled corn grits (Watson & Ramstad, 1987) ............ 33
Table 2-13 : Functional role of raw ingredient components ......................................... 34
Table 2-14 : Amylose and amylopectin content of various starches (Harper, 1981) .... 36
Table 3-1 : Proximate composition of raw pumpkin and pumpkin flour prepared from
different fractions of two (2) types of pumpkin prepared by different drying methods .. 45
Table 3-2 : Commercial pumpkin flour (proximate) ...................................................... 46
Table 3-3 : Colour Value (L*a*b*) of raw pumpkin and pumpkin flour (peel, flesh, seed)
from two (2) cultivars using different methods of drying .............................................. 47

Page | xvii
Table 4-1 : Basic recipes for extruding pumpkin with corn grit .................................... 50
Table 4-2 : Extrusion conditions (Brennan et al., 2008) ............................................... 51
Table 4-3 : Processing parameters of control and pumpkin flour mixed with corn grits at
different percentage levels to produce expanded snacks. ........................................... 55
Table 4-4 : Colour value (L*a*b*) of expanded snacks made of pumpkin flour (peel,
flesh and seed) with corn grits at different percentage levels. ..................................... 56
Table 5-1: Proximate composition of raw materials (corn grits and pumpkin flour) used
for the extrusion. ......................................................................................................... 68
Table 5-2 : Effect of formulations and feed rates on operating conditions of expanded
snacks made from pumpkin flour-corn grits................................................................. 76
Table 5-3 : Pearson’s correlation ................................................................................ 78
Table 5-4 : The effect and relationships between experiment variables, control
variables and physical characteristics of extruded snacks made from pumpkin flour-
corn grits. .................................................................................................................... 85
Table 6-1 : Coded levels for the independent variables.............................................. 91
Table 6-2 : Determining α for Rotatability .................................................................... 91
Table 6-3 : Extrusion conditions with actual variable levels for experimental design ... 92
Table 6-4 : The regression models for the product colour ......................................... 104
Table 6-5 : Analysis of varience (ANOVA) for response surface for dependant variables
of pumpkin flour-corn grits snacks. ........................................................................... 109
Table 6-6 : Solutions for optimum conditions and responses .................................... 110
Table 7-1 : Carotenoid study done by several researchers ....................................... 115
Table 7-2 : In vitro nutritional classification of starch. ................................................ 116
Table 7-3 : Formulation and extruder conditions ....................................................... 118

Page | xviii
Table 7-4 : Pearson’s correlation of total carotenoid ................................................. 123
Table 7-5 : Pearson’s correlation of extruded pumpkin flour-corn grits snacks .......... 127
Table 7-6 : Pearson’s correlation of unextruded (raw materials) and extruded pumpkin-
corn grits snacks ....................................................................................................... 127
Table 7-7 : Pearson’s correlation of proximate composition in pumpkin flour-corn grits
expanded snack ....................................................................................................... 128
Table 7-8 : Mean scores for sensory attributes of pumpkin flour – corn grits snack
products .................................................................................................................... 131
Table 7-9 : Pearson’s correlation of sensory attributes ............................................. 133
Table 7-10 : X-ray tomography cross sectional of 2-D image (radial): Changes of
bubble size through out the extruded sample at screw speed 250rpm (Scale 1:2) .... 135

Page | xix
List of Figures
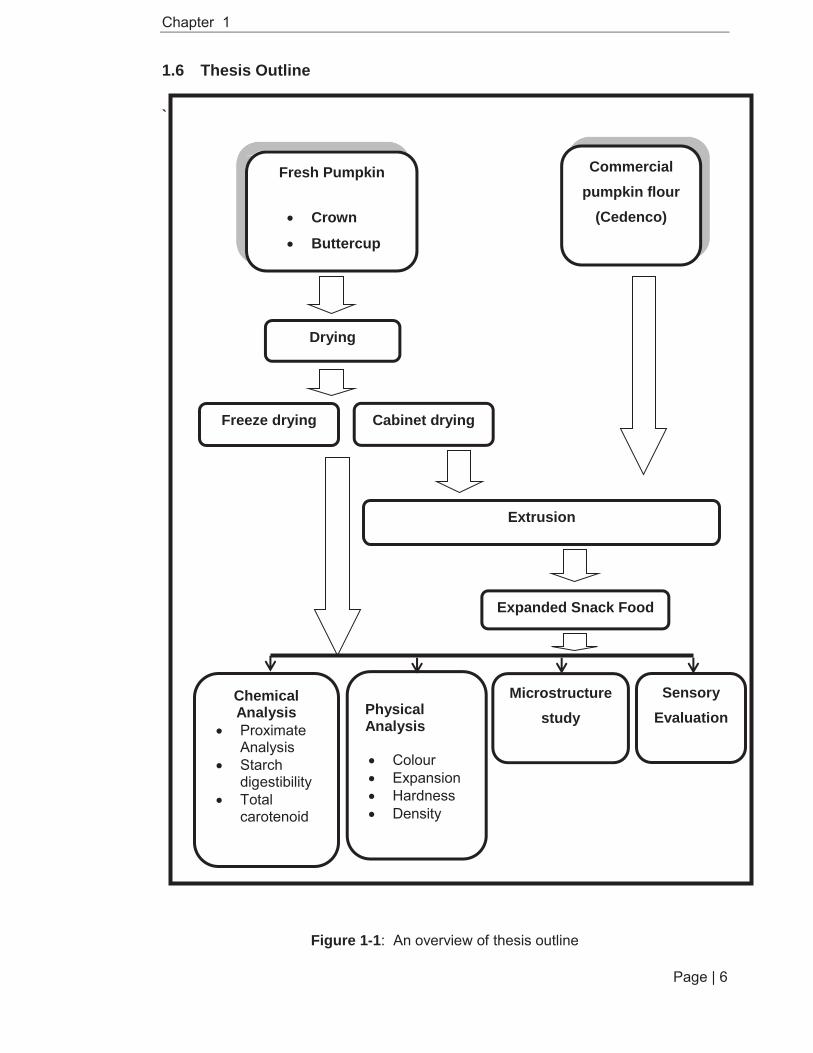
Figure 1-1: An overview of thesis outline ..................................................................... 6
Figure 2-1 : Global sweet and savoury snacks retail value sales 2004-2009............... 10
Figure 2-2 : Global sweet and savoury retail value sales 2004-2009........................... 11
Figure 2-3 : Global sweet and savoury retail value growth 2004-2009 ........................ 11
Figure 2-4 : Single screw extruder and Twin screw extruder ....................................... 16
Figure 2-5 : Schematic diagram of single screw extruder ............................................ 17
Figure 2-6 : A twin- screw extruder Clextral BC21, Firminy Cedex, France at Massey
University, New Zealand ............................................................................................. 18
Figure 2-7 : Schematic diagram of twin screw extruder components ........................... 19
Figure 2-8 : Interaction of raw material properties, process variables and product
characteristics (Chessari & Sellahewa, 2001) ............................................................. 21
Figure 2-9 : Schematic diagram of bubble formation during extrusion (Moraru et al.,
1992) .......................................................................................................................... 22
Figure 2-10 : Pumpkin structure .................................................................................. 26
Figure 2-11 : Components of corn kernel ................................................................... 31
Figure 2-12 : Amylose structure ................................................................................. 35
Figure 2-13 : Amylopectin structure ........................................................................... 35
Figure 3-1: The production process for pumpkin flour ................................................. 39
Figure 3-2 : Proportion of two types of pumpkin .......................................................... 41
Figure 3-3 : Recovery yield of pumpkin flour .............................................................. 43
Page | xx
Figure 4-1: Displacement (mm) versus Force (N) for 100% corn grits extruded product
at 250rpm ................................................................................................................... 53
Figure 4-2 : Expansion ratio of the expanded snack ................................................... 58
Figure 4-3 : Product density of the expanded snack ................................................... 60
Figure 4-4 : Hardness of the expanded snack ............................................................. 62
Figure 4-5 : Expanded snacks made from pumpkin flour (peel fractions) with corn grits
................................................................................................................................... 63
Figure 4-6 : Expanded snacks made from pumpkin flour (flesh fractions) with corn grits
................................................................................................................................... 64
Figure 4-7 : Expanded snacks made from pumpkin flour (seed fractions) with corn grits
................................................................................................................................... 65
Figure 5-1 : A typical complete RVA curve (Paton & Spratt,1981) ............................... 69
Figure 5-2: Schematic diagram of screw configuration of the extruder, the angle on the
schematic represent screw pitch from the feed at the left hand side to the die on the
right hand side. ........................................................................................................... 70
Figure 5-3 : Compression graph of force (N) against time (s) ...................................... 72
Figure 5-4 : RVA pasting curves of starches in corn grits, pumpkin flour and their blend
................................................................................................................................... 73
Figure 5-5 : Relationship between percentage of pumpkin flour and hot peak viscosity
................................................................................................................................... 74
Figure 5-6 : Effect of formulations and feed rates on expansion ratio of expanded
snacks made from pumpkin flour-corn grits................................................................. 76
Figure 5-7: Effect of formulations and feed rates on hardness (kg) of expanded snacks
made from pumpkin flour-corn grits ............................................................................ 77

Page | xxi
Figure 5-8 : Effect of formulations and feed rates on true density (g/m3) of expanded
snacks made from pumpkin flour-corn grits................................................................. 77
Figure 5-9: Effect of screw speed and the proportion of pumpkin flour on torque during
extrusion. Error bars indicate standard deviations. ...................................................... 79
Figure 5-10 : Effect of screw speed and the proportion of pumpkin flour on the specific
mechanical energy (SME). Each value was an average of duplicate samples. ........... 79
Figure 5-11 : Effect of screw speed and the proportion of pumpkin flour on power
consumption (kw) during extrusion. ............................................................................ 80
Figure 5-12 : Effect of screw speed and the proportion of pumpkin flour on pressure
thrust during extrusion. Error bars indicate standard deviations. ................................. 80
Figure 5-13 : Effect of screw speed (250rpm) and the proportion of pumpkin flour on
the physical characteristics of extruded products. ....................................................... 81
Figure 5-14 : Effect of screw speed (350rpm) and the proportion of pumpkin flour on
the physical characteristics of extruded products. ....................................................... 81
Figure 5-15 : Effect of screw speed and the proportion of pumpkin flour on the
expansion ratio. Error bars represent the standard deviation. ..................................... 82
Figure 5-16 : Effect of varying pumpkin flour percentage and screw speed on the
hardness of extrudates. Error bars indicate the standard deviation ............................. 83
Figure 5-17 : Effect of varying pumpkin flour percentage and screw speed on the bulk
density of extrudates. Error bars indicate the standard deviation ................................ 83
Figure 5-18 : Effect of varying pumpkin flour percentage and screw speed on the true
density of extruded products. Error bars indicate the standard deviation .................... 84
Figure 5-19: Texture mapping of pumpkin flour – corn grits snack with commercial
snack products ........................................................................................................... 87
Figure 6-1 : Predicted response surface plot for power consumption (kW) as a function
of pumpkin flour level (%) and barrel temperature ( C ) at a feed rate of 11.25 kg/hr. 94

Page | xxii
Figure 6-2 : Predicted response surface plot for torque (Nm) as a function of pumpkin
flour level (%) and barrel temperature ( C ) at a constant feed rate of 11.25 kg/hr. .... 95
Figure 6-3 : Response surface plot for specific mechanical energy (kwhr/kg)as a
function of pumpkin flour level (%) and barrel temperature ( C ) at a feed rate of 11.25
kg/hr. .......................................................................................................................... 96
Figure 6-4 : Response surface plot for pressure thrust as a function of pumpkin flour
level (%) and barrel temperature ( C ) at a feed rate of 11.25 kg/hr. ........................... 98
Figure 6-5 : Product expansion characteristics ........................................................... 99
Figure 6-6 : Longitudinal expansion of extrudate product as a function of barrel
temperature and pumpkin flour percentage at a constant feed rate of 11.25kg/hr ..... 100
Figure 6-7 : Sectional expansion of extruded product as a function of barrel
temperature and pumpkin flour concentration (%) at a constant feed rate of 11.25kg/hr
................................................................................................................................. 101
Figure 6-8 : Effect of barrel temperature, feed rate and pumpkin flour percentage on
lightness (L value) ..................................................................................................... 102
Figure 6-9 : Effect of barrel temperature, feed rate and pumpkin flour percentage on
redness ( a value) ..................................................................................................... 103
Figure 6-10 : Effect of barrel temperature, feed rate and pumpkin flour percentage on
yellowness b value) ................................................................................................. 103
Figure 6-11 : Effect of barrel temperature, feed rate and pumpkin flour percentage on
bulk density. .............................................................................................................. 105
Figure 6-12 : Effect of barrel temperature, feed rate and pumpkin flour percentage on
true density ............................................................................................................... 106
Figure 6-13 : Effect of barrel temperature, feed rate and pumpkin flour percentage on
the product hardness ................................................................................................ 107
Figure 6-14 : Effect of barrel temperature, feed rate and pumpkin flour percentage on
the total carotenoid ................................................................................................... 108

Page | xxiii
Figure 6-15 : Predicted response surface plot for the effect of feed rate and barrel
temperature on radial expansion of pumpkin flour-corn grits snack. .......................... 110
Figure 6-16 : Predicted response surface plot for the effect of feed rate and barrel
temperature on hardness of pumpkin flour-corn grits snack. ..................................... 111
Figure 6-17 Predicted response surface plot for the effect of feed rate and barrel
temperature on specific mechanical energy (SME) of pumpkin flour-corn grits snack.
................................................................................................................................. 112
Figure 6-18 : Predicted response surface plot for the effect of feed rate and barrel
temperature on total carotenoid content of pumpkinn flour-corn grits snacks. ........... 113
Figure 7-1 : Summary of the process of how the microstructure of the expanded snack
was captured and analysed ...................................................................................... 121
Figure 7-2 : Total carotenoid content of raw materials (unextruded).......................... 122
Figure 7-3 : Total carotenoid level (ppm) in pumpkin flour-corn grits snacks at different
level of pumpkin flour added, different barrel temperature ( C) and different mass flow
(kg/hr) ....................................................................................................................... 123
Figure 7-4 : In vitro starch fractions of raw materials (unextruded) and extruded
pumpkin flour-corn grits snack products .................................................................... 126
Figure 7-5 : Spider web of mean scores for sensory attributes of pumpkin flour-corn
grits expanded snacks .............................................................................................. 132
Figure 7-6 : Effect of varying pumpkin flour at constant screw speed (250rpm) on
bubble area distribution at the upper end and centre of the extruded expanded snack
................................................................................................................................. 134
Page | xxiv
List of Peer-Reviewed Publications, Conference Proceedings and Presentation
Journal Articles
Norfezah,M.N., Carr, A., Hardacre, A., & Brennan, C.S. (2013). The development of
expanded snack product made from pumpkin flour- corn grits : Effect of extrusion
conditions and formulations on physical characteristics and microstructure. Foods
(Accepted 3rd May 2013).
Norfezah, M., Hardacre, A., & Brennan, C. (2011). Comparison of waste pumpkin
material and its potential use in extruded snack foods. Food Science and Technology
International, 17(4), 367-373.
Conference Proceedings
Norfezah, M.N., Hardacre,A., Carr, A., & Brennan, C.S. Effect of varying pumpkin flour
and screw speed on the extrusion parameters, physical characteristics and
microstructure of the development added-value expanded snack products. In The
Proceeding of 44th Annual AIFST Convention “Tackling Tomorrow Today”, 10-13 July
2011, Sydney Convention Centre, Darling Harbour, Sydney, Australia.
Norfezah M.N.,Hardacre A.K., Carr A.J., Brennan C.S. The effect of process
parameters on the operating conditions and physical properties of extruded breakfast
cereals made from pumpkin flour and corn grits. In The Proceedings of New Zealand
Institute of Food Science (NZIFST) Conference : Food Elements-Putting The Pieces
Together, 23rd-25th June 2009, Christchurch Convention Centre, Christchurch, New
Zealand.
Norfezah, M. N., Brennan, C.S.& Hardacre, A. Utilization of pumpkin flour in expanded
breakfast cereals. In Total Food Proceeding : Sustainability of the Agri-Food Chain
International Conference, K.W.Waldron, G.K.Moates, C.B. Faulds (eds), 22-24 April
2009, Norwich, UK, pp105-108
Oral presentation
Norfezah,M.N. (2009). Optimization of process parameters for production of extruded
snack food made from pumpkin flour and corn grits. (Oral presented at IFNHH Seminar
on 19/8/09)

Chapter 1
Page | 1
Chapter 1: Introduction
This chapter introduces the purpose of the study. An overview of each chapter in
this thesis is provided.
1.1 Background of the Study
This research was conducted to investigate the potential of processing the whole
pumpkin fractions including peel, pulp (rind), flesh and seed into a usable flour for
extrusion processing, particularly for the manufacturer of the expanded snacks.
Pumpkin is a widely consumed food either directly as a vegetable or as a
thickener and flavour base in soups, sauces and spice mixes. Moreover, pumpkin can
also provide a natural yellow-orange colouring agent when blended with cereal flour,
pasta and extrusion expanded snacks. Pumpkin flour contains 350-400ug/100g
carotene which is converted to vitamin A in the body along with pectin (14-22%),
dietary fibre (0.5g/100g) and minerals. It also gives natural sweetness to the product
due to high levels (37%) of sugar in the flesh. In view of its nutritional value and flavour
characteristics, pumpkin flour is a potential ingredient for producing expanded snacks.
In Malaysia, the utilisation of pumpkin has been limited to the consumption of
fresh products as a vegetable and alternately grown after tobacco plant. In line with the
Malaysian government’s effort to redevelop and reposition the Agriculture Industry –
“Agriculture is Business”, this study may provide useful information about pumpkin flour
and its application in food production. Diversifying the usage and processing of
pumpkin, it could increase the returns for pumpkin growers in Malaysia. In contrast,
processing pumpkin for powder in New Zealand resulted in more than 25% of the fruit
being wasted as only the fleshy part was used. Reducing the waste by using seed, peel
and pulp (rind) may offer one of the best routes to increasing the productivity of this
industry.
There is a large range of snack foods on the supermarket shelves with a large
variety of sizes, shapes, colours and flavours available. The snack food market is
expanding rapidly and growth is forecast to continue into the future. The worldwide
market for snack food is expected to rise to USD$334 billion with a production volume
of 48.5 million metric tonne by 2015 (Euromonitor, 2010). Potato chips followed by corn
chips dominated the snack food market throughout the world. Most snacks are made
Chapter 1
Page | 2
from cereal grain (e.g. corn, wheat, rice and oats) which are usually low in nutritional
components such as vitamins and amino acids. Over the past ten years consumers
have become more health conscious and are choosing snacks that claim to be
healthier and more nutritious. Therefore snack foods that are low fat, fibre-rich, vitamin
and mineral fortified and have organic claims have become more popular and in high
demand. However, the production of healthier snack food is not only limited to natural
seasoning and flavour but could be achieved by incorporating fruit and vegetable
products into the formulation (Sacks et al.,1999; Block, Patterson & Subar ., 1992).
Only a few researchers have investigated the potential used of fruit and vegetables in
snack food production. Ibanoglu, Ainsworth, Ozer and Plunkett.,(2006) made a gluten
free snack, a rice flour-acorn squash blend extruded snack is described by Morini and
Maga, (1995) and a barley-tomato pomace blends by Altan, McCarthy and
Maskan.,(2008). Incorporation of pumpkin powder with whole cornmeal in the extrusion
process has been done by Karkle, Alavi,Dogan, Jain and Waghray (2009) while
Mastromatteo,Danza, Guida and Del Nobile (2012), added pumpkin powder in bread
making.
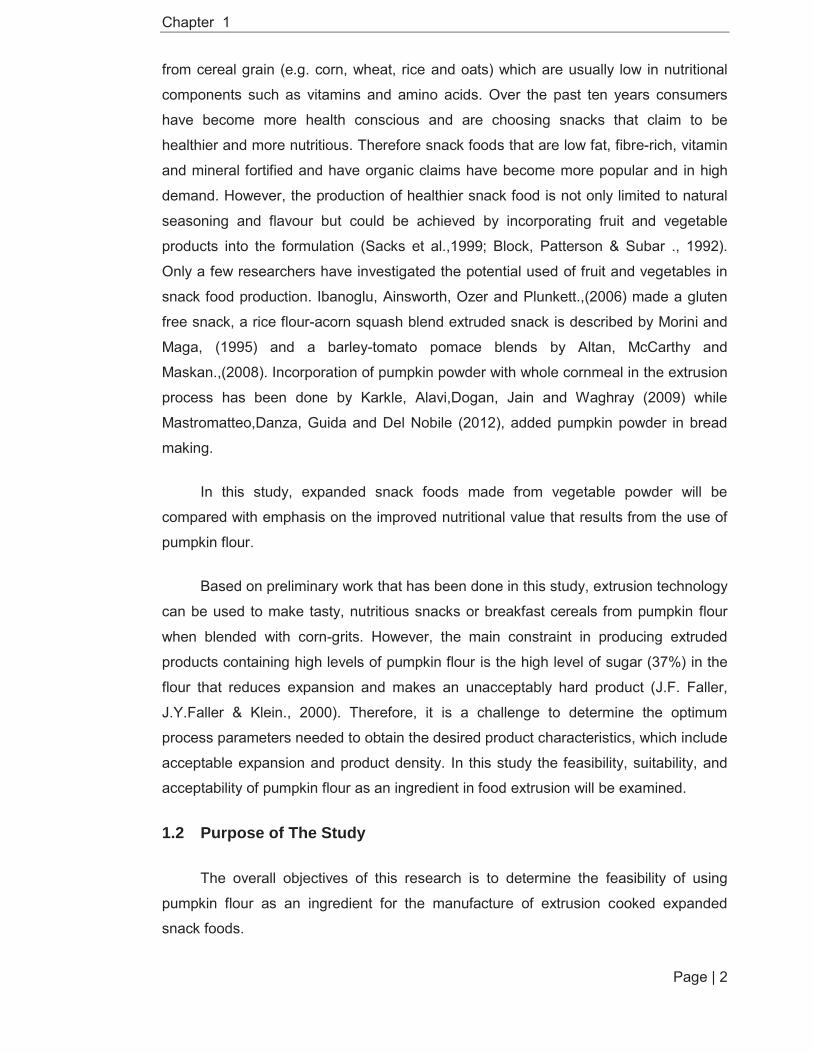
In this study, expanded snack foods made from vegetable powder will be
compared with emphasis on the improved nutritional value that results from the use of
pumpkin flour.
Based on preliminary work that has been done in this study, extrusion technology
can be used to make tasty, nutritious snacks or breakfast cereals from pumpkin flour
when blended with corn-grits. However, the main constraint in producing extruded
products containing high levels of pumpkin flour is the high level of sugar (37%) in the
flour that reduces expansion and makes an unacceptably hard product (J.F. Faller,
J.Y.Faller & Klein., 2000). Therefore, it is a challenge to determine the optimum
process parameters needed to obtain the desired product characteristics, which include
acceptable expansion and product density. In this study the feasibility, suitability, and
acceptability of pumpkin flour as an ingredient in food extrusion will be examined.
1.2 Purpose of The Study
The overall objectives of this research is to determine the feasibility of using
pumpkin flour as an ingredient for the manufacture of extrusion cooked expanded
snack foods.

Chapter 1
Page | 3
1.3 Significance and Rationale of Study
The products are expected to have improved nutritional properties compared with
tradition cereal based snacks. Demonstration of an acceptable product will also provide
new opportunities for the snack food industry while increasing the market for pumpkin
products.
1.4 Research Aims and Objectives
In line with the background of the study the proposed study attempts to answer the
following research questions:
1. How to enhance and diversify the usage of pumpkin?
Can it be processed into a food ingredient or flour?
2. What are the possible applications of pumpkin flour?
Is it suitable as an ingredient in the manufacture of snacks?
Do pumpkin-enriched snacks have a high nutritional value?
What is the level of consumer acceptance of pumpkin enriched snacks?
3. Extrusion
What are the best parameters (operating conditions) of the Clextral BC21 Twin
Screw Extruder for extruding pumpkin enriched snacks food?
What is the highest concentration of pumpkin flour (edible fractions: flesh and
seed) that can be used for the extrusion of expanded snacks?
What types of cereal (for example: corn grits) can be used to enhance the
organoleptic properties of extruded pellets made with pumpkin flour?
What is the most suitable level for each of the cereal grits?
4. To determine digestibility (Glycaemic Glucose Equivalent) of the starch
component in the extruded pumpkin enriched snack foods.

Chapter 1
Page | 4
1.5 Overview Outline
This thesis comprises eight (8) chapters:
Chapter 1 provides the background of the study, the purpose of the study and potential
contributions of the study for pumpkin growers, snack food manufacturers and
consumers. An overview of the thesis structure is also provided.
Chapter 2 is a review of current and past issues related to the extrusion of snack foods,
and to the use of pumpkin and corn grits.
Chapter 3 describes the characterisation of pumpkin and pumpkin flour production.
This preliminary work will be focused on exploring and processing of fresh pumpkin into
flour. Two types of pumpkin ( Crown and Buttercup) with two drying methods which are
convection oven and freeze drying. The flours produced in this work will also be
compared with commercial pumpkin flour produced by Cedenco.
Chapter 4 reports the results from the preliminary extrusion processing of snacks made
from a blend of pumpkin flour and corn grits. This work covers a wide range and looks
at many different factors which preliminary experiments and literature suggest might
have an effect.
Chapter 5 reports the effect of varying the proportion of pumpkin flour at two extruder
feed flow rates and at two screw speeds on the processing parameters and the
physical characteristics of the expanded snack This trial was carried out in order to
establish the conditions that can be used to process snacks containing high levels of
pumpkin flour. Correlation between the parameters also has been studied.
Chapter 6 describes the product optimisation process, in terms of the optimum
formulation and extrusion conditions for production of pumpkin rich snacks including
corn grits. Response surface methodology with a central composite design was used.
Three independent variables were selected which were temperature ( C), feed rate
(kg/hr) and pumpkin flour percentage (%).
Chapter 7 assesses the final product quality based on total carotenoid content, starch
digestibility and microstructure of the product. Total carotenoid was analysed to
determine the retention and stability of total carotenoid content during extrusion
processing. Losses and the stability of the total carotenoid in the final product were

Chapter 1
Page | 5
measured and compared with levels in the unprocessed ingredients. Starch digestibility
was determined to assess the effect of processing conditions on starch digestibility.
This is linked to the blood sugar levels of consumers. The microstructure was studied
in order to understand the role of bubble formation in the structure of the extrudate
products, which reflects on the final product quality. Sensory evaluation determined the
acceptance and preference of these extruded products by consumers. These results
were linked to the physical characteristics of the product and the processing conditions.
In the final chapter, the summary, conclusion and recommendations of the whole study
will be given.
Chapter 1
Page | 6
1.6 Thesis Outline
`
Figure 1-1: An overview of thesis outline
Sensory Evaluation
Fresh Pumpkin
Crown
Buttercup
Drying
Freeze drying Cabinet drying
Extrusion
Expanded Snack Food
Chemical Analysis Proximate Analysis Starch digestibility Total carotenoid
Physical Analysis
Colour Expansion Hardness Density
Commercial pumpkin flour
(Cedenco)
Microstructure study
Chapter 2
Page | 7
Chapter 2: Literature Review
This chapter is a review of current and past issues regarding the development and
trends of snack foods and extrusion technology. Previous work on pumpkin utilisation
and research is also reviewed.
2.1 Introduction
Malaysia’s food and beverage processing industry comprises more than 3,200
businesses with a total output in excess of US$ 13 billion (Borris, 2002). Therefore,
food and beverage manufacturing provides the biggest value of gross output compared
to other industries. Moreover, research has found that the main contributors to the
growth of the Malaysian economy are the services, manufacturing, and agriculture
sectors (Hun, 2012). Most food processing in Malaysia operates within the agro-based
industry.
Malaysia produced 874,602 metric tonnes of vegetables in 2011 (Crop Statistic
Information, 2013). Most commercial-based food processing is agro-based, due to
Malaysia’s major contribution to health and well-being. However, the growth of per
capita consumption of vegetables has not been as high as those meats and fish food
products.
As snack food consumption is increasing due to a number of global trends and
changing lifestyles (Kruger, 2012), along with demand for healthy snack option , adding
pumpkin powder in the extruded snack food may give a new prospective and
alternative for healthy extruded snack food production. Most snack foods contain a high
proportion of corn, wheat and rice, with potato and oat and other grain products
commonly added in smaller quantities. Vegetable powders are occasionally added but
are not common in ready-to eat (RTE) snacks.
Pumpkin is a good source of carotenes which are responsible for the yellow
colour of the flesh, they also contain appreciable levels of sugar and pectin. Sugar
sweetens products that include pumpkin, while pectin is a soluble fibre that delivers
many health benefits. However, the utilisation of pumpkin has been limited to the
consumption of fresh products as a vegetable, or thickeners in soups and purees
(Konopacka., et al., 2010) and the production of dry powders (flours) that are also used
to colour, flavour and thicken a range of foods. A potential avenue of development for

Chapter 2
Page | 8
pumpkin based products is in the expanded snack market where pumpkin can be used
to naturally enhance the flavour and colour of these products.
In line with the Malaysian Government’s effort to redevelop and reposition the
Agriculture Industry – “Agriculture is Business” this study may provide useful
information about pumpkin flour and its application in food production. Furthermore,
there are some agricultural sector activities that are no longer viable such as planting
tobacco (Abdullah, 2006). Pumpkin is a suitable crop to replace the tobacco crop, since
pumpkin is often planted alternately with tobacco.
Research on utilisation and feasibility of using fruit and vegetable powder, paste,
and juice or extrusion to produce extruded snack has been reported for 30 years (Maga
& Kim, 1989). A summary of current research on fruit and vegetable powder inclusion
in extruded snack is shown below:
Table 2-1 : Summary of current research on vegetable and fruit inclusion during
extrusion processing
Research References
Lycopene extraction from extruded
products containing tomato skin
Dehghan-Shoar,Z,Hardacre,A.K.,
Meerdink,G & Brennan,C.S. (2011)
Effect of extrusion cooking on functional
properties and in vitro starch digestibility
of barley- based extrudates from fruits and
vegetable by-products
Altan, A., McCarthy,K.L & Maskan, M.
(2009).
Comparison of waste pumpkin material
and its potential use in extruded snack
foods
Norfezah,M.N., Hardacre, A.K & Brennan,
C.S (2011)
Cauliflower by-products as a new source
of dietary fibre, antioxidants and proteins
in cereal based ready-to-eat expanded
snacks
Stojceska,V.,Ainsworth, P., Plunkettt, A.,
Ibanoglu, E.& Ibanoglu, S (2008)
2.2 Snack Foods
Snack foods have a junk food image in which they are perceived to have little or
no nutritional value. The 21st century saw the revolution of snack food towards healthier

Chapter 2
Page | 9
snacks and snack food manufacturers started adding fruit and vegetables about 30
years ago. The exact definition of “snack food’, covered by a broad range of definitions.
Most of which describe snacks on the basis of size and the occasion when they are
consumed (Matz, 1993; Riaz,2006).Snack foods are also defined as a light meal eaten
between regular meals which include a variety of products that can take many forms
such as potato chips or cereal-based snacks (Sajilata & Singhal, 2005). A snack is also
defined by the American Heritage Dictionary (as cited in Riaz, 2006) as a hurried or
light meal that is eaten between meals and can be considered as a reward or a treat.
Most snack foods in the market are cereal- based, usually corn, wheat, rice,
potato, tapioca or oats (Riaz, 2000). A number of research snack foods made from
vegetable powder have been produced as summarised in Table 2-2 below:
Table 2-2 : Summary of research on snack food vegetable enrichment
Type of vegetable powder Researcher
Soy Liu et al.,(2005)
Nwabueze, T. (2007)
Tomato Dehghan Shoar, Z., Hardacre, A. K., Meerdink, G., &
Brennan, C. S. (2011).
Ibanoglu, S., Ainsworth, P., Ozer, E. A., & Plunkett, A.
(2006)
Yam Alves et al., (2002)
Carrot, basil Ibanoglu, S., Ainsworth, P., Ozer, E. A., & Plunkett, A.
(2006).
The main ingredients for making snack foods are grain-based and are normally wheat
flour and corn. Other ingredients include fat, oils, emulsifiers and antioxidants.
However, in this study the main ingredients will be pumpkin flour and corn grits.
Snack foods are manufactured using various methods of production. In this study the
only method of snack food production that will be considered is extrusion, which will be
covered in section 2.5.

Chapter 2
Page | 10
2.3 The Snack Food Market
The snack food market is increasing and snacks occur in a wide variety of
shapes, flavours and colours. This section will discuss an overview of current market
trends and growth of sweet and savoury snack foods in five (5) selected countries;
Malaysia, New Zealand, Australia, the United Kingdom and the United States.
The increased demand for the snack food was found due to several factors:
i. Changes of life styles which more people spent time at work, less food
preparation, doubled income.
ii. Highly mobile population
iii. Growth in snack vending machines and convenience markets
According to the Euromonitor International report (2010), the retail value of snack
food particularly sweet and savoury snacks, increased by 4% in the year 2009
compared to 2008. This is shown in Figure 2-1.
Figure 2-1 : Global sweet and savoury snacks retail value sales 2004-2009

Chapter 2
Page | 11
Figure 2-2 : Global sweet and savoury retail value sales 2004-2009
However, the global retail volume was found to be slowing down by the year 2009
compared to 2008 (as shown in Figure 2-2) this was due to an economic downturn
and health conscious consumers moving towards healthy snacking. This offered a new
opportunity to the food industry in exploring, developing and innovating healthier snack
food products.
Figure 2-3 : Global sweet and savoury retail value growth 2004-2009
Based on product type (Figure 2-3), chips dominated the sweet and savoury snack
market, closely followed by extruded snacks. This is shown by the red arrow marker.
Chapter 2
Page | 12
2.3.1 Sweet and Savoury Snacks Market in Malaysia
Snacking is a part of Malaysian culture and the sweet and savoury snacks market in
Malaysia was worth US$34.0 million (RM105.7 million) in 2010. Extruded snacks and
popcorn dominated the snack market. However, the traditional snacks such as muruku,
green peas, fruit jellies and cuttlefish remained popular among Malaysians.
2.3.2 Sweet and Savoury Snacks Market in New Zealand
The value of sales of sweet and savoury snacks in New Zealand reached US$287.04
million (NZ$349 million) in 2010 representing an impressive growth of 3% over 2009.
Health-related trends towards healthy snack products which include high fibre, whole
grains, and less trans fats and fats continued to grow well. Popcorn was the largest
growth sector with 48% volume growth, followed by nuts (42.2%) and extruded snacks
(22.6%).
2.3.3 Sweet and Savoury Snacks Market in Australia
According to the Euromonitor International report (2010), nuts dominated the sales of
sweet and savoury snacks approximately 38.26% of the market, followed by extruded
snacks (26.76%). This was due to health conscious parents directing the healthy
snacking habits of their children. Overall the sweet and savoury market was found to
be worth more than US$615.66 million (A$605.52 million) in 2010. The extruded snack
market increased by 26% from the year 2005 to 2010 (Euromonitor International,
2010).
2.3.4 Sweet and Savoury Snacks Market in the United Kingdom
Throughout the European market, the United Kingdom contributed the largest sales of
snack foods with approximately US$1,410.11 million (£938.2 million) in sales of
extruded snacks. Overall, there was an increment of 4% in sales of the sweet and
savoury snacks over the years 2005 to 2010. The report showed healthy snacking was
driven by the dynamic growth of tortilla chips (13%) and popcorn (7%) sales in the year
2010.(Euromonitor International, 2010).
Chapter 2
Page | 13
2.3.5 Sweet and Savoury Snacks Market in the United States
The sweet and savoury snacks market in the United States by the year 2010, saw retail
volume fall slightly across the product categories with the exception of nuts. Overall,
the value of snack sales was US$32 billion in 2010 with chips dominating the
supermarket shelves (35.6%) followed by nuts (30.0%), fruit snacks (29.3%) and
extruded snacks (20.8%). The sales of sweet and savoury snacks were predicted to
grow 3% in volume terms over the years 2010 to 2015 (Euromonitor International,
2010).
2.4 Extruded Food Products
Extruded snack foods or expanded snacks have been identified as one of the
fastest growing snack segments and have great potential to be explored. Expanded
corn snacks were among the first extruded snacks to be introduced and
commercialised in mid to late 1940s. Presently, a variety of shapes, colours and
flavours of extruded snacks are available in supermarket, grocery retailers, corner
stores, gas stations, vending machines, cinemas as well as at sports events or theme
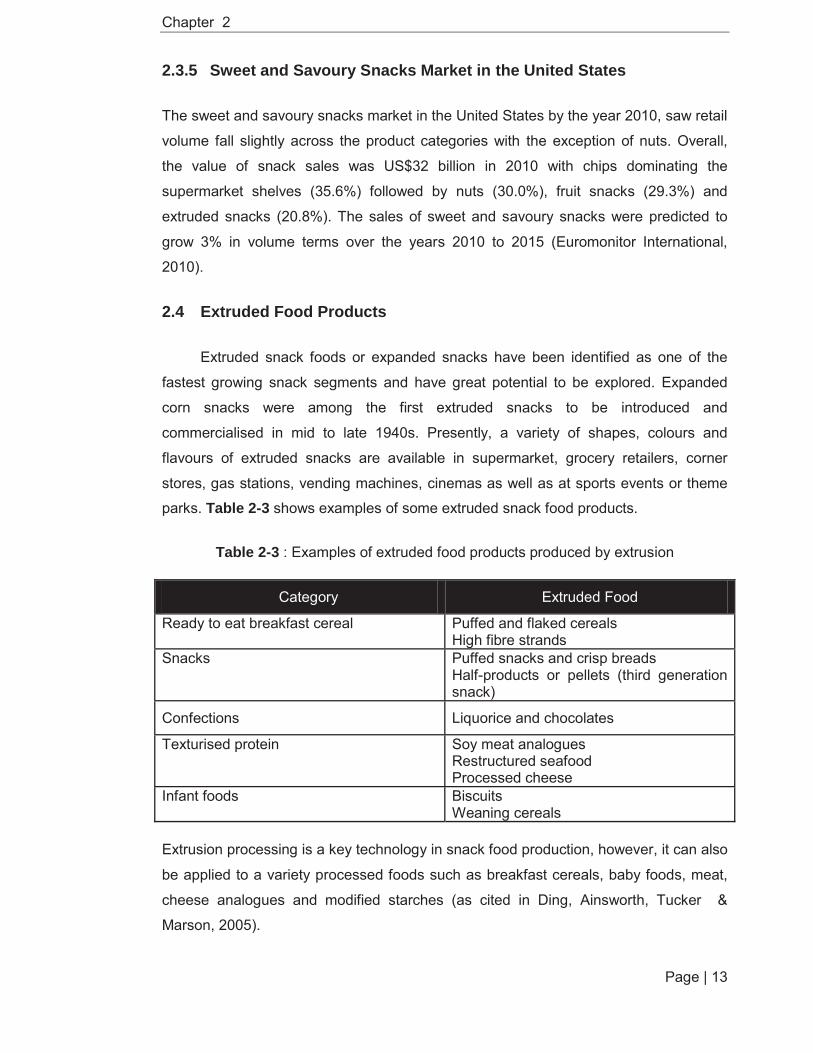
parks. Table 2-3 shows examples of some extruded snack food products.
Table 2-3 : Examples of extruded food products produced by extrusion
Category Extruded Food
Ready to eat breakfast cereal Puffed and flaked cereals High fibre strands
Snacks Puffed snacks and crisp breads Half-products or pellets (third generation snack)
Confections Liquorice and chocolates
Texturised protein Soy meat analogues Restructured seafood Processed cheese
Infant foods Biscuits Weaning cereals
Extrusion processing is a key technology in snack food production, however, it can also
be applied to a variety processed foods such as breakfast cereals, baby foods, meat,
cheese analogues and modified starches (as cited in Ding, Ainsworth, Tucker &
Marson, 2005).

Chapter 2
Page | 14
2.5 Extrusion 2.5.1 Introduction
Extrusion is a versatile and very efficient technology that is widely used in food and
feed processing. Extruders have been used for many applications, which include:
breakfast cereals, snack foods, other cereal - based products, pet food and aquatic
foods, texturised vegetable proteins, confectionery products, chemical and biochemical
reactions, and oil extraction. It is a device that expedites the shaping and restructuring
process for food ingredients which can be applied to a variety of food processes (Riaz,
2000). Extrusion processing involves some of these functions: mixing, homogenisation,
shearing, thermal cooking and shaping. The main reasons that extrusion is used are:
Versatility – A wide range of products can be produced ; dry and semi-moist pet
foods, expanded snacks, breakfast cereals, pastas, infant foods, confectionary,
textured vegetable protein (TVP) and flavoured compounds
Reduced production costs - factors such as higher throughputs, less labour,
reduced energy input, reduced wastage and reduce effluents
The ability to produce products with specific properties and based on consumer
demand. This can be achieved through controlling the ingredients and the
operating conditions.
2.5.2 Definitions of Extrusion
Extrusion is defined as a process that transforms a granular raw material into a
continuous plasticised mass through a high-temperature-short-time (HTST) process.
The end product, known as an extrudate is a highly expanded, porous solid, obtained
from the dissipation of mechanical energy in the extruder and the sudden pressure
drop as the material is forced through the die.
Rossen and Miller (1973) defined food extrusion as a process in which a food
material is forced to flow, under one or more varieties of conditions of mixing, heating
and shear, through a die which is designed to form and/or puff-dry the ingredients.
2.5.3 Background and Development of Extruder
Extrusion has been widely used in the manufacturing industry during the past two
centuries. A brief history of the development of extrusion is outlined in Table 2-4 below.

Chapter 2
Page | 15
Table 2-4 : Brief history of extrusion development (Riaz, 2000)
Year Brief History of Extrusion
1797 Development of a hand-operated piston press to extrude
seamless lead pipe by Joseph Bramah, England.
1869 First continuous twin screw extruder was developed in sausage
manufacture by Fellows & Bates, England.
1873 First Single Screw Extruder was developed in rubber processing
by Phoenix Gummiwerke , A.G., Germany
Mid 1930’s Single-screw continuous pasta press was developed
Late 1930’s Twin screw extruder for making plastic was developed
Late 1930’s First single screw extruder used for ready-to-eat breakfast cereals
(prior to flaking)
1939 Expanded corn curls or “collets” were first extruded
1940’s Single screw oil presses was developed replacing the hydraulic
presses
Late 1940’s Cooking extruder for manufacturing animal feed was developed
1950 Dry expanded pet food
- Pre cooked flours
Late 1950’s Development of pressurised pre-conditioner
1960’s Ready-to-eat (RTE) & Textured Vegetable protein were produced
by extruders
Mid 1970’s Second generation of extruder was developed ( segmented screw
& barrel)
Early 1990’s Third generation of extruder was developed ( Conditioners &
vented barrels)
Late 1990’s
(1998)
New generation extruders were patented by Wenger
Manufacturing Co. (Sabetha, KS)
2.5.4 Types of Extruder
Extruders used in food applications are usually single-screw extruder or twin-
screw extruder and both are generally classified based on the number of screws.
Figure 2-4 showed a schematic diagram of single and twin screw in extruder below.

Chapter 2
Page | 16
1. Single screw extruders
Laminar Flow
2. Twin screw extruder
Figure 2-4 : Single screw extruder and Twin screw extruder
2.5.4.1 Single-Screw Extruder
Basically, this type of extruder is a relatively simple, reliable and extremely
effective means of cooking and forming wide variety of products. A schematic diagram
of a single model extruder is shown in Figure 2-5. A single screw extruder can be
classified based on several different characteristics such as:
i. Wet vs dry
ii. Segmented vs solid screw
iii. Shear : cold forming extruder, high-pressure forming extruder, low-shear
cooking extruder, collet extruder, high shear cooking extruder
iv. Heat generated : adiabatic, isothermal extruder, polytropic extruder
v. Based on its design : solid single-screw extruder, interrupted-flight
extruder-expander, single segmented-screw extruder
Feed Barrel
Die
Screw
Feed
Barrel
Screws
Die

Chapter 2
Page | 17
Figure 2-5 : Schematic diagram of single screw extruder
In general a single screw extruder comprises three (3) main sections; feed section,
compression section and metering section, as shown in Figure 2-5 and Table 2-5 describes their functions.
Table 2-5 : Functions of Extruder Sections
Section Function
Feed Carried and compacted solid materials to
the compression section.
Compression Completed the melting process of melt
materials.
Metering Heats and conveys melt materials to the
die.
Develops high shear rates and pressure
2.5.4.2 Twin- Screw Extruder
The use of twin-screw extruders has rapidly increased the number of extruded products
(Bhattacharya, Sivakumar & Chakarborty., 1997). Twin screw extruder can be divided
into four types, based on the direction of screw rotation, which are:
(a) Counter-rotating intermeshing
(b) Counter-rotating non-intermershing
(c) Co-rotating intermeshing
(d) Co-rotating non-intermeshing
Chapter 2
Page | 18
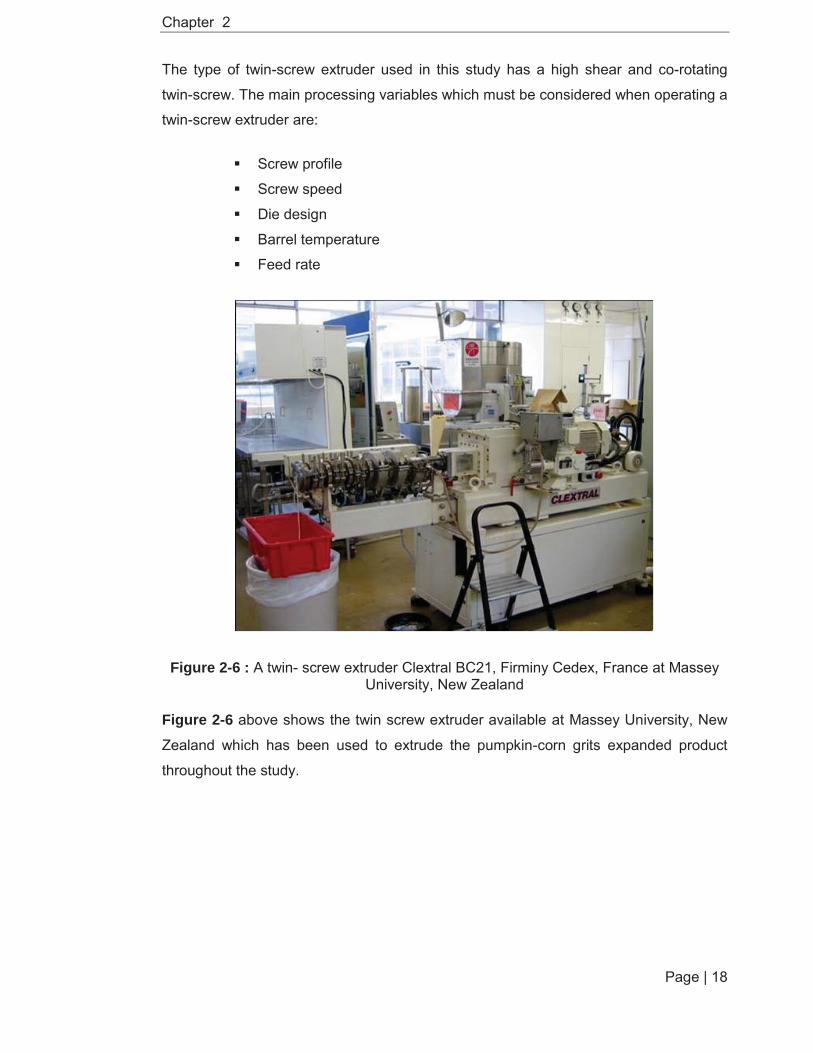
The type of twin-screw extruder used in this study has a high shear and co-rotating
twin-screw. The main processing variables which must be considered when operating a
twin-screw extruder are:
Screw profile
Screw speed
Die design
Barrel temperature
Feed rate
Figure 2-6 : A twin- screw extruder Clextral BC21, Firminy Cedex, France at Massey University, New Zealand
Figure 2-6 above shows the twin screw extruder available at Massey University, New
Zealand which has been used to extrude the pumpkin-corn grits expanded product
throughout the study.

Chapter 2
Page | 19
2.5.5 Comparison of Single Screw and Twin Screw Extruders
Table 2-6 : Comparison of single screw and twin screw extruders
Single screw Co-rotating twin screw
Self-wiping No Yes
Mixing Poor Good
Uniformity of shear rate Poor Good
Heat Transfer Poor Good
Moisture range (%) 12-35 6-very high
Flexibility Narrower Wider
Table 2-6 shows the differences between single and twin screw extruders.
2.5.6 Principles of Extrusion Cooking
Figure 2-7 : Schematic diagram of twin screw extruder components
The basic components of a twin screw extruder are shown in Figure 2-7 above. Raw
ingredients enter the feeder and came out through the die. High temperature and screw
movement inside the extruder, generates the pressure and heat which results in the
raw ingredients becoming a melt fluid. The bubble will start to develop as the melt fluid

Chapter 2
Page | 20
is exposed to steam vapour (superheated), followed by a rapid drop in pressure and
temperature upon exiting the die, this will expand the bubble and by end of the die a
light expanded product will be produced.
Generally extrusion cooking involves a few extrusion parameters and ingredient
as well as changes on chemical nutrients such as starch, protein, lipid, vitamin and
bubble formation development. Therefore the subsequent section will cover this topic.
2.5.6.1 Variables and Parameters Involved In Extrusion Processing
Variables and parameters involved in extrusion processing are as follows: i. Raw Materials
Composition – starch, protein Moisture Particle size Additives
ii. Operational variables Feed rate Screw speed Cutter speed Screw profile Barrel temperature Water addition
iii. System parameters Product temperature Product pressure Melt viscosity Thermal energy Specific mechanical energy (SME) Residence time
iv. System disturbances Ambient conditions Screw wear
v. Die profile Open area Flow resistance
vi. Product quality Product moisture Expansion Bulk density Texture Gelatinisation Dextrinisation Morphology – size, shape, uniformity
(Campanella, Li &Ross, 2002)
The interaction between variables and parameters are shown in Figure 2-8 below:

Chapter 2
Page | 21
Figure 2-8 : Interaction of raw material properties, process variables and product characteristics (Chessari & Sellahewa, 2001)
2.5.6.2 Factors Influencing the Extrusion Process
The effect of raw materials and extruder operating conditions, particularly mass flow
and screw speed during extrusion processing, will be covered. Further discussion on
results obtained will be discussed in Chapter 5. Understanding these factors is
important to compensate for the steady state disturbances and maintain final product
quality.
2.5.6.2.1 Mass Flow Rate
Mass flow is referred to as the feed rate which influences the flows of raw materials
through the barrel during extrusion processing and the final product quality. Harper
(1981), stated that an efficient raw material feed rate in a twin screw extruder gives
advantages in eliminating or minimising the pressure and leakage of the raw materials
flow. Moreover it is controlled by the direction of screw shape, screw rotation, the
relative position of the screw sections and screw configuration (Noguchi, 1989). A
stable and steady flow rate of raw materials must be achieved during processing in
order to avoid large variation in product quality particularly poor shape, uneven texture
and large size distribution of the product. Therefore, the feed rate must be calibrated
before extruding the raw materials, thus giving a constant feed rate.

Chapter 2
Page | 22
2.5.6.2.2 Screw Speed
The movement of raw materials is due to the rotation of the screw (known as the screw
speed) by an electric motor inside the barrel which affects the degree of fill, the
duration that materials remain inside the barrel (residence time distribution) and the
pressure on the product (Prabhat, Sandeep & Sajid, 2010) An increase in screw speed
lowers the melt viscosity of materials due to lowered shear rate thus the materials
become less viscous and there is a drop of die pressure during the extrusion
processing (Guha, Ali, & Bhattacharya,1998). However, Harper (1981) found that
screw speed had only minor effects on final product quality.
2.5.6.3 Bubble Formation During Extrusion
Figure 2-9 : Schematic diagram of bubble formation during extrusion (Moraru et al., 1992)
The structure and texture properties of extruded products which are airy, porous, brittle
and expanded are due to bubble formation during the extrusion process. Formation of
bubbles involves five (5) major steps: order-disorder of starch molecular, nucleation,
extrudate swelling, bubble growth and bubble collapse. These processes are shown in
the schematic in Figure 2-9 and explanation for each processes are discussed below.
A. Order-disorder of starch molecule
This step occurs at the extruder die, where the homogenous melt of raw
materials is exposed to high temperature and high pressure that alters the
starch molecule and rheological of the physical starch.

Chapter 2
Page | 23
B. Nucleation
Nucleation of the bubble starts as the melt materials exit the extruder die.
C. Extrudate swell
As the temperature is still higher than boiling temperature, the bubble
expansion starts to gives rise to the product structure and formation of crust as
the product grows.
D. Bubble growth
The difference in pressure between the inside and outside of the product leads
to uneven growth of the bubble, so bubble growth at the centre expand more
than those at the surface.
E. Bubble collapse
At this final stage, as the product starts to cool, the temperature and pressure
drops, the bubble expansion stops and collapses, due to both the cooling and
increase in total solids (due to water loss as steam) the viscosity of the
extrudate increases and the foam structure sets.
Bubble formation in pumpkin flour – corn grits expanded snacks will be determined and
discussed in section 7.2.6.
2.6 Raw Materials For Extrusion
Common food ingredients that have been used in food extrusion are cereal-
based ingredients such as maize, wheat, rice, oat and barley as the major ingredient,
while non-major ingredients include tuber sources, potato and tapioca. Vegetable
powder such as pumpkin flour is rare in snack processing. All ingredients provide
different functional roles in terms of formation, stabilisation, colour, flavour, texture and
nutritional qualities of the extruded products (Guy, 2001).
This section will briefly outline two main ingredients that have been used in this study
which were pumpkin and corn. Chemical and nutritional changes of the raw material
components also will be covered.
2.6.1 Pumpkin 2.6.1.1 Introduction
Pumpkin is a fruit vegetable, native to the Western Hemisphere. It can also be
found in North America, Continental Europe, Australia, New Zealand, India and some

Chapter 2
Page | 24
other countries. In addition, pumpkin has also been cultivated in tropical Asia and
countries such as Indonesia, Malaysia and the Philippines (Tindall, 1983). About
1,500,000 ha of pumpkins, squash and gourds were harvested in 2005. Asia and
Europe were the main producer. Together, these regions produced nearly 19 million
tonnes (FAO, 2006)
Pumpkins and banana can be found in abundant supply in Malaysia (Normah &
Ponjata, 2000). Noor Aziah and Komathi (2009) reported that 10,224 metric tonnes of
pumpkins were produced in 2007 for local consumption in Malaysia. Pumpkin is a
yellow-coloured fruit and is a good source of pro-vitamin carotenoids. Pumpkin is also
rich in carbohydrate, pectin, mineral salts and vitamins (Wang &Zhao, 1998; Wang, Liu,
Zhao & Hoa.,2002). Pumpkins are grown widely as a replacement for tobacco crops in
the tabacco-growing areas of Kelantan, Malaysia. Pumpkins is mainly used as a
vegetable food and is also served as a traditional dish by cooking it in a heavy syrup of
palm sugar. It is also widely used in the preparation of traditional cakes and as a base
in other foods including jams and soups.
Increased use of pumpkin and its co-products will also enhance the utility and
versatility of the pumpkin crop in Malaysia. Yet few investigations of this product and its
applications have so far been carried out (Normah & Ponjata (2000), Noor Aziah &
Komathi (2009)). The versatility and profitability of the pumpkin crop could be extended
by diversifying crop use and utilising products such as pumpkin peel and seed. This
could contribute to maximising the available resources and result in the production of
various new products thus minimising the agricultural by-product waste.
Various parts of the pumpkin plant and pumpkin fruit can be eaten. Longe,
Farinu and Fetuga (1983) noted that young green leaves are delicious as a vegetable.
The kernels of pumpkin seeds are often used as additives to some food dishes as
reported by Nwokolo and Sim (1987). Koike, Li, Liu, Hata and Nikaido (2005) stated
that pumpkin has been used as a vegetable since antiquity. In addition, pumpkin seeds
have often been used as snacks. Lazos (1986) stated that pumpkin seed is high in
protein content that ranged from 25.2 to 37% and oil that ranged from 37.8 to
45.4%.Pumpkins are commonly cooked and served as a vegetable such as pumpkin
pie, pumpkin bread, pumpkin soup and roasted pumpkin. Ptitchkina, Danilova,
Doxastakis, Kasapis and Morris (1994) stated pumpkin can also be used as a gelling
agent in food jam and jellies. Moreover pumpkin has also been used as forage to feed

Chapter 2
Page | 25
sheep, pigs and goats (Akwaowo,Ndon & Etuk.,2000). In addition pumpkins are
traditionally part of Halloween celebrations in the United States (Radovich,2010).
The orange-flesh types of pumpkin provide an excellent source of vitamin A, which
is an important antioxidant. The flesh is also naturally low in calories (Radovich,2010).
Pumpkins are among the most economically important plant families being the basis for
multi-million dollar industries. The role of pumpkin and its nutritional advantages
contribute substantially to its economic value ( Kocyan, Zhang, Schaefer & Renner,
2007).
Having considered the common features of the pumpkin plant, the focus now turns
to the pumpkin’s rating on the Glycaemic Index (GI) scale. Nishimune, Yakushiji,
Sumimoto, Taguchi, Konishi, Nakahara and Kunita (1991) found that pumpkin has a
high GI value of 75 compared to 100 for white bread. This result was supported by
Foster-Powell and Miller (1995). Foods with a lower glycaemic response are
associated with reduced risk for chronic disease (Brand-Miller,Foster-Powell & Burani,
2006). Furthermore, foods with a lower glycaemic index may help regulate the satiety
mechanism (Roberts, 2000) and body weight (Pereira,Swain, Goldfine, Rifai & Ludwig.,
2004). Foods with low GI release glucose more steadily over several hours and this
helps to keep blood sugar levels relatively low. Foods with a high GI release glucose
into the blood stream quickly. This causes blood sugar levels to rise rapidly and
invokes an insulin spike resulting in high insulin release into the blood stream.
The main problem in pumpkin processing is waste stream management. Brian
(2008) stated that Cedenco generates approximately 5500 metric tonnes of pumpkin
waste during the processing season (January-June). Based on application analyses
done by Brian(2008) on Cedenco Foods Ltd, a few suggestions have been made to
overcome and manage the waste stream from pumpkin processing; biomass for energy
production, biomass for removal of heavy metal, composting, skin products, health
products, squash puree, milled pumpkin seeds, pumpkin seed oil and snack foods.
However, this may need a feasibility study to be carried out.
In order to enhance the utility and versatility of a pumpkin based food products,
breakfast cereals or expanded snack products with a low glycaemic index value are
recommended. Breakfast cereals are in high demand due to several factors such as
the convenience of these foods, advertising, and the increased interest in dietary fibre
and enriched or fortified foods (Gibson, Donovan & Heath, 1997).

Chapter 2
Page | 26
Nowadays, extrusion technology is increasingly important in the food industry for
transforming ingredients into intermediate or finished products. According to Miller
(1988) extrusion cooking is widely used in the production of breakfast cereals. In
particular, it has become the most common and versatile technology in the production
of cereal based snack foods (Perez-Navarrete, Gonzalez, Chel-Guerrero & Betancur-
Ancona, 2006). Moreover Anderson, Conway, Pfeifer and Griffin (1969) also stated that
extrusion technology has been widely used in the manufacture of ready-to-eat cereals,
expanded products and breakfast cereals.
2.6.1.2 Pumpkin Structure
Figure 2-10 : Pumpkin structure
Figure 2-10: shows pumpkin structure which consists of four main parts; peel, flesh,
seed and pulp (rind).
2.6.1.3 Plant Species
The FAO (2006) reported that world agricultural production has increased
annually by 2.2% over the last ten years. Pumpkin production was found to have
increased from 50 million tonnes in 1996 to 203 million tonnes in 2005. In fact, pumpkin
production grew faster than average agricultural production. Sidek (1999) stated that
cucurbitaceae (pumpkin family name) is the third largest family of fruit vegetable crops
grown in Malaysia after solanaceace and leguminosae in terms of hectarage. Almost all
of the cucurbits were grown for local consumption.
Peel
Seed
Flesh
Pulp (rind)

Chapter 2
Page | 27
The pumpkin plant grows as a vine or as a compact bush. Pumpkin fruit is large
and varies in shape from more or less spherical to flattened or oblong. The colour of
pumpkin ranges from dark green, pale-green, orange-yellow, white, and red to gray
(Tindall, 1983). The cucurbitaceace family consists of 119 genera and 825 species
(Vanhanen, Savage & Dutta., 2005) which include Cucurbita maxima, Cucurbita
moshata, Cucurbita pepo,and Cucurbita mixta .
Cucurbita maxima, known as the King of Mammoths, Big Max, Big Moon or
Atlantic Giant, is the largest in size sometimes exceeding 300kg. In New Zealand this
species is the fourth largest fresh horticultural crop for export after apples and kiwifruit
(Bycroft, Corrigan & Irving., 1999). In addition Cucurbita maxima is the most important
species in South America (Linskens & Jackson, 1994). The matured fruits are cooked
as a vegetable and used in jams and pies. Cucurbita moschata is bell-shaped and is
commonly known as butternut squash. In the Middle East it is known as “Tripolitan”.
This species is quite large with some in excess of 100kg. Cucurbita moschata is
suitable for use in pies and jams, while “mammoth” cultivars are mainly used for
stockfeed. According to Wenli, Yaping, Jinjing and Bo (2004), Cucurbita moschata is
one of the most popular snack and main food resources planted in China. Moreover, its
seed is commonly used for salad oil production in Austria, Slovenia and Hungary
(Murkovic, Hillebrand, Winkler & Pfannhauser, 1996).
2.6.1.4 Nutritional Value of Pumpkin
The nutritional composition of pumpkin is shown in Table 2-7. The major
component of raw pumpkin is moisture (91.6%) which varies according to variety,
maturity, growing conditions, season and fraction that is consumed (Hart & Scott,
1995). Cucurbita moschata was found to have a high fibre content, and to be low in
sugar and lipids (McCance & Widdowson, 1991). The content of carbohydrate varies
greatly between species of pumpkin (Nishmune et al., 1991). The average total dietary
fibre (TDF) in pumpkin was found to be 1.57%.
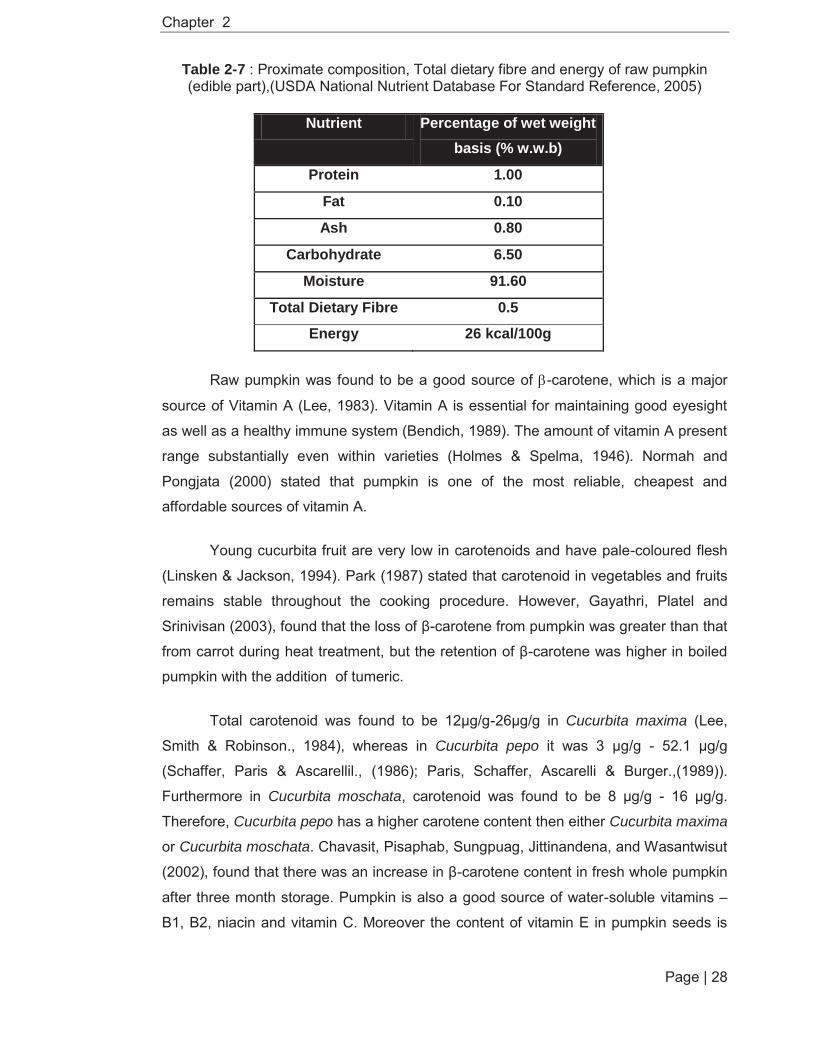
Chapter 2
Page | 28
Table 2-7 : Proximate composition, Total dietary fibre and energy of raw pumpkin (edible part),(USDA National Nutrient Database For Standard Reference, 2005)
Nutrient Percentage of wet weight basis (% w.w.b)
Protein 1.00
Fat 0.10
Ash 0.80
Carbohydrate 6.50
Moisture 91.60
Total Dietary Fibre 0.5
Energy 26 kcal/100g
Raw pumpkin was found to be a good source of -carotene, which is a major
source of Vitamin A (Lee, 1983). Vitamin A is essential for maintaining good eyesight
as well as a healthy immune system (Bendich, 1989). The amount of vitamin A present
range substantially even within varieties (Holmes & Spelma, 1946). Normah and
Pongjata (2000) stated that pumpkin is one of the most reliable, cheapest and
affordable sources of vitamin A.
Young cucurbita fruit are very low in carotenoids and have pale-coloured flesh
(Linsken & Jackson, 1994). Park (1987) stated that carotenoid in vegetables and fruits
remains stable throughout the cooking procedure. However, Gayathri, Platel and
Srinivisan (2003), found that the loss of β-carotene from pumpkin was greater than that
from carrot during heat treatment, but the retention of β-carotene was higher in boiled
pumpkin with the addition of tumeric.
Total carotenoid was found to be 12μg/g-26μg/g in Cucurbita maxima (Lee,
Smith & Robinson., 1984), whereas in Cucurbita pepo it was 3 μg/g - 52.1 μg/g
(Schaffer, Paris & Ascarellil., (1986); Paris, Schaffer, Ascarelli & Burger.,(1989)).
Furthermore in Cucurbita moschata, carotenoid was found to be 8 μg/g - 16 μg/g.
Therefore, Cucurbita pepo has a higher carotene content then either Cucurbita maxima
or Cucurbita moschata. Chavasit, Pisaphab, Sungpuag, Jittinandena, and Wasantwisut
(2002), found that there was an increase in β-carotene content in fresh whole pumpkin
after three month storage. Pumpkin is also a good source of water-soluble vitamins –
B1, B2, niacin and vitamin C. Moreover the content of vitamin E in pumpkin seeds is
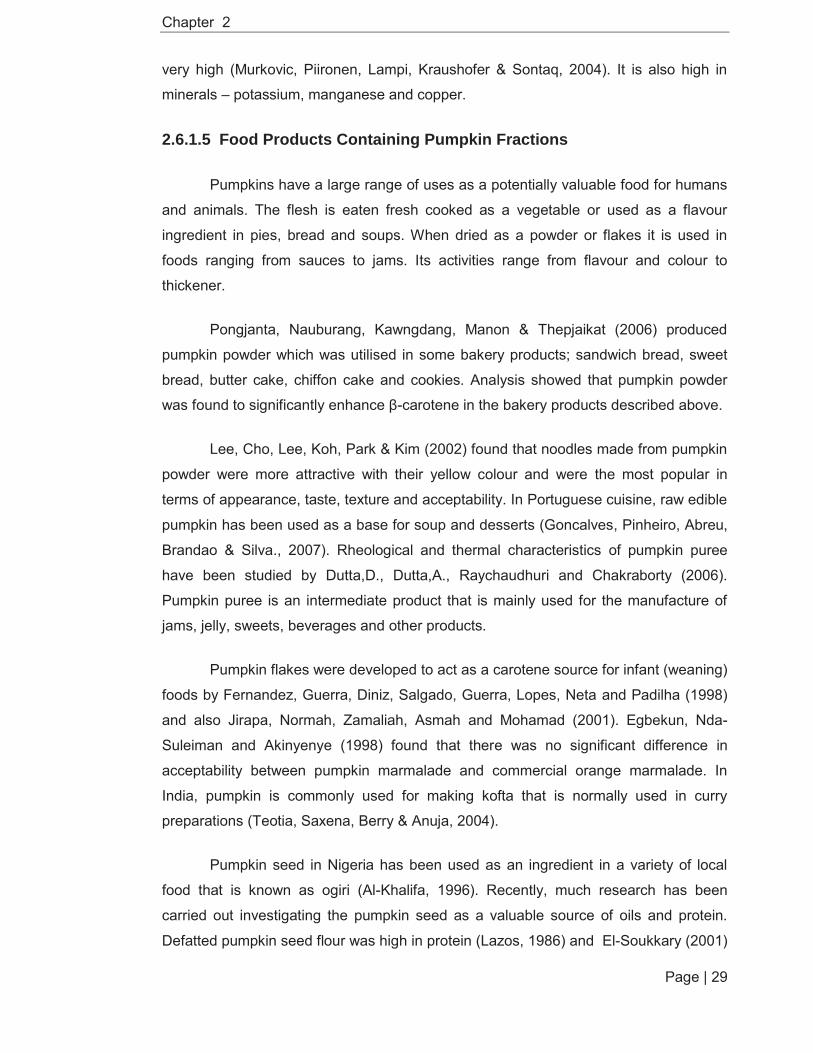
Chapter 2
Page | 29
very high (Murkovic, Piironen, Lampi, Kraushofer & Sontaq, 2004). It is also high in
minerals – potassium, manganese and copper.
2.6.1.5 Food Products Containing Pumpkin Fractions
Pumpkins have a large range of uses as a potentially valuable food for humans
and animals. The flesh is eaten fresh cooked as a vegetable or used as a flavour
ingredient in pies, bread and soups. When dried as a powder or flakes it is used in
foods ranging from sauces to jams. Its activities range from flavour and colour to
thickener.
Pongjanta, Nauburang, Kawngdang, Manon & Thepjaikat (2006) produced
pumpkin powder which was utilised in some bakery products; sandwich bread, sweet
bread, butter cake, chiffon cake and cookies. Analysis showed that pumpkin powder
was found to significantly enhance β-carotene in the bakery products described above.
Lee, Cho, Lee, Koh, Park & Kim (2002) found that noodles made from pumpkin
powder were more attractive with their yellow colour and were the most popular in
terms of appearance, taste, texture and acceptability. In Portuguese cuisine, raw edible
pumpkin has been used as a base for soup and desserts (Goncalves, Pinheiro, Abreu,
Brandao & Silva., 2007). Rheological and thermal characteristics of pumpkin puree
have been studied by Dutta,D., Dutta,A., Raychaudhuri and Chakraborty (2006).
Pumpkin puree is an intermediate product that is mainly used for the manufacture of
jams, jelly, sweets, beverages and other products.
Pumpkin flakes were developed to act as a carotene source for infant (weaning)
foods by Fernandez, Guerra, Diniz, Salgado, Guerra, Lopes, Neta and Padilha (1998)
and also Jirapa, Normah, Zamaliah, Asmah and Mohamad (2001). Egbekun, Nda-
Suleiman and Akinyenye (1998) found that there was no significant difference in
acceptability between pumpkin marmalade and commercial orange marmalade. In
India, pumpkin is commonly used for making kofta that is normally used in curry
preparations (Teotia, Saxena, Berry & Anuja, 2004).
Pumpkin seed in Nigeria has been used as an ingredient in a variety of local
food that is known as ogiri (Al-Khalifa, 1996). Recently, much research has been
carried out investigating the pumpkin seed as a valuable source of oils and protein.
Defatted pumpkin seed flour was high in protein (Lazos, 1986) and El-Soukkary (2001)
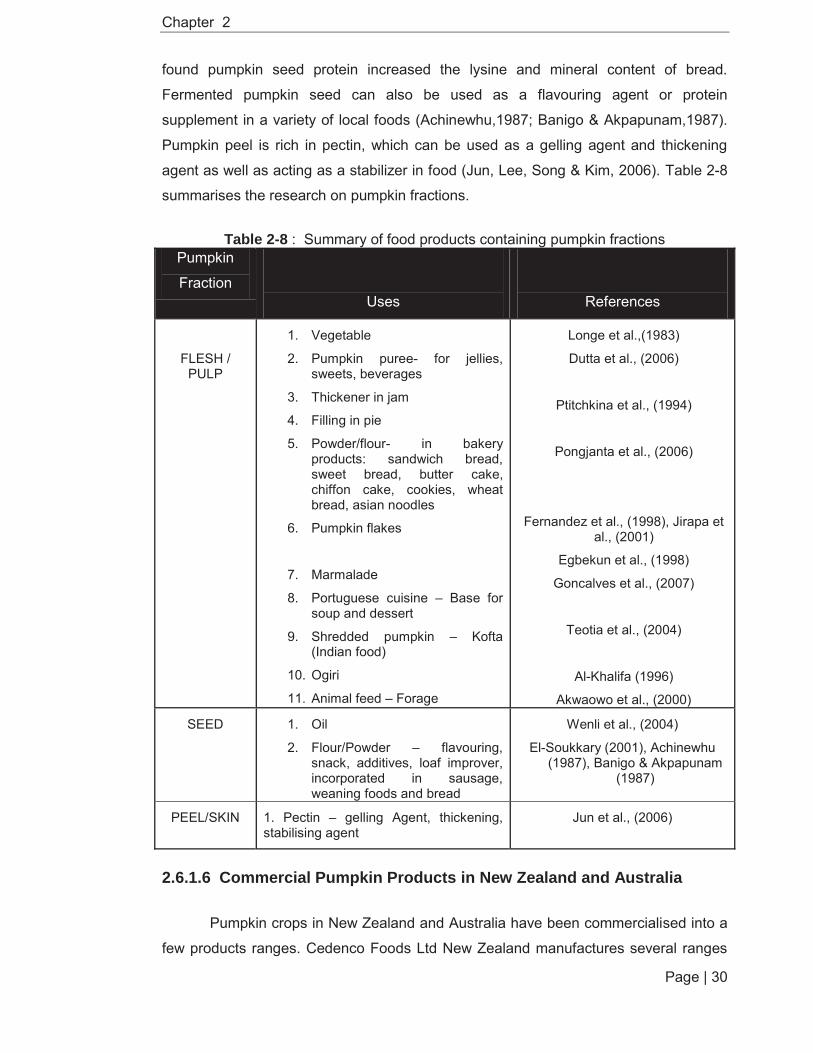
Chapter 2
Page | 30
found pumpkin seed protein increased the lysine and mineral content of bread.
Fermented pumpkin seed can also be used as a flavouring agent or protein
supplement in a variety of local foods (Achinewhu,1987; Banigo & Akpapunam,1987).
Pumpkin peel is rich in pectin, which can be used as a gelling agent and thickening
agent as well as acting as a stabilizer in food (Jun, Lee, Song & Kim, 2006). Table 2-8 summarises the research on pumpkin fractions.
Table 2-8 : Summary of food products containing pumpkin fractions Pumpkin
Fraction
Uses
References
FLESH / PULP
1. Vegetable
2. Pumpkin puree- for jellies, sweets, beverages
3. Thickener in jam
4. Filling in pie
5. Powder/flour- in bakery products: sandwich bread, sweet bread, butter cake, chiffon cake, cookies, wheat bread, asian noodles
6. Pumpkin flakes
7. Marmalade
8. Portuguese cuisine – Base for soup and dessert
9. Shredded pumpkin – Kofta (Indian food)
10. Ogiri
11. Animal feed – Forage
Longe et al.,(1983)
Dutta et al., (2006)
Ptitchkina et al., (1994)
Pongjanta et al., (2006)
Fernandez et al., (1998), Jirapa et al., (2001)
Egbekun et al., (1998)
Goncalves et al., (2007)
Teotia et al., (2004)
Al-Khalifa (1996)
Akwaowo et al., (2000)
SEED
1. Oil
2. Flour/Powder – flavouring, snack, additives, loaf improver, incorporated in sausage, weaning foods and bread
Wenli et al., (2004)
El-Soukkary (2001), Achinewhu (1987), Banigo & Akpapunam
(1987)
PEEL/SKIN
1. Pectin – gelling Agent, thickening, stabilising agent
Jun et al., (2006)
2.6.1.6 Commercial Pumpkin Products in New Zealand and Australia
Pumpkin crops in New Zealand and Australia have been commercialised into a
few products ranges. Cedenco Foods Ltd New Zealand manufactures several ranges

Chapter 2
Page | 31
of pumpkin products for the local and Japanese markets. The products are pumpkin
powder, frozen puree, individually quick frozen (IQF) pieces and IQF diced pieces.
Heinz Wattie’s Ltd New Zealand has produced baby food and soup made from
pumpkin. In the local supermarket, Woolworths and Countdown in New Zealand,
pumpkin seeds are sold as snack foods as Fresh Zone™ pumpkin seeds and Tasti™
pumpkin seeds. The Australian Pumpkin Seed Company in Australia produces and
sells pumpkin seed meal and pumpkin seed oils as a nutritional supplement, also
pumpkin seeds that are coated in either milk or dark chocolate in small packages. The
latest product is chili coated pumpkin seed. However, no expanded snacks are made
from pumpkin flour in either country.
2.6.2 Corn 2.6.2.1 Introduction
Maize or corn is the third most important crop worldwide and commonly has been used
as a base ingredient in the snack industry. In general, there are several uses of corn in
food as well as feed industry such as the production of flour, corn meal, grits,
sweeteners, starches, alcoholic beverages, cooking oil, tortilla, snacks, breakfast foods
and other products. Dry-milled corn meal is the most common primary ingredient used
in corn-based extruded snacks.
2.6.2.2 Corn Kernel Structure and Types
Corn kernel is referred to as a seed in the form of a single fruit coat comprised
of pericarp, endosperm and germ as shown in Figure 2-11 below.
Figure 2-11 : Components of corn kernel

Chapter 2
Page | 32
Table 2-9 : Kernel structures and their functions
Kernel Structure Characteristics and Functions
Pericarp (Hull/Bran) As a protector for internal parts
Thickness : 25 to 140μm
Dry kernel weight : 5-6%
Endosperm Represents majority of the kernel
Dry weight : 82-84%
Composed of 86-89% starch
granules
Embryo (Germ) Contains 81-85% oil
A dorman young corn plant
Dry weight : 10-12%
Table 2-9 above describes the parts of the corn kernel and their functions.
2.6.2.3 Corn for Food Industry Processing
Corn is processed into a wide variety of products. Basically most corn
processed for the food industry either by wet or dry milling. A summary of corn uses in
the food industry is shown in Table 2-10.
Table 2-10 : Summary of corn uses in food industry processing (Serna-Saldivar, Gomez, & Rooney, 2001)
Corn fraction Food Industry Processing and Applications
Whole Corn 1. Alkaline cooked products 2. Industrial tortilla production 3. Fried products- snacks 4. Nixtamalized dry masa flours 5. Hominy 6. Cornuts and parched products
Dry milled corn fraction 1. Flaking grits : cornflake production 2. Corn grits – brewing, distillation,
breakfast foods, extruded snacks, arepas
3. Corn meal 4. Corn flour
Chapter 2
Page | 33
2.6.2.4 Dry Milled Corn Fractions
Dry milling of corn produces the maximum output of clean grits, with less fat, fibre and
speck from the hilum. Table 2-11 shows the percentages of dry-milled fractions.
Table 2-11 : Typical yields of corn dry-milled fractions
Product Yield (%)
Flaking grits 12 Coarse grits 15 Regular grits 23 Coarse meal 3 Dusted meal 3 Flour 4 Oil 1 Hominy feed 35 Shrinkage 4
2.6.2.5 Dry Milled Corn Fractions for Extruded Snack Processing
The unique characteristics of corn resulted in it becoming the choice of most snack
processors for use in corn-based extruded snacks especially in terms of starch content
which has good expansion characteristics, it also has a definite flavour with a natural
yellow colour.
2.6.2.6 Nutritional Value of Dry Milled Corn Fractions
In general, typical dry-milled corn consists of nutrients as shown in Table 2-12 below.
Table 2-12 : Composition of dry-milled corn grits (Watson & Ramstad, 1987)
Component Percentage (%)
Moisture Protein Fat Crude fibre Ash Starch Other Polysaccharides
11.5 7.5 0.7 0.2 0.3 78 1.8

Chapter 2
Page | 34
2.6.3 Nutrient Components: Chemical and Nutritional Changes in Food During Extrusion
Extrusion - cooking has a great effect on chemical and nutritional changes in
nutrient components of raw materials. The raw materials may undergo many chemical
and structural transformations such as starch gelatinisation, protein denaturation,
complex formation between amylose and lipids and degradation reactions of vitamins
and pigments (Ilo & Berghofer.,1999).
Table 2-13 : Functional role of raw ingredient components
Component of raw ingredient Functional Properties
Starch, Protein Structure-forming materials
Protein, Starch, Fibre, Oils (Lipid) Dispersed-phase filling materials
Water, oils and fats Plasticisers and lubricants
2.6.3.1 Carbohydrate
Three main types of carbohydrate are affected by extrusion cooking: starch, fibre and
sugar.
2.6.3.1.1 Starch
Starch is the dominant polymer and plays an important role in the extruded products by
giving them expansion (Moraru & Kokini, 2003), binding and “mouthfeel”. Moreover
starch is the largest food component that provides the structure formation of the
extrudate products (Prabhat et al., 2010). In general the roles of starch in the extrusion
processing are density control, strength, shelf life improvement, moisture uptake,
flavour, water holding capacity and fat binding (Feldberg and Smith as cited in Harper,
1981).
Fundamentally starch is composed of amylose and amylopectin. Different types of food
may have different amounts of amylose and amylopectin. Amylose is a linear molecule
of glucose units linked by α-(1-4) bonds. Typically amylose consists of 100-1000
glucose units. Amylopectin is a branched molecule with linear regions of α-(1-4) linked
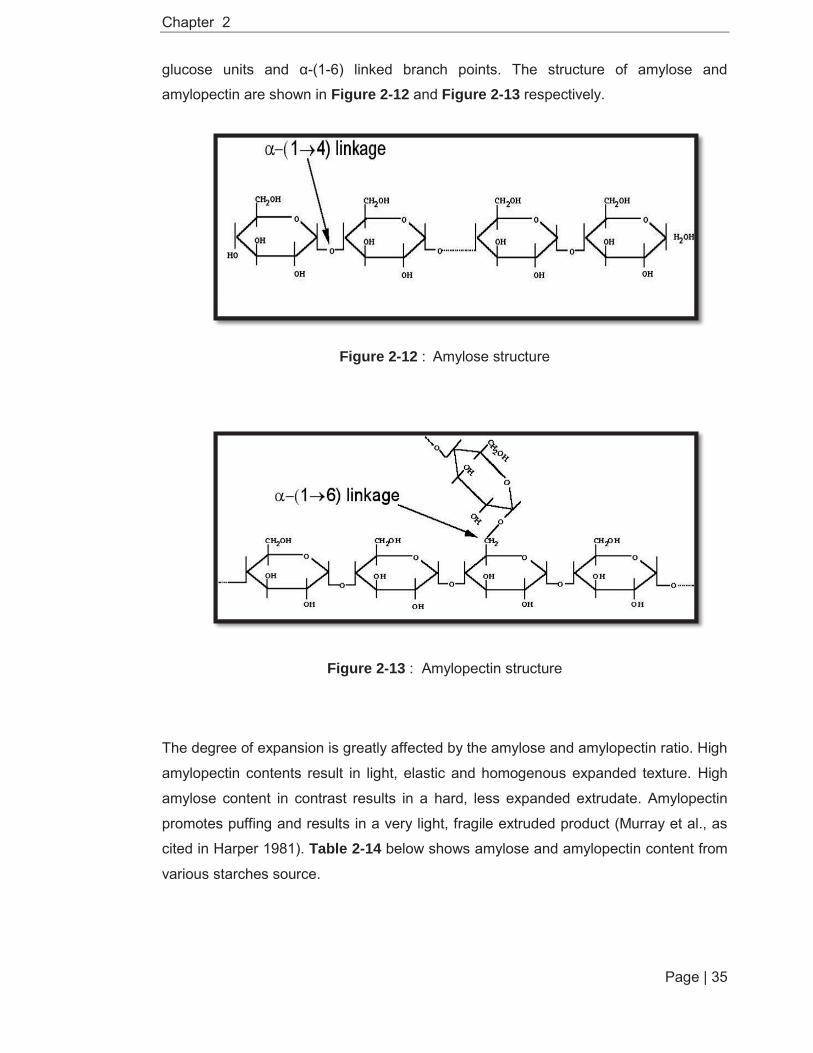
Chapter 2
Page | 35
glucose units and α-(1-6) linked branch points. The structure of amylose and
amylopectin are shown in Figure 2-12 and Figure 2-13 respectively.
Figure 2-12 : Amylose structure
Figure 2-13 : Amylopectin structure
The degree of expansion is greatly affected by the amylose and amylopectin ratio. High
amylopectin contents result in light, elastic and homogenous expanded texture. High
amylose content in contrast results in a hard, less expanded extrudate. Amylopectin
promotes puffing and results in a very light, fragile extruded product (Murray et al., as
cited in Harper 1981). Table 2-14 below shows amylose and amylopectin content from
various starches source.

Chapter 2
Page | 36
Table 2-14 : Amylose and amylopectin content of various starches (Harper, 1981)
2.6.3.1.2 Starch Structure Changes during Extrusion
Extrusion processing results in starch gelatinisation, partial starch hydrolysis and also
affects the pasting properties. In general, starch gelatinisation or cooking starch
through extrusion processing converts raw indigestible starch into digestible starch with
the presence of heat and moisture (Lawton, Henderson & Derlatka, 1972). Starch
granules irreversibly lose their regular shape and properties and become more soluble.
Gelatinisation temperature varies among ingredients, such as maize 62 -80 C, wheat
52 -82 C, tapioca 52 -65 C and potato 58 -65 C. A part from the extrusion process,
some of the starch also undergoes hydrolysis. Changes to the starch granules affect
the final viscosity of the starch.
2.6.3.1.3 Fibre
Fibre or dietary fibre is referred to as the non-digestible components of plant cell walls,
and consists of a group of polysaccharides such as pectin, cellulose, hemi-cellulose,
mucilage, lignin and other substances i.e cutin, suberin and waxes (Devries, Prosky, Li
& Cho, 1999). It can be categorised into two types; soluble (pectin, glucan, soluble
pentosans) and insoluble dietary fibre (cellulose, lignin, insoluble pentosans,
protopectin). Huber (2011) stated that fibre is chemically resistant to heat during
extrusion processing which may affect the expansion of the extruded product. This was
supported by Mendonca, Grossmann and Verhe, (2000) who found that fibre content
in the form of bran results in premature rupture of gas cells, thus reducing overall
Starches Percentage (%)
Amylose Amylopectin
Standard maize 24 76
Waxy maize 0.8 99.2
High amylose maize 70 30
Potato 20 80
Rice 18.5 81.5
Tapioca 16.7 83.3
Wheat 25 75

Chapter 2
Page | 37
expansion. Fibrous fragments disrupt the starchy film of air cell walls, reducing their
formation and swelling, and altering air cell size. As pumpkin was found to have high
pectin content it may be expected to affect the physical output of the expanded snack
product.
2.6.3.2 Protein
Protein may become denatured and change from soluble to insoluble forms during the
extrusion process. The denaturation process occurs at 60-70 C and as a result will
become less functional and lead to reduced expansion of final extrudates.
2.6.3.3 Lipids
Materials with a high fat content may not extruded. Riaz (2000) stated that a lipid
content of more than 5-6% will impair the extruder performance by decreasing the
torque value. As a consequence this will contribute to poor product expansion.

Chapter 3
Page | 38
Chapter 3: Characterisation and Production of Pumpkin Flour 3.1 Introduction
This preliminary work will focus on exploring and processing of fresh pumpkin into flour.
Two types of pumpkin crown and buttercup were used with two drying methods,
convection oven and freeze drying. The objectives of this work were to produce
pumpkin flour from the entire pumpkin fractions such as peel, pulp(rind), flesh and
seed. Then use the pumpkin flour as an ingredient in making the expanded snack
products. The proximate composition and colour value of the pumpkin flour were
determined. The results from this work were compared with commercial pumpkin flour
made by Cedenco Foods Ltd.
3.2 Materials and Methods 3.2.1 Raw Materials
Mature crown and buttercup pumpkin (Cucurbita maxima) were purchased fresh from
the local market. Pumpkin flour was supplied by Cedenco Foods Ltd, Gisborne New
Zealand. Corn grits (Spec 220) were supplied by Corson Grain Ltd Gisborne, New
Zealand.
3.2.2 Sample Preparation
Pumpkins were diced and separated into four fractions; peel, flesh, pulp(rind) and
seed. Then all fractions were soaked in 0.1% citric acid for 30 minutes and drained.
The purpose of soaking in citric acid was to prevent unfavourable changes in pumpkin
colour and flavour deterioration (Konopacka, 2006). Pumpkin flour was produced using
two (2) methods of drying, convection oven and freeze drying as described in sections 3.2.2.1 and 3.2.2.2 below.
3.2.2.1 Pumpkin Flour Production Using Convection Oven
All four fractions of pumpkin (peel, flesh, pulp and seed) were transferred to wire-net
trays and dried in the hot air drier for 24 hours at 65 C and 40% humidity. The dried
fractions were ground into flour using a grinder and vacuum packed for further use.

Chapter 3
Page | 39
3.2.2.2 Pumpkin Flour Production Using Freeze Drying
The samples were freeze dried using a pilot plant freeze drier (Cuddon FD 18LT). The
samples were frozen at -30ºC overnight prior to freeze-drying. The samples then were
placed between metal sheets, which were heated at 25ºC at a chamber pressure of
0.1mbar for 3-4 days.
Pumpkins were cut and separated into Peel, Pulp, Flesh, Seed
Wash and Soak in 0.1% Citric Acid, (30 mins)
Drain
Cabinet Drying Place on wire-net trays Dry (Cabinet dry, 60 -65 C, 24 hrs)
Or Freeze dried (25 C, 0.1mbar, 3 to 4 days)
Grind
Pumpkin Flour
Figure 3-1: The production process for pumpkin flour
3.2.3 Proximate Analysis
Moisture, ash (AOAC method No.945.18), fat (AOAC method No. 945.16) and crude
protein (AOAC method No. 920.53) were determined by the AOAC method (1998). A
factor of 6.25 was used for conversion of nitrogen to crude protein. Carbohydrates
content was calculated by subtracting the content of all the measured components (i.e.
moisture, ash, crude fat and crude protein) from total mass. All measurements were
expressed on a dry matter basis and reported as a mean (± S.D.) of triplicate analysis.
3.2.4 Colour Measurement
The Minolta Chroma meter (CR-200) was used to determine the Hunter L*, a* and b*
values of the samples. Ground samples were placed into small petri dishes and
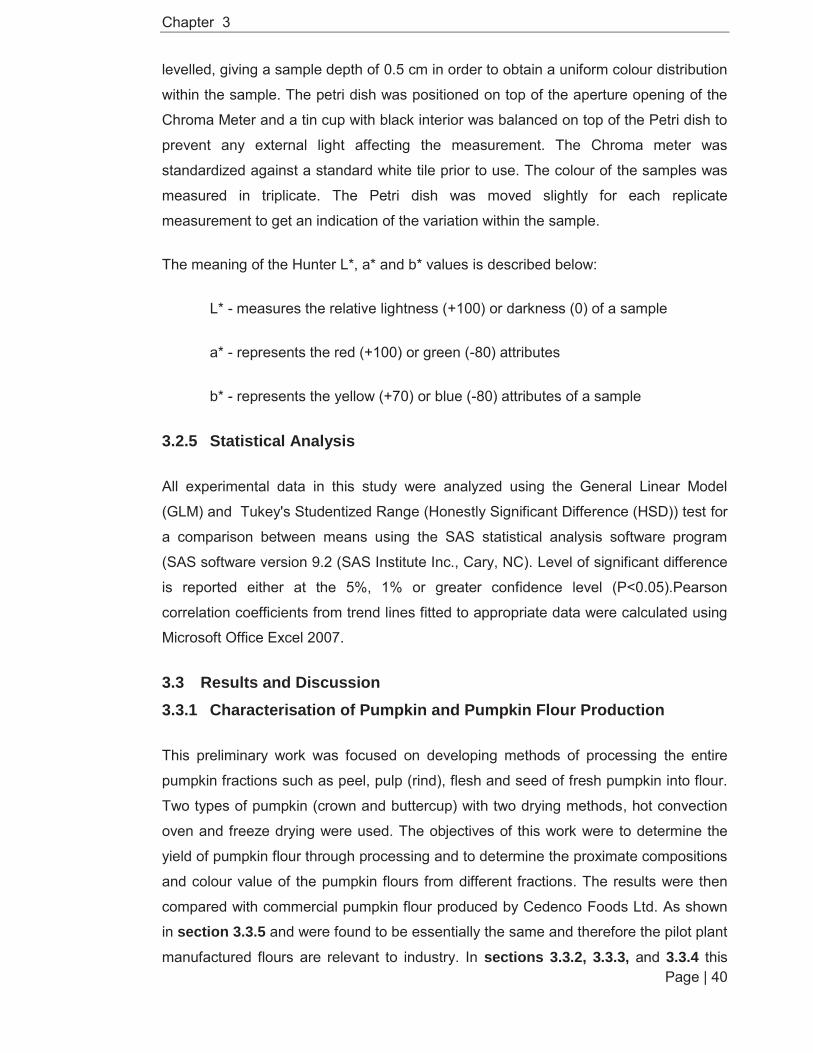
Chapter 3
Page | 40
levelled, giving a sample depth of 0.5 cm in order to obtain a uniform colour distribution
within the sample. The petri dish was positioned on top of the aperture opening of the
Chroma Meter and a tin cup with black interior was balanced on top of the Petri dish to
prevent any external light affecting the measurement. The Chroma meter was
standardized against a standard white tile prior to use. The colour of the samples was
measured in triplicate. The Petri dish was moved slightly for each replicate
measurement to get an indication of the variation within the sample.
The meaning of the Hunter L*, a* and b* values is described below:
L* - measures the relative lightness (+100) or darkness (0) of a sample
a* - represents the red (+100) or green (-80) attributes
b* - represents the yellow (+70) or blue (-80) attributes of a sample
3.2.5 Statistical Analysis
All experimental data in this study were analyzed using the General Linear Model
(GLM) and Tukey's Studentized Range (Honestly Significant Difference (HSD)) test for
a comparison between means using the SAS statistical analysis software program
(SAS software version 9.2 (SAS Institute Inc., Cary, NC). Level of significant difference
is reported either at the 5%, 1% or greater confidence level (P<0.05).Pearson
correlation coefficients from trend lines fitted to appropriate data were calculated using
Microsoft Office Excel 2007.
3.3 Results and Discussion 3.3.1 Characterisation of Pumpkin and Pumpkin Flour Production
This preliminary work was focused on developing methods of processing the entire
pumpkin fractions such as peel, pulp (rind), flesh and seed of fresh pumpkin into flour.
Two types of pumpkin (crown and buttercup) with two drying methods, hot convection
oven and freeze drying were used. The objectives of this work were to determine the
yield of pumpkin flour through processing and to determine the proximate compositions
and colour value of the pumpkin flours from different fractions. The results were then
compared with commercial pumpkin flour produced by Cedenco Foods Ltd. As shown
in section 3.3.5 and were found to be essentially the same and therefore the pilot plant
manufactured flours are relevant to industry. In sections 3.3.2, 3.3.3, and 3.3.4 this
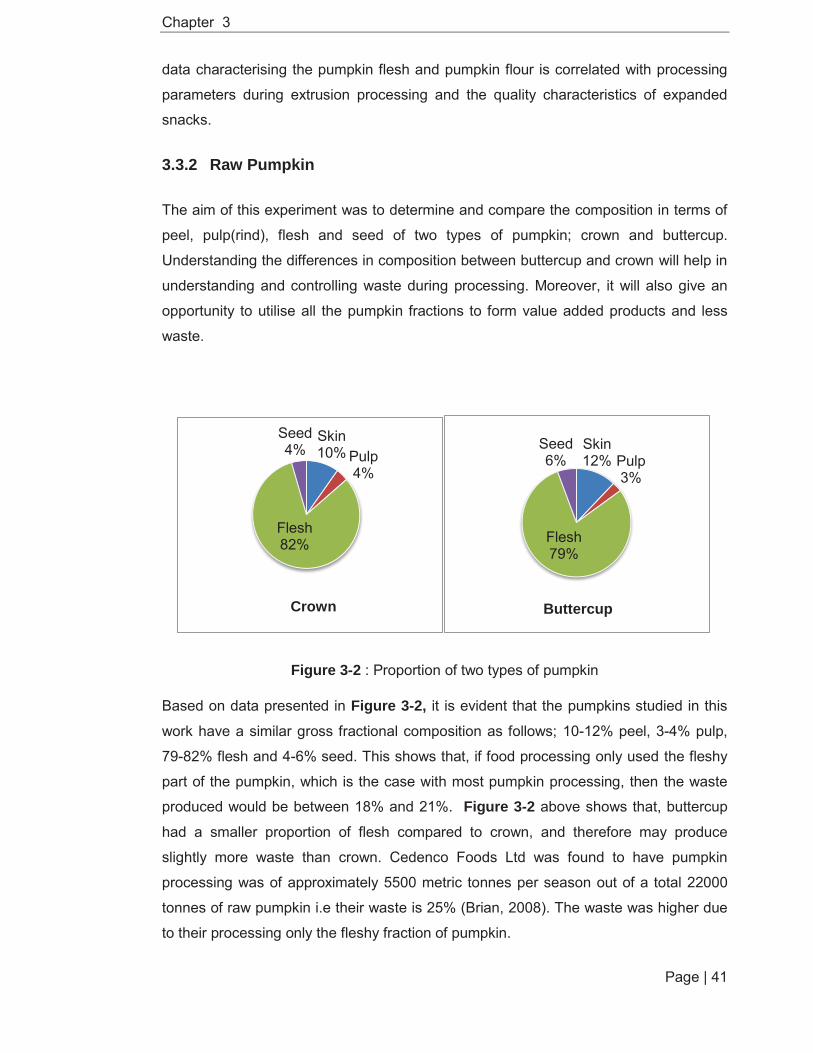
Chapter 3
Page | 41
data characterising the pumpkin flesh and pumpkin flour is correlated with processing
parameters during extrusion processing and the quality characteristics of expanded
snacks.
3.3.2 Raw Pumpkin
The aim of this experiment was to determine and compare the composition in terms of
peel, pulp(rind), flesh and seed of two types of pumpkin; crown and buttercup.
Understanding the differences in composition between buttercup and crown will help in
understanding and controlling waste during processing. Moreover, it will also give an
opportunity to utilise all the pumpkin fractions to form value added products and less
waste.
Figure 3-2 : Proportion of two types of pumpkin
Based on data presented in Figure 3-2, it is evident that the pumpkins studied in this
work have a similar gross fractional composition as follows; 10-12% peel, 3-4% pulp,
79-82% flesh and 4-6% seed. This shows that, if food processing only used the fleshy
part of the pumpkin, which is the case with most pumpkin processing, then the waste
produced would be between 18% and 21%. Figure 3-2 above shows that, buttercup
had a smaller proportion of flesh compared to crown, and therefore may produce
slightly more waste than crown. Cedenco Foods Ltd was found to have pumpkin
processing was of approximately 5500 metric tonnes per season out of a total 22000
tonnes of raw pumpkin i.e their waste is 25% (Brian, 2008). The waste was higher due
to their processing only the fleshy fraction of pumpkin.
Skin 10% Pulp
4%
Flesh 82%
Seed 4%
Crown
Skin 12% Pulp
3%
Flesh 79%
Seed 6%
Buttercup

Chapter 3
Page | 42
The amount of waste generated from pumpkin processing, however, is not merely the
sum of the pumpkin fractions that are intentionally not used. Additionally the separation
processes involved in isolating the desired fraction (i.e. the flesh) are not 100%
efficient. The peeling process in most food industries normally involves using abrasive
peeling and steam peeling (Emadi, Kosse & Yarlagadda, 2007). In this study the
peeling process was manually done using knives, this may affect the accuracy of the
recovery percentage achieved and if this applied to the industry it may cost and
expensive labour. In this study the recovery yield given is based on an estimate, the
skin was difficult to peel and some of the flesh remained on the peel.
3.3.3 Pumpkin Flour Production
Sixteen samples of pumpkin flour were produced via the method described in section 3.2.2. Four fractions (peel, pulp, flesh and seed) of two types of pumpkin (crown and
buttercup) were dried using either freeze drying or convection oven. The relative
percentages on a dry weight basis of pumpkin flour produced from four different
fractions of two types of pumpkin using different types of drying methods are presented
in Figure 3-3 below. For both types of pumpkin, flour made from seed fractions using
freeze drying gave the highest yield of flour (52.15% (crown), 47.08% (buttercup)
followed by peel, flesh and pulp as compared to convection oven. Pulp fractions were
difficult to separate and gave the lowest yield of flour for both types of pumpkin and
both types of drying methods. Due to the difficulties of isolating pulp fractions further
physicochemical analysis focused only upon the three fractions (peel, flesh, and seed)
of each variety of pumpkin for both methods of drying.
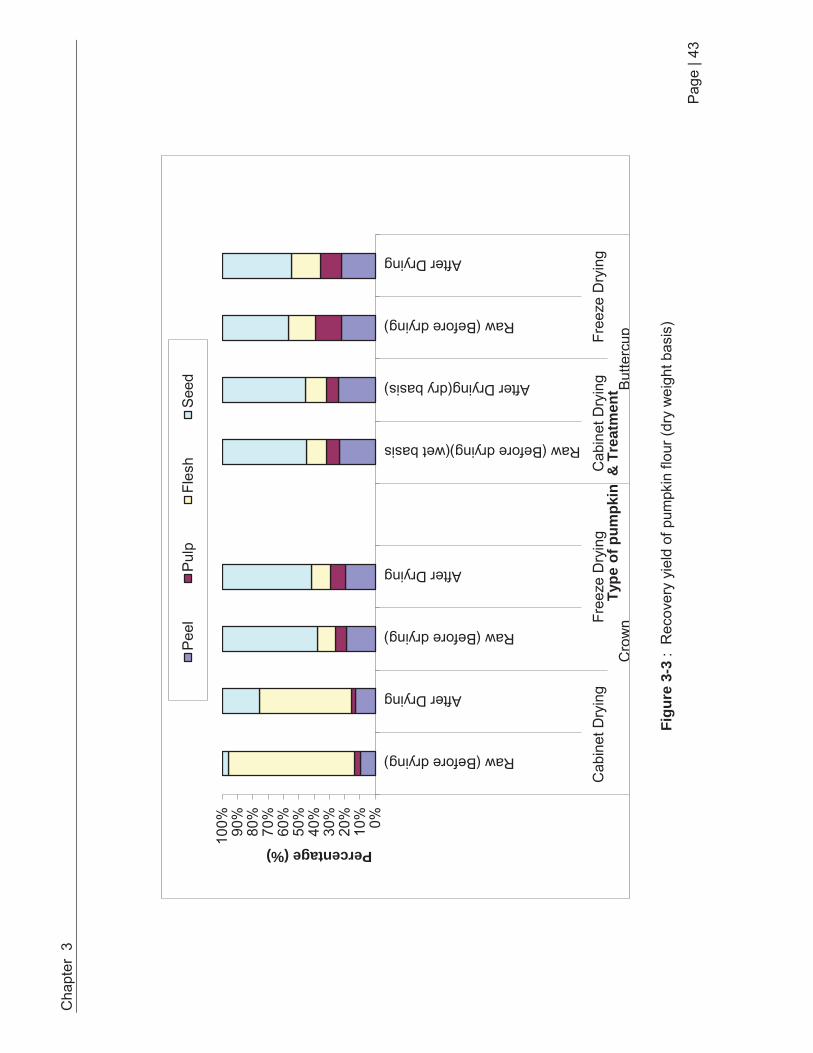
Cha
pter
3
Page
| 43
Figu
re 3
-3 :
Rec
over
y yi
eld
of p
umpk
in fl
our (
dry
wei
ght b
asis
)
0%10%
20%
30%
40%
50%
60%
70%
80%
90%
100%
Raw (Before drying)
After Drying
Raw (Before drying)
After Drying
Raw (Before drying)(wet basis
After Drying(dry basis)
Raw (Before drying)
After Drying
Cab
inet
Dry
ing
Free
ze D
ryin
gC
abin
et D
ryin
gFr
eeze
Dry
ing
Cro
wn
Butte
rcup
Percentage (%)
Type
of p
umpk
in &
Tre
atm
ent
Peel
Pulp
Fles
hSe
ed

Chapter 3
Page | 44
3.3.4 Proximate Composition of Raw Pumpkin and Pumpkin Flour
The proximate composition of moisture content, ash, protein, fat and carbohydrate of
the pumpkin flour from three fractions (peel, flesh, and seed) of two types of pumpkin
(crown and buttercup) with two different drying methods are presented in Table 3-1.
Significant differences (P<0.05) were found in a number of areas in terms of type of
pumpkin, drying method and fractions. For both varieties, drying methods showed a
significant effect (P<0.05) on the moisture, ash, protein, fat and carbohydrate content.
Flour produced by freeze drying for both varieties showed the lowest value of moisture
content (2.63 – 14.99%).
The preliminary result in this study, revealed that the nutritional values of pumpkin flour
produced by freeze drying compared with convection oven drying were not significantly
different. However, Que,Mao,Fang and Wu (2008) stated that freeze drying is the most
effective way of protecting against loss of nutrients during the drying process. These
observations need to be further investigated in terms of method of flour preparation,
equipment used and a storage study.
Commercial pumpkin flour (Table 3-2) produced by Cedenco Foods Ltd that has been
processed by drum drying was found to have a lower moisture content (1.8%) as
compared to convection oven drying (9.44 – 14.43%) and freeze drying (4.91% -
14.99%). Overall other nutrient contents such as protein, carbohydrate and ash were
found to vary among fractions but did not much differed from commercial pumpkin
flour.
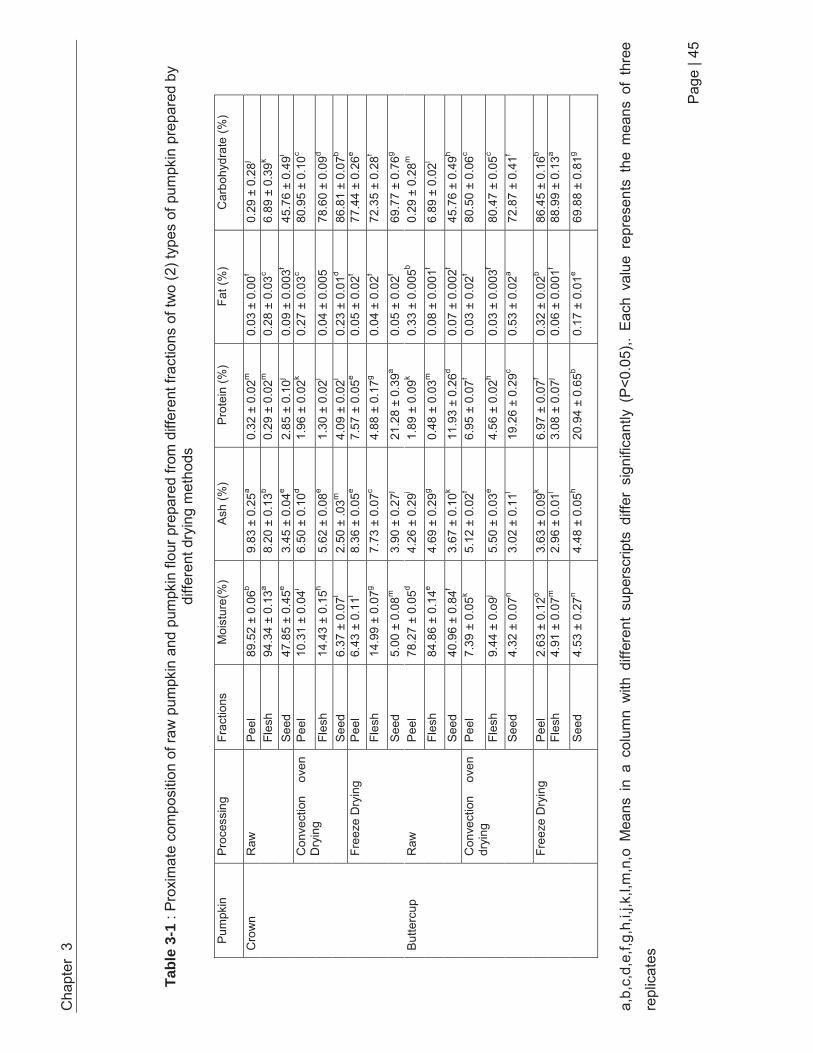
Cha
pter
3
Page
| 45
Tabl
e 3-
1 : P
roxi
mat
e co
mpo
sitio
n of
raw
pum
pkin
and
pum
pkin
flou
r pre
pare
d fro
m d
iffer
ent f
ract
ions
of t
wo
(2) t
ypes
of p
umpk
in p
repa
red
by
diffe
rent
dry
ing
met
hods
Pum
pkin
P
roce
ssin
g Fr
actio
ns
Moi
stur
e(%
) A
sh (%
) P
rote
in (%
) Fa
t (%
) C
arbo
hydr
ate
(%)
Cro
wn
Raw
Pee
l 89
.52
± 0.
06b
9.83
± 0
.25a
0.32
± 0
.02m
0.
03 ±
0.0
0f 0.
29 ±
0.2
8j Fl
esh
94.3
4 ±
0.13
a 8.
20 ±
0.1
3b 0.
29 ±
0.0
2m
0.28
± 0
.03c
6.89
± 0
.39k
See
d 47
.85
± 0.
45e
3.45
± 0
.04e
2.85
± 0
.10j
0.09
± 0
.003
f 45
.76
± 0.
49i
Con
vect
ion
oven
D
ryin
g P
eel
10.3
1 ±
0.04
i 6.
50 ±
0.1
0d 1.
96 ±
0.0
2k 0.
27 ±
0.0
3c 80
.95
± 0.
10c
Fles
h 14
.43
± 0.
15h
5.62
± 0
.08e
1.30
± 0
.02l
0.04
± 0
.005
78
.60
± 0.
09d
See
d 6.
37 ±
0.0
7l 2.
50 ±
.03m
4.
09 ±
0.0
2i 0.
23 ±
0.0
1d 86
.81
± 0.
07b
Free
ze D
ryin
g
Pee
l 6.
43 ±
0.1
1l 8.
36 ±
0.0
5e 7.
57 ±
0.0
5e 0.
05 ±
0.0
2f 77
.44
± 0.
26e
Fles
h 14
.99
± 0.
07g
7.73
± 0
.07c
4.88
± 0
.17g
0.04
± 0
.02f
72.3
5 ±
0.28
f
See
d 5.
00 ±
0.0
8m
3.90
± 0
.27j
21.2
8 ±
0.39
a 0.
05 ±
0.0
2f 69
.77
± 0.
76g
But
terc
up
Raw
Pee
l 78
.27
± 0.
05d
4.26
± 0
.29i
1.89
± 0
.09k
0.33
± 0
.005
b 0.
29 ±
0.2
8m
Fles
h 84
.86
± 0.
14e
4.69
± 0
.29g
0.48
± 0
.03m
0.
08 ±
0.0
01f
6.89
± 0
.02l
See
d 40
.96
± 0.
84f
3.67
± 0
.10k
11.9
3 ±
0.26
d 0.
07 ±
0.0
02f
45.7
6 ±
0.49
h C
onve
ctio
n ov
en
dryi
ng
Pee
l 7.
39 ±
0.0
5k 5.
12 ±
0.0
2f 6.
95 ±
0.0
7f 0.
03 ±
0.0
2f 80
.50
± 0.
06c
Fles
h 9.
44 ±
0.o
9j 5.
50 ±
0.0
3e 4.
56 ±
0.0
2h 0.
03 ±
0.0
03f
80.4
7 ±
0.05
c S
eed
4.32
± 0
.07n
3.02
± 0
.11l
19.2
6 ±
0.29
c 0.
53 ±
0.0
2a 72
.87
± 0.
41f
Free
ze D
ryin
g
Pee
l 2.
63 ±
0.1
2o 3.
63 ±
0.0
9k 6.
97 ±
0.0
7f 0.
32 ±
0.0
2b 86
.45
± 0.
16b
Fles
h 4.
91 ±
0.0
7m
2.96
± 0
.01l
3.08
± 0
.07j
0.06
± 0
.001
f 88
.99
± 0.
13a
See
d 4.
53 ±
0.2
7n 4.
48 ±
0.0
5h 20
.94
± 0.
65b
0.17
± 0
.01e
69.8
8 ±
0.81
g
a,b,
c,d,
e,f,g
,h,i,
j,k,l,
m,n
,o M
eans
in
a co
lum
n w
ith d
iffer
ent
supe
rscr
ipts
diff
er s
igni
fican
tly (
P<0
.05)
,. E
ach
valu
e re
pres
ents
the
mea
ns o
f th
ree
repl
icat
es
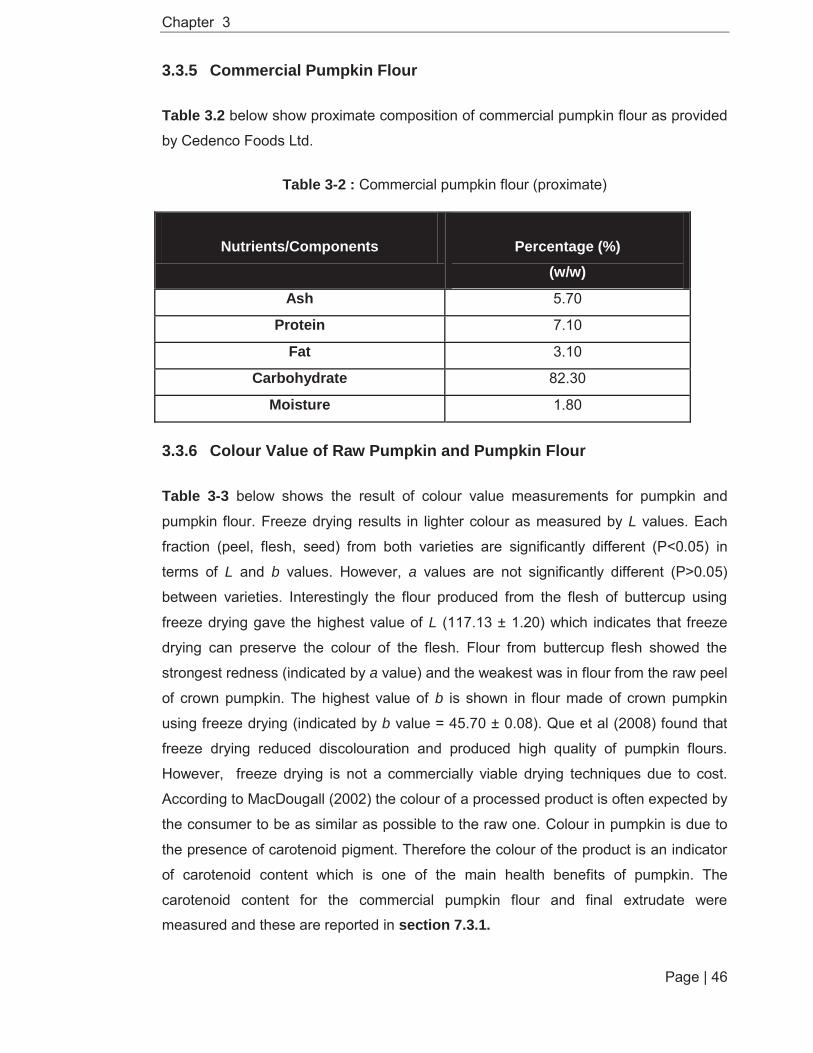
Chapter 3
Page | 46
3.3.5 Commercial Pumpkin Flour
Table 3.2 below show proximate composition of commercial pumpkin flour as provided
by Cedenco Foods Ltd.
Table 3-2 : Commercial pumpkin flour (proximate)
Nutrients/Components
Percentage (%)
(w/w)
Ash 5.70
Protein 7.10
Fat 3.10
Carbohydrate 82.30
Moisture 1.80
3.3.6 Colour Value of Raw Pumpkin and Pumpkin Flour
Table 3-3 below shows the result of colour value measurements for pumpkin and
pumpkin flour. Freeze drying results in lighter colour as measured by L values. Each
fraction (peel, flesh, seed) from both varieties are significantly different (P<0.05) in
terms of L and b values. However, a values are not significantly different (P>0.05)
between varieties. Interestingly the flour produced from the flesh of buttercup using
freeze drying gave the highest value of L (117.13 ± 1.20) which indicates that freeze
drying can preserve the colour of the flesh. Flour from buttercup flesh showed the
strongest redness (indicated by a value) and the weakest was in flour from the raw peel
of crown pumpkin. The highest value of b is shown in flour made of crown pumpkin
using freeze drying (indicated by b value = 45.70 ± 0.08). Que et al (2008) found that
freeze drying reduced discolouration and produced high quality of pumpkin flours.
However, freeze drying is not a commercially viable drying techniques due to cost.
According to MacDougall (2002) the colour of a processed product is often expected by
the consumer to be as similar as possible to the raw one. Colour in pumpkin is due to
the presence of carotenoid pigment. Therefore the colour of the product is an indicator
of carotenoid content which is one of the main health benefits of pumpkin. The
carotenoid content for the commercial pumpkin flour and final extrudate were
measured and these are reported in section 7.3.1.

Chapter 3
Page | 47
Table 3-3 : Colour Value (L*a*b*) of raw pumpkin and pumpkin flour (peel, flesh, seed) from two (2) cultivars using different methods of drying
Pumpkin Processing Fractions L a b
Crown
Raw
Peel 53.42 ± 0.27l -0.55 ± 0.36e 24.91 ± 1.61f
Flesh 67.94 ± 2.69g 12.29 ± 1.79b 42.75 ± 3.36b
Seed 62.14 ± 0.91i 3.42 ± 1.05d 19.16 ± 1.73g
Convection
Oven Drying
Peel 65.00 ± 0.33h -4.19 ± 0.24f 29.42 ± 0.50e
Flesh 75.84 ± 1.07f 5.77 ± 0.44c 37.76 ± 0.55c
Seed 67.18 ± 0.80g -0.63 ± 0.49e 22.33 ± 0.27g
Freeze
Drying
Peel 83.79 ± 0.53e -2.55 ± 0.29e 39.96 ± 0.11c
Flesh 84.55 ± 0.40e 4.86 ± 0.15c 45.70 ± 0.08a
Seed 66.40 ± 0.73g -1.37 ± 0.48e 25.33 ± 1.15f
Buttercup Raw
Peel 50.58 ± 1.06m 2.35 ± 0.51d 20.66 ± 1.78g
Flesh 57.85 ± 2.25k 14.03 ± 1.75a 35.13 ± 5.04d
Seed 60.05 ± 1.12j 3.00 ± 0.38d 21.69 ± 0.91g
Convection
Oven drying
Peel 94.40 ± 1.38c 0.22 ± 0.03e 2.20 ± 0.15c
Flesh 109.92 ± 0.47b 2.88 ± 0.12d 10.65 ± 0.39h
Seed 91.49 ± 0.85d 3.42 ± 0.17d -1.54 ± 0.93j
Freeze
Drying
Peel 108.99 ± 0.66b -10.93 ± 0.29g -1.77 ± 0.27j
Flesh 117.13 ± 1.20a -2.54 ± 0.23e 10.95 ± 1.42h
Seed 91.09 ± 0.05d -1.72 ± 0.29e -1.56 ± 0.52j
*a, b,c,d,e,f,g,h,I,j,k,l,m Means in a column with different superscripts differ significantly
(P<0.05)
While, colour values of pumpkin flour supplied by Cedenco Foods Ltd are as follows; L
value 76.86, a value +2.07 and b value +33.84.

Chapter 3
Page | 48
3.4 Conclusion
These results show that pumpkin flour can be produced from three (3) fractions
(peel, flesh and seed) of pumpkin. Pumpkin flour from the flesh of the pumpkin were
found to have similar properties to the commercial pumpkin flour in terms of proximate
compositions and colour values.
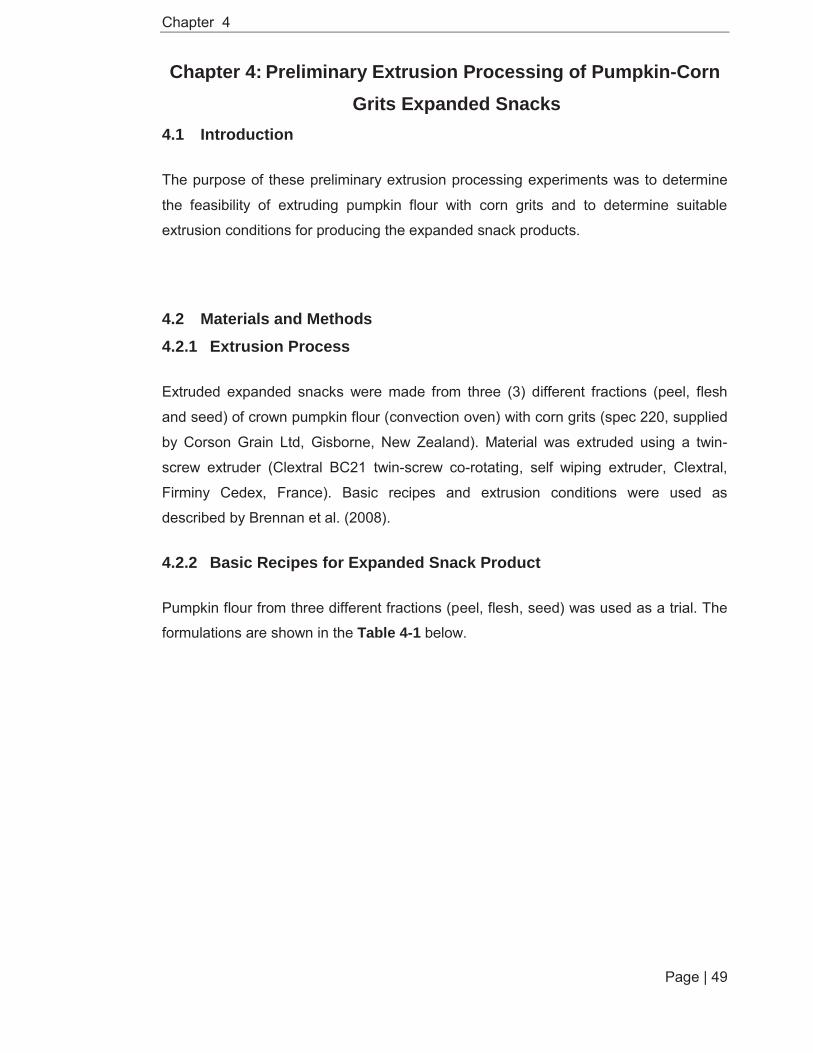
Chapter 4
Page | 49
Chapter 4: Preliminary Extrusion Processing of Pumpkin-Corn Grits Expanded Snacks
4.1 Introduction
The purpose of these preliminary extrusion processing experiments was to determine
the feasibility of extruding pumpkin flour with corn grits and to determine suitable
extrusion conditions for producing the expanded snack products.
4.2 Materials and Methods 4.2.1 Extrusion Process
Extruded expanded snacks were made from three (3) different fractions (peel, flesh
and seed) of crown pumpkin flour (convection oven) with corn grits (spec 220, supplied
by Corson Grain Ltd, Gisborne, New Zealand). Material was extruded using a twin-
screw extruder (Clextral BC21 twin-screw co-rotating, self wiping extruder, Clextral,
Firminy Cedex, France). Basic recipes and extrusion conditions were used as
described by Brennan et al. (2008).
4.2.2 Basic Recipes for Expanded Snack Product
Pumpkin flour from three different fractions (peel, flesh, seed) was used as a trial. The
formulations are shown in the Table 4-1 below.
Chapter 4
Page | 50
Table 4-1 : Basic recipes for extruding pumpkin with corn grit
(Brennan et al., 2008)
4.2.3 Extrusion Conditions
Table 4-2 below shows the extrusion conditions. The torque, pressure thrust, pressure
die, power consumption and die temperature were recorded when stable during the
extrusion process.
Sample
Pumpkin Flour (g)
Corn Grits (g)
Control 0 1000
Peel 100 900
300 700
500 500
Flesh 100 900
300 700
500 500
Seed 100 900
300 700
500 500

Chapter 4
Page | 51
Table 4-2 : Extrusion conditions (Brennan et al., 2008)
Parameter
Internal barrel width 46 mm
Height 25 mm
Screw Diameter 24.7 mm
Temperature of the barrel 40ºC,60ºC,80ºC,100ºC,140ºC, 160ºC and 180ºC
Screw speed 315 rpm
Feed rate 6.75 kg/h
Water rate 0.29 L/h
Die diameter 3 mm
Screw Configuration A: Forward, 13mm pitch, 50mm length B: Forward, 10mm pitch, 50mm length C: Forward, 7mm pitch, 50mm length D: Forward, 7mm pitch, 25mm length
Cutter set 200 rpm
4.2.4 Product Characteristics 4.2.4.1 Colour Measurement
Colour measurements of samples were carried as described in section 3.2.4.
4.2.4.2 Expansion Ratio
Expansion ratio (%) is measured as the radial expansion calculated as the ratio of the
diameter of the extruded snack to die diameter multiplied by 100. The diameter of 20
extruded snack pellets was taken at random from each product made and were
measured with a digital caliper (Mitutoyo: Tokyo, Japan) and the average diameter
recorded.
Percentage expansion of the samples was determined using the formula (1) below:

Chapter 4
Page | 52
4.2.4.3 Product Density
Bulk Density (kg/L) was measured from the weight of a standard volume of product
and True Density was determined from the weight of the extrusions and the volume of
poppy seeds displaced. The method is described by Brennan, M.A., Merts, Monro,
Woolnough and Brennan,C.S(2008). Bulk density and true density were calculated
using equations (2) and (3) respectively as shown below:
…………………… (2)
………………….(3)
4.2.4.4 Product Texture
Hardness was measured using an Instron Universal testing machine (Instron model
4502 with a 1KN load cell) fitted with a Kramer Shear cell. The Kramer cell had a lower
fixed cell of 67 × 64 × 50 mm and an upper moving component fitted with three blades
each 125 × 70 × 3 mm. Before measuring hardness, the samples were dried overnight
in a forced air oven at 35ºC to achieve a water activity (Aw) of 0.2-0.4. The lower cell
was filled to 40mm depth with the extruded snacks and the test begun. The crosshead
speed of the blades was 180mm/min with a compression limit of 50mm. The test was
carried out at room temperature (25 C). Hardness was determined as the force
recorded as the probe moved through the sample and transitioned from compression
packing to crushing. An example of this is given (Figure 4-1) which shows the
relationship between force and vertical distance. Triplicates of each sample were
measured and the average was calculated.
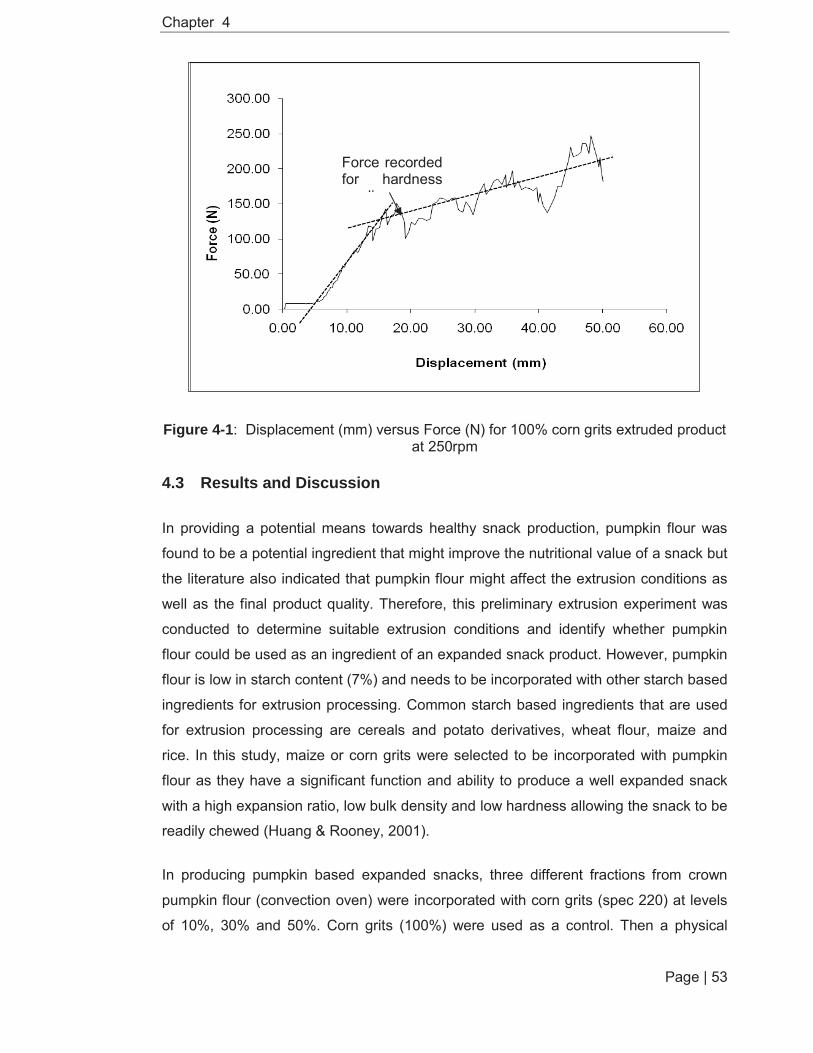
Chapter 4
Page | 53
Figure 4-1: Displacement (mm) versus Force (N) for 100% corn grits extruded product at 250rpm
4.3 Results and Discussion
In providing a potential means towards healthy snack production, pumpkin flour was
found to be a potential ingredient that might improve the nutritional value of a snack but
the literature also indicated that pumpkin flour might affect the extrusion conditions as
well as the final product quality. Therefore, this preliminary extrusion experiment was
conducted to determine suitable extrusion conditions and identify whether pumpkin
flour could be used as an ingredient of an expanded snack product. However, pumpkin
flour is low in starch content (7%) and needs to be incorporated with other starch based
ingredients for extrusion processing. Common starch based ingredients that are used
for extrusion processing are cereals and potato derivatives, wheat flour, maize and
rice. In this study, maize or corn grits were selected to be incorporated with pumpkin
flour as they have a significant function and ability to produce a well expanded snack
with a high expansion ratio, low bulk density and low hardness allowing the snack to be
readily chewed (Huang & Rooney, 2001).
In producing pumpkin based expanded snacks, three different fractions from crown
pumpkin flour (convection oven) were incorporated with corn grits (spec 220) at levels
of 10%, 30% and 50%. Corn grits (100%) were used as a control. Then a physical
Force recorded for hardness
di

Chapter 4
Page | 54
analysis was carried out to determine product colour, product density, expansion ratio
and hardness.
4.3.1 Extrusion Parameters for the Expanded Snack Product
Pumpkin has been processed in a number of ways but little detailed information is
available on extrusion parameters used to produce extruded pumpkin based snack
products. As suggested by Meng, Threinen, Hansen and Driedger.,(2010) and
Ravindran, Carr and Hardacre., (2011), the desired characteristics of expanded snack
products that should be targeted and achieved include well expanded, high expansion
ratio, low bulk density and low hardness. Other desired characteristics were large air
cells and thin cell walls. These can be achieved through extrusion processing at low
feed moisture, high screw speed and medium to high barrel temperature (Pansawat et
al., 2008). These parameters are investigated in this chapter. As a starting point, the
settings for these parameters were based on Brennan et al.,(2008), who used an
identical extruder to the one in this study. Additionally the product of Brennan was
predominantly based on corn grits.
The effect of extruding pumpkin flour with corn grits on torque, thrust pressure, die
pressure, temperature at the die face and power consumption are presented in Table 4-3. Results show that incorporating pumpkin flour from different fractions with corn
grits at different percentage levels reduces torque, thrust pressure and die pressure
with the exception of 10% peel and 30% seed.
In extrusion processing, torque is referred to as the amount of energy that has been
absorbed by the raw material due to the shear exerted by screws (Fichtali & Van De
Voort., 1989). The value of torque provides an indicator for steady state running of the
extrusion. In this study, each formulation gave a different value of torque as compared
to the control. Under constant extrusion conditions (feed rate, screw speed and barrel
temperature), torque was reduced to the lowest (51%) when flesh pumpkin flour was
incorporated with corn grits compared to the control. Increased use of pumpkin flour
likely decreased the torque value due the presence of sugar, pectin and fibre in the
pumpkin flour. It has been reported by Pansawat et al., (2008) that these components
decrease the resistance against the melt viscosity.

Chapter 4
Page | 55
Pressure thrust ranged from 40-69 bar. The highest pressure thrust was observed at
30% pumpkin flour from peel and 50% pumpkin flour from seed, which is 6% higher
than the control.
Table 4-3 : Processing parameters of control and pumpkin flour mixed with corn grits at different percentage levels to produce expanded snacks.
Sample
Torque (Nm)
Pressure Thrust (Bar)
Pressure Die
(Bar)
Temperature at the die face ( C)
Power Consumption
(kw) Control (100% Corn Grits)
5.3 65 92 126.4 1.45
10% Peel (Crown Pumpkin-Convection oven) with 90% Corn Grits
4.5 69 98 129.6 1.26
30% Peel (Crown Pumpkin-Convection oven) with 70% Corn Grits
3.6 54 76 129.7 0.98
50% Peel (Crown Pumpkin-Convection oven) with 50% Corn Grits
3.2 51 74 129.9 0.60
10% Flesh (Crown Pumpkin-Convection oven) with 90% Corn Grits
4.1 68 90 128.2 1.24
30% Flesh (Crown Pumpkin-Convection oven) with 70% Corn Grits
2.8 40 64 128.8 0.76
50% Flesh (Crown Pumpkin-Convection oven) with 50% Corn Grits
2.6 40 64 131.2 0.72
10% Seed (Crown Pumpkin-Convection oven) with 90% Corn Grits
4.1 66 90 130.4 1.10
30% Seed (Crown Pumpkin-Convection oven) with 90% Corn Grits
3.8 68 103 131.1 0.94
50% Seed (Crown Pumpkin-Convection oven) with 90% Corn Grits
3.2 69 94 129.9 0.94
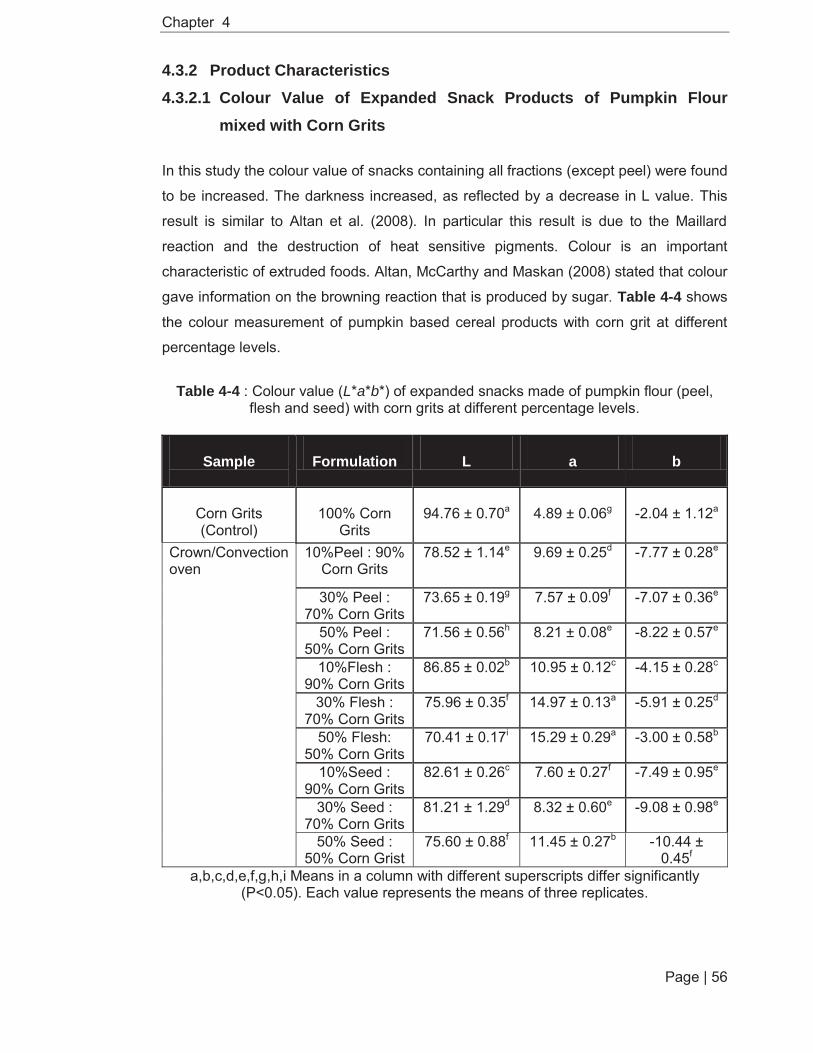
Chapter 4
Page | 56
4.3.2 Product Characteristics 4.3.2.1 Colour Value of Expanded Snack Products of Pumpkin Flour
mixed with Corn Grits
In this study the colour value of snacks containing all fractions (except peel) were found
to be increased. The darkness increased, as reflected by a decrease in L value. This
result is similar to Altan et al. (2008). In particular this result is due to the Maillard
reaction and the destruction of heat sensitive pigments. Colour is an important
characteristic of extruded foods. Altan, McCarthy and Maskan (2008) stated that colour
gave information on the browning reaction that is produced by sugar. Table 4-4 shows
the colour measurement of pumpkin based cereal products with corn grit at different
percentage levels.
Table 4-4 : Colour value (L*a*b*) of expanded snacks made of pumpkin flour (peel, flesh and seed) with corn grits at different percentage levels.
Sample
Formulation
L
a
b
Corn Grits (Control)
100% Corn
Grits
94.76 ± 0.70a
4.89 ± 0.06g
-2.04 ± 1.12a
Crown/Convection oven
10%Peel : 90% Corn Grits
78.52 ± 1.14e 9.69 ± 0.25d -7.77 ± 0.28e
30% Peel : 70% Corn Grits
73.65 ± 0.19g 7.57 ± 0.09f -7.07 ± 0.36e
50% Peel : 50% Corn Grits
71.56 ± 0.56h 8.21 ± 0.08e -8.22 ± 0.57e
10%Flesh : 90% Corn Grits
86.85 ± 0.02b 10.95 ± 0.12c -4.15 ± 0.28c
30% Flesh : 70% Corn Grits
75.96 ± 0.35f 14.97 ± 0.13a -5.91 ± 0.25d
50% Flesh: 50% Corn Grits
70.41 ± 0.17i 15.29 ± 0.29a -3.00 ± 0.58b
10%Seed : 90% Corn Grits
82.61 ± 0.26c 7.60 ± 0.27f -7.49 ± 0.95e
30% Seed : 70% Corn Grits
81.21 ± 1.29d 8.32 ± 0.60e -9.08 ± 0.98e
50% Seed : 50% Corn Grist
75.60 ± 0.88f 11.45 ± 0.27b -10.44 ± 0.45f
a,b,c,d,e,f,g,h,i Means in a column with different superscripts differ significantly (P<0.05). Each value represents the means of three replicates.
Chapter 4
Page | 57
4.3.2.2 Expansion Ratio of Expanded Snack Products of Pumpkin Flour with Corn Grits
The expansion property of extruded snacks made from different fractions of pumpkin
flour (peel, flesh and seed)) with corn grits at different percentage levels are shown in
Figure 4-2. According to Ilo, Tomschik, Berghofer and Mundigler (1996) the expansion
ratios of extruded products are dependent on moisture content, product temperature
and feed rate. Furthermore the degree of expansion determines the extruded product’s
structure.
As can be seen in Figure 4-2 an increasing percentage of pumpkin flour from all
fractions, decreased the product diameter thus resulting in a decrease in the expansion
ratio. Colonna, Tayler and Mercier (1989) reported that the decrease in expansion at
higher temperatures is due to the increase of dextrinisation and the weakening of
structure. The expansion ratio of all pumpkin fractions flour with corn grits at different
percentage levels were significantly (P<0.05) lower than the control.
Further research needs to be carried out because the quality of extruded product can
vary depending on the extrusion parameters e.g. types of extruder, screw
configuration, feed moisture, temperature profile in the barrel sections, screw speed
and feed rate (Ilo et.al.,1996).
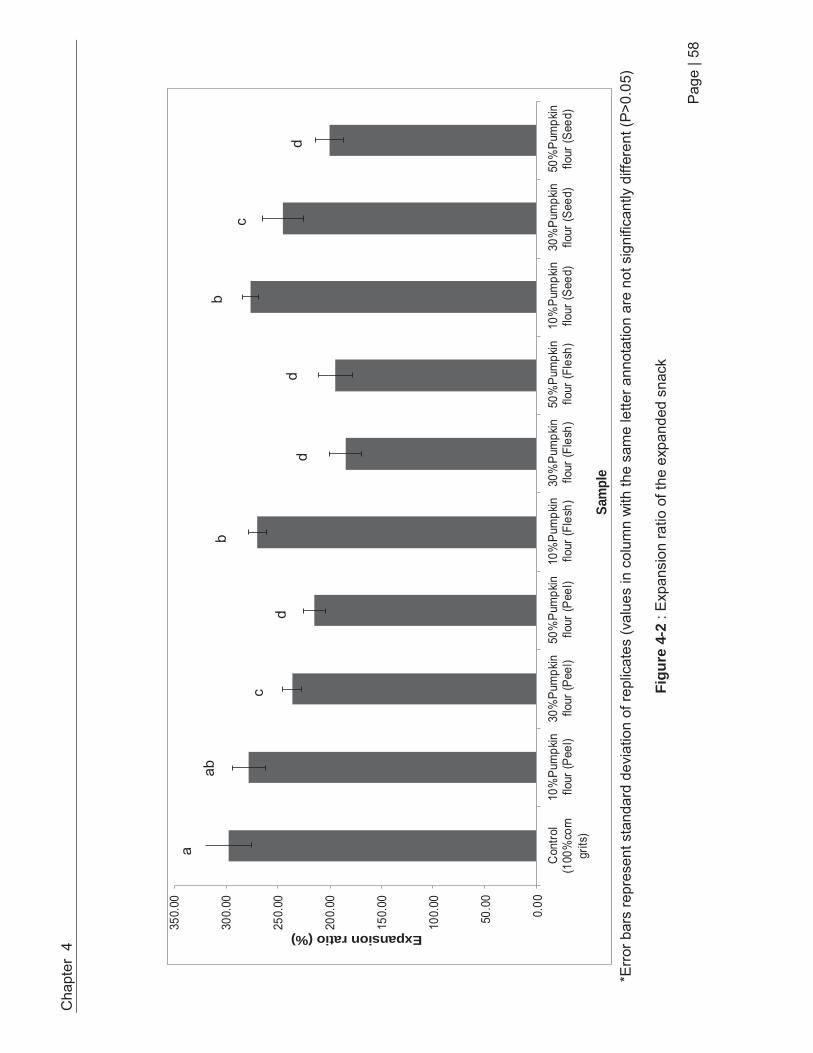
Cha
pter
4
Page
| 58
0.00
50.0
0
100.
00
150.
00
200.
00
250.
00
300.
00
350.
00
Con
trol
(100
%co
rngr
its)
10%
Pum
pkin
flour
(Pee
l)30
%Pu
mpk
inflo
ur (P
eel)
50%
Pum
pkin
flour
(Pee
l)10
%Pu
mpk
inflo
ur (F
lesh
)30
%Pu
mpk
inflo
ur (F
lesh
)50
%Pu
mpk
inflo
ur (F
lesh
)10
%Pu
mpk
inflo
ur (S
eed)
30%
Pum
pkin
flour
(See
d)50
%Pu
mpk
inflo
ur (S
eed)
Expansion ratio (%)
Sam
ple
*E
rror
bar
s re
pres
ent s
tand
ard
devi
atio
n of
repl
icat
es (v
alue
s in
col
umn
with
the
sam
e le
tter a
nnot
atio
n ar
e no
t sig
nific
antly
diff
eren
t (P>
0.05
)
Figu
re 4
-2 :
Exp
ansi
on ra
tio o
f the
exp
ande
d sn
ack
a ab
c d
b
d d
b c
d

Chapter 4
Page | 59
4.3.2.3 Bulk Density of Expanded Snack Products made of Pumpkin Flour and Corn Grits
Figure 4-3 shows the bulk density of expanded snacks made with different percentage
levels of pumpkin flour fractions (peel, flesh and seed) with corn grits. The density of
extrudates ranges from 140-500kg/m3. The density of extrudates in samples containing
10% pumpkin flour (peel) , 10% pumpkin flour (seed) and 30% pumpkin flour (seed)
are not significantly different (p> 0.05) from the control. As the level of pumpkin flour
increased for all fractions and all percentage levels, the extrudates exhibited higher
density. However, increased levels of pumpkin flour have an inverse relationship with
the expansion ratio. This result agrees with those previous of studies, which showed
that increasing the product density is correlated with decreasing expansion ratio (Ding,
Ainsworth, Plunkett, Tucker & Marson., 2006; Foster, 2004).

Cha
pter
4
Page
| 60
0.00
100.
00
200.
00
300.
00
400.
00
500.
00
600.
00
Con
trol
(100
% g
rits)
10%
Pum
pkin
flour
(Pee
l)30
%P
umpk
inflo
ur (P
eel)
50%
Pum
pkin
flour
(Pee
l)10
%P
umpk
inflo
ur (F
lesh
)30
%P
umpk
inflo
ur (F
lesh
)50
%P
umpk
inflo
ur (F
lesh
)10
%P
umpk
inflo
ur (S
eed)
30%
Pum
pkin
flour
(See
d)50
%P
umpk
inflo
ur (S
eed)
Product density (kg/m3)
Sam
ple
Bul
k de
nsity
(Wei
ght o
f 1L)
True
den
sity
(Pr
oduc
t den
sity
(kg
/m3)
)
hh
DD
dc
BB
f
C
b
A
a
A
i
Dg
De
C
*Err
or b
ars
repr
esen
t sta
ndar
d de
viat
ion
of re
plic
ates
(val
ues
in c
olum
ns w
ith th
e sa
me
lette
r ann
otat
ion
are
not s
igni
fican
tly d
iffer
ent (
P>0.
05)
Figu
re 4
-3 :
Prod
uct d
ensi
ty o
f the
exp
ande
d sn
ack
Chapter 4
Page | 61
4.3.2.4 Texture of Expanded Snack Products made of Pumpkin Flour with Corn Grits
The texture properties of expanded snacks made with different levels of pumpkin
fractions (peel, flesh and seed) with corn grits are shown in Figure 4-4. The hardness
for all samples was found to be significantly different (p<0.05) from the control. The
sample containing 10% pumpkin seed flour with 90% corn grits gave a similar texture
as the control. The results also show that the expanded snacks containing 50%
pumpkin flesh flour with 50% corn grits gave the hardest texture. According to Ryu and
Ng (2001), the hardness of extruded products is due to increases of protein or gluten,
amylose and water content. Textures of extruded products are dependent on various
process variables such as barrel temperature, screw speed and feed rate. Moreover,
texture is a critical quality factor for products (Puppala, 1998).

Cha
pter
4
Page
| 62
*Err
or b
ars
repr
esen
t sta
ndar
d de
viat
ion
of re
plic
ates
(val
ues
in c
olum
ns w
ith th
e sa
me
lette
r ann
otat
ion
are
not s
igni
fican
tly d
iffer
ent (
P>0.
05)
Figu
re 4
-4 :
Har
dnes
s of
the
expa
nded
sna
ck
0.00
50.0
0
100.
00
150.
00
200.
00
250.
00
300.
00
350.
00
Con
trol (
100%
co
rn g
rits)
10%
Pum
pkin
flo
ur (P
eel)
30%
Pum
pkin
flo
ur (P
eel)
50%
Pum
pkin
flo
ur (P
eel)
10%
Pum
pkin
flo
ur (F
lesh
)30
%Pu
mpk
in
flour
(Fle
sh)
50%
Pum
pkin
flo
ur (F
lesh
)10
%Pu
mpk
in
flour
(See
d)30
%Pu
mpk
in
flour
(See
d)50
%Pu
mpk
in
flour
(See
d)
Hardness(kg)
Sam
ple
j
g f
b
h
d
a
i e
c
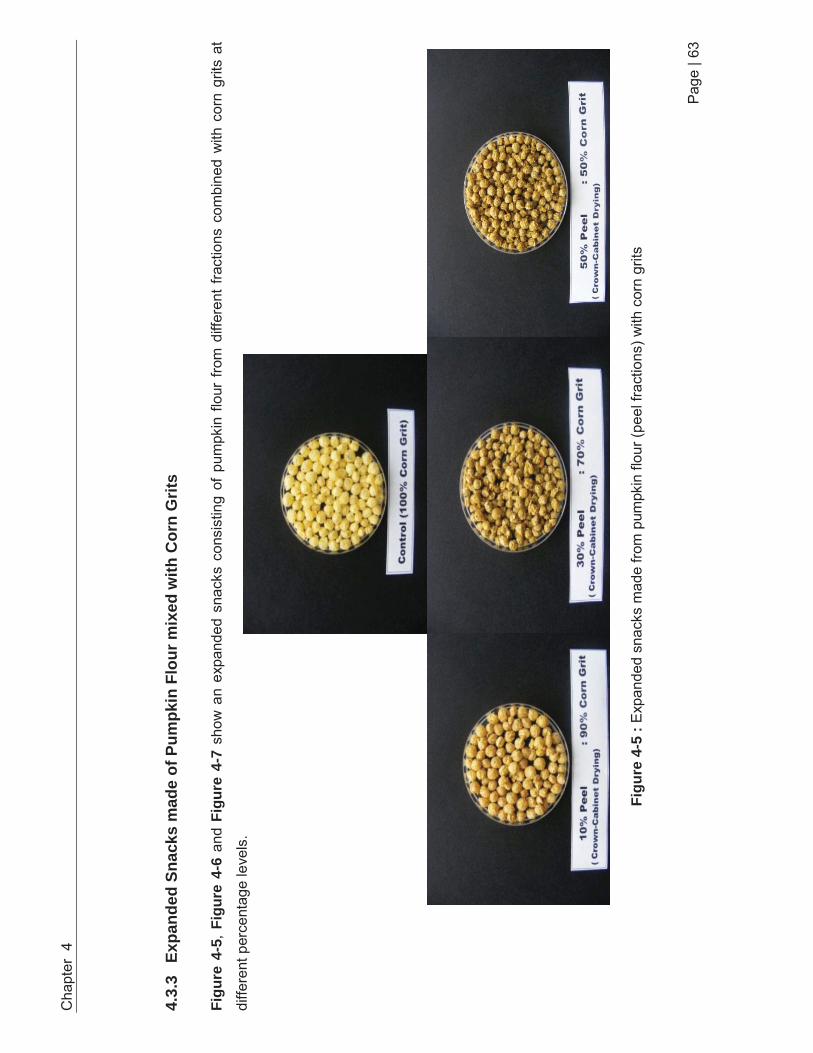
Cha
pter
4
Page
| 63
4.3.
3 Ex
pand
ed S
nack
s m
ade
of P
umpk
in F
lour
mix
ed w
ith C
orn
Grit
s
Figu
re 4
-5,
Figu
re 4
-6 a
nd F
igur
e 4-
7 sh
ow a
n ex
pand
ed s
nack
s co
nsis
ting
of p
umpk
in f
lour
fro
m d
iffer
ent f
ract
ions
com
bine
d w
ith c
orn
grits
at
diffe
rent
per
cent
age
leve
ls.
Figu
re 4
-5 :
Exp
ande
d sn
acks
mad
e fro
m p
umpk
in fl
our (
peel
frac
tions
) with
cor
n gr
its

Cha
pter
4
Page
| 64
Figu
re 4
-6 :
Exp
ande
d sn
acks
mad
e fro
m p
umpk
in fl
our (
flesh
frac
tions
) with
cor
n gr
its

Cha
pter
4
Page
| 65
Figu
re 4
-7 :
Exp
ande
d sn
acks
mad
e fro
m p
umpk
in fl
our (
seed
frac
tions
) with
cor
n gr
its
Chapter 4
Page | 66
As seen in Figure 4-5, Figure 4-6 and Figure 4-7, the colour of extrudates of pumpkin flour
blended with corn grits became darker as the percentage of pumpkin flour inclusion increased for
all fractions. 50% of pumpkin flour in the blend, produced a burnt and unappealing colour in the
final products. This could quantified with the L, a, and b values as described in section 4.3.2.1. The results showed that decreased values of L were found at higher percentages of pumpkin flour
added. This increased the red and yellow colour in the product.
4.3.4 Conclusion
Incorporating pumpkin flour with corn grits at a low percentage level (less than 20%) gives good
results in terms of product colour, expansion ratio, bulk density and texture compared to controls.
All samples were found to exhibit higher density as the level of pumpkin flour increased (more than
30%). This result should be avoided as the changes to the product quality are detrimental.
Even though the extrusion parameters based on Brennan et al., (2008) can be applied to pumpkin
based expanded snacks this may not achieve the desired characteristics of the product as
discussed in the introduction. Therefore several adjustments in terms of extrusion processing
conditions need to be made for the subsequent experiments. These conditions are detailed in the
following chapter and optimised in Chapter 6.
Chapter 5
Page | 67
Chapter 5: The effect of varying the proportion of pumpkin flour at two mass flow rates and at two screw speeds on processing parameters and the physical characteristics of the extruded product.
5.1 Introduction
Consumer interest in ready-to-eat (RTE) snack foods is growing due to their
convenience, value, attractive appearance, taste and texture (Harper, 1981). Cereal-
based extruded snacks are the most commonly consumed snacks (Rhee, Kim, Kim,
Jung & Rhee., 2004). Extruders can blend the diverse ingredients used to develop
novel snack foods. The quality of the final product depends on the processing
conditions used during extrusion and this includes the composition of the raw materials,
feed moisture, barrel temperature, screw speed and screw configuration (Yang, Peng,
Lui & Lin, 2008). Moreover ingredients and formulation play an important role in
developing the texture of the extruded product and ultimately the acceptability of the
extruded product to the consumer. Additionally, the conditions under which the product
is processed will determine the survivability of labile functional ingredients including
vitamins, pigments such as -carotene and volatile flavour compounds. Therefore,
processing must be carefully controlled to optimise the survival of functional
components.
Most snack foods contain a high proportion of corn, wheat and rice, with potato and oat
and other grain products commonly added in smaller quantities. Vegetable powders
are occasionally added but are not common in RTE snacks. Pumpkin is a good source
of carotenes with are responsible for the yellow color of the flesh, they also contain
appreciable levels of sugar and pectin. Sugar sweetens products that include pumpkin,
while pectin is a soluble fibre that delivers many ealth benefits. However, the utilisation
of pumpkin has been limited to the consumption of fresh products as a vegetable, or
thickeners in soups and purees (Konopacka., et al., 2010) and the production of dry
powders that are also used to colour, flavour and thicken a range of foods including
soups and purees. A potential avenue of development for pumpkin based products is
for the expanded snack market where pumpkin can be used to naturally enhance the
flavour and colour of these products. The incorporation of pumpkin flour which naturally
contains 37% sugar and 14% pectin (Ptichkina, Markina & Rumyantseva, 2008) into
the extruded snack will change the extrusion system, generally making it more difficult

Chapter 5
Page | 68
to achieve a highly expanded low density snack (Hardacre, pers com). However, the
limits for the addition of pumpkin powder and detailed quantitative knowledge of its
effects on the physical properties of snacks containing pumpkin powder are unknown.
In this study the effect of varying the proportion of pumpkin flour and screw speed on
the extrusion parameters and the final quality of extruded product was studied.
5.2 Materials and Methods 5.2.1 Raw Materials
Pumpkin flour (supplied by Cedenco Foods Ltd, Gisborne New Zealand) and
Specification 220 corn grits from Corson Grain Ltd, Gisborne, New Zealand were used.
The proximate composition of corn grits and pumpkin flour, according to manufacturers
data are presented in Table 5-1 below.
Table 5-1: Proximate composition of raw materials (corn grits and pumpkin flour) used for the extrusion.
Proximate
Corn grits
Pumpkin Flour
Protein (%) 6.0-9.0 maximum 7.10
Fat (%) 1.5 maximum 3.10 Moisture (%) 10-14 1.80 Ash (%) 2.0 5.70 Carbohydrate (%) 80.5 82.30
5.2.2 Pasting Properties (RVA)
The main objective of the Rapid Visco Analysis (RVA) in this chapter was to determine
the viscosity of pumpkin flour at different concentrations. Pasting properties of the
pumpkin flours were determined using a Rapid-Visco Analyser (Rapid Visco Analyser
Series S4A, Warriewood, Australia) equipped with Thermocline software. The method
used was according to the manufacturer’s instructions using set standard 1. Each RVA
canister contains 3g of samples (ground and sieved to 200um) and was made up to 27
g using distilled water. The samples were grounded and sieved in order to ensure that
no thermal degradation of the starch occurs and to obtain a uniform size distribution
during RVA analysis (Paton & Spratt, 1981). The RVA parameters are as follows; peak

Chapter 5
Page | 69
viscosity, peak time, pasting temperature, peak temperature, holding strength,
breakdown, final viscosity, setback 1 and setback 2. These were recorded as shown in
Figure 5-1 below. All RVA parameters mentioned above were used to describe the
pasting properties of the materials. Each analysis was performed in triplicate.
Figure 5-1 : A typical complete RVA curve (Paton & Spratt,1981)
5.2.3 Extrusion Processing 5.2.3.1 Extrusion at constant screw speed with two mass flow rate
Expanded snack products were made by extruding finely milled corn endosperm (grits)
as a control (100%) and corn grits mixed with pumpkin flour added at 5%, 10% and
20% on a dry weight basis using a twin- screw extruder (Clextral BC21 twin-screw co-
rotating self wiping extruder, Clextral, Firminy Cedex, France). Basic recipes and
extrusion conditions were used as described in Brennan et al., (2008). Two feed rates
of 7.5 and 8.5 kg/hr for each formulation were used. The torque (Nm), power
consumption (kw), specific mechanical energy (SME, kWhr/kg), expansion ratio, true
density and hardness were measured.

Chapter 5
Page | 70
5.2.3.2 Extrusion at Two Screw Speeds with Constant Mass Flow Rate
Expanded snack products were made by extruding finely milled corn
endosperm (Specification 220 corn grits) as a control (100%) and corn grits mixed with
pumpkin flour added at 5%, 10%, 15% and 20% on a dry weight basis. These
ingredients were added into the extruder at a constant mass flow rate of 12.5kg/hr.
Processing was carried out using a twin- screw extruder (Clextral BC21 twin-screw
extruder, Clextral, Firminy Cedex, France). The barrel length was 700mm and the
screw diameter was 24.7mm. The screw configuration (Figure 5.2) was a four pairs of
13mm forward pitch screws each 50mm in length, five pairs of, 10mm forward pitch
screws each 50mm in length, and five pairs of 13mm forward pitch screws each 50mm
in length. The barrel temperatures in each section of the extruder from inlet port to die
were set at 40 C, 60 C, 80 C, 100 C, 140 C, 160 C and 180 C. A single die with a
3.4mm diameter aperture was used and a knife rotating at 55 rpm cut the emerging
product into pellets about 15m in length. Two screw speeds of 250 rpm and 350 rpm
were used for each formulation.
During this work the processing parameters for the extruder were recorded;
these included torque, electrical energy consumption (kW) and from the energy
consumption and the total mass through-put, the specific mechanical energy (SME)
was calculated as kWh/kg.
A
40C 60C 80C 100C 140C 160C 180C
700 mm
50mmFw d F 50mmFw d F Die
Water injection
50mmFw d M 50mmFw d F 50mmFw d F 50mmFw d F50mmFw d C 50mmFw d C 50mmFw d M 50mmFw d M50mmFw d C 50mmFw d C 50mmFw d C 50mmFw d C
Figure 5-2: Schematic diagram of screw configuration of the extruder, the angle on the schematic represent screw pitch from the feed at the left hand side to the die on the right hand side.
Feed Die

Chapter 5
Page | 71
5.2.4 Physical Characteristics
The physical characteristics of the extruded products were measured including:
expansion ratio, product density and hardness. The measurement is as described in
4.2.4 .
5.2.5 Texture Analysis of Product Mapping
Texture mapping of commercial snack products and pumpkin flour-corn grits expanded
snacks was performed in order to compare the crispiness and hardness between the
snack products. The plot of a commercial product is used as a benchmark and
guidance for pumpkin flour-corn grit snack extrusion processing in order to get the
desired texture known to be accepted by consumers.
Several commercial snack products were randomly purchased from Countdown,
Palmerston North. The commercial snacks were; ETA skof (burgers), ETA skof
(munchos), ETA skof (sonics), ETA skof (balls), Bluebird (burger rings), Bluebird
twisties (ottawa) and Pams(twisties).
Pumpkin flour-corn grits expanded snack products were prepared as described in
5.2.3.2.
The texture analysis for commercial and pumpkin-corn grits snack products was
performed using a compression test on the Texture analyser (TA.XT PLUS, Canners
Machinery Ltd. Simcoe, Ontario Canada). A probe type of 30mm square, Ottawa cell
with a solid base plate (Instron Corporation, Canton, Massachusetts 02021, USA) was
used. The compression was done with a 50kg load size and a standard bulk volume of
360 cm3 of each sample was measured. The test was done under Pre-test speed: 0.5
mm/s, Test speed: 0.5 mm/s, Post-test speed: 10 mm/s, Distance: 50 mm, and Trigger
force: 0.1 N. Hardness was determined as the maximum peak force and crispness as
the number of positive peaks with threshold set at 0.1 N, as shown in Figure 5-3. Measurements were conducted in duplicate.

Chapter 5
Page | 72
Figure 5-3 : Compression graph of force (N) against time (s)
5.2.6 Statistical Analysis
The experimental data was analysed as described in 3.2.5.
5.3 Results and Discussion
In this chapter, pasting properties of pumpkin flour starch and comparison of texture
between pumpkin-corn grits snacks with commercial snacks are discussed. The effects
of adding different proportions of pumpkin flour and operating the extruder at different
mass flow rates and screw speeds on the extrusion parameters of torque, specific
mechanical energy (SME), power consumption (kW), pressure thrust (bar) and the
physical characteristics of extruded products is reported. These include expansion
ratio, bulk density, true density and hardness.
5.3.1 Pasting Properties of Raw Ingredients (pumpkin flour-Cedenco)
The main purpose of this experiment was to characterise the pasting properties of
pumpkin flour starch, which could be useful in providing the initial guidelines for
extrusion food processing and other food processing. It also can be used as a
Positive peaks with threshold >0.1N anchored – crispiness
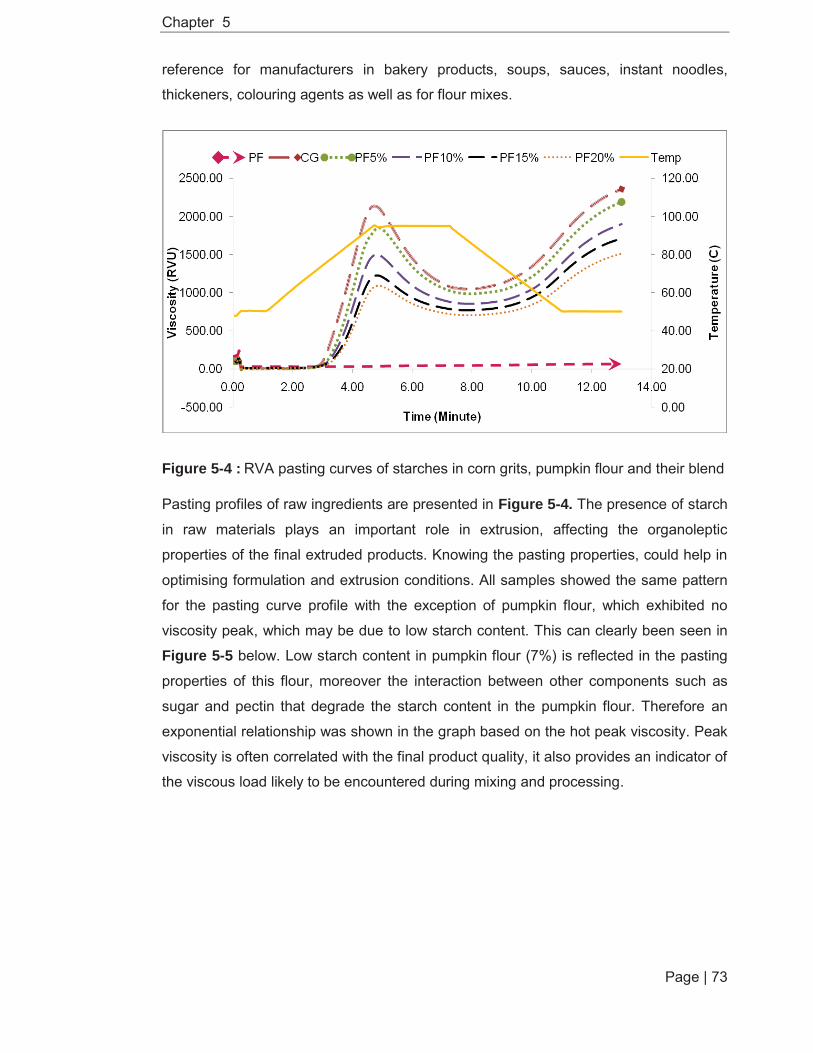
Chapter 5
Page | 73
reference for manufacturers in bakery products, soups, sauces, instant noodles,
thickeners, colouring agents as well as for flour mixes.
Figure 5-4 : RVA pasting curves of starches in corn grits, pumpkin flour and their blend
Pasting profiles of raw ingredients are presented in Figure 5-4. The presence of starch
in raw materials plays an important role in extrusion, affecting the organoleptic
properties of the final extruded products. Knowing the pasting properties, could help in
optimising formulation and extrusion conditions. All samples showed the same pattern
for the pasting curve profile with the exception of pumpkin flour, which exhibited no
viscosity peak, which may be due to low starch content. This can clearly been seen in
Figure 5-5 below. Low starch content in pumpkin flour (7%) is reflected in the pasting
properties of this flour, moreover the interaction between other components such as
sugar and pectin that degrade the starch content in the pumpkin flour. Therefore an
exponential relationship was shown in the graph based on the hot peak viscosity. Peak
viscosity is often correlated with the final product quality, it also provides an indicator of
the viscous load likely to be encountered during mixing and processing.

Chapter 5
Page | 74
Figure 5-5 : Relationship between percentage of pumpkin flour and hot peak viscosity
This is supported by Bailey et al. (1990) who found only 7% starch content per 100g of
pumpkin. Overall, as the level of pumpkin flour increases, both the pasting temperature
and peak viscosity decrease. The highest peak viscosity was shown by the control
sample (100% corn grits) at 2116.00 RVU, while the lowest peak viscosity was
exhibited by the sample mixture of 80%corn grits + 20% pumpkin flour. Variation in
peak viscosity was contributed to by the size of starch granules as well as the level of
phosphorus present (Singh, Kaur, & McCarthy, 2007). Samples with higher peak
viscosity may contain larger starch granules and higher levels of phosphorus. The
lower setback was found in the sample mixture of 80% Corn grits + 20% pumpkin flour.
This may have resulted in less expanded extrudate as it could lower the retrogradation
or aggregation of amylose. Substitution of 5-15% of pumpkin flour achieved peak
viscosity in the lowest temperature range of 68.53ºC – 65.27ºC, this requires less
energy to cook and produced a stable paste for the extrusion process.
y = 2220.6e-0.04x R² = 0.9994
0
500
1000
1500
2000
2500
0 10 20 30 40 50 60 70 80 90 100 110
Visc
osity
(RVU
)
Percentage of pumpkin flour (%)
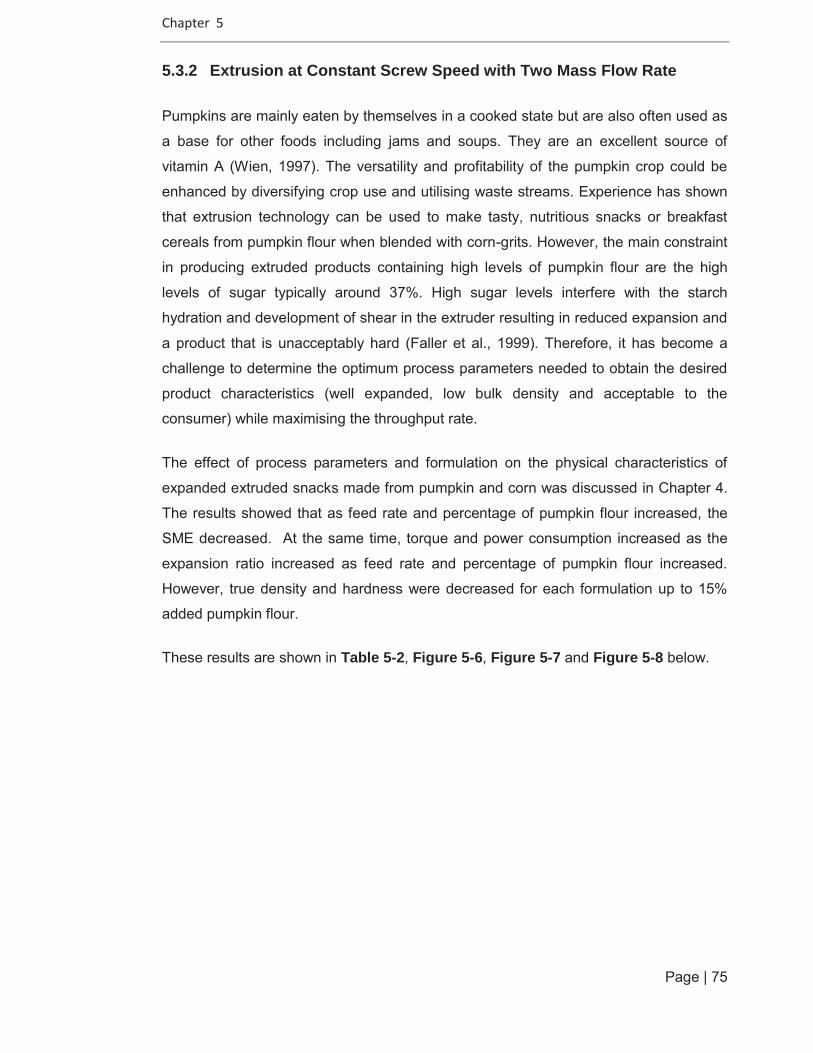
Chapter 5
Page | 75
5.3.2 Extrusion at Constant Screw Speed with Two Mass Flow Rate
Pumpkins are mainly eaten by themselves in a cooked state but are also often used as
a base for other foods including jams and soups. They are an excellent source of
vitamin A (Wien, 1997). The versatility and profitability of the pumpkin crop could be
enhanced by diversifying crop use and utilising waste streams. Experience has shown
that extrusion technology can be used to make tasty, nutritious snacks or breakfast
cereals from pumpkin flour when blended with corn-grits. However, the main constraint
in producing extruded products containing high levels of pumpkin flour are the high
levels of sugar typically around 37%. High sugar levels interfere with the starch
hydration and development of shear in the extruder resulting in reduced expansion and
a product that is unacceptably hard (Faller et al., 1999). Therefore, it has become a
challenge to determine the optimum process parameters needed to obtain the desired
product characteristics (well expanded, low bulk density and acceptable to the
consumer) while maximising the throughput rate.
The effect of process parameters and formulation on the physical characteristics of
expanded extruded snacks made from pumpkin and corn was discussed in Chapter 4.
The results showed that as feed rate and percentage of pumpkin flour increased, the
SME decreased. At the same time, torque and power consumption increased as the
expansion ratio increased as feed rate and percentage of pumpkin flour increased.
However, true density and hardness were decreased for each formulation up to 15%
added pumpkin flour.
These results are shown in Table 5-2, Figure 5-6, Figure 5-7 and Figure 5-8 below.

Chapter 5
Page | 76
Table 5-2 : Effect of formulations and feed rates on operating conditions of expanded snacks made from pumpkin flour-corn grits
Sample Mass Flow (kg/hr)
Kw Torque
(Nm)
(SME)
kW.hr/kg Control (100% corn grits)
7.5 1.46b 6.60
a 0.24
a
8.5 1.02f 3.80
e 0.15
c
5% pumpkin flour + 95% corn grits
7.5 1.27c 5.30
b 0.22
b
8.5 1.46a 5.30
b 0.20
b
10% pumpkin flour + 90% corn grits
7.5 1.11e 4.30
d 0.12
d
8.5 1.27d 4.70
c 0.20
b
20% pumpkin flour + 80% corn grits
7.5 0.92h 3.70
e 0.17
c
8.5 0.96g 3.25
f 0.16
c
Figure 5-6 : Effect of formulations and feed rates on expansion ratio of expanded snacks made from pumpkin flour-corn grits
0
50
100
150
200
250
300
Control(100% corn
grits)
5% pumpkinflour + 95%corn grits
10% pumpkinflour + 90%corn grits
20% pumpkinflour + 80%corn grits
Expa
nsio
n ra
tio (%
)
Sample
7.5 kg/hr Mass flow 8.5 kg/hr Mass flow
c a d d d
b
d
d

Chapter 5
Page | 77
Figure 5-7: Effect of formulations and feed rates on hardness (kg) of expanded snacks made from pumpkin flour-corn grits
Figure 5-8 : Effect of formulations and feed rates on true density (g/m3) of expanded snacks made from pumpkin flour-corn grits
050
100150200250300350400
Control(100% corn
grits)
5% pumpkinflour + 95%corn grits
10%pumpkin
flour + 90%corn grits
20%pumpkin
flour + 80%corn grits
Har
dnes
s (k
g)
Sample
7.5 kg/hr Mass flow 8.5 kg/hr Mass flow
d a
c
d d
d
b a
050
100150200250300350400450500
Control(100% corn
grits)
5% pumpkinflour + 95%corn grits
10% pumpkinflour + 90%corn grits
20% pumpkinflour + 80%corn grits
True
den
sity
(g/m
3)
Sample
7.5 kg/hr Mass flow 8.5 kg/hr Mass flow
d
c d d
d d
b
a

Chapter 5
Page | 78
Table 5-3 : Pearson’s correlation
Sample
Flow
rate kW Torque SME Expansion Hardness TD
Sample 1
Flow rate 0.22 1.00
kW -0.59 -0.03 1.00
Torque -0.71 -0.35 0.92 1.00
SME -0.44 -0.14 0.74 0.80 1.00
Expansion -0.79 -0.07 0.65 0.66 0.38 1.00
Hardness 0.33 0.24 -0.26 -0.30 -0.06 -0.59 1.00
TD 0.68 0.30 -0.75 -0.78 -0.45 -0.92 0.70 1.00
Increasing pumpkin flour significantly (P<0.05) decreased power consumption, SME
and torque while increasing product density and hardness. High quality product was
produced at all feed rates providing pumpkin flour was incorporated at less than
20%.Therefore formulation and to a lesser extent feed rate, are important in
determining the characteristics of the final product.
5.3.3 Extrusion at Two Screw Speeds with Constant Mass Flow Rate 5.3.3.1 Extrusion Parameters
The torque and specific mechanical energy (SME) response to different proportions of
pumpkin in the ingredients at different screw speeds are presented in Figure 5-9 and
Figure 5-10. Increasing the proportion of pumpkin flour in the formulations decreased
torque and SME. However, the rate of reduction in torque and SME was not constant
over the range of pumpkin flour added to the formulation. When pumpkin flour was
added, the torque decreased to about 60% of the value for corn grits only and the SME
decreased to about 45% of the value for the corn grits alone when pumpkin flour was
added to the ingredients (Figure 5-9 and 5-10). At all proportions of pumpkin flour,
torque and SME were constant, except for torque at 250 rpm (Figure 5-9) which was
constant at 10% or more of added pumpkin flour. The result also indicated that
increasing the screw speed from 250 to 350 rpm at all pumpkin flour proportions
decreased the torque during processing but not the SME.
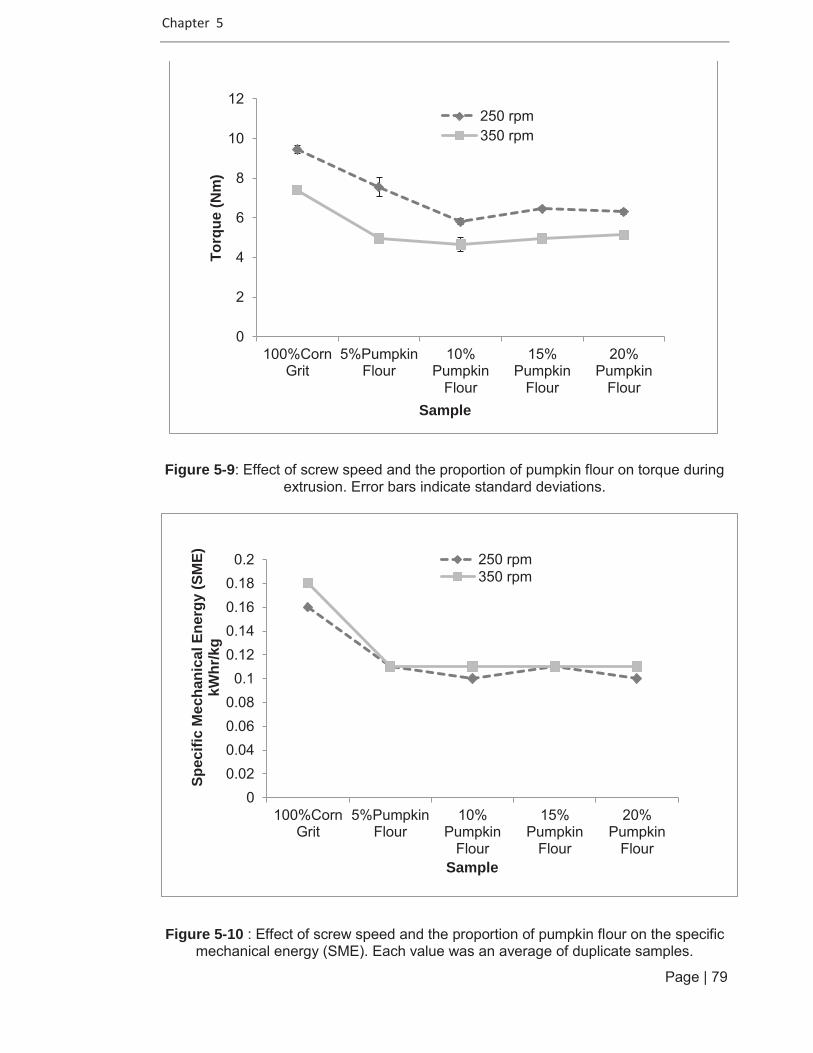
Chapter 5
Page | 79
Figure 5-9: Effect of screw speed and the proportion of pumpkin flour on torque during extrusion. Error bars indicate standard deviations.
Figure 5-10 : Effect of screw speed and the proportion of pumpkin flour on the specific mechanical energy (SME). Each value was an average of duplicate samples.
0
2
4
6
8
10
12
100%CornGrit
5%PumpkinFlour
10%Pumpkin
Flour
15%Pumpkin
Flour
20%Pumpkin
Flour
Torq
ue (N
m)
Sample
250 rpm350 rpm
00.020.040.060.080.1
0.120.140.160.180.2
100%CornGrit
5%PumpkinFlour
10%Pumpkin
Flour
15%Pumpkin
Flour
20%Pumpkin
Flour
Spec
ific
Mec
hani
cal E
nerg
y (S
ME)
kW
hr/k
g
Sample
250 rpm350 rpm

Chapter 5
Page | 80
Figure 5-11 : Effect of screw speed and the proportion of pumpkin flour on power consumption (kw) during extrusion.
Figure 5-12 : Effect of screw speed and the proportion of pumpkin flour on pressure thrust during extrusion. Error bars indicate standard deviations.
0
0.5
1
1.5
2
2.5
100%CornGrit
5%PumpkinFlour
10%Pumpkin
Flour
15%Pumpkin
Flour
20%Pumpkin
Flour
Pow
er c
onsu
mpt
ion
(kW
)
Sample
250 rpm350 rpm
0
20
40
60
80
100
100%CornGrit
5%PumpkinFlour
10%Pumpkin
Flour
15%Pumpkin
Flour
20%Pumpkin
Flour
Pres
sure
Thr
ust (
Bar
)
Sample
250 rpm350 rpm

Chap
ter
5
Page
| 81
5.3.
3.2
Phys
ical
Cha
ract
eris
tics
of E
xtru
ded
Prod
ucts
Figu
re 5
-13
and
Figu
re 5
-14
belo
w s
how
ext
rude
d pr
oduc
ts m
ade
from
diff
eren
t com
bina
tions
of p
umpk
in fl
our a
nd c
orn
grits
at s
crew
spe
eds
250
rpm
and
350
rpm
resp
ectiv
ely.
Figu
re 5
-13
: Effe
ct o
f scr
ew s
peed
(250
rpm
) and
the
prop
ortio
n of
pum
pkin
flou
r on
the
phys
ical
cha
ract
eris
tics
of e
xtru
ded
prod
ucts
.
Figu
re 5
-14
: Effe
ct o
f scr
ew s
peed
(350
rpm
) and
the
prop
ortio
n of
pum
pkin
flou
r on
the
phys
ical
cha
ract
eris
tics
of e
xtru
ded
prod
ucts
.
100%
Cor
n gr
its
5% P
umpk
in
Flou
r 10
% P
umpk
in
Flou
r 15
% P
umpk
in
Flou
r 20
%P
umpk
in
Flou
r
100%
Cor
n gr
its
5% P
umpk
in
Flou
r 10
% P
umpk
in
Flou
r 15
% P
umpk
in
Flou
r 20
%P
umpk
in
Flou
r
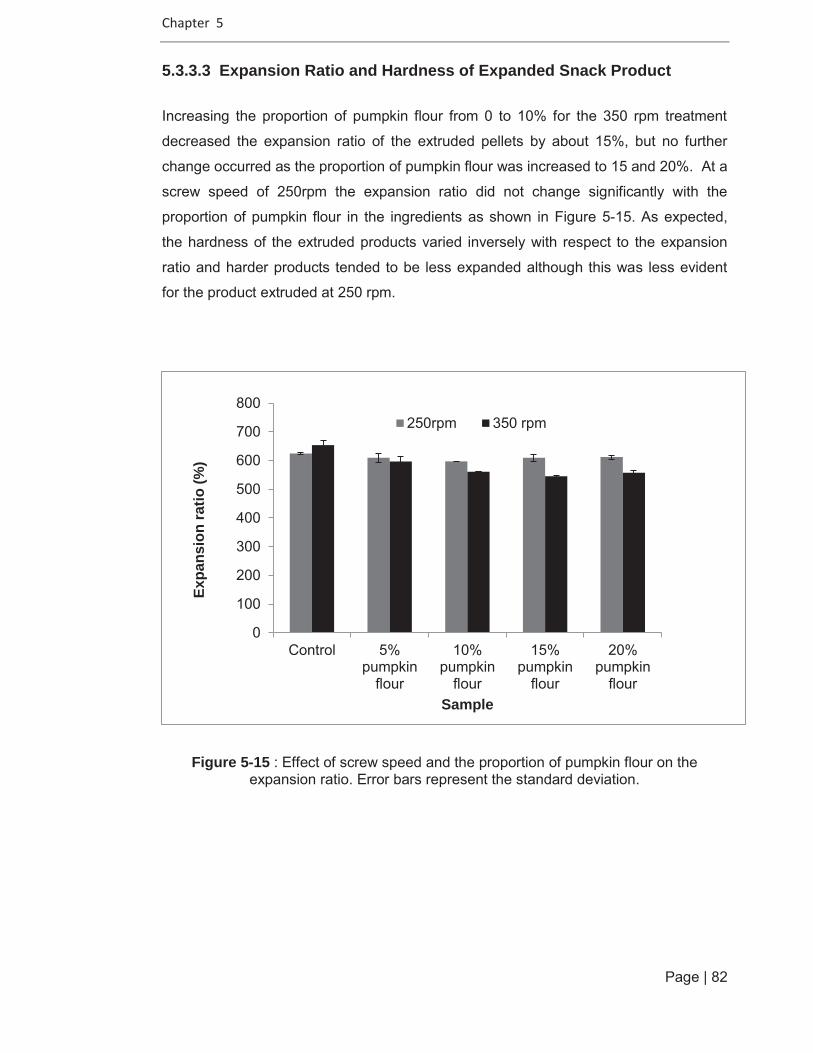
Chapter 5
Page | 82
5.3.3.3 Expansion Ratio and Hardness of Expanded Snack Product
Increasing the proportion of pumpkin flour from 0 to 10% for the 350 rpm treatment
decreased the expansion ratio of the extruded pellets by about 15%, but no further
change occurred as the proportion of pumpkin flour was increased to 15 and 20%. At a
screw speed of 250rpm the expansion ratio did not change significantly with the
proportion of pumpkin flour in the ingredients as shown in Figure 5-15. As expected,
the hardness of the extruded products varied inversely with respect to the expansion
ratio and harder products tended to be less expanded although this was less evident
for the product extruded at 250 rpm.
Figure 5-15 : Effect of screw speed and the proportion of pumpkin flour on the expansion ratio. Error bars represent the standard deviation.
0
100
200
300
400
500
600
700
800
Control 5%pumpkin
flour
10%pumpkin
flour
15%pumpkin
flour
20%pumpkin
flour
Expa
nsio
n ra
tio (%
)
Sample
250rpm 350 rpm
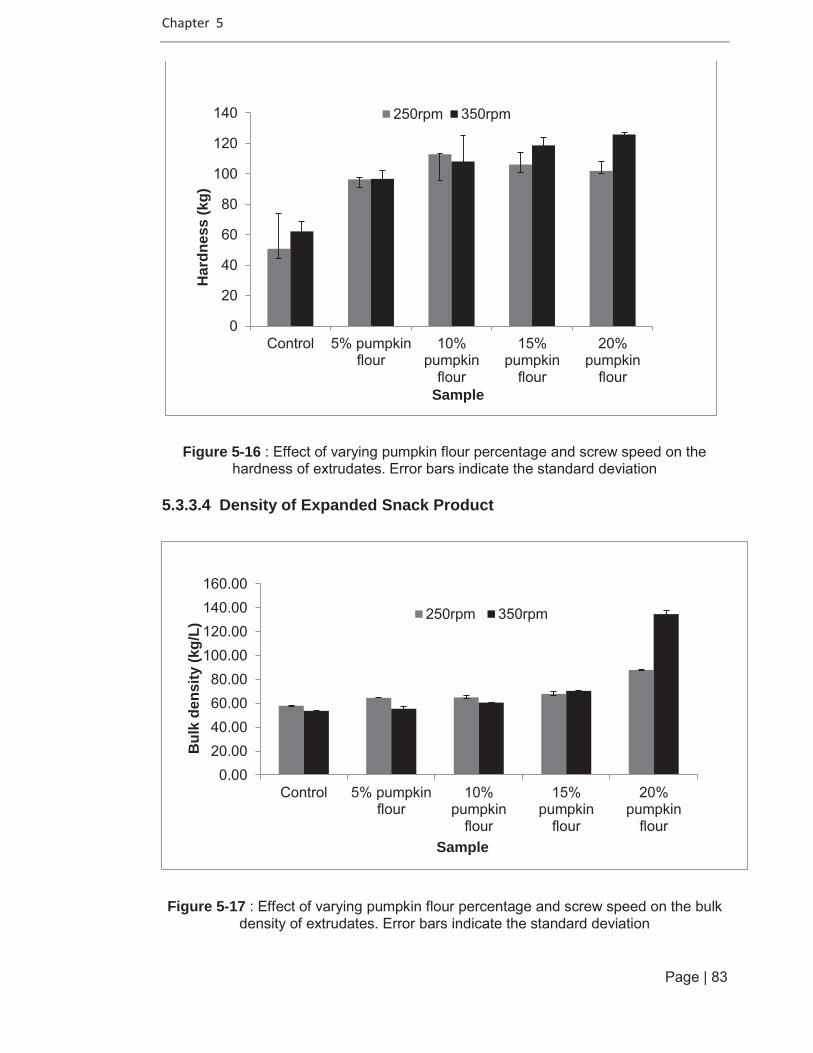
Chapter 5
Page | 83
Figure 5-16 : Effect of varying pumpkin flour percentage and screw speed on the hardness of extrudates. Error bars indicate the standard deviation
5.3.3.4 Density of Expanded Snack Product
Figure 5-17 : Effect of varying pumpkin flour percentage and screw speed on the bulk density of extrudates. Error bars indicate the standard deviation
0
20
40
60
80
100
120
140
Control 5% pumpkinflour
10%pumpkin
flour
15%pumpkin
flour
20%pumpkin
flour
Har
dnes
s (k
g)
Sample
250rpm 350rpm
0.0020.0040.0060.0080.00
100.00120.00140.00160.00
Control 5% pumpkinflour
10%pumpkin
flour
15%pumpkin
flour
20%pumpkin
flour
Bul
k de
nsity
(kg/
L)
Sample
250rpm 350rpm

Chapter 5
Page | 84
Bulk density (BD) and true density (TD) of the expanded pellets are shown in Figure 5-17 and Figure 5-18. The bulk density ranged from 53.7 for the corn pellets to 134.7
kg/L for those containing 20% pumpkin flour. The true density was about 1.7 times
greater than bulk density and ranged from 94.4 to 226.0 kg/L. As the level of pumpkin
flour added into the blend was increased from 0 to 15% the BD and TD only increased
by 5-15% for the 350 rpm screw speed. However when the level of pumpkin flour was
increased from 15% to 20% the BD and TD approximately doubled. At a screw speed
of 250 rpm, BD and TD increased by only 25% and 15% respectively as the pumpkin
flour content was increased from 15 to 20%.
Figure 5-18 : Effect of varying pumpkin flour percentage and screw speed on the true density of extruded products. Error bars indicate the standard deviation
0
50
100
150
200
250
Control 5%pumpkin
flour
10%pumpkin
flour
15%pumpkin
flour
20%pumpkin
flour
True
den
sity
(kg/
L)
Sample
250rpm 350rpm

Chap
ter
5
Page
| 85
5.3.
3.5
Pear
son
Cor
rela
tion
Inte
rrel
atio
nshi
p
Tabl
e 5-
4 : T
he e
ffect
and
rela
tions
hips
bet
wee
n ex
perim
ent v
aria
bles
, con
trol v
aria
bles
and
phy
sica
l cha
ract
eris
tics
of e
xtru
ded
snac
ks m
ade
from
pum
pkin
flou
r-co
rn g
rits.
Expe
rimen
tal V
aria
ble
Con
trol V
aria
ble
Mea
sure
d V
aria
ble
Scr
ew
Spe
ed
(rpm
)
Per
cent
age
of C
orn
Grit
s (%
)
Per
cent
age
of P
umpk
in
Flou
r (%
)
Pow
er
Con
sum
ptio
n (k
W)
Torq
ue
(Nm
)
Pre
ssur
e Th
rust
(B
ar)
Spe
cific
M
echa
nica
l E
nerg
y (k
Whr
/kg)
Exp
ansi
on
Rat
io
(long
itudi
nal)
Har
dnes
s (k
g)
Bul
k D
ensi
ty
(kg/
l)
True
D
ensi
ty
(kg/
l) S
crew
Spe
ed
(rpm
) 1.
00
Per
cent
age
of
Cor
n G
rits
(%)
0.00
1.
00
P
erce
ntag
e of
P
umpk
in F
lour
(%
) 0.
00
-1.0
0 1.
00
Pow
er
Con
sum
ptio
n (k
W)
0.21
0.
70
-0.7
0 1.
00
Torq
ue (N
m)
-0.5
8 0.
58
-0.5
8 0.
63
1.00
P
ress
ure
Thru
st
(Bar
) -0
.49
-0.6
5 0.
65
-0.8
6 -0
.32
1.00
Spe
cific
M
echa
nica
l E
nerg
y (k
Whr
/kg)
0.
14
0.72
-0
.72
0.99
0.
67
-0.8
3 1.
00
Exp
ansi
on R
atio
(lo
ngitu
dina
l) -0
.43
0.58
-0
.58
0.58
0.
74
-0.4
9 0.
63
1.00
Har
dnes
s (k
g)
0.18
-0
.78
0.78
-0
.79
-0.8
1 0.
64
-0.8
4 -0
.76
1.00
B
ulk
Den
sity
(k
g/l)
0.14
-0
.74
0.74
-0
.29
-0.3
0 0.
25
-0.3
5 -0
.44
0.53
1.
00
Tr
ue D
ensi
ty
(kg/
l) 0.
09
-0.7
3 0.
73
-0.2
6 -0
.23
0.28
-0
.31
-0.4
5 0.
48
0.98
1.
00

Chapter 5
Page | 86
Table 5-4 above shows the correlation coefficients for the relationship between
experimental variables, the control variables and physical characteristics of extruded
products made from pumpkin flour and corn grits.
26% of the variables were found to be correlated with a value for r2 that was greater
than 0.5. Screw speed was found to be negatively correlated (r2=-0.58) with torque.
This indicates that, as screw speed increased, torque decreased due to lower barrel fill
which may decrease the resistance against melt viscosity and thus result in lesser
resistance to screw rotation and lower motor torque (Lu., 1992).
Another possible explanation is that the increased shear rate resulting from the
increases in screw speed results in an increased level of shear thinning of the melt. It is
also expected that the melt temperature will increase with shear also contributing to
decreases in melt viscosity.
When pumpkin flour was added to the formulations power consumption (r2=-0.70),
torque (r2=-0.58) and SME (r2=-0.72) decreased. This shows that the three parameters
were proportional to the product expansion. The presence of sugar, fibre and pectin in
pumpkin flour reduce melt viscosity so reducing power decreased the expansion of the
final product. SME was found to be highly positively correlated to power consumption
(r2=0.99). As expected, hardness was found to be correlated to bulk density (r2=0.53)
and true density (r2=0.48).
5.3.4 Texture Analysis of Product Mapping
A random and general texture mapping of commercial snack foods was used to
compare the hardness and crispiness of pumpkin flour – corn grits expanded snack
products. It was also used as a standard reference in order to get a desired texture
acceptable to the consumers. However, this cannot be a true comparison due to
different raw ingredients used, different extrusion conditions used and moreover, most
of the commercial snacks were coated with seasoning that may lower the hardness
and crispiness. Therefore due to this phenomenon, pumpkin flour-corn grits expanded
snacks were found to be harder with less crispiness. This is shown in Figure 5-19.
Hardness of some of the samples fell within the range of commercial snacks. Two
different patterns are observed in the graph. Therefore, it will be a great challenge to
develop the desired and accepted texture with pumpkin flour – corn grits.
Recommendation: use a different grain based flour such as rice flour or other grains.
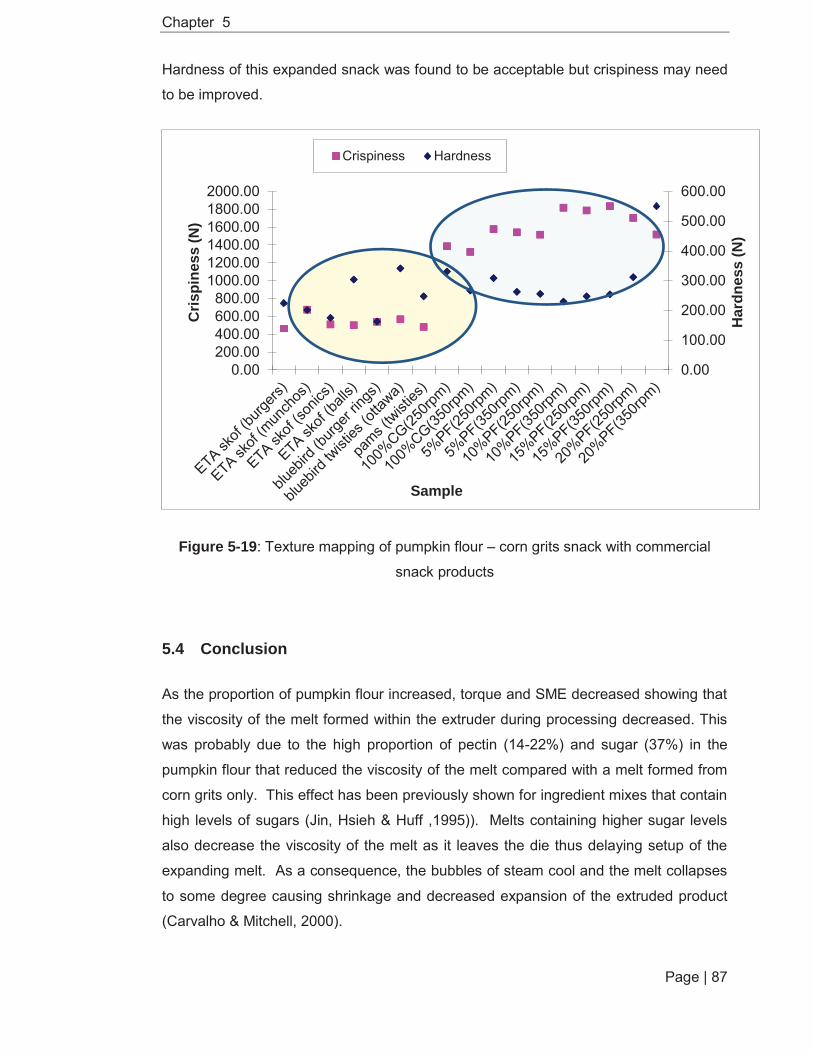
Chapter 5
Page | 87
Hardness of this expanded snack was found to be acceptable but crispiness may need
to be improved.
Figure 5-19: Texture mapping of pumpkin flour – corn grits snack with commercial
snack products
5.4 Conclusion
As the proportion of pumpkin flour increased, torque and SME decreased showing that
the viscosity of the melt formed within the extruder during processing decreased. This
was probably due to the high proportion of pectin (14-22%) and sugar (37%) in the
pumpkin flour that reduced the viscosity of the melt compared with a melt formed from
corn grits only. This effect has been previously shown for ingredient mixes that contain
high levels of sugars (Jin, Hsieh & Huff ,1995)). Melts containing higher sugar levels
also decrease the viscosity of the melt as it leaves the die thus delaying setup of the
expanding melt. As a consequence, the bubbles of steam cool and the melt collapses
to some degree causing shrinkage and decreased expansion of the extruded product
(Carvalho & Mitchell, 2000).
0.00
100.00
200.00
300.00
400.00
500.00
600.00
0.00200.00400.00600.00800.00
1000.001200.001400.001600.001800.002000.00
Har
dnes
s (N
)
Cris
pine
ss (N
)
Sample
Crispiness Hardness
Chapter 5
Page | 88
During this work it was possible to keep the SME near constant for all treatments
except the 100% corn grits for which torque and SME were about 64% greater than for
the treatments including pumpkin flour. The lubricating effect of the sugar and pectin
components in the pumpkin flour were clear although it is surprising that the effect
stabilised after the addition of 5% of pumpkin flour. This effect is evident throughout
this work and the expansion ratio, hardness, densities and probably the void area of
extruded product made with 10, 15 or 20% of pumpkin flour were not significantly
different. This may be because the sugar and pectin in the pumpkin flour preferentially
coats the working surfaces in the extruder possibly by the formation of a depletion
layer.
As the proportion of pumpkin flour increased from 0 to about 10%, the extruded pellets
approximately doubled in hardness but decreased in their true density. Among the
variables, power consumption and SME were found to have a higher value of positive
correlation (r2=0.99).This work has shown that snack foods can be produced from
combinations of corn grits and pumpkin products. Although, the texture of this product
was about 40% harder than for typical corn based products the bulk density was similar
up to the addition of 15% of pumpkin flour. Preliminary work (Hardacre unpublished)
had shown that at levels of pumpkin flour of greater than 20% very little expansion in
the extruded products could be achieved. At all levels of added pumpkin powder below
20%, the hardness of the pellets seemed to be determined by the strength of the
bubble walls and not by the number and distribution of bubbles measured as the void
volume in the extruded pellets or by bulk density (as discussed in section 7.3.4.)

Chapter 6
Page | 89
Chapter 6: Product Optimisation
In this chapter, Response Surface Methodology (RSM) and its application in steady
state modelling of the extrusion processing of pumpkin flour –corn grits snacks are
discussed with a particular focus on process conditions, extrusion parameters and
product characteristics.
6.1 Introduction
Response surface methodology (RSM) refers to a group of statistical and
mathematical techniques for developing, improving and optimising processes (Bas&
Boyaci., 2007).Giovanni (1983) defines Response Surface Methodology (RSM) as a
statistical mathematical method that uses quantitative data in an experimental design
to determine and simultaneously solve multivariate equations, in order to optimise
processes and products. Myers and Montgomery (2002) stated that, the application
and results of RSM cover the effects of the independent variables and their
combination on the process. Originally the principles and ideas of RSM were presented
by Box and Wilson (1951).The application of RSM has since covered a wide range of
design and development, enabling the optimisation of new product formulation and
improvement of existing products in various industries such as polymers and the food
industry. RSM is a good tool for providing information from a large amount of data
within the shortest time and with the least amount of analysis and can also be used to
determine interactions and relationships among variables. Moreover, RSM is a useful
tool to optimise a process. However, the disadvantage of RSM is that the data
transformation process for a non-linear system may not give desirable results and thus
may need more critical determination of the independent parameter range for more
precise analysis.
Regression equations are the primary results obtained, and these are used to interpret
the importance and significance for each variable, to determine the interactions and
relationships between variables and also to predict the pattern of relationships such as
a linear, curved or quadratic response surface (Olkku, Hagqvist & Linko, 1983). A good
indicator and prediction of the model can be determined by a non-significant lack of fit
( Myers & Montogomery, 2002). The coefficient of variation (C.V ) is used to measure
the reproducibility of the models, where if the CV is not greater than 10% ,it can be
considered as a reasonable and reproducible model (Firatligil-Durmus & Evranuz,
Chapter 6
Page | 90
2010). The C.V also indicates the relative dispersion of the experimental points from
the prediction models. The coefficient of determination (R2) is the ratio of the explained
variation to the total variation and is used to measure the degree of fit (Haber &
Runyon., 1977). Overall the adequacy of the models is based on model analysis, lack-
of-fit test and the coefficient of determination (R2) (Lee, Ye, Landen & Eitenmiller
(2000); Weng, Liu & Lin (2001)). If the adequate precision value is greater than 4.0, the
model can be used to navigate the design space (Montgomery & Wiley, 2001).
Extrusion processes are affected by numerous parameters and basically can be
divided into three main variables; Process variables, Extrusion variables and Product
characteristics variables. Prediction and optimisation of product quality in the food
industry is a major concern (Olkku, Hagqvist & Linko, 1983) especially in developing
new snack products from new to extrusion raw material such as pumpkin flour where it
is unknown how such an ingredient behaves. Therefore, the objective of this
experiment was to determine by using RSM the optimum combination of extrusion
variables for the production of an extruded product from pumpkin flour when used in
combination with corn grits which is a more common snack extrusion ingredient.
6.2 Materials and Methods 6.2.1 Extrusion Conditions
Extrusion was performed using a Clextral B21 twin-screw co-rotating laboratory scale
extruder (Clextral, Firminy Cedex, France) with three different screw configurations; A-
Forward, 13mm pitch, 50mm length, B-Forward, 10mm pitch, 50mm length, C-Forward,
7mm pitch, 50mm length. The extruding was running at a constant screw speed of
300rpm with 55rpm cutter speed. A die opening of 3.0 mm diameter was used. The
internal barrel width was 46mm, height 25mm and screw diameter 24.7mm.
6.2.2 Experimental Design
Response Surface Methodology (RSM) was used to find ideal and optimal process
parameters for the pumpkin-corn grits extrusion. The experimental design was based
on a central composite design (CCD) with three independent variables X1- barrel
temperature, X2- feed rate, and X3- percentage of pumpkin flour. Dependent variables
were the extrusion parameters of torque, SME, power consumption, and pressure
thrust and the physical characteristics of expansion, bulk density, true density,
hardness, colour analysis and total carotenoid. The plot generations and statistical

Chapter 6
Page | 91
analysis were performed using the commercial statistical package of Design Expert
software version 6.0.2 (Statease Inc., Minneapolis, MN, USA). The three levels of
process variables were coded as -1, 0 and 1 as shown in Table 6-1 below. The actual
levels of extrusion conditions are summarised in Table 6-3.
Table 6-1 : Coded levels for the independent variables
Variable α Coded level
α
-1.682 -1 0 1 1.682
X1 – Barrel Temperature
(C)
116.36
130
150
170
183.64
X2 – Feed Rate (kg/hr)
9.99
10.5
11.25
12
12.51
X3 – Pumpkin Flour (%)
0
5
15
25
31.82
The alpha (α) represents low and high values for each factor; Barrel temperature, Feed
rate and pumpkin flour percentage respectively. The value of α depends on the number
of factors in the factorial part of the design as shown in Table 6.2 below.
Table 6-2 : Determining α for Rotatability Number of
Factors Factorial Portion
Scaled Value for Relative to ±1
2 22 22/4 = 1.414 3 23 23/4 = 1.682 4 24 24/4 = 2.000 5 25-1 24/4 = 2.000 5 25 25/4 = 2.378 6 26-1 25/4 = 2.378 6 26 26/4 = 2.828

Chapter 6
Page | 92
Table 6-3 : Extrusion conditions with actual variable levels for experimental design
Run
Barrel temperature (C)
Feed rate (kg/hr)
Pumpkin level (%)
1 150.00 12.51 15.00
2 150.00 11.25 15.00
3 150.00 9.99 15.00
4 183.64 11.25 15.00
5 130.00 10.50 25.00
6 170.00 12.00 25.00
7 116.36 11.25 15.00
8 130.00 12.00 5.00
9 150.00 11.25 15.00
10 150.00 11.25 31.82
11 150.00 11.25 0
12 150.00 11.25 15.00
13 150.00 11.25 15.00
14 170.00 10.50 25.00
15 170.00 10.50 5.00
16 150.00 11.25 15.00
17 130.00 12.00 25.00
18 150.00 11.25 15.00
19 170.00 12.00 5.00
20 130.00 10.50 5.00
6.2.3 Extrusion Parameters Analysis
Extrusion parameters consisting of power consumption, torque, specific
mechanical energy (SME), and pressure thrust were analysed according the methods
mentioned in Chapter 5.
6.2.4 Product Analysis
Expansion, density, hardness and colour analysis on extruded product were
determined as described in Chapter 5.

Chapter 6
Page | 93
6.2.5 Total Carotenoid Analysis
Extraction of carotenoid in the pumpkin flour – corn grits extruded product was
carried out according to the method of Kean, Hamaker and Fernizi., (2008) with minor
modifications. A 1 gram sample was homogenised/dissolved in/with 5 ml of a 10mg/ml
porcine pancreatin solution and then incubated at 37 C in a shaking water bath for 20
minutes. A 20 ml aliquot of a solvent mixture comprised of petroleum ether: acetone
(3:1 v/v) containing 0.1% (w/v) butylated hydroxytolouene (BHT) was added and
shaken vigorously for 1 min to facilitate the separation. The suspension was held at
room temperature and minimum light exposure for 15 minutes to allow further
separation of polar (water) and nonpolar (solvent) phases. The upper layer containing
total carotenoid was collected and the absorbance at 450nm was measured using a
UV-visible spectrophotometer (Helios Epsilon spectrophotometer; Thermo Electron
Corporation, Pittsford, NY, USA). For data quantification, a standard curve of pure
carotene solution was prepared.
6.2.5.1 Total Carotenoid Standard Curve
A series of concentrations ((0.01, 0.02, 0.03, 0.04, 0.001 and 0.02 mg/ml) of β-
carotene standard purchased from Sigma-Aldrich,NZ Ltd were dissolved in
petroleum ether. The colour intensity of the β-carotene was then measured at
ʌ=450nm and a standard calibration curve of concentration versus absorbance was
plotted with R2= 0.9904.
6.3 Results and Discussion 6.3.1 Extrusion Parameters
Extrusion parameters play a major role in extrusion processing and they reflect
the energy consumption and extruder efficiency during the process. Moreover they also
influence the final product characteristics. The effect of process conditions of X1 –
barrel temperature, X2- feed rate and X3- pumpkin flour percentage on the power
consumption, torque, thrust pressure and specific mechanical energy (SME) were
studied.
The regression models for power consumption(kw), torque (Nm), pressure thrust (Bar)
and specific mechanical energy (SME) showed r2 >0.5. None of the models show
significant lack-of-fit (P>0.05).
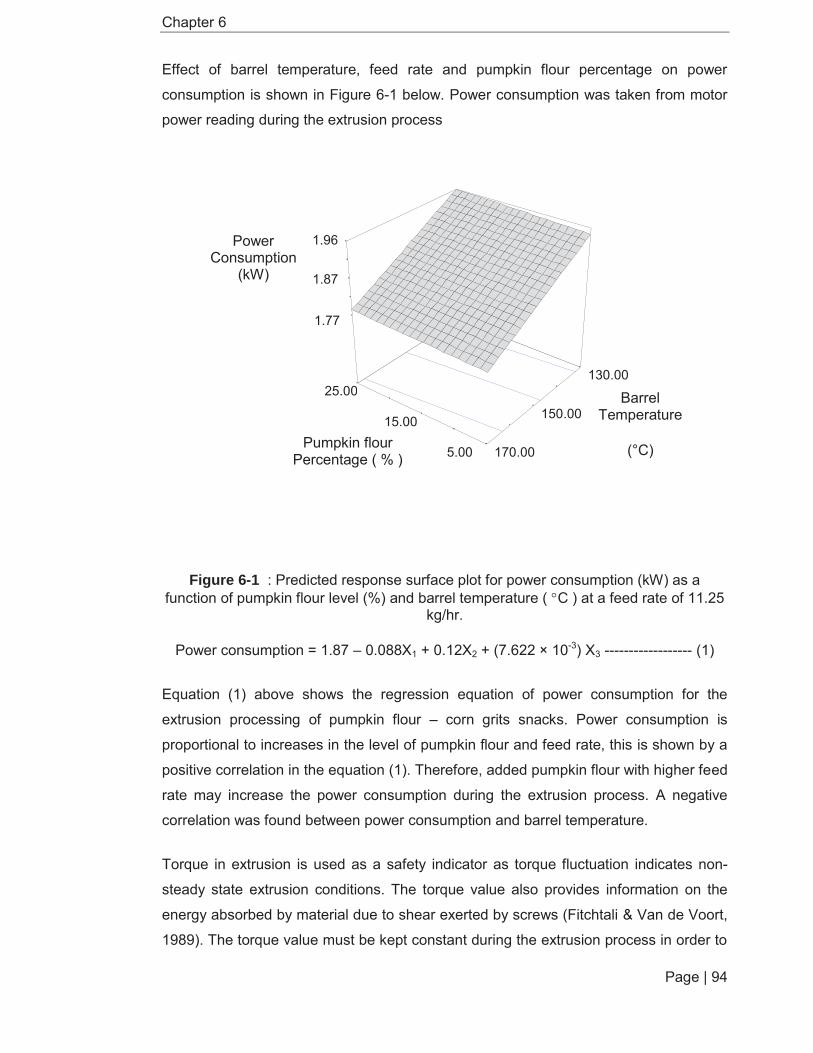
Chapter 6
Page | 94
Effect of barrel temperature, feed rate and pumpkin flour percentage on power
consumption is shown in Figure 6-1 below. Power consumption was taken from motor
power reading during the extrusion process
Figure 6-1 : Predicted response surface plot for power consumption (kW) as a function of pumpkin flour level (%) and barrel temperature ( C ) at a feed rate of 11.25
kg/hr.
Power consumption = 1.87 – 0.088X1 + 0.12X2 + (7.622 × 10-3) X3 ------------------ (1)
Equation (1) above shows the regression equation of power consumption for the
extrusion processing of pumpkin flour – corn grits snacks. Power consumption is
proportional to increases in the level of pumpkin flour and feed rate, this is shown by a
positive correlation in the equation (1). Therefore, added pumpkin flour with higher feed
rate may increase the power consumption during the extrusion process. A negative
correlation was found between power consumption and barrel temperature.
Torque in extrusion is used as a safety indicator as torque fluctuation indicates non-
steady state extrusion conditions. The torque value also provides information on the
energy absorbed by material due to shear exerted by screws (Fitchtali & Van de Voort,
1989). The torque value must be kept constant during the extrusion process in order to
1.77
1.87
1.96 Power Consumption
(kW)
5.00
15.00
25.00 130.00
150.00
170.00Pumpkin flour
Percentage ( % )
Barrel Temperature
(°C)

Chapter 6
Page | 95
7.34 7 34
7.79
8.23
Torque (Nm)
5.00
15.00
25.00 130.00
150.00
170.00
Pumpkin flour Percentage (%)
Barrel Temperature(°C )
provide stable processing conditions. The results of this work showed that torque
ranged from 5.85 – 9.30 Nm.
Figure 6-2 shows response surface plot for torque (Nm) as a function of pumpkin flour
level (%) and barrel temperature ( C ) at a feed rate of 11.25 kg/hr.
Figure 6-2 : Predicted response surface plot for torque (Nm) as a function of pumpkin flour level (%) and barrel temperature ( C ) at a constant feed rate of 11.25 kg/hr.
The predicted model for torque in this experiment is as follows:
Torque = 7.79 – 0.44X1 + 0.56X2 – (6.957 10-3)X3 -----------------------( 2 )
Based on the equation (2) above, torque was found to be negatively correlated with the
barrel temperature (X1), thus indicated increased of barrel temperature, decreased
torque value at pumpkin flour at 15%. The coefficient of variation (C.V) of the torque
was found to be relatively less than 10% (C.V= 7.17), which indicates that this model
can be used in optimising the extrusion conditions for a pumpkin flour-corn grits
extrudate snack. A positive correlation is shown between the torque and feed rate. As
feed rate increased, there was a concomitant increase in torque. Increasing the feed
rate may result in development of the resistance required to turn the screw as the

Chapter 6
Page | 96
0.14
0.15 0 15
0.17 Specific
Mechanical Energy
(kWhr/kg)
5.00
15.00
25.00
130.00
150.0
0
170.00
Pumpkin flour Percentage (%)
0Barrel Temperature
(°C)
number of filled flight of extruder barrel increased. Therefore, there is a need for more
mechanical power to dissipate into the material during extrusion processing, as a result
the value of torque will increase (Liang, Huff & Hsieh, 2002).
The effects of pumpkin flour percentage, barrel temperature and feed rate on specific
mechanical energy (SME) of extruded snacks made from a pumpkin flour- corn grits
mixture are shown in Figure 6--3.
Figure 6-3 : Response surface plot for specific mechanical energy (kwhr/kg)as a function of pumpkin flour level (%) and barrel temperature ( C ) at a feed rate of 11.25
kg/hr.
Specific mechanical energy
(SME) = 0.16 – (6.024 10-3) X1 + (1.714 10-3) X2– (7.722 10-3)X3 --------------------(3)
The regression equation for SME was fitted using a linear model as stated above
(equation 3). No interaction among the variables was found. The analysis of variance
(ANOVA) for SME indicates a linear effect with r2 = 0.5357 at P<0.01 and coefficient of
variation (C.V) 5.41. As the correlation coefficient value (r2) <0.6 the relationship is not

Chapter 6
Page | 97
strong, but the C.V was <10% which indicates that this model is reliable and can be
applied to the extrusion processing of pumpkin flour-corn grits mixtures. The F-value
for SME was found to be significant (P<0.05), while the lack of fit was not significant
(P>0.05). As the SME increases, the barrel temperature decreases, which is a similar
result to that reported by Altan, McCarthy and Maskan, (2008) for a barley-pomace
extrudate product. The effects of pumpkin flour level and barrel temperature on SME
are shown in Figure 6-3 above. It is evident from Figure 6-6 that the higher the SME
value the better the product’s expansion. From equation (3) there are three ways of
increasing SME, however for a given pumpkin – corn grits formulation this reduces to
two variables. Although decreasing X1 (barrel temperature) will increase SME it will
result in reduced expansion as the driving force for expansion is related to the rate of
liquid water converting to vapour on the release of pressure upon exiting the die. The
rate of conversion from liquid water to vapour is relative to the magnitude of the
temperature difference between the liquid water in the extrudate at the point of die exit
and the boiling point of water under the pressure conditions of the post-die
environment. Therefore the only lever available to the manufacturer to increase SME is
through increasing the feed rate (X2). In contrast a lower SME resulted in reduced
expansion. According to Erdemir (1989) a lower SME results in a lower degree of
molecular breakdown of starch and thus will reduce the expansion.
Pressure thrust = 69.22 – 11.30X1 + 3.14X2 + 2.53X3 -------------------------- (4)
The RSM analysis suggested that a linear relationship exists between the pressure
thrust and the three process variables assessed in this work. The main variable
affecting pressure thrust was the barrel temperature which had approximately 4-5 times
the effect on pressures thrust as feed rate (X2) and the level of pumpkin flour (X1). At
low barrel temperature, pressure thrust increased only incrementally with increases in
either feed rate or pumpkin flour level. Analysis of variance, shows that the model as a
whole has a high correlation coefficient (r2= 0.8561) with the model accounting for 85%
of the total variation observed in the data collected. The model is also reliable with a
C.V. of less than 10% (C.V= 6.57). The regression was found to be statistically
significantly with a P value of <0.001). No interaction between variables was found.
The response surface plot for pressure thrust is shown in Figure 6-4.
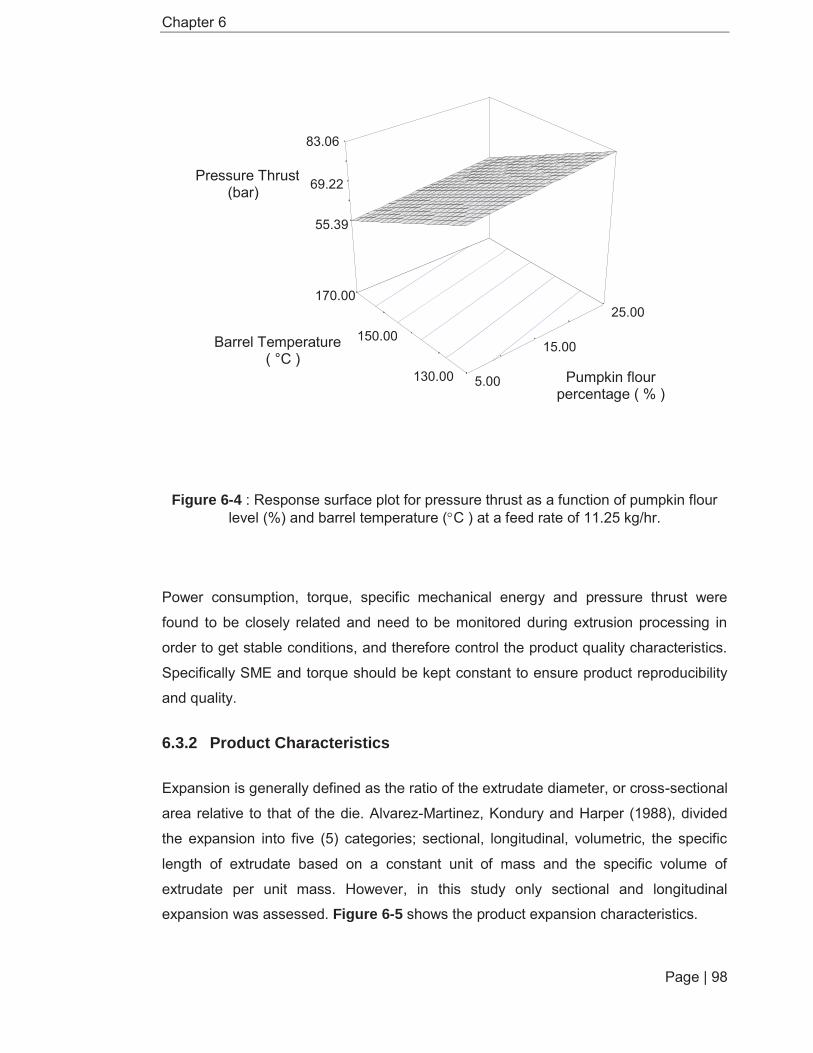
Chapter 6
Page | 98
Figure 6-4 : Response surface plot for pressure thrust as a function of pumpkin flour level (%) and barrel temperature ( C ) at a feed rate of 11.25 kg/hr.
Power consumption, torque, specific mechanical energy and pressure thrust were
found to be closely related and need to be monitored during extrusion processing in
order to get stable conditions, and therefore control the product quality characteristics.
Specifically SME and torque should be kept constant to ensure product reproducibility
and quality.
6.3.2 Product Characteristics
Expansion is generally defined as the ratio of the extrudate diameter, or cross-sectional
area relative to that of the die. Alvarez-Martinez, Kondury and Harper (1988), divided
the expansion into five (5) categories; sectional, longitudinal, volumetric, the specific
length of extrudate based on a constant unit of mass and the specific volume of
extrudate per unit mass. However, in this study only sectional and longitudinal
expansion was assessed. Figure 6-5 shows the product expansion characteristics.
55.39
69.22
83.06
Pressure Thrust (bar)
5.00
15.00
25.00
130.00
150.00
170.00
Pumpkin flour percentage ( % )
Barrel Temperature ( °C )

Chapter 6
Page | 99
Figure 6-5 : Product expansion characteristics
Longitudinal Expansion = 22.28 + 1.59X1 + 0.93X2 – 0.64X3 ---------------------------- (5)
The Longitudinal Expansion Index is calculated using the ratio of the exiting velocity of
the extrudate after expansion to its velocity in the die orifice. The response surface plot
below (Figure 6-6) shows that longitudinal expansion increases with increases in barrel
temperature and feed rate, however the expansion decreases with increases in barrel
temperature above 183.64°C and above feed rates of 12.51kg/hr. This effect is thought
to be due to excessive structure breakdown and starch degradation at high
temperature and feed rate, which may result in structure collapse. A similar result has
also been reported by Dogan and Karwe (2003) and Ilo, Tomschik, Berghofer and
Mundigler., (1996). Increasing the level of pumpkin flour was found to be negatively
correlated to the longitudinal expansion.

Chapter 6
Page | 100
Figure 6-6 : Longitudinal expansion of extrudate product as a function of barrel temperature and pumpkin flour percentage at a constant feed rate of 11.25kg/hr
The maximum expansion ratio (24.73) of extrudate products at coded point (0,-1, 0)
was about 1.4 times more than the minimum expansion (17.35) at the same coded
point. The model of F-value of 10.35 implies that the model is of statistical significance
with a P value of 0.05. This model can be used for prediction purposes as the adequate
precision (10.931) is greater than 4.0 (Montgomery, 2001). The effect of barrel
temperature, feed rate and pumpkin flour level on longitudinal expansion of the
extrudate is shown in Figure 6-6.
Sectional expansion or radial expansion is referred to as the movement of cooked melt
perpendicular to the flow.
Sectional expansion
= 12.22 – 0.26X1 + 0.36X2 – 2.14X3- 0.11X12 + 0.12X2
2 – 0.86X32 + 0.27X1X2 + 0.47X1X3 –
0.056X2X3 ----------------------------------- ( 6 )
20.05 20 05
22.28 22 28
24.50
Longitudinal expansion ratio
5.00
15.00
25.00
130.0
150.0
170.0
Pumpkin flour Percentage (%)
Barrel Temperature (°C )

Chapter 6
Page | 101
The response surface plot for sectional expansion of the extruded product as a function
of barrel temperature and pumpkin flour concentration at a constant feed rate of
11.25kg/hr is shown in Figure 6-7 below.
Figure 6-7 : Sectional expansion of extruded product as a function of barrel temperature and pumpkin flour concentration (%) at a constant feed rate of 11.25kg/hr
The model fitted to the sectional expansion ratio data is shown in equation 6 and unlike
the other models presented earlier in this chapter include the quadratic as well as linear
effects for all variables. The sectional expansion ratio of pumpkin flour –corn grits
extruded products ranged between 8.2–14.59. A high value of coefficient of
determination (r2- 0.9090) with coefficient of variation (C.V = 7.63) less than 10% was
observed.
Both of the analyses resulting from equations 5 and 6 indicate that the key variable
affecting the longitudinal and sectional expansion ratios of pumpkin flour –corn grits
extrudate products, is the barrel temperature which if increased leads to lower melt
viscosity and hence would increase the longitudinal expansion and concomitantly
8.90
11.50 11 50
14.11
1Sectional expansion
ratio
130.00
150.00
170.00
5.00 15.00
25.00 50.00
Barrel Temperature ( C)
Pumpkin flour Percentage (%)
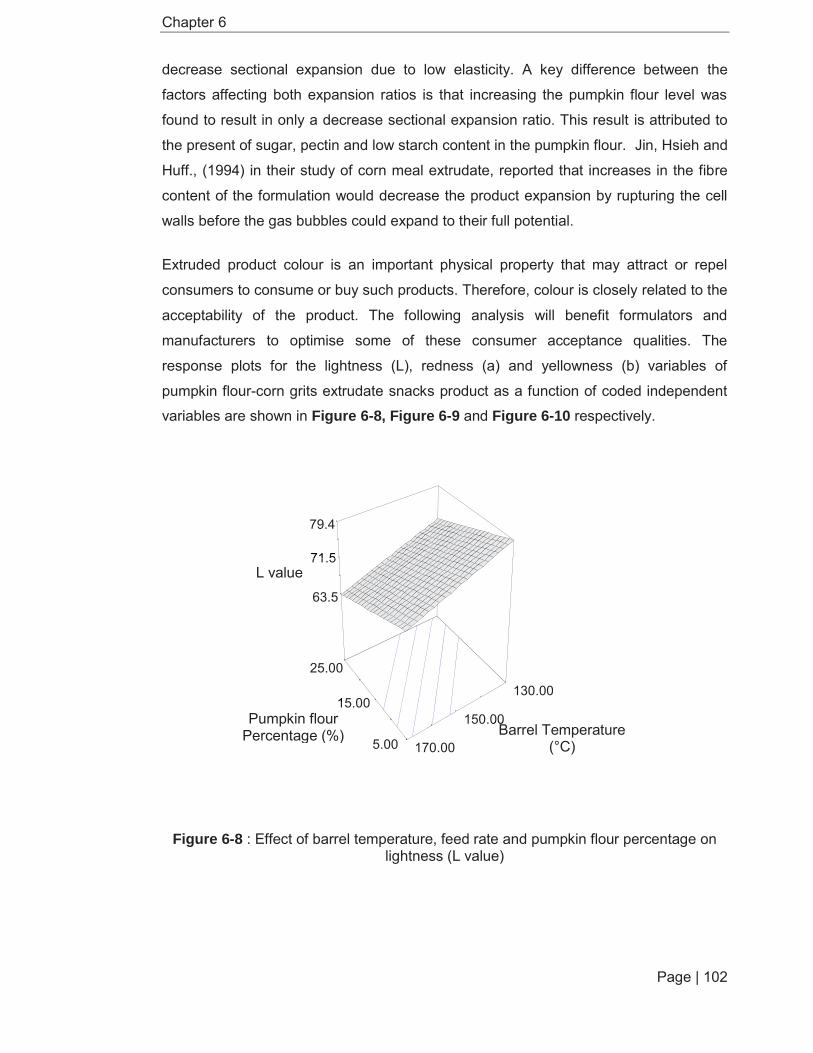
Chapter 6
Page | 102
decrease sectional expansion due to low elasticity. A key difference between the
factors affecting both expansion ratios is that increasing the pumpkin flour level was
found to result in only a decrease sectional expansion ratio. This result is attributed to
the present of sugar, pectin and low starch content in the pumpkin flour. Jin, Hsieh and
Huff., (1994) in their study of corn meal extrudate, reported that increases in the fibre
content of the formulation would decrease the product expansion by rupturing the cell
walls before the gas bubbles could expand to their full potential.
Extruded product colour is an important physical property that may attract or repel
consumers to consume or buy such products. Therefore, colour is closely related to the
acceptability of the product. The following analysis will benefit formulators and
manufacturers to optimise some of these consumer acceptance qualities. The
response plots for the lightness (L), redness (a) and yellowness (b) variables of
pumpkin flour-corn grits extrudate snacks product as a function of coded independent
variables are shown in Figure 6-8, Figure 6-9 and Figure 6-10 respectively.
Figure 6-8 : Effect of barrel temperature, feed rate and pumpkin flour percentage on lightness (L value)
63.5
71.5 71 5
79.4
L value
5.00
15.00 1
25.00
130.00
150.00
170.00
Pumpkin flour Percentage (%)
00Barrel Temperature
(°C)

Chapter 6
Page | 103
Figure 6-9 : Effect of barrel temperature, feed rate and pumpkin flour percentage on redness ( a value)
Figure 6-10 : Effect of barrel temperature, feed rate and pumpkin flour percentage on yellowness b value)
1.49 1 49
3.77
6.05
a va
lue
5.00
15.00
25.00
130.00
150.00
170.00
00 Pumpkin flour Percentage (%)
1Barrel Temperature
(° C )
35.8
38.0
40.2
b value
5.00
15.00
25.00
130.00 150.00
170.00
Pumpkin flour Percentage (%)
Barrel Temperature ( C )
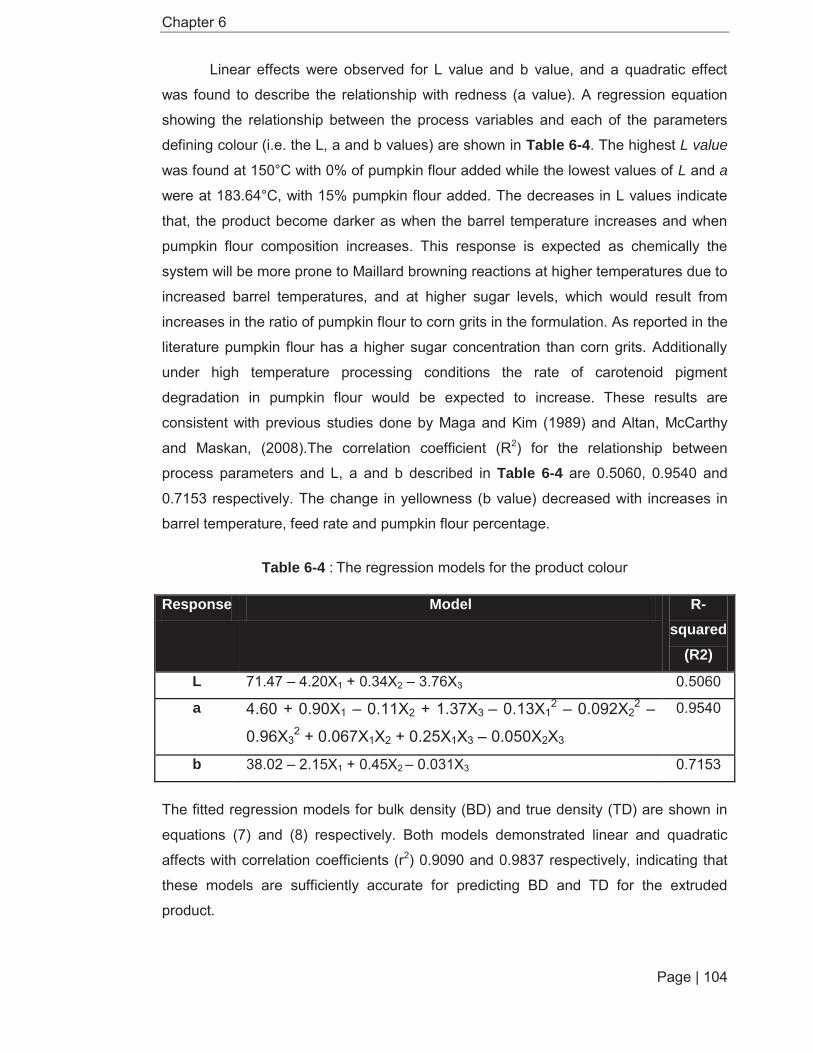
Chapter 6
Page | 104
Linear effects were observed for L value and b value, and a quadratic effect
was found to describe the relationship with redness (a value). A regression equation
showing the relationship between the process variables and each of the parameters
defining colour (i.e. the L, a and b values) are shown in Table 6-4. The highest L value
was found at 150°C with 0% of pumpkin flour added while the lowest values of L and a
were at 183.64°C, with 15% pumpkin flour added. The decreases in L values indicate
that, the product become darker as when the barrel temperature increases and when
pumpkin flour composition increases. This response is expected as chemically the
system will be more prone to Maillard browning reactions at higher temperatures due to
increased barrel temperatures, and at higher sugar levels, which would result from
increases in the ratio of pumpkin flour to corn grits in the formulation. As reported in the
literature pumpkin flour has a higher sugar concentration than corn grits. Additionally
under high temperature processing conditions the rate of carotenoid pigment
degradation in pumpkin flour would be expected to increase. These results are
consistent with previous studies done by Maga and Kim (1989) and Altan, McCarthy
and Maskan, (2008).The correlation coefficient (R2) for the relationship between
process parameters and L, a and b described in Table 6-4 are 0.5060, 0.9540 and
0.7153 respectively. The change in yellowness (b value) decreased with increases in
barrel temperature, feed rate and pumpkin flour percentage.
Table 6-4 : The regression models for the product colour
Response Model R-squared
(R2)
L 71.47 – 4.20X1 + 0.34X2 – 3.76X3 0.5060
a 4.60 + 0.90X1 – 0.11X2 + 1.37X3 – 0.13X12 – 0.092X2
2 –
0.96X32 + 0.067X1X2 + 0.25X1X3 – 0.050X2X3
0.9540
b 38.02 – 2.15X1 + 0.45X2 – 0.031X3 0.7153
The fitted regression models for bulk density (BD) and true density (TD) are shown in
equations (7) and (8) respectively. Both models demonstrated linear and quadratic
affects with correlation coefficients (r2) 0.9090 and 0.9837 respectively, indicating that
these models are sufficiently accurate for predicting BD and TD for the extruded
product.
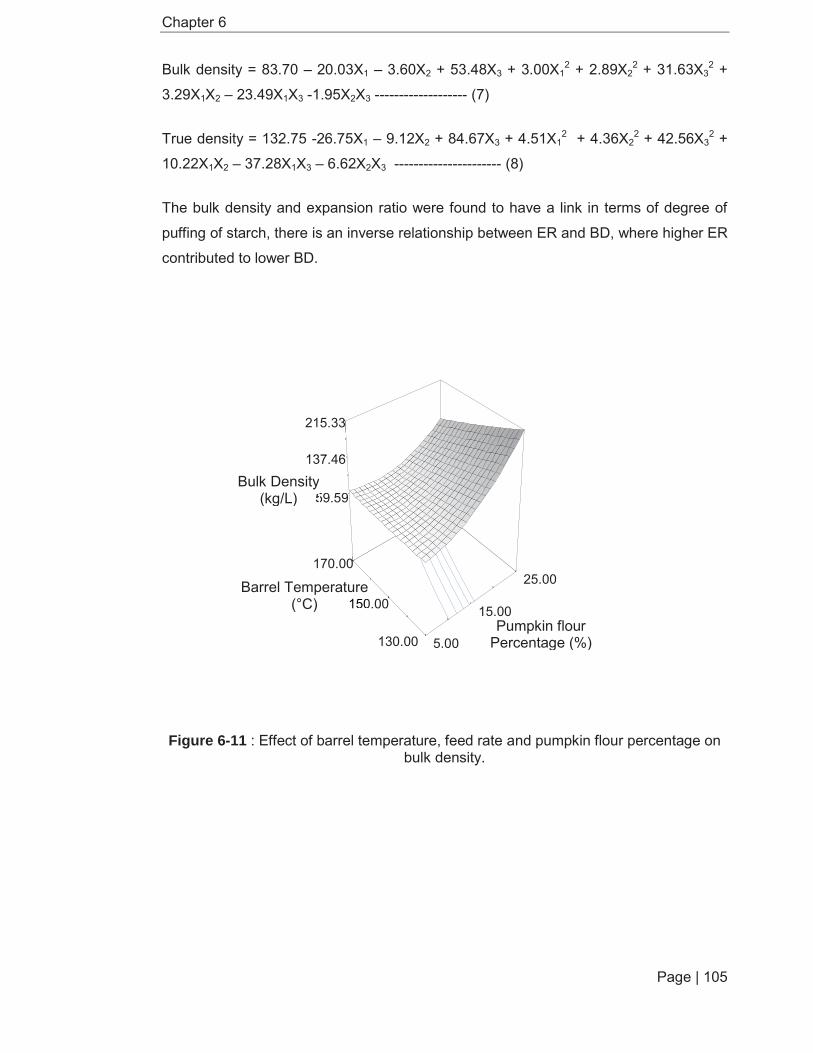
Chapter 6
Page | 105
Bulk density = 83.70 – 20.03X1 – 3.60X2 + 53.48X3 + 3.00X12 + 2.89X2
2 + 31.63X32 +
3.29X1X2 – 23.49X1X3 -1.95X2X3 ------------------- (7)
True density = 132.75 -26.75X1 – 9.12X2 + 84.67X3 + 4.51X12 + 4.36X2
2 + 42.56X32 +
10.22X1X2 – 37.28X1X3 – 6.62X2X3 ---------------------- (8)
The bulk density and expansion ratio were found to have a link in terms of degree of
puffing of starch, there is an inverse relationship between ER and BD, where higher ER
contributed to lower BD.
Figure 6-11 : Effect of barrel temperature, feed rate and pumpkin flour percentage on bulk density.
59.59 59 59
137.46 137 46
215.33
55Bulk Density
(kg/L)
5.00
15.00
25.00
130.00 13
150.00
170.00
Pumpkin flour Percentage (%)
150Barrel Temperature
(°C)

Chapter 6
Page | 106
Figure 6-12 : Effect of barrel temperature, feed rate and pumpkin flour percentage on true density
The relationship between product hardness and processing parameters is described by
a combination of linear and quadratic in equation 9. Hardness of the extrudate was
significantly (P<0.01) affected by the linear and quadratic effects of all variables. The
regression model (equation 9) for hardness showed a higher coefficient of
determination (r2 = 0.9638), which indicates that the model accounts for most of the
observed variation in the data collected for this study. However, the model has a C.V of
greater than 10% (23.14%) and a significant lack-of-fit (P<0.01). Therefore, the model
developed for the hardness of the pumpkin flour –corn grits snack product is
considered inadequate.
Hardness = 165.63 – 73.08X1 – 6.62X2 + 210.91X3 + 8.37X12 + 6.16X2
2 + 159.25X32 +
19.02X1X2 – 111.37X1X3 + 1.32X2X3 ------------------- (9)
The effect of pumpkin flour and barrel temperature on hardness is shown in the
response surface plot in Figure 6-13. The maximum hardness (996.97N) at coded point
(-1,0,1) was about 6.5 times greater than the minimum hardness (133.30N). The
average hardness for pumpkin flour- corn grits snack products was 298.51N. The
84.63 84 63
206.57 206 57
328.51 True
Density (kg/L)
5.00
15.00
25.00
130.00 1
150.00
170.00
Pumpkin flour percentage(%)
15 Barrel Temperature ( °C )

Chapter 6
Page | 107
hardness was found to be proportional to the bulk density of the product with both
increasing with barrel temperature (183.64°C). This is in line with studies done by Altan
et al. (2008) and Ding et al., (2005). As observed, as high percentage of pumpkin flour
added the final product is normally associated with a harder product structure. The
results from these experiments show that the minimum hardness value of the
extrudate was achieved at the highest barrel temperature (183.64°C) with 15%
pumpkin flour added at 11.25kg/hr feed rate.
Figure 6-13 : Effect of barrel temperature, feed rate and pumpkin flour percentage on the product hardness
The total carotenoid or Vitamin A precursor in fresh pumpkin was found to decrease
during the extrusion process. Product yellowness in the extruded product was mainly
due to the presence of carotenoid pigment.
As expected the carotenoid content of the final product increases linearly with the
concentration of carotenoid in the base formulation i.e. carotenoid content increases
with pumpkin flour content. The degradation of carotenoid during processing is a
combination of barrel temperature and feed rate. There was no evidence however of
interactions between processing variables and carotenoid degradation. Collectively the
84.1 84 1
406.3 06 3
728.6
4040Hardness
(N)
5.00
15.00
25.00
130.00 13
150.00
170.00
Pumpkin flour percentage (%)
1501Barrel
Temperature (°C )

Chapter 6
Page | 108
final total carotenoid content of the extruded product may be predicted from equation
10.
Lack of fit was found not statistically significant and thus indicates that the model is
adequate for prediction.
Total Carotenoid = 1.81 – 0.28X1 – 0.28X2 + 1.26X3 ------------------- (10)
Figure 6-14 : Effect of barrel temperature, feed rate and pumpkin flour percentage on the total carotenoid
0.26 0 26
1.81
3.36
00
1Total Carotenoid
(μg/ml)
5.00
15.00
25.00
130.00 13
150.00
170.00
0 Pumpkin flour Percentage
(%)
150Barrel
Temperature (°C)

Chapter 6
Page | 109
6.4 Summary of Results and Optimisation
Overall results of predicted responses were shown in Table 6.5 below. The adequacy
of the models was tested using coefficient of determination (R2). R2 with value more
than 0.8 was considered adequate (Herika,1982).Therefore the model of responses
that were found adequate were pressure thrust, sectional expansion, a value, bulk
density, true density, hardness and total carotenoid.
Table 6-5 : Analysis of varience (ANOVA) for response surface for dependant variables of pumpkin flour-corn grits snacks.
Response Lack of fit R2 Adjusted R2
Power Consumption (kW)
Not significant 0.73 0.68
Torque Not significant 0.58 0.50
Specific Mechanical Energy (SME)
Not significant 0.54 0.45
Pressure Thrust Not significant 0.86 0.83
Longitudinal Expansion
Not significant 0.66 0.60
Sectional Expansion
Not significant 0.91 0.83
L value Significant 0.51 0.41
a value Significant 0.95 0.91
b value Not significant 0.72 0.66
Bulk Density Significant 0.98 0.97
True Density Significant 0.98 0.96
Hardness Significant 0.96 0.93
Total Carotenoid Not significant 0.83 0.80

Chapter 6
Page | 110
Table 6-6 : Solutions for optimum conditions and responses
No. Barrel Temperature (°C)
Feed Rate (kg/hr)
Pumpkin flour (%)
Radial Expansion
Hardness SME Total carotenoid
Desirability
1 166.44 10.50 16.72 11.15 133.30 0.15 2.07 0.615
2 166.28 10.50 16.67 11.16 133.32 0.15 2.06 0.615
3 165.84 10.50 16.55 11.20 133.36 0.15 2.06 0.615
4 166.21 10.50 17.14 11.07 142.07 0.15 2.13 0.614
Figure 6-15 : Predicted response surface plot for the effect of feed rate and barrel temperature on radial expansion of pumpkin flour-corn grits snack.
11.0311.03
11.35 11.35
11.6711.67
11.99 11.99
12.31
Exp
ansi
on (r
adia
l)
130.00 .00 140.00 .00
150.00.00 160.00 .00
170.00
10.501010.88 1
11.25111.63 11
12.00
Barrel Temperature
(°C)
Feed rate (kg/hr)

Chapter 6
Page | 111
Figure 6-16 : Predicted response surface plot for the effect of feed rate and barrel temperature on hardness of pumpkin flour-corn grits snack.
116.45 116.45172.14 172.14
227.82 227.82
283.51 283.51339.19
Har
dnes
s
130.00 00 140.00 00
150.0000 160.0000
170.00
10.50110.88
11.25111.63 1
12.00
0 Barrel Temperature
(°C )
Feed rate (kg/hr)

Chapter 6
Page | 112
Figure 6-17 : Predicted response surface plot for the effect of feed rate and barrel temperature on specific mechanical energy (SME) of pumpkin flour-corn grits snack.
0.15 0.15
0.15 0.150.16 0.160.16 0.160.16
Spec
ific
Mec
hani
cal
Ener
gy (S
ME)
130.0000 140.0000
150.0000 160.00 00
170.00
10.501
10.88
11.25
11.631112.00
Barrel Temperature
(° C )
Feed rate (kg/hr)
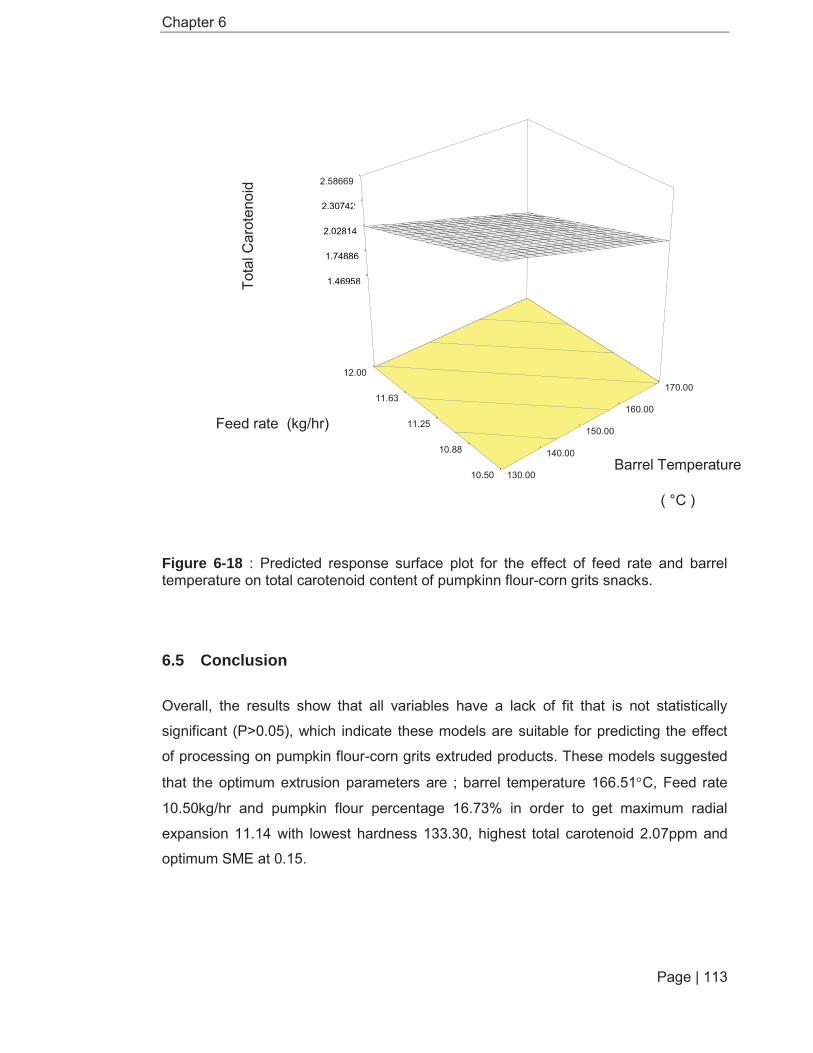
Chapter 6
Page | 113
Figure 6-18 : Predicted response surface plot for the effect of feed rate and barrel temperature on total carotenoid content of pumpkinn flour-corn grits snacks.
6.5 Conclusion
Overall, the results show that all variables have a lack of fit that is not statistically
significant (P>0.05), which indicate these models are suitable for predicting the effect
of processing on pumpkin flour-corn grits extruded products. These models suggested
that the optimum extrusion parameters are ; barrel temperature 166.51 C, Feed rate
10.50kg/hr and pumpkin flour percentage 16.73% in order to get maximum radial
expansion 11.14 with lowest hardness 133.30, highest total carotenoid 2.07ppm and
optimum SME at 0.15.
1.46958 1.46958
1.74886 1.74886
2.02814 2.02814
2.30742 2.30742
2.58669
Tot
al C
arot
enoi
d
130.00
140.00
150.00
160.00
170.00
10.50
10.88
11.25
11.63
12.00
Barrel Temperature
( °C )
Feed rate (kg/hr)
Chapter 7
Page | 114
Chapter 7: Final Product Quality 7.1 Background
The final quality of extruded snacks is influenced by a large number of processes and
variables. The focus of this thesis is on the incorporation of pumpkin flour as a potential
added value ingredient in extruded snacks that may enhance their nutritional value and
also may provide benefits such as contributing a good natural yellow colour to the
product. The previous chapters have shown that inclusion of pumpkin flour into a
traditional corn grits based formulation necessitates changes to process parameters in
order to optimise production. However, during the extrusion process pumpkin flour may
also undergo physical-chemical modifications, resulting in changes in nutritional value
and just as importantly changes in consumer acceptance. If the snack does not deliver
on nutritional benefits or results in a product that is not acceptable to consumers then
the value of pumpkin inclusion is diminished. On this basis the discussion in this
chapter is focused on the retention of the key nutritional benefit of pumpkin flour,
carotenoid content, through processing and a sensory analysis of the final product.
Additional analysis on the starch digestibility, and microstructure of the final product is
also presented.
In addition to pumpkin flour possessing a high content of carotenoid pigment, which
provides an orange colour to the food product, the carotenoid content is also of great
interest to health-conscious consumers for its antioxidant potential. However, it is
known to be unstable and sensitive to light and heat treatment. There areseveral
studies on the carotenoid content of pumpkin and the effect of extrusion on the
carotenoid of other fruit and vegetables (refer to Table 7-1 below). In general, during
processing, vitamin decreases with increasing temperature, increasing screw speed,
decreasing moisture, decreasing throughput (i.e. longer residence time), decreasing
die diameter and increasing specific energy input (Killeit, 1994). Guzman-Tello and
Cheftel (1990) reported that the losses of total carotenoid during the extrusion process
was due to thermal degradation and evaporation of the vitamin at the extruder outlet.
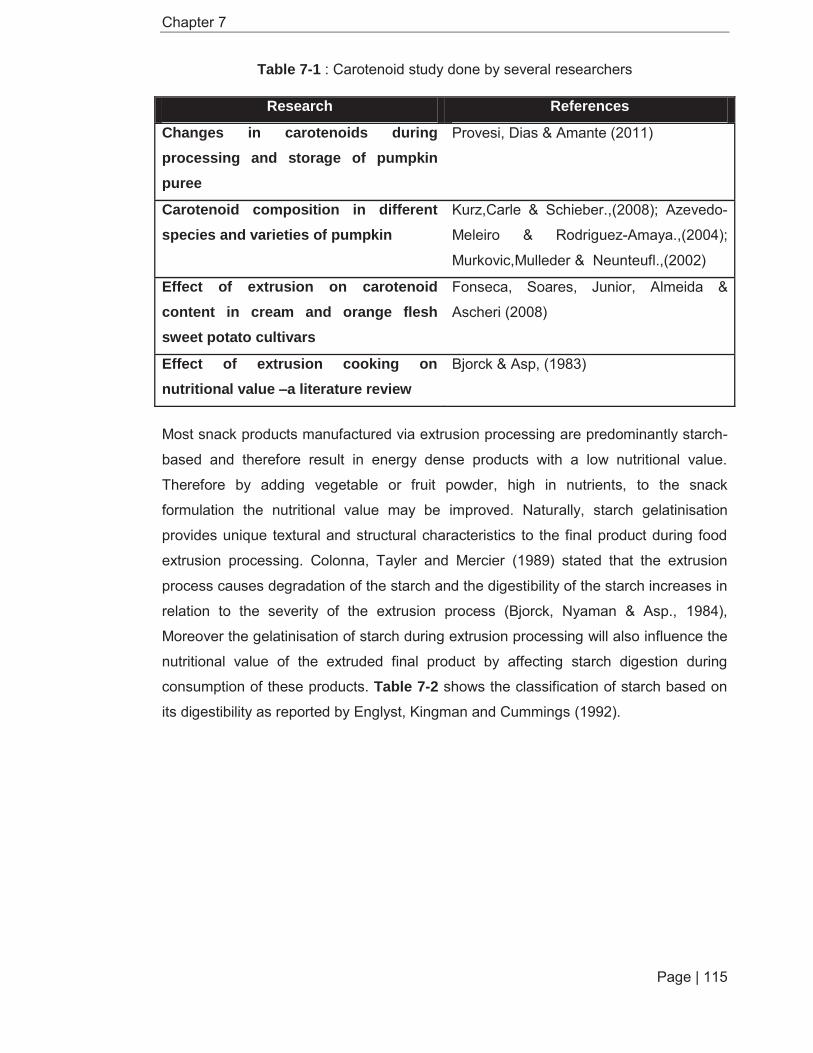
Chapter 7
Page | 115
Table 7-1 : Carotenoid study done by several researchers
Research References
Changes in carotenoids during processing and storage of pumpkin puree
Provesi, Dias & Amante (2011)
Carotenoid composition in different species and varieties of pumpkin
Kurz,Carle & Schieber.,(2008); Azevedo-
Meleiro & Rodriguez-Amaya.,(2004);
Murkovic,Mulleder & Neunteufl.,(2002)
Effect of extrusion on carotenoid content in cream and orange flesh sweet potato cultivars
Fonseca, Soares, Junior, Almeida &
Ascheri (2008)
Effect of extrusion cooking on nutritional value –a literature review
Bjorck & Asp, (1983)
Most snack products manufactured via extrusion processing are predominantly starch-
based and therefore result in energy dense products with a low nutritional value.
Therefore by adding vegetable or fruit powder, high in nutrients, to the snack
formulation the nutritional value may be improved. Naturally, starch gelatinisation
provides unique textural and structural characteristics to the final product during food
extrusion processing. Colonna, Tayler and Mercier (1989) stated that the extrusion
process causes degradation of the starch and the digestibility of the starch increases in
relation to the severity of the extrusion process (Bjorck, Nyaman & Asp., 1984),
Moreover the gelatinisation of starch during extrusion processing will also influence the
nutritional value of the extruded final product by affecting starch digestion during
consumption of these products. Table 7-2 shows the classification of starch based on
its digestibility as reported by Englyst, Kingman and Cummings (1992).

Chapter 7
Page | 116
Table 7-2 : In vitro nutritional classification of starch.
Starch type Source Digestibility in small intestine
Rapidly digestible starch (RDS)
Freshly cooked starchy foods
Rapid
Slowly digestible starch (SDS)
Most raw cereals Slow but complete
Resistant starch (RS) Physically inaccessible starch (RS1)
Partly milled grain and seeds
Resistant
Resistant starch granules (RS2)
Raw potato and banana
Resistant
Retrograded starch (RS3) Cooled, cooked potato, cornflakes and bread
Resistant
Structure is a key parameter to understanding the behaviour of foods and the basic
mechanisms of physicochemical changes. Food structure relates to nutrition, chemical,
microbiological stability, texture, physical properties, transport properties, product
engineering and product texture. Therefore, the extrusion process has a considerable
effect on food structure and nutritional quality of food products. The structure of the
final expanded snack is developed through formation of bubbles due to moisture
flashing off on exiting the extruder die and the bubbles becoming entrapped when the
dough solidifies as a result of viscosity increasing due to both increases in the total
solids content and evaporative cooling.
Acceptance and the successful launch of a new product, is not only dependent on the
processing parameters or formulation but most importantly is dependent on the
sensory evaluation of the consumer. The sensory feedback of a consumer can be a
reliable tool to determine the acceptance of and preference for the product. Moreover,
in defining the quality characteristics of the extruded snacks, consumer perceptions
and acceptance are the most critical elements (Munoz & Chambers, 1993: Galvez &
Resurreccion, 1992).
Chapter 7
Page | 117
Many studies have been performed on pumpkin utilisation and usage in bread
fortification (Noor Aziah & Komathi, 2009), pumpkin jam, pumpkin noodles and 3rd
generation pumpkin snacks (refer to section 2.6.1) (Konopacka Seroczynska,
Korzeniewska, Jesionkowska,Niemirowicz-Szczytt, & Plocharski, 2010). Nutritious
snack foods can be made not only from cereal grain as in the commercial market, but
can also incorporate other vegetables, legumes, and fruits in their formulation
(Ibanoglu ., Ainsworth, Ozer, & Plunkett,2006). Second-generation snacks (direct-
puffed snacks) are usually low in bulk density and there are commercially produced
examples of such products that are high-fibre, high protein, contain nutritional products
and are low calorie (Liu., Hsieh., Heymann., & Huff., 2000). Currently, there are limited
studies on the effect of extrusion cooking on the carotenoid content, starch digestibility
and sensory evaluation of pumpkin flour and corn grits expanded snacks.
This chapter focuses on four (4) main factors affecting the final quality of the extruded
pumpkin-corn grits snacks product; Total β-carotene content, starch digestibility,
microstructure and sensory evaluation.
7.2 Materials and Methods
The five best formulations of the 20 pumpkin-corn grits snack products analysed in
earlier chapter (Chapter 6) were selected for carotenoid determination, starch
digestibility analysis and sensory evaluation including consumer acceptance and
preference. The selection was based on the highest expansion ratio, highest pumpkin
level, the least hardness and the lightness and yellowish-brown colour of the expanded
snack product.
7.2.1 Extrusion Conditions
Extrusion parameters and formulation were used as described in 6.2.1. Table 7-3
shows the formulation and extrusion conditions for producing the pumpkin flour-corn
grits expanded snacks.

Chapter 7
Page | 118
Table 7-3 : Formulation and extruder conditions
Sample Barrel Temperature (last 3 barrel)
( C)
Mass flow (kg/hr)
Label
15% Pumpkin Flour + 85% Corn grits
150
12.5
15%PF,BT 150,MF 12.5
15% Pumpkin Flour + 85% Corn grits
150
10.0
15%PF, BT150, MF
10.0
5% Pumpkin Flour + 95% Corn grits
130
12.0
5%PF,BT
130, MF 12.0
100% Corn grits
150
11.3
Control (100%
corn grits)BT150,
MF11.3
5% Pumpkin Flour + 95% Corn grits
170
12.0
5%PF, BT
170, MF 12.0
7.2.2 Total Carotenoid Analysis
Extraction of total carotenoid in pumpkin and pumpkin based extruded product was
carried out as described in section 6.2.5 and standard curve of total carotenoid in
Appendix 3.
7.2.3 Starch Digestibility
In vitro starch digestibility was carried out using the method of Englyst., Veenstra.,
andHudson (1996) and Brennan, M., Merts., Monro., Woolnough., and Brennan,C
(2008). A 2.5g ground sample (<4.75mm) was mixed with 30ml of deionised water,
then 1 ml of 1M hydrochloric acid (HCL) and 1 ml pepsin (10% solution in 0.05M HCL)
were added and the digestion was carried out at 37C for 30 minutes with a slow
constant mixing. Then 2 ml NaHCO3 (1M), 5 ml,0.1M Na Maleate buffer (pH6) and 5
ml pancreatin (2.5% in 0.1M Na maleate buffer, pH 6) were added for further digestion.
0.1ml amyglucosidase (MegaZyme E-AMGDF) was added to prevent end product
inhibition of pancreatic amylase and the total volume adjusted to 55 ml. The samples
were further incubated at 37°C with slow constant mixing (130rpm)for 120rpm. A
duplicate of 1 ml aliquots of the mixture was collected at 0,20, 60 and 120 minutes and
Chapter 7
Page | 119
added to 4 ml ethanol (95%w/v) to stop the digestion process and prepare for
determination of reducing sugar content using 3,5-dinitrosalicylic acid methods.
The amount of starch digestion was determined by comparing the absorbance of the
sample to a glucose standard curve. Rapidly digestible starch (RDS) is the starch that
hydrolysed within the first 20 minutes of incubation while slowly digestible starch (SDS)
was identified the starch hydrolysed between 20 and 120 minutes of digestion.
7.2.4 Proximate Composition
Proximate composition for all samples was determined as described in section 3.2.3.
7.2.5 Sensory Evaluation
The main objectives of sensory evaluation in this study were to determine product
acceptance and preference of the pumpkin-flour –corn grits expanded snack product.
The panelists were also asked to rank the product from the least liked to the best liked.
Forty (40) panellists comprising 14 males and 26 females aged between 19 to 64
years, were randomly recruited among staff and students of the Institute of Food
Nutrition and Human Health, Massey University, Palmerston North, New Zealand, to
evaluate the extruded product without any knowledge of the formulation or the product.
The panellists were asked to evaluate the overall acceptability, colour, smell, product’s
texture, taste, pumpkin flavour intensity, and potential of buying this product as a snack
using a structured nine-point hedonic scale (Stone & Sidel, 2004). The sensory
evaluation was conducted in the sensory lab equipped with 10-individual partitioned
booths. Drinking water was provided to clean and rinse the mouth between samples.
The samples were place in shallow white cup and were coded using a random three-
digit number. They were served under normal lighting conditions at room temperature
(25 C).
7.2.6 Microstructure of Expanded Snack Product
The extruded product was imaged using X-ray microtomography (Skyscan,
Kartuizersweg 3B, 2550 Kontich, Belgium). Image acquisition was carried out using an
x-ray beam energy of 60kv at a current of 160μ and images were recorded using a
pixel size of 17.1 μm and an image size of 2000 × 1048 pixels. The sample was
scanned for 180 of rotation at intervals of 0.4 of rotation. Three dimensional (3D)

Chapter 7
Page | 120
images were reconstructed using NRecon software provided with the machine from
which a series of 180-200 vertical slices, each 3 m thick were generated. A grid of 81
points using ImageJ software (Version 1.43) was overlaid on the image and the
number covering the image was manually counted. The number of points falling on
voids was calculated as the void volume (%) as a proportion of the number of points
covering the image.

Chapter 7
Page | 121
Figure 7-1 : Summary of the process of how the microstructure of the expanded snack
was captured and analysed
Extruded pellet mounted on imaging stub
3D image of expanded snack
2D image of expanded snack
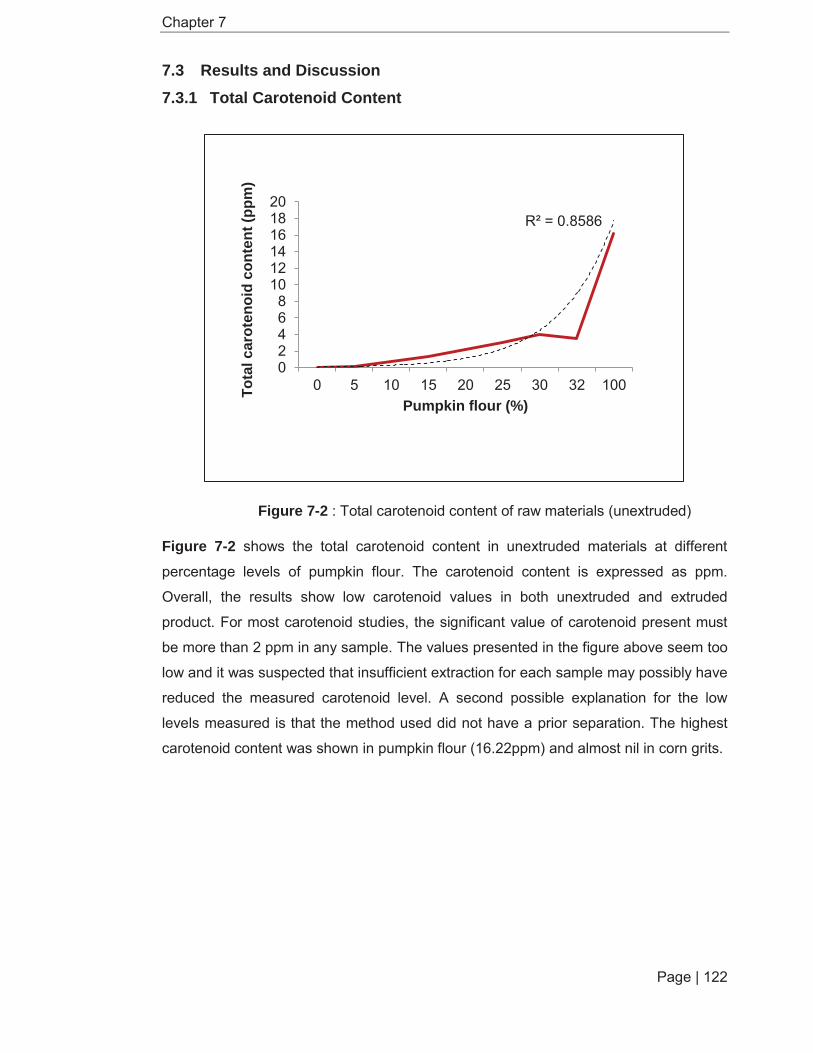
Chapter 7
Page | 122
7.3 Results and Discussion 7.3.1 Total Carotenoid Content
Figure 7-2 : Total carotenoid content of raw materials (unextruded)
Figure 7-2 shows the total carotenoid content in unextruded materials at different
percentage levels of pumpkin flour. The carotenoid content is expressed as ppm.
Overall, the results show low carotenoid values in both unextruded and extruded
product. For most carotenoid studies, the significant value of carotenoid present must
be more than 2 ppm in any sample. The values presented in the figure above seem too
low and it was suspected that insufficient extraction for each sample may possibly have
reduced the measured carotenoid level. A second possible explanation for the low
levels measured is that the method used did not have a prior separation. The highest
carotenoid content was shown in pumpkin flour (16.22ppm) and almost nil in corn grits.
R² = 0.8586
02468
101214161820
0 5 10 15 20 25 30 32 100Tota
l car
oten
oid
cont
ent (
ppm
)
Pumpkin flour (%)
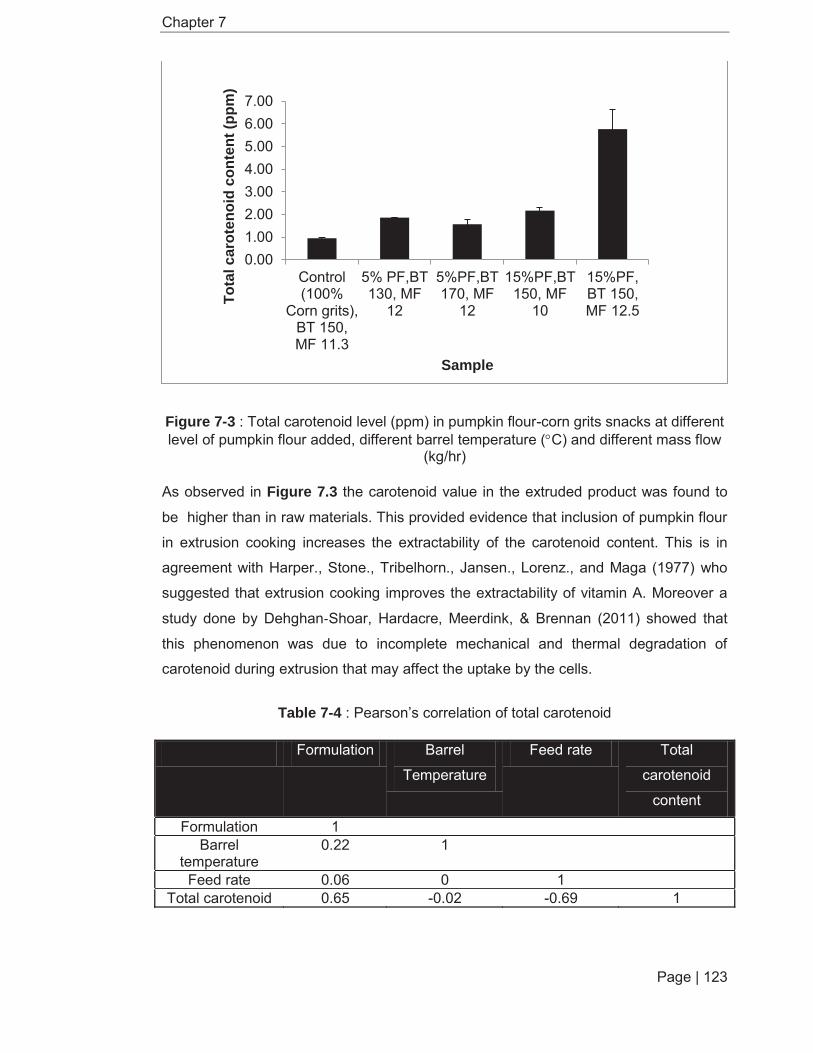
Chapter 7
Page | 123
Figure 7-3 : Total carotenoid level (ppm) in pumpkin flour-corn grits snacks at different level of pumpkin flour added, different barrel temperature ( C) and different mass flow
(kg/hr)
As observed in Figure 7.3 the carotenoid value in the extruded product was found to
be higher than in raw materials. This provided evidence that inclusion of pumpkin flour
in extrusion cooking increases the extractability of the carotenoid content. This is in
agreement with Harper., Stone., Tribelhorn., Jansen., Lorenz., and Maga (1977) who
suggested that extrusion cooking improves the extractability of vitamin A. Moreover a
study done by Dehghan Shoar, Hardacre, Meerdink, & Brennan (2011) showed that
this phenomenon was due to incomplete mechanical and thermal degradation of
carotenoid during extrusion that may affect the uptake by the cells.
Table 7-4 : Pearson’s correlation of total carotenoid
Formulation Barrel
Temperature
Feed rate Total
carotenoid
content
Formulation 1 Barrel
temperature 0.22 1
Feed rate 0.06 0 1 Total carotenoid 0.65 -0.02 -0.69 1
0.001.002.003.004.005.006.007.00
Control(100%
Corn grits),BT 150,MF 11.3
5% PF,BT130, MF
12
5%PF,BT170, MF
12
15%PF,BT150, MF
10
15%PF,BT 150,MF 12.5
Tota
l car
oten
oid
cont
ent (
ppm
)
Sample

Chapter 7
Page | 124
The pearson correlation (Table 7-4) showed a strong positive relationship between
measured carotenoid content and formulation (R2=0.65), showing increases in total
carotenoid content with increases in pumpkin flour content. Moreover, the result
indicates that the total extractable carotenoid content is higher in the extruded snack
compared to the initial carotenoid content. However, a negative correlation was found
between feed rate and carotenoid content (r2=-0.69), at a lower feed rate the total
carotenoid increased. This finding contradicted a study done by Fonseca, Soares,Freire Junior,Almeida, and Ascheri., (2008) which found that lower feed rates
decreased the carotenoid content in sweet potato due to long retention in the barrel
which melt the viscosity.
Killeit (1994) reported that the initial all-trans β-carotene was destroyed by 38-73% at
barrel temperatures between 125° - 200 C. Jansen (1979) found that retention of
vitamin A ranged between 87-100%. Even though there were several studies on the
carotenoid analysis on pumpkin, extrusion process but the published works on the
carotenoid content of unextruded and extruded product made from pumpkin and corn
grits are limited references.
7.3.2 Starch Digestibility
The digestibility of starch fractions of the raw material prior to extrusion and of
expanded snacks made from pumpkin flour-corn grits was measured using the Rapidly
Digestible Starch (RDS) and Slowly Digestible Starch (SDS) methods. Results are
shown in Figure 7-4 below. In a previous study, the extrusion processing resulted in a
significant increase in starch digestibility due to gelatinisation of the starch in the
extruded product compared to the unextruded raw materials (Hagenimana et al., 2006).
In contrast our study indicates the opposite. A potential mechanism that would explain
the current results is that interactions with other components in particularly sugar and
pectin components from the pumpkin flour, which trap starch granules within a viscous
pectin-starch network, such entrapment would be expected to hinder in vitro digestion
due to reducing contact between digestive enzymes and starch. This result supports
the theory presented by Altan et al., (2009) and Hagenimana et al.,( 2006), who found
that starch digestibility was lower in barley-based extruded products. In addition to the
entrapment mechanism mentioned above, Altan et. al., (2009) also conjectured that a
second mechanism is at work. They postulated that there may be incomplete rupturing
of starch granules (i.e. gelatinisation) resulting in limited enzyme access during the

Chapter 7
Page | 125
digestion and hence slower amylolytic hydrolysis. Other factors that significantly
contribute to lower starch digestibility that have been identified by researchers include;
amylose-amylopectin ratio (Lai et al., 2000), starch-protein interactions and granule
particle size (Englyst et al., 1992; Hoover and Sosulski, 1985).
Extrusion conditions such as barrel temperature, screw speed and feed moisture
content may also alter the digestion of starch (Yagci & Gogus, 2010). The strong
positive relationship (r2=0.85) between barrel temperature and RDS as well as between
formulation and SDS (R2=0.88) were observed in Table 7-5 Pearson’s correlation.
Increased barrel temperature resulted in an increase in starch digestibility, this result is
in line with Chiang and Johnson, (1977).
RDS and SDS are indicative of the rate of carbohydrate release (starch digestion) from
foods into blood sugar (absorption) and generally reflects the glycaemic response
(Englyst & Hudson, 1996).
The RDS of pumpkin flour – corn grits snacks ranged from 35.00 to 40.15 mg/g and the
SDS ranged from 43.71 to 97.03mg/g. The overall value of RDS was lower than SDS
for all of the pumpkin flour-corn grits expanded snack formulations. The variation in
RDS between the formulations was not statistically significant (P>0.01). In contrast the
relationship between formulations (i.e. level of pumpkin flour incorporation) and SDS
values were statistically significant (P<0.01).
RDS is a starch fraction that causes a rapid increase in blood glucose levels after
ingestion while SDS is a starch fraction that slowly digests resulting in the gradually
release of sugar and hence smooth, stable rises in blood sugar (Chung, Liu & Hoover,
2009).Therefore SDS may become a nutritionally favourable option for snack
manufacturer who wish to produce healthy snacks for the consumers.
High SDS values were obtained under the following process conditions: barrel
temperature of 150°C, feed rate of 12.5kg/hr and 15% pumpkin flour inclusion. In
contrast a snack manufactured under the same conditions but with no pumpkin flour
added resulted in low value of SDS for pumpkin-corn grits expanded snack products.

Cha
pter
7
Page
| 12
6
Figu
re 7
-4 :
In v
itro
star
ch fr
actio
ns o
f raw
mat
eria
ls (u
next
rude
d) a
nd e
xtru
ded
pum
pkin
flou
r-co
rn g
rits
snac
k pr
oduc
ts
0.00
50.0
0
100.
00
150.
00
200.
00
250.
00
300.
00
350.
00
400.
00
450.
00
Cor
n gr
its(ra
w)
pum
pkin
flour
cede
nco
(raw
)
Con
trol
(100
%C
orn
grits
),B
T 15
0, M
F11
.3
5% P
F,B
T13
0, M
F 12
5%P
F,BT
170,
MF
1215
%P
F,B
T15
0, M
F 10
15%
PF, B
T15
0, M
F12
.5
Total glucose released (mg/g)
Sam
ple
RD
S (m
g/g)
SDS
(mg/
g)
RD
S: r
apid
ly d
iges
tible
sta
rch
SD
S :
Slo
wly
dig
estib
le s
tarc
h P
F: P
umpk
in F
lour
B
T: B
arre
l Tem
pera
ture
M
F: M
ass
Flow
Ac
cd
B B
B B
A
d d
d
b
a
B

Cha
pter
7
Page
| 12
7
Tabl
e 7-
5 : P
ears
on’s
cor
rela
tion
of e
xtru
ded
pum
pkin
flou
r-cor
n gr
its s
nack
s
S
ampl
e Ba
rrel
Tem
pera
ture
M
ass
Flow
R
DS
SD
S
Sam
ple
1
Bar
rel t
empe
ratu
re
0.22
1
Mas
s Fl
ow
0.06
0
1
RD
S
0.48
0.
85
-0.0
3 1
SDS
0.88
-0
.18
0.25
0.
04
1
Tabl
e 7-
6 : P
ears
on’s
cor
rela
tion
of u
next
rude
d (ra
w m
ater
ials
) and
ext
rude
d pu
mpk
in-c
orn
grits
sna
cks
Sa
mpl
e R
DS
SD
S
Sam
ple
1
RD
S
-0.7
9 1
SDS
-0.6
8 0.
93
1

Chapter 7
Page | 128
7.3.3 Pearson’s Correlation of Proximate Composition
The correlation of pumpkin flour inclusion on the proximate composition of the
expanded snack is given in Table 7-7 below.
Table 7-7 : Pearson’s correlation of proximate composition in pumpkin flour-corn grits expanded snack
sample moisture ash fat protein CHO sample 1 moisture -0.71 1 ash 0.94 -0.51 1 fat 0.71 -0.91 0.58 1 protein 0.16 -0.27 0.22 0.64 1 CHO -0.60 0.53 -0.63 -0.83 -0.89 1
Pumpkin flour – corn grits snack products contain moisture ranging from 7.34-7.81%,
while snack products made from 100% corn grits were found to contain higher moisture
(8.46%) than the other samples. As increased of pumpkin flour inclusion increased of
protein content and no significant loss of carbohydrate was found during the extrusion
process.
7.3.4 Sensory Evaluation
The data presented in this section has been interpreted using the scale reported by
Knuckles, Hudson, Chiu and Sayre. (1997) Product attributes with a mean score
greater than 5 were considered to be positive or liked by the consumer. While sensory
attributes falling below 4 were deemed unacceptable by the panellists. The mean score
of sensory attributes for the pumpkin flour-corn grits snack products is given in Table
7-8. There was no significant difference (P>0.001) in terms of the overall acceptability,
smell of the food, texture and taste of the food detectable by the panellists. The colour
of the snack products was however detected by panellists and this data was correlated
in terms of acceptability with the level of pumpkin flour in the formulation (P<0.001).
The mean panellists’ scores for colour acceptability ranged between 4.63 (“dislike
slightly”) to 7.00 (‘like moderately”). By inspection it can be seen that the snack
containing 5%pumpkin flour extruded at a barrel temperature of 130 C with a feed rate
of 12kg/hr gave the best score for the colour acceptance(mean score= 7.00). The
panellists were found to moderately like the snack with a light yellow-brown product

Chapter 7
Page | 129
colour compared to the snack with 15%pumpkin flour inclusion, which showed very
low acceptability by the consumers who based on their comments associated the
colour of snacks containing higher levels of pumpkin flour with being burnt.
The panellists were able to distinguish at a level of significance of P<0.001, all the
samples on the basis of product colour. A degradation of carotenoid pigment and
maillard reaction due to high sugar content in the pumpkin flour are likely to have
caused the undesirable darker and burnt colour of the product that resulted in the
panellists designating the colour unappealing. This result was in agreement with
Pongjanta, Naulbunrang, Kawngdang, Manon and Thepjaikat.(2006) who found that
the colour values of products increased with higher inclusion of pumpkin flour and thus
resulted in a decrease in acceptance of the products .While the raw data indicates that
panellists were found more likely (mean score = 6.03) to prefer the smell of snacks
extruded with 0% pumpkin flour added compared to the snack products with pumpkin
flour inclusion (mean score ranged from 5.56 to 6.00) a statistical analysis showed that
there was no significant difference between the samples (P>0.001). It was suspected
that the panellists preferences might be partially due to familiarity with the smell of corn
snack products through availability in the market. The undesirable smell detected by
panellists may in part be due to pyrolysis resulting from the high levels of sugar in
pumpkin flour.If this is the case then it may be possible to manipulate processing to
minimise to a certain extent, the degree of Maillard reactions via temperature
manipulation.
Texture in extruded snacks plays an important role in sensory quality. The definition of
texture from a sensory perspective can cover a broad range of characteristics that
include the molecular structure of the food and it also how a food is perceived when
touched and pressed (Szcesniak, 2002).
In this study, texture refers to the hardness of the snack that is detected by panellists
based on mechanical forces when compressing the snack between molar teeth. Terms
that may be used to describe the product by panellists include soft, firm and hard.
However, some of the consumers based on their comments distinguished products
based on textural characteristics such as stickiness (adhesiveness). The highest mean
score of texture likeness (mean score=6.75, “like slightly” to “like moderately”) was
observed on the snack with 5% pumpkin inclusion cooked with a barrel temperature of
170°C with a 12kg/hr feed rate.

Chapter 7
Page | 130
Added pumpkin flour in the snack processing was anticipated to contribute sweet, sour
and bitter tastes to the end product. Sweet tastes in products have been reported to be
associated with the presence of sugar and carotenoid content (Marek et al., 2008).The
mean score for liking the product in this study, with regard to taste ranged from 5.12 to
5.68. However, even though the mean score for sweetness indicates a positive liking
the product taste as a whole had a low preference. This result was probably due to a
lack of seasoning added to the samples. If this is true then the overall taste preference
could be improved by matching the intrinsic sweetness of the pumpkin product with
flavours that are typically associated with sweetness.
The overall acceptability result showed that panellist “slightly accepted’ pumpkin flour-
corn grits expanded snack product as shown by mean scores ranging from 5.33 to
6.08. Curiously the panellists could not differentiate the presence or absence of
pumpkin flour on the basis of pumpkin flavour in the product as they could perceived a
“pumpkin flavour” in the 100% corn grits formulation. Most of the panellists perceived
the taste of pumpkin in snacks including pumpkin flour in at 5% to 15% as “slightly -
moderately low.
Based on a mean score of 5.30, the panellists probably would buy a snack product
containing 5% pumpkin flour with extruder conditions run at barrel temperature 170°C
and mass flow of 12.0 kg/hr. Based on Pearson’s correlation, taste, texture, smell and
overall acceptability of the product influenced their decision to buy the snack product.

Cha
pter
7
Page
| 13
1
Tabl
e 7-
8 : M
ean
scor
es fo
r sen
sory
attr
ibut
es o
f pum
pkin
flou
r – c
orn
grits
sna
ck p
rodu
cts
Sa
mpl
e
Bar
rel
Tem
pera
ture
(
C)
M
ass
Flow
(K
g/hr
)
C
olou
r
Smel
l
Text
ure
Ta
ste
O
vera
ll ac
cept
abilit
y
P
umpk
in fl
our
inte
nsity
B
uy a
s a
snac
k fo
od
C
ontro
l (10
0%
Cor
n G
rits)
15
0
11.3
6.77
± 1
.72b
6.
03 ±
1.3
9b
6.71
± 1
.75b
5.
64 ±
1.8
0a
6.05
± 1
.58b
2.
85 ±
1.6
9a
4.62
± 2
.11a
5%
Pum
pkin
Fl
our
13
0 12
7.00
± 1
.40b
5.
63 ±
1.3
3a
5.56
± 1
.80a
5.
12 ±
1.7
2a
5.64
± 1
.70a
3.
10 ±
1.7
3a
4.17
± 2
.14a
5%
Pum
pkin
Fl
our
17
0 12
6.60
± 1
.65b
6.
00 ±
1.4
1b
6.75
± 1
.74b
5.
68 ±
1.8
3a
6.08
± 1
.62b
3.
78 ±
1.7
9b
5.30
± 2
.21b
15%
Pum
pkin
Fl
our
15
0 10
4.63
± 2
.20a
5.
63 ±
1.5
3a
6.46
± 1
.92b
5.
53 ±
2.1
2a
5.33
± 2
.07a
4.
75 ±
2.2
3c
4.63
± 2
.53a
15%
Pum
pkin
Fl
our
15
0
12.5
5.43
± 1
.87a
5.
56 ±
1.5
7a
5.80
± 1
.96a
5.
43 ±
1.8
2a
5.48
± 1
.91a
4.
47 ±
1.9
1c
4.53
± 2
.26a

Chapter 7
Page | 132
Figure 7-5 : Spider web of mean scores for sensory attributes of pumpkin flour-corn grits expanded snacks
Acceptance and preference of sensory attributes of pumpkin flour- corn grits expanded
snacks was shown in Figure 7-5 above.
Table 7-9 shows the Pearson correlation for all sensory attributes. Overall acceptability
was influenced by pumpkin flour percentage (r2=-0.68), Colour of the product (r2=0.78),
smell of the product (r2=0.94) and texture of product (r2=0.56). Consumers would want
to buy this product based on ; taste (r2=0.83), texture (r2=0.78), smell(r2=0.64) and
overall (r2=0.54).The colour of the product was found negatively correlated with the
pumpkin level (r2=-0.79) while barrel temperature was found to influence smell (r2=
0.58), texture (r2= 0.77) and taste (r2= 0.88).Pumpkin flour intensity was positively
correlated with the level of Pumpkin flour added (r2=0.93). While consumers did detect
pumpkin flavour in the control snacks, most consumers could distinguish the level of
pumpkin flour in the product via flavour, and they could predict the right intensity of
pumpkin flour in each formulation.
0123456789Colour
Smell
Texture
TasteOverall acceptability
Pumpkin flour intensity
Buy as a snack food
Control (150°C, 11.3 kg/hr) 5%Pumpkin flour (130°C, 12kg/hr)
5%Pumpkin flour (170°C, 12kg/hr) 15%Pumpkin flour (150°C, 10kg/hr)
15%Pumpkin flour (150°C, 12.5kg/hr)

Cha
pter
7
Page
| 13
3
Tabl
e 7-
9 : P
ears
on’s
cor
rela
tion
of s
enso
ry a
ttrib
utes
Sa
mpl
e B
arre
l
Tem
pera
ture
Mas
s
Flow
Col
our
Smel
l Te
xtur
e Ta
ste
Ove
rall
acce
ptab
ility
Pum
pkin
flour
inte
nsity
Buy
as
a
snac
k
Sam
ple
1
Bar
rel
Tem
pera
ture
0.22
1
Mas
s Fl
ow
0.07
0.
00
1
Col
our
-0.7
9 -0
.14
0.53
1
Smel
l -0
.66
0.58
-0
.01
0.56
1
Text
ure
-0.2
7 0.
77
-0.4
5 -0
.03
0.81
1
Tast
e -0
.01
0.88
-0
.27
-0.1
7 0.
70
0.93
1
Ove
rall
acce
ptab
ility
-0.6
8 0.
46
0.32
0.
78
0.94
0.
56
0.48
1
Pum
pkin
flour
inte
nsity
0.93
0.
29
-0.2
9 -0
.93
-0.5
7 -0
.04
0.15
-0
.71
1
Buy
as
a
snac
k
0.11
0.
98
0.00
-0
.01
0.64
0.
78
0.83
0.
54
0.19

Chapter 7
Page | 134
7.3.5 Microstructure of Expanded Snack Product
Due to cost restraints, micro computerised axial tomography (mico-CAT) was only
carried out on the extruded product made using the 250rpm screw speed. The
proportion of the cross-sectional area of the extruded pellets that was represented by
void area (bubbles) for pellets containing different proportions of pumpkin flour is
shown in figure 9. Near the ends of the pellets, the void area was between 50% and
60% and about 10% less than in the centre of the pellets (Dark shading Figure 7-6 and
Table 7-10). Towards the centre of the pellets the bubbles increased in size and the
void area increased. Increasing the proportion of pumpkin flour in the ingredients
although resulting in increased hardness and density of the pellets, had a relatively
small effect on the proportion of void area in the pellets. The mean void are area
decreased by about 15% for the ends and centre of the pellets as the proportion of
pumpkin flour in the ingredients increased. However these differences in void area
were not significant, although they were consistent with the significant increases in
density and hardness for pellets extruded at 250 rpm.
Figure 7-6 : Effect of varying pumpkin flour at constant screw speed (250rpm) on bubble area distribution at the upper end and centre of the extruded expanded snack

Chapter 7
Page | 135
Table 7-10 : X-ray tomography cross sectional of 2-D image (radial): Changes of bubble size through out the extruded sample at screw speed 250rpm (Scale 1:2)
Sample
Upper end
Middle
100% Corn grits
5% Pumpkin Flour
10% Pumpkin Flour
15% Pumpkin Flour
20% Pumpkin Flour
7.4 Conclusion
Sensory results showed that pumpkin flour could be successfully incorporated up to 5%
with the corn grits to obtain an acceptable snack in terms of texture, taste, overall
acceptability and potential for consumers to buy as a snack. However, in terms of
nutritional value specifically the total carotenoid content, starch digestibility and
proximate composition the best product quality was shown by the expanded snack
product that was extruded at barrel temperature of 150°C with mass flow rate of 12.5
kg/hr. This had the highest total carotenoid (5.78ppm) with the SDS value of
97.03mg/g. This product was also found to have protein content of 28.8% with average
value of moisture content (7.56%), ash (1.65%) and 59.29% carbohydrate.

Chapter 8
Page | 136
Chapter 8: Overall Conclusion, Limitations and Further Research
8.1 Overall Conclusion
The objective of this research was to process all pumpkin fractions into powder then
use this product as an ingredient in extrusion processing. The objective was then to
develop an acceptable expanded snack product with a good flavour and texture.
Moreover, it could help the food processing industry to dramatically reduce waste
during processing. Cedenco Food Ltd was struggling to reduce pumpkin waste to
below 25% of the harvested crop. Adding vegetable powder made from the entire fruit
and not only the flesh in extrusion processing was not common. With its natural
sweetness and colour, pumpkin powder could give a new option for the healthy snack
food market while offering new opportunities to the pumpkin industry.
Overall this research successfully developed a new snack formulation for extrusion
processing. Conditions including processing temperature, screw speed, mass flow rate
and cutter speed were defined. Product properties in terms of expansion, density,
hardness, colour and nutritional value including carotenoid content and starch
digestibility were reported. Consumer acceptance of this snack indicated that it has
potential as a commercial snack food.
The following point emerged from this work :
The production of pumpkin flour made from entire pumpkin was found to be
feasible. However, the processing of pumpkin seed for extruded snack may
need treatment to reduce the oil content. Processing as a dry powder with a
long shelf life, will make pumpkin flour available throughout the year.
Although freeze drying was found to be the most effective method for drying
and best conserved the nutritional value and colour of pumpkin flour, it was not
commercially viable due to the high cost.
The results obtained from this research shows that pumpkin flour is suitable for
extrusion cooked snacks when blended with corn grits due to its low starch
(7%) and high sugar (37%) content. The sugar and pectin content of pumpkin
flour was the likely cause of the lower viscosity compared to corn grits flow
when the pasting profile was assessed. The low starch content of the pumpkin
reduced expansion of the snack product.

Chapter 8
Page | 137
Prediction using RSM showed the best conditions for processing pumpkin on
this equipment were at a barrel temperature of 166.5 C with a feed rate of
10.50kg/hr.
Overall, the unflavoured product was neither liked nor disliked by the sensory
panellists. It is therefore, probable that the product can be flavoured to suit the
intended market.
Snack products containing 15% pumpkin flour had a protein content of 29% and
carotenoid content of 13.18ppm. Slowly digestible starch (SDS) was found
significantly (P<0.01) increased as pumpkin flour in the formulation was
increased, this may contribute to lower blood glycemia. However, this may be
susceptible to increase shear and temperature during extrusion.
The improved protein and carotenoid content of these snack products may have
sales advantages compared to other snacks available in the market place.
8.2 Limitations and Recommendations
This work has shown that there is no significant functional difference between pumpkin
flours manufactured via freeze drying or air drying. The work did show that colour
retention in freeze dried flour is much greater than air drying. However, due to the low
margins associated with snack foods, as a low cost, high volume product, it is
recommended to use air drying as freeze drying is both an energy intensive process
and is also a batch process and thus unsuited to large volumes.
As pumpkin flour blended with corn grits gave a dark colour and burnt taste to the
snacks, studies using other cereal -based ingredients should be carried out
The extruder processing conditions used only the two screw speeds and mass flow
rates. Therefore, investigation of the effect of other process settings is suggested with
the objective of reducing colour and burnt tastes.
Sensory results revealed that consumers preferred the expanded snack food that had
lower percentage of 5% pumpkin flour. Flavouring and seasoning will improve taste
and improve consumer appeal.

Chapter 8
Page | 138
8.3 Further Research
Future research recommendations are as follows:
Packaging and storage study of the expanded snacks needs to be carried out.
Finally, scaled up production and marketing research are essential to confirm the
demand and acceptance for this expanded snack in the real market place.

Page | 139
References
Abdullah, A.B., (2006). Budget 2007.Speech presented at Parliament of Malaysia.
Achinewhu, S. C. (1987). Protein quality evaluation of weaning food mixtures from
indogenous fermented foods. Nigerian Journal of Nutritional Sciences., 8, 23-
31.
Akwaowo, E. U., Ndon, D. A., & Etuk, E. U. (2000). Minerals and antinutrients in fluted
pumpkin (Telfairia occidentalis Hook f.). Food Chemistry, 70(2), 235-240.
Al-Khalifa, A. (1996). Physicochemical characteristics, fatty acid composition, and
lipoxygenase activity of crude pumpkin and melon seed oils. Journal of
Agricultural and Food Chemistry, 44(4), 964-966.
Altan, A., McCarthy, K. L., & Maskan, M. (2008). Twin-screw extrusion of barley–grape
pomace blends: Extrudate characteristics and determination of optimum
processing conditions. Journal of Food Engineering, 89, 24-32.
Altan, A., McCarthy, K. L., & Maskan, M. (2009). Effect of extrusion process on
antioxidant activity, total phenolics and β-glucan content of extrudates
developed from barley-fruit and vegetable by-products. International Journal of
Food Science and Technology, 44(6), 1263-1271.
Alvarez-Martinez,L., Kondury, K.P., & Harper, J.M.(1988). A General Model for
Expansion of Extruded Products. Journal of Food Science, 53(2), 609 - 615.
Alves, R. M., Grossmann, M. V., Ferrero, C., Zaritzky, N. E., Martino, M. N., &
Sierakoski, M. R. (2002). Chemical and functional characterization of products
obtained from yam tubers. Starch Stärke, 54(10), 476-481.
Anderson, R., Conway, H., Pfiefer, V., & Griffin, E. (1969). Roll and extrusion-cooking
of grain sorghum grits. Cereal Science Today, 14(11), 4-7, 11-12
AOAC.(1998).Official Methods of Analysis of the Association of Official Analytical
Chemists, 4th Revision, 16th Ed.Arlington,Va:Assoc of Official Analytical
Chemists Intl.
Page | 140
Asare, E. K., Sefa-Dedeh, S., Sakyi-Dawson, E., & Afoakwa, E. O. (2004). Application
of response surface methodology for studying the product characteristics of
extruded rice-cowpea-groundnut blends. International Journal of Food Sciences
and Nutrition, 55(5), 431-439.
Aylin Altan , Kathryn L. McCarthy , Medeni Maskan. (2008). Evaluation of snack foods
from barley–tomato pomace blends by extrusion processing. Journal of Food
Engineering 84, 231–242
Azevedo-Meleiro, C. H., & Rodriguez-Amaya, D. B. (2004). Confirmation of the identity
of the carotenoids of tropical fruits by HPLC-DAD and HPLC-MS. Journal of
Food Composition and Analysis, 17(3-4), 385-396.
Banigo, E., & Akpapunam, M. (1987). Physico-chemical and nutritional evaluation of
protein-enriched fermented maize flour. Nig Food J, 5, 30-36.
Bas, D., & Boyaci, I. H. (2007). Modeling and optimization I: Usability of response
surface methodology. Journal of Food Engineering, 78(3), 836-845.
Bendich, A. (1989). Carotenoids and the immune response. The Journal of Nutrition,
119(1), 112.
Bhattacharya, S., Sivakumar, V., & Chakraborty, D. (1997). Changes in CIELab Colour
Parameters Due to Extrusion of Rice-greengram Blend: a Response Surface
Approach. Journal of Food Engineering, 32, 125-131.
Bjorck, I., & Asp, N.-G. (1983). The Effects of Extrusion Cooking on Nutritional Value -
A Literature Review*. Journal of Food Engineering, 2, 281-308.
Björck, I., Nyman, M., & Asp, N. (1984). Extrusion cooking and dietary fiber: effects on
dietary fiber content and on degradation in the rat intestinal tract. Cereal Chem,
61(2), 174-179.
Block, G., Patterson, B., & Subar, A. (1992). Fruits, vegetables, and cancer prevention:
The epidemiological evidence. Nutrition and Cancer, 18,1–29
Boris, B. (2002). Malaysia Food Processing Ingredients Sector Report. Foreign
Agriculture Services.

Page | 141
Box, G. E. P., & Wilson, K. (1951). On the experimental attainment of optimum
conditions. Journal of the royal statistical society. series b (methodological),
13(1), 1-45.
Brand-Miller, J., Foster-Powell, K., & Burani, J. (2006). The New Glucose Revolution
Low GI Guide to Diabetes: The Only Authoritative Guide to Managing Diabetes
Using the Glycemic Index: Da Capo Press.
Brennan,M.A., Merts, I., Monro, J., Woolnough, J., & Brennan, C. S. (2008). Impact of
Guar Gum and Wheat Bran on the Physical and Nutritional Quality of Extruded
Breakfast Cereals. Starch/Stärke, 60, 248-256.
Brian, H.(2008). Utilisation of squash waste. Bachelor of Technology (Honours) in Food
Technology, Massey University, Palmerston North, New Zealand.
Bycroft, B. L., Corrigan, V. K., & E.Irving, D. (1999). Heat treatments increase
sweetness and flesh colour of buttercup squash. New Zealand Journal of Crop
and Horticultural 27, 265-271.
Campanella, O., Li, P., & Ross, K. (2002). The Role Of Rheology In Extrusion
Engineering and Food for the 21st Century: CRC Press.
Carvalho, C. W. P., & Mitchell, J. R. (2000). Effect of sugar on the extrusion of maize
grits and wheat flour. International Journal of Food Science & Technology,
35(6), 569-576.
Chavasit, V., Pisaphab, R., Sungpuag, P., Jittinandana, S., & Wasantwisut, E. (2002).
Changes in B-Carotene and Vitamin A Contents of Vitamin A-rich Foods in
Thailand During Preservation and Storage. Journal of Food Science, 67(1),
375-379.
Chessari, C., & Sellahewa, J. (2001). Effective process control Extrusion Cooking (Vol.
null): CRC Press.
Chiang, B. Y., & Johnson, J. A. (1977). Gelatinization of starch in extruded products.
Cereal Chem, 54, 436.

Page | 142
Chung, H. J., Liu, Q., & Hoover, R. (2009). Impact of annealing and heat-moisture
treatment on rapidly digestible, slowly digestible and resistant starch levels in
native and gelatinized corn, pea and lentil starches. Carbohydrate Polymers,
75(3), 436-447.
Colonna, P., Tayler, J., & Mercier, C. (1989). Extrusion cooking of starch and starchy
products. In M. C, P. Linko & J. M. Harper (Eds.), Extrusion cooking (pp. 247-
319). St.Paul, MN: Eds Am Assoc Cereal Chem.
Crop Statistic Information. ( 2013, April 22). Malaysian Vegetables Area and Production
by State,2007-2011.Department of Agriculture Malaysia. Retrieved April 23,
2013 from http://www.doa.gov.my/c/document_library/get_file?uuid= 1a47a9e4-
9448-4a66-ad3e-f3ad910a17ba&groupId=38371
Dehghan Shoar, Z., Hardacre, A. K., Meerdink, G., & Brennan, C. S. (2011). Lycopene
extraction from extruded products containing tomato skin. International Journal
of Food Science & Technology, 46(2), 365-371.
DeVries, J., Prosky, L., Li, B., & Cho, S. (1999). A historical perspective on defining
dietary fiber. Cereal Foods World, 44, 367-369.
Ding, Q. B., Ainsworth, P., Tucker, G., & Marson, H. (2005). The effect of extrusion
conditions on the physicochemical properties and sensory characteristics of
rice-based expanded snacks. Journal of Food Engineering, 66(3), 283-289.
Ding, Q.-B., Ainsworth, P., Plunkett, A., Tucker, G., & Marson, H. (2006). The effect of
extrusion conditions on the functional and physical properties of wheat-based
expanded snacks. Journal of Food Engineering, 73, 142-148.
Doğan, H., & Karwe, M. (2003). Physicochemical properties of quinoa extrudates. Food
Science and Technology International, 9(2), 101.
Dutta, D., Dutta, A., Raychaudhuri, U., & Chakraborty, R. (2006). Rheological
characteristics and thermal degradation kinetics of beta-carotene in pumpkin
puree. Journal of Food Engineering, 76(4), 538-546.

Page | 143
Egbekun, M., Nda-Suleiman, E., & Akinyeye, O. (1998). Utilization of fluted pumpkin
fruit (Telfairia occidentalis) in marmalade manufacturing. Plant Foods for
Human Nutrition (Formerly Qualitas Plantarum), 52(2), 171-176.
El-Soukkary, F. (2001). Evaluation of pumpkin seed products for bread fortification.
Plant Foods for Human Nutrition (Formerly Qualitas Plantarum), 56(4), 365-384.
Emadi, B., Kosse, V., & Yarlagadda, P. (2007). Abrasive peeling of pumpkin. Journal of
Food Engineering, 79(2), 647-656.
Englyst, H. N., & Hudson, G. J. (1996). The classification and measurement of dietary
carbohydrates. Food Chemistry, 57(1), 15-21.
Englyst, H. N., Kingman, S., & Cummings, J. (1992). Classification and measurement
of nutritionally important starch fractions. European Journal of Clinical Nutrition,
46, S33-50.
Euromonitor Data (2010). Retrieved online 12/3/2011
Erdemir, M. (1989). Effect of screw configuration on energy introduction in twin screw
extrusion, M.Sc. thesis, Universityof California, Davis, CA.
Expert, D. (2002) (Version Version 6.0.2). Stat-Ease Inc., MN, USA
Faller,J.Y., Klein, B.P. & Faller, J.F. (1999). Acceptability of extruded corn snacks as
affected by inclusion of soy protein. J. Food Sci., 64(1):185-8.
Faller, J. F., Faller, J. Y., & Klein, B. P. (2000). Physical and sensory characteristics of
extruded corn/soy breakfast cereals. Journal of Food Quality, 23(1), 87–102
FAO. (2006). Faostat database. Retrieved 18 Oct 2007 http://faostat.fao.org
Fernandez, Z.F., Guerra,N.B., Diniz,N.M., Salgado,S., Guera, TM., Lopes, A.C., Neta,
J.C. & Padilha, M.R. (1998). Development of a milk beverage based on
pumpkin flakes. Arch Latinoam Nutr. 48(2), 175-178
Fichtali, J. & van de Voort, F. R. (1989). Fundamental and practical aspects of twin
screw extrusion. Cereal Foods World, 34( I I), 921-929.
Page | 144
Fichtali, J., & Van de Voort, F. (1989). Fundamental and practical aspects of twin screw
extrusion. Cereal Foods World, 34(11), 921-929.
Firatligil-Durmus, E., & Evranuz, O. (2010). Response surface methodology for protein
extraction optimization of red pepper seed (Capsicum frutescens). LWT-Food
Science and Technology, 43(2), 226-231.
Fonseca, M. J. O., Soares, A. G., Freire Junior, M., Almeida, D. L., & Ascheri, J. L. R.
(2008). Effect of extrusion-cooking in total carotenoids content in cream and
orange flesh sweet potato cultivars. Horticultura Brasileira, 26(1), 112-115.
Foster, K. (2004). The Creation of a Hominy Based Breakfast Cereal Ingredient by the
Ise of Twin Screw Extrusion Technology: A Project Report Presented in Partial
Fulfillment of the Requirements for the Degree of Bachelor of Technology (Food
Technology) of Massey University. Massey University, Palmerston North, New
Zealand.
Foster-Powell, K., & Miller, J. B. (1995). International tables of glycemic index.
American Journal of Clinical Nutrition, 62(4), 871S.
Francis, E. J. (1991). Colour measurement and interpretation. In:Fang DYC, Matthews
RF. Editor Instrumental methods of quality assurance, New York: Marcel
Dekker Inc. 189-209
Galvez, F. C. F., & Resurreccion, A. V. A. (1992). Reliability of the focus group
technique in determining the quality characteristics of mungbean [Vigna radiata
(L.) wilczec] noodles. Journal of Sensory Studies, 7(4), 315-326.
Gayathri GN, Platel K, Prakash J, Srinivasan K (2004) Influence of antioxidant spices
on the retention of -carotene in vegetables during domestic cooking processes.
Food Chem 84:35–43
Gebhart, S., Cutrutelli, R., Howe, J., Haytowitz, D., Pehrsson, P., Lemar, L., Exler, J.
(2006). USDA national nutrient database for standard reference, release 19.
Home Page.

Page | 145
Gibson, R., Donovan, U., & Heath, A. L. M. (1997). Dietary strategies to improve the
iron and zinc nutriture of young women following a vegetarian diet. Plant Foods
for Human Nutrition (Formerly Qualitas Plantarum), 51(1), 1-16.
Giovanni, M. (1983). Response surface methodology and product optimization. Food
Technol, 37(11), 41-45.
Goncalves, E., Pinheiro, J., Abreu, M., Brandao, T., & Silva, C. L. M. (2007). Modelling
the kinetics of peroxidase inactivation, colour and texture changes of pumpkin
(Cucurbita maxima L.) during blanching. Journal of Food Engineering, 81(4),
693-701.
Guha, M., Ali, S. Z., & Bhattacharya, S. (1998). Effect of barrel temperature and screw
speed on rapid viscoanalyser pasting behaviour of rice extrudate. International
Journal of Food Science & Technology, 33(3), 259-266.
Guy, R. (2001). Extrusion cooking: technologies and applications: Woodhead
Publishing.
Guzman-tello, R., & Cheftel, J. (1990). Colour loss during extrusion cooking of β
carotene wheat flour mixes as an indicator of the intensity of thermal and
oxidative processing. International Journal of Food Science & Technology, 25(4),
420-434.
Haber, A., & Runyon, R. P. (1977). General statistics: Addison-Wesley Reading, MA.
Hagenimana, A., Ding, X., & Fang, T. (2006). Evaluation of rice flour modified by
extrusion cooking. Journal of Cereal Science, 43, 38-46.
Harper, J. (1981). Extrusion of foods: CRC Press Boca Raton, Florida.
Harper,J.M., Stone, M.L., Tribelhom,R.E., Jansen,G.R., Lorenz,K.J. and Maga,J.A.
(1977).Evaluation of low cost extrusion cooker for use in LDCS,Annual
report,LEC-2,Colorado State University,Fort Collins,Colo, p63
Hart, D. J., & Scott, K. J. (1995). Development and evaluation of an HPLC method for
the analysis of carotenoids in foods, and the measurement of the carotenoid
Page | 146
content of vegetables and fruits commonly consumed in the UK. Food
Chemistry, 54(1), 101-111.
Hashim, N., & Pongjata, J. (2000). Vitamin A Activity of Rice-based Weaning Foods
Enriched with Germinated Cowpea Flour, Banana, Pumpkin and Milk Powder.
Malaysian J Nutr, 6, 65-73.
Holland, B., Welch, A., Unwin, I., Buss, D., Paul, A., & Southgate, D. (1991). McCance
and Widdowson's the composition of food. McCance and widdwson's the
composition of foods.
Holmes, A. D., & Spelman, A. F. (1946). Composition Of Squashes after winter
storage. Journal of Food Science, 11(4), 345-350.
Hoover, R., & Sosulski, F. (1985). Studies on the functional characteristics and
digestibility of starches from Phaseolus vulgaris biotypes. Starch Stärke, 37(6),
181-191.
Huang, D. P., & Rooney, L. W. (2001). Starches for snack foods. Snack Foods
Processing, 115-130.
Huber, G. (2001). Snack foods from cooking extruders. Snack Foods Processing.
Lucas, RW, Rooney, LW, ed. CRC: Baton Roca, Fl, 315-323.
Hun,C.J. (2012,Sept 28). Economic Report 2012/2013 Malaysia 2013 GDP growth
forecast at 4.5% to 5.5% says MoF. Theedgemalaysia.com. Retrieved April 4,
2013 from http://www.theedgemalaysia.com/highlights/221437-economic-
report-20122013-msia-2013-gdp-growth-forecast-at-45-to-55-says-mof.html
Ibanoglu, S., Ainsworth, P., Ozer, E. A., & Plunkett, A. (2006). Physical and sensory
evaluation of a nutritionally balanced gluten-free extruded snack. Journal of
Food Engineering, 75, 469-472.
Ilo, S., & Berghofer, E. (1999). Kinetics of colour changes during extrusion cooking of
maize grits. Journal of Food Engineering, 39, 73-80.
Ilo, S., Tomschik, U., Berghofer, E., & Mundigler, N. (1996). The effect of extrusion
operating conditions on the apparent viscosity and the properties of extrudates

Page | 147
in twin-screw extrusion cooking of maize grits. Lebensmittel-Wissenschaft und-
Technologie, 29(7), 593-598.
Jansen,G.R. (1979). Nutritional aspects of the LEC program at Colorado State
University. D.E.Wilson, R.E.Tribelhorn (Eds) low-cost extrusion
cookers,Colorado State University,Fort Collins,Colo, pp121-141
Jin, Z., Hsieh, F., & Huff, H. E. (1995). Effects of Soy Fiber, Salt, Sugar and Screw
Speed on Physical Properties and Microstructure of Corn Meal Extrudate*.
Journal of Cereal Science, 22, 185-194
Jin,Z., Hsieh, F & Huff, H.C. (1994). Extrusion cooking of corn meal with soy fiber,salt
and sugar. Cereal Chemistry, 71(3), 227-234
Jirapa, P., Normah, H., Zamaliah, M. M., Asmah, R., & Mohamad, K. (2001). Nutritional
quality of germinated cowpea flour (Vigna unguiculata) and its application in
home prepared powdered weaning foods. Plant Foods for Human Nutrition,
56(3), 203-216.
Jun, H. I., Lee, C. H., Song, G. S., & Kim, Y. S. (2006). Characterization of the pectic
polysaccharides from pumpkin peel. LWT-Food Science and Technology, 39(5),
554-561.
Karkle, E.L., Alavi, S., Dogan,H., Jain,S. & Waghray,K. (2009). Development and
evaluation of fruit and vegetable-based extruded snacks. Online AACC
International Cereal Science Knowledge Database. (From
http://www.aaccnet.org/publications/plexus/cfwplexus/library/webcasts/Pages/E
Karkle.aspx)
Kean, E. G., Hamaker, B. R., & Ferruzzi, M. G. (2008). Carotenoid bioaccessibility from
whole grain and degermed maize meal products. Journal of Agricultural and
Food Chemistry, 56(21), 9918-9926.
Kiileit, U. (1994). Vitamin retention in extrusion cooking. Food Chemistry, 49, 149-153.
Knuckles, B., Hudson, C., Chiu, M., & Sayre, R. (1997). Effect of β-glucan barley
fractions in high-fiber bread and pasta. Cereal foods world, 42(2), 94-100.

Page | 148
Kocyan, A., Zhang, L. B., Schaefer, H., & Renner, S. S. (2007). A multi-locus
chloroplast phylogeny for the Cucurbitaceae and its implications for character
evolution and classification. Molecular phylogenetics and evolution, 44(2), 553-
577.
Koike, K., Li, W., Liu, L., Hata, E., & Nikaido, T. (2005). New phenolic glycosides from
the seeds of Cucurbita moschata. Chemical & Pharmaceutical Bulletin, 53(2),
225-228.
Konopacka, D. (2006). The effect of enzymatic treatment on dried vegetable color.
Drying Technology, 24(9), 1173-1178.
Konopacka, D., Seroczynska, A., Korzeniewska, A., Jesionkowska, K., Niemirowicz-
Szczytt, K., & Plocharski, W. (2010). Studies on the usefulness of Cucurbita
maxima for the production of ready-to-eat dried vegetable snacks with a high
carotenoid content. LWT-Food Science and Technology, 43(2), 302-309.
Kruger, A. (2012). Demographics, Purchasing Behaviors, and Nutrient Composition
among Vending Machine Consumers at The Ohio State University. Retrieved
from http://hdl.handle.net/1811/51914
Kurz, C., Carle, R., & Schieber, A. (2008). HPLC-DAD-MSn characterisation of
carotenoids from apricots and pumpkins for the evaluation of fruit product
authenticity. Food Chemistry, 110(2), 522-530.
Lai,V.M.F., Lu,S., & Lii, C.Y. (2000). Molecular characteristics influencing
retrogradation kinetics of rice amylo pectins. Cereal Chemistry, 77(2000), 272-
278
Lawton, B., Henderson, G., & Derlatka, E. J. (1972). The effects of extruder variables
on the gelatinisation of corn starch. The Canadian Journal of Chemical
Engineering, 50(2), 168-172.
Lazos, E. S. (1986). Nutritional, fatty acid, and oil characteristics of pumpkin and melon
seeds. Journal of Food Science, 51(5), 1382-1383.
Page | 149
Lee, C. H., Cho, J. K., Lee, S. J., Koh, W., Park, W., & Kim, C. H. (2002). Enhancing β-
carotene content in Asian noodles by adding pumpkin powder. Cereal
Chemistry, 79(4), 593-595.
Lee,C.Y., Smith, N.L. & Robinson,R.W. (1984). Carotenoids and vitamin A value of
fresh and canned winter squashes. Nutr. Rep. Int. 29,129-133
Lee, F. A. (1983). Basic food chemistry: Avi Publishing Company Inc.
Lee, J., Ye, L., Landen, W. O., & Eitenmiller, R. R. (2000). Optimization of an
extraction procedure for the quantification of vitamin E in tomato and broccoli
using response surface methodology. Journal of Food Composition and
Analysis, 13(1), 45-57.
Liang, M., Huff, H., & Hsieh, F. H. (2002). Evaluating Energy Consumption and
Efficiency of a Twin Screw Extruder. Journal of Food Science, 67(5), 1803-
1807.
Linsken, H.F., & Jackson, J.F. (1994). Modern methods of plant analysis. Springer,
Berlin. 187
Liu, S., Peng, M., Tu, S., Li, H., Cai, L., & Yu, X. (2005). Development of a new meat
analog through twin-screw extrusion of defatted soy flour-lean pork blend. Food
Science and Technology International, 11(6), 463-470.
Liu, Y., Hsieh, F., Heymann, H., & Huff, H. (2000). Effect of process conditions on the
physical and sensory properties of extruded oat-corn puff. Journal of Food
Science, 65(7), 1253-1259.
Longe, O. G., Farinu, G. O., & Fetuga, B. L. (1983). Nutritional value of the fluted
pumpkin (Telfaria occidentalis). Journal of Agricultural and Food Chemistry,
31(5), 989-992.
Lu, Q. (1992). Dynamic modelling and analysis of twin screw extruder. PhD dissertation
Dept of Food Science, University of Missouri, Columbia MI
MacDougall, D. B. (2002). Discontinuity, bubbles, and translucence: major error factors
in food color measurement. In Proceeding of SPIE 4421, 9th Congress of the

Page | 150
International Colour Association, 685 (June 6, 2002); doi:10.1117/12.464552;
http://dx.doi.org/10.1117/12.464552
Mastromatteo,M., Danza,A., Guida,M. & Del Nobile,M.A. (2012). Formulation
optimisation of vegetable flour-loaded functional bread Part 1: Screening of
vegetable flours and structuring agents. International Journal of Food Science
and Technology, 47, 1313-1320
McCance, R.A. & Widdowson, E.M. (1991). The composition of foods.5th
edn.Cambridge,UK:Royal Society of Chemistry
Maga, J., & Kim, C. (1989). Co-extrusion of rice flour with dried fruits and fruit juice
concentrates. Lebensm.-Wiss. Technol, 22, 182-187.
Marek, G., Radzanowska,J.Danilcenko,H.,Jariene,E & Cerniauskiene,J. (2008).Quality
of pumpkin Cultivars in relation to sensory characteristics. Notulae Botanicae
Horti Agrobotanici Chyi-Napoce, 36(1):73-79
Matz, S. A. (1993). Puffed Snacks. In M. MA (Ed.), Snack food Technology (pp. 159-
172). New York: AVI.
Mendonca, S., Grossmann,M.V.E., Verhe, R. (2000). Corn bran as a fibre source in
expanded snacks. . Lebensm.-Wiss. Technol, 33, 2-8.
Meng, X., Threinen, D., Hansen, M., & Driedger, D. (2010). Effects of extrusion
conditions on system parameters and physical properties of a chickpea flour-
based snack. Food Research International, 43(2), 650-658.
Mian, R. (2005). Extruded Snacks Handbook of Food Science, Technology, and
Engineering, Volume Four: CRC Press.
Miller, R. (1988). Continuous cooking of breakfast cereals. Cereal foods world, 33(3),
284-291.
Montgomery, D. C. (2008). Design and analysis of experiments: John Wiley & Sons
Inc. 416-419.
Page | 151
Montgomery, D. C., & Myers, R. H. (2002). Response surface methodology: process
and product optimization using designed experiments. Response Surface
Methodology: Process and Product Optimization Using Designed Experiments.
Montgomery, D. C., & Wiley, J. (2001). Design and Analysis of Engineering
Experiments: New York: Wiley. 416-419.
Moraru, C. I., & Kokini, J. L. (2003). Nucleation and Expansion During Extrusion and
Microwave Heating of Cereal Foods. Comprehenisve Reviews In Food Science
and Food Safety, 2, 147-165.
Morini, G and Maga, J.A. Properties of extruded rice flour and acorn squash (Cucubita
pepo) blends. Developments in Food Science , 37, 549-555
Munoz, A. M., & Chambers, E. (1993). Relating sensory measurements to consumer
acceptance of meat products. Food technology, 47.
Murkovic, M., Hillebrand, A., Winkler, J., & Pfannhauser, W. (1996). Variability of
vitamin E content in pumpkin seeds (Cucurbita pepo L). Zeitschrift für
Lebensmitteluntersuchung und-Forschung A, 202(4), 275-278.
Murkovic, M., Malleder, U., & Neunteufl, H. (2002). Carotenoid content in different
varieties of pumpkins. Journal of Food Composition and Analysis, 15(6), 633-
638.
Murkovic, M., Piironen, V., Lampi, A. M., Kraushofer, T., & Sontag, G. (2004). Changes
in chemical composition of pumpkin seeds during the roasting process for
production of pumpkin seed oil (Part 1: non-volatile compounds). Food
Chemistry, 84(3), 359-365.
Myers, R & Montgomery,D.C. (2002). Response Surface Methodology. Wiley, New
York, USA.
Montgomery,D.C. (2001). Design and analysis of experiments, 5th edn.Wiley,New York.
Nishimune, T., Yakushiji, T., Sumimoto, T., Taguchi, S., Konishi, Y., Nakahara, S.
Kunita, N. (1991). Glycemic response and fiber content of some foods.
American Journal of Clinical Nutrition, 54(2), 414-419.

Page | 152
Noguchi, A. (1989). Extrusion cooking of high-moisture protein foods. Extrusion
cooking, 143.
Noor Aziah, A. A., & Komathi, C. A. (2009). Physicochemical and functional properties
of peeled and unpeeled pumpkin flour. Journal of Food Science, 74(7).; S:328-
33
Norfezah, M., Hardacre, A., & Brennan, C. (2011). Comparison of waste pumpkin
material and its potential use in extruded snack foods. Food Science and
Technology International, 17(4), 367-373.
Normah Hashim & Jirapa Pongjata (2000). Vitamin A activity of rice-based weaning
foods enriched with germinated cowpea flour, banana,pumpkin and milk powder.
Malaysian JNutr 6: 65-73.
Nwabueze, T. (2007). Effect of process variables on trypsin inhibitor activity (TIA),
phytic acid and tannin content of extruded African breadfruit–corn–soy mixtures:
A response surface analysis. LWT-Food Science and Technology, 40(1), 21-29.
Nwokolo, E., & Sim, J. S. (1987). Nutritional assessment of defatted oil meals of melon
(Colocynthis Citrullus L.) and fluted pumpkin (Telfaria occidentalis Hook) by
chick assay. Journal of the Science of Food and Agriculture, 38(3), 237-246.
Olkku, J., Hagqvist, A., & Linko, P. (1983). Steady-state modelling of extrusion cooking
employing response surface methodology. Journal of Food Engineering, 2(2),
105-128.
Pansawata, N., Jangchuda, K., Jangchuda, A., Wuttijumnonga, P., Saaliac, F. K.,
Eitenmillerb, R. R., & Phillips, R. D. (2008). Effects of extrusion conditions on
secondary extrusion variables and physical properties of fish, rice-based
snacks. LWT, 41, 632-641
Paris, H. S., Schaffer, A. A., Ascarelli, I. M., & Burger, Y. (1989). Heterozygosity of
gene –B and the carotenoid content of cucurbita-pepo. Crop Research, 29(1),
11-18.

Page | 153
Park, Y. W. (1987). Effect of Freezing, Thawing, Drying, and Cooking on Carotene
Retention in Carrots, Broccoli and Spinach. Journal of Food Science, 52(4),
1022-1025.
Paton, D., & Spratt, W. (1981). Simulated approach to the estimation of degree of
cooking of an extruded cereal product [Wheat starch]. Cereal Chemistry, 58.
Pereira, M. A., Swain, J., Goldfine, A. B., Rifai, N., & Ludwig, D. S. (2004). Effects of a
low–glycemic load diet on resting energy expenditure and heart disease risk
factors during weight loss. JAMA: the journal of the American Medical
Association, 292(20), 2482.
Pérez Navarrete, C., González, R., Chel Guerrero, L., & Betancur Ancona, D. (2006).
Effect of extrusion on nutritional quality of maize and Lima bean flour blends.
Journal of the Science of Food and Agriculture, 86(14), 2477-2484.
Pongjanta, J., Naulbunrang, A., Kawngdang, S., Manon, T., & Thepjaikat, T. (2006).
Utilization of pumpkin powder in bakery products. Songklanakarin Journal of
Science and Technology, 28(SUPPL. 1), 71-79.
Prabhat, K., Sandeep, K., & Sajid, A. (2010). Extrusion of Foods Mathematical
Modeling of Food Processing (pp. 795-827): CRC Press.
Prabhat, K., Sandeep, K., & Sajid, A. (2010). Extrusion of Foods Mathematical
Modeling of Food Processing (pp. 795-827): CRC Press.
Provesi, J. G., Dias, C. O., & Amante, E. R. (2011). Changes in carotenoids during
processing and storage of pumpkin puree. Food Chemistry. 128, 195-202
Ptichkina,N.M., Markina,O.A., & Rumyantseva,G.N. (2008). Pectin extraction from
pumpkin with the aid of microbial enzymes. Food Hydrocolloids. 22(1), 192-195
Ptitchkina, N. M., Danilova, I. A., Doxastakis, G., Kasapis, S., & Morris, E. R. (1994).
Pumpkin pectin: gel formation at unusually low concentration. Carbohydrate
Polymers, 23(4), 265-273.
Puppala, V. (1998). Texture comparison of traditional and extruded cornflakes. Cereals
Foods World, 43(8), 650-652.

Page | 154
Que, F., Mao, L., Fang, X., & Wu, T. (2008). Comparison of hot air-drying and freeze-
drying on the physicochemical properties and antioxidant activities of pumpkin
(Cucurbita moschata Duch.) flours. International Journal of Food Science and
Technology, 43, 1195–1201.
Radovich,T. (2010). Pumpkin and squash. Retrieved online March 6, 2013 from
http://www.agroforestry.net/scps/Pumpkin-squash_speciality_crop.pdf
Ravindran, G., Carr, A., & Hardacre, A. (2011). A comparative study of the effects of
three galactomannans on the functionality of extruded pea-rice blends. Food
Chemistry, 124(4), 1620-1626.
Rhee, K., Kim, E., Kim, B., Jung, B., & Rhee, K. (2004). Extrusion of minced catfish
with corn and defatted soy flours for snack foods. Journal of Food Processing
and Preservation, 28(4), 288-301.
Riaz, M. N. (2000). Extruders in food applications: CRC.
Riaz, M. N. (2006). Soy applications in food: CRC Press.
Roberts, S. B. (2000). High-glycemic index foods, hunger, and obesity: is there a
connection? Nutrition Reviews-Washington., 58(6), 163-169.
Rossen, J., & Miller, R. (1973). Food extrusion. Food Technol, 27(8), 46.
Ryu, G. H., & Ng, P. (2001). Effects of selected process parameters on expansion and
mechanical properties of wheat flour and whole cornmeal extrudates. Starch
Stärke, 53(3 4), 147-154
S. Ilo, U. T., Berghofer, E., & Mundigler, N. (1996). The effect of extrusion operating
conditions on the apparent viscosity and the properties of extrudates in twin-
screw extrusion cooking of maize grits. Lebensm.-Wiss. u.-Technol, 29, 593-
598.
Sacks, F. M., Appel, L. J., Moore, T. J., Obarzanek, E., Vollmer, W. M.,Svetkey, L. P.,
et al. (1999). A dietary approach to prevent hypertension:A review of the Dietary
Approaches to Stop Hypertension (DASH) study. Clinical Cardiology, 22(Suppl.
7), III6–III10
Page | 155
Sajilata, M., & Singhal, R. S. (2005). Specialty starches for snack foods. Carbohydrate
Polymers, 59(2), 131-151.
Schaffer, A., Paris, H., & Ascarelli, I. (1986). Carotenoid and starch content of near-
isogenic B+ B+ and BB genotypes of Cucurbita. Journal of the American
Society for Horticultural Science (USA).
Serna-Saldivar, S. O., Gomez, M. H., & Rooney, L. W. (2001). Food uses of regular
and specialty corns and their dry-milled fractions. Specialty corns, 2, 303-337.
Sidek, Z. (1999). Viruses of Cucurbits: The strategies.
Singh,J., Kaur & McCarthy,O.J. (2007). Factors influencing the physic-
chemical,morphological,thermal and rheological properties of some chemically
modified starches for food applications_A Review. Food Hydrocolloids, 21(1), 1-
22
Sivak, M. N., & Preiss, J. (1998). Starch: Basic Science to Biotechnology: Academic Press.
Stojceska, V., Ainsworth, P., Plunkett, A., İbanoğlu, E., & İbanoğlu, Ş. (2008).
Cauliflower by-products as a new source of dietary fibre, antioxidants and
proteins in cereal based ready-to-eat expanded snacks. Journal of Food
Engineering, 87(4), 554-563.
Stone, H., & Sidel, J. L. (2004). Sensory evaluation practices: Academic press.
Szcesniak, A. (2002). Texture is a sensory property. Food Quality and Preference, 13,
Tee, E. (1991). Carotenoid composition and content of Malaysian vegetables and fruits
by the AOAC and HPLC methods. Food Chemistry, 41(3), 309-339.
Teotia, M. S., Saxena, A. K., Berry, S. K., & Ahuja, D. K. (2004). Development of
instant pumpkin Kofta. Journal of Food Science and Technology-Mysore, 41(6),
703-706.
Tindall, H. D. (1983). Vegetables in the tropics: Macmillan Press Ltd.
Unhealthy lifestyle a big concern. (2005). The Star.

Page | 156
USDA. USDA National Nutrient Database for Standard Reference, Release 16.
Nutrient Data Laboratory Home Page. U.S. Department of Agriculture,
Agricultural Research Service, 2003
Vanhanen, L. P., Savage, G., Dutta, P., & Vile, G. (2003). Fatty acid, tocopherol and
phytosterol composition of cucurbit seeds grown in Marlborough, New
Zealand.30, 66-70
Vanhanen, L.P., Savage,G.P. & Dutta, P.C. (2005).Tocopherol content of pumpkin
seed oil.Proceeding of the Nutrition Society of New Zealand,
Wang, P., Liu, J., Zhao, Q., & Hao, L. (2002). Studies on nutrient composition and
utilization of pumpkin fruit. [J]. Journal of Inner Mongola Institute of Agriculture
and Animal Husbandry, 3.
Wang,P., & Zhao, Q.Y. (1998). Nutrient ingredient, medicinal value and exploitative
prospects of pumpkin. Journal of Chiang Jiang Vegetables. 7, 1-4
Watson, S.A. (1987). Measurement and maintance of quality.Chapter 5 in:Corn:
Chemistry and Technology.Am.Assoc.Cereal Chem:St.Paul MN
Watson,S. & Ramstad, P. (1987). Structure and composition In : Corn : Chemistry and
Technology,S.A. Watson and Ramstad,eds.AACC International.St Paul, MN
Weng, W. L., Liu, Y. C., & Lin, C. W. (2001). Studies on the optimum models of the
dairy product Kou Woan Lao using response surface methodology. Asian
Australasian Journal of Animal Sciences, 14(10), 1470-1476.
Wenli, Y., Yaping, Z., Jingjing, C., & Bo, S. (2004). Comparison of two kinds of
pumpkin seed oils obtained by supercritical CO2 extraction. European Journal
of Lipid Science and Technology, 106(6), 355-358.
Wien, H. C. (1997). The physiology of vegetables crops centre for agriculture and
biosciences. CAB International, 345-376.
Yagci,S. & Gogus,F. (2010). Effect of incorporation of various food by-products on
some nutritional properties of rice-based extruded foods.Food Science and
Technology International, 15(6), 571-581

Page | 157
YagcI, S., & Gögüs, F. (2008). Response surface methodology for evaluation of
physical and functional properties of extruded snack foods developed from
food-by-products. Journal of Food Engineering, 86(1), 122-132.
Yang, S.-h., Peng, J., Lui, W.-B., & Lin, J. (2008). Effects of adlay species and rice flour
ratio on the physicochemical properties and texture characteristic of adlay-
based extrudates. Journal of Food Engineering, 84, 489-494.
Page | 158
Appendices

Page
| 15
9
Appe
ndix
1
The
regr
essi
on e
quat
ions
for t
he d
epen
dent
var
iabl
es
K
W
T PT
SM
E LE
SE
L
a
b
B
D
TD
H
TC
Inte
rcep
t 1.
87
7.79
69
.22
0.16
22
.28
12.2
2 71
.47
4.60
38
.02
83.7
0 13
2.75
16
5.63
1.
81
X 1
-0.0
88
-0.4
4 -1
1.30
- 6.
0246
E-0
03
1.59
-0
.26
-4.2
0 0.
90
-2.1
5 -2
0.03
-2
6.75
-7
3.08
-0
.28
X 2
0.12
0.
56
3.14
1.
714E
-00
3 0.
93
0.36
0.
34
-0.1
1 0.
45
-3.6
0 -9
.12
-6.6
2 -0
.28
X 3
7.62
2E-
003
-6.9
57E-
003
2.53
-7
.722
E-00
3 -0
.64
-2.1
4 -3
.76
1.37
-0
.031
53
.48
84.6
7 21
0.91
1.
26
X 12
-0
.11
-0
.13
3.
00
4.51
8.
37
X 22
0.
12
-0
.092
2.89
4.
36
6.16
X 32
-0
.86
-0
.96
31
.63
42.5
6 15
9.25
X 1X 2
0.27
0.06
7
3.29
10
.22
19.0
2
X 1X 3
0.47
0.25
-23.
49
-37.
28
-111
.37
X2X
3
-0.0
56
-0
.050
-1.9
5 -6
.62
1.32
X1-B
arre
l te
mpe
ratu
re,
X2-F
eed
rate
, X3
-Pum
pkin
flo
ur p
erce
ntag
e,
KW-P
ower
con
sum
ptio
n, T
-Tor
que,
PT-
Pre
ssur
e Th
rust
, S
ME
-Spe
cific
Mec
hani
cal
Ene
rgy,
LE
-Lo
ngitu
dina
l Exp
ansi
on,S
E-S
ectio
nal e
xpan
sion
, L-li
ghtn
ess
valu
e, B
D-B
ulk
dens
ity, T
D-T
rue
dens
ity, H
-Har
dnes
s, T
C-T
otal
Car
oten
oid

Page
| 16
0
Appe
ndix
2
Anal
ysis
of V
aria
nce
(AN
OVA
) res
ults
for f
itted
mod
els
of d
epen
dent
var
iabl
es fo
r pum
pkin
flou
r-co
rn g
rits
snac
k pr
oduc
ts.
Res
pons
e
Sou
rce
Sum
of
Squa
res
df
Mea
n sq
uare
s F-
valu
e P-
valu
e
Pow
er
Con
sum
ptio
n (k
w)
Mod
el
Line
ar
Lack
of f
it
Pure
Err
or
Res
idua
l
Tota
l
0.3
0.09
8
0.01
3
0.11
0.41
3 11
5 16
19
0.10
0
8.87
6 ×
10-3
2.54
7 ×
10-3
6.89
8 ×
10-3
14.4
6
3.49
<0.0
001
0.08
95
Torq
ue (N
m)
Mod
el
Line
ar
Lack
of f
it
Pure
Err
or
Res
idua
l
Tota
l
6.96
3.27
1.71
4.98
11.9
4
3 11
5 16
19
2.32
0.30
0.34
0.31
7.45
0.87
0.00
24
0.60
78

Page
| 16
1
Res
pons
e
Sou
rce
Sum
of
Squa
res
df
Mea
n sq
uare
s F-
valu
e P-
valu
e
Pre
ssur
e Th
rust
(Bar
) M
odel
Li
near
Lack
of f
it
Pure
Erro
r
Res
idua
l
Tota
l
1965
.76
209.
60
120.
88
330.
48
2296
.24
3 11
5 16
19
655.
25
19.0
5
24.1
8
20.6
5
31.7
2
0.79
<0.0
001
0.65
65
Spec
ific
Mec
hani
cal
Ener
gy (S
ME)
Mod
el
Line
ar
Lack
of f
it
Pure
Erro
r
Res
idua
l
Tota
l
1.35
0 ×
10-3
9.70
0 ×
10-4
2.00
× 1
0-4
1.17
× 1
0-4
2.52
0 ×
10-3
3 11
5 16
19
4.50
0 ×
10-4
8.81
8 ×
10-5
4.00
× 1
0-5
7.31
2 ×
10-5
6.15
2.20
0.00
55
0.19
75
Long
itudi
nal
Expa
nsio
n M
odel
Li
near
Lack
of f
it
Pure
Erro
r
Res
idua
l
Tota
l
51.7
9
21.4
9
5.21
6.15
1 ×
104
3 11
5 6 20
17.2
6
1.95
1.04
1.03
500.
21
10.3
5
1.87
0.00
05
0.25
29

Page
| 16
2
Res
pons
e
Sou
rce
Sum
of
Squa
res
df
Mea
n sq
uare
s F-
valu
e P-
valu
e
Sect
iona
l Ex
pans
ion
Mod
el
Qua
drat
ic
Lack
of f
it
Pure
Erro
r
Res
idua
l
Tota
l
11.2
5
2.61
5.28
6.28
2795
.08
3 5 5 6 20
3.75
0.52
1.06
1.05
139.
75
4.75
0.50
0.02
61
0.77
06
L va
lue
Mod
el
Line
ar
Lack
of f
it
Pure
Erro
r
Res
idua
l
Tota
l
436.
04
421.
81
3.82
49.3
2
1.03
0E+0
05
3 11
5 6 20
145.
35
38.3
5
0.76
8.22
5151
.04
5.46
50.1
3
0.00
89
0.00
02
a v
alue
M
odel
Q
uadr
atic
Lack
of f
it
Pure
Erro
r
Res
idua
l
Tota
l
13.2
0
2.39
0.05
1
0.08
9
340.
83
3 5 5 6 20
4.40
0.48
0.01
0
0.01
5
17.0
4
18.0
6
46.4
7
0.00
02
0.00
03

Page
| 16
3
Res
pons
e
Sou
rce
Sum
of
Squa
res
df
Mea
n sq
uare
s F-
valu
e P-
valu
e
b va
lue
Mod
el
Line
ar
Lack
of f
it
Pure
Erro
r
Res
idua
l
Tota
l
65.9
3
23.1
8
3.07
3.51
2899
5.74
3 11
5 6 20
21.9
8
2.11
0.61
0.59
1449
.79
13.4
0
3.43
0.00
01
0.09
20
Bul
k de
nsity
M
odel
Q
uadr
atic
Lack
of f
it
Pure
Erro
r
Res
idua
l
Tota
l
1444
22.8
9
1031
.10
23.7
8
179.
20
3.03
8E+0
05
3 5 5 6 20
4807
.63
206.
22
4.76
29.8
7
1518
8.69
45.5
7
43.3
5
<0.0
001
0.00
04
True
den
sity
M
odel
Q
uadr
atic
Lack
of f
it
Pure
Erro
r
Res
idua
l
Tota
l
2610
7.22
3037
.12
404.
01
420.
18
7.14
2E+0
05
3 5 5 6 20
8702
.41
607.
42
80.8
0
70.0
3
3571
2.09
25.2
9
7.52
<0.0
001
0.02
25

Page
| 16
4
Res
pons
e
Sou
rce
Sum
of
Squa
res
df
Mea
n sq
uare
s F-
valu
e P-
valu
e
Har
dnes
s M
odel
Q
uadr
atic
Lack
of f
it
Pure
Erro
r
Res
idua
l
Tota
l
3.67
5E+0
05
4151
4.77
1761
.56
6879
.72
2.81
0E+0
06
3 5 5 6 20
1.22
5E+0
05
8302
.95
352.
31
1146
.62
1.40
5E+0
05
28.3
0
23.5
7
<0.0
001
0.00
17
Tota
l ca
rote
noid
co
nten
t
Mod
el
Line
ar
Lack
of f
it
Pure
Erro
r
Res
idua
l
Tota
l
23.9
4
3.95
0.97
4.92
28.8
6
3 11
5 16
19
7.98
0.36
0.19
0.31
25.9
4
1.86
<0.0
001
0.25
56

Page
| 16
5
Appe
ndix
3
Stan
dard
cur
ve o
f tot
al c
arot
enoi
d
y =
0.16
77x
- 0.0
102
R² =
0.9
904
00.
005
0.01
0.01
50.
020.
025
0.03
0.03
50.
040.
045
00.
10.
20.
30.
4
Total carotenoid concentration (mg/ml)
Abso
rban
ce a
t 4
50nm
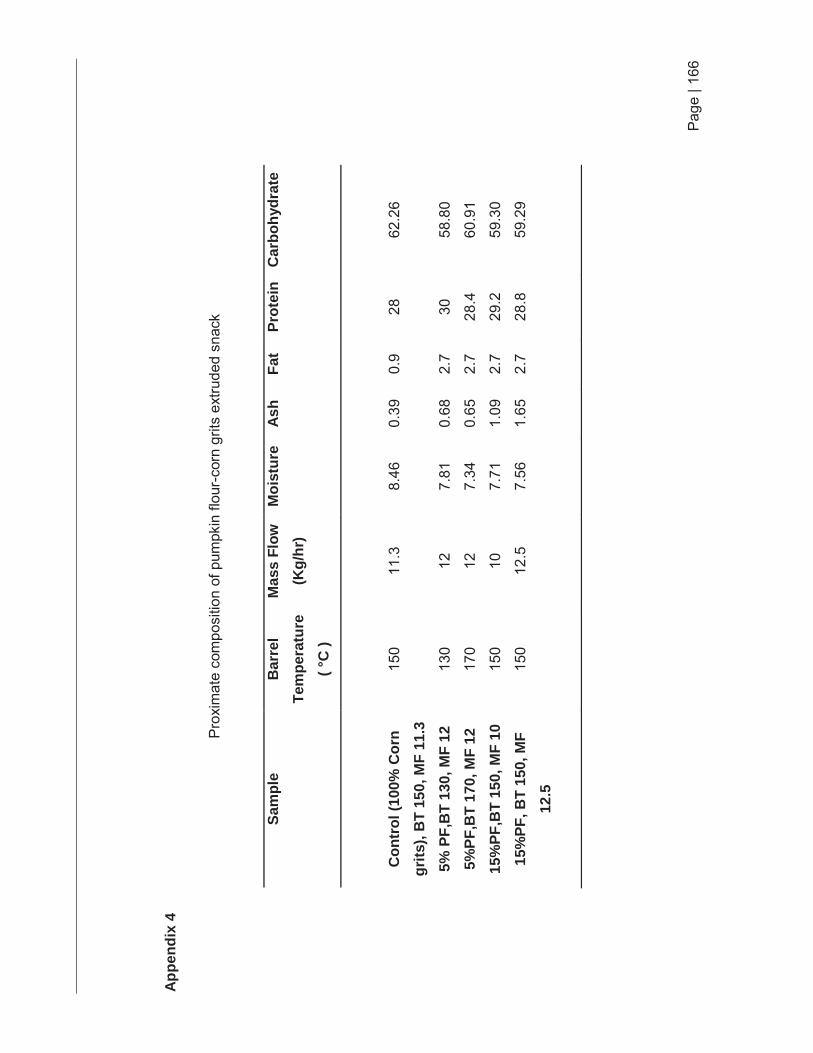
Page
| 16
6
Appe
ndix
4
Pro
xim
ate
com
posi
tion
of p
umpk
in fl
our-
corn
grit
s ex
trude
d sn
ack
Sam
ple
Bar
rel
Tem
pera
ture
( °
C )
Mas
s Fl
ow
(Kg/
hr)
Moi
stur
e As
h Fa
t Pr
otei
n C
arbo
hydr
ate
Con
trol
(100
% C
orn
grits
), B
T 15
0, M
F 11
.3
150
11.3
8.46
0.39
0.9
28
62.2
6
5% P
F,B
T 13
0, M
F 12
13
0 12
7.
81
0.68
2.
7 30
58
.80
5%PF
,BT
170,
MF
12
170
12
7.34
0.
65
2.7
28.4
60
.91
15%
PF,B
T 15
0, M
F 10
15
0 10
7.
71
1.09
2.
7 29
.2
59.3
0
15%
PF, B
T 15
0, M
F 12
.5
150
12.5
7.
56
1.65
2.
7 28
.8
59.2
9

Page | 167
Appendix 5
PUMPKIN-CORN GRITS EXTRUDED SNACKS PRODUCT
Consumer Sensory Evaluation
Please circle/complete the questions below:
Sex : Male / Female
Age :
All information provided will be used for academic purpose only.
Instructions:
You will be given five (5) different pumpkin-corn grits snack foods.
Please rinse your mouth before starting Evaluate the product in front of you by looking at it and tasting it (Please
evaluate one at a time) Please tick the box to indicate how much you liked and disliked this
product Finally, rank the samples from most liked to least liked
Thank you for your time and help
Cheers
Norfezah Md Nor
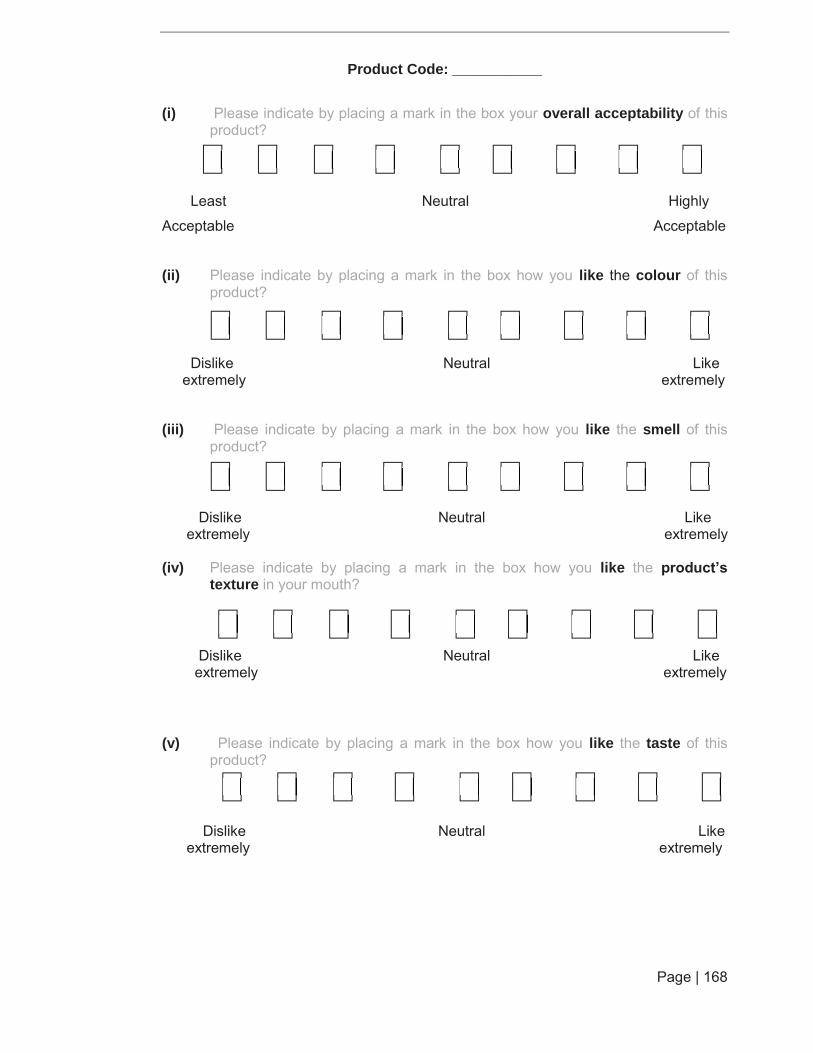
Page | 168
Product Code: ___________
(i) Please indicate by placing a mark in the box your overall acceptability of this product?
Least Neutral Highly
Acceptable Acceptable
(ii) Please indicate by placing a mark in the box how you like the colour of this product?
Dislike Neutral Like extremely extremely
(iii) Please indicate by placing a mark in the box how you like the smell of this product?
Dislike Neutral Like extremely extremely (iv) Please indicate by placing a mark in the box how you like the product’s
texture in your mouth?
Dislike Neutral Like extremely extremely
(v) Please indicate by placing a mark in the box how you like the taste of this product?
Dislike Neutral Like extremely extremely

Page | 169
(vi) Please indicate by placing a mark in the box your evaluation on the pumpkin flavour of this product?
Too Low Just Right Too Strong
(vii) Please indicate by placing a mark in the box if you would buy this product as a
snack food?
Not Likely Neutral Very Likely
Overall comment(s) of this product as a snack :
_____________________________________________________________________
_____________________________________________________________________
_____________________________________________________________________
___________________________

Page | 170
Product Code: ___________
(i) Please indicate by placing a mark in the box your overall acceptability of thisproduct?
Least Neutral Highly
Acceptable Acceptable
(ii) Please indicate by placing a mark in the box how you like the colour of thisproduct?
Dislike Neutral Like extremely extremely
(iii) Please indicate by placing a mark in the box how you like the smell of thisproduct?
Dislike Neutral Like extremely extremely (iv) Please indicate by placing a mark in the box how you like the product’s
texture in your mouth?
Dislike Neutral Like extremely extremely
(v) Please indicate by placing a mark in the box how you like the taste of thisproduct?
Dislike Neutral Like extremely extremely

Page | 171
(i) Please indicate by placing a mark in the box your evaluation on the pumpkinflavour of this product?
Too Low Just Right Too Strong
(ii) Please indicate by placing a mark in the box if you would buy this product as a
snack food?
Not Likely Neutral Very Likely
Overall comment(s) of this product as a snack :
_____________________________________________________________________
_____________________________________________________________________
_____________________________________________________________________
___________________________

Page | 172
Product Code: ___________
(i) Please indicate by placing a mark in the box your overall acceptability of thisproduct?
Least Neutral Highly
Acceptable Acceptable
(ii) Please indicate by placing a mark in the box how you like the colour of thisproduct?
Dislike Neutral Like extremely extremely
(iii) Please indicate by placing a mark in the box how you like the smell of thisproduct?
Dislike Neutral Like extremely extremely (iv) Please indicate by placing a mark in the box how you like the product’s
texture in your mouth?
Dislike Neutral Like extremely extremely
(v) Please indicate by placing a mark in the box how you like the taste of thisproduct?
Dislike Neutral Like extremely extremely

Page | 173
(i) Please indicate by placing a mark in the box your evaluation on the pumpkinflavour of this product?
Too Low Just Right Too Strong
(ii) Please indicate by placing a mark in the box if you would buy this product as a
snack food?
Not Likely Neutral Very Likely
Overall comment(s) of this product as a snack :
_____________________________________________________________________
_____________________________________________________________________
_____________________________________________________________________
___________________________

Page | 174
Product Code: ___________
(i) Please indicate by placing a mark in the box your overall acceptability of thisproduct?
Least Neutral Highly
Acceptable Acceptable
(ii) Please indicate by placing a mark in the box how you like the colour of thisproduct?
Dislike Neutral Like extremely extremely
(iii) Please indicate by placing a mark in the box how you like the smell of thisproduct?
Dislike Neutral Like extremely extremely (iv) Please indicate by placing a mark in the box how you like the product’s
texture in your mouth?
Dislike Neutral Like extremely extremely
(v) Please indicate by placing a mark in the box how you like the taste of thisproduct?
Dislike Neutral Like extremely extremely
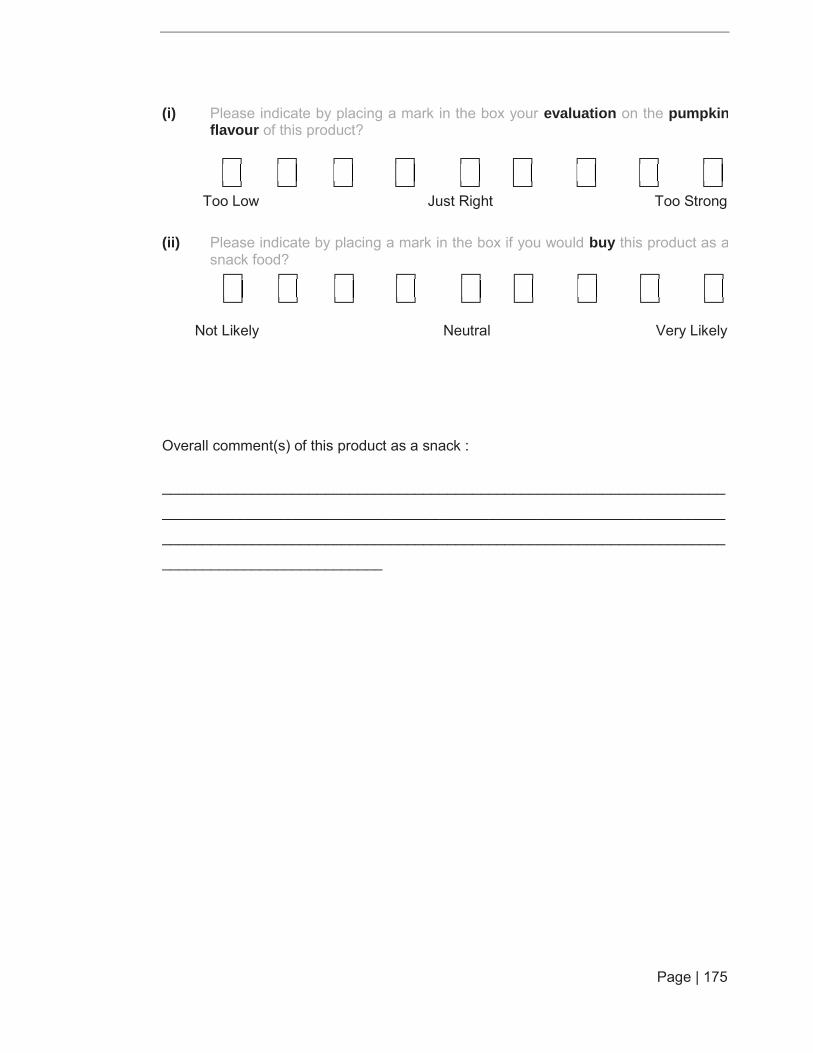
Page | 175
(i) Please indicate by placing a mark in the box your evaluation on the pumpkinflavour of this product?
Too Low Just Right Too Strong
(ii) Please indicate by placing a mark in the box if you would buy this product as a
snack food?
Not Likely Neutral Very Likely
Overall comment(s) of this product as a snack :
_____________________________________________________________________
_____________________________________________________________________
_____________________________________________________________________
___________________________

Page | 176
Product Code: ___________
(i) Please indicate by placing a mark in the box your overall acceptability of thisproduct?
Least Neutral Highly
Acceptable Acceptable
(ii) Please indicate by placing a mark in the box how you like the colour of thisproduct?
Dislike Neutral Like extremely extremely
(iii) Please indicate by placing a mark in the box how you like the smell of thisproduct?
Dislike Neutral Like extremely extremely (iv) Please indicate by placing a mark in the box how you like the product’s
texture in your mouth?
Dislike Neutral Like extremely extremely
(v) Please indicate by placing a mark in the box how you like the taste of thisproduct?
Dislike Neutral Like extremely extremely

Page | 177
(i) Please indicate by placing a mark in the box your evaluation on the pumpkinflavour of this product?
Too Low Just Right Too Strong
(ii) Please indicate by placing a mark in the box if you would buy this product as a
snack food?
Not Likely Neutral Very Likely
Overall comment(s) of this product as a snack :
_____________________________________________________________________
_____________________________________________________________________
_____________________________________________________________________
___________________________
Rank the samples from most liked to least liked, using the following numbers : 1 = most liked and 5 = the least liked
Sample Rank (1 to 5)
(Ties are not allowed)
289 __________
979 __________
175 __________
237 __________
318 __________
Thank you for your participation