Embed Size (px)
Citation preview
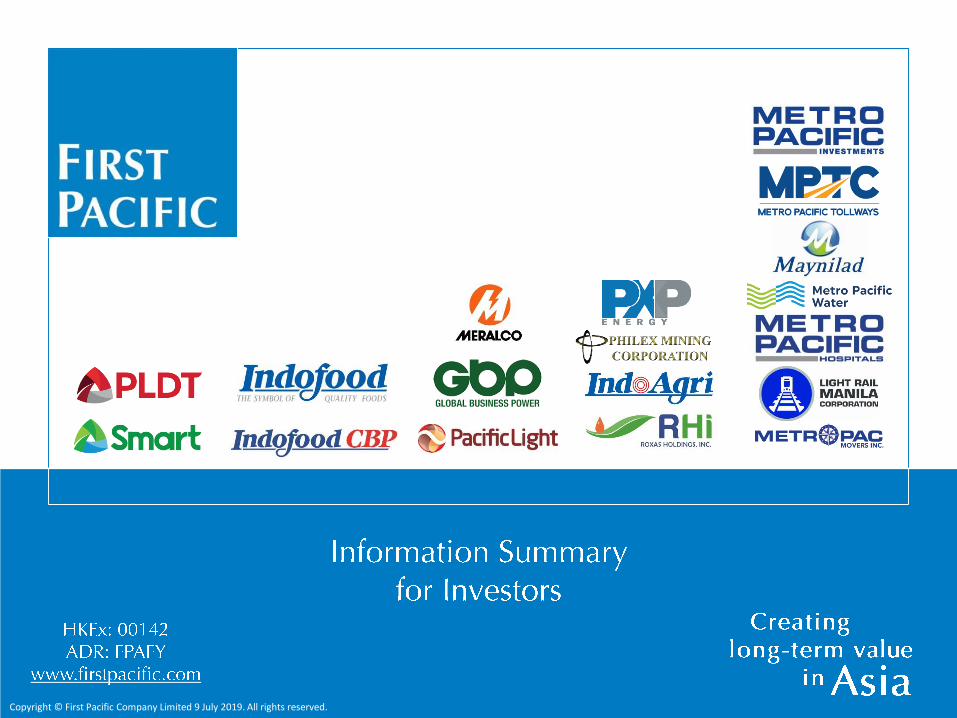
Copyright © First Pacific Company Limited 9 July 2019. All rights reserved.
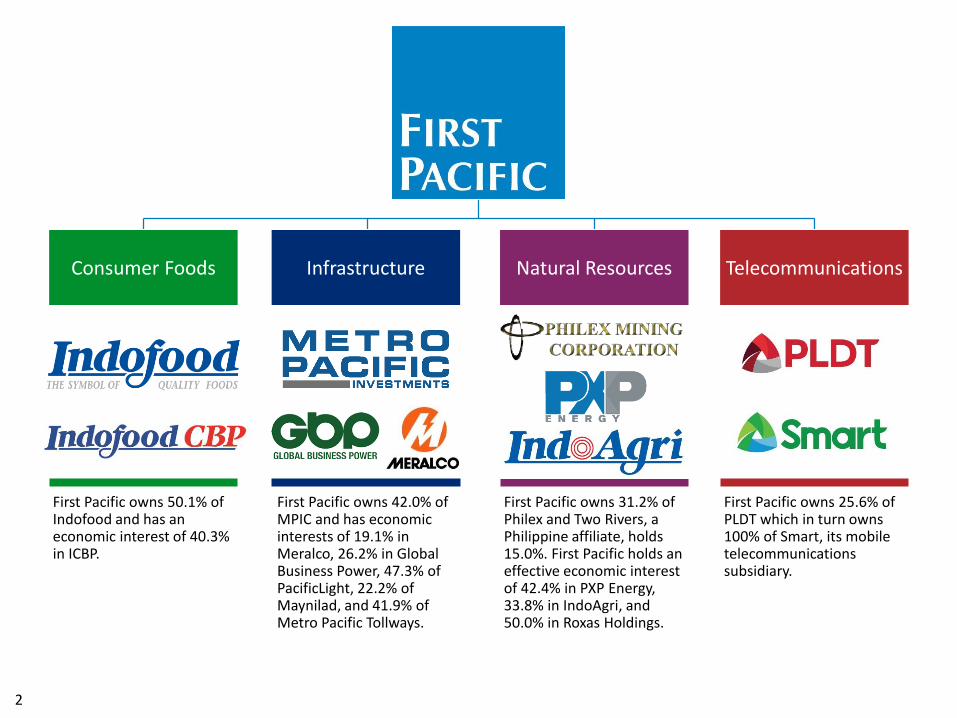
Consumer Foods
First Pacific owns 50.1% of Indofood and has an economic interest of 40.3% in ICBP.
Infrastructure
First Pacific owns 42.0% of MPIC and has economic interests of 19.1% in Meralco, 26.2% in Global Business Power, 47.3% of PacificLight, 22.2% of Maynilad, and 41.9% of Metro Pacific Tollways.
Telecommunications
First Pacific owns 25.6% of PLDT which in turn owns 100% of Smart, its mobile telecommunications subsidiary.
Natural Resources
First Pacific owns 31.2% of Philex and Two Rivers, a Philippine affiliate, holds 15.0%. First Pacific holds an effective economic interest of 42.4% in PXP Energy, 33.8% in IndoAgri, and 50.0% in Roxas Holdings.
2
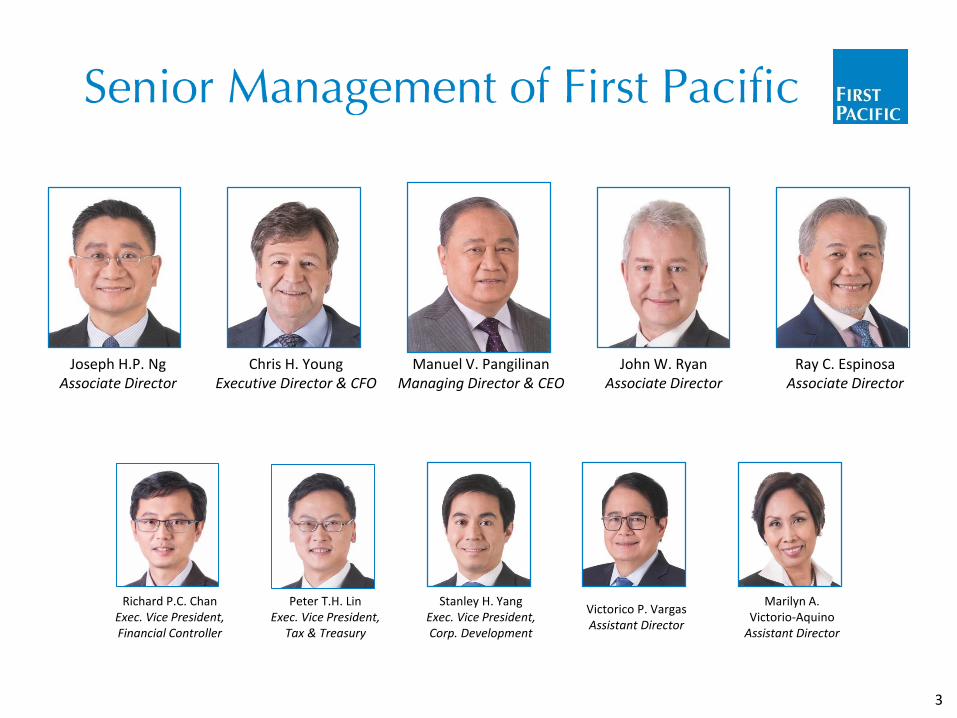
Chris H. YoungExecutive Director & CFO
Manuel V. PangilinanManaging Director & CEO
John W. RyanAssociate Director
Ray C. EspinosaAssociate Director
Stanley H. YangExec. Vice President,Corp. Development
Peter T.H. LinExec. Vice President,
Tax & Treasury
Richard P.C. ChanExec. Vice President,Financial Controller
Victorico P. VargasAssistant Director
Marilyn A. Victorio-Aquino
Assistant Director
3
Joseph H.P. NgAssociate Director
13 cmX
13 cm11.5 x 4.5
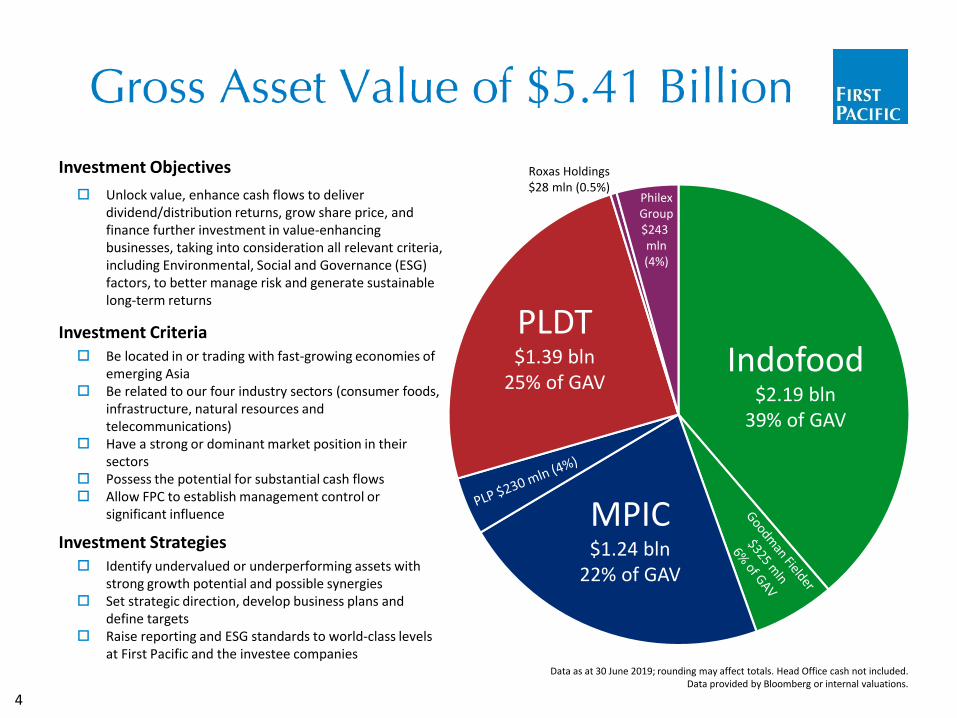
Investment Objectives
Unlock value, enhance cash flows to deliver dividend/distribution returns, grow share price, and finance further investment in value-enhancing businesses, taking into consideration all relevant criteria, including Environmental, Social and Governance (ESG) factors, to better manage risk and generate sustainable long-term returns
Investment Criteria Be located in or trading with fast-growing economies of
emerging Asia Be related to our four industry sectors (consumer foods,
infrastructure, natural resources and telecommunications)
Have a strong or dominant market position in their sectors
Possess the potential for substantial cash flows Allow FPC to establish management control or
significant influence
Investment Strategies Identify undervalued or underperforming assets with
strong growth potential and possible synergies Set strategic direction, develop business plans and
define targets Raise reporting and ESG standards to world-class levels
at First Pacific and the investee companies
PLDT$1.39 bln
25% of GAV
MPIC$1.24 bln
22% of GAV
PhilexGroup$243 mln(4%)
Indofood$2.19 bln
39% of GAV
Data as at 30 June 2019; rounding may affect totals. Head Office cash not included.Data provided by Bloomberg or internal valuations.
Roxas Holdings$28 mln (0.5%)
4
13.6 cmX
13.6 cm1.3 x 3.7
41%37%17%
6%
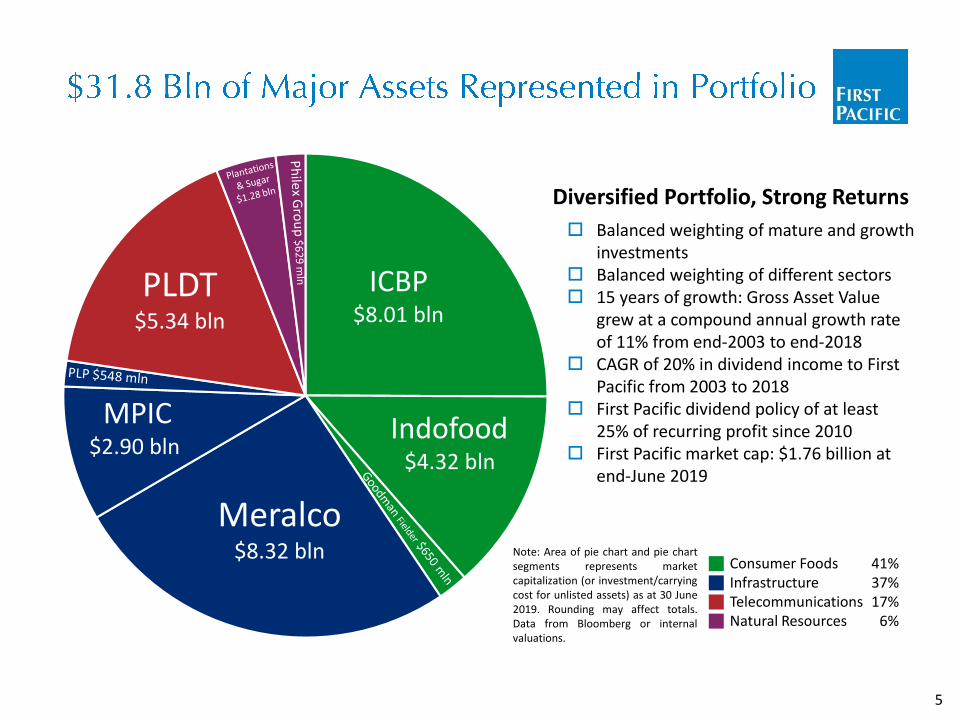
Consumer FoodsInfrastructureTelecommunicationsNatural Resources
Diversified Portfolio, Strong Returns
Balanced weighting of mature and growth investments
Balanced weighting of different sectors 15 years of growth: Gross Asset Value
grew at a compound annual growth rate of 11% from end-2003 to end-2018
CAGR of 20% in dividend income to First Pacific from 2003 to 2018
First Pacific dividend policy of at least 25% of recurring profit since 2010
First Pacific market cap: $1.76 billion at end-June 2019
Indofood$4.32 bln
Meralco$8.32 bln
MPIC$2.90 bln
ICBP$8.01 bln
PLDT$5.34 bln
Note: Area of pie chart and pie chartsegments represents marketcapitalization (or investment/carryingcost for unlisted assets) as at 30 June2019. Rounding may affect totals.Data from Bloomberg or internalvaluations.
5
Diverse Emerging ASEAN Portfolio Our Hong Kong-based investment management and
holding company has developed three core assets in fast-growing ASEAN markets: Indofood, MPIC, and PLDT
Together they offer earnings stability and high growth potential
Capital is continually recycled to the most promising opportunities
Indofood (Gross Revenues of $5.1 Billion) One of the largest food companies in Indonesia Largest instant wheat noodles producer in the world Largest flour and pasta manufacturer in Indonesia Operator of one of the largest FMCG distribution networks
in Indonesia
PLDT (Gross Revenues of $2.9 Billion) The largest overall telecom services provider in the
Philippines Operator of the most technologically advanced network in
the country Entering a new phase of sustained growth in both
subscriber numbers and average revenue per user
MPIC (Gross Revenues of $1.6 Billion) The largest infrastructure investment holding company in
the Philippines and expanding in other ASEAN markets Invested in key natural monopolies in electricity
distribution and generation, toll roads, and water, as well as other growth investments, e.g. hospitals and logistics
Core Assets Are Engines of Growth First Pacific’s key investments are based in the fast-
growing economies of Southeast Asia, a region we know well
Our ambition is threefold: Increase distributable earnings Narrow valuation discounts Nurture core holdings for growth
Non-Core Investments to Be Guided to Exit First Pacific has selected a handful of investments to be
sold, freeing capital for debt reduction and distribution to shareholders via share repurchases
These assets are outside our chosen geography of emerging Asia and outside our sector focus on consumer foods, infrastructure, telecommunications and natural resources
Potential disposals after Goodman Fielder will come from non-core investments
Value Investments Our holding company is currently trading at a historically
high discount to its net asset value Two of our three core investments are also trading at large
discounts – Indofood and MPIC First Pacific management is rigorously seeking to narrow
our NAV discount and release value to shareholders Our key means is seeking disposal of those assets deemed
non-core while focusing on value-creation at core investments and narrowing interest and head-office costs
6
90.6 89.5
202.9
(71.2)
(74.6)
7.5
(6.6)(32.9)
(26.2)
0
50
100
150
200
250
300
350
300.0
289.5
(20.9)
(9.7)
(8.4)(4.4)
16.1
8.1 5.0 2.3 1.4
230
240
250
260
270
280
290
300
310
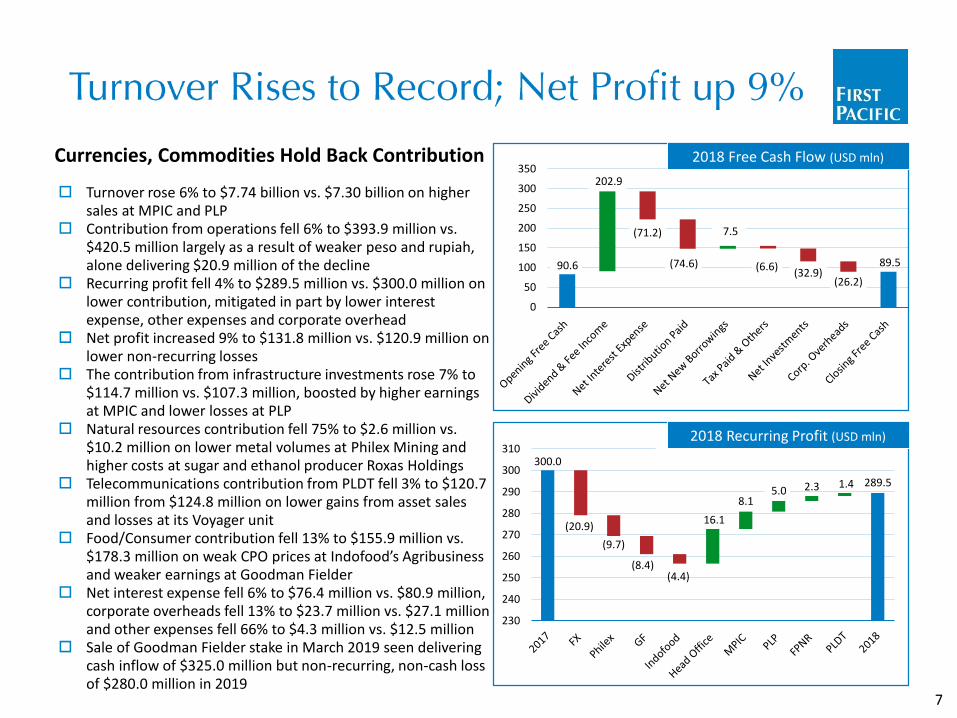
Currencies, Commodities Hold Back Contribution
Turnover rose 6% to $7.74 billion vs. $7.30 billion on higher sales at MPIC and PLP
Contribution from operations fell 6% to $393.9 million vs. $420.5 million largely as a result of weaker peso and rupiah, alone delivering $20.9 million of the decline
Recurring profit fell 4% to $289.5 million vs. $300.0 million on lower contribution, mitigated in part by lower interest expense, other expenses and corporate overhead
Net profit increased 9% to $131.8 million vs. $120.9 million on lower non-recurring losses
The contribution from infrastructure investments rose 7% to $114.7 million vs. $107.3 million, boosted by higher earnings at MPIC and lower losses at PLP
Natural resources contribution fell 75% to $2.6 million vs. $10.2 million on lower metal volumes at Philex Mining and higher costs at sugar and ethanol producer Roxas Holdings
Telecommunications contribution from PLDT fell 3% to $120.7 million from $124.8 million on lower gains from asset sales and losses at its Voyager unit
Food/Consumer contribution fell 13% to $155.9 million vs. $178.3 million on weak CPO prices at Indofood’s Agribusiness and weaker earnings at Goodman Fielder
Net interest expense fell 6% to $76.4 million vs. $80.9 million, corporate overheads fell 13% to $23.7 million vs. $27.1 million and other expenses fell 66% to $4.3 million vs. $12.5 million
Sale of Goodman Fielder stake in March 2019 seen delivering cash inflow of $325.0 million but non-recurring, non-cash loss of $280.0 million in 2019
2018 Free Cash Flow (USD mln)
2018 Recurring Profit (USD mln)
7
InterestCover
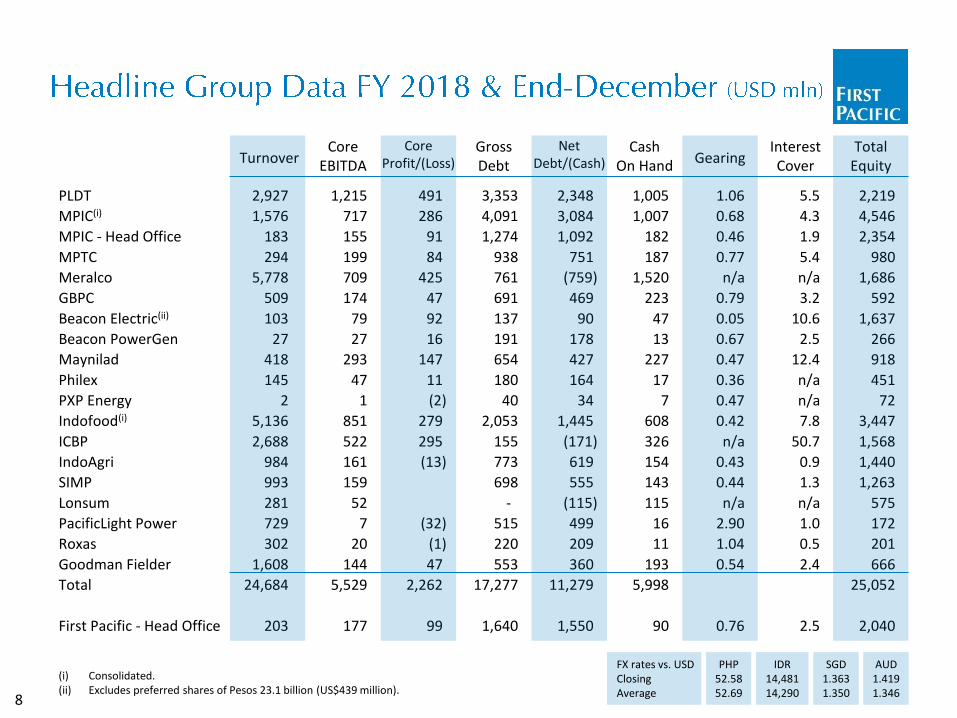
(i) Consolidated.(ii) Excludes preferred shares of Pesos 23.1 billion (US$439 million).
PLDT
MPIC(i)
MPIC - Head Office
MPTC
Meralco
GBPC
Beacon Electric(ii)
Beacon PowerGen
Maynilad
Philex
PXP Energy
Indofood(i)
ICBP
IndoAgri
SIMP
Lonsum
PacificLight Power
Roxas
Goodman Fielder
Total
First Pacific - Head Office
GrossDebt
3,353
4,091
1,274
938
761
691
137
191
654
180
40
2,053
155
773
698
-
515
220
553
17,277
1,640
CashOn Hand
1,005
1,007
182
187
1,520
223
47
13
227
17
7
608
326
154
143
115
16
11
193
5,998
90
5.5
4.3
1.9
5.4
n/a
3.2
10.6
2.5
12.4
n/a
n/a
7.8
50.7
0.9
1.3
n/a
1.0
0.5
2.4
2.5
CoreEBITDA
1,215
717
155
199
709
174
79
27
293
47
1
851
522
161
159
52
7
20
144
5,529
177
2,927
1,576
183
294
5,778
509
103
27
418
145
2
5,136
2,688
984
993
281
729
302
1,608
24,684
203
PHP52.5852.69
IDR14,48114,290
FX rates vs. USDClosingAverage
SGD1.3631.350
AUD1.4191.346
TurnoverCore
Profit/(Loss)
491
286
91
84
425
47
92
16
147
11
(2)
279
295
(13)
(32)
(1)
47
2,262
99
NetDebt/(Cash)
2,348
3,084
1,092
751
(759)
469
90
178
427
164
34
1,445
(171)
619
555
(115)
499
209
360
11,279
1,550
Gearing
1.06
0.68
0.46
0.77
n/a
0.79
0.05
0.67
0.47
0.36
0.47
0.42
n/a
0.43
0.44
n/a
2.90
1.04
0.54
0.76
TotalEquity
2,219
4,546
2,354
980
1,686
592
1,637
266
918
451
72
3,447
1,568
1,440
1,263
575
172
201
666
25,052
2,040
8
170
400
210
100
252
359
175
0
100
200
300
400
500
2020 2021 2022 2023 2024 2025 2026 2027 2028 2029
Unsecured Bank Loans Secured Bond Unsecured Bonds
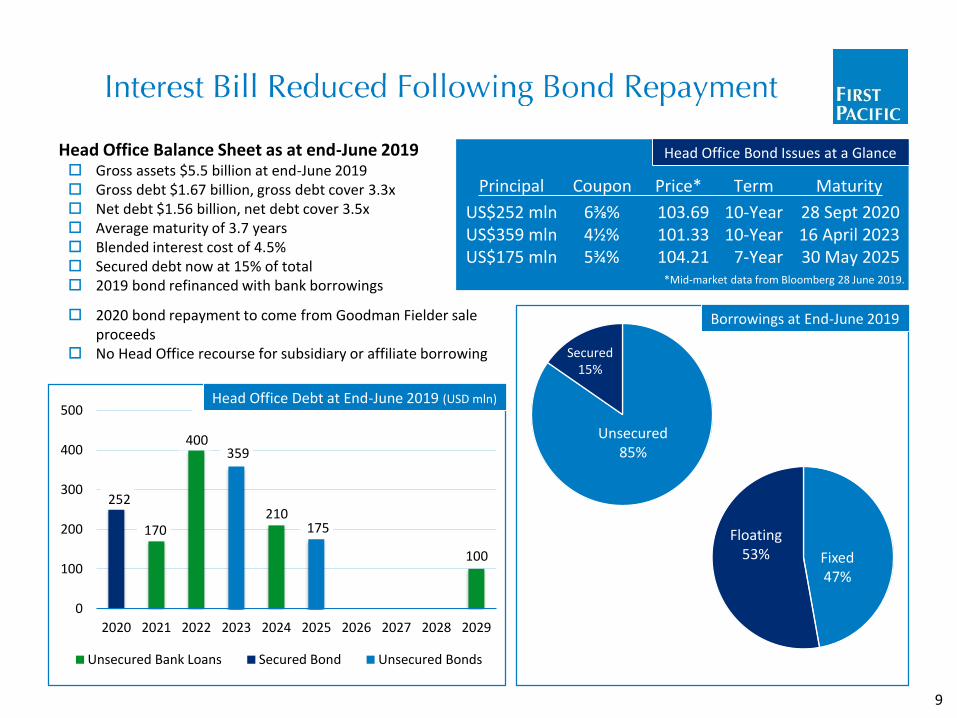
Head Office Balance Sheet as at end-June 2019 Gross assets $5.5 billion at end-June 2019 Gross debt $1.67 billion, gross debt cover 3.3x Net debt $1.56 billion, net debt cover 3.5x Average maturity of 3.7 years Blended interest cost of 4.5% Secured debt now at 15% of total 2019 bond refinanced with bank borrowings
Head Office Bond Issues at a Glance
*Mid-market data from Bloomberg 28 June 2019.
Coupon
6⅜%4½%5¾%
Term
10-Year10-Year
7-Year
Maturity
28 Sept 202016 April 202330 May 2025
Principal
US$252 mlnUS$359 mlnUS$175 mln
Price*
103.69101.33104.21
Borrowings at End-June 2019
Unsecured85%
Secured15%
Fixed47%
Floating53%
Head Office Debt at End-June 2019 (USD mln)
9
2020 bond repayment to come from Goodman Fielder sale proceeds
No Head Office recourse for subsidiary or affiliate borrowing
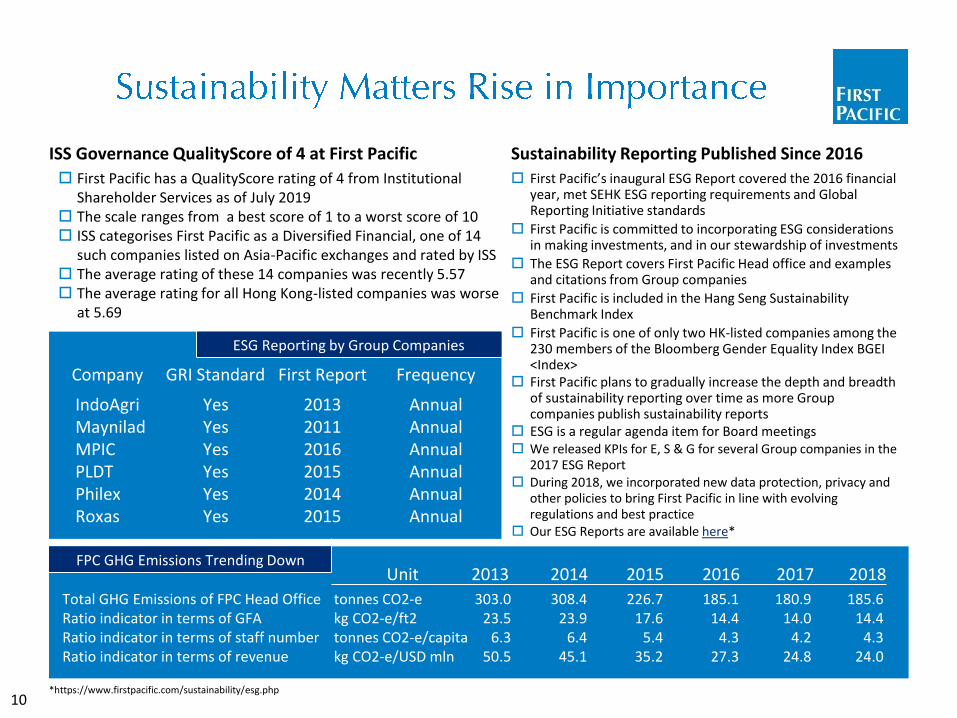
ISS Governance QualityScore of 4 at First Pacific
First Pacific has a QualityScore rating of 4 from Institutional Shareholder Services as of July 2019
The scale ranges from a best score of 1 to a worst score of 10 ISS categorises First Pacific as a Diversified Financial, one of 14
such companies listed on Asia-Pacific exchanges and rated by ISS The average rating of these 14 companies was recently 5.57 The average rating for all Hong Kong-listed companies was worse
at 5.69
ESG Reporting by Group Companies
GRI Standard First Report FrequencyCompany
YesYesYesYesYesYes
201320112016201520142015
AnnualAnnualAnnualAnnualAnnualAnnual
IndoAgriMayniladMPICPLDTPhilexRoxas
FPC GHG Emissions Trending DownUnit
tonnes CO2-ekg CO2-e/ft2tonnes CO2-e/capitakg CO2-e/USD mln
Total GHG Emissions of FPC Head OfficeRatio indicator in terms of GFARatio indicator in terms of staff numberRatio indicator in terms of revenue
2013
303.0 23.5
6.3 50.5
2014
308.4 23.9
6.4 45.1
2015
226.7 17.6
5.4 35.2
2016
185.1 14.4
4.3 27.3
2017
180.9 14.0
4.2 24.8
*https://www.firstpacific.com/sustainability/esg.php
Sustainability Reporting Published Since 2016
First Pacific’s inaugural ESG Report covered the 2016 financial year, met SEHK ESG reporting requirements and Global Reporting Initiative standards
First Pacific is committed to incorporating ESG considerations in making investments, and in our stewardship of investments
The ESG Report covers First Pacific Head office and examples and citations from Group companies
First Pacific is included in the Hang Seng Sustainability Benchmark Index
First Pacific is one of only two HK-listed companies among the 230 members of the Bloomberg Gender Equality Index BGEI <Index>
First Pacific plans to gradually increase the depth and breadth of sustainability reporting over time as more Group companies publish sustainability reports
ESG is a regular agenda item for Board meetings We released KPIs for E, S & G for several Group companies in the
2017 ESG Report During 2018, we incorporated new data protection, privacy and
other policies to bring First Pacific in line with evolving regulations and best practice
Our ESG Reports are available here*
10
2018
185.6 14.4
4.3 24.0
5,350
4,7635,004
5,237 5,136
332 265 299 320 279
0
1,000
2,000
3,000
4,000
5,000
6,000
2014 2015 2016 2017 2018
Revenues Core Income
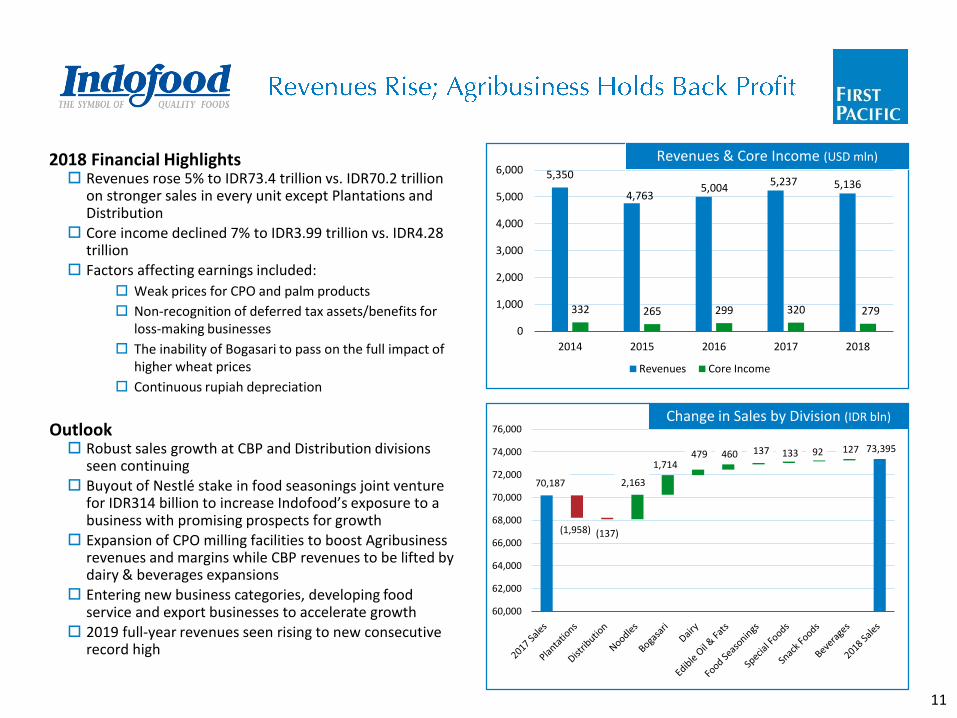
2018 Financial Highlights Revenues rose 5% to IDR73.4 trillion vs. IDR70.2 trillion
on stronger sales in every unit except Plantations and Distribution
Core income declined 7% to IDR3.99 trillion vs. IDR4.28 trillion
Factors affecting earnings included:
Weak prices for CPO and palm products
Non-recognition of deferred tax assets/benefits for loss-making businesses
The inability of Bogasari to pass on the full impact of higher wheat prices
Continuous rupiah depreciation
Outlook Robust sales growth at CBP and Distribution divisions
seen continuing Buyout of Nestlé stake in food seasonings joint venture
for IDR314 billion to increase Indofood’s exposure to a business with promising prospects for growth
Expansion of CPO milling facilities to boost Agribusiness revenues and margins while CBP revenues to be lifted by dairy & beverages expansions
Entering new business categories, developing food service and export businesses to accelerate growth
2019 full-year revenues seen rising to new consecutive record high
Revenues & Core Income (USD mln)
Change in Sales by Division (IDR bln)
70,187
73,395
(1,958) (137)
2,163
1,714 479 460 137 133 92 127
60,000
62,000
64,000
66,000
68,000
70,000
72,000
74,000
76,000
11
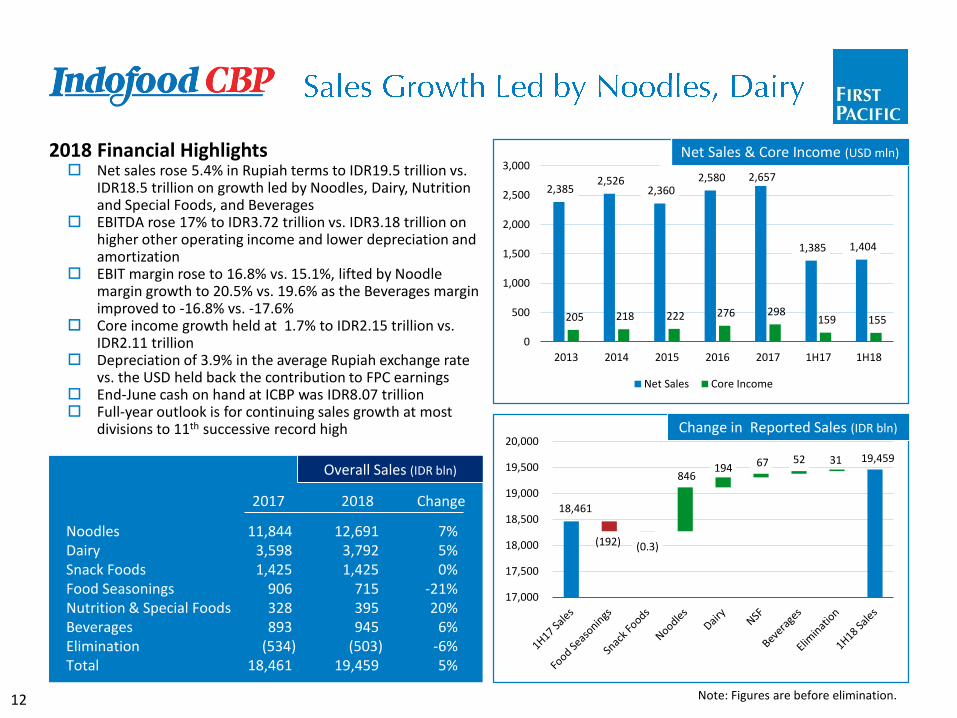
2,385 2,526
2,360 2,580 2,657
1,385 1,404
205 218 222 276 298 159 155
0
500
1,000
1,500
2,000
2,500
3,000
2013 2014 2015 2016 2017 1H17 1H18
Net Sales Core Income
18,461
19,459
(192) (0.3)
846 194 67 52 31
17,000
17,500
18,000
18,500
19,000
19,500
20,000Change in Reported Sales (IDR bln)
2018 Financial Highlights Net sales rose 5.4% in Rupiah terms to IDR19.5 trillion vs.
IDR18.5 trillion on growth led by Noodles, Dairy, Nutrition and Special Foods, and Beverages
EBITDA rose 17% to IDR3.72 trillion vs. IDR3.18 trillion on higher other operating income and lower depreciation and amortization
EBIT margin rose to 16.8% vs. 15.1%, lifted by Noodle margin growth to 20.5% vs. 19.6% as the Beverages margin improved to -16.8% vs. -17.6%
Core income growth held at 1.7% to IDR2.15 trillion vs. IDR2.11 trillion
Depreciation of 3.9% in the average Rupiah exchange rate vs. the USD held back the contribution to FPC earnings
End-June cash on hand at ICBP was IDR8.07 trillion Full-year outlook is for continuing sales growth at most
divisions to 11th successive record high
Net Sales & Core Income (USD mln)
Note: Figures are before elimination.
Overall Sales (IDR bln)
2017
11,844 3,598 1,425
906 328 893
(534)18,461
Change
7%5%0%
-21%20%
6%-6%5%
2018
12,691 3,792 1,425
715 395 945
(503)19,459
NoodlesDairySnack FoodsFood SeasoningsNutrition & Special FoodsBeveragesEliminationTotal
12
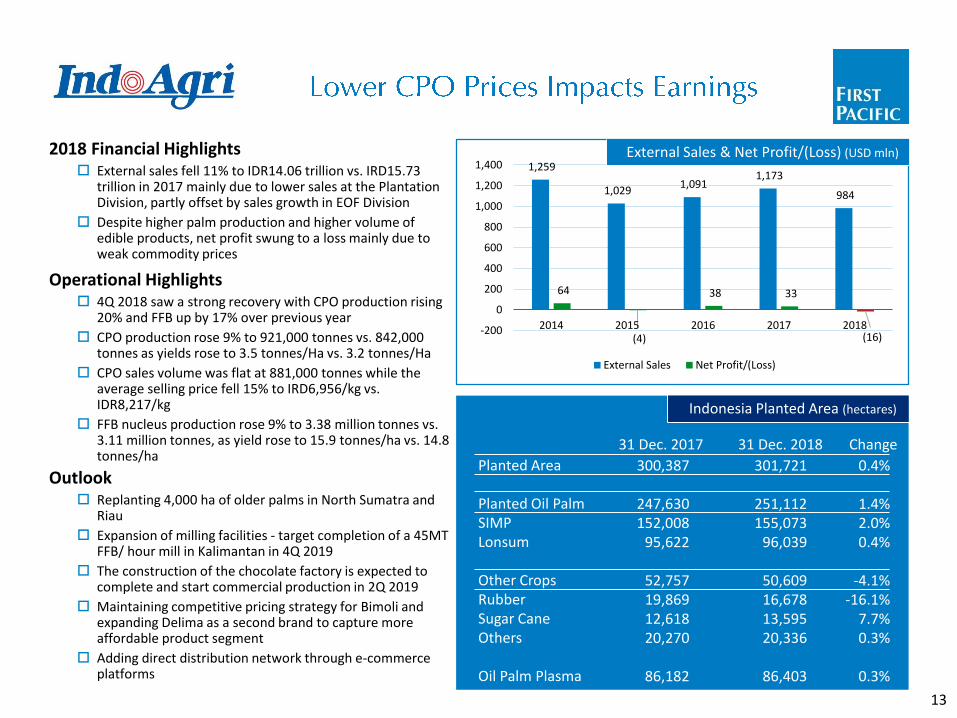
1,259
1,029 1,091
1,173
984
64
(4)
38 33
(16)-200
0
200
400
600
800
1,000
1,200
1,400
2014 2015 2016 2017 2018
External Sales Net Profit/(Loss)
2018 Financial Highlights External sales fell 11% to IDR14.06 trillion vs. IRD15.73
trillion in 2017 mainly due to lower sales at the Plantation Division, partly offset by sales growth in EOF Division
Despite higher palm production and higher volume of edible products, net profit swung to a loss mainly due to weak commodity prices
Operational Highlights 4Q 2018 saw a strong recovery with CPO production rising
20% and FFB up by 17% over previous year
CPO production rose 9% to 921,000 tonnes vs. 842,000 tonnes as yields rose to 3.5 tonnes/Ha vs. 3.2 tonnes/Ha
CPO sales volume was flat at 881,000 tonnes while the average selling price fell 15% to IRD6,956/kg vs. IDR8,217/kg
FFB nucleus production rose 9% to 3.38 million tonnes vs. 3.11 million tonnes, as yield rose to 15.9 tonnes/ha vs. 14.8 tonnes/ha
Outlook Replanting 4,000 ha of older palms in North Sumatra and
Riau
Expansion of milling facilities - target completion of a 45MT FFB/ hour mill in Kalimantan in 4Q 2019
The construction of the chocolate factory is expected to complete and start commercial production in 2Q 2019
Maintaining competitive pricing strategy for Bimoli and expanding Delima as a second brand to capture more affordable product segment
Adding direct distribution network through e-commerce platforms
Indonesia Planted Area (hectares)
Planted Area
Planted Oil PalmSIMPLonsum
Other CropsRubberSugar CaneOthers
Oil Palm Plasma
301,721
251,112 155,073
96,039
50,609 16,678 13,595 20,336
86,403
0.4%
1.4%2.0%0.4%
-4.1%-16.1%
7.7%0.3%
0.3%
300,387
247,630 152,008
95,622
52,757 19,869 12,618 20,270
86,182
31 Dec. 2017 31 Dec. 2018 Change
External Sales & Net Profit/(Loss) (USD mln)
13
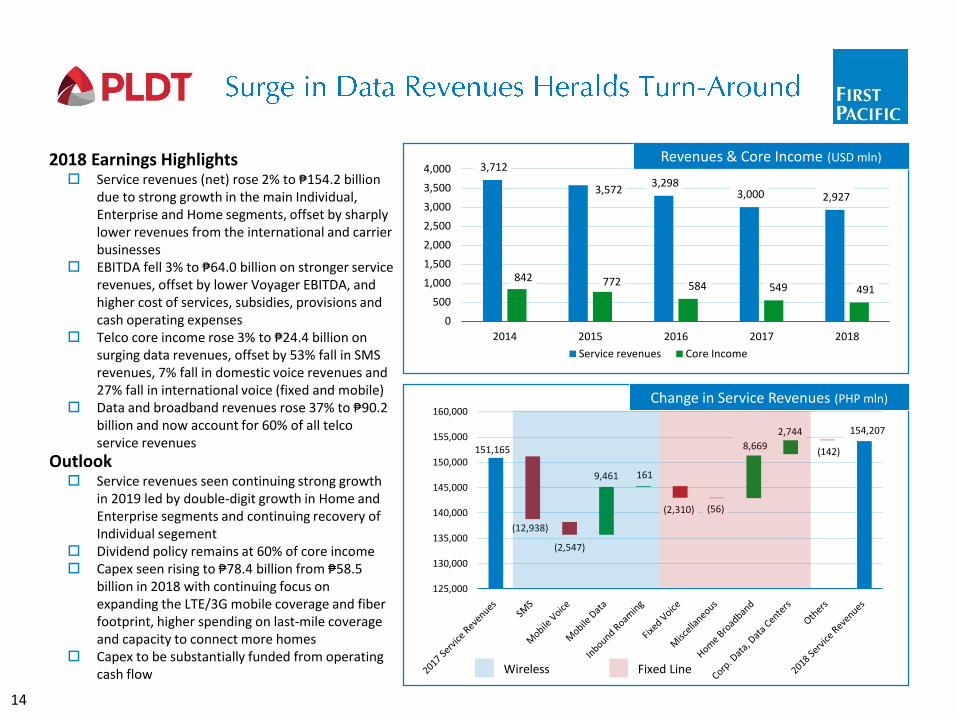
151,165
154,207
(12,938)
(2,547)
9,461 161
(2,310) (56)
8,669
2,744
(142)
125,000
130,000
135,000
140,000
145,000
150,000
155,000
160,000
3,712
3,572 3,298
3,000 2,927
842 772 584 549 491
0
500
1,000
1,500
2,000
2,500
3,000
3,500
4,000
2014 2015 2016 2017 2018
Service revenues Core Income
Outlook Service revenues seen continuing strong growth
in 2019 led by double-digit growth in Home and Enterprise segments and continuing recovery of Individual segement
Dividend policy remains at 60% of core income Capex seen rising to ₱78.4 billion from ₱58.5
billion in 2018 with continuing focus on expanding the LTE/3G mobile coverage and fiber footprint, higher spending on last-mile coverage and capacity to connect more homes
Capex to be substantially funded from operating cash flow
Revenues & Core Income (USD mln)
Wireless Fixed Line
Change in Service Revenues (PHP mln)
2018 Earnings Highlights Service revenues (net) rose 2% to ₱154.2 billion
due to strong growth in the main Individual, Enterprise and Home segments, offset by sharply lower revenues from the international and carrier businesses
EBITDA fell 3% to ₱64.0 billion on stronger service revenues, offset by lower Voyager EBITDA, and higher cost of services, subsidies, provisions and cash operating expenses
Telco core income rose 3% to ₱24.4 billion on surging data revenues, offset by 53% fall in SMS revenues, 7% fall in domestic voice revenues and 27% fall in international voice (fixed and mobile)
Data and broadband revenues rose 37% to ₱90.2 billion and now account for 60% of all telco service revenues
14
7.0
7.5
8.0
8.5
9.0
9.5
1Q17 2Q17 3Q17 4Q17 1Q18 2Q18 3Q18 4Q18
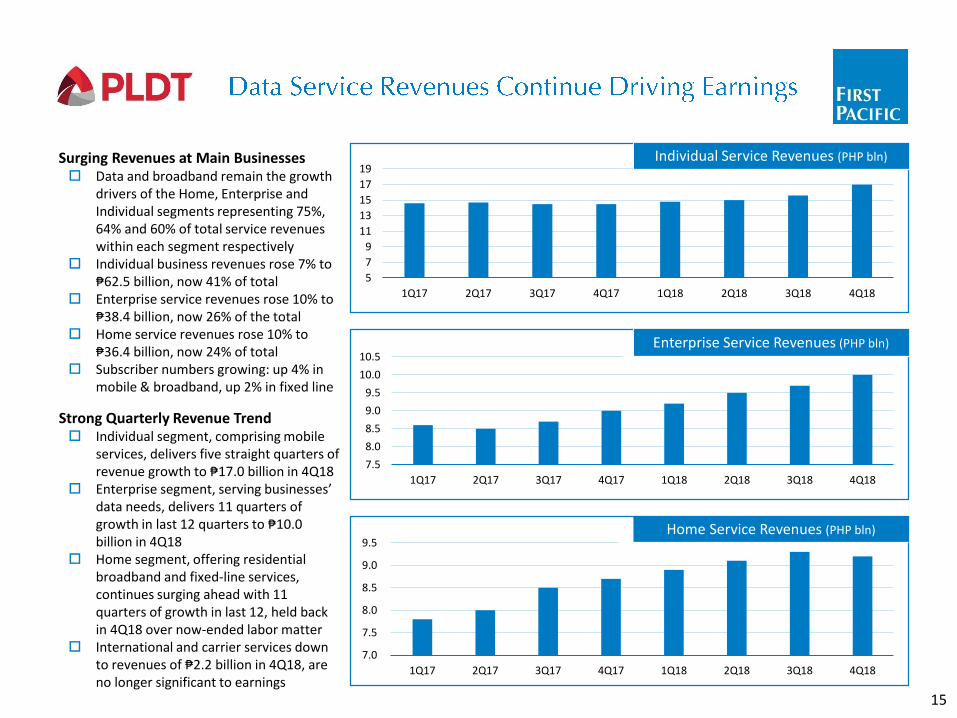
Strong Quarterly Revenue Trend Individual segment, comprising mobile
services, delivers five straight quarters of revenue growth to ₱17.0 billion in 4Q18
Enterprise segment, serving businesses’ data needs, delivers 11 quarters of growth in last 12 quarters to ₱10.0 billion in 4Q18
Home segment, offering residential broadband and fixed-line services, continues surging ahead with 11 quarters of growth in last 12, held back in 4Q18 over now-ended labor matter
International and carrier services down to revenues of ₱2.2 billion in 4Q18, are no longer significant to earnings
Surging Revenues at Main Businesses Data and broadband remain the growth
drivers of the Home, Enterprise and Individual segments representing 75%, 64% and 60% of total service revenues within each segment respectively
Individual business revenues rose 7% to ₱62.5 billion, now 41% of total
Enterprise service revenues rose 10% to ₱38.4 billion, now 26% of the total
Home service revenues rose 10% to ₱36.4 billion, now 24% of total
Subscriber numbers growing: up 4% in mobile & broadband, up 2% in fixed line
5
7
9
11
13
15
17
19
1Q17 2Q17 3Q17 4Q17 1Q18 2Q18 3Q18 4Q18
Individual Service Revenues (PHP bln)
7.5
8.0
8.5
9.0
9.5
10.0
10.5
1Q17 2Q17 3Q17 4Q17 1Q18 2Q18 3Q18 4Q18
Enterprise Service Revenues (PHP bln)
Home Service Revenues (PHP bln)
15
0 2 4 6 8 10
Globe
Smart
Download Speed Experience (Mbps)
0 1 1 2 2 3 3 4
Globe
Smart
Upload Speed Experience (Mbps)
0 10 20 30 40 50
Globe
Smart
Video Experience (points)
0 10 20 30 40 50 60 70 80
Globe
Smart
Latency Experience (milliseconds)
0 10 20 30 40 50 60 70 80
Globe
Smart
4G Availability (percent)
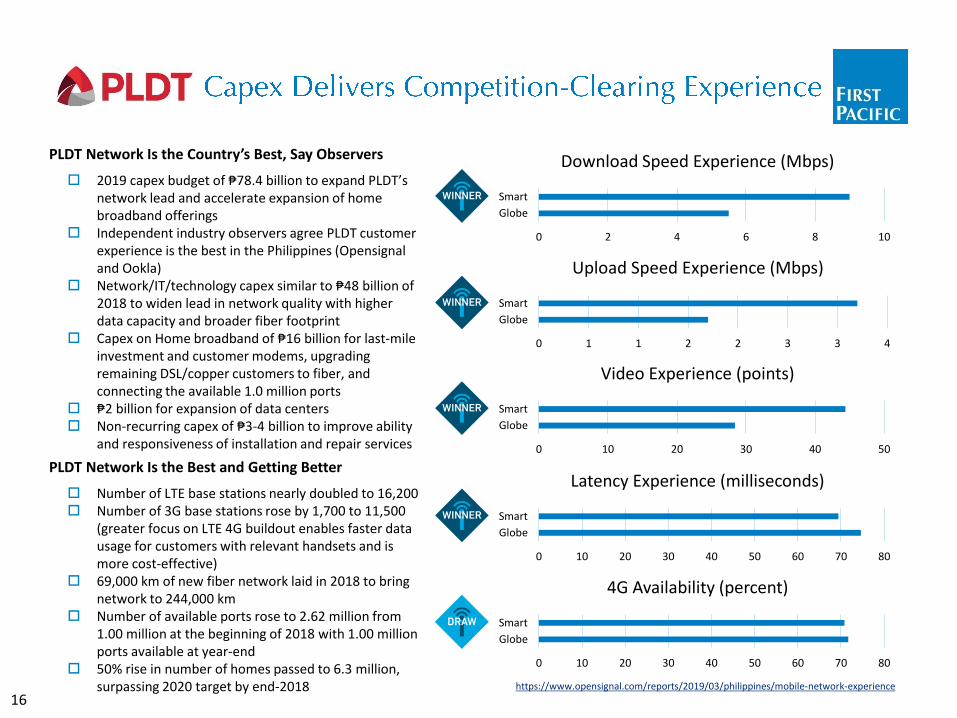
PLDT Network Is the Country’s Best, Say Observers
2019 capex budget of ₱78.4 billion to expand PLDT’s network lead and accelerate expansion of home broadband offerings
Independent industry observers agree PLDT customer experience is the best in the Philippines (Opensignaland Ookla)
Network/IT/technology capex similar to ₱48 billion of 2018 to widen lead in network quality with higher data capacity and broader fiber footprint
Capex on Home broadband of ₱16 billion for last-mile investment and customer modems, upgrading remaining DSL/copper customers to fiber, and connecting the available 1.0 million ports
₱2 billion for expansion of data centers Non-recurring capex of ₱3-4 billion to improve ability
and responsiveness of installation and repair services
https://www.opensignal.com/reports/2019/03/philippines/mobile-network-experience
PLDT Network Is the Best and Getting Better
Number of LTE base stations nearly doubled to 16,200 Number of 3G base stations rose by 1,700 to 11,500
(greater focus on LTE 4G buildout enables faster data usage for customers with relevant handsets and is more cost-effective)
69,000 km of new fiber network laid in 2018 to bring network to 244,000 km
Number of available ports rose to 2.62 million from 1.00 million at the beginning of 2018 with 1.00 million ports available at year-end
50% rise in number of homes passed to 6.3 million, surpassing 2020 target by end-2018
16
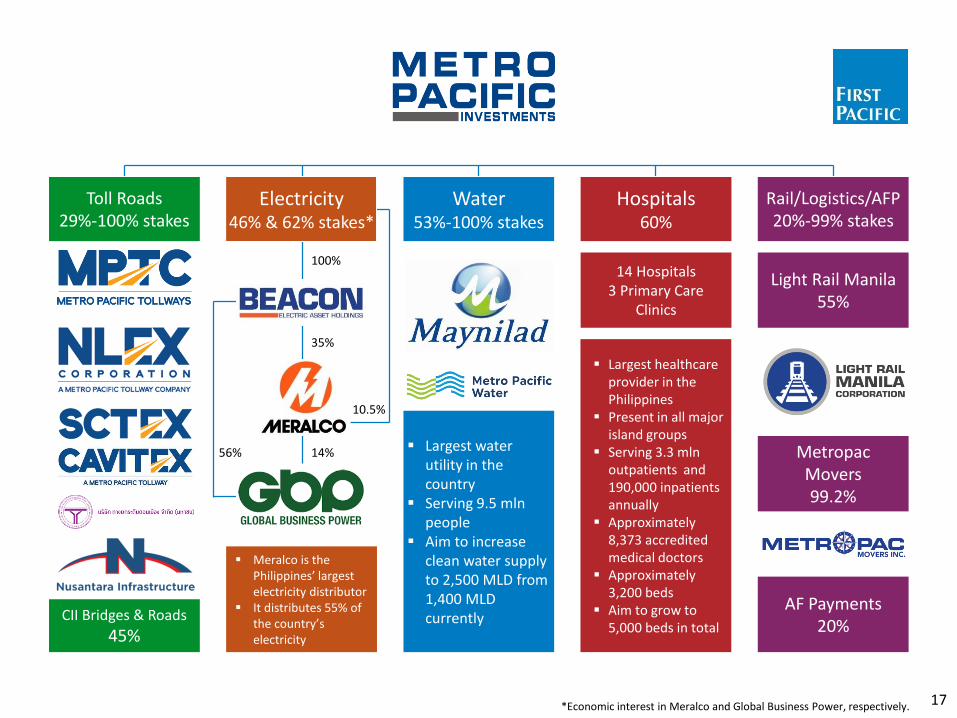
*Economic interest in Meralco and Global Business Power, respectively.
Toll Roads29%-100% stakes
Electricity46% & 62% stakes*
Water53%-100% stakes
Hospitals60%
14 Hospitals3 Primary Care
Clinics
Rail/Logistics/AFP20%-99% stakes
Light Rail Manila55%
MetropacMovers99.2%
CII Bridges & Roads
45%
100%
35%
▪ Largest healthcare provider in the Philippines
▪ Present in all major island groups
▪ Serving 3.3 mlnoutpatients and 190,000 inpatients annually
▪ Approximately 8,373 accredited medical doctors
▪ Approximately 3,200 beds
▪ Aim to grow to 5,000 beds in total
10.5%
56% 14% ▪ Largest water utility in the country
▪ Serving 9.5 mlnpeople
▪ Aim to increase clean water supply to 2,500 MLD from 1,400 MLD currently
AF Payments20%
▪ Meralco is the Philippines’ largest electricity distributor
▪ It distributes 55% of the country’s electricity
17
17,797
19,563
(527)
1,445
522 161 86 61 18
16,000
16,500
17,000
17,500
18,000
18,500
19,000
19,500
20,000
761 816901
1,241
1,576
191 227 243 280 286
0
200
400
600
800
1,000
1,200
1,400
1,600
1,800
2014 2015 2016 2017 2018
Revenues Core Income
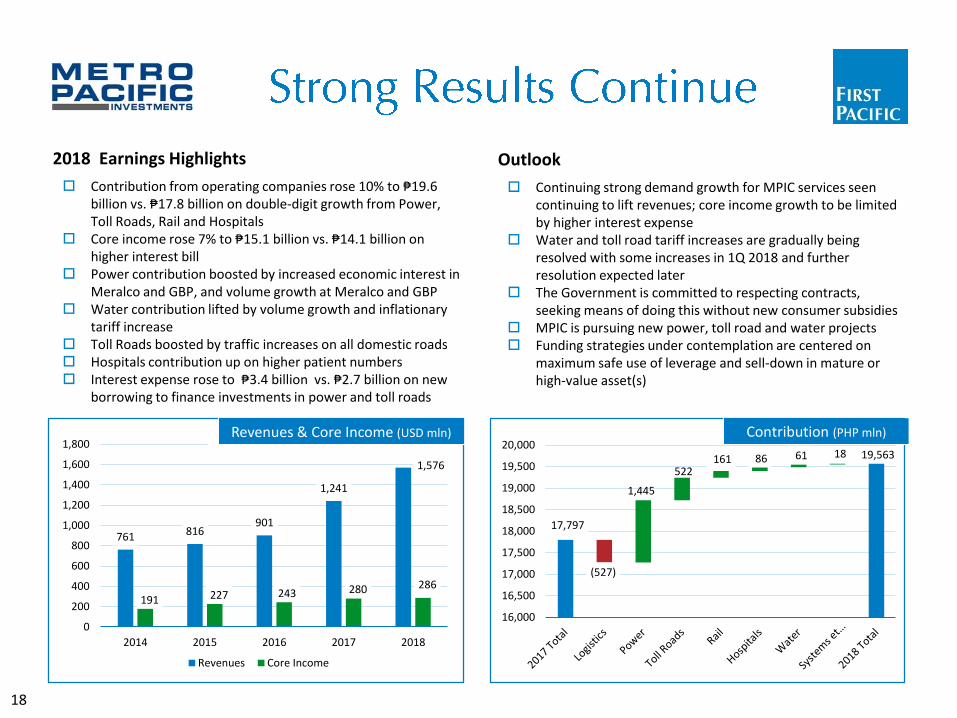
Outlook
Continuing strong demand growth for MPIC services seen continuing to lift revenues; core income growth to be limited by higher interest expense
Water and toll road tariff increases are gradually being resolved with some increases in 1Q 2018 and further resolution expected later
The Government is committed to respecting contracts, seeking means of doing this without new consumer subsidies
MPIC is pursuing new power, toll road and water projects Funding strategies under contemplation are centered on
maximum safe use of leverage and sell-down in mature or high-value asset(s)
Contribution (PHP mln)Revenues & Core Income (USD mln)
2018 Earnings Highlights
Contribution from operating companies rose 10% to ₱19.6 billion vs. ₱17.8 billion on double-digit growth from Power, Toll Roads, Rail and Hospitals
Core income rose 7% to ₱15.1 billion vs. ₱14.1 billion on higher interest bill
Power contribution boosted by increased economic interest in Meralco and GBP, and volume growth at Meralco and GBP
Water contribution lifted by volume growth and inflationary tariff increase
Toll Roads boosted by traffic increases on all domestic roads Hospitals contribution up on higher patient numbers Interest expense rose to ₱3.4 billion vs. ₱2.7 billion on new
borrowing to finance investments in power and toll roads
18
405370
472509
64 60 57 47
0
100
200
300
400
500
600
2015 2016 2017 2018
Revenues Core Income
1,269 1,2071,144
1,183 1,177
408 414 394 401 425
0
200
400
600
800
1,000
1,200
1,400
2014 2015 2016 2017 2018
Distribution Revenues Core Income
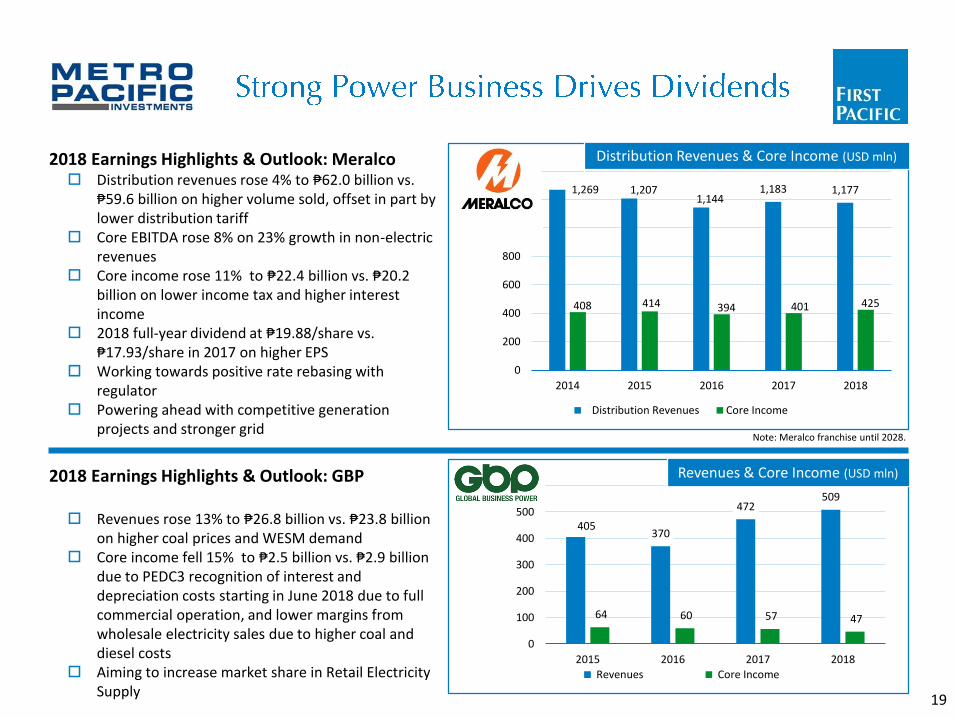
2018 Earnings Highlights & Outlook: Meralco Distribution revenues rose 4% to ₱62.0 billion vs.
₱59.6 billion on higher volume sold, offset in part by lower distribution tariff
Core EBITDA rose 8% on 23% growth in non-electric revenues
Core income rose 11% to ₱22.4 billion vs. ₱20.2 billion on lower income tax and higher interest income
2018 full-year dividend at ₱19.88/share vs. ₱17.93/share in 2017 on higher EPS
Working towards positive rate rebasing with regulator
Powering ahead with competitive generation projects and stronger grid
2018 Earnings Highlights & Outlook: GBP
Revenues rose 13% to ₱26.8 billion vs. ₱23.8 billion on higher coal prices and WESM demand
Core income fell 15% to ₱2.5 billion vs. ₱2.9 billion due to PEDC3 recognition of interest and depreciation costs starting in June 2018 due to full commercial operation, and lower margins from wholesale electricity sales due to higher coal and diesel costs
Aiming to increase market share in Retail Electricity Supply
Distribution Revenues & Core Income (USD mln)
Revenues & Core Income (USD mln)
Note: Meralco franchise until 2028.
19
413 419 407 412 418
198 212
144 146 147
0
50
100
150
200
250
300
350
400
450
500
2014 2015 2016 2017 2018
Revenues Core Income
194212
239260
294
48 56 66 78 84
0
50
100
150
200
250
300
350
2014 2015 2016 2017 2018 Revenues Core Income
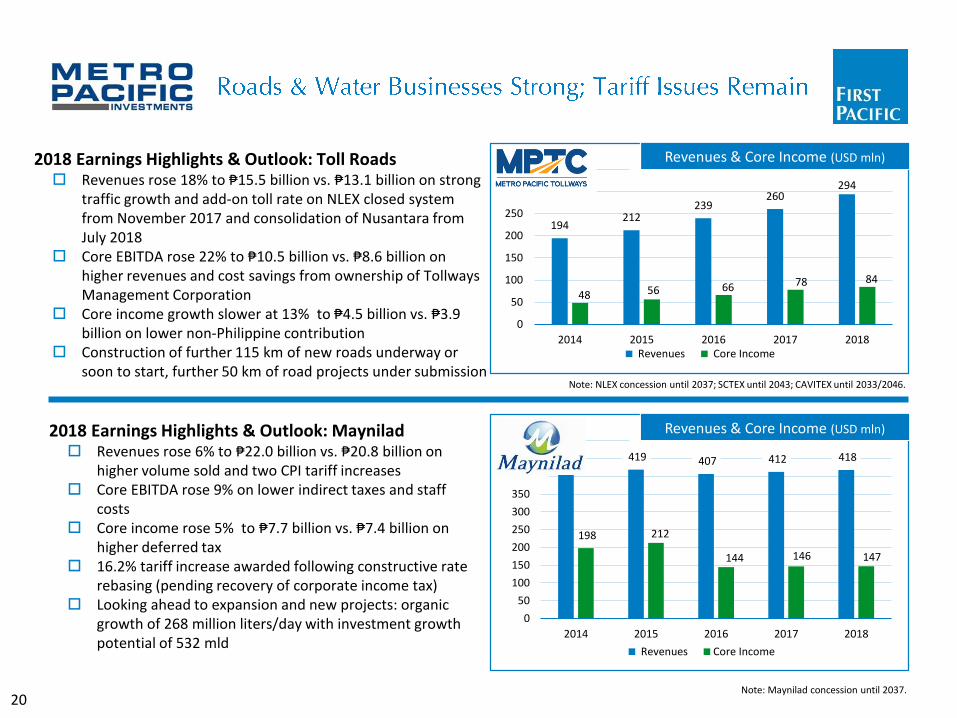
2018 Earnings Highlights & Outlook: Maynilad Revenues rose 6% to ₱22.0 billion vs. ₱20.8 billion on
higher volume sold and two CPI tariff increases Core EBITDA rose 9% on lower indirect taxes and staff
costs Core income rose 5% to ₱7.7 billion vs. ₱7.4 billion on
higher deferred tax 16.2% tariff increase awarded following constructive rate
rebasing (pending recovery of corporate income tax) Looking ahead to expansion and new projects: organic
growth of 268 million liters/day with investment growth potential of 532 mld
2018 Earnings Highlights & Outlook: Toll Roads Revenues rose 18% to ₱15.5 billion vs. ₱13.1 billion on strong
traffic growth and add-on toll rate on NLEX closed system from November 2017 and consolidation of Nusantara from July 2018
Core EBITDA rose 22% to ₱10.5 billion vs. ₱8.6 billion on higher revenues and cost savings from ownership of Tollways Management Corporation
Core income growth slower at 13% to ₱4.5 billion vs. ₱3.9 billion on lower non-Philippine contribution
Construction of further 115 km of new roads underway or soon to start, further 50 km of road projects under submission
Revenues & Core Income (USD mln)
Note: NLEX concession until 2037; SCTEX until 2043; CAVITEX until 2033/2046.
Revenues & Core Income (USD mln)
Note: Maynilad concession until 2037.20
10.67
10.27 (0.23)(0.11)
0.05 0.02 0.004
10.00 10.10 10.20 10.30 10.40 10.50 10.60 10.70 10.80
2017 CashCost perTonne
Power PurchaseContracts
Labor Materials& Supplies
Otherexpenses
2018 CashCost perTonne
245
201 215198
158
25 20 35 3311
0
50
100
150
200
250
300
2014 2015 2016 2017 2018Revenues Core Income
Revenues & Core Income (USD mln)
Bumolo is in the region of Padcal. Boyongan and Bayugo are Silangan ore bodies.
Total of Mineral Resources
PadcalBumoloBoyonganBayugo
Total
52 22
273 125
472
Metrictonnes(mln)
184 96
3,120 1,820
5,220
Cu(mln lb.)
0.20 0.20 0.52 0.66
Cu(percent)
Au(g/t)
0.39 0.30 0.72 0.66
Au(‘000 oz.)
520 210
6,300 2,700
9,730
Cash Production Cost (USD/metric tonne)
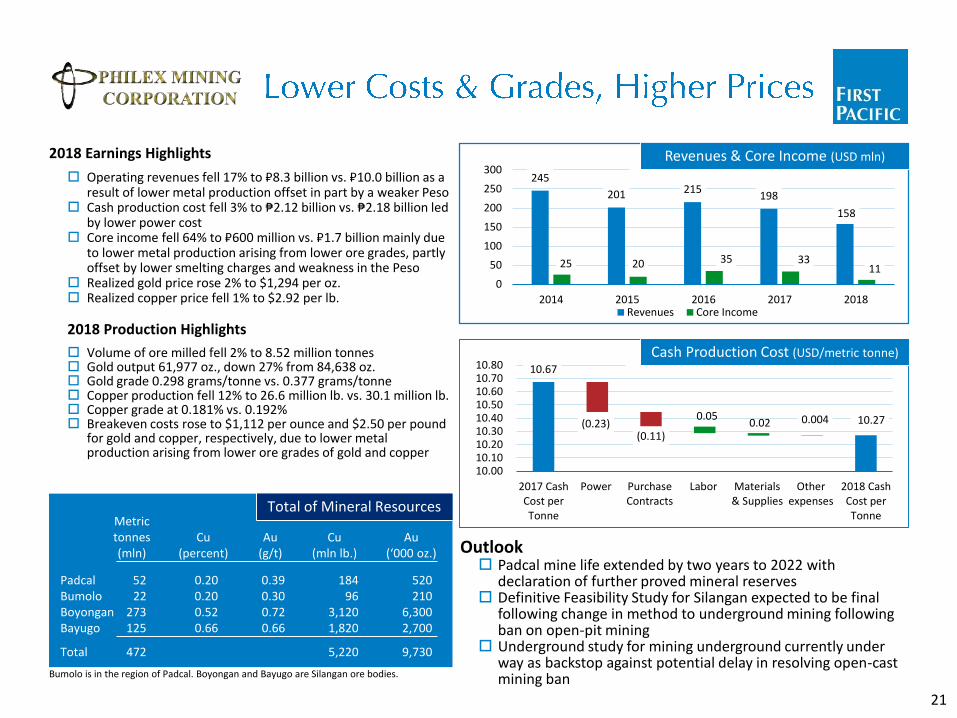
Outlook Padcal mine life extended by two years to 2022 with
declaration of further proved mineral reserves Definitive Feasibility Study for Silangan expected to be final
following change in method to underground mining following ban on open-pit mining
Underground study for mining underground currently under way as backstop against potential delay in resolving open-cast mining ban
2018 Earnings Highlights
Operating revenues fell 17% to ₽8.3 billion vs. ₽10.0 billion as a result of lower metal production offset in part by a weaker Peso
Cash production cost fell 3% to ₱2.12 billion vs. ₱2.18 billion led by lower power cost
Core income fell 64% to ₽600 million vs. ₽1.7 billion mainly due to lower metal production arising from lower ore grades, partly offset by lower smelting charges and weakness in the Peso
Realized gold price rose 2% to $1,294 per oz. Realized copper price fell 1% to $2.92 per lb.
2018 Production Highlights
Volume of ore milled fell 2% to 8.52 million tonnes Gold output 61,977 oz., down 27% from 84,638 oz. Gold grade 0.298 grams/tonne vs. 0.377 grams/tonne Copper production fell 12% to 26.6 million lb. vs. 30.1 million lb. Copper grade at 0.181% vs. 0.192% Breakeven costs rose to $1,112 per ounce and $2.50 per pound
for gold and copper, respectively, due to lower metal production arising from lower ore grades of gold and copper
21

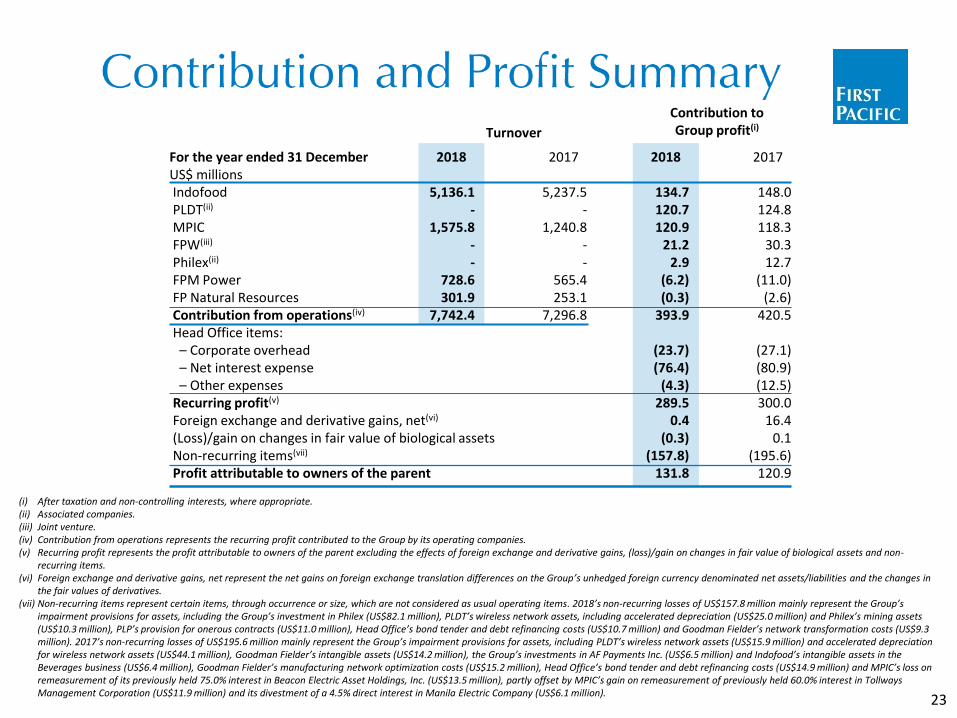
For the year ended 31 DecemberUS$ millionsIndofood PLDT(ii)
MPIC FPW(iii)
Philex(ii)
FPM Power FP Natural Resources Contribution from operations(iv)
Head Office items: – Corporate overhead – Net interest expense – Other expenses
Recurring profit(v)
Foreign exchange and derivative gains, net(vi)
(Loss)/gain on changes in fair value of biological assets Non-recurring items(vii)
Profit attributable to owners of the parent
(i) After taxation and non-controlling interests, where appropriate.(ii) Associated companies.(iii) Joint venture.(iv) Contribution from operations represents the recurring profit contributed to the Group by its operating companies.(v) Recurring profit represents the profit attributable to owners of the parent excluding the effects of foreign exchange and derivative gains, (loss)/gain on changes in fair value of biological assets and non-
recurring items.(vi) Foreign exchange and derivative gains, net represent the net gains on foreign exchange translation differences on the Group’s unhedged foreign currency denominated net assets/liabilities and the changes in
the fair values of derivatives.(vii) Non-recurring items represent certain items, through occurrence or size, which are not considered as usual operating items. 2018’s non-recurring losses of US$157.8 million mainly represent the Group’s
impairment provisions for assets, including the Group’s investment in Philex (US$82.1 million), PLDT’s wireless network assets, including accelerated depreciation (US$25.0 million) and Philex’s mining assets (US$10.3 million), PLP’s provision for onerous contracts (US$11.0 million), Head Office’s bond tender and debt refinancing costs (US$10.7 million) and Goodman Fielder’s network transformation costs (US$9.3 million). 2017’s non-recurring losses of US$195.6 million mainly represent the Group’s impairment provisions for assets, including PLDT’s wireless network assets (US$15.9 million) and accelerated depreciation for wireless network assets (US$44.1 million), Goodman Fielder’s intangible assets (US$14.2 million), the Group’s investments in AF Payments Inc. (US$6.5 million) and Indofood’s intangible assets in the Beverages business (US$6.4 million), Goodman Fielder’s manufacturing network optimization costs (US$15.2 million), Head Office’s bond tender and debt refinancing costs (US$14.9 million) and MPIC’s loss on remeasurement of its previously held 75.0% interest in Beacon Electric Asset Holdings, Inc. (US$13.5 million), partly offset by MPIC’s gain on remeasurement of previously held 60.0% interest in TollwaysManagement Corporation (US$11.9 million) and its divestment of a 4.5% direct interest in Manila Electric Company (US$6.1 million).
2018
5,136.1-
1,575.8--
728.6301.9
7,742.4
2018
134.7120.7120.9
21.22.9
(6.2)(0.3)
393.9
(23.7)(76.4)
(4.3)289.5
0.4(0.3)
(157.8)131.8
Contribution toGroup profit(i)Turnover
2017
5,237.5-
1,240.8--
565.4253.1
7,296.8
2017
148.0124.8118.3
30.312.7
(11.0)(2.6)
420.5
(27.1)(80.9)(12.5)300.0
16.40.1
(195.6)120.9
23
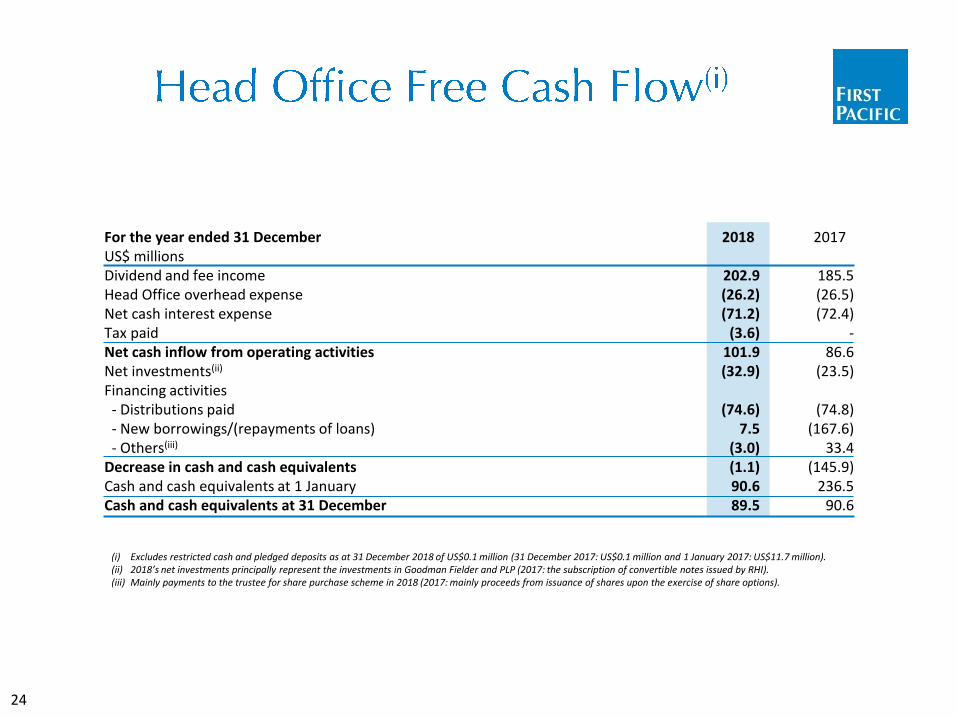
(i) Excludes restricted cash and pledged deposits as at 31 December 2018 of US$0.1 million (31 December 2017: US$0.1 million and 1 January 2017: US$11.7 million).(ii) 2018’s net investments principally represent the investments in Goodman Fielder and PLP (2017: the subscription of convertible notes issued by RHI).(iii) Mainly payments to the trustee for share purchase scheme in 2018 (2017: mainly proceeds from issuance of shares upon the exercise of share options).
For the year ended 31 DecemberUS$ millionsDividend and fee incomeHead Office overhead expenseNet cash interest expenseTax paidNet cash inflow from operating activitiesNet investments(ii)
Financing activities- Distributions paid- New borrowings/(repayments of loans)- Others(iii)
Decrease in cash and cash equivalentsCash and cash equivalents at 1 JanuaryCash and cash equivalents at 31 December
2018
202.9 (26.2)(71.2)
(3.6)101.9 (32.9)
(74.6)7.5
(3.0)(1.1)90.6 89.5
2017
185.5 (26.5)(72.4)
-86.6
(23.5)
(74.8) (167.6)
33.4 (145.9)
236.5 90.6
24
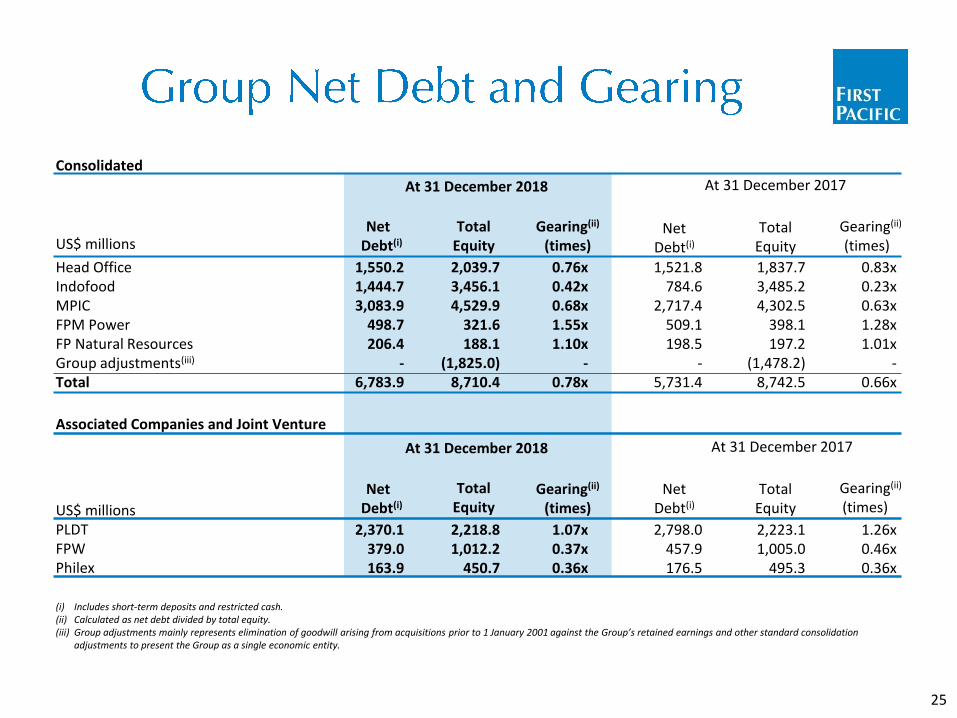
Consolidated
(i) Includes short-term deposits and restricted cash.(ii) Calculated as net debt divided by total equity.(iii) Group adjustments mainly represents elimination of goodwill arising from acquisitions prior to 1 January 2001 against the Group’s retained earnings and other standard consolidation
adjustments to present the Group as a single economic entity.
At 31 December 2018 At 31 December 2017
Head OfficeIndofoodMPICFPM PowerFP Natural ResourcesGroup adjustments(iii)
Total
US$ millions
Associated Companies and Joint Venture
At 31 December 2018 At 31 December 2017
US$ millionsPLDTFPWPhilex
Net Debt(i)
Net Debt(i)
1,550.2 1,444.7 3,083.9
498.7 206.4
-6,783.9
2,370.1 379.0 163.9
TotalEquity
TotalEquity
2,039.7 3,456.1 4,529.9
321.6 188.1
(1,825.0)8,710.4
2,218.8 1,012.2
450.7
Gearing(ii)
(times)
Gearing(ii)
(times)
0.76x0.42x0.68x1.55x1.10x
-0.78x
1.07x0.37x0.36x
NetDebt(i)
NetDebt(i)
1,521.8 784.6
2,717.4 509.1 198.5
-5,731.4
2,798.0 457.9 176.5
TotalEquity
TotalEquity
1,837.7 3,485.2 4,302.5
398.1 197.2
(1,478.2)8,742.5
2,223.1 1,005.0
495.3
Gearing(ii)
(times)
Gearing(ii)
(times)
0.83x0.23x0.63x1.28x1.01x
-0.66x
1.26x0.46x0.36x
25
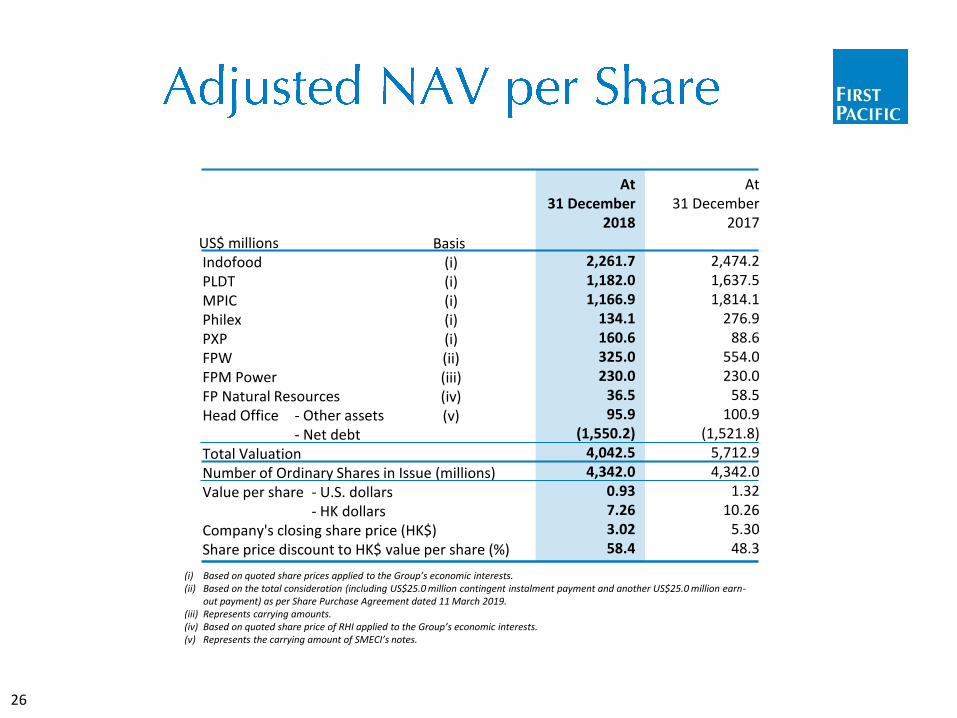
(i) Based on quoted share prices applied to the Group’s economic interests.(ii) Based on the total consideration (including US$25.0 million contingent instalment payment and another US$25.0 million earn-
out payment) as per Share Purchase Agreement dated 11 March 2019.(iii) Represents carrying amounts.(iv) Based on quoted share price of RHI applied to the Group’s economic interests.(v) Represents the carrying amount of SMECI’s notes.
US$ millionsIndofood PLDT MPIC Philex PXP FPW FPM Power FP Natural Resources Head Office - Other assets
- Net debt Total Valuation Number of Ordinary Shares in Issue (millions) Value per share - U.S. dollars
- HK dollars Company's closing share price (HK$) Share price discount to HK$ value per share (%)
At31 December
2017
2,474.2 1,637.5 1,814.1
276.9 88.6
554.0 230.0
58.5 100.9
(1,521.8)5,712.9 4,342.0
1.32 10.26
5.30 48.3
Basis(i) (i) (i) (i) (i) (ii) (iii) (iv) (v)
At31 December
2018
2,261.7 1,182.0 1,166.9
134.1 160.6 325.0 230.0
36.5 95.9
(1,550.2)4,042.5 4,342.0
0.93 7.26 3.02 58.4
26
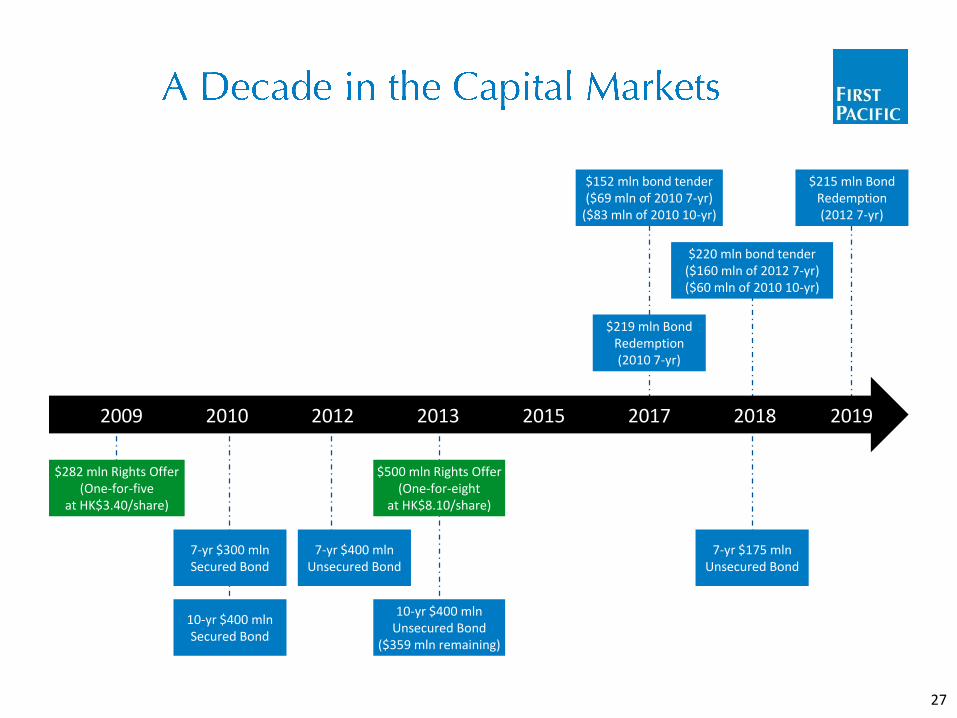
$215 mln Bond Redemption(2012 7-yr)
27
$282 mln Rights Offer(One-for-five
at HK$3.40/share)
10-yr $400 mlnSecured Bond
7-yr $400 mlnUnsecured Bond
7-yr $300 mlnSecured Bond
10-yr $400 mlnUnsecured Bond
($359 mln remaining)
7-yr $175 mlnUnsecured Bond
$500 mln Rights Offer(One-for-eight
at HK$8.10/share)
$219 mln Bond Redemption(2010 7-yr)
$152 mln bond tender($69 mln of 2010 7-yr)
($83 mln of 2010 10-yr)
$220 mln bond tender($160 mln of 2012 7-yr)($60 mln of 2010 10-yr)
2009 20122010 2013 20182015 20192017
1.3X
4.513.4 x 13.4
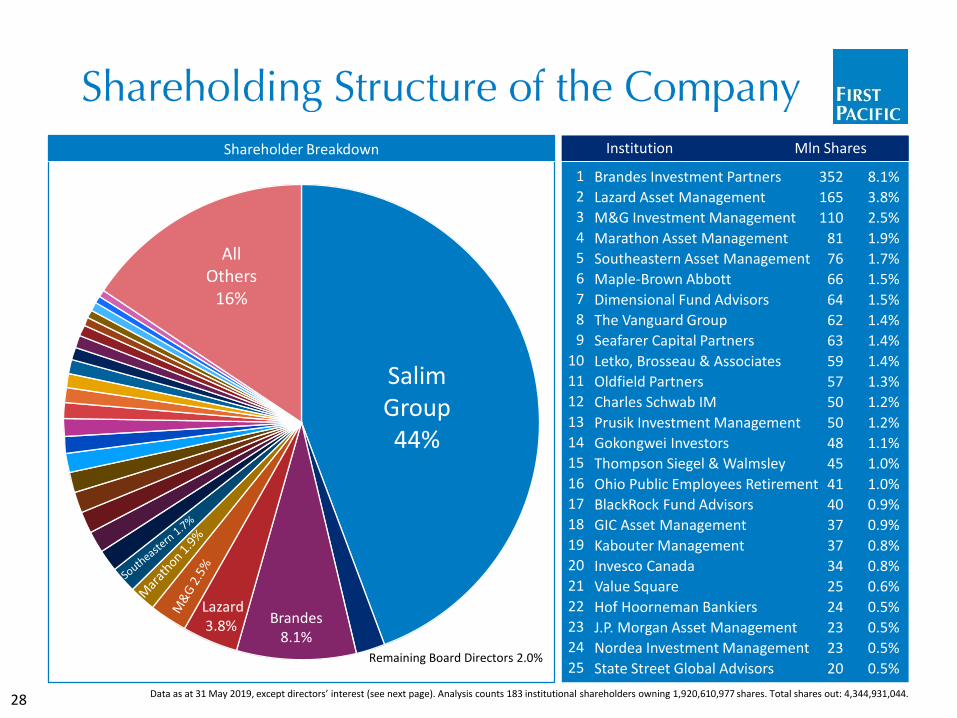
SalimGroup44%
Brandes8.1%
Remaining Board Directors 2.0%
AllOthers
16%
Shareholder Breakdown
Lazard3.8%
Institution
Brandes Investment Partners
Lazard Asset Management
M&G Investment Management
Marathon Asset Management
Southeastern Asset Management
Maple-Brown Abbott
Dimensional Fund Advisors
The Vanguard Group
Seafarer Capital Partners
Letko, Brosseau & Associates
Oldfield Partners
Charles Schwab IM
Prusik Investment Management
Gokongwei Investors
Thompson Siegel & Walmsley
Ohio Public Employees Retirement
BlackRock Fund Advisors
GIC Asset Management
Kabouter Management
Invesco Canada
Value Square
Hof Hoorneman Bankiers
J.P. Morgan Asset Management
Nordea Investment Management
State Street Global Advisors
Mln Shares
8.1%
3.8%
2.5%
1.9%
1.7%
1.5%
1.5%
1.4%
1.4%
1.4%
1.3%
1.2%
1.2%
1.1%
1.0%
1.0%
0.9%
0.9%
0.8%
0.8%
0.6%
0.5%
0.5%
0.5%
0.5%
1
2
3
4
5
6
7
8
9
10
11
12
13
14
15
16
17
18
19
20
21
22
23
24
25
352
165
110
81
76
66
64
62
63
59
57
50
50
48
45
41
40
37
37
34
25
24
23
23
20
28 Data as at 31 May 2019, except directors’ interest (see next page). Analysis counts 183 institutional shareholders owning 1,920,610,977 shares. Total shares out: 4,344,931,044.
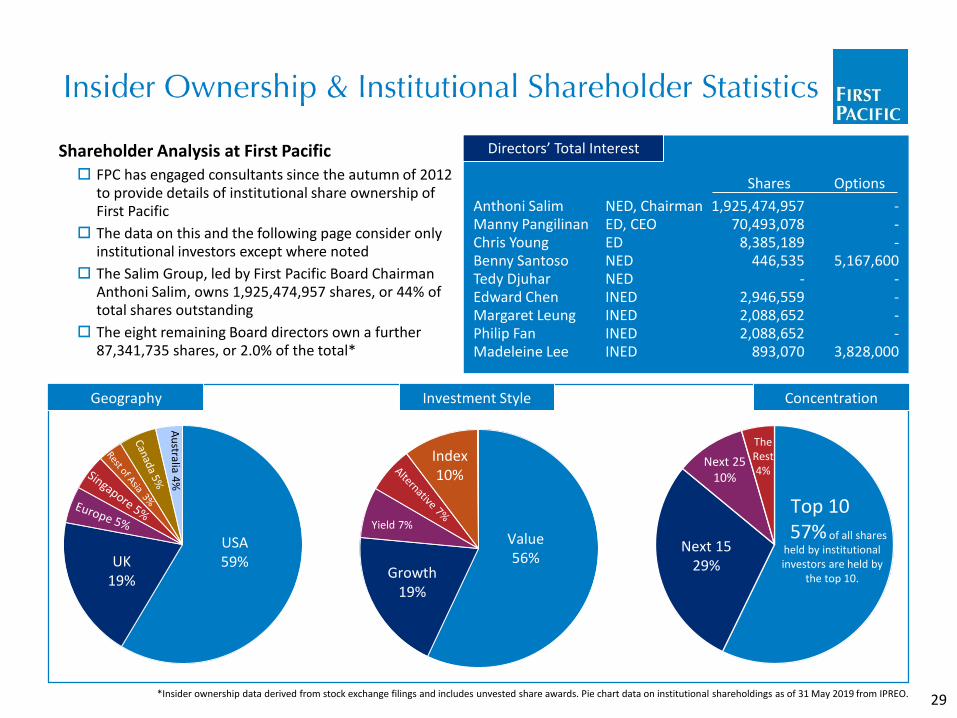
Geography Investment Style Concentration
UK19%
USA59%
Value56%
Growth19%
Index10%
Yield 7%
TheRest4%
Next 1529%
Next 2510%
of all shares held by institutionalinvestors are held by
the top 10.
Top 1057%
*Insider ownership data derived from stock exchange filings and includes unvested share awards. Pie chart data on institutional shareholdings as of 31 May 2019 from IPREO.
Shareholder Analysis at First Pacific FPC has engaged consultants since the autumn of 2012
to provide details of institutional share ownership of First Pacific
The data on this and the following page consider only institutional investors except where noted
The Salim Group, led by First Pacific Board Chairman Anthoni Salim, owns 1,925,474,957 shares, or 44% of total shares outstanding
The eight remaining Board directors own a further 87,341,735 shares, or 2.0% of the total*
Anthoni SalimManny PangilinanChris YoungBenny SantosoTedy DjuharEdward ChenMargaret LeungPhilip FanMadeleine Lee
1,925,474,95770,493,078
8,385,189 446,535
-2,946,559 2,088,652 2,088,652
893,070
---
5,167,600 ----
3,828,000
NED, ChairmanED, CEOEDNEDNEDINEDINEDINEDINED
Shares Options
Directors’ Total Interest
29
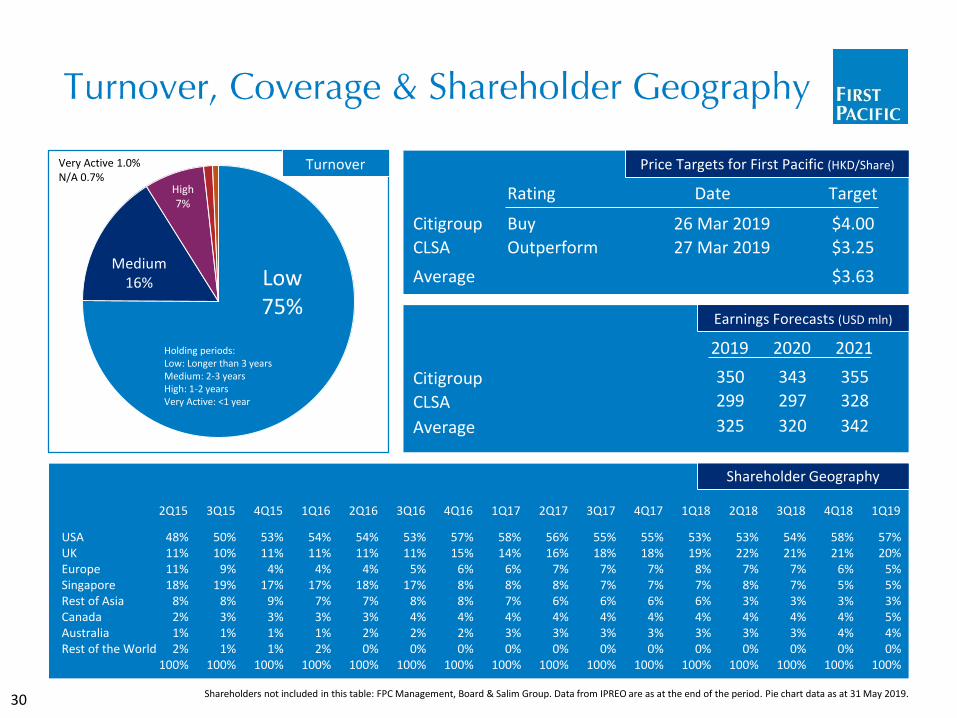
Citigroup
CLSA
Price Targets for First Pacific (HKD/Share)
Buy
Outperform
Rating
26 Mar 2019
27 Mar 2019
Date
Average
$4.00
$3.25
Target
$3.63
Earnings Forecasts (USD mln)
2020
343
297
320
2019
350
299
325
Citigroup
CLSA
Average
USA UK Europe Singapore Rest of Asia Canada Australia Rest of the World
3Q181Q174Q16 3Q172Q17 4Q17 1Q18 2Q183Q16 4Q183Q152Q15 4Q15 1Q16 2Q16
56%16%
7%8%6%4%3%0%
100%
58%14%
6%8%7%4%3%0%
100%
55%18%
7%7%6%4%3%0%
100%
57%15%
6%8%8%4%2%0%
100%
55%18%
7%7%6%4%3%0%
100%
53%19%
8%7%6%4%3%0%
100%
53%22%
7%8%3%4%3%0%
100%
54%21%
7%7%3%4%3%0%
100%
48%11%11%18%
8%2%1%2%
100%
53%11%
4%17%
9%3%1%1%
100%
58%21%
6%5%3%4%4%0%
100%
50%10%
9%19%
8%3%1%1%
100%
54%11%
4%17%
7%3%1%2%
100%
54%11%
4%18%
7%3%2%0%
100%
53%11%
5%17%
8%4%2%0%
100%
Shareholders not included in this table: FPC Management, Board & Salim Group. Data from IPREO are as at the end of the period. Pie chart data as at 31 May 2019.
Turnover
Low75%
Medium16%
Very Active 1.0%N/A 0.7%
Holding periods:Low: Longer than 3 yearsMedium: 2-3 yearsHigh: 1-2 yearsVery Active: <1 year
High7%
2021
355
328
342
30
1Q19
57%20%
5%5%3%5%4%0%
100%
Shareholder Geography
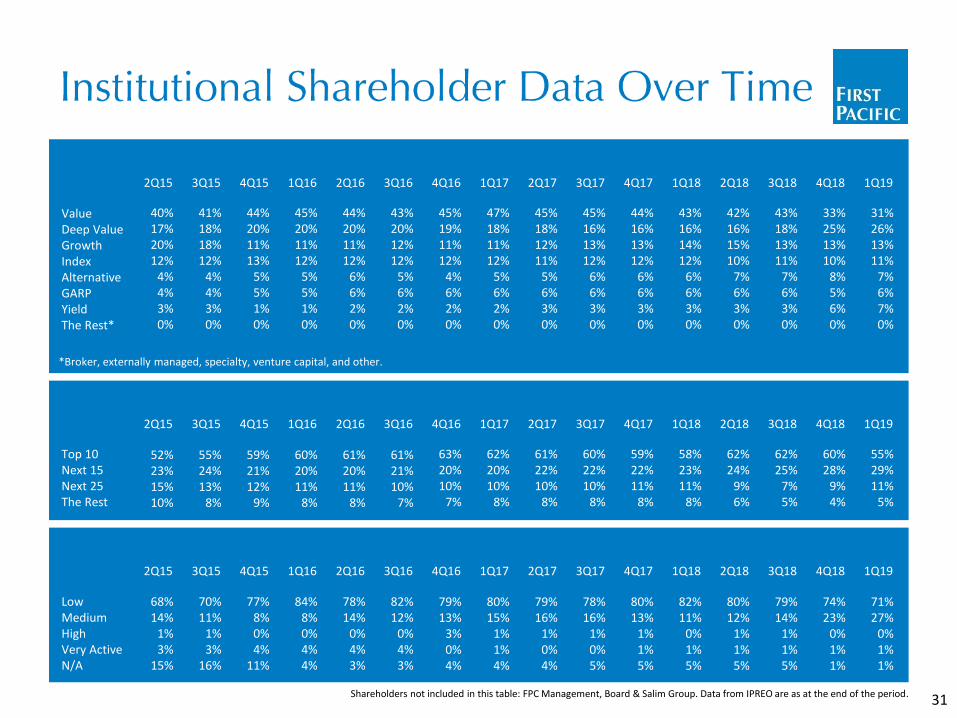
Value Deep Value Growth Index Alternative GARP Yield The Rest*
Top 10 Next 15 Next 25 The Rest
Low Medium High Very Active N/A
*Broker, externally managed, specialty, venture capital, and other.
43%18%13%11%
7%6%3%0%
3Q18
47%18%11%12%
5%6%2%0%
1Q17
45%19%11%12%
4%6%2%0%
4Q16
45%16%13%12%
6%6%3%0%
3Q17
45%18%12%11%
5%6%3%0%
2Q17
44%16%13%12%
6%6%3%0%
4Q17
43%16%14%12%
6%6%3%0%
1Q18
42%16%15%10%
7%6%3%0%
2Q183Q16
43%20%12%12%
5%6%2%0%
4Q18
33%25%13%10%
8%5%6%0%
3Q15
41%18%18%12%
4%4%3%0%
2Q15
40%17%20%12%
4%4%3%0%
4Q15
44%20%11%13%
5%5%1%0%
1Q16
45%20%11%12%
5%5%1%0%
2Q16
44%20%11%12%
6%6%2%0%
Shareholders not included in this table: FPC Management, Board & Salim Group. Data from IPREO are as at the end of the period.
60%28%
9%4%
74%23%
0%1%1%
62%25%
7%5%
62%20%10%
8%
63%20%10%
7%
60%22%10%
8%
61%22%10%
8%
59%22%11%
8%
58%23%11%
8%
62%24%
9%6%
61%21%10%
7%
55%24%13%
8%
52%23%15%10%
59%21%12%
9%
60%20%11%
8%
61%20%11%
8%
79%14%
1%1%5%
80%15%
1%1%4%
79%13%
3%0%4%
78%16%
1%0%5%
79%16%
1%0%4%
80%13%
1%1%5%
82%11%
0%1%5%
80%12%
1%1%5%
82%12%
0%4%3%
70%11%
1%3%
16%
68%14%
1%3%
15%
77%8%0%4%
11%
84%8%0%4%4%
78%14%
0%4%3%
3Q181Q174Q16 3Q172Q17 4Q17 1Q18 2Q183Q16 4Q183Q152Q15 4Q15 1Q16 2Q16
3Q181Q174Q16 3Q172Q17 4Q17 1Q18 2Q183Q16 4Q183Q152Q15 4Q15 1Q16 2Q16
31
1Q19
31%26%13%11%
7%6%7%0%
55%29%11%
5%
71%27%
0%1%1%
1Q19
1Q19
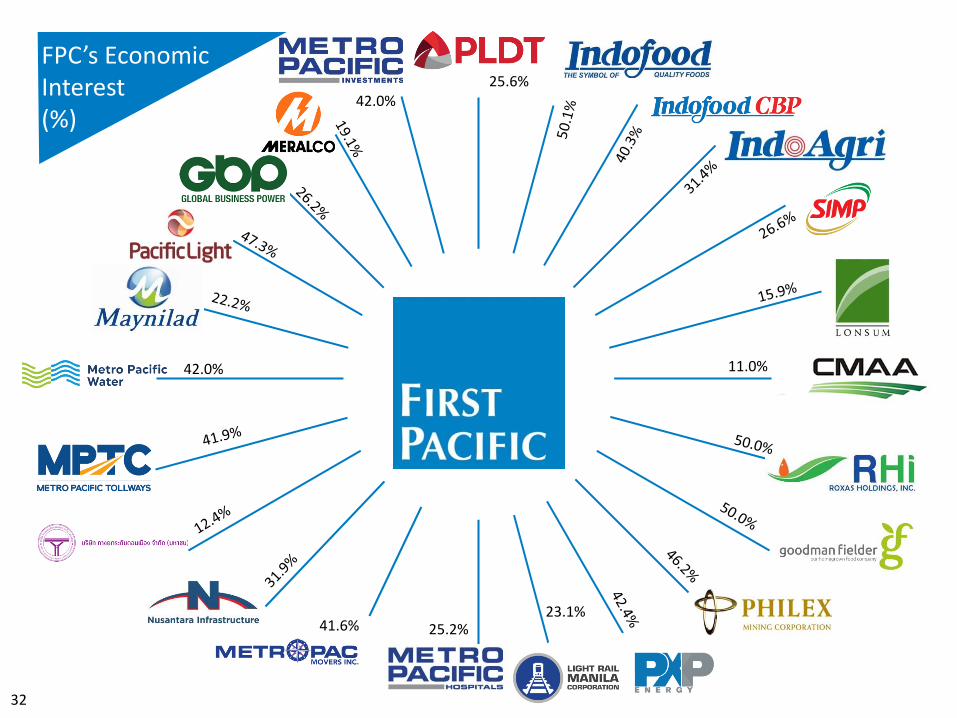
25.6%
42.0%
42.0%
FPC’s EconomicInterest(%)
23.1%
11.0%
25.2%41.6%
32


This presentation is provided for information purposes only. It does not constitute an offer or invitation to purchase or subscribe for any securities of First Pacific or any of its subsidiaries or investee companies, and no part of this presentation shall form the basis of or be relied upon in connection with any contract or commitment.
Certain statements contained in this presentation may be statements of future expectations and other forward-looking statements that are based on third-party sources and involve known and unknown risks and uncertainties. Forward-looking statements contained in this presentation regarding past trends or activities should not be taken as a representation that such trends or activities will continue in the future.
There is no obligation to update or revise any forward-looking statements, whether as a result of new information, future events or otherwise. You should not place undue reliance on forward-looking statements, which speak only as of the date of this presentation.
The dollar sign (“$”) is used throughout this presentation to represent U.S. dollars except where otherwise indicated.
36

First Pacific Company Limited(Incorporated with limited liability under the laws of Bermuda)
24th Floor, Two Exchange Square8 Connaught Place, Central
Hong KongTel: +852 2842 4374
www.firstpacific.com
37