Embed Size (px)
Citation preview

Copyright (C) 2002 Houghton Mifflin Company. All rights reserved. 1
Procedure for Hypothesis Testing
1. Establish the null hypothesis, H0.
2. Establish the alternate hypothesis: H1.
3. Use the level of significance and the alternate hypothesis to determine the critical region.
4. Find the critical values that form the boundaries of the critical region(s).
5. Use the sample evidence to draw a conclusion regarding whether or not to reject the null hypothesis.

Copyright (C) 2002 Houghton Mifflin Company. All rights reserved. 2
Null Hypothesis
Claim about or historical value of
H0: = k

Copyright (C) 2002 Houghton Mifflin Company. All rights reserved. 3
H0: = k
If you believe is less than the value stated in H0,
use a left-tailed test.
H1: < k

Copyright (C) 2002 Houghton Mifflin Company. All rights reserved. 4
H0: = k
If you believe is more than the value stated in H0,
use a right-tailed test.
H1: > k

Copyright (C) 2002 Houghton Mifflin Company. All rights reserved. 5
H0: = k
If you believe is different from the value stated in H0,
use a two-tailed test.
H1: k

Copyright (C) 2002 Houghton Mifflin Company. All rights reserved. 6
Hypothesis Testing About a
Population Mean when Sample Evidence Comes From
a Large Sample
Apply the Central Limit Theorem.

Copyright (C) 2002 Houghton Mifflin Company. All rights reserved. 7
Central Limit Theorem Indicates:
Central Limit Theorem Indicates:
Since we are working with assumptions concerning a population mean for a large sample, we can assume:
1. The distribution of sample means is (approximately) normal.

Copyright (C) 2002 Houghton Mifflin Company. All rights reserved. 8
Since we are working with assumptions concerning a population mean for a large sample, we can assume:
2. The mean of the sampling distribution is the same as the mean of the original
distribution.
Central Limit Theorem Indicates:

Copyright (C) 2002 Houghton Mifflin Company. All rights reserved. 9
Since we are working with assumptions concerning a population mean for a large sample, we can assume:
3. The standard deviation of the sampling distribution = the original standard deviation divided by the square root of the the sample size.
Assumptions:
Copyright (C) 2002 Houghton Mifflin Company. All rights reserved. 10
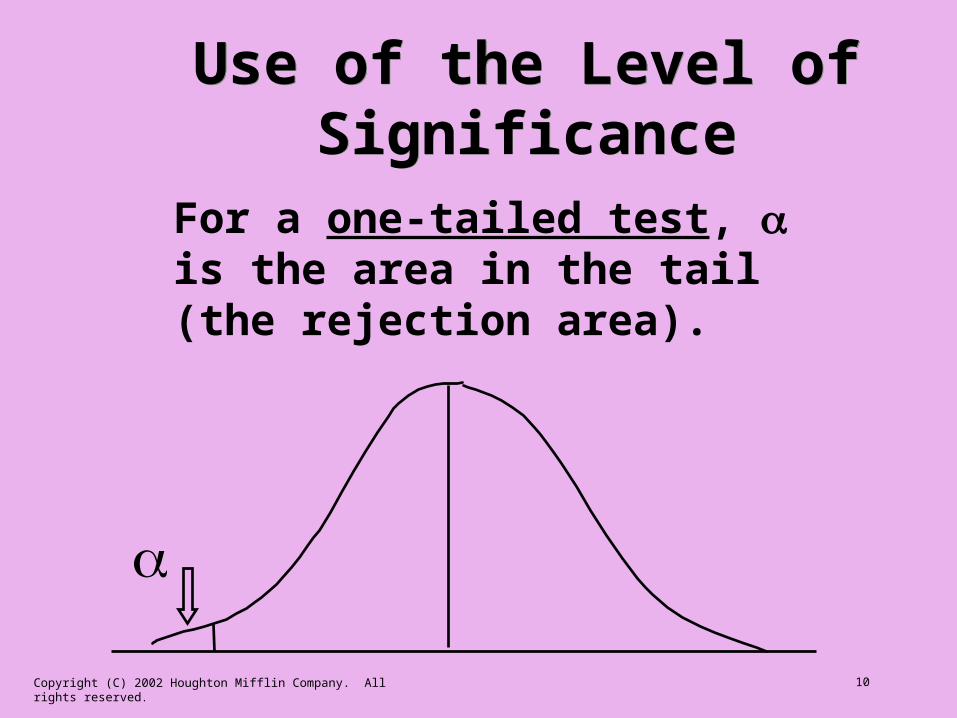
Use of the Level of SignificanceUse of the Level of Significance
For a one-tailed test, is the area in the tail (the rejection area).

Copyright (C) 2002 Houghton Mifflin Company. All rights reserved. 11
Use of the Level of SignificanceUse of the Level of Significance
For a two-tailed test, is the total area in the two tails.
Each tail = /2.
/2 /2

Copyright (C) 2002 Houghton Mifflin Company. All rights reserved. 12
Critical z Values for Two-Tailed Test: = 0.05
– 1.96 0 1.96
If test statistic is at or near the
claimed mean, we
do not reject the Null
Hypothesis
The critical regions: z < – 1.96 with z > 1.96.
H0: = k
H1: k

Copyright (C) 2002 Houghton Mifflin Company. All rights reserved. 13
Critical z Values for Two-Tailed Test: = 0.01
– 2.58 0 2.58
If test statistic is at or near the
claimed mean, we
do not reject the Null
Hypothesis
The critical regions: z < – 2.58 with z > 2.58.
H0: = k
H1: k

Copyright (C) 2002 Houghton Mifflin Company. All rights reserved. 14
Critical z Value for Right-Tailed Test: = 0.05
Critical z Value for Right-Tailed Test: = 0.05
0 1.645
If test statistic is at, near, or below the
claimed mean, we do not reject the Null
Hypothesis
The critical region: z > 1.645.
H0: = k
H1: > k
Copyright (C) 2002 Houghton Mifflin Company. All rights reserved. 15
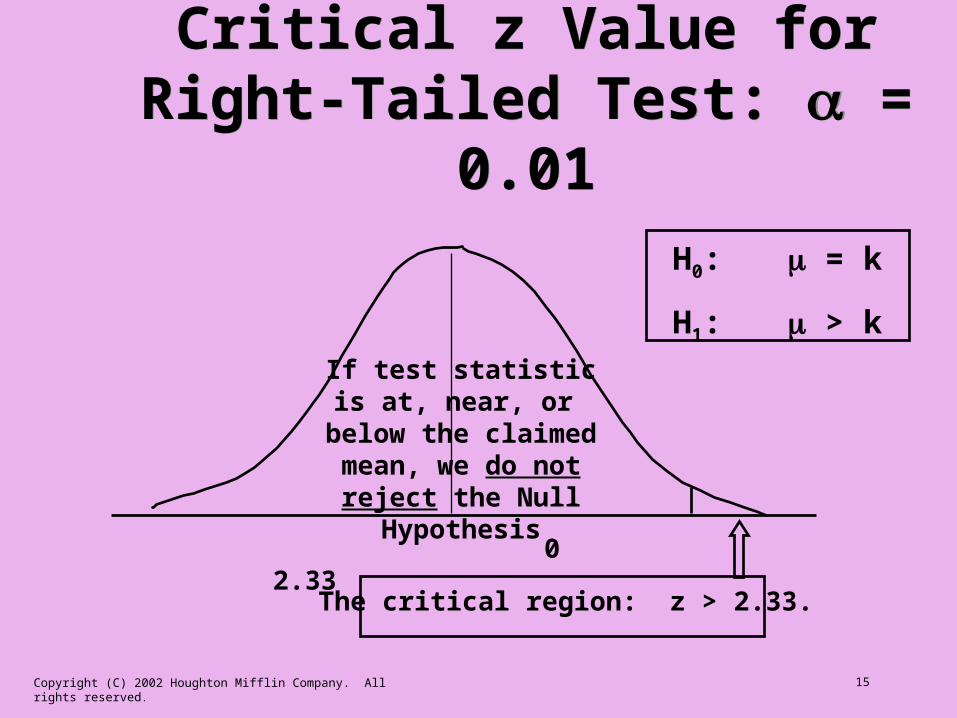
Critical z Value for Right-Tailed Test: = 0.01
Critical z Value for Right-Tailed Test: = 0.01
0 2.33
If test statistic is at, near, or below the
claimed mean, we do not reject the Null
Hypothesis
The critical region: z > 2.33.
H0: = k
H1: > k

Copyright (C) 2002 Houghton Mifflin Company. All rights reserved. 16
Critical z Value for Left-Tailed Test: = 0.05
Critical z Value for Left-Tailed Test: = 0.05
-1.645 0
If test statistic is at, near, or above the
claimed mean, we do not reject the Null
Hypothesis
The critical region: z < – 1.645
H0: = k
H1: < k
Copyright (C) 2002 Houghton Mifflin Company. All rights reserved. 17
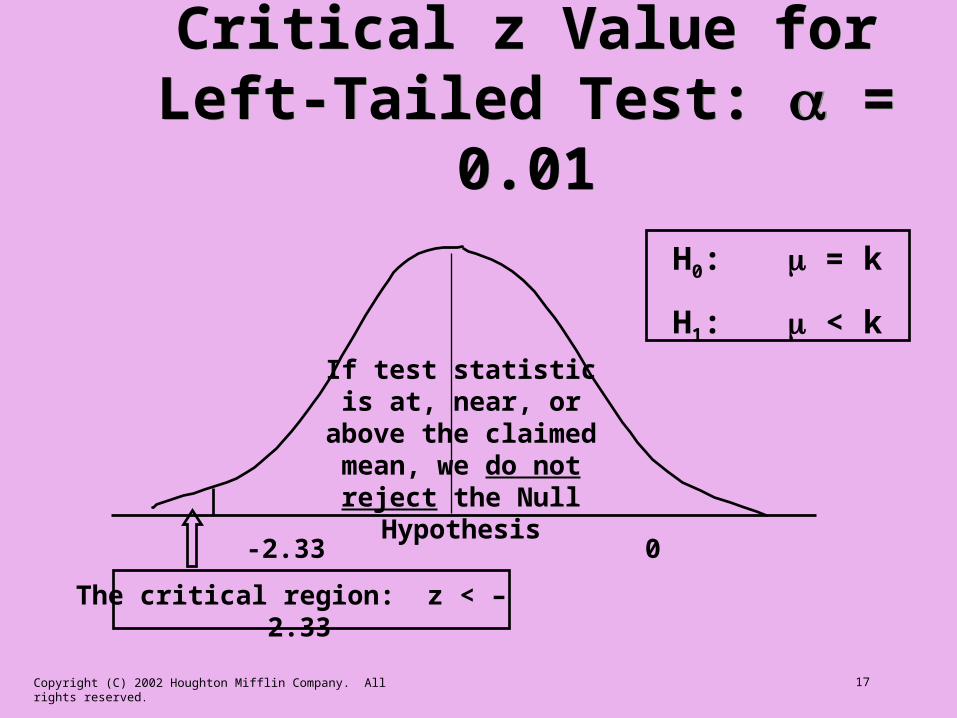
Critical z Value for Left-Tailed Test: = 0.01
Critical z Value for Left-Tailed Test: = 0.01
-2.33 0
If test statistic is at, near, or above the
claimed mean, we do not reject the Null
Hypothesis
The critical region: z < – 2.33
H0: = k
H1: < k

Copyright (C) 2002 Houghton Mifflin Company. All rights reserved. 18
Hypothesis Test Example
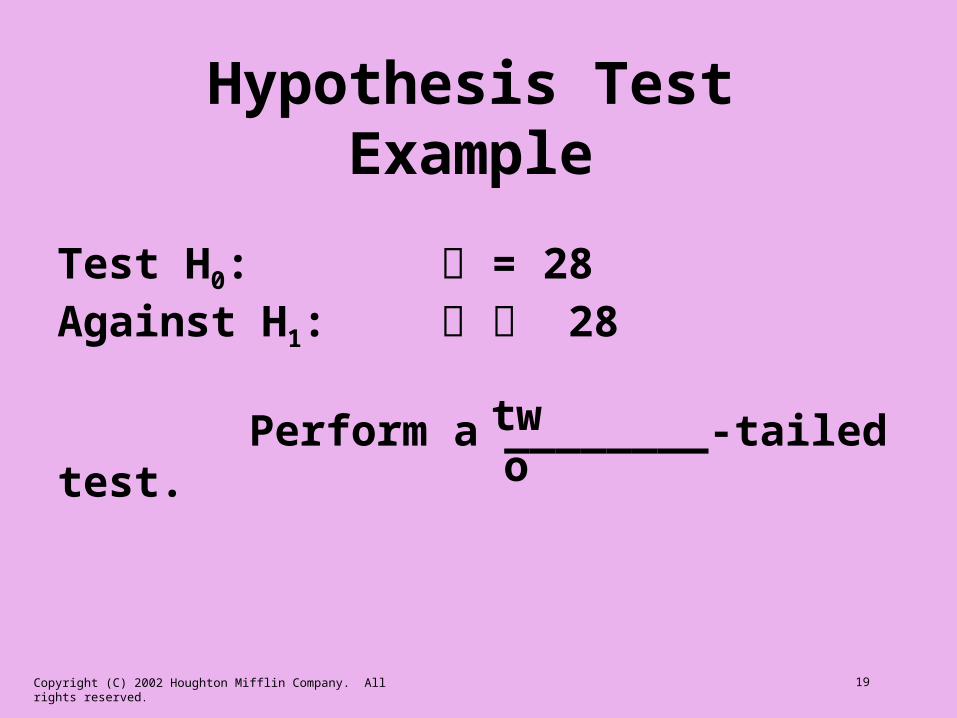
Your college claims that the mean age of its students is 28 years. You wish to check the validity of this statistic with a level of significance of = 0.05.
A random sample of 49 students has a mean age of 26 years with a standard deviation of 2.3 years.
Copyright (C) 2002 Houghton Mifflin Company. All rights reserved. 19
two
Test H0: = 28Against H1: 28
Perform a ________-tailed test.
Hypothesis Test Example

Copyright (C) 2002 Houghton Mifflin Company. All rights reserved. 20
two
Using = 0.05 Critical z value(s) = _________
Test H0: = 28Against H1: 28
Perform a ________-tailed test.
Hypothesis Test Example
±1.96

Copyright (C) 2002 Houghton Mifflin Company. All rights reserved. 21
Critical z Values for Two-Tailed Test: = 0.05
– 1.96 0 1.96
If test statistic is at or near the
claimed mean, we
do not reject the Null
Hypothesis
The critical regions: z < – 1.96 with z > 1.96.
H0: = 28
H1: 28

Copyright (C) 2002 Houghton Mifflin Company. All rights reserved. 22
Since z < – 1.96, we _________ the null hypothesis.
73.2
2826
n
xz
09.632857.
2
reject
Sample Results
:z statistictest the Calculate
.3.2,26 sx

Copyright (C) 2002 Houghton Mifflin Company. All rights reserved. 23
Hypothesis Test Example
Your college claims that the mean age of its students is 28 years. You wish to check the validity of this statistic with a level of significance of = 0.05.
A random sample of 49 students has a mean age of 27.5 years with a standard deviation of 2.3 years.

Copyright (C) 2002 Houghton Mifflin Company. All rights reserved. 24
Using = 0.05 Critical z values = 1.96
Test H0: = 28Against H1: 28
So, perform a two-tailed test.
Hypothesis Test ExampleHypothesis Test Example

Copyright (C) 2002 Houghton Mifflin Company. All rights reserved. 25
Since the test statistic is neither < – 1.96 nor > 1.96 , we _______________ the null
hypothesis.
73.2
285.27
n
xz
52.132857.
5.
do not reject
Sample ResultsSample Results
:z statistic,test the Calculate
2.3.s 27.5,x

Copyright (C) 2002 Houghton Mifflin Company. All rights reserved. 26
Hypothesis Test Example
The manufacturer of light bulbs claims that they will burn for 1000 hours. I will test a sample of the bulbs before deciding whether to keep them. The bulbs will be returned to the manufacturer only if my sample indicates that they will burn less than 1000 hours.

Copyright (C) 2002 Houghton Mifflin Company. All rights reserved. 27
The manufacturer of light bulbs claims that they will burn for 1000 hours. ...The bulbs will be returned ... if my sample indicates that they will burn less than 1000 hours.
H0: = 1000H1: < 1000
Hypothesis Test ExampleHypothesis Test Example
Copyright (C) 2002 Houghton Mifflin Company. All rights reserved. 28
left
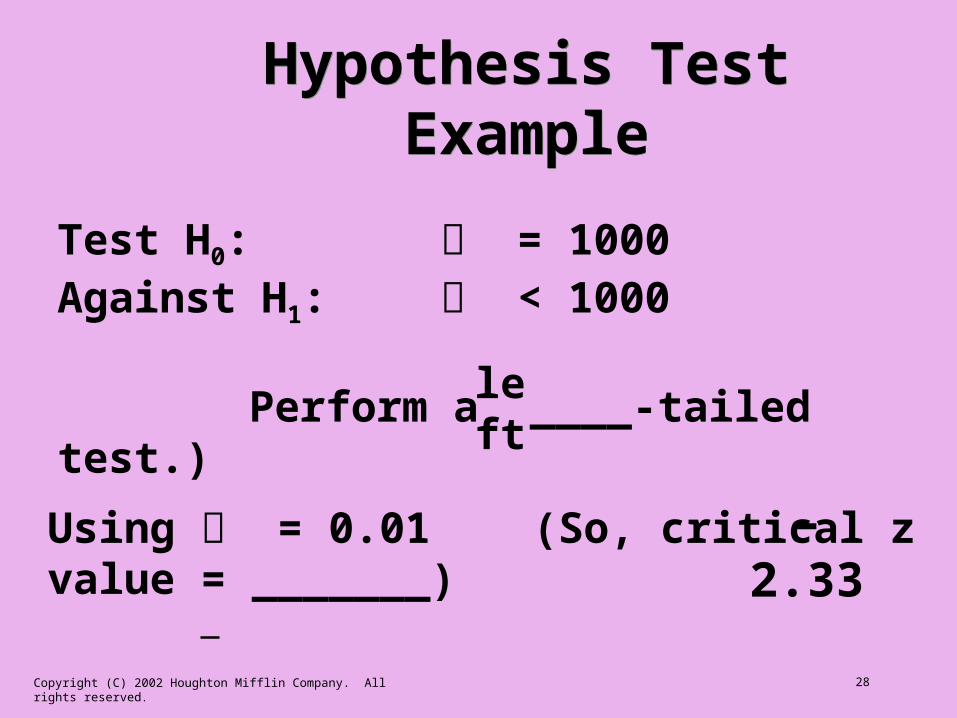
Using = 0.01 (So, critical z value = _______)
Test H0: = 1000Against H1: < 1000
Perform a ____-tailed test.)
Hypothesis Test ExampleHypothesis Test Example
–2.33
Copyright (C) 2002 Houghton Mifflin Company. All rights reserved. 29
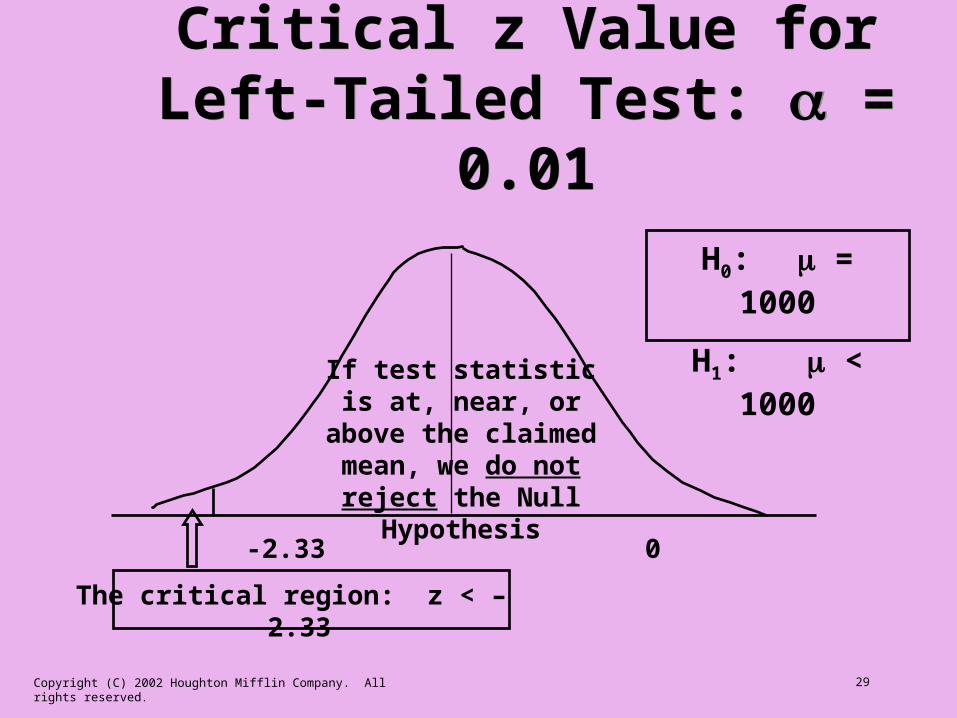
Critical z Value for Left-Tailed Test: = 0.01
Critical z Value for Left-Tailed Test: = 0.01
-2.33 0
If test statistic is at, near, or above the
claimed mean, we do not reject the Null
Hypothesis
The critical region: z < – 2.33
H0: = 1000
H1: < 1000

Copyright (C) 2002 Houghton Mifflin Company. All rights reserved. 30
Since the test statistic is not < – 2.33 we _____________ the null hypothesis.
64.3
1000999
n
xz
76.1567.
1
do not reject
Sample ResultsSample Results
:z Calculate
hours. 3.4 s and hours 999x
shows bulbs 36 of sampleour Suppose
Copyright (C) 2002 Houghton Mifflin Company. All rights reserved. 31
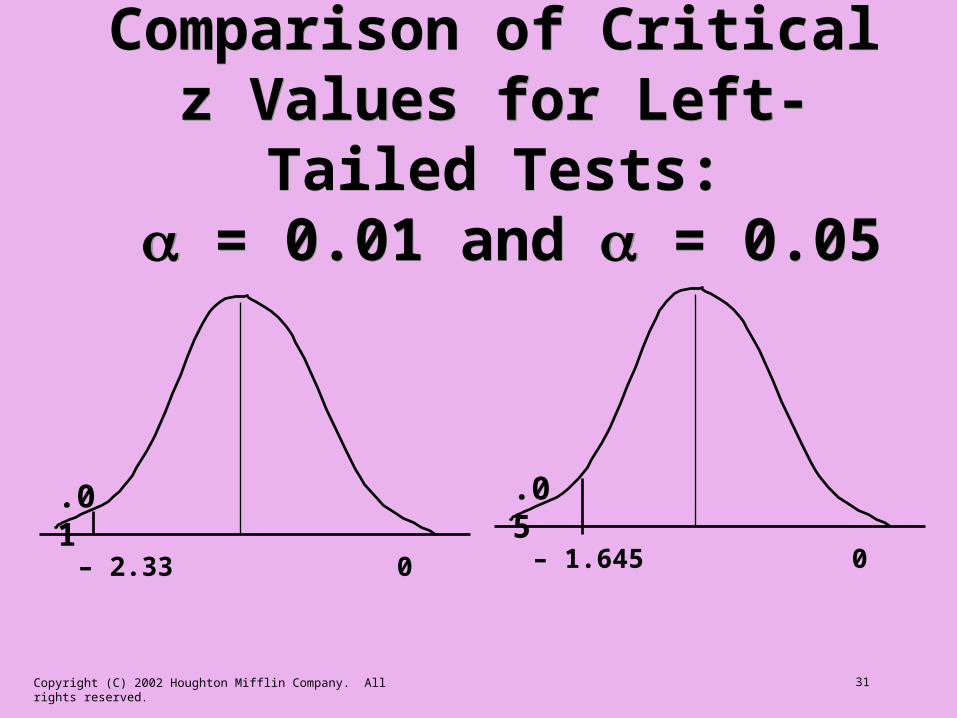
Comparison of Critical z Values for Left-Tailed Tests:
= 0.01 and = 0.05
Comparison of Critical z Values for Left-Tailed Tests:
= 0.01 and = 0.05
– 2.33 0 – 1.645 0
.01 .05

Copyright (C) 2002 Houghton Mifflin Company. All rights reserved. 32
In our last hypothesis test example, we calculated z = – 1.76.
Since we were using = 0.01, the boundary of the critical region was
– 2.33.
Our conclusion was not to reject the null hypothesis.
Had we been using = 0.05, our conclusion would have been to reject H0.

Copyright (C) 2002 Houghton Mifflin Company. All rights reserved. 33
Comparison of Critical z Values for Left-Tailed Tests:
= 0.01 and = 0.05
Comparison of Critical z Values for Left-Tailed Tests:
= 0.01 and = 0.05
– 2.33 0 – 1.645 0
=.01 = .05
z = – 1.76Do not reject H0.
z = – 1.76Reject H0.

Copyright (C) 2002 Houghton Mifflin Company. All rights reserved. 34
Statistical Significance
• If we reject H0, we say that the data collected in the hypothesis testing process are statistically significant.
• If we do not reject H0, we say that the data collected in the hypothesis testing process are not statistically significant.