Embed Size (px)
Citation preview

Copyright
by
Hong Liu
2012
The Dissertation Committee for Hong Liu certifies that this
is the approved version of the following dissertation:
Simple and Inexpensive Biosensors for Point-of-Care
Diagnostics
Committee:
______________________________
Richard M. Crooks, Supervisor
______________________________
Allen J. Bard
______________________________
Keith J. Stevenson
______________________________
Eric V. Anslyn
______________________________
John X.J. Zhang
Simple and Inexpensive Biosensors for Point-of-Care
Diagnostics
by
Hong Liu, B.S.; M.S.
Dissertation
Presented to the Faculty of the Graduate School of
The University of Texas at Austin
in Partial Fulfillment
of the Requirements
for the Degree of
Doctor of Philosophy
The University of Texas at Austin
December, 2012

Dedication
To my wife,
Ningyan Miao
and my daughter,
Yi Liu

Acknowledgements
I would like to sincerely thank my research advisor, Dr.
Richard M. Crooks for his generous support over my entire
graduate study. It has been great privilege for me to work
in his laboratory. This experience is invaluable to me and
my future career. His encouragement was the most important
factor leading to many fruitful developments.
I would also like to thank Dr. Allen J. Bard, Dr. Keith
J. Stevenson, Dr. Eric V. Anslyn, and Dr. John X. J. Zhang
for being my committee members and helping me to finish my
graduate study.
My gratitude goes to Dr. Kwok-Fan Chow, Stephen Fosdick,
Dr. Christophe Renault, Dr. Xiaole Chen, Dr. Damon Smith, Dr.
Ian Richards, Dr. Antonio Ricco, Dr. Bingling Li, Dr. Xiang
Yu, Alexandra Gade and Angie Missildine for assisting me in
my graduate research. Special thanks go to my fellow Crooks
group members for their assistance in the laboratory.
Last but not least, I want to thank my lovely wife,
daughter as well as our family for their undying support
throughout my studies.
v
Simple and Inexpensive Biosensors for Point-of-Care
Diagnostics
Publication No._______________
Hong Liu, Ph. D.
The University of Texas at Austin, 2012
Supervisor: Richard M. Crooks
In this dissertation, three types of paper-based
analytical devices for point-of-care biosensing, a
potentiometric method for analyzing percent hemoglobin A1c
(%HbA1c) and a PDMS-glass microelectrochemical device for
highly reproducible amperometric measurement in microdroplet,
are described.
The first paper-based sensing device is fabricated
using the principles of origami (paper folding). The three-
dimensional origami paper analytical device (oPAD) is
fabricated on a single sheet of flat paper in a single
photolithographic step and assembled by simply folding the
paper by hand. Following analysis, the device can be
vi
unfolded to reveal each layer for optical and fluorescent
read-out.
The second type of paper-based device has an integral
aluminum/air battery as the power source and reports its
output using Prussian blue as an electrochromic indicator.
The integrated aluminum/air battery powers both the
electrochemical sensor and the electrochromic read-out. The
applicability of the device to point-of-care sensing is
demonstrated by qualitative detection of glucose and H2O2 in
artificial urine.
The third type of paper-based device (oPAD 2) uses an
aptamer to recognize the analyte, adenosine, a glucose
oxidase tag to modify the relative concentrations of an
electroactive redox couple, and a digital multimeter to
transduce the result of the assay. Adenosine is
quantitatively determined using this device with a detection
limit of 11.8 M.
The method for measuring HbA1c concentration,
hemoglobin concentration, and thus %HbA1c in human blood is
based on potentiometry. We use Alizarin red s (ARS) as a
redox indicator. The potential shift of ARS owing to diol-
boronic acid complexation is used to determine the HbA1c,
which is a competitor of ARS for the complexation reaction.
The concentration of Hb is determined by reacting it with
vii
Fe(CN)63- and measuring the potential shift arising from the
reduction of Fe(CN)63- by Hb. The results obtained for
%HBA1c in human blood are in good agreement with those
determined using a reference method.
The method for highly reproducible chronoamperometric
analysis of the contents of microdroplets is developed.
Aqueous microdroplets (~ 1 nL) and separated by a
fluorocarbon solvent are generated within a microfluidic
device using a T-shaped junction. Highly reproducible quasi-
steady-state currents (relative standard deviations = ~ 2%)
are observed when the microdroplets are stretched by a
factor of 10 in a narrowed segment of a microchannel, which
leads to desirable intradroplet mass transfer
characteristics. Importantly, the design of the
microelectrochemical device ensures direct contact between
intradroplet redox molecules and the electrode surface to
study inner-sphere electrocatalytic processes such as the
oxygen reduction reaction. Finite-element simulations are
presented that are in accord with the experimental findings.
viii
Table of Contents
Chapter 1: Introduction..................................1
1.1 Paper-based analytical devices................1
1.2 Point-of-care diagnosis of diabetes...........5
1.3 Microdroplets.................................7
1.4 Research summary and accomplishments.........10
Chapter 2: Experimental.................................13
2.1 Chemicals....................................13
2.2 Techniques...................................13
Chapter 3: Fabrication of three-dimensional paper fluidic
device using the principle of origami........16
3.1 Synopsis.....................................16
3.2 Introduction.................................16
3.3 Experimental.................................20
3.4 Results and Discussion.......................24
3.5 Summary and Conclusion.......................37
Chapter 4: Paper-Based Electrochemical Sensing Platform
with Integral Battery and Electrochromic Read-
Out..........................................38
4.1 Synopsis.....................................38
4.2 Introduction.................................38
4.3 Experimental.................................43
4.4 Results and Discussion.......................46
ix
4.5 Summary and Conclusion.......................57
Chapter 5: Aptamer-based Origami Paper Analytical Device for
Electrochemical Detection of adenosine.......59
5.1 Synopsis.....................................59
5.2 Introduction.................................60
5.3 Experimental.................................64
5.4 Results and Discussion.......................71
5.5 Summary and Conclusion.......................83
Chapter 6: Determination of Percent Hemoglobin A1c Using a
Potentiometric Method........................85
6.1 Synopsis.....................................85
6.2 Introduction.................................85
6.3 Experimental.................................88
6.4 Results and Discussion.......................91
6.5 Summary and Conclusion......................112
Chapter 7: Highly Reproducible Chronoamperometric Analysis
in Microdroplets............................113
7.1 Synopsis....................................113
7.2 Introduction................................114
7.3 Experimental................................119
7.4 Results and Discussion......................121
7.5 Summary and Conclusion......................143
Chapter 8: Summary and Conclusion......................145
References.............................................148
x

xi
Vita...................................................167
Chapter 1: Introduction
1.1 Paper-based analytical devices
Paper is a thin material made by pressing moist fibers
(e.g., cellulose pulp) and drying them into flexible sheets.
The making process of the material recognizable as paper in
modern times was invented by a Chinese named Lun Cai in the
early 2nd century AD.1 Now it has been widely used in almost
all aspects of human life, for example, writing, printing,
cleaning, packaging. Paper made from cellulose is a
renewable material with annual production of 1.5×10¹² tons.2
It is also one of the cheapest materials all over the world.
The unique features of paper in terms of analytical
chemistry are: (1) Paper is a porous hydrophilic material so
that it wicks fluid, which facilities the manipulation of
liquid sample without using a pump or a pipette. (2) Due to
well-established printing techniques, patterning paper is
much easier than patterning other thin materials. This makes
mass production of paper-based analytical devices
practically feasible. (3) Paper is a biocompatible material
so that biomolecule probes are more stable and less likely
to denature on paper. (4) Paper is also chemically inert so
that it doesn’t interference with most analytical processes.
1
The simplest and earliest paper-based analytical
devices is probably litmus paper, which was invented by a
French chemist, J.L. Gay-Lussac, in the 1800s.3 The working
principle of the litmus paper is quite similar to that of
the microfluidic paper analytical devices (PADs) recently
invented by Whitesides and coworkers.4 The filter paper,3 or
patterned chromatography paper,4 is dipped into a liquid
sample, the preloaded regents on the paper are dissolved by
the sample, and the reagents react with the analyte (e.g.
protons or glucose) to develop colors which are correlate to
the concentration of the analyte. Owing to the simple users’
experience of “dip-and-read”, paper-based analytical devices
are especially suitable for point-of-care diagnostics.5 By
careful engineering of the paper-based analytical devices,
more sophisticated bioassays that involve specific binding
reaction have also been achieved on paper with high
sensitivity (i.e., sub-nM) and good reproducibility. For
example, in 1988, a nitrocellulose-based lateral-flow
immunochromatographic assay was developed by Unipath for
point-of-care pregnancy testing, which turns out to be a
great commercial success.5
The origin of using patterned paper as a platform for
analytical chemistry is probably the work reported by Müller
and coworkers.6 In 1949, they studied the elution of a
2
pigment mixture along a fluidic channel of filter paper
which was patterned using paraffin wax. The paraffin wax was
patterned on the filter paper by selectively applying heat
to melt wax and the wax wicked into the paper. After cooling
to room temperature, the wax formed a hydrophobic barrier to
guide the wicking of sample liquid in the remaining paper
channel. In 2007, Whitesides and coworkers developed a
photolithographic method to pattern chromatography paper and
the resulting two-dimensional (2-D) PADs were used for
colorimetric detection of glucose and bovine serum albumin.4
Since then, a wide range of paper-patterning techniques have
been developed for fabricating 2-D PADs, including
plotting,7 ink-jet etching,8 plasma treatment,9 wax
printing,10,11 inkjet printing,12 Flexography printing,13
screen printing14 and laser treatment.15
In 2009, Whitesides and coworkers fabricated three-
dimensional (3-D) PADs by stacking of 2-D PADs using
double sided tape.16 A laser cutter was used to punch holes
and the holes were filled with cellulose powders to enable
vertical connections between paper channels on adjacent
layers. However, the fabrication of this 3-D device is very
complicated, and it involves the use of an expensive laser
3
cutter, which limits the mass production capability of this
device.
According to World Health Organization, point-of-care
analytical devices for developing world need to be ASSURED,
which is Affordable, Sensitive, Specific, User-friendly,
Rapid and robust, Equipment-free and Deliverable to end-
users.17 Due to the requirement of equipment-free,
colorimetric read-out, which enables naked-eye detection,
was exclusively used at the beginning of this technique.4 16-
18 However, the key limitation of the colorimetric read-out
for a paper-based analytical device is the poor sensitivity
and the difficulty of achieving quantitative analysis. The
poor sensitivity is partially due to the short optical path
of paper (e.g. ~ 180 μm) so that the absorption of light is
very small and can not be seen by human eyes unless a high
concentration of chromophore is generated. To achieve
quantitative analysis, an additional optical device (i.e.,
camera, scanner or colorimeter), appropriate image-
processing software, and certain expertise is required,
which highly limits the practical application in point-of-
care diagnostics.
Electrochemical methods, due to their low cost, low
power consumption and simple instrumentation, are especially
useful in point-of-care diagnostics.19 For example, glucose
4
biosensors, which are mainly electrochemical sensors,
account for 85% of the entire biosensor market.20 Unlike
colorimetric methods, electrochemical methods are
intrinsically quantitative. The first electrochemical paper-
based analytical device was reported by Henry and
coworkers.21 They fabricated three-electrode system on a
paper fluidic device by screen printing of carbon and
Ag/AgCl conductive ink. Glucose, lactate and uric acid were
quantitatively determined on a single device using a
traditional electrochemical read-out, a potentiostat.
Therefore, the practical application in point-of-care
sensing of their device is highly limited by the
potentiostat which requires expertise to use. Accordingly,
Whitesides and coworkers developed a paper-based
electrochemical sensing device that only requires a personal
glucose meter (PGM) for readout.22 However, the PGM is
engineered to detect blood glucose at physiological
concentration (4.4 -6.6 mM).20 The concentration of most
biochemical analytes is much smaller than that of glucose
(e.g., nM or pM) so that considerable signal amplification
is required.
1.2 Point-of-care diagnosis of diabetes
Diabetes, as a group of metabolic diseases, is a
5
growing worldwide health problem.23 It is also one of
leading causes of death and disability around the world. The
metabolic disorder of diabetes is reflected by blood glucose
concentrations higher or lower than the normal range of 80-
120 mg/dL (4.4-6.6 mM).20 Poor management of blood glucose
usually results in numerous complications, including heart
attack, renal failure and blindness. Therefore, continuous
monitoring blood glucose concentration is crucial for the
diagnosis and treatment of diabetes.24
The use of PGM for blood glucose determination requires
three to four tests a day due to the large fluctuation of
blood glucose concentration.24 For effective diagnosis and
management of diabetes, the analysis of percent hemoglobin
A1c (%HbA1c), which is the ratio of HbA1c to total
hemoglobin (Hb) concentration, is more appropriate.25 26
Specifically, the 2010 American Diabetes Association
Standards of Medical Care in Diabetes has included %HbA1c ≥
6.5% as a criterion for the diagnosis of diabetes
mellitus.27
HbA1c is formed by a nonenzymatic reaction between N-
terminal valine of Hb chain and plasma glucose, followed
by an Amadori rearrangement reaction.28 The %HbA1c reflects
the average blood glucose concentration over the entire half
life of erythrocytes (i.e. 60 days).26
6
Because of the huge market of diabetes diagnostics
(millions of diabetes patients test their blood glucose
several times daily),20 the %HbA1c becomes a very attractive
model analyte for the development of lots of sensing
concepts. A wide range of analytical methods have been
developed for the analysis of %HbA1c, including boronate
affinity chromatography,29,30 ion-exchange chromatography,31
electrophoresis,32 fluorescence,33,34 UV-vis absorption,34
chemiluminescence,28 electrochemical methods,35-39 and
immunoassays.40,41
However, most of these methods are based on
chromatographic separations. Other methods usually require
antibody reagents or commercially unavailable derivatives of
boronic acid, which render these methods relatively
vulnerable and expensive.28,33,34,38,40,41 Moreover, some of
these methods only determine the absolute concentration of
HbA1c rather than %HbA1c. Finally, it has recently been
reported that the majority of commercially available HbA1c
analyzers are unreliable.42
1.3 Microdroplets
Microfluidics, as a convenient way to manipulate or
process small amounts of liquids (nL to aL) in a
microchannel of tens of micrometers, has found a wide range
7
of applications in chemical and biological research.43,44 A
decade ago, microdroplets for applications to microfluidics
was reported by Quake and coworkers.45 Since then,
microdroplets have found a myriad of applications solving a
number of problems associated with analytical applications
of microfluidic systems. For example, due to laminar flow in
standard fluidic microchannels, the rate of mixing is
limited by diffusional mass transport.46,47,48 However, mixing
can be accelerated by internal recirculating convection in a
flowing microdroplet.49 Moreover, the parabolic profile of
pressure-driven flow in a microchannel leads to axial Taylor
dispersion and thus dilution of reagents.50 In contrast, the
reagents in a microdroplet are encapsulated in an immiscible
organic phase, thereby avoiding dilution. Furthermore,
nonspecific adsorption of reagents onto the traditional
microfluidic channel walls can be problematic,51 but this
problem is avoided with segmented flow since the aqueous
microdroplet does not contact the channel wall. Finally,
poly(dimethylsiloxane) (PDMS) is a common material used for
fabricating microfluidic devices. The PDMS is vapor
permeable and thus may lead to solvent evaporation
problems.47 This problem can also be solved by the
encapsulation of microdroplet using an immiscible liquid.
8
A number of methods have been reported for analyzing
the contents of microdroplets: fluorescence
spectroscopy,49,52,53 Raman spectroscopy,54,55 mass
spectrometry,56,57 and electrochemical methods.58-60 Compared
with the other methods, electrochemistry is relative simple
and low cost, and it provides information about mass
transfer, electron transfer, and coupled chemical processes
that are difficult or impossible to study using the
aforementioned approaches.61 For example, Han et al.58
reported on the enzymatic kinetics of catalase confined
within microdroplets by detecting H2O2 using wire electrodes
inserted into the microchannel. In this case, the contact
time between the electrodes and the droplets was short, and
so the faradaic current was short and convoluted with a
large capacitive current. Moreover, the electrode wires were
forced to penetrate each droplet, and this resulted in a
significant degree of droplet instability. The same group
also reported a potentiometric method, using an ion-
selective electrode, for studying rapid binding kinetics of
Mg2+ to RNA in microdroplets.62 However, potentiometric
measurements were not carried out in droplets, but rather
under continuous flow conditions.
Electrochemical measurements in larger (millimeter-
scale) droplets have also been reported. For example, Liu et
9
al.59 used chronoamperometry to study droplet size,
frequency of droplet generation, and flow velocity of
droplets in organic fluid containing redox species. Sassa et
al.60 used electrode arrays to enhance the sensitivity of
coulometric detection of H2O2 and L-glutamate in aqueous
droplets. However, it would be challenging to do these
experiments when the size of the droplets decreased to
micrometer scale.
1.4 Research Summary and Accomplishments
My dissertation focuses on the development of simple
and inexpensive biosensors for point-of-care diagnostics.
Chapters 3, 4, and 5 describe three types of paper-based
analytical devices fabricated for biochemical analysis.
These paper-based biosensors are very cheap to fabricate and
they are all “dip-and-read” sensors which means only two
steps are involved for using these sensors. First, dip the
device into liquid sample, second, read the results.
Therefore, no expertise is required to use these sensors.
Specifically, chapter 3 discusses the fabrication of 3-
D paper fluidic analytical devices using the principle of
origami. The 3-D origami paper analytical device (oPAD) is
fabricated on a single sheet of flat paper in a single
photolithographic step and assembled by simply folding the
10
paper by hand. Following analysis, the device can be
unfolded to reveal each layer for optical assays.
Chapter 4 discusses the second type of paper-based
device has an integral aluminum/air battery as the power
source and reports its output using Prussian blue as an
electrochromic indicator. The integrated aluminum/air
battery powers both the electrochemical sensor and the
electrochromic read-out. The applicability of the device to
point-of-care sensing is demonstrated by qualitative
detection of 0.1 mM glucose and H2O2 in artificial urine.
Chapter 5 discusses the third type of paper-based
device (oPAD 2) that uses an aptamer to recognize the
analyte, adenosine, a glucose oxidase tag to modify the
relative concentrations of an electroactive redox couple,
and a digital multimeter to transduce the result of the
assay. Adenosine is quantitatively determined using this
device with a detection limit of 12 M.
Chapter 6 describes a method for measuring HbA1c
concentration, Hb concentration, and %HBA1c in human blood
for diagnosis and management of diabetes mellitus. Alizarin
red s (ARS) is used as a potentiometric indicator.
Phenylboronic acid (PBA) binds to both ARS and HbA1c via
diol-boronic acid complexation. The binding of PBA to ARS
shifts its redox potential negative. However, when HbA1c
11
competes with ARS for PBA binding, the solution potential
shifts positive. This shift is linked to the HbA1c
concentration. To determinate the concentration of Hb, Hb is
allowed to react with Fe(CN)63-. The potential shift arising
from the reduction of Fe(CN)63- by Hb is proportional to the
logarithm of the Hb concentration. The results obtained for
%HBA1c in human blood are in good agreement with those
determined using a reference method.
Chapter 7 describes a method for highly reproducible
chronoamperometric analysis of the contents of microdroplets
(~ 1 nL). The key finding is that stable and reproducible
quasi-steady-state currents (± ~2%) are observed if the
electrochemical measurements are made in a narrowed segment
of a microchannel where the microdroplets are stretched a
factor of 10. Importantly, the design of the
microelectrochemical device ensures direct contact between
intradroplet redox molecules and the electrode surface that
enables the study of inner-sphere electrocatalytic processes
such as the oxygen reduction reaction. Finite-element
simulations are presented that are in accord with the
experimental findings.
12
Chapter 2: Experimental
2.1 Chemicals
All chemicals used in this work are separately
described in each chapter.
2.2 Techniques
Photolithography Photolithography uses UV photons to
cross link photoresist and generate two-dimensional patterns
on a flat substrate.63 The microelectrochemical devices for
microdroplet experiments and the oPADs used in this work
were fabricated by a contact-mode photolithography.
For fabricating the microelectrochemical device, a
conformal photoresist (AZ4670) layer is first spin-coated
onto a gold slide having a Cr adhesion layer, and prebaked
to remove some solvent. Next, a transparency mask is brought
into direct contact with the photoresist layer under a
vacuum so that the mask and the photoresist layer on the
substrate are in close proximity (e.g. ~ 1 m). The
photoresist is exposed to incident UV light (365 nm, 350 W)
so that cross-link reactions is initiated. After rinsing
with developing solution, the remaining unexposed
photoresist is removed, and the underlying substrate is
allowed for further processing. The Au and Cr adhesion
13
layers are etched subsequently.64 All remaining photoresist
is then removed by acetone.
For oPADs, SU-8 photoresist is patterned on
chromatography paper based on a previously reported
procedure.4 Briefly, the chromatography paper is soaked in
diluted photoresist for 5 min. After soft baking at 130 oC
for 10 min on a hot plate and cooling to room temperature,
the paper is exposed to 365 nm UV light (350 W lamp) for 30
s under a transparency mask. Next, the paper was post baked
at 130 oC for 10 min on a hotplate. Finally, the paper was
immersed in acetone for 1 min to remove the unexposed
photoresist.
Soft lithography The microchannels used in this work
are fabricated by soft lithography.63 The mold having the
dimensions of the microchannel fabricated by
photolithographically cross-linking photoresist coated on a
glass slide. The mold is then silanized for microchannel
fabrication.
To fabricate the microchannel, the PDMS precursor is
first poured onto the photoresist mold. After curing at ~65
oC for 3 h, the PDMS is peeled off from the mold. A hole
puncher is used to form the reservoirs at each end of the
microchannel. For irreversible binding of the PDMS slab on
the glass surface, the PDMS and glass slide are first
14
treated with air plasma for 15 s. After attachment of the
PDMS on the glass slide, the whole device is heated at ~80
oC for 1 min.
Wax printing The patterning of paper using wax printer
is based on a slight modification of a procedure reported
previously.11 Briefly, a Xerox 8570DN inkjet printer is used
to print wax-based solid ink on Whatman chromatography paper.
The paper is then placed on a hot plate with the wax side up
for 15 s at 120 oC, and then cooled to 20 OC.
Screen printing For fabricating electrodes on a paper-
based device, the paper is placed on a flat glass surface,
and then covered with a home-made screen with an impermeable
pattern on it. An aliquot of carbon ink is dropcast on the
paper. A coating blade or rod is used to coat the carbon ink
uniformly onto the paper through the screen. To cure the
carbon ink, the paper is placed in an oven at 80 OC for 30
min.
15
Chapter 3: Three-Dimensional Paper Microfluidic Devices
Assembled Using the Principles of Origami
3.1 Synopsis
In this chapter we report a method, based on the
principles of origami (paper folding), for fabricating
three-dimensional (3-D) paper microfluidic devices. The
entire 3-D device is fabricated on a single sheet of flat
paper in a single photolithographic step. It is assembled
by simply folding the paper by hand. Following analysis, the
device can be unfolded to reveal each layer. The
applicability of the device to chemical analysis is
demonstrated by colorimetric and fluorescence detection
using multilayer microfluidic network.
3.2 Introduction
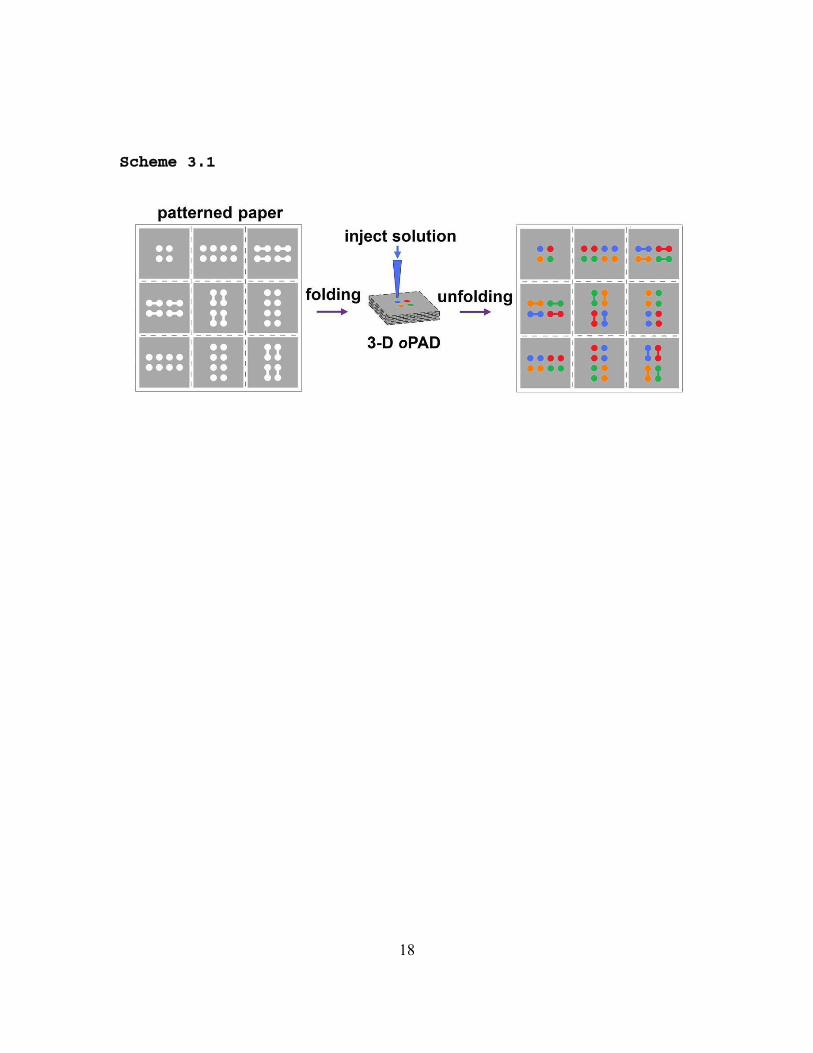
In this chapter we report a method for fabricating
three-dimensional (3-D) paper microfluidic devices that is
based on the principles of origami (paper folding). The
concept is illustrated in Scheme 3.1. Using this method, the
entire device is fabricated on a single sheet of flat paper,
and then it is assembled by simple paper folding. This
method is important for several reasons. First, instead of
sequential layer-by-layer fabrication, which is the usual
16

approach for preparing 3-D microfluidic systems,16,65,66 the
entire device is fabricated on one piece of paper in a
single photolithographic step. This speeds the fabrication
process and reduces cost. Second, the multilayer device is
assembled by simple paper folding, which can be completed in
less than 1 min without tools or special alignment
techniques. Third, the device can be easily unfolded so that
all layers, rather than just the surface, can be used for
parallel analysis. Fourth, incorporation of additional
intermediate layers should not result in much additional
fabrication overhead.
17
Scheme 3.1
18
The principles of 2-D and 3-D microfluidic paper
analytical devices (μPADs) have been described by Whitesides
and co-workers,4,16,18,67,68 and a number of interesting
applications have been reported.17,18,21,22,67,69,70 Briefly, for
2-D μPADs, microfluidic channels and reservoirs are
fabricated by patterning channel walls on chromatography
paper using a hydrophobic material, such as photoresist (PR)
or wax. Aqueous solutions are then driven along the
hydrophilic paper channels by capillary action. For 3-
DμPADs,16,18 individual layers are patterned sequentially by
photolithography and then stacked using double-side tape.
Holes are punched in the tape using a laser cutter, and the
resulting holes are filled with cellulose powder16 or
compressed18 to provide vertical connections between
adjacent layers. The results of an analysis are determined
using colorimetric detection on one of the two surface
layers. The 3-D μPADs show great promise for applications
such as power-free, point-of-care detection and diagnosis,
particularly in underdeveloped or remote areas. However, as
presently practiced, device fabrication requires a
photolithographic step for each layer and then laser cutting
of vias to establish fluidic connections between layers.
Moreover, assembly of the device, using double-side tape, is
19
irreversible so that only the surface layer can be used for
colorimetric detection. The approach we describe addresses
these points.
As previously discussed, 3-D μPADs are fabricated by
stacking 2-D layers. An alternative approach is based on the
principles of origami. Origami is the traditional Japanese
art of paper folding, and it has been in use for ~400 years
to construct 3-D geometries starting with a single piece of
flat paper. Within the context of modern science and
engineering, there has not been much interest in origami.
However, there is one report in which it was used to
fabricate 3-D printed circuit boards in the shapes of
airplanes and cranes.71 With that as a starting point, we
show here that origami can be used to fabricate simple and
functional microfluidic devices, which we call origami paper
analytical devices (oPADs), having several highly desirable
characteristics.
3.3 Experimental
Chemicals Colorimetric glucose (GAGO-20), protein
(TP0100) and fluorescent protein assay kits (FP0010) were
purchased from Sigma-Aldrich. SU-8 2025 photoresist was
obtained from MicroChem Corp. (Newton, MA), and diluted
using propylene glycol methyl ether acetate (≥99.5%, Sigma-
20
Aldrich) to 75% v/v for photolithographic patterning on the
chromatography paper (Whatman, 1 CHR, 100μm thick).
Rhodamine 6G (99%) and erioglaucine disodium salt were
purchased from Acros Organics. Tatrazine were obtained from
MP Biomedicals (Solon, OH). All solutions were prepared with
deionized water (18.0 MΩ-cm, Milli-Q Gradient System,
Millipore). All reagents were used as received without
further purification.
Experimental procedure The patterning of SU-8
photoresist on chromatography paper was based on a
previously reported procedure (Martinez, A. W.; Phillips, S.
T.; Whitesides, G. M. Proc. Natl. Acad. Sci. U.S.A., 2008,
105, 19606-19611.). Briefly, the chromatography paper was
soaked in the photoresist for 5 min. After soft baking at
130 oC for 10 min on a hot plate and cooling to room
temperature, the paper was exposed to 365 nm UV light (350 W
lamp) for 30 s under a transparency mask. Next, the paper
was post baked at 130 oC for 10 min on a hotplate. Finally,
the paper was immersed in acetone for 1 min to remove the
unexposed photoresist. All channels patterned on the paper
were 900 μm wide, and the reservoirs were 2.5 mm in diameter.
Individual layers of the paper device were 2 cm x 2 cm.
Paper folding was carried out using the sequence
illustrated in Figure 3.1. After folding, the four corners
21
of the folded paper were removed using scissors so the paper
device could be accommodated by the aluminum clamp shown in
Figure 3.2d. Pressure was applied evenly by the screws to
ensure that the paper layers contacted each other. Four
1.25 mm-diameter holes were drilled into the top plate of
the clamp so that test solutions could be injected into the
device.
Fluorescence analysis of the oPADs was carried out
using a Typhoon Trio fluorescent imager (GE Healthcare,
Piscataway, NJ). Each paper layer was scanned at a lateral
resolution of 100 μm using a 532 nm, 20 mW solid-state laser
as the light source and a 640 nm emission filter. The scan
was complete within 1 min.
22
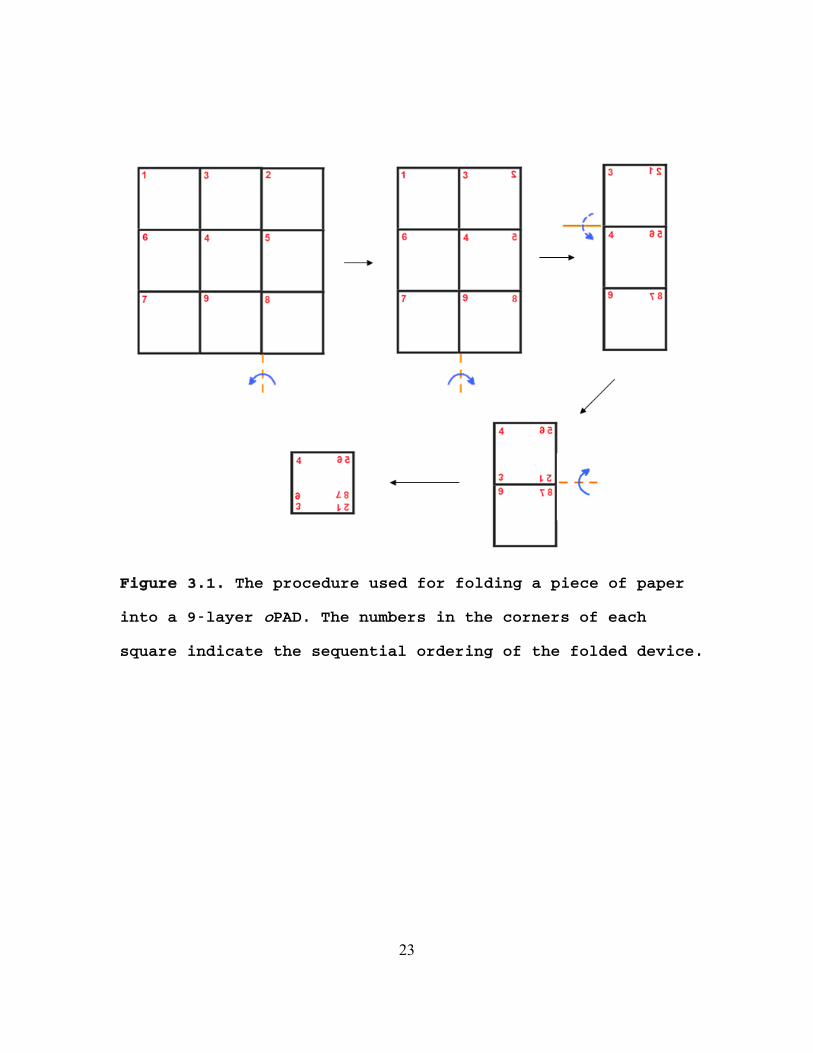
Figure 3.1. The procedure used for folding a piece of paper
into a 9-layer oPAD. The numbers in the corners of each
square indicate the sequential ordering of the folded device.
23
3.4 Results and Discussion
Figure 3.2a shows a piece of chromatography paper that
has been patterned with channels, reservoirs, and a frame
(to provide a template for subsequent folding) fabricated in
a single photolithographic step. The fabrication process is
based on previously reported procedures16 and is described
in the Experimental Section. As reported previously,16 the
entire photolithographic process can be performed without a
cleanroom, using just a hot plate, UV lamp, and a mask
produced on a printer. Following photolithography, the 3-D
device was assembled by folding the paper along the
lithographically defined frame. The frame ensures that the
channels and reservoirs are properly aligned after folding
into the 3-D assembly. The folding sequence is provided in
Figure 3.1. The four corners of the folded paper were
trimmed, as shown in Figures 3.2b and 3.2c, to accommodate
an aluminum clamp (Figure 3.2d). Solutions could then be
injected into the four holes drilled into the top aluminum
plate of the clamp (Figure 3.2d).
24
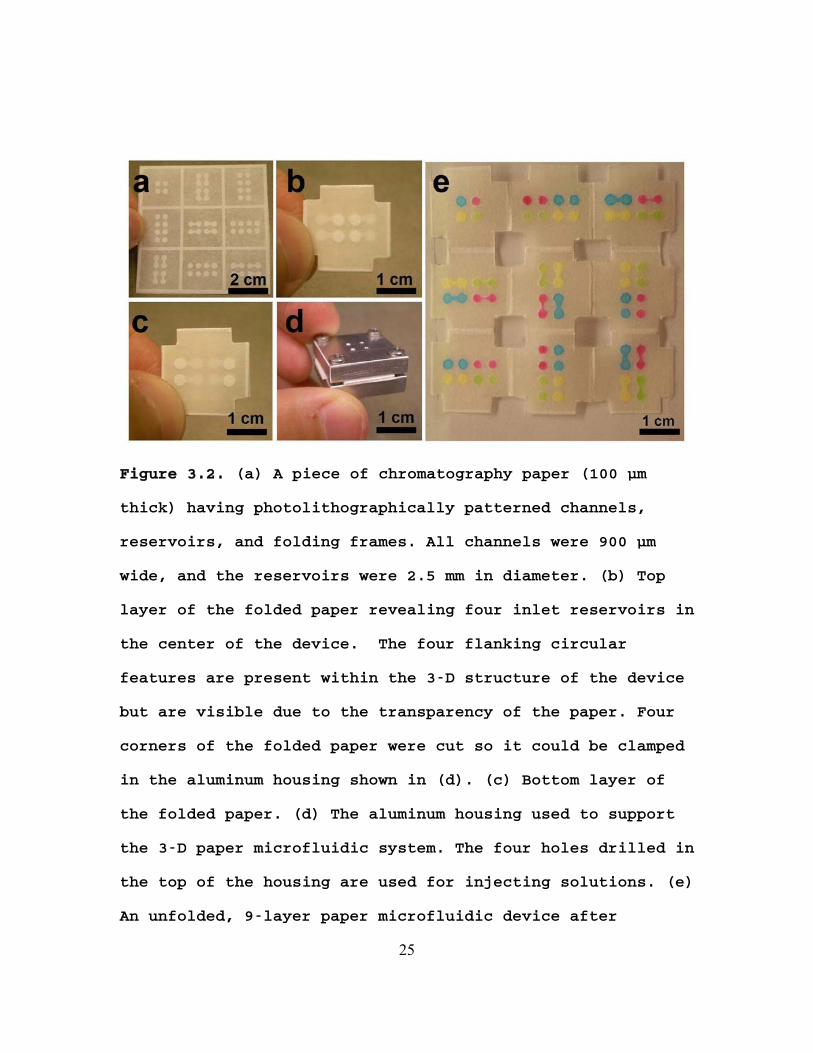
Figure 3.2. (a) A piece of chromatography paper (100 μm
thick) having photolithographically patterned channels,
reservoirs, and folding frames. All channels were 900 μm
wide, and the reservoirs were 2.5 mm in diameter. (b) Top
layer of the folded paper revealing four inlet reservoirs in
the center of the device. The four flanking circular
features are present within the 3-D structure of the device
but are visible due to the transparency of the paper. Four
corners of the folded paper were cut so it could be clamped
in the aluminum housing shown in (d). (c) Bottom layer of
the folded paper. (d) The aluminum housing used to support
the 3-D paper microfluidic system. The four holes drilled in
the top of the housing are used for injecting solutions. (e)
An unfolded, 9-layer paper microfluidic device after
25

injecting four 1.0 mM, aqueous, colored solutions (rhodamine
6G, red; erioglaucine, blue; tatrazine, yellow; and a
mixture of erioglaucine and tatrazine, 1:10, green) through
the four injection ports in the aluminum clamp. The colored
solutions passed through their designated channels and
reservoirs without mixing.
26
Importantly, this origami assembly method does not
require adhesive tape, which can lead to contamination and
nonspecific adsorption.16 Avoiding tape also speeds the
assembly of the device and eliminates the need for laser
cutting. The photoresist pattern serves as the channel wall
to separate solutions into different channels in all three
dimensions. As described previously,18 the vertical
connections are made by direct contact of paper channels or
reservoirs on adjacent layers, and this avoids the use of
cellulose powders.16
The 9-layer device shown in Figure 3.2 was used to
demonstrate the ability of the origami device to direct the
flow of fluids in three dimensions. Specifically, 10.0 μL of
the following four 1.0 mM aqueous solutions were injected
through the openings in the top plate of the clamp:
rhodamine 6G (red), erioglaucine (blue), tatrazine (yellow),
and erioglaucine mixed with tatrazine (1:10, green). After 5
min, the device was unfolded, and, as shown in Figure 3.2e,
the solutions flowed through their designated channels and
reservoirs without mixing. Moreover, there was no observable
nonspecific adsorption of dyes on the channel walls.
As mentioned earlier, every layer of the device can be
used for parallel colorimetric analysis of multiple analytes.
27
This is because the paper can be unfolded after analysis to
reveal a permanent record of the assay. This aspect of the
method might be useful for multiplexed detection and high-
throughput screening. To demonstrate this principle, a two-
analyte colorimetric assay of glucose and protein (bovine
serum albumin, BSA) was carried out using a single 3-D oPAD
device comprised of five layers and assembled by origami.
The experiment was performed as follows. First, the
detection reservoirs (Figures 3.3a and 3.3c) were preloaded
with commercially available reagents for the colorimetric
detection of glucose and BSA, and then the device, including
the reagents, was dried at 20 oC for 30 min. The specific
reactions leading to colorimetric detection are provided in
Figure 3.4. Second, four 5.0 μL aliquots containing
different amounts of glucose and BSA were injected into the
four inlets at the top of the device (Figure 3.3b). The
samples flowed toward the detection reservoirs, and a
portion of these samples were allowed to react with the
preloaded reagents for 10 min. Finally, the paper was
unfolded so that both layers having detection reservoirs
were accessible for colorimetric analysis. The degree of
color change is directly related to the concentration of
glucose or protein in the samples.
28
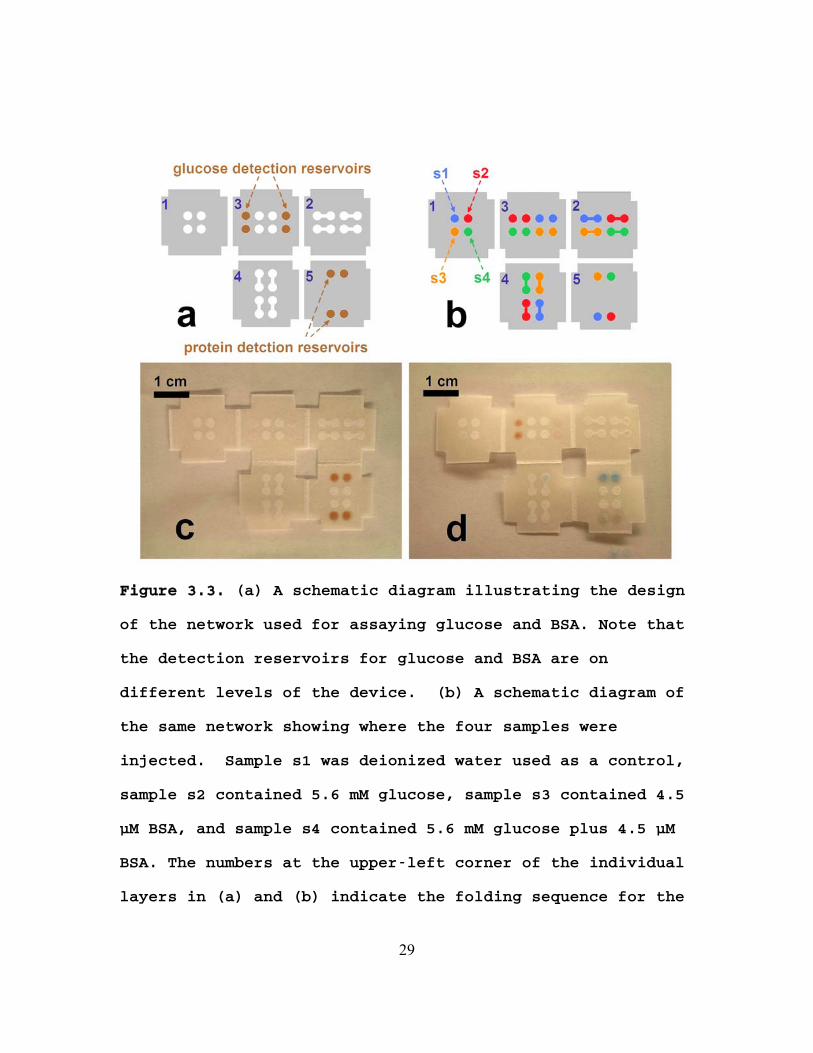
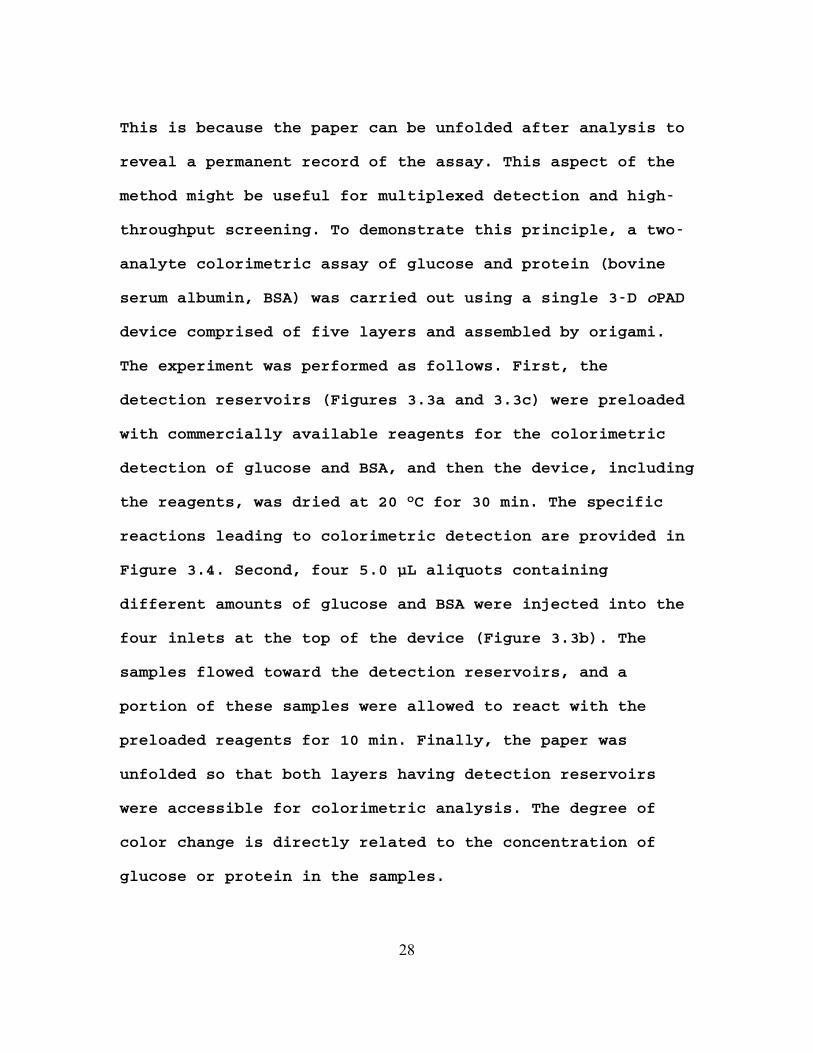
Figure 3.3. (a) A schematic diagram illustrating the design
of the network used for assaying glucose and BSA. Note that
the detection reservoirs for glucose and BSA are on
different levels of the device. (b) A schematic diagram of
the same network showing where the four samples were
injected. Sample s1 was deionized water used as a control,
sample s2 contained 5.6 mM glucose, sample s3 contained 4.5
μM BSA, and sample s4 contained 5.6 mM glucose plus 4.5 μM
BSA. The numbers at the upper-left corner of the individual
layers in (a) and (b) indicate the folding sequence for the
29
device. (c) Photograph of an unfolded device showing the
assay reagents dried in the detection reservoirs. (d) The
unfolded 3-D device after completion of the assay. The color
change from colorless to brown indicated the presence of
glucose in samples s2 and s4. The color change from brown to
blue indicated the presence of BSA in samples s3 and s4. No
color change was observed for control sample s1.
30
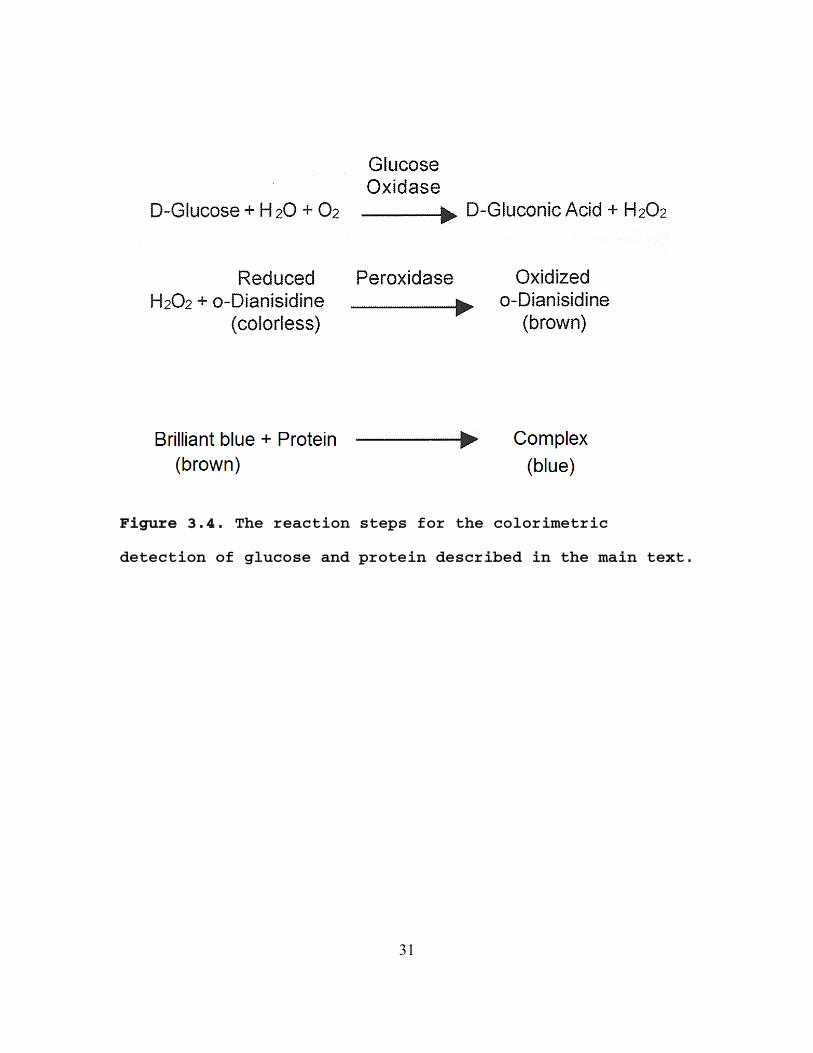
Figure 3.4. The reaction steps for the colorimetric
detection of glucose and protein described in the main text.
31
Comparison of Figures 3.3c and 3.3d indicate that the
assay was successful and that there was no mixing between
channels or reservoirs. Specifically, the color of the
solution in the detection reservoirs exposed to glucose
(samples s2 and s4, Figure 3.3b) or BSA (samples s3 and s4)
changed from colorless to brown or from brown to blue,
respectively. Although only two layers on the device were
required for this very simple colorimetric assay, it is
obvious that more complex analyses could be performed. To
scale up the device for analyzing more analytes or more
samples, additional layers might be required. However, all
layers of the multilayer network are fabricated
simultaneously, so the addition of more layers or more
complex structures does not present much of a practical
barrier.
Fluorescence detection usually provides substantially
higher sensitivity and lower detection limits than simple
colorimetric measurements. However, to the best of our
knowledge, fluorescence detection has not thus far been used
for 3-D μPAD-based assays. Accordingly, we fabricated 3-
layer oPADs (similar to the device illustrated in Figure 3.3,
but with just 3 layers) that could be used to carry out four
simultaneous BSA assays using fluorescence detection. The
32
assay is based on the dye epicocconone, which exhibits
enhanced fluorescence in the presence of BSA (Figure 3.5).72
The assay for BSA using the paper device was carried out as
follows. First, 1.0 μL of a buffered epicocconone solution
was spotted onto each detection reservoir and then dried at
20 oC for 5 min. Second, 3.0 μL aliquots of buffered BSA
solutions were injected into the four inlets at the top of
the device. Third, the oPAD was placed in a humidity chamber
for 30 min, during which time the BSA solutions passed to
the detection reservoirs and reacted with the preloaded
fluorescent dye. Finally, the bottom layer of the device was
scanned using a fluorescence imager. Each scan was performed
at 100 μm resolution and was complete within 1 min.
33
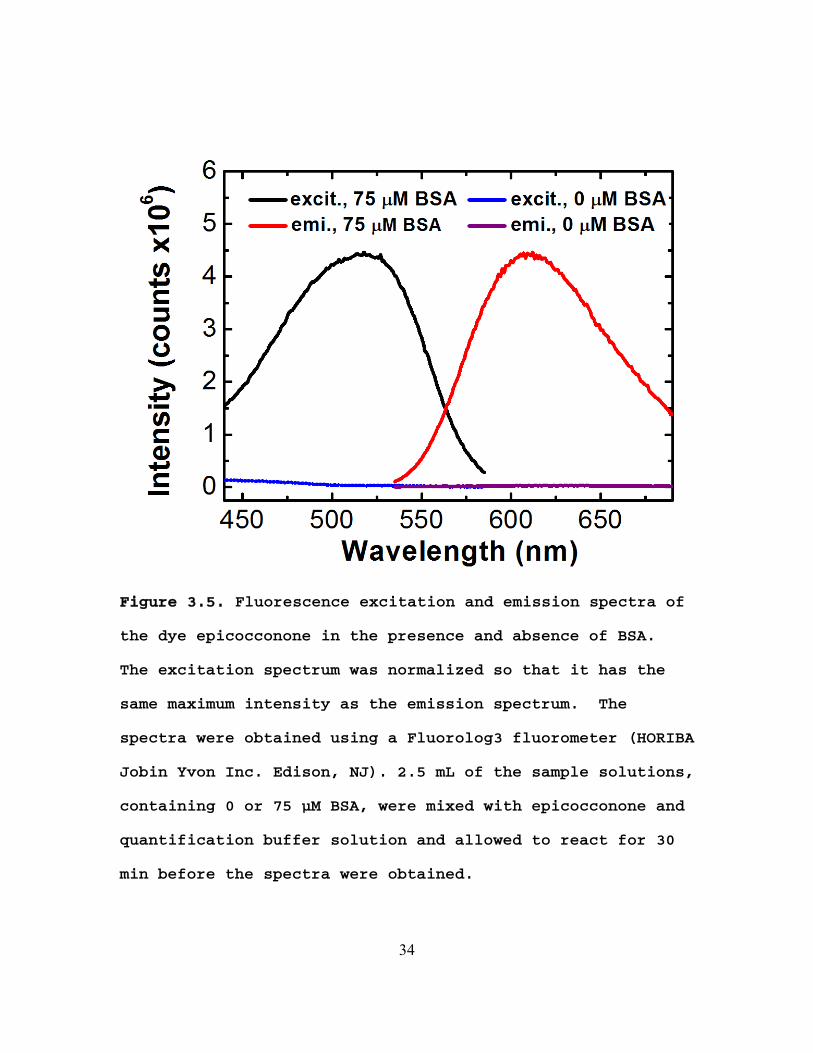
Figure 3.5. Fluorescence excitation and emission spectra of
the dye epicocconone in the presence and absence of BSA.
The excitation spectrum was normalized so that it has the
same maximum intensity as the emission spectrum. The
spectra were obtained using a Fluorolog3 fluorometer (HORIBA
Jobin Yvon Inc. Edison, NJ). 2.5 mL of the sample solutions,
containing 0 or 75 μM BSA, were mixed with epicocconone and
quantification buffer solution and allowed to react for 30
min before the spectra were obtained.
34
Figure 3.6a shows the result of an assay in which all
four BSA aliquots were of the same concentration (3.0 μM),
while in Figure 3.6b the concentrations of BSA were
different (0, 0.75, 1.50 and 3.00 μM). Qualitatively,
Figure 3.6b shows that the color of the detection reservoirs
becomes darker as the concentration of BSA increases. To
quantify these results, the images were imported into Adobe
Photoshop CS2 and transferred to grayscale mode. The mean
fluorescence intensity was determined from the image
histogram for each detection reservoir, and then it was
background-corrected by subtracting the average intensity
measured at the center of the paper where no BSA was present.
These data constitute a calibration curve, which is shown in
Figure 3.6c. The error bars represent the standard deviation
of at least 3 independent measurements. The detection limit,
defined as three times the standard deviation of the sample
containing no BSA (0 μM) divided by the slope of the
calibration curve, is 0.14 μM BSA. Because the fluorescence
intensity, rather than the color change, is directly
proportional to protein concentration, quantification by
fluorescence is more straightforward than colorimetric
detection.
35
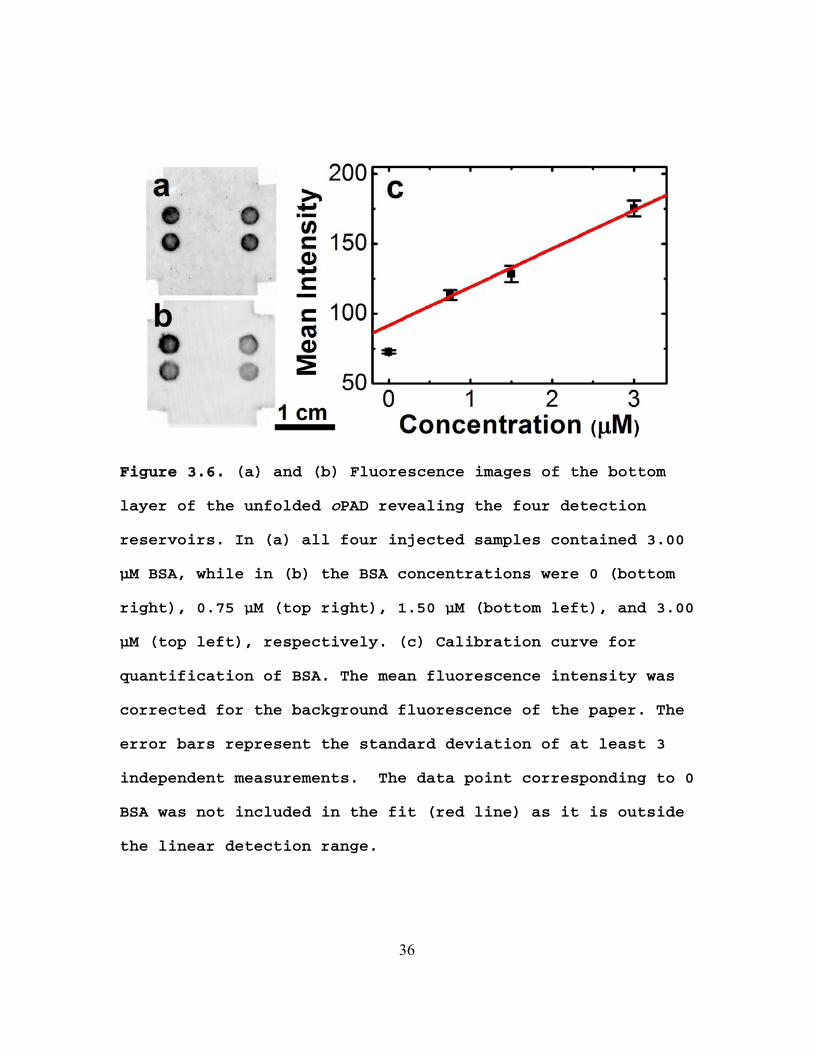
Figure 3.6. (a) and (b) Fluorescence images of the bottom
layer of the unfolded oPAD revealing the four detection
reservoirs. In (a) all four injected samples contained 3.00
μM BSA, while in (b) the BSA concentrations were 0 (bottom
right), 0.75 μM (top right), 1.50 μM (bottom left), and 3.00
μM (top left), respectively. (c) Calibration curve for
quantification of BSA. The mean fluorescence intensity was
corrected for the background fluorescence of the paper. The
error bars represent the standard deviation of at least 3
independent measurements. The data point corresponding to 0
BSA was not included in the fit (red line) as it is outside
the linear detection range.
36
3.5 Summary and Conclusion
To summarize, we have reported an origami-based method
for fabricating 3-D paper microfluidic devices. This method
provides a number of key advantages compared to previously
reported approaches that rely on stacking individual layers
and holding them in place with double-sided tape. First,
origami fabrication only requires one photolithographic
patterning step, regardless of the number of layers.
Therefore, the devices can be made arbitrarily complex
without much additional fabrication overhead. Second, oPADs
can be produced by automated printing techniques and
subsequently assembled without tools. Third, detection
points can be placed on any layer of oPADs, because the
paper can be easily unfolded to reveal them. Fourth, the
resulting permanent record of an assay can be qualitatively
analyzed using the naked eye, or the results can be
quantified using a high-throughput automated scanner. We
believe oPADs will prove promising for applications that
involve low cost and simplicity.
37
Chapter 4: A Paper-Based Electrochemical Sensing Platform
with Integral Battery and Electrochromic Read-out
4.1 Synopsis
In this chapter we report a battery-powered,
microelectrochemical sensing platform that reports its
output using an electrochromic display. The platform is
fabricated based on paper fluidics, and uses a Prussian blue
spot electrodeposited on an indium-doped tin oxide thin film
as the electrochromic indicator. The integrated metal/air
battery powers both the electrochemical sensor and the
electrochromic readout, which are in electrical contact via
a paper reservoir. The sample activates the battery and the
presence of analyte in the sample initiates the color change
of the Prussian blue spot. The entire system is assembled on
the lab bench, without the need for cleanroom facilities.
The applicability of the device to point-of-care sensing is
demonstrated by qualitative detection of 0.1 mM glucose and
H2O2 in artificial urine samples.
4.2 Introduction
In this chapter, we report a versatile
microelectrochemical biosensing platform that is based on
38
paper fluidics and powered by an integral metal/air battery.
The battery powers both the sensing chemistry and an
electrochromic display that provides an optical indication
of the state of the system. The operating voltage of the
device is controlled by the identity of the metal foil used
in the battery. The sensor is activated by application of
artificial urine (AU), which acts both as the matrix for the
analyte and the electrolyte for the battery. The entire
system is assembled on the lab bench without the need for
cleanroom facilities. Taken together, these characteristics
suggest the approach described here is appropriate for
point-of-care (POC) diagnosis and resource-limited sensing.5
Electrochemical methods are widely used for chemical
sensing due to their low cost, low power requirements, and
simplicity.73 Most such devices are based on electrolytic
reactions and hence require a reader powered by either a
battery or line voltage. However, a few self-powered sensors
have also been reported.74-76 The operational basis of the
latter devices is a galvanic reaction that is initiated by
the presence of an analyte which may or may not itself be
redox active. For example, we recently reported a self-
powered sensor in which a galvanic reaction is triggered by
the presence of non-electroactive trypsin.76
39
Recently, microfluidic paper analytical devices (μPADs)
have emerged as a promising solution to the need for low-
cost diagnostic systems.17 The success of μPADs arises from
two main factors: low cost and visual (colorimetric) readout.
However, there is a problem with colorimetric detection: a
unique chemistry must be devised and optimized for every
reaction. Electrochemical systems provide some relief for
this situation, because current replaces the visual readout
signal. This fact has driven the development of microfluidic
paper electrochemical devices (μPEDs), which now have the
capability of detecting multiple analytes via
amperometry.21,22 However, the design principle for μPEDs
that have been reported thus far involves a disposable paper
fluidic system that is controlled and read out using a
conventional potentiostat21,68 or commercial reader.22,77 Note,
however, that in parallel with the development of μPEDs,
research in the field of energy storage has resulted in
paper-based batteries.78,79
The principal advance reported in the present article
is a broadly applicable means for fully integrating μPEDs
with an inexpensive, on-board power source without giving up
the convenience of visual color-based read-out that has
driven the field of μPADs. The operational principles of the
device are illustrated in Figure 4.1. The sensor is powered
40
by a metal/air battery that drives electrolytic reactions in
a paper reservoir defined by a wax frame. Electrical contact
is made to the paper via a pair of transparent indium-doped
tin oxide (ITO) electrodes. The paper is preloaded with a
dried enzyme and Fe(CN)63- or Fe(CN)6
4-. The analysis of
glucose in AU is carried out as follows. First, glucose in
AU is applied to the paper fluidic system, which directs the
sample to the reaction zone. Second, glucose oxidase (GOx)
present in the paper reaction zone catalyzes glucose
oxidation with simultaneous reduction of Fe(CN)63- to
Fe(CN)64-. This process activates conversion of
electrochromic Prussian blue (PB) on the ITO electrode to
colorless Prussian white (PW). As discussed later, a similar
approach is used to detect peroxide.
41
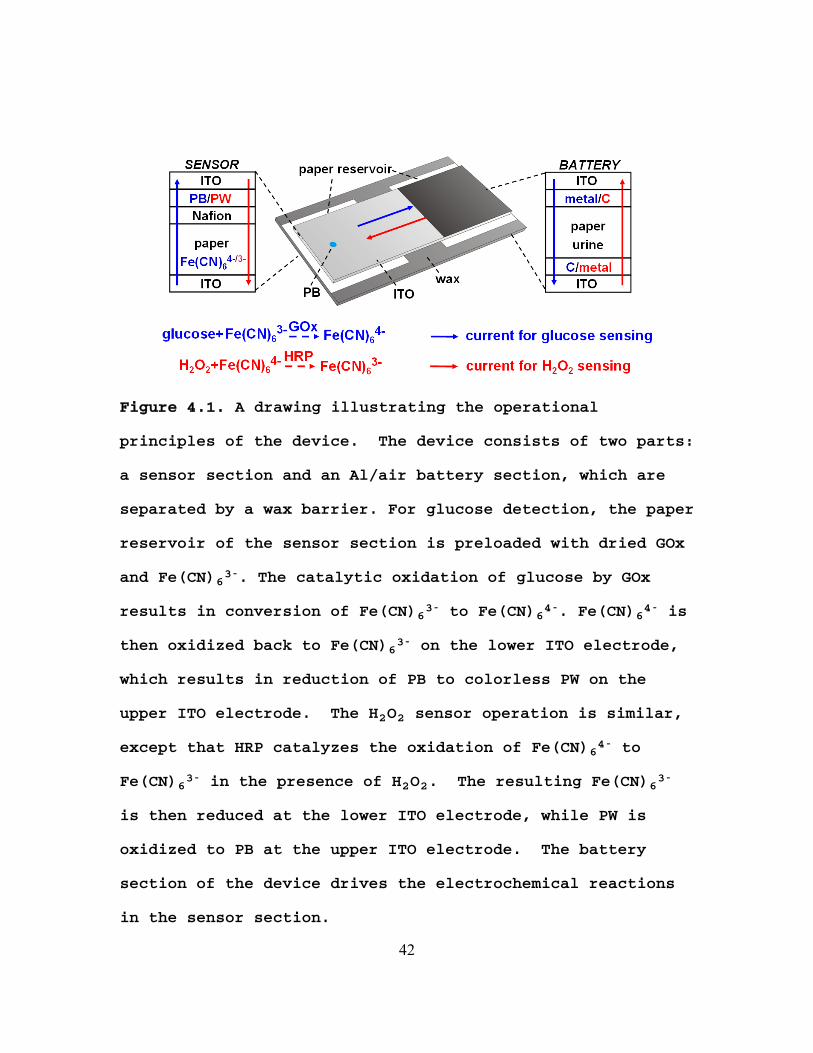
Figure 4.1. A drawing illustrating the operational
principles of the device. The device consists of two parts:
a sensor section and an Al/air battery section, which are
separated by a wax barrier. For glucose detection, the paper
reservoir of the sensor section is preloaded with dried GOx
and Fe(CN)63-. The catalytic oxidation of glucose by GOx
results in conversion of Fe(CN)63- to Fe(CN)6
4-. Fe(CN)64- is
then oxidized back to Fe(CN)63- on the lower ITO electrode,
which results in reduction of PB to colorless PW on the
upper ITO electrode. The H2O2 sensor operation is similar,
except that HRP catalyzes the oxidation of Fe(CN)64- to
Fe(CN)63- in the presence of H2O2. The resulting Fe(CN)6
3-
is then reduced at the lower ITO electrode, while PW i
oxidized to PB at the upper ITO electrode. The battery
section of the device drives the electrochemical reactions
in the sensor section.
s
42
4.3 Experimental
Chemicals and materials. ITO electrodes were obtained
from Delta Technologies (Loveland, CO), and cut into 25 mm x
10 mm pieces using a glass cutter. Conductive carbon ink,
thinning solution (Creative Materials, Inc. Tyngsboro, MA),
and activated carbon (Sigma-Aldrich) were used to fabricate
the battery cathode. Zn, Co, Pb (Alfa Aesar), Cu (Sigma
Aldrich), and Al (Reynolds Wrap, Fisher Scientific) foils
were used to fabricate the battery anode. A Sharpie wax
pencil (Fisher Scientific) was used for patterning the
sensing area on chromatographic paper (Grade 1, Whatman).
Glucose oxidase was obtained from MP Biomedicals (Solon, OH)
and horseradish peroxidase was purchased from Sigma Aldrich.
D-glucose and 30% H2O2 solution were obtained from Fisher
Scientific. FeCl3•6H2O, K3Fe(CN)6, and K4Fe(CN)6 were
obtained from Acros Organics. All chemicals necessary for
preparing the AU were from Sigma-Aldrich. A Nafion membrane
(N-115, Fuel Cell Store, Inc., Boulder, CO) was used to
separate the anodic and cathodic reactions in the sensing
reservoir while maintaining ionic conductivity. All
solutions were prepared with deionized water (18.0 MΩ•cm,
Milli-Q Gradient System, Millipore). All reagents were used
as received.
43
Artificial urine. AU was prepared according to a
previously published procedure.16 It contained 1.1 mM lactic
acid, 2.0 mM citric acid, 25 mM sodium bicarbonate, 170 mM
urea, 2.5 mM calcium chloride, 90 mM sodium chloride, 2.0 mM
magnesium sulfate, 10 mM sodium sulfate, 7.0 mM potassium
dihydrogen phosphate, 7.0 mM dipotassium hydrogen phosphate,
and 25 mM ammonium chloride. The pH was adjusted to 6.0
using 1.0 M HCl.
Prussian blue. Electrodeposition of PB on an ITO
electrode was carried out as follows. First, a 1-mm thick
poly(dimethylsiloxane) (PDMS) slab was prepared by pouring
premixed PDMS precursor (Sylgard 184, Dow Corning, Midland,
MI) into a plastic petri dish (Fisher Scientific) and curing
at 80 oC in a convection oven for 2 h. Second, a 1.2 mm-
diameter hole was punched into the slab using a 16-gauge
syringe needle to yield a mask. Third, electrodeposition of
PB through the mask and onto the ITO was carried out using a
previously reported procedure.80 Briefly, a plating solution
containing 2.6 mM HCl, 10 mM K3Fe(CN)6, and 10 mM FeCl3 was
freshly prepared, and then a 100 μL aliquot was dropcast
into the hole in the mask. Electrodeposition was carried
out for 60 s at a constant cathodic current of 0.4 μA/mm2
using a Ag/AgCl reference electrode, a Pt counter electrode,
and a CHI 760B potentiostat (CH Instruments, Austin, TX).
44
After deposition, the mask was removed, the ITO electrode
was, washed with deionized water, and then it was dried
under nitrogen gas.
Battery. The battery cathode was fabricated using a
mixed carbon material containing 1 g of activated carbon, 4
g of conductive carbon ink, and 2 g of thinning solution.
The carbon material was coated onto half of an ITO electrode
using a Meyer rod (R.D. Specialties, Inc. Webster, NY). The
carbon electrode was then cured at 80 oC in a convection
oven for 30 min. The battery anode was fabricated by
attaching a piece of metal foil (5 mm x 5 mm) onto an ITO
electrode. The open-circuit voltage (OCV) and short-circuit
current (SCC) of the batteries were measured using a CHI
760B potentiostat in a two-electrode mode. The SCC was
measured with one electrode held at 0 V relative to the
other.
Sensors. The paper reservoirs (10 mm x 10 mm) for the
sensing and battery modules were fabricated using a wax
pencil and a ruler. The hydrophobic walls of the reservoirs
were fabricated by drawing on the chromatographic paper
using the wax pencil guided by the ruler. The paper was then
placed on a hot plate (80 oC for 10 min) to melt the wax so
that it penetrated into the paper layer. The paper was then
cooled to 20 oC. For glucose sensing, 40 μL of a solution
45
containing 125 mM K3Fe(CN)6 and 500 U glucose oxidase in
0.01 M PBS buffer (pH 7.4) was dropcast onto the paper
electrochemical cell and then dried at 20 oC. For H2O2
sensing, 40 μL of a solution containing 125 mM K4Fe(CN)6 and
100 U horseradish peroxidase in 0.01 M PBS buffer (pH 7.4)
was dropcast onto the paper electrochemical cell and then
dried at 20 oC.
The sensors for glucose and H2O2 were fabricated by
sandwiching the paper, which defined the sensing and battery
reservoirs, between two ITO electrodes. A Nafion membrane
was used to separate the sensing reagents from the ITO
electrode on which the PB or PW spot was immobilized. A
binder clip was used to clamp the ITO electrodes so that all
layers were in contact with one-another. Electrochemical
sensing was initiated after injecting the sample (contained
in AU) into the sensing reservoir. Upon injection of battery
electrolyte, the battery was then activated to report the
sensing result.
4.4 Results and Discussion
Device overview. Figure 4.2a shows cyclic
voltammograms (CVs) of ITO electrodes in 0.01 M PBS buffer
(pH 7.4) and AU. In both cases no significant current is
observed between 1.2 V and -0.6 V (vs. Ag/AgCl). However,
46
when a thin film of PB is electrodeposited on the ITO
electrode,80 a pair of redox peaks is observed at 0.207 V
and 0.158 V. These are due to the reversible interconversion
of PB (blue) to PW (clear, at more negative potentials).80
When one ITO electrode modified with PB or PW is used
to construct a two-electrode cell with a second, naked ITO
electrode, the reduction of PB to PW can be used to visually
report an oxidation reaction occurring on the naked ITO
electrode. Likewise, the oxidation of PW to PB can be used
to visually report a cathodic reaction on the naked ITO
electrode. This is an important property of the device shown
in Figure 4.1, and it is implemented here by separating the
anode and cathode with a thin film of Nafion.
47
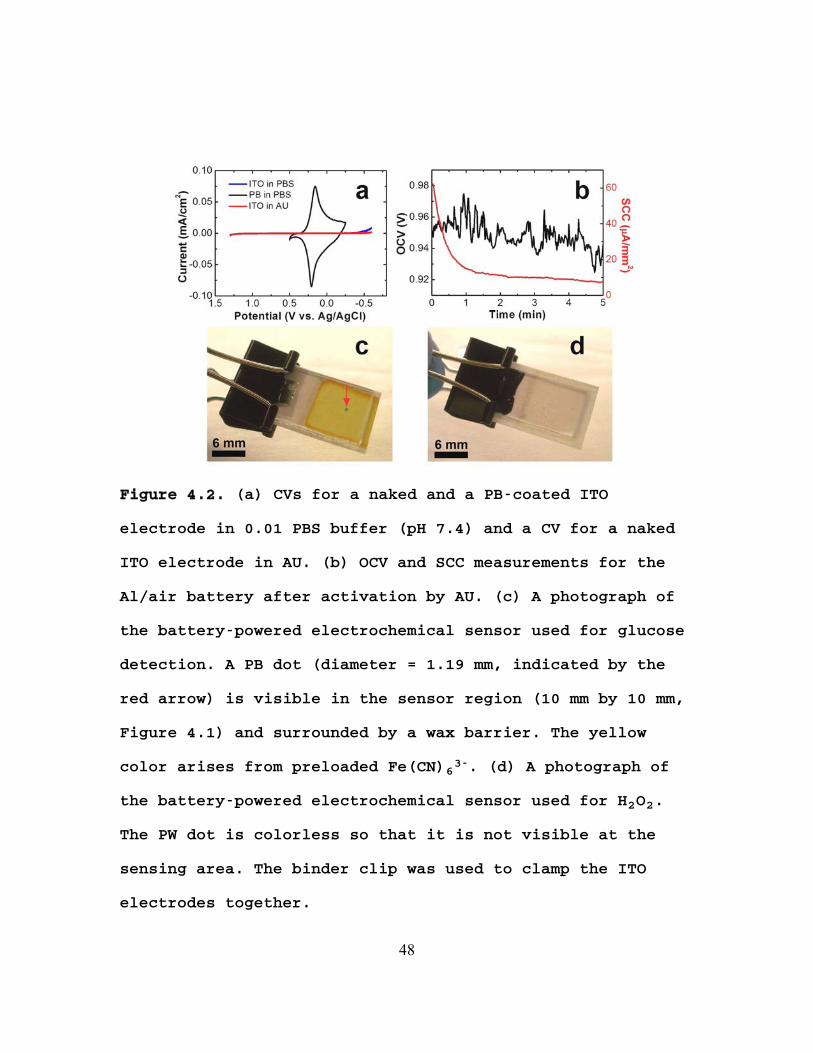
Figure 4.2. (a) CVs for a naked and a PB-coated ITO
electrode in 0.01 PBS buffer (pH 7.4) and a CV for a naked
ITO electrode in AU. (b) OCV and SCC measurements for the
Al/air battery after activation by AU. (c) A photograph of
the battery-powered electrochemical sensor used for glucose
detection. A PB dot (diameter = 1.19 mm, indicated by the
red arrow) is visible in the sensor region (10 mm by 10 mm,
Figure 4.1) and surrounded by a wax barrier. The yellow
color arises from preloaded Fe(CN)63-. (d) A photograph of
the battery-powered electrochemical sensor used for H2O2.
The PW dot is colorless so that it is not visible at the
sensing area. The binder clip was used to clamp the ITO
electrodes together.
48
As shown in Figure 4.2c, the PB reporter dot used in
this work was 1.19 mm in diameter, and it was
electrodeposited on the ITO electrode through a hole punched
on a PDMS thin film at a current density of 0.4 μA/mm2 for
60 s (24 μC/mm2). Unlike some colorimetric reagents, PB is
stable indefinitely under ambient conditions. The total
charge used to deposit the PB spot for each device reported
here was uniform to ensure reproducible color changes.
Importantly, the amount of charge stored in the PB or PW
spot can be adjusted to match the detection limit and range
of the sensor for specific clinical needs. Under optimal
conditions, the relationship between the diameter of the PB
or PW spot (d in mm) and the lowest detectable concentration
(C in M) of analyte having a particular volume (V in L) is
given by eq 1.
)1(
4
2
nFV
QdaC
Here, Q is the charge density required for color
transition of PB or PW in C/mm2, n is the number of
electrons transferred for the sensing reaction, F is the
Faraday constant, and a is a dimensionless empirical
constant, which is larger than unity and related to
experimental conditions such as sensing time, mass transfer,
49
and enzyme activity. For the devices reported here, C is
given by eq 2.
(2) 1096.6104.88 626 aadC
The metal/air battery used in this work was easily
fabricated using a piece of metal foil as the anode, high-
surface area activated carbon as the cathode for oxygen
reduction, and paper as the separator. The same ITO
electrodes used for sensing were used as the current
collectors for the battery. The battery was activated
immediately prior to sensing by injecting 40 μL of AU onto
the paper reservoir. This eliminates the possibility of
discharge during long-term storage, and the use of AU as
both the battery electrolyte and sample matrix streamlines
use of the sensor. Note that activation of a paper-based
battery with AU has been reported previously.81,82 The
voltage provided by the battery depends on the identity of
the metal-foil anode. As shown in Figure 4.3, the open
circuit voltages (OCV) for batteries, using Zn, Co, Pb, and
Cu foils as the anodic materials, were 1.1, 0.68, 0.56 and
0.25 V, respectively, and the short-circuit currents (SCC)
increased with increasing battery voltages (Figure 4.4). In
the present study, a 5 mm x 5 mm piece of Reynolds Wrap Al
foil was used as the anode for all sensors. The per-sensor
cost of the foil is $US 0.00006, and the total cost for each
50
battery, including the ITO current collectors, is $US 0.95.
As shown in Figure 4.2b, the average OCV of the Al/air
battery was about 0.94 V with a maximum peak-to-peak
variation of 50 mV over a period of 5 min. The SCC onset
current was 60 μA/mm2 and decreased to 8 μA/mm2 after 5 min.
For applications other than those described here, it might
be advantageous to use different metals in the battery to
lower its voltage and thereby avoid background redox
processes.
51
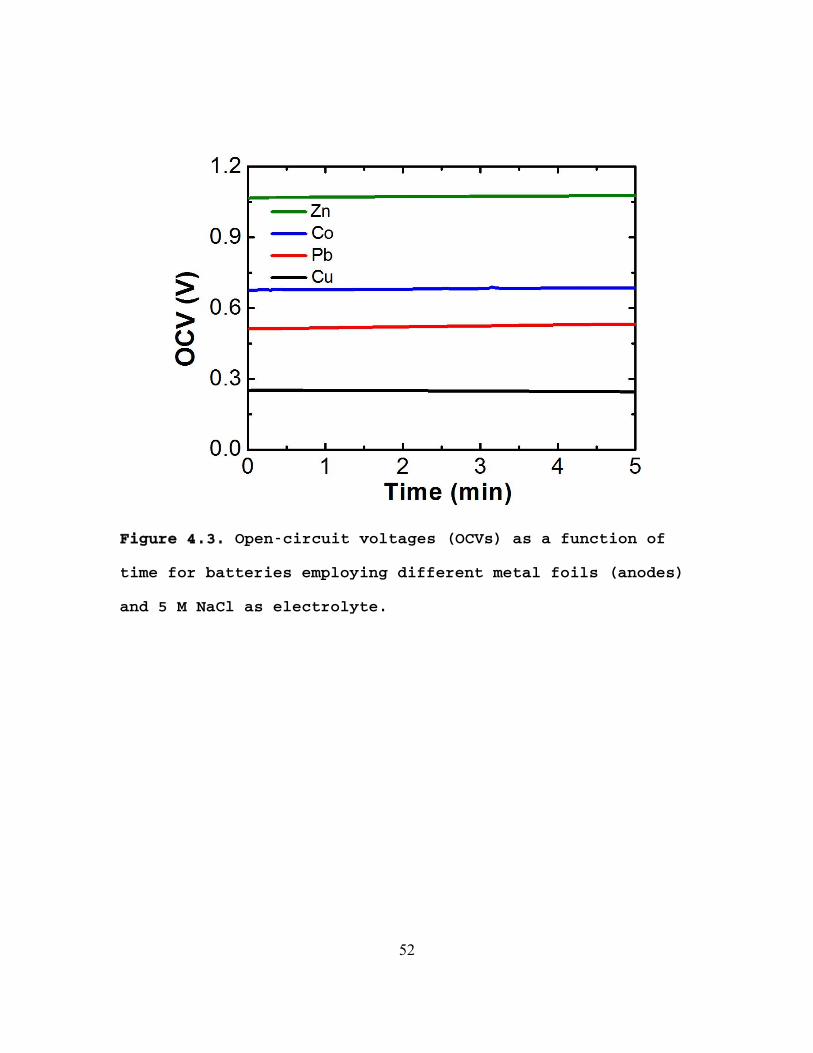
Figure 4.3. Open-circuit voltages (OCVs) as a function of
time for batteries employing different metal foils (anodes)
and 5 M NaCl as electrolyte.
52
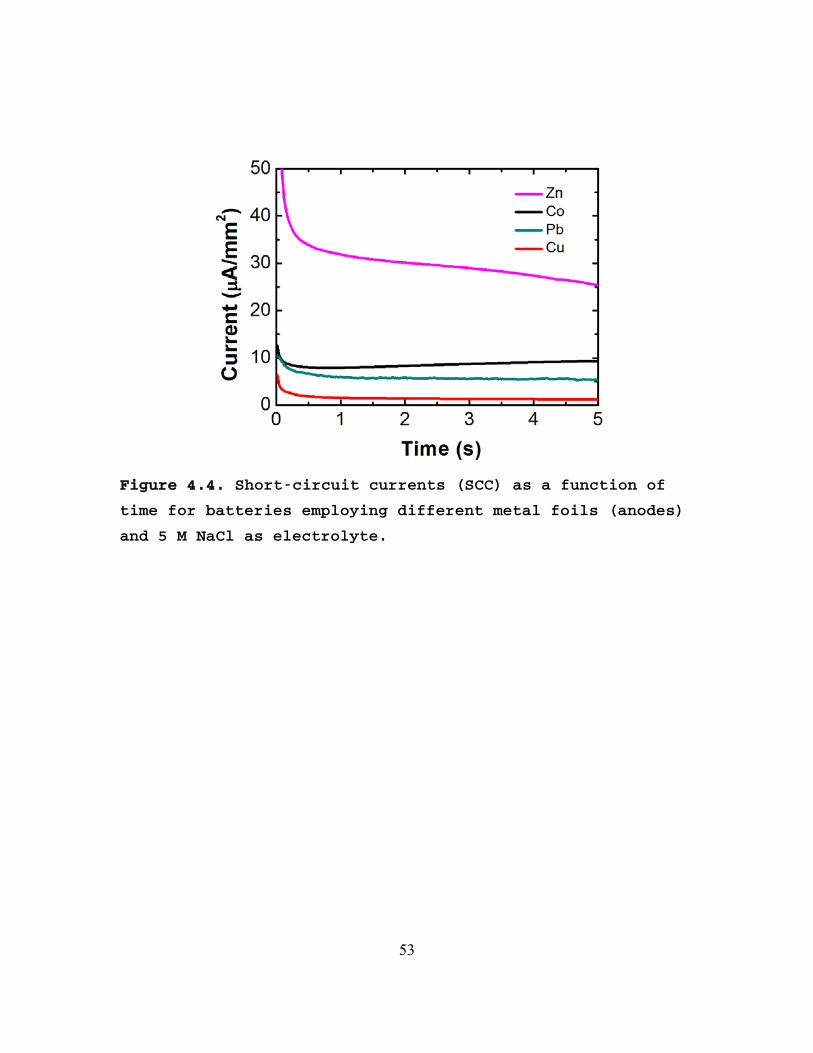
Figure 4.4. Short-circuit currents (SCC) as a function of
time for batteries employing different metal foils (anodes)
and 5 M NaCl as electrolyte.
53
The sensors shown in Figures 4.2c and 4.2d were
configured for detection of glucose and H2O2, respectively.
The two ITO electrodes were clamped together using a binder
clip to ensure reproducible contact between the different
layers in the sensor. The top row of micrographs in Figure
4.5 show the electrochromic reporting areas of a glucose
sensor before and after injecting 40 μL of an AU sample
containing 0.10 mM glucose. The results from a glucose-free
injection are also shown. After injecting the 0.10 mM
glucose sample, the PB spot turned from blue to colorless,
as shown in Figure 4.5b. However, under otherwise identical
conditions the glucose-free control sample had no effect on
the color of the PB spot (Figures 4.5c and 4.5d).
Prior to use of the device for H2O2 sensing, the PB spot was
reduced to PW (colorless) by holding the potential of the
ITO electrode at -0.8 V vs. the other ITO electrode for 60 s
in 0.01 M PBS buffer (pH 7.4). A slight coloring of the PW
spot is present in Figure 4.5e, and this is due to air
oxidation during the device fabrication process. Next, 40 μL
AU samples containing 0.10 mM H2O2, or a H2O2-free solution,
were injected onto the paper defining the sensing areas. The
color of PW spot turned from nearly colorless to blue for
the sample containing 0.10 mM H2O2 (Figure 4.4f), but no
54

color change was observed for the control sample (Figures
4.5g and 4.5h). The lowest detectable concentration of H2O2
and glucose was 0.10 mM, and therefore, according to eq 2,
the empirical constant a is 14.4 for these sensors.
55
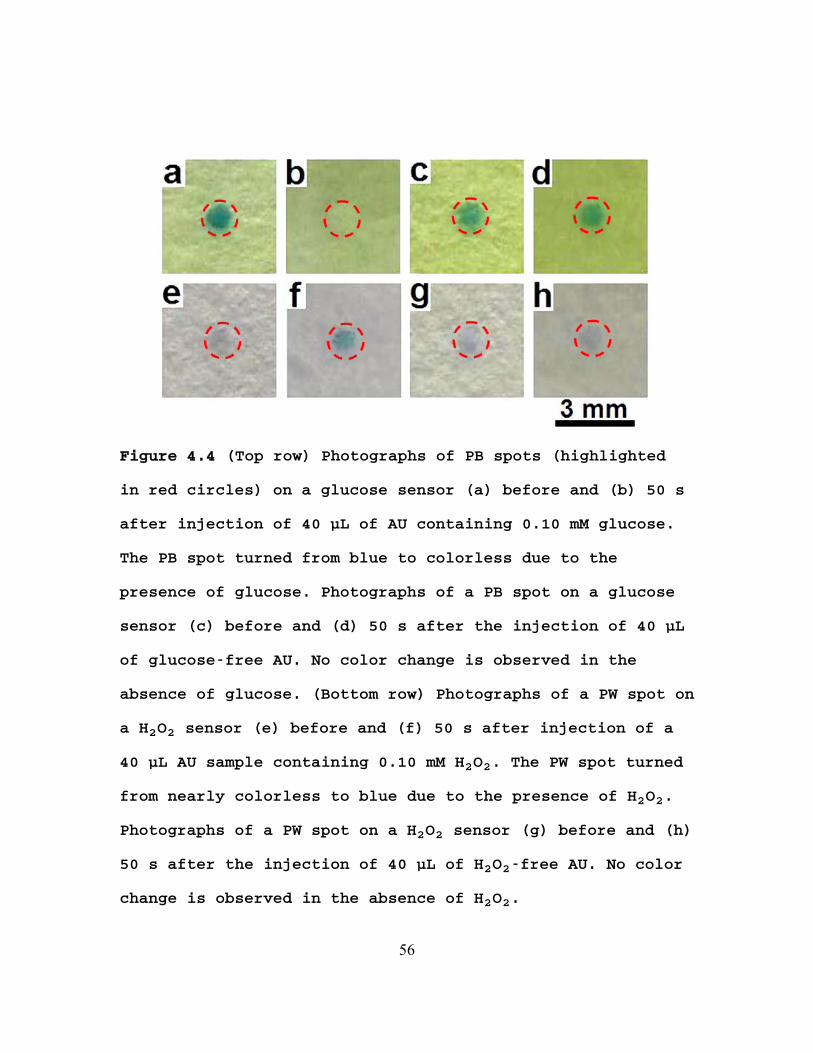
Figure 4.4 (Top row) Photographs of PB spots (highlighted
in red circles) on a glucose sensor (a) before and (b) 50 s
after injection of 40 μL of AU containing 0.10 mM glucose.
The PB spot turned from blue to colorless due to the
presence of glucose. Photographs of a PB spot on a glucose
sensor (c) before and (d) 50 s after the injection of 40 μL
of glucose-free AU. No color change is observed in the
absence of glucose. (Bottom row) Photographs of a PW spot on
a H2O2 sensor (e) before and (f) 50 s after injection of a
40 μL AU sample containing 0.10 mM H2O2. The PW spot turned
from nearly colorless to blue due to the presence of H2O2.
Photographs of a PW spot on a H2O2 sensor (g) before and (h)
50 s after the injection of 40 μL of H2O2-free AU. No color
change is observed in the absence of H2O2.
56
4.5 Summary and Conclusion
We have reported the first paper-based
microelectrochemical sensing platform that incorporates an
integral power source. The on-board metal/air battery
powers both the sensing reactions and the color conversion
of the electrochromic spot used for read-out. The voltage
provided by the battery is easily controlled by changing the
identity of the metal foil, which means that different redox
processes can be used for both the sensing chemistry and the
electrochromic read-out. The detection limit and dynamic
range of the sensor is controlled by matching the amount of
charge stored in the PB/PW spot to the clinical threshold
values required for different biomarkers. The fabrication of
the sensor is very simple and does not require cleanroom
facilities. The cost of the sensor, including the integral
battery, is very low.
Here we have focused on using the device for obtaining
qualitative results. However, studies presently underway
are focused on quantitative detection of more realistic
biomarkers over a broader range of analyte concentrations.
It will also be possible to replace the ITO current
collectors in the next generation of this platform, so that
the entire device is constructed of paper. These
57

enhancements will improve the likelihood that this type of
sensing platform will be useful for point-of-care clinical
diagnosis and electrochemical sensing under resource-limited
conditions.
58
Chapter 5: Aptamer-based Origami Paper Analytical Device
for Electrochemical Detection of Adenosine
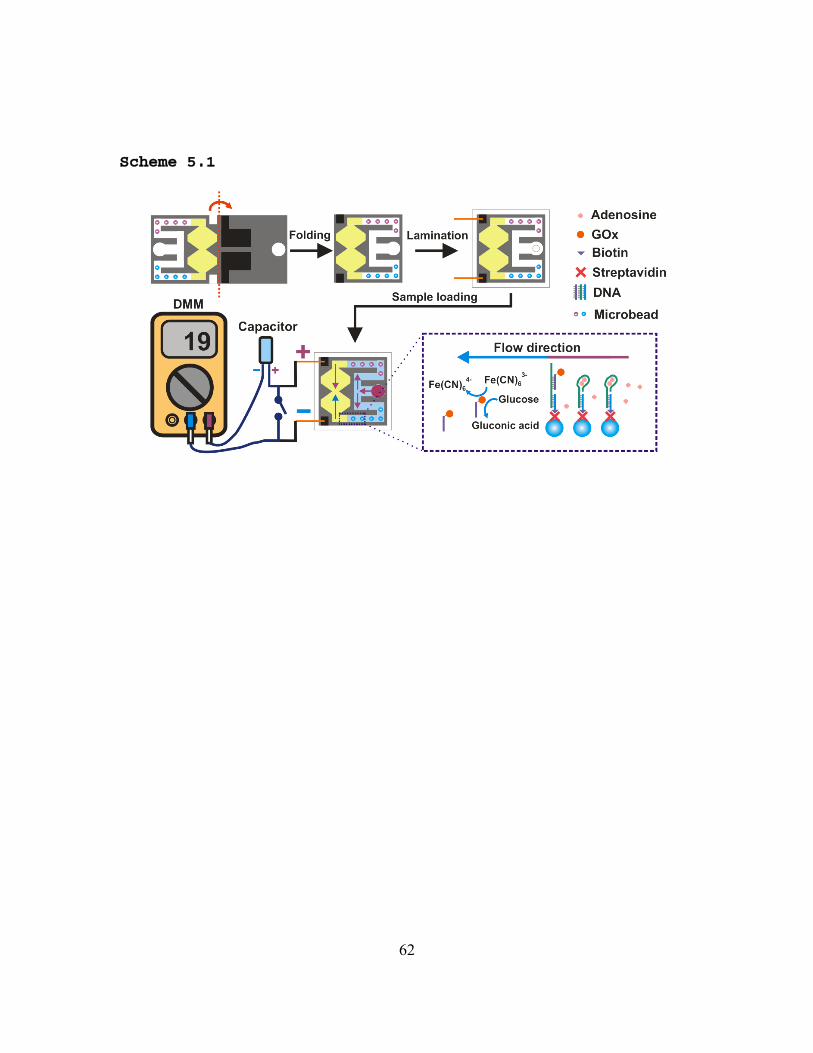
5.1 Synopsis
Here we report a self-powered origami paper analytical
device (oPAD) that uses an aptamer to recognize an analyte,
a glucose oxidase (GOx) tag to modify the relative
concentrations of an electroactive redox couple, and a
digital multimeter (DMM) to transduce the result of the
assay. The sensor is self-powered in that it self-generates
an electrical signal so that the read-out process is similar
to testing a battery. The principle of the sensor is
illustrated in Scheme 5.1. Briefly, the device is printed on
a single piece of paper, folded into a three-dimensional (3D)
configuration, and then laminated in plastic. An aliquot of
sample is loaded at the inlet, split into two channels, and
then directed to microbeads entrapped within the channels.
In one channel, an aptamer immobilized on microbeads binds
to the target and releases a GOx-labeled DNA strand that
flows downstream. No aptamer is present on the microbeads in
the other channel, which is used as a control. The split
fluids terminate in an hour-glass-shaped, two-compartment
electrochemical cell. The waist of the hour glass serves as
a salt bridge between the two half cells. In one of the half
59
cells, GOx catalyzes the oxidation of glucose, which in turn
results in conversion of Fe(CN)63- to Fe(CN)6
4-. The
difference in concentrations of Fe(CN)63- and Fe(CN)6
4- in
the sensing half cell and control half cell results in a
voltage that is used to charge a capacitor. When the switch
(lower part of Scheme 5.1) is closed, the capacitor
discharges through the DMM. The capacitor provides a high
instantaneous current, in effect an amplified current, and
hence a higher sensitivity than a direct current measurement.
5.2 Introduction
In this chapter, we report a self-powered origami paper
analytical device (oPAD) that uses an aptamer to recognize
an analyte, a glucose oxidase (GOx) tag to modify the
relative concentrations of an electroactive redox couple,
and a digital multimeter (DMM) to transduce the result of
the assay. This device and its operational features are
important for five reasons. First, the aptamer is
immobilized on microbeads trapped within the paper fluidic
channel. This design greatly simplifies probe introduction,
compared to direct immobilization on paper,83 because
existing bead immobilization and characterization methods
can be used for a range of different probe families
including aptamers, DNAzymes,84-88 and antibodies. Second, as
60
configured in this device, bead immobilization eliminates
the need for a washing step. Third, although aptamers and
other nucleic acid probes have been used on test strips,89,90
they have not been integrated with fluidic devices using
patterned paper. Aptamers can bind to a wide range of
targets, including those (like the adenosine target we
report) that are not immunogenic.84-86 Moreover, nucleic acid
probes are generally more stable than those based on
proteins.5 Fourth, the transducer is based on a
concentration cell, which acts like a battery to charge a
capacitor that is subsequently read-out using a DMM. The
latter has a very wide dynamic range, and the use of the
capacitor results in a quantitative response that yields a
17-fold enhancement of sensitivity compared to a direct
current measurement. Finally, the device is encapsulated in
plastic using impulse edge thermal lamination, which solves
many problems, including fluid evaporation, reagent
deactivation, and device contamination.
61
Scheme 5.1
62
Paper fluidics have their genesis in the lateral flow
test strip, which was first released commercially by Unipath
in 1988 in the form of a home pregnancy test kit.91 The low
cost and ease of use of this family of devices ensured an
expansion in the number of types of assays available,
particularly for point-of-care applications.5 In 2007,
Whitesides and coworkers added functionality to the basic
lateral flow design by developing a means for dividing the
paper substrate into hydrophilic and hydrophobic regions.4
These types of devices are now known as microfluidic paper
analytical devices (μPADs).17,18,21,92-97 In 2008, Whitesides
and co-workers introduced 3D PADs, which were constructed by
alternating layers of patterned paper and double-sided
tape.16 These devices introduced even more functionality,
but the fabrication method does not lend itself to mass
production. More recently, we reported an origami-based
method that resolves the fabrication problems associated
with multi-level PADs.98 Origami PADs (oPADs) are
fabricated (patterned) on a single sheet of chromatography
paper and then folded into a 3D fluidic architecture using
simple principles of origami (no adhesive tape or scissors
are permitted).
63
Most paper-based assays transduce the
sensing/recognition chemistry using colorimetry,95,98
fluorescence,98 or electrochromism.99 Therefore image
recording using a camera or scanner, a computer, and
appropriate software are required for quantification and
unambiguous analyte determination.95,98 These add time, cost,
complexity, and uncertainty (i.e. variation of light) to the
assay. Electrochemical methods have also been used to
transduce signals from paper-based devices.21,68 Such
experiments normally involve a potentiostat, which limit
applications for POC testing. Handheld readers have
alleviated this drawback, and in particular, μPADs have been
integrated with personal glucose meters (PGM).22 However,
the sensing chemistry in that case is based on direct
oxidation of analytes using the relevant oxidases or
dehydrogenases, and the applicability of such sensors to a
specific analyte is limited by the availability of the redox
enzyme. Note also that the PGM is designed to detect glucose
in the millimolar concentration range, and thus requires
significant signal amplification for trace analysis.77
5.3 Experimental
Chemicals and materials All DNA was ordered from
Integrated DNA Technologies, Inc. Streptavidin-labeled
64
glucose oxidase (sGOx) was purchased from Rockland
Immunochemicals, Inc. (Gilbertsville, PA). Streptavidin-
coated polystyrene microbeads and fluorescent polystyrene
microbeads with Nile red inside were purchased from
Spherotech, Inc. (Lake Forest, IL). Adenosine and Glucose
oxidase (GOx) from Aspergillus niger were obtained from
Sigma Aldrich. D-glucose and K3Fe(CN)6 was purchased from
Fisher Scientific. All solutions were prepared with
deionized water (18.0 MΩ·cm, Milli-Q Gradient System,
Millipore). Conductive carbon ink (Creative Materials, Inc.
Tyngsboro, MA) was used to fabricate electrodes using a
coating kit (RD Specialties, Inc. Webster, NY). All paper
fluidic devices were fabricated using Grade 1 Whatman
chromatographic paper. Scotch thermal laminating pouches
(TP5851-20) and a Jorestech impulse thermal edge sealer were
used for thermal lamination of the device. A 2.2 μF
electrolytic capacitor, a switch, and a breadboard with
jumper wires were obtained from RadioShack. All reagents and
materials were used as received.
Experimental procedures The patterning of paper is
based on a slight modification of a wax printing procedure
reported previously.11 Briefly, a Xerox 8570DN inkjet
printer was used to print wax-based solid ink on Whatman
chromatography paper. The paper was then placed on a hot
65
plate with the wax side up for 15 s at 120 oC, and then
cooled to 20 OC. For fabricating electrodes, the patterned
paper was placed on a flat glass surface, and then covered
with a home-made stencil. An aliquot of carbon ink was
dropcast on the stencil. A coating rod was used to coat the
carbon ink uniformly onto the patterned paper through the
stencil. To cure the carbon ink, the stencil was removed
from the paper, and the paper was placed in an oven at 80 OC
for 30 min.
For preparing GOx-labeled DNA, 12.5 μM biotin-modified
DNA (bDNA) solution was mixed with a 100 μM streptavidin-
labeled GOx (sGOx) solution to yield a solution containing
1:1 bDNA and sGOx. The sGOx solution also contains 10 mg/mL
bovine serum albumin (BSA) as a stabilizer and 0.1 mg/mL
sodium azide as a preservative. After reaction for 24 h, an
Amicon 50 K centrifugal filter (Millipore) was used to
separate the GOx-labeled bDNA from free bDNA by centrifugal
filtering. All solutions were diluted to the same volume for
UV-vis characterization, which leads to a concentration of
0.46 μM for both bDNA and sGOx solutions. The UV-vis spectra
were taken using a UV-vis spectrometer (Hewlett-Packard
8453).
As shown in Figure 5.1, the characteristic maximum
absorptions of protein and DNA are at 280 nm and 260 nm
66
respectively. Note that the absorption of sGOx at 280 nm is
significantly higher than that of bDNA at 260 nm at the same
concentration due to the difference in extinction
coefficients and excess BSA in the sGOx solution. For a
solution containing both sGOx and bDNA at a 1:1 molar ratio,
the absorption at 260 nm was higher than that of the
solution containing only sGOx due to the presence of bDNA in
the solution. After filtration using a 50 k cut-off
centrifugal filter, all the sGOx-labeled bDNA was maintained
in the retentate, but the free bDNA passed the filter into
the filtrate. The absorption of the retentate at 260 nm was
obviously higher than that of the solution containing only
sGOx, which demonstrates the formation of the bDNA-sGOx
conjugate that was left in the retentate. The absorption of
the retentate overlapped with the absorption of the 1:1 sGOx
and bDNA mixture, which demonstrates that the ratio of sGOx
to bDNA in the final product was approximately 1:1. This
agrees with the fact that the absorption of the filtrate at
260 nm was very small. Therefore, almost all bDNA binds to
sGOx with minimal free bDNA in the filtrate.
67
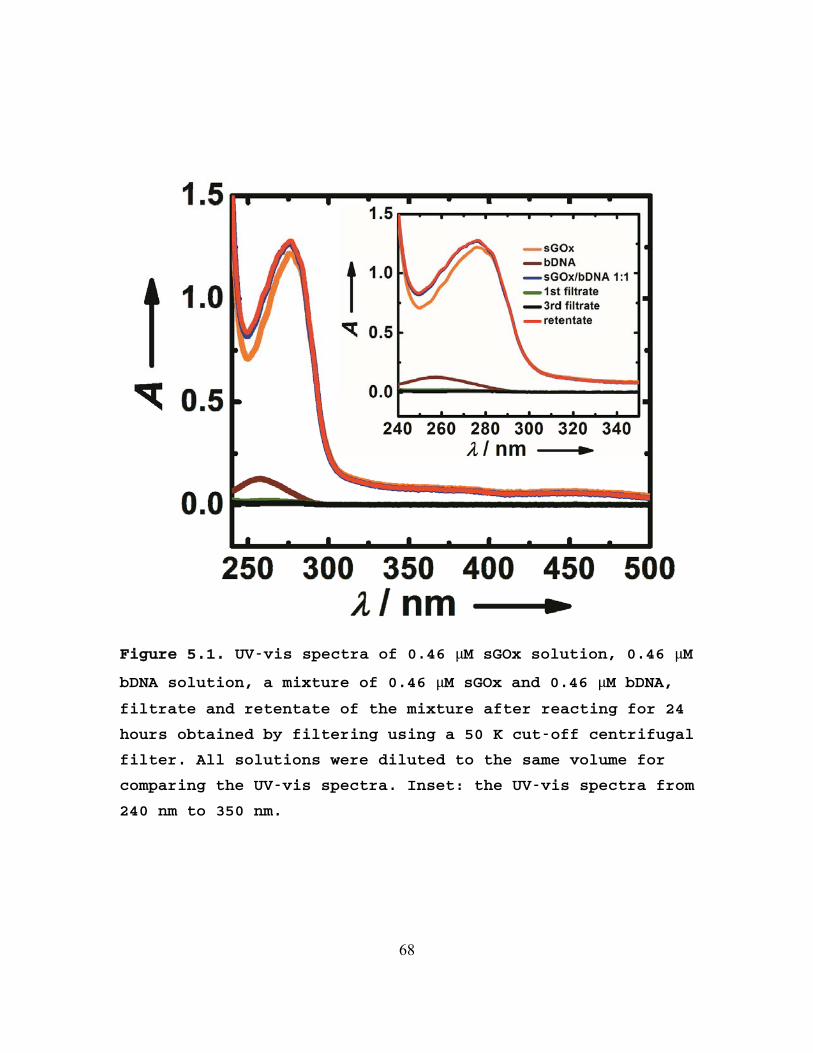
Figure 5.1. UV-vis spectra of 0.46 μM sGOx solution, 0.46 μM
bDNA solution, a mixture of 0.46 μM sGOx and 0.46 μM bDNA,
filtrate and retentate of the mixture after reacting for 24
hours obtained by filtering using a 50 K cut-off centrifugal
filter. All solutions were diluted to the same volume for
comparing the UV-vis spectra. Inset: the UV-vis spectra from
240 nm to 350 nm.
68
To prepare the device for electrochemical sensing, 12
μL of 100 mM glucose and 100 mM Fe(CN)63- in 0.01 M PBS
buffer (pH 6.0) was loaded into both halves of the
electrochemical cell, and dried in air. A 20 μL solution
containing 25 μM biotin-DNA strand was mixed with 20 μL 0.5%
(w/v) streptavidin-labeled microbeads. After reaction in the
dark for 24 h, the resulting solution was mixed with a 40 μL
solution containing 8.4 μM GOx-DNA strand and 12 μM aptamer
strand. The solution was dropcast in the split channel on
the unfolded device, washed with 0.01 M PBS buffer (pH 7.4)
containing 0.1% BSA, and dried in air.
To assemble the origami paper analytical devices
(oPADs), the paper was folded by hand. The folded paper
device was placed in a thermal laminating pouch, and the
pouch was sealed at the edge of the paper device using the
impulse thermal edge sealer. Three holes were punched on one
side of the pouch. One of the holes was used as inlet and
the other two were used to accommodate ohmic contact of the
carbon electrodes to two copper wires using Ag adhesive.
Five-minute epoxy was used to reinforce the contact.
To use the device for electrochemical sensing, a 20 μL
sample aliquot was loaded at the inlet of the oPAD. After 10
min, when the sample fills the whole channel, the oPAD was
69
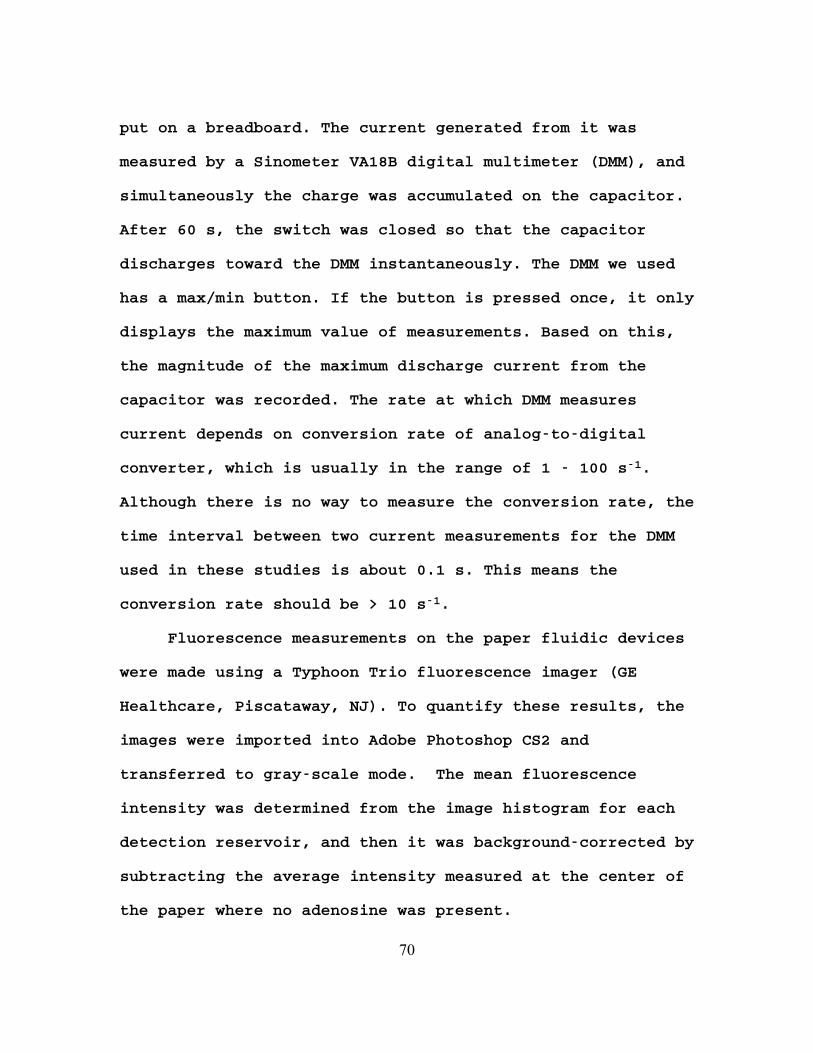
put on a breadboard. The current generated from it was
measured by a Sinometer VA18B digital multimeter (DMM), and
simultaneously the charge was accumulated on the capacitor.
After 60 s, the switch was closed so that the capacitor
discharges toward the DMM instantaneously. The DMM we used
has a max/min button. If the button is pressed once, it only
displays the maximum value of measurements. Based on this,
the magnitude of the maximum discharge current from the
capacitor was recorded. The rate at which DMM measures
current depends on conversion rate of analog-to-digital
converter, which is usually in the range of 1 - 100 s-1.
Although there is no way to measure the conversion rate, the
time interval between two current measurements for the DMM
used in these studies is about 0.1 s. This means the
conversion rate should be > 10 s-1.
Fluorescence measurements on the paper fluidic devices
were made using a Typhoon Trio fluorescence imager (GE
Healthcare, Piscataway, NJ). To quantify these results, the
images were imported into Adobe Photoshop CS2 and
transferred to gray-scale mode. The mean fluorescence
intensity was determined from the image histogram for each
detection reservoir, and then it was background-corrected by
subtracting the average intensity measured at the center of
the paper where no adenosine was present.
70
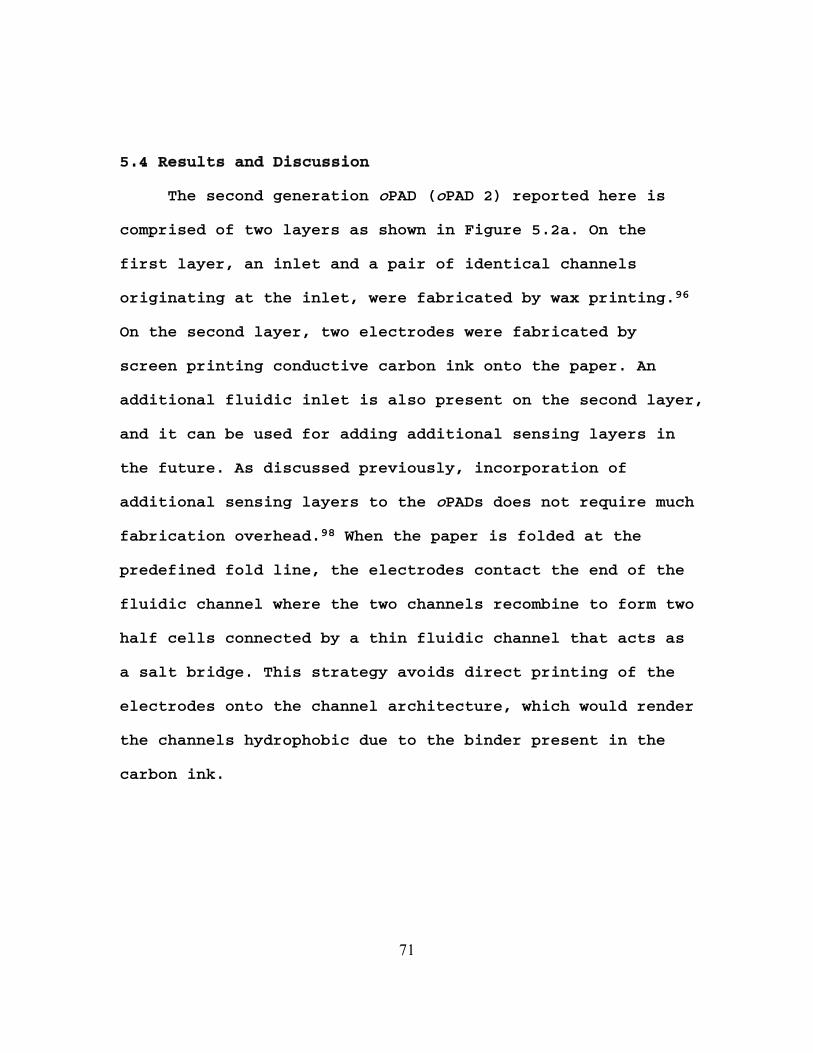
5.4 Results and Discussion
The second generation oPAD (oPAD 2) reported here is
comprised of two layers as shown in Figure 5.2a. On the
first layer, an inlet and a pair of identical channels
originating at the inlet, were fabricated by wax printing.96
On the second layer, two electrodes were fabricated by
screen printing conductive carbon ink onto the paper. An
additional fluidic inlet is also present on the second layer,
and it can be used for adding additional sensing layers in
the future. As discussed previously, incorporation of
additional sensing layers to the oPADs does not require much
fabrication overhead.98 When the paper is folded at the
predefined fold line, the electrodes contact the end of the
fluidic channel where the two channels recombine to form two
half cells connected by a thin fluidic channel that acts as
a salt bridge. This strategy avoids direct printing of the
electrodes onto the channel architecture, which would render
the channels hydrophobic due to the binder present in the
carbon ink.
71
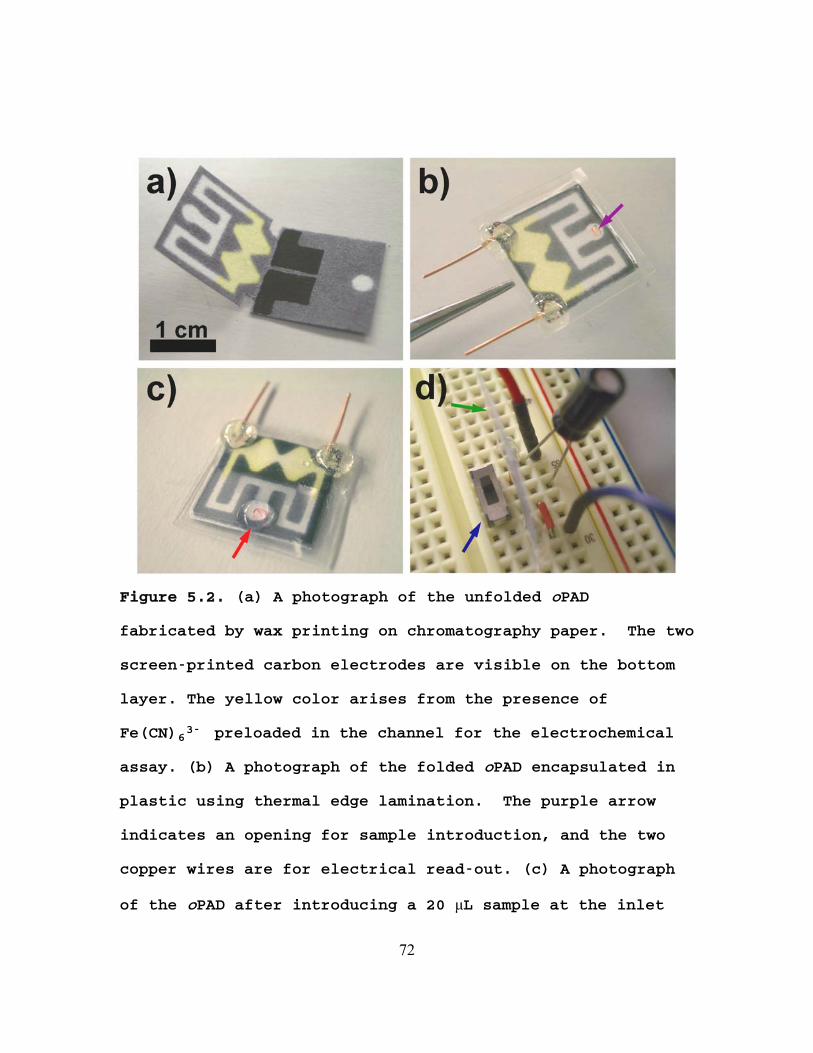
Figure 5.2. (a) A photograph of the unfolded oPAD
fabricated by wax printing on chromatography paper. The two
screen-printed carbon electrodes are visible on the bottom
layer. The yellow color arises from the presence of
Fe(CN)63- preloaded in the channel for the electrochemical
assay. (b) A photograph of the folded oPAD encapsulated in
plastic using thermal edge lamination. The purple arrow
indicates an opening for sample introduction, and the two
copper wires are for electrical read-out. (c) A photograph
of the oPAD after introducing a 20 μL sample at the inlet
72
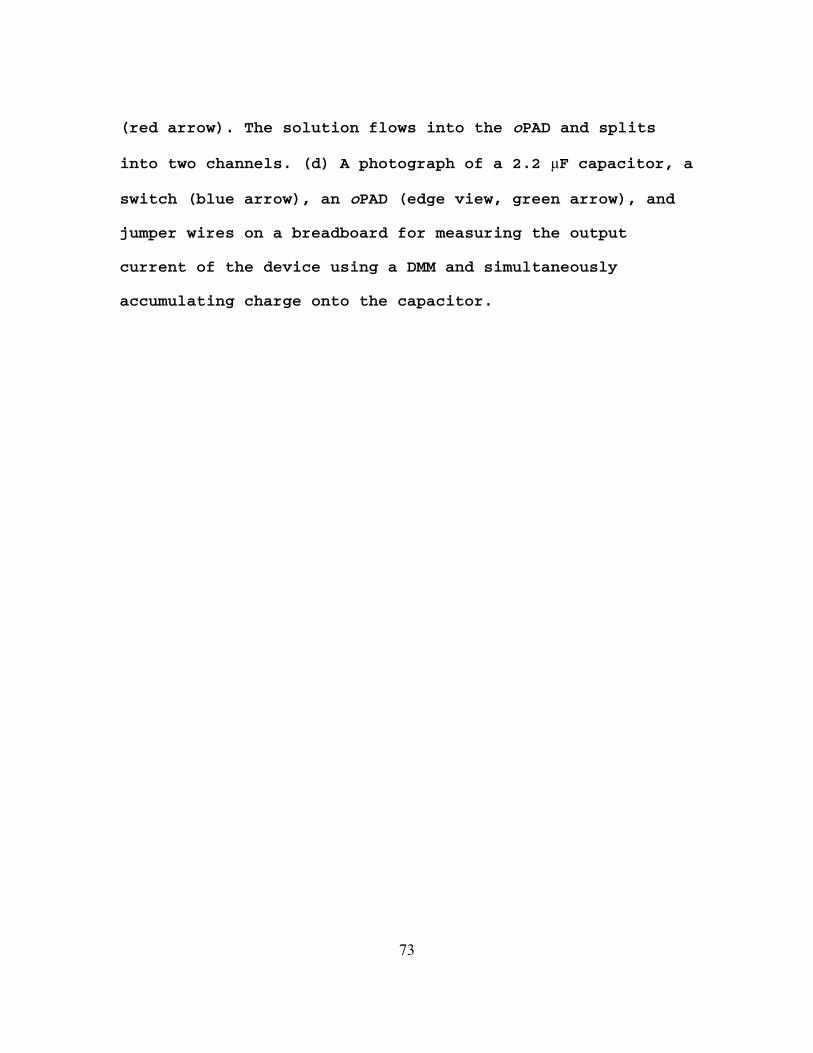
(red arrow). The solution flows into the oPAD and splits
into two channels. (d) A photograph of a 2.2 μF capacitor, a
switch (blue arrow), an oPAD (edge view, green arrow), and
jumper wires on a breadboard for measuring the output
current of the device using a DMM and simultaneously
accumulating charge onto the capacitor.
73
To test this general approach, we first constructed a
concentration cell using the following methodology. GOx was
preloaded in one of the channels, and then a solution
containing 12 μL of 100 mM glucose and 100 mM Fe(CN)63- in
0.01 M PBS buffer (pH 6.0) was loaded into both halves of
the electrochemical cell. After drying in the dark, the
device was folded and then encapsulated in plastic by
impulse edge thermal lamination. As shown in Figure 5.2b,
the oPAD was fully enclosed with the exception of a small
opening for sample loading (marked by a purple arrow) and
two copper leads that connected to the carbon electrodes.
Note that lamination ensures vertical contact between
adjacent layers, which eliminates the need for the type of
metal clamp used in our earlier work.98 After assembly of
the oPAD, 20 μL of 0.01 M PBS buffer (pH 7.4) was introduced
through the inlet (Figure 5.2c). After 10 min, when the
fluid recombined in the electrochemical cell, the oPAD was
placed onto a breadboard, as shown in Figure 5.2d. The
electric circuit on the breadboard was designed to measure
the current generated by the oPAD using the DMM while
simultaneously accumulating the resulting charge on the
capacitor. Of course, in the future, the capacitor would be
directly fabricated on paper and integrated into the
74
laminated package. Upon closing the switch, the capacitor
quickly discharges, and the resulting maximum current is
recorded by the DMM. Information about the sampling
frequency of the DMM is provided in the Experimental Section.
The important point is that the magnitude of the discharge
current increases linearly with increasing concentration of
GOx (Figure 5.3), thereby demonstrating the applicability of
the sensor to quantification. Note that making use of the
capacitor discharge current increases the sensitivity of the
assay by 15.5-fold compared to a simple current measurement
(4.1 μA/pmol vs. 0.26 μA/pmol, Figure 5.3).
75
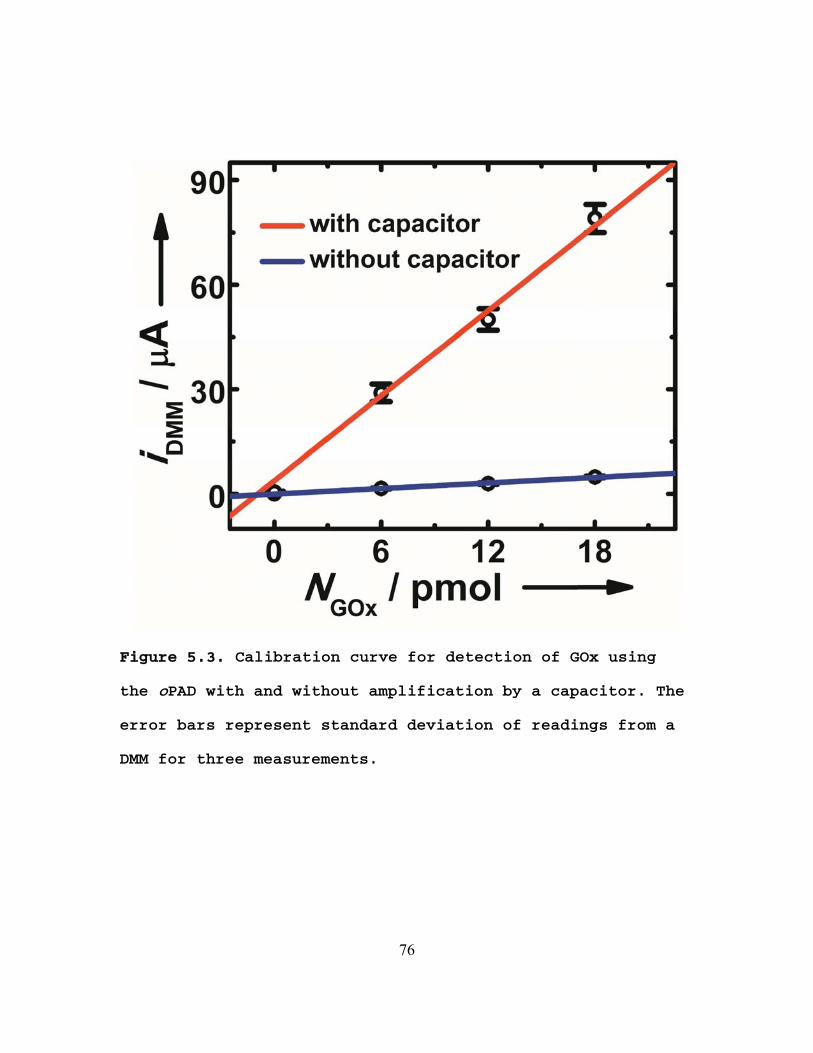
Figure 5.3. Calibration curve for detection of GOx using
the oPAD with and without amplification by a capacitor. The
error bars represent standard deviation of readings from a
DMM for three measurements.
76
With these promising preliminary results in hand, we
carried out a heterogeneous aptamer assay. Biotin-labeled
aptamers for adenosine77,100,101 were immobilized on 10 μm-
diameter polystyrene (PS) microbeads functionalized on their
surface with streptavidin. It was possible to keep track of
the location of the microbeads, because they contained
fluorescent Nile Red. A 0.10 μL aliquot of the 0.25% (w/v)
microbead solution was added to one of the channels and
allowed to dry. To ensure that the microbeads did not move
in the paper channels, we carried out the following simple
experiment. First, the entire unfolded device was imaged in
a fluorescence scanner to locate the beads (Figure 5.4a).
Next, the device was folded and a PBS solution (0.01 M, pH
7.4) was added to the device inlet and allowed to flow to
its end. Finally, the device was imaged a second time
(Figure 5.4b). The results show minimal (and acceptable)
bead displacement after exposure to the buffer solution.
77
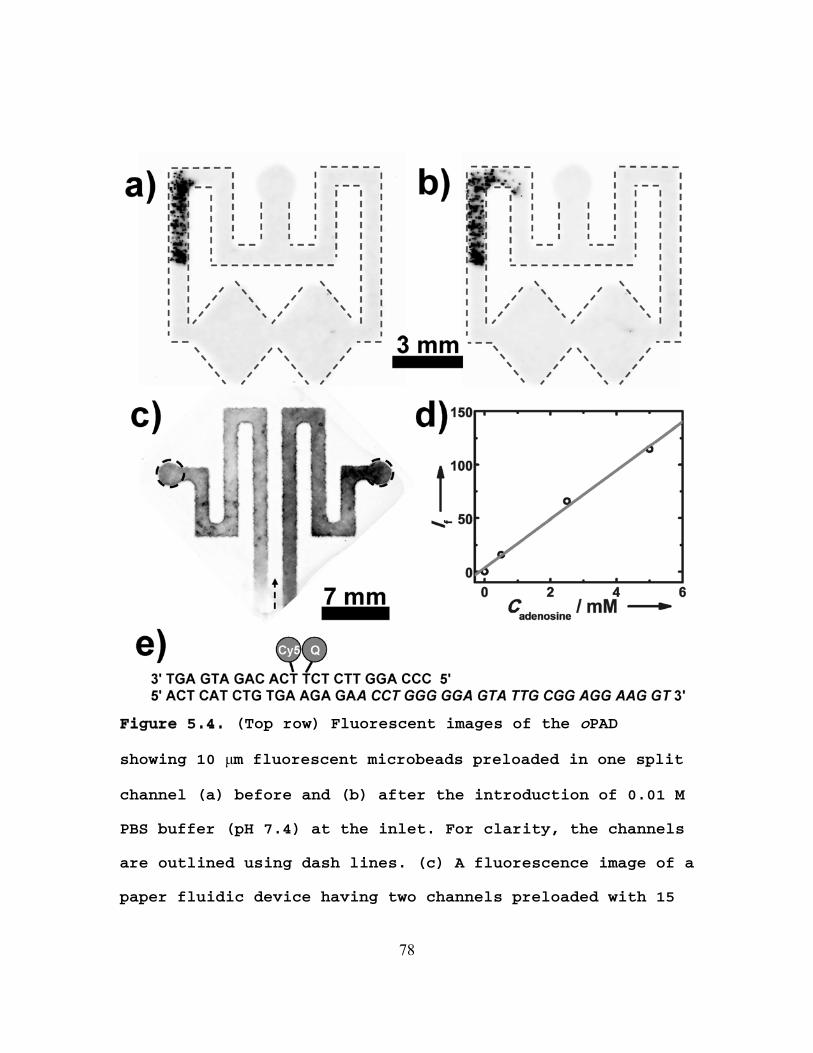
Figure 5.4. (Top row) Fluorescent images of the oPAD
showing 10 μm fluorescent microbeads preloaded in one split
channel (a) before and (b) after the introduction of 0.01 M
PBS buffer (pH 7.4) at the inlet. For clarity, the channels
are outlined using dash lines. (c) A fluorescence image of a
paper fluidic device having two channels preloaded with 15
78
μL of a solution containing 0.32 μM adenosine aptamer strand,
0.20 μM fluorophore strand, and 0.40 μM quencher strand. The
right channel was filled with 15 μL of 0.01 M PBS buffer (pH
7.4) containing 5 mM adenosine, and the left channel was
filled with 15 μL of adenosine-free PBS. The arrow shows the
flow direction. The darker color in the right channel
represents enhanced fluorescence due to the presence of
adenosine. (d) A plot of fluorescent intensity (If) versus
the concentration of adenosine (Cadenosine) in the sample. The
intensity was measured in the right circle shown in (c) and
subtracted from the intensity measured in the left circle.
(e) Sequences of aptamer strand, the fluorophore strand, and
the quencher strand. The sequence for binding to adenosine
is in italics.
79
Heterogeneous assays generally require longer
incubation times than homogeneous assays due to reduced mass
transfer of reagents to the immobilized probes. Longer
assay times can be a problem for paper devices due to water
evaporation, but this issue has been addressed by
encapsulating the device in an impermeable enclosure. For
example, pressure-sensitive adhesives95,97 or printer toner96
have been used for this purpose. We used a glossy and clear
plastic envelope sealed with an impulse thermal edge
laminator that only applies heat to the edge of the plastic.
This approach avoids adhesives,95,97 which can lead to
contamination or nonspecific adsorption of reagents or
targets, and heat-induced deactivation.96 Using this
approach, we found that the channel stays wet in the
enclosed device at 37 oC for > 2 h (Figure 5.5).
To demonstrate the function of the aptamer probe in the
enclosed oPADs, a fluorescent adenosine aptamer sensor
(Figure 5.4e) was tested in the device. Adenosine is a
crucial biological cofactor in many biological processes,
such as those involved in kidney function. Normal levels of
urinary adenosine are in the micromolar range, and elevated
renal adenosine levels can be characteristic of disease.102
As shown in Figure 5.4c, two separate channels were
80
preloaded with 15 μL of aptamer solution containing 0.32 μM
adenosine aptamer strand, 0.20 μM fluorophore strand and
0.40 μM quencher strand, and then the channels were allowed
to dry in air. Next, a 15 μL buffer solution containing 5 mM
adenosine was introduced into one of the channels, and
buffer only was added to the other channel. After 15 min the
fluorescence from both channels was measured. As shown in
Figure 5.4c, fluorescence is enhanced in the channel where
adenosine is present. Moreover, there is a linear
relationship between the fluorescence intensity and the
adenosine concentration between 0.5 mM to 5 mM.
81
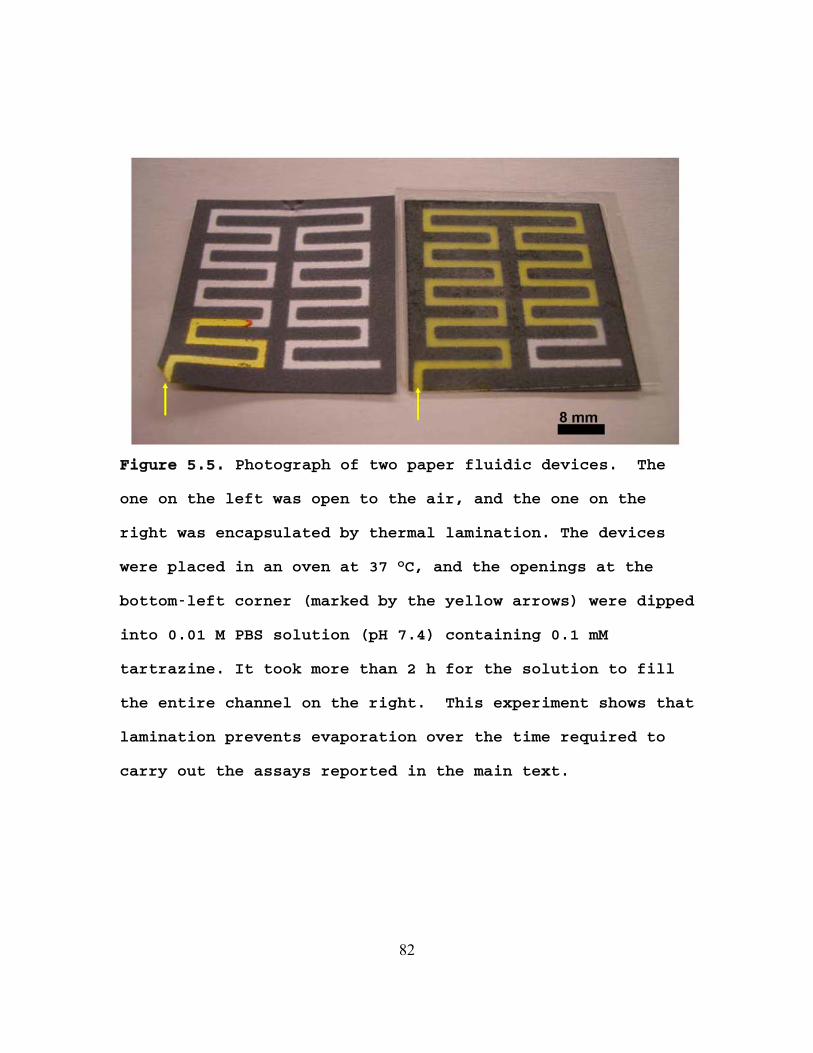
Figure 5.5. Photograph of two paper fluidic devices. The
one on the left was open to the air, and the one on the
right was encapsulated by thermal lamination. The devices
were placed in an oven at 37 oC, and the openings at the
bottom-left corner (marked by the yellow arrows) were dipped
into 0.01 M PBS solution (pH 7.4) containing 0.1 mM
tartrazine. It took more than 2 h for the solution to fill
the entire channel on the right. This experiment shows that
lamination prevents evaporation over the time required to
carry out the assays reported in the main text.
82
For electrochemical read-out, we used 5’ biotin-
modified DNA (bDNA). The biotin group was used to link
streptavidin-labeled GOx (sGOx). The sequences are shown in
Figure 5.6b. UV-vis spectroscopy was used to characterize
the product. Details about the synthesis, characterization
and UV-vis spectra (Figure 5.1) are available in the
Experimental Section. The key point is that bDNA binds to
sGOx which is separated from free bDNA by centrifugal
filtering. The whole process to make an oPAD for
electrochemical detection of adenosine is provided in the
experimental section. The current increased with increasing
adenosine concentration. The detection limit, calculated as
3-times the standard deviation of the blank divided by the
slope, is 11.8 μM. The sensitivity (0.48 μA/μM) was enhanced
by 17-fold compared to that without amplification (0.029
μA/μM).
5.5 Summary and Conclusions
In this chapter, we have reported a μPAD-type device
that utilizes aptamers as the sensing probe and very simple
electrochemical (DMM) read-out. The fabrication of the
device is fast, easy, and inexpensive, and all fabrication
steps could be easily automated. The sensor is self powered
83
in that it generates a current without the need for an
external power source.74 DMMs are ubiquitous and can be
purchased for as little as $US30. Moreover, DMMs integrated
with an iPhone or iPod (known as iMultimeter) are now
available.103 Although we used an adenosine aptamer for this
proof-of-concept study, a range of probes, including,
antibodies, DNAzyme, or aptazymes, could also be integrated
into the device using the same sensing platform. We believe
the oPAD 2 will prove promising for applications such as
point-of-care diagnosis and unambiguous sensing under
esource-limited settings. r
84
Chapter 6: Determination of Percent Hemoglobin A1c Using a
Potentiometric Method
6.1 Synopsis
In this chapter we report a potentiometric method for
measuring hemoglobin A1c (HbA1c, glycated hemoglobin)
concentration, hemoglobin (Hb) concentration, and percent
HbA1c (%HBA1c) in human blood. The %HBA1c is important for
diagnosis and management of diabetes mellitus. Alizarin red
s (ARS) is used as a redox indicator. Phenylboronic acid
(PBA) binds to both ARS and HbA1c via diol-boronic acid
complexation. The binding of PBA to ARS shifts its redox
potential negative. However, when HbA1c competes with ARS
for PBA binding, the solution potential shifts positive.
This shift is linked to the HbA1c concentration. To
determinate the concentration of Hb, Hb is allowed to react
with Fe(CN)63-. The potential shift arising from the
reduction of Fe(CN)63-
by Hb is proportional to the
logarithm of the Hb concentration. The results obtained for
%HBA1c in human blood are in good agreement with those
determined using a reference method.
6.2 Introduction
85
Diabetes mellitus is a growing worldwide health
problem.23 Diagnosis and management of this disease require
continuous monitoring of blood glucose level, usually using
personal glucose meters (PGMs).24 However, effective
management requires three to four tests a day owing to the
large fluctuation of glucose level, and hence this type of
spot testing does not reflect average blood glucose level
over a prolonged period. For the latter type of
determination, testing for percent hemoglobin A1c (glycated
hemoglobin, %HbA1c), which is the ratio of HbA1c to total
hemoglobin (Hb) concentration, is more appropriate.26
HbA1c is formed by a nonenzymatic reaction between
blood glucose and the N-terminal valine of the Hb chain,
followed by an Amadori rearrangement reaction.28 The
correlation between %HbA1c and average blood glucose level
is well established.25 Specifically, the %HbA1c provides a
running average of the blood glucose level over the half-
life of erythrocytes (i.e., ~60 days) and has therefore been
recognized as a crucial parameter for the diagnosis and
management of diabetes mellitus.25 The 2010 American
Diabetes Association Standards of Medical Care in Diabetes
has included %HbA1c ≥ 6.5% as a criterion for the diagnosis
of diabetes mellitus.27
86
A wide range of methods have been developed for the
determination of %HbA1c, including boronate affinity
chromatography,29,30 ion-exchange chromatography,31
electrophoresis,32 fluorescence,33,34 UV-vis absorption,34
chemiluminescence,28 electrochemical methods,35-39 and
immunoassays.40,41 However, most of these methods are based
on chromatographic separations. Other methods usually
require antibody reagents or commercially unavailable
derivatives of boronic acid, which render these methods
relatively vulnerable and expensive.28,33,34,38,40,41 Moreover,
some of these methods only determine the absolute
concentration of HbA1c rather than %HbA1c. Finally, it has
recently been reported that the majority of commercially
available HbA1c analyzers are unreliable.42
Electrochemical methods, because of their low cost and
simplicity, are particularly amenable to point-of-care
sensing.19,99 For example, we previously reported
electrogenerated chemiluminescent detection of HbA1c using a
microelectrochemical bipolar electrode array on a
microfluidic chip.37 As discussed earlier, however, this
approach leads to the absolute concentration of HbA1c rather
than the more useful %HbA1c. Here, we report a method based
on potentiometry for determination of HbA1c concentration,
Hb concentration, and thus %HbA1c in human blood. The method
87
is simple, requires no separation, and all necessary
reagents are inexpensive, stable (not biological), and
commercially available. The quantitative determination of
HbA1c is based on measuring the potential shift of a redox
indicator, alizarin red s (ARS, US$ ~2.1/g). When ARS binds
to phenylboronic acid (PBA, US$ ~2.3/g) through diol-boronic
acid complexation, the redox potential shifts negative. In
the presence of HbA1c, which is a competitor of ARS for PBA
binding, the potential shifts back positive. The magnitude
of this back shift is used for the quantification of HbA1c.
For the determination of total Hb, the blood sample is
allowed to react with K3Fe(CN)6, and the potential shift
owing to the reduction of K3Fe(CN)6 by Hb is correlated
quantitatively to the Hb concentration.
6.3 Experimental
Chemicals and materials Lyophilized Hb standard (13.2
g/dL) and an HbA1c calibrator kit with four lyophilized Hb
samples containing 5.0, 8.0, 10.8, and 14.8% of HbA1c,
respectively, were purchased from Pointe Scientific, Inc.
(Canton, MI). The concentrations of total Hb in the HbA1c
calibrator samples were determined using UV-vis spectroscopy
by comparing the adsorption at 415 nm with Hb standards. The
absolute concentration of HbA1c was then obtained by
88
multiplying the total Hb concentration and the %HbA1c. ARS,
K3Fe(CN)6 (99+%) and N-ethylmorpholine (99%) were purchased
from Acros Organics. PBA (≥97%) were purchased from Sigma-
Aldrich. KCl and HCl were purchased from Fisher Scientific.
All solutions were prepared using deionized water (18.0
MΩ•cm, Milli-Q Gradient System, Millipore). All reagents
were used as received.
Electrochemical measurements All electrochemical
measurements were made using a CHI650c potentiostat from CH
Instrument (Austin, TX). For cyclic voltammetry (CV) and
linear sweep voltammetry (LSV), a glassy carbon working
electrode (3.0 mm in diameter), a Ag/AgCl reference
electrode, and a platinum counter electrode were used. For
potentiometric measurements, only the glassy carbon
electrode and the Ag/AgCl electrode were required. The
Ag/AgCl reference electrode was filled with saturated KCl
solution. Before all electrochemical measurements, the
glassy carbon electrode was polished with slurries of -
alumina (300 nm and then 50 nm) using a MetaServ-3000
polisher from Buehler (Lake Bluff, IL), rinsed with
deionized water, and dried under nitrogen.
Determination of the dissociation constant of ARS-PBA
The dissociation constant for ARS-PBA complexation was
89
determined by nonlinear fitting of a titration curve using
Origin 8.0 with the function given in eq 1.104
)/()()/()( odooARSPBA jjjjKjjjjCC (1)
Here, CPBA is the total concentration of PBA and CARS is
the total concentration of ARS. The measured peak current
density is j, which is proportional to the concentration of
free ARS. The peak current density measured in the absence
of PBA is j0. The peak current measured when PBA is in
excess j∞.
Potentiometric detection of HbA1c 100 μL of the Hb
sample was mixed with 50 L of 0.10 M N-ethylmorpholine
buffer (pH adjusted to 8.5 using HCl) containing 1.0 mM ARS
and 0.10 M KCl in a glass vial with stirring (the ARS stock
solution was freshly prepared each day). The solution was
diluted to 500 L using 0.10 M N-ethylmorpholine buffer (pH
8.5) containing 0.10 M KCl. The open-circuit potential (OCP)
of the stirred solution was measured for a total of 1180 s
at a sampling rate of 10/s. At 1000 s, 1.0 L of 2.0 M PBA
dissolved in ethanol was added into the glass vial. The
resulting potential shift was recorded and the dose-response
curve was plotted for the determination of the HbA1c
concentration.
90
Potentiometric detection of total Hb 3.0 mL of 0.010 M
PBS solution (pH 7.4) containing 10 mM K3Fe(CN)6 was
freshly prepared and added into a glass vial with stirring.
The OCP was measured at a sampling rate of 10/s while
stirring. At 60 s, 3.0 L of Hb sample was added into the
glass vial. After 200 s, an additional 3.0 L aliquot of the
Hb sample was added into the glass vial. The resulting
potential shift during the second addition of sample wa
used for the determination of the total hemoglobin
s
concentration.
6.4 R
er
S. At pH 8.5,
S is
deprotonated,107 as shown in Figure 6.1.
esults and Discussion
Electrochemistry of ARS and ARS-PBA. Schumacher et al.
have examined the electrochemistry of ARS and ARS-PBA using
CV, and they also used ARS as an amperometric indicator for
studying the binding between PBA and fructose in phosphate
buffer (pH 7.4).105 The binding between diols and boronic
acid is generally believed to be more favorable at high
pHs,106 and therefore we used 0.10 M N-ethylmorpholine
buffer (pH 8.5) containing 0.10 M KCl supporting electrolyte
for all electrochemical experiments involving AR
it is known that the 3-hydroxy group of AR
91
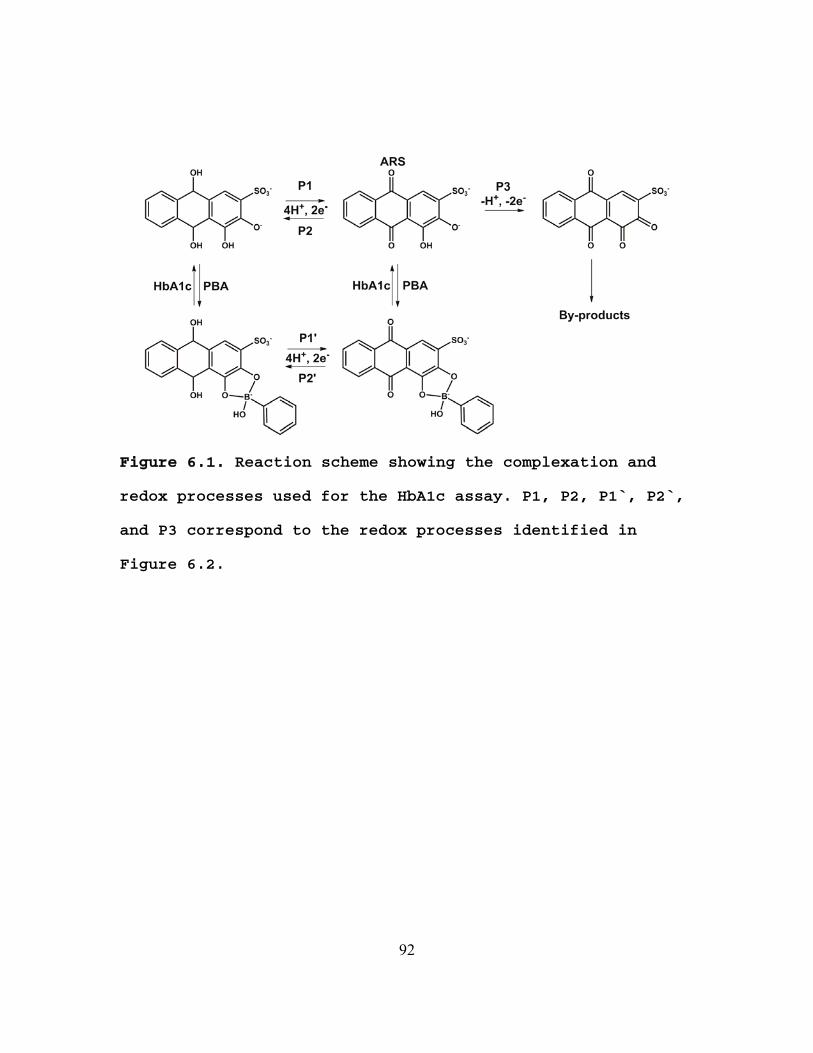
Figure 6.1. Reaction scheme showing the complexation and
redox processes used for the HbA1c assay. P1, P2, P1’, P2’,
and P3 correspond to the redox processes identified in
Figure 6.2.
92
A CV of 1.0 mM ARS is shown in Figure 6.2a (black
curve). A nearly reversible process is observed at E1/2=-
704 mV with ΔE=53 mV (P1 and P2 in Figure 6.2a). Recall
that E1/2=(Epc+Epa)/2 and ΔE= Epc-Epa where Epc and Epa are
the potentials corresponding to the cathodic and anodic
current density peaks, respectively. An irreversible proc
is detected at E
ess
y pa=301 mV (P3 in Figure 6.2a). The nearl
reversible and the irreversible processes are attributable
to the 2-proton-2-electron redox reactions of the
orthoquinone moiety and the oxidation of the dihydroxyl
moiety of the ARS, respectively (Figure 6.1).105 The peak at
Ep=-592 mV corresponds to the reduction of oxygen. This
assertion is confirmed by Figure 6.3, which shows that this
peak is absent in a deoxygenate solution. All subsequent
electrochemical measurements were carried out in air-
saturated solutions, because it is difficult to deoxygenate
hemoglobin solutions.
93
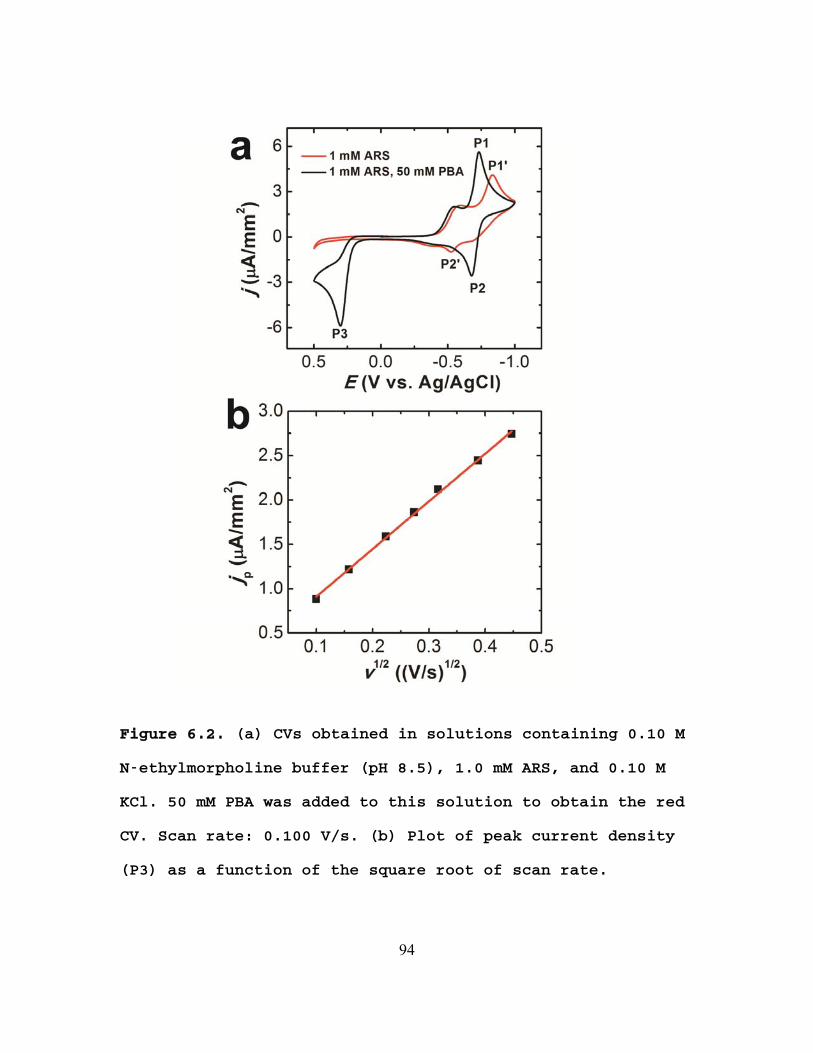
Figure 6.2. (a) CVs obtained in solutions containing 0.10 M
N-ethylmorpholine buffer (pH 8.5), 1.0 mM ARS, and 0.10 M
KCl. 50 mM PBA was added to this solution to obtain the red
CV. Scan rate: 0.100 V/s. (b) Plot of peak current density
(P3) as a function of the square root of scan rate.
94
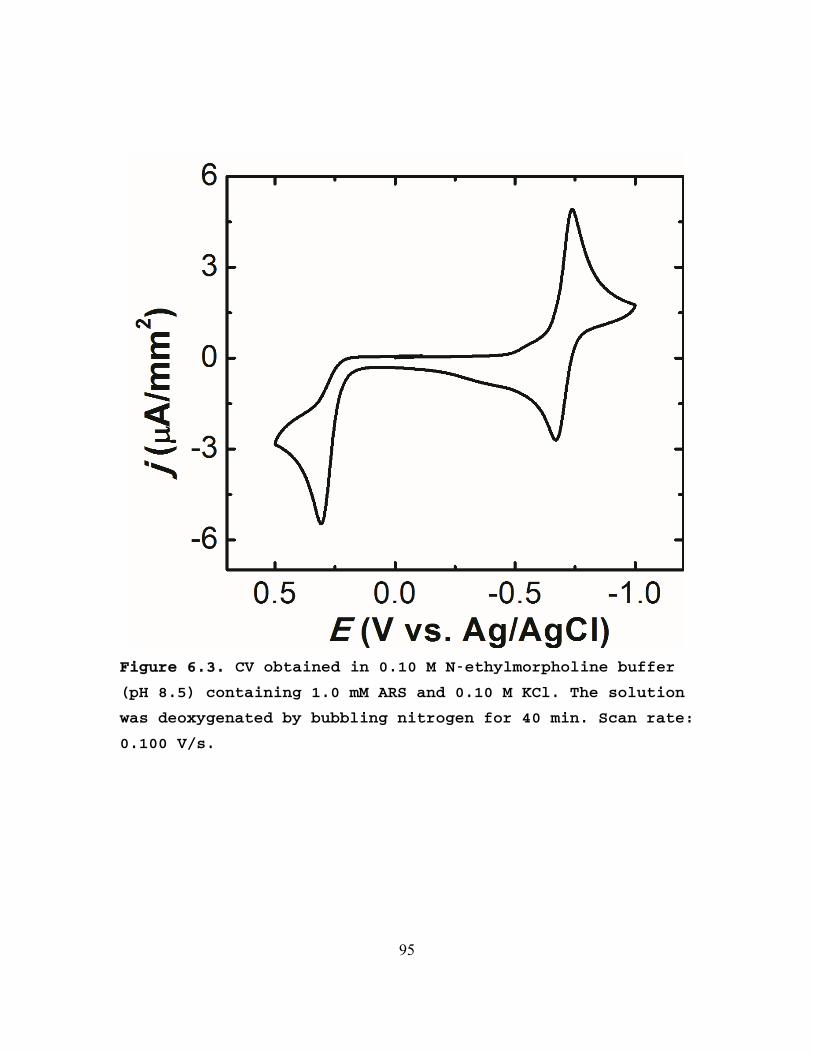
Figure 6.3. CV obtained in 0.10 M N-ethylmorpholine buffer
(pH 8.5) containing 1.0 mM ARS and 0.10 M KCl. The solution
was deoxygenated by bubbling nitrogen for 40 min. Scan rate:
0.100 V/s.
95
When 50 mM PBA is added to the 1.0 mM ARS solution, the
voltammetry changes (red curve, Figure 6.2a). In this case,
peak P3 is not present due to complexation between ARS and
PBA via the diol-boronic acid interaction (Figure 6.1).
Furthermore, the peak potentials of the orthoquinone redox
process (P1’ and P2’ in Figure 6.2a) shift, they become more
irreversible (ΔE=310 mV and E1/2=-679 mV), and the ORR
shifts slightly negative (Ep=-592 mV).
As shown in Figure 6.2b, the peak current density
arising from the dihydroxyl oxidation of ARS (peak P3) is
proportional to the square root of the scan rate (10-200
mV/s), indicating that the redox reaction is diffusion
limited.61 Therefore, the magnitude of peak current density
P3 is proportional to the bulk concentration of free ARS in
the solution, and hence it can be used to study the binding
between ARS and PBA.
Complexation of ARS and PBA. A detailed fluorescence
study of the complexation between PBA and a range of diols,
including ARS, was reported by Wang et al.106 One outcome of
this study is that the pH and solution composition greatly
influence the binding of PBA and diols.106 Generally, the
interactions are favored at high pHs when the boronic acid
96
is tetrahedral and negatively charged, as shown in Figure
6.1.106
To determine the time required for the ARS-PBA
complexation reaction to take place under electrochemical
conditions, 10 L of 1.0 M PBA dissolved in ethanol was
added to 10 mL of 0.10 M N-ethylmorpholine buffer containing
1.0 mM ARS and 0.10 M KCl. LSVs were obtained as a function
of time, and the resulting peak current densities, jp, as a
function of time are presented in Figure 6.4a. The results
show that the magnitude of the anodic current density
decreases quickly with time, but after ~20 min achieves a
plateau. Therefore, a reaction time of 20 min was used for
the following experiments to determine the dissociation
constant for the ARS-PBA complex.
97
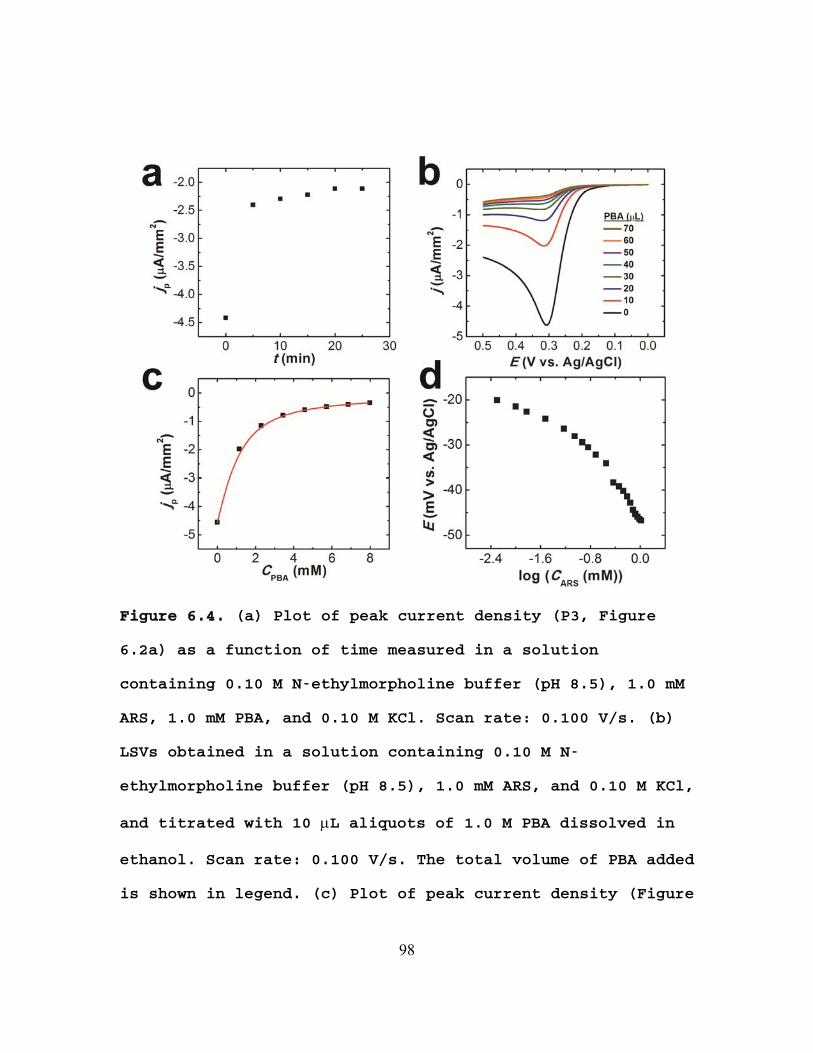
Figure 6.4. (a) Plot of peak current density (P3, Figure
6.2a) as a function of time measured in a solution
containing 0.10 M N-ethylmorpholine buffer (pH 8.5), 1.0 mM
ARS, 1.0 mM PBA, and 0.10 M KCl. Scan rate: 0.100 V/s. (b)
LSVs obtained in a solution containing 0.10 M N-
ethylmorpholine buffer (pH 8.5), 1.0 mM ARS, and 0.10 M KCl,
and titrated with 10 L aliquots of 1.0 M PBA dissolved in
ethanol. Scan rate: 0.100 V/s. The total volume of PBA added
is shown in legend. (c) Plot of peak current density (Figure
98

6.2b) as a function of PBA concentration. The red curve is a
non-linear fit obtained using eq 1. (d) Plot of potential
measured in a solution containing 0.10 M N-ethylmorpholine
buffer (pH 8.5) and 0.10 M KCl as a function of the
logarithm of the concentration of added ARS.
99
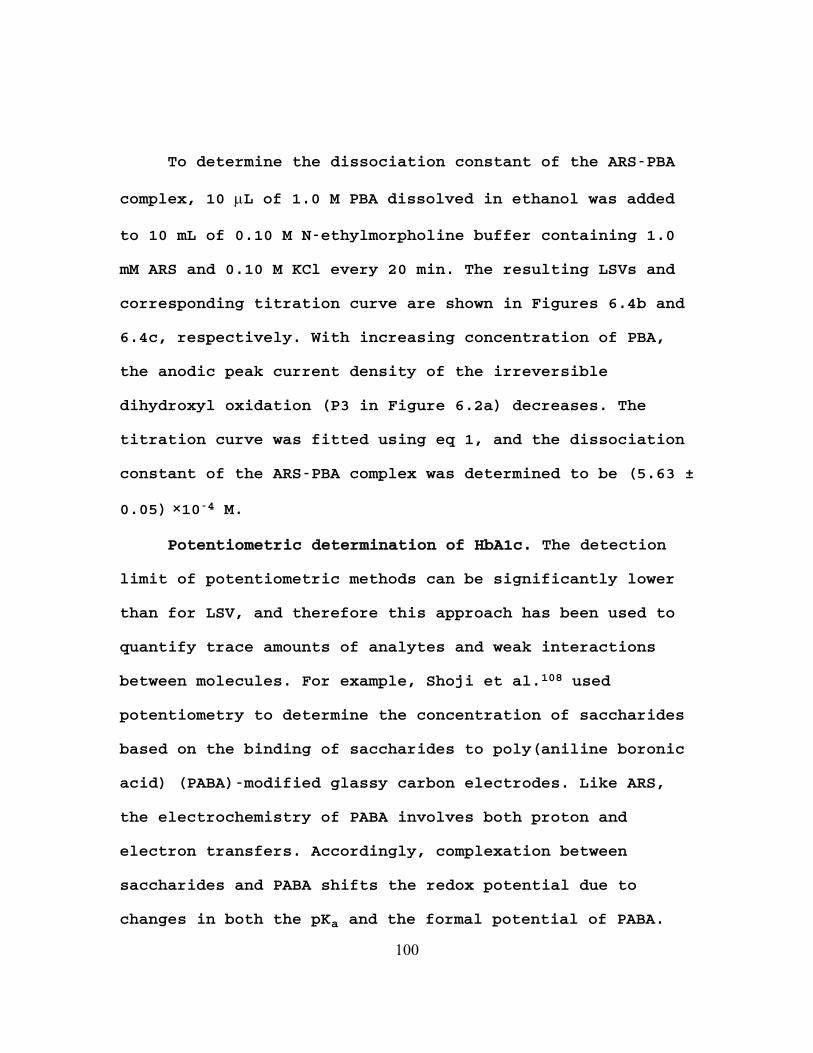
To determine the dissociation constant of the ARS-PBA
complex, 10 L of 1.0 M PBA dissolved in ethanol was added
to 10 mL of 0.10 M N-ethylmorpholine buffer containing 1.0
mM ARS and 0.10 M KCl every 20 min. The resulting LSVs and
corresponding titration curve are shown in Figures 6.4b and
6.4c, respectively. With increasing concentration of PBA,
the anodic peak current density of the irreversible
dihydroxyl oxidation (P3 in Figure 6.2a) decreases. The
titration curve was fitted using eq 1, and the dissociation
constant of the ARS-PBA complex was determined to be (5.63 ±
0.05) ×10-4 M.
Potentiometric determination of HbA1c. The detection
limit of potentiometric methods can be significantly lower
than for LSV, and therefore this approach has been used to
quantify trace amounts of analytes and weak interactions
between molecules. For example, Shoji et al.108 used
potentiometry to determine the concentration of saccharides
based on the binding of saccharides to poly(aniline boronic
acid) (PABA)-modified glassy carbon electrodes. Like ARS,
the electrochemistry of PABA involves both proton and
electron transfers. Accordingly, complexation between
saccharides and PABA shifts the redox potential due to
changes in both the pKa and the formal potential of PABA.
100
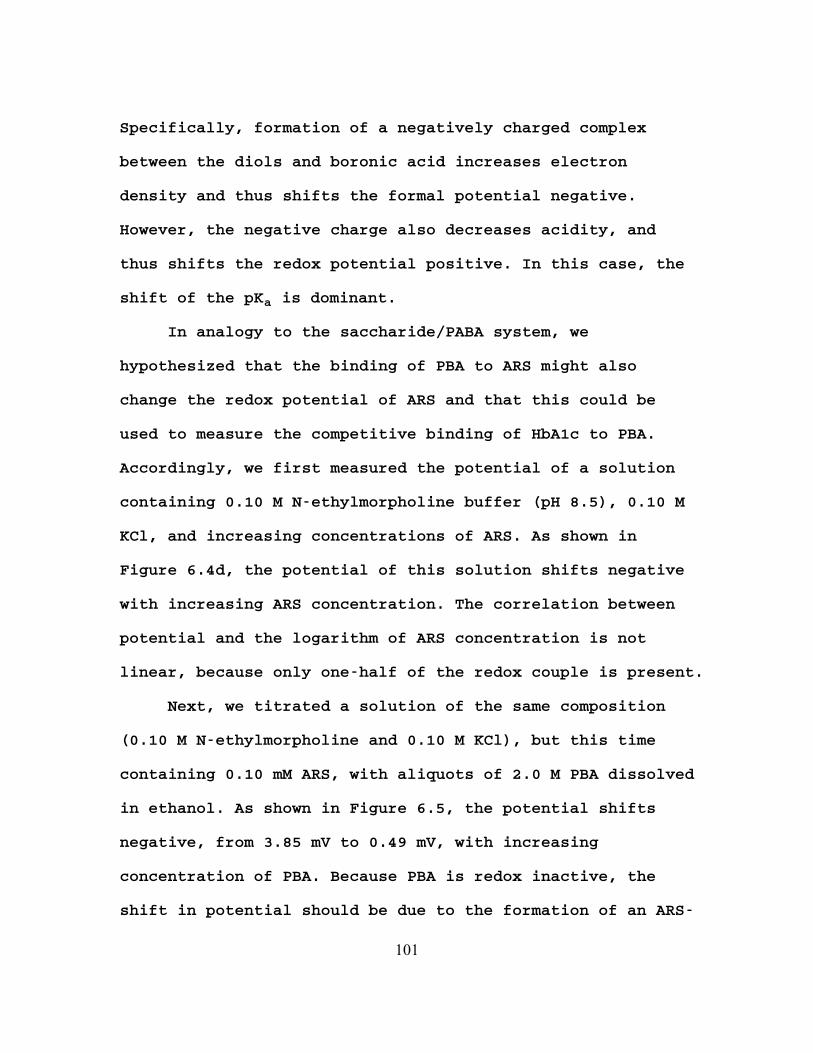
Specifically, formation of a negatively charged complex
between the diols and boronic acid increases electron
density and thus shifts the formal potential negative.
However, the negative charge also decreases acidity, and
thus shifts the redox potential positive. In this case, the
shift of the pKa is dominant.
In analogy to the saccharide/PABA system, we
hypothesized that the binding of PBA to ARS might also
change the redox potential of ARS and that this could be
used to measure the competitive binding of HbA1c to PBA.
Accordingly, we first measured the potential of a solution
containing 0.10 M N-ethylmorpholine buffer (pH 8.5), 0.10 M
KCl, and increasing concentrations of ARS. As shown in
Figure 6.4d, the potential of this solution shifts negative
with increasing ARS concentration. The correlation between
potential and the logarithm of ARS concentration is not
linear, because only one-half of the redox couple is present.
Next, we titrated a solution of the same composition
(0.10 M N-ethylmorpholine and 0.10 M KCl), but this time
containing 0.10 mM ARS, with aliquots of 2.0 M PBA dissolved
in ethanol. As shown in Figure 6.5, the potential shifts
negative, from 3.85 mV to 0.49 mV, with increasing
concentration of PBA. Because PBA is redox inactive, the
shift in potential should be due to the formation of an ARS-
101

PBA complex. The negative direction of the potential shift
suggests that it is controlled by the change in the formal
potential of ARS complex rather its pKa.
102
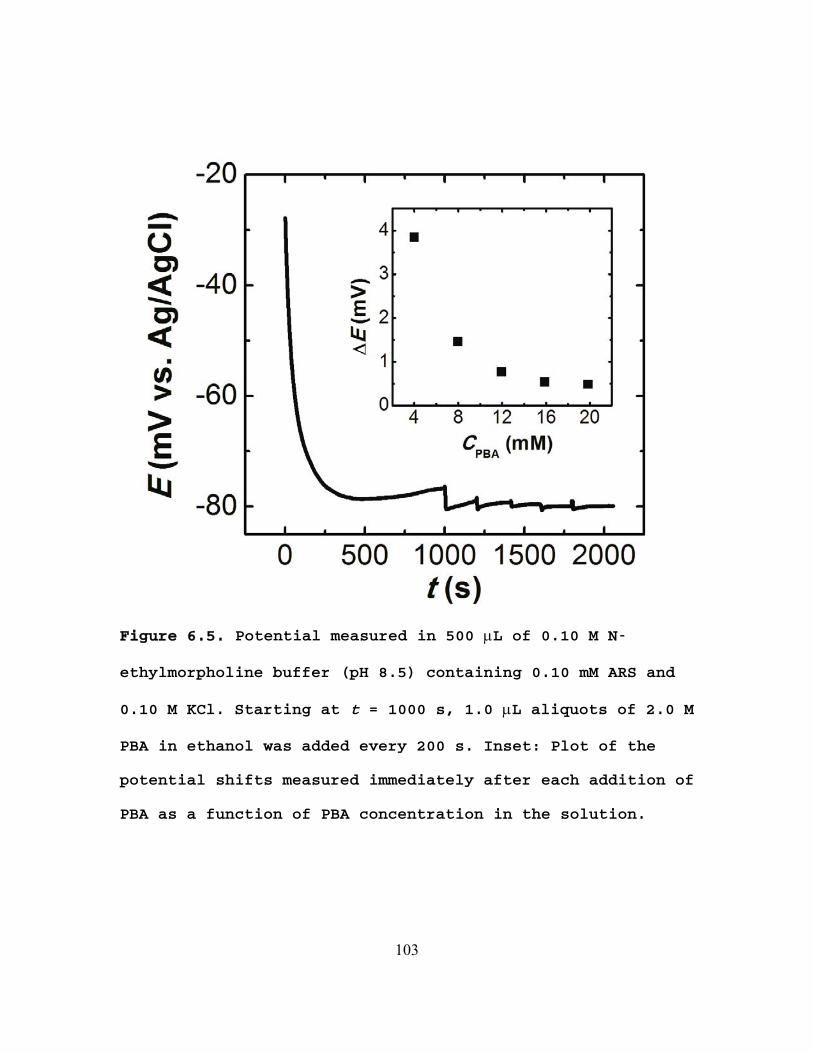
Figure 6.5. Potential measured in 500 L of 0.10 M N-
ethylmorpholine buffer (pH 8.5) containing 0.10 mM ARS and
0.10 M KCl. Starting at t = 1000 s, 1.0 L aliquots of 2.0 M
PBA in ethanol was added every 200 s. Inset: Plot of the
potential shifts measured immediately after each addition of
PBA as a function of PBA concentration in the solution.
103
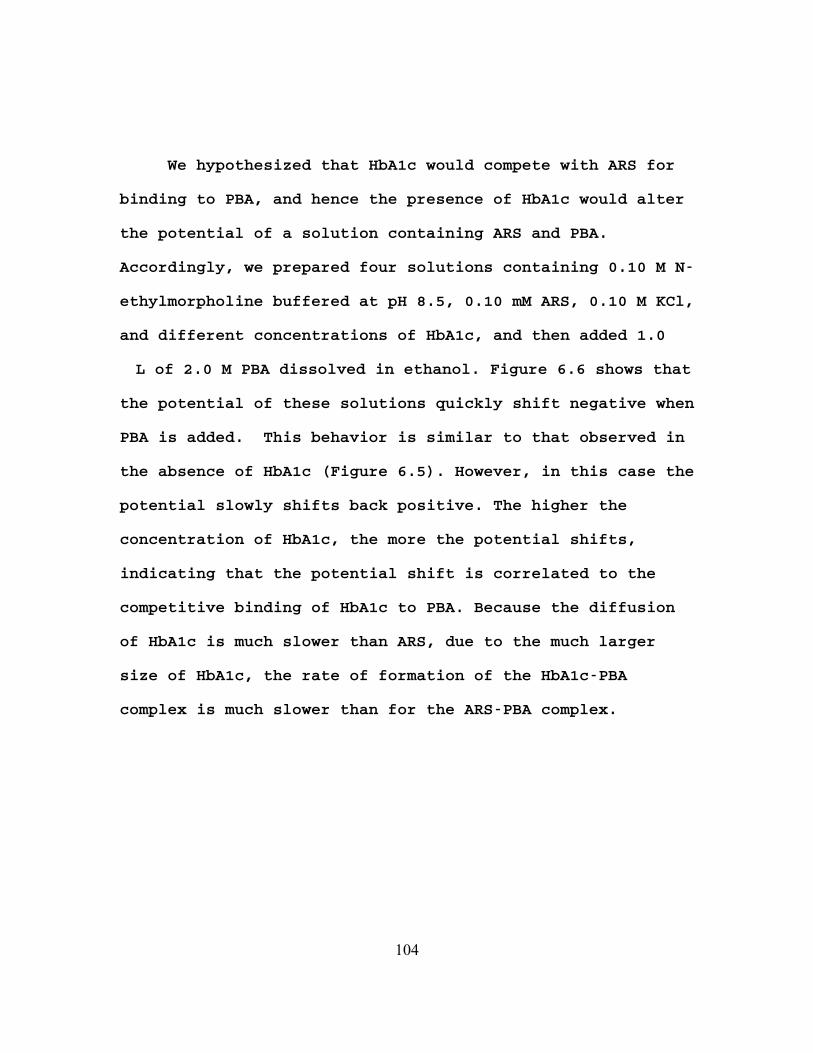
We hypothesized that HbA1c would compete with ARS for
binding to PBA, and hence the presence of HbA1c would alter
the potential of a solution containing ARS and PBA.
Accordingly, we prepared four solutions containing 0.10 M N-
ethylmorpholine buffered at pH 8.5, 0.10 mM ARS, 0.10 M KCl,
and different concentrations of HbA1c, and then added 1.0
L of 2.0 M PBA dissolved in ethanol. Figure 6.6 shows that
the potential of these solutions quickly shift negative when
PBA is added. This behavior is similar to that observed in
the absence of HbA1c (Figure 6.5). However, in this case the
potential slowly shifts back positive. The higher the
concentration of HbA1c, the more the potential shifts,
indicating that the potential shift is correlated to the
competitive binding of HbA1c to PBA. Because the diffusion
of HbA1c is much slower than ARS, due to the much larger
size of HbA1c, the rate of formation of the HbA1c-PBA
complex is much slower than for the ARS-PBA complex.
104
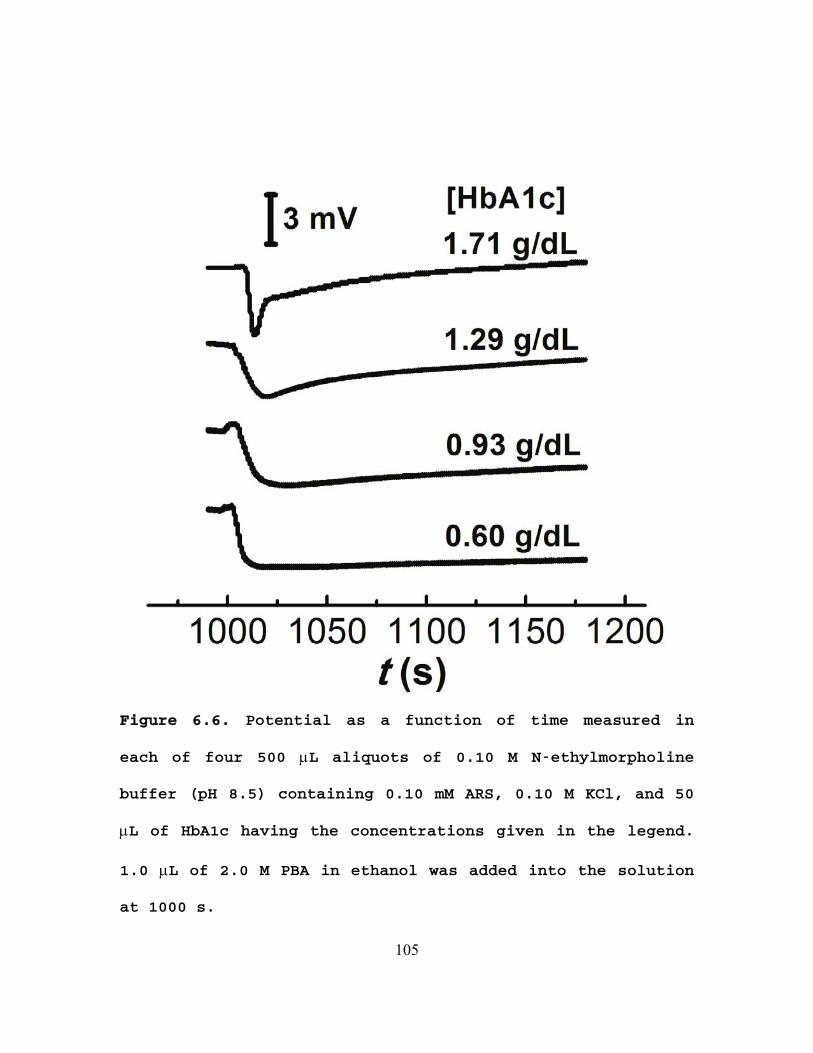
Figure 6.6. Potential as a function of time measured in
each of four 500 L aliquots of 0.10 M N-ethylmorpholine
buffer (pH 8.5) containing 0.10 mM ARS, 0.10 M KCl, and 50
L of HbA1c having the concentrations given in the legend.
1.0 L of 2.0 M PBA in ethanol was added into the solution
at 1000 s.
105
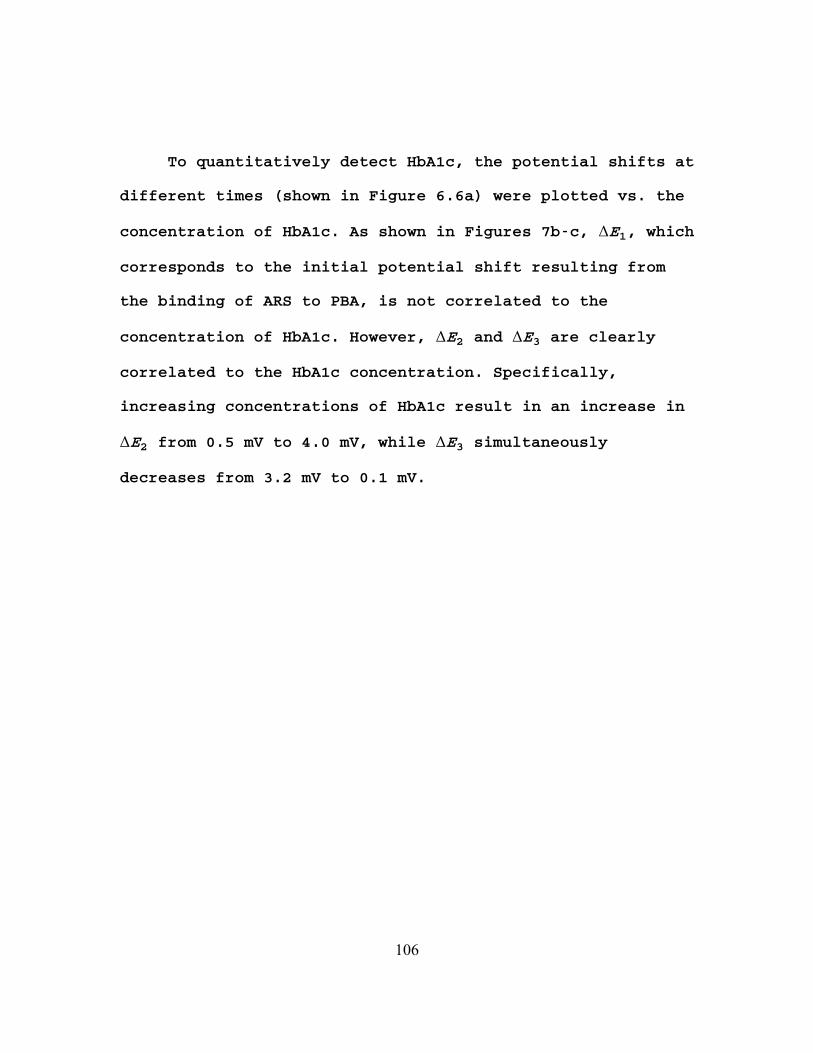
To quantitatively detect HbA1c, the potential shifts at
different times (shown in Figure 6.6a) were plotted vs. the
concentration of HbA1c. As shown in Figures 7b-c, ΔE1, which
corresponds to the initial potential shift resulting from
the binding of ARS to PBA, is not correlated to the
concentration of HbA1c. However, ΔE2 and ΔE3 are clearly
correlated to the HbA1c concentration. Specifically,
increasing concentrations of HbA1c result in an increase in
ΔE2 from 0.5 mV to 4.0 mV, while ΔE3 simultaneously
decreases from 3.2 mV to 0.1 mV.
106
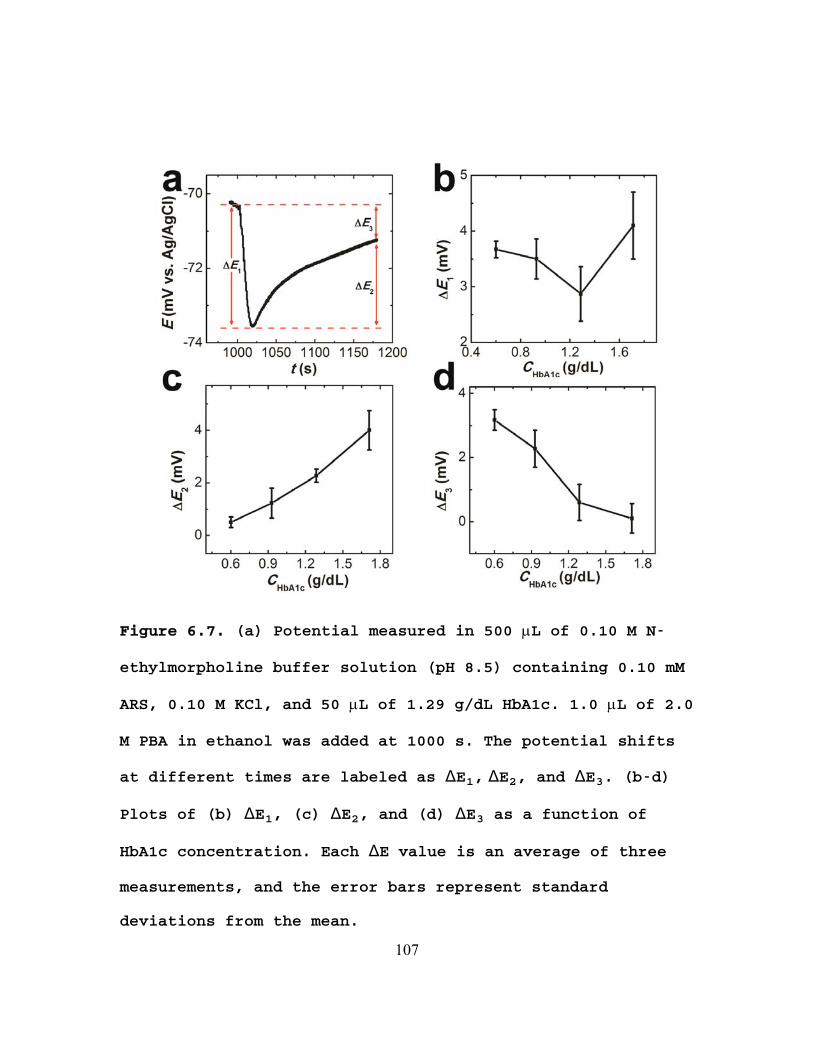
Figure 6.7. (a) Potential measured in 500 L of 0.10 M N-
ethylmorpholine buffer solution (pH 8.5) containing 0.10 mM
ARS, 0.10 M KCl, and 50 L of 1.29 g/dL HbA1c. 1.0 L of 2.0
M PBA in ethanol was added at 1000 s. The potential shifts
at different times are labeled as ∆E1, ∆E2, and ∆E3. (b-d)
Plots of (b) ∆E1, (c) ∆E2, and (d) ∆E3 as a function of
HbA1c concentration. Each ∆E value is an average of three
measurements, and the error bars represent standard
deviations from the mean.
107
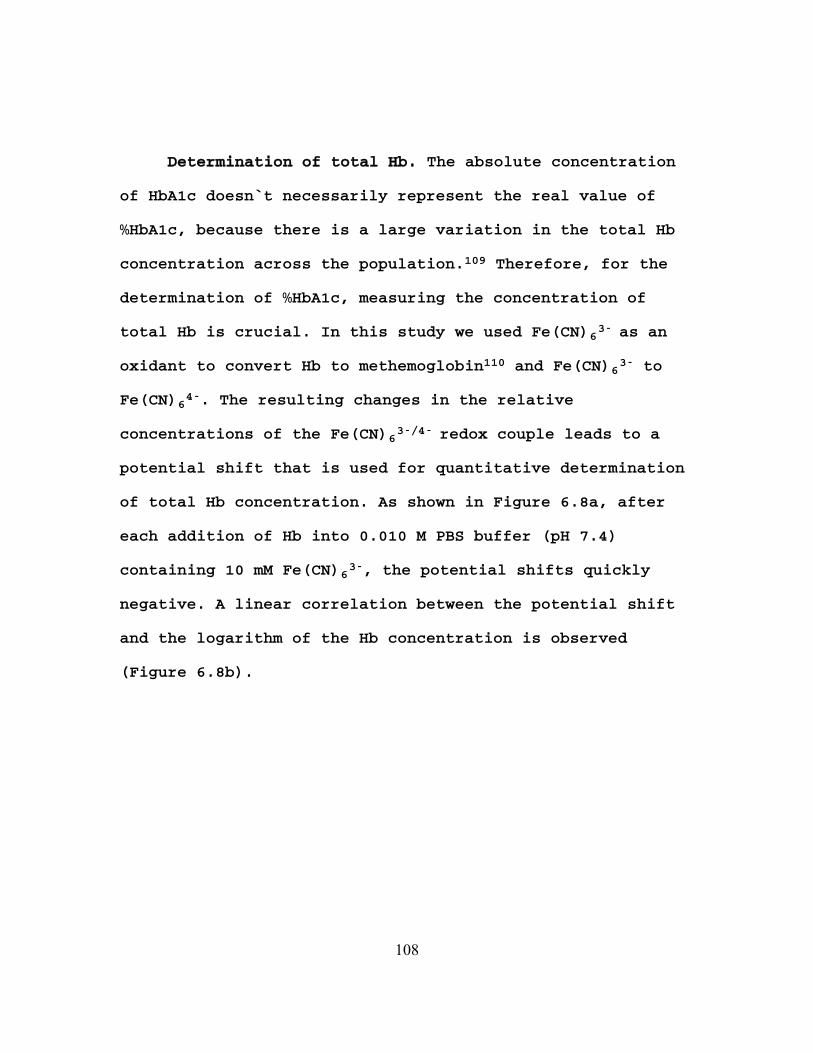
Determination of total Hb. The absolute concentration
of HbA1c doesn’t necessarily represent the real value of
%HbA1c, because there is a large variation in the total Hb
concentration across the population.109 Therefore, for the
determination of %HbA1c, measuring the concentration of
total Hb is crucial. In this study we used Fe(CN)63- as an
oxidant to convert Hb to methemoglobin110 and Fe(CN)63- to
Fe(CN)64-. The resulting changes in the relative
concentrations of the Fe(CN)63-/4- redox couple leads to a
potential shift that is used for quantitative determination
of total Hb concentration. As shown in Figure 6.8a, after
each addition of Hb into 0.010 M PBS buffer (pH 7.4)
containing 10 mM Fe(CN)63-, the potential shifts quickly
negative. A linear correlation between the potential shift
and the logarithm of the Hb concentration is observed
(Figure 6.8b).
108
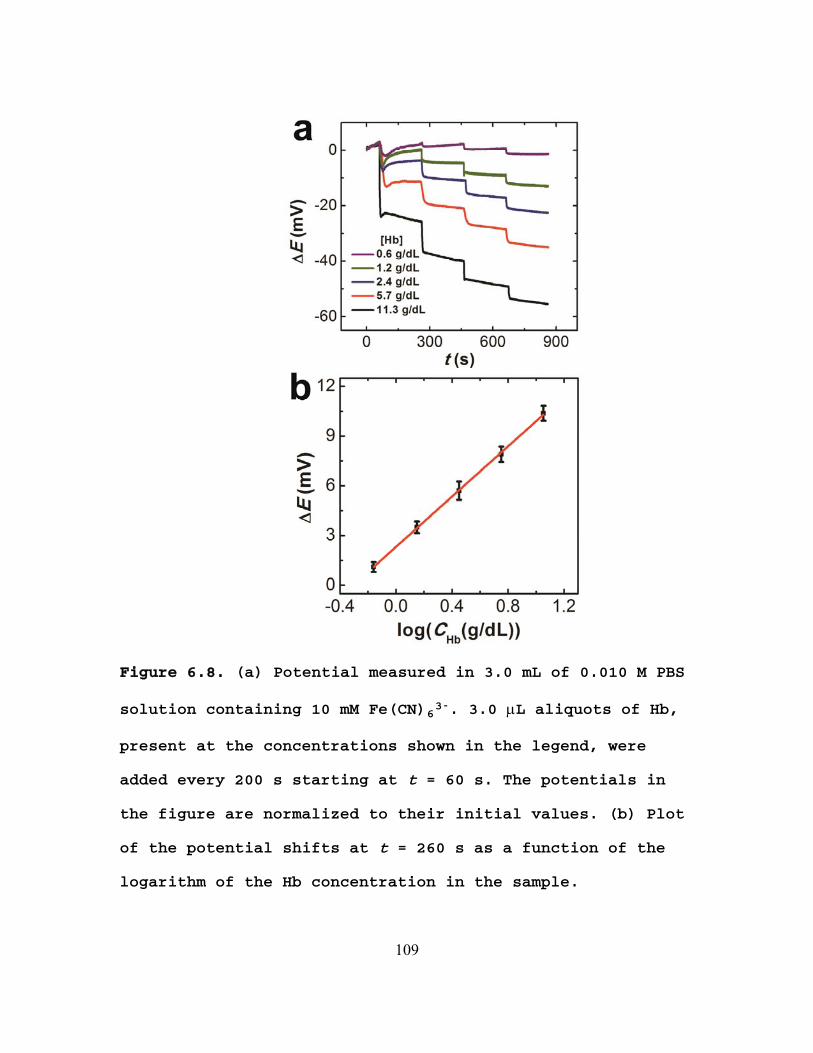
Figure 6.8. (a) Potential measured in 3.0 mL of 0.010 M PBS
solution containing 10 mM Fe(CN)63-. 3.0 L aliquots of Hb,
present at the concentrations shown in the legend, were
added every 200 s starting at t = 60 s. The potentials in
the figure are normalized to their initial values. (b) Plot
of the potential shifts at t = 260 s as a function of the
logarithm of the Hb concentration in the sample.
109
Comparison of this potentiometric method to reference
values for %HbA1c. Using the potentiometric methods
described thus far, the HbA1c concentration, Hb
concentration, and thus the %HbA1c in four blood samples
were determined. The HbA1c concentrations were analyzed by
measuring the potential shift, ΔE2 (Figure 6.7a), and
converting ΔE2 to the HbA1c concentration by interpolating
from the dose-response curve (Figure 6.7c) using eq 2.
(2) '''
')'''('
22
22HbA1cHbA1cHbA1cHbA1c EE
EECCCC
Here, ΔE2’ and ΔE2’’ are two nearest potential shifts
in Figure 6.7c, and CHbA1c’ and CHbA1c’’ are the corresponding
HbA1c concentrations. The Hb concentrations were determined
using the calibration curve shown in Figure 6.8b. The
results obtained using the potentiometric and a reference
method (Beckman CX, provided by the sample supplier) are
provided in Table 6.1. The %HbA1c determined using the
potentiometric method and the reference method are all
within 0.5%.
110
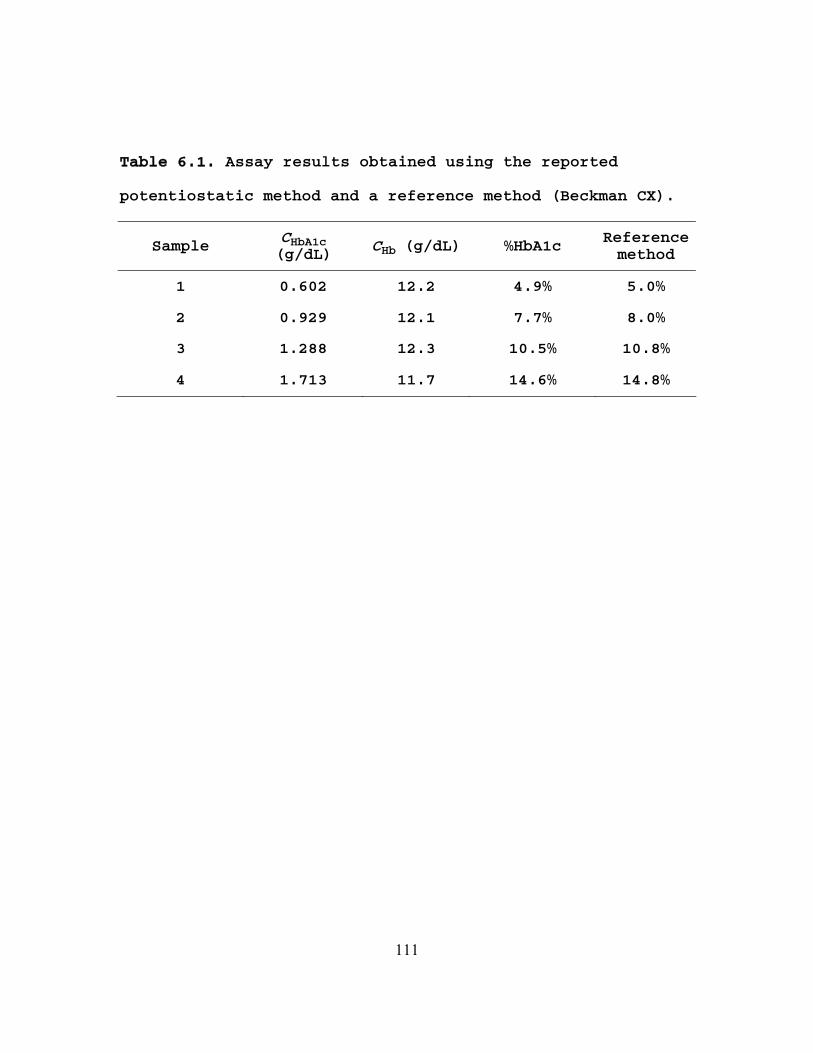
Table 6.1. Assay results obtained using the reported
potentiostatic method and a reference method (Beckman CX).
Sample CHbA1c (g/dL)
CHb (g/dL) %HbA1c Reference
method
1 0.602 12.2 4.9% 5.0%
2 0.929 12.1 7.7% 8.0%
3 1.288 12.3 10.5% 10.8%
4 1.713 11.7 14.6% 14.8%
111
6.5 Summary and Conclusions
We have reported a potentiometric method for measuring
the concentrations of HbA1c and Hb in human blood, and from
these values the %HbA1c. The key to this method is that
binding of ARS to PBA through diol-boronic acid complexation
leads to a negative shift of the redox potential and
competitive binding of HbA1c to PBA leads to the
displacement of ARS and thus a positive shift of the redox
potential. This positive shift in the solution potential is
linked to the HbA1c concentration. The total hemoglobin
concentration was determined by oxidizing Hb using Fe(CN)63-
and measuring the potential shift arising from the reduction
of Fe(CN)63-. Four blood samples were tested using this
method, and the results were in good agreement with that
determined by a reference method. The method reported here
is simple, low cost, and thus useful for point-of-care
diagnosis and management of diabetes mellitus. To further
improve the analytical performance of this method, we are
searching for optimal indicator molecules (i.e., a
replacement for ARS) as well as integrating the sensor onto
a microfluidic platform. The results of these experiments
will be reported in due course.
112
Chapter 7: Highly Reproducible Chronoamperometric Analysis
in Microdroplets
7.1 Synopsis
This chapter describes a method for highly reproducible
chronoamperometric analysis of the contents of microdroplets.
Aqueous microdroplets having volumes on the order of 1 nL
and separated by a fluorocarbon solvent are generated within
a microfluidic device using a T-shaped junction. The key
finding is that stable and reproducible quasi-steady-state
currents are observed if the electrochemical measurements
are made in a narrowed segment of a microchannel. Under
these conditions, the microdroplets are stretched, here by a
factor of 10, leading to desirable intradroplet mass
transfer characteristics. Microdroplet frequencies up to
0.67 s-1 are accessible using this method. The quasi-
steady-state currents resulting from chronoamperometric
analysis of microdroplets containing 1.0 mM Ru(NH3)63+ have
relative standard deviations of just 1.8% and 2.8% at flow
rates of 30 nL/min and 60 nL/min, respectively. Importantly,
the design of the microelectrochemical device ensures direct
contact between intradroplet redox molecules and the
electrode surface. That is, the fluorocarbon between
microdroplets does interfere with inner-sphere
113
electrocatalytic processes such as the oxygen reduction
reaction. Finite-element simulations are presented that are
in accord with the experimental findings.
7.2 Introduction
In this chapter we report an electrochemical method for
detection of analytes in segmented microdroplets present
within microfluidic channels. The significant new finding is
that by stretching the microdroplet 10-fold in a narrow
section of the microchannel, highly reproducible quasi-
steady-state chronoamperometric currents are obtained. The
magnitude of the experimentally determined current is
confirmed by numerical simulation. Finally, inner-sphere
electrochemical reactions, for example, the oxygen reduction
reaction (ORR), are observed in the chronoamperometric
analysis, which proves that there is intimate contact
between redox molecules and the electrode surface.
Segmented flow for applications to microfluidics was
originally reported by Quake and coworkers.45 Since that
time, it has been used to solve a number of problems
associated with analytical applications of microfluidic
systems. For example, due to laminar flow the rate of
mixing in standard fluidic microchannels is limited by
diffusional mass transport.46,47,48 However, mixing can be
114
accelerated by internal recirculating convection in a
flowing microdroplet.111 Moreover, pressure-driven flow in a
microchannel is parabolic, which leads to axial Taylor
dispersion and thus dilution of reagents.50 In contrast, the
immiscible organic phase between aqueous droplets
encapsulates reagents, thereby avoiding dilution.
Furthermore, nonspecific adsorption of reagents onto the
walls of traditional microfluidic channels can be
problematic,51 but this problem is avoided with segmented
flow since the aqueous microdroplet does not contact the
channel wall. Finally, poly(dimethylsiloxane) (PDMS), which
is a common material used for fabricating microfluidic
devices, is gas permeable and thus may lead to solvent
evaporation problems.47 This problem can also be solved by
the encapsulation of microdroplet using an immiscible liquid.
A number of methods have been reported for analyzing the
contents of microdroplets: fluorescence spectroscopy,49,52,53
Raman spectroscopy,54,55 mass spectrometry,56,57 and
electrochemical methods.58-60 Compared with other methods,
electrochemistry is relative simple and low cost, and it
provide information about mass transfer, electron transfer,
and coupled chemical processes that are difficult or
impossible to study using the aforementioned approaches.61
For example, Han et al.58 reported on the enzymatic kinetics
115
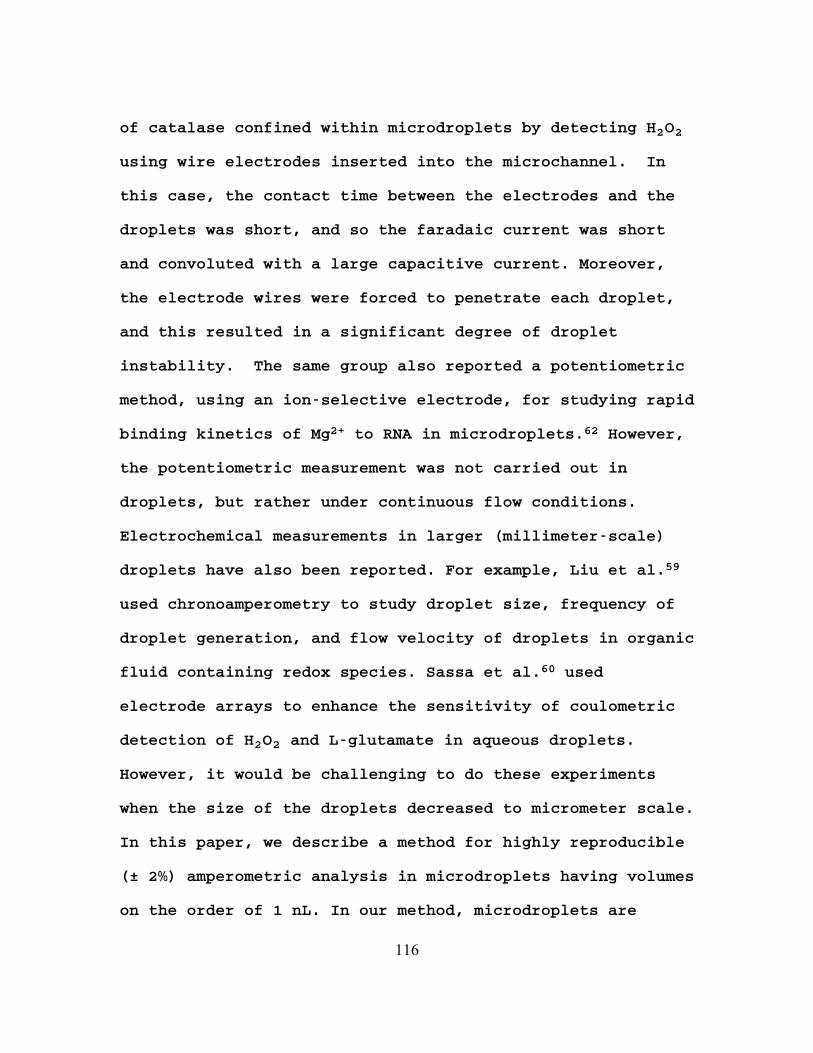
of catalase confined within microdroplets by detecting H2O2
using wire electrodes inserted into the microchannel. In
this case, the contact time between the electrodes and the
droplets was short, and so the faradaic current was short
and convoluted with a large capacitive current. Moreover,
the electrode wires were forced to penetrate each droplet,
and this resulted in a significant degree of droplet
instability. The same group also reported a potentiometric
method, using an ion-selective electrode, for studying rapid
binding kinetics of Mg2+ to RNA in microdroplets.62 However,
the potentiometric measurement was not carried out in
droplets, but rather under continuous flow conditions.
Electrochemical measurements in larger (millimeter-scale)
droplets have also been reported. For example, Liu et al.59
used chronoamperometry to study droplet size, frequency of
droplet generation, and flow velocity of droplets in organic
fluid containing redox species. Sassa et al.60 used
electrode arrays to enhance the sensitivity of coulometric
detection of H2O2 and L-glutamate in aqueous droplets.
However, it would be challenging to do these experiments
when the size of the droplets decreased to micrometer scale.
In this paper, we describe a method for highly reproducible
(± 2%) amperometric analysis in microdroplets having volumes
on the order of 1 nL. In our method, microdroplets are
116
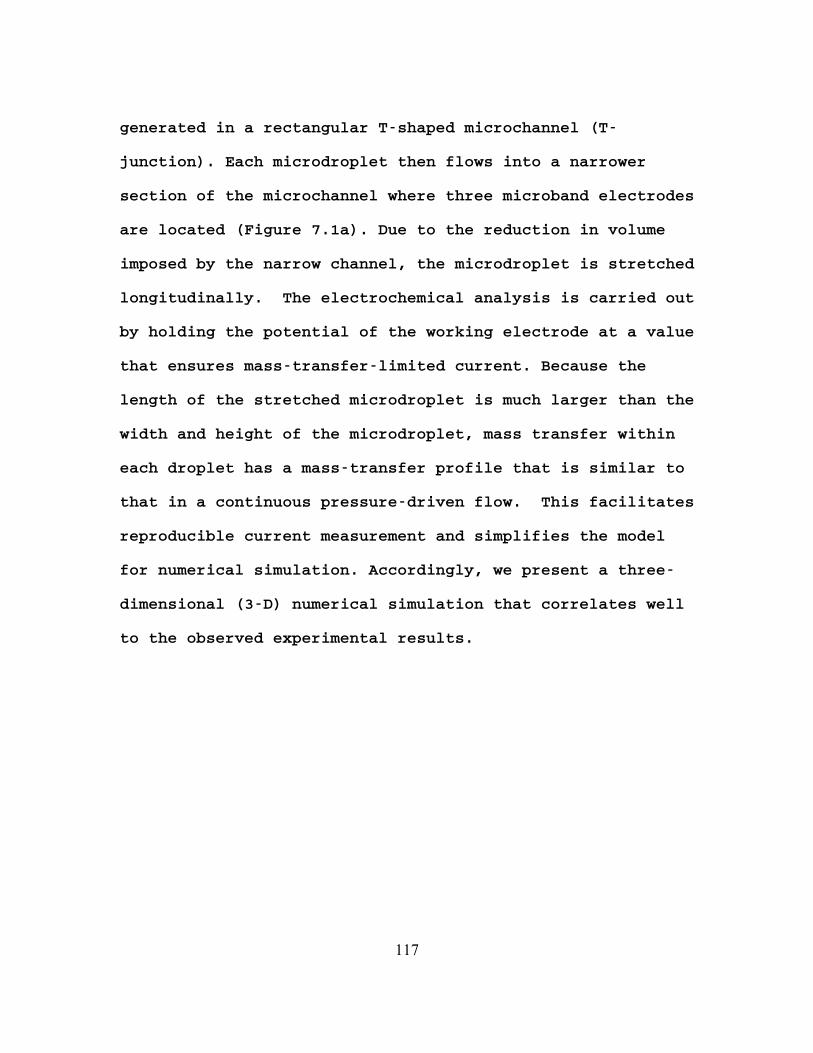
generated in a rectangular T-shaped microchannel (T-
junction). Each microdroplet then flows into a narrower
section of the microchannel where three microband electrodes
are located (Figure 7.1a). Due to the reduction in volume
imposed by the narrow channel, the microdroplet is stretched
longitudinally. The electrochemical analysis is carried out
by holding the potential of the working electrode at a value
that ensures mass-transfer-limited current. Because the
length of the stretched microdroplet is much larger than the
width and height of the microdroplet, mass transfer within
each droplet has a mass-transfer profile that is similar to
that in a continuous pressure-driven flow. This facilitates
reproducible current measurement and simplifies the model
for numerical simulation. Accordingly, we present a three-
dimensional (3-D) numerical simulation that correlates well
to the observed experimental results.
117
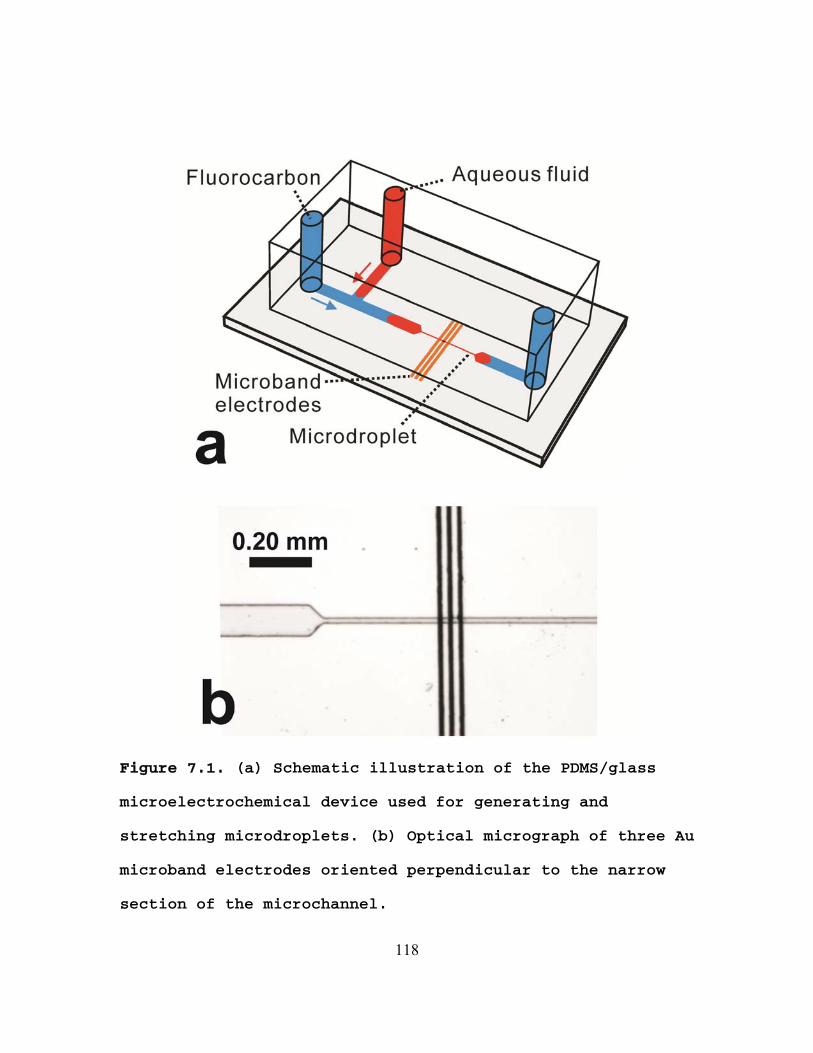
Figure 7.1. (a) Schematic illustration of the PDMS/glass
microelectrochemical device used for generating and
stretching microdroplets. (b) Optical micrograph of three Au
microband electrodes oriented perpendicular to the narrow
section of the microchannel.
118
7.3 Experimental
Chemicals. The silicone elastomer and curing agent
(Sylgard 184) used to prepare the PDMS microfluidic devices
were obtained from Dow Corning, (Midland, MI). A
fluorocarbon solution (PFDO) containing a 10:1 (v/v)
mixture of perfluorodecalin (mixture of cis and trans, 95%,
Acros Organics) and 1H,1H,2H,2H-perfluoro-1-octanol (97%,
Sigma-Aldrich) was used as the fluorocarbon carrier solution.
Hexamine ruthenium (III) chloride (Ru(NH3)63+, >99.9%) and
ferrocenemethanol (FcMeOH, 97%) were purchased from Sigma-
Aldrich. KNO3 (Fisher Scientific) was used as the supporting
electrolyte. All aqueous solutions were prepared with
deionized water (18.0 MΩ﹒cm, Milli-Q Gradient System,
Millipore). All reagents were used as received without
further purification.
Microelectrochemical devices. The hybrid PDMS/glass
microelectrochemical devices were fabricated using a
previously published procedure.112,113 Briefly, the T-
junction (Figure 7.1a) was fabricated from PDMS using the
replica micromolding method.112 The main microchannel was
100 μm wide and 21 μm high. A smaller channel segment (10
μm wide and 21 μm high), which was used to stretch the
microdroplets, was inserted in the middle of the main
119
channel (Figure 7.1a). Reservoirs (1.0 mm in diameter) were
punched at each end of the microchannel to accommodate the
ingress and egress of fluids. Three Au microband electrodes
were microfabricated from Au-coated glass slide (100 nm Au
atop a 5 nm Cr adhesion layer, Evaporated Metal Films,
Ithaca, NY) using standard photolithography.113 The
electrodes were 25 μm wide with an edge-to-edge spacing of
10 μm. Finally, the PDMS and the glass side were exposed to
an O2 plasma (60 W, model PDC-32F, Harrick Scientific,
Ossining, NY) for 15 s and then bonded together permanently
with the Au electrodes oriented perpendicular to the narrow
section of the microchannel. Two gas-tight, glass syringes
(Hamilton Company, Reno, NV), having maximum volumes of 25
μL and 50 μL, were driven by a syringe pump (Pump 11 pico
plus elite, Harvard Apparatus, Holliston, MA) and used for
injecting fluorocarbon and aqueous solutions, respectively,
into the microchannel. The syringes were connected to the
reservoirs using Teflon tubing.
Silanization of microchannel. After assembly, the
microchannel was silanized.114 Briefly, the vapor of
1H,1H,2H,2H-perfluorooctyl-trichlorosilane (Sigma-Aldrich)
was entrained within a N2 gas stream and then introduced
into the microchannel at a flow rate of 5.0 μL/min for 60
min. Next, the device was heated to 80 oC for 30 min, and
120
then it was rinsed sequentially with acetone and water. A
separate experiment was undertaken to study the surface
properties of the glass, PDMS, and Au electrodes before and
after silanization. In this case, the silanization
procedure was carried out prior to assembly of the
microfluidic device. For these experiments, 10 μL of the
PFDO solution or deionized water was dropcast onto each of
the three surfaces, and a micrograph of the droplet was
immediately imaged using a contact-angle goniometer (Model
100-00-115, Rame Hart, Netcong, NJ).
Electrodeposition of Ag. A Ag quasi-reference (QRE)
was prepared within the microchannel by electrodepositing Ag
onto the central Au microband (Figure 7.1a).115 Briefly, a
Ag wire (0.25 mm in diameter, 99.9%, Sigma-Aldrich) was
inserted into the downstream reservoir to act as a QRE and
counter electrode for the electrodeposition. An aqueous
solution containing 0.050 M AgNO3 (Sigma-Aldrich), 1.0 M
NaNO3 (Fisher Scientific), and 0.50 M NH4OH (Sigma-Aldrich)
was introduced into the microchannel at a flow rate of 0.60
μL/min. Next, the central Au microband was cleaned
electrochemically by holding its potential at 0.950 V vs. Ag
QRE for 30 s. Finally, Ag was electrodeposited by holding
the electrode potential at -0.200 V vs. Ag QRE for 15 s, and
121
then the microchannel was rinsed using 0.50 M NH4OH aqueous
solution followed by water.
Optical imaging and electrochemistry. An inverted
microscope (Eclipse TE 2000-U, Nikon, Tokyo, Japan)
configured with a CCD camera (Cascade, Photometrics Ltd.,
Tucson, AZ) was used to image the microdroplets and the
three microband electrodes in the narrow section of the
microchannel. Micrographs of Au microband electrodes with
and without an electrodeposited Ag layer were obtained using
an optical microscope (Nikon AZ 100, Nikon, Tokyo, Japan)
equipped with a CCD camera (Cascade, Photometrics Ltd.,
Tucson, AZ). The optical micrographs were processed using
V++ Precision Digital Imaging software (Digital Optics,
Auckland, New Zealand). A potentiostat (Model 650c, CH
Instruments, Austin, TX) was used for all electrochemical
experiments. Quasi-steady-state currents of redox species in
microdroplets were measured at the end of current transients.
Numerical simulation. 3-D numerical simulation of the
electrochemical experiment was carried out using the COMSOL
multiphysics software package (Burlington, MA). The fluidic
dynamics and the mass transfer problems were solved using
the incompressible Navier-Stokes and convection–diffusion
equations, respectively. A portion of the narrow
microchannel having the electrode boundary was chosen as the
122
subdomain. A free mesh method using triangular elements was
used for meshing the subdomain. The mesh was optimized by
gradually reducing the size of mesh unit near the electrode
boundary until a convergent solution of current was obtained.
The steady-state current was calculated based on the
integral of the normal concentration gradient of redox
species at the electrode boundary.
7.4 Results and Discussion
Silanization of microchannel. Reproducible generation
of size-monodisperse microdroplets flowing at a relatively
low rate is crucial for quantitative electrochemical
measurements. To generate microdroplets in the microchannel,
the surface of the microchannel must be rendered hydrophobic
or else two immiscible fluids may flow parallel to each
other without forming microdroplets.116 Here, we used a
PDMS-glass hybrid microfluidic chip, and the surface of the
microchannel was modified by silanization using 1H,1H,2H,2H-
perfluorooctyl-trichlorosilane. The effects of silanization
on the surface properties of glass, PDMS, and Au slides were
studied using contact-angle measurements. The results
(Figure 7.2) show that the water contact angles for the
glass and PDMS surfaces increase after the silanization,
while the PFDO contact angles decrease. These measurements
123
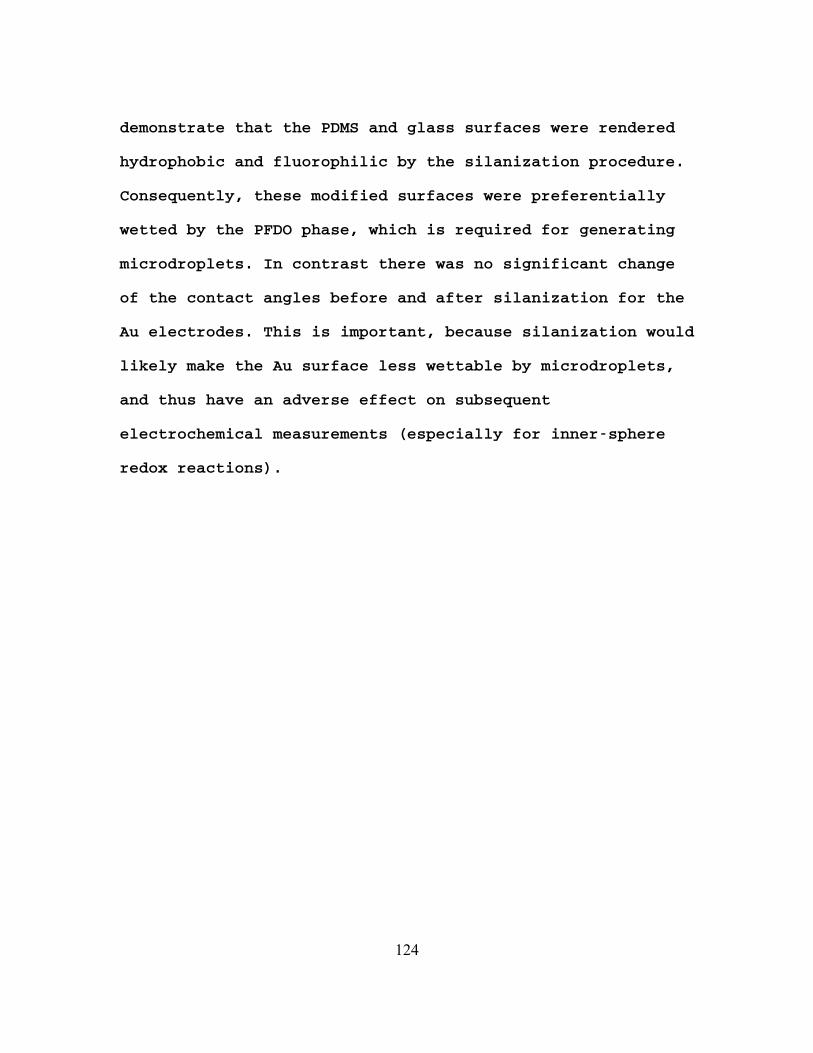
demonstrate that the PDMS and glass surfaces were rendered
hydrophobic and fluorophilic by the silanization procedure.
Consequently, these modified surfaces were preferentially
wetted by the PFDO phase, which is required for generating
microdroplets. In contrast there was no significant change
of the contact angles before and after silanization for the
Au electrodes. This is important, because silanization would
likely make the Au surface less wettable by microdroplets,
and thus have an adverse effect on subsequent
electrochemical measurements (especially for inner-sphere
redox reactions).
124
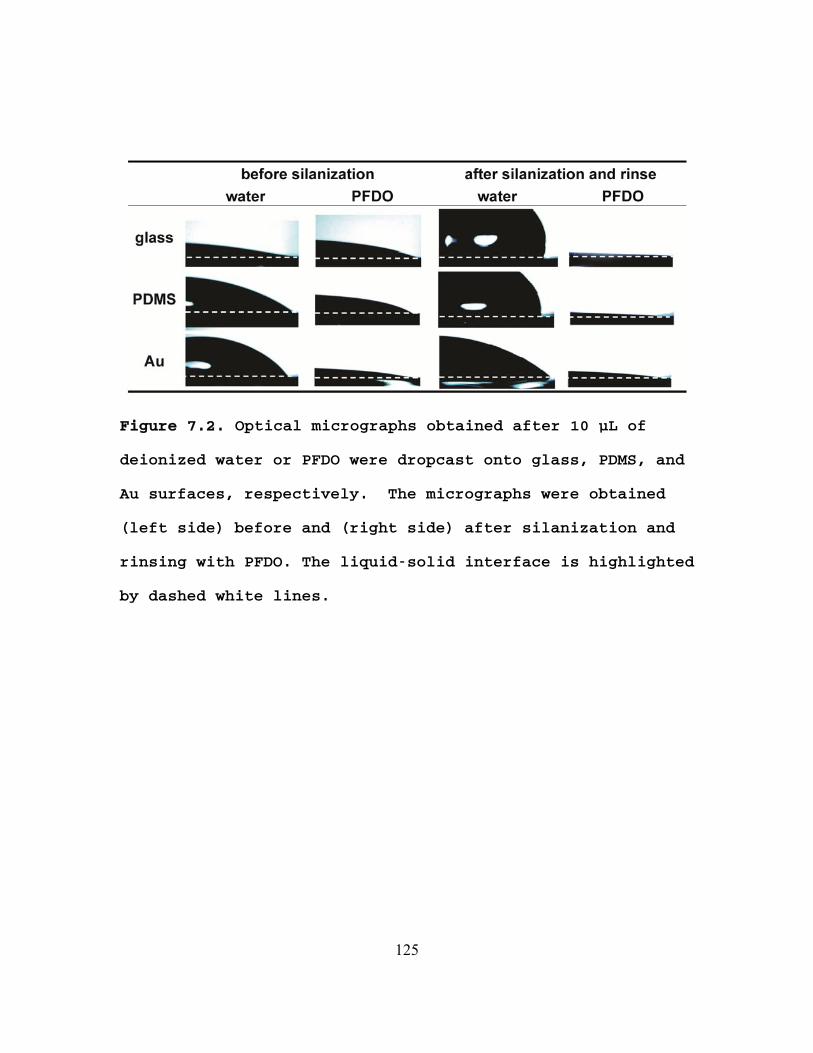
Figure 7.2. Optical micrographs obtained after 10 μL of
deionized water or PFDO were dropcast onto glass, PDMS, and
Au surfaces, respectively. The micrographs were obtained
(left side) before and (right side) after silanization and
rinsing with PFDO. The liquid-solid interface is highlighted
by dashed white lines.
125
Generation of microdroplets. As shown in Figures 7.1
and 7.3, a T-junction was fabricated and silanized to
generate microdroplets. This part of the microchannel is 100
μm wide and 21 μm high. The PFDO solution containing a 10:1
(v/v) mixture of perfluorodecalin and 1H,1H,2H,2H-perfluoro-
1-octanol was injected into the main channel at 10 nL/min,
and an aqueous solution containing 1.0 mM Ru(NH3)63+ and
0.10 M KNO3 was injected into the side channel at 20 nL/min.
The microdroplets spontaneously formed at the intersection
of these two channels
.
126
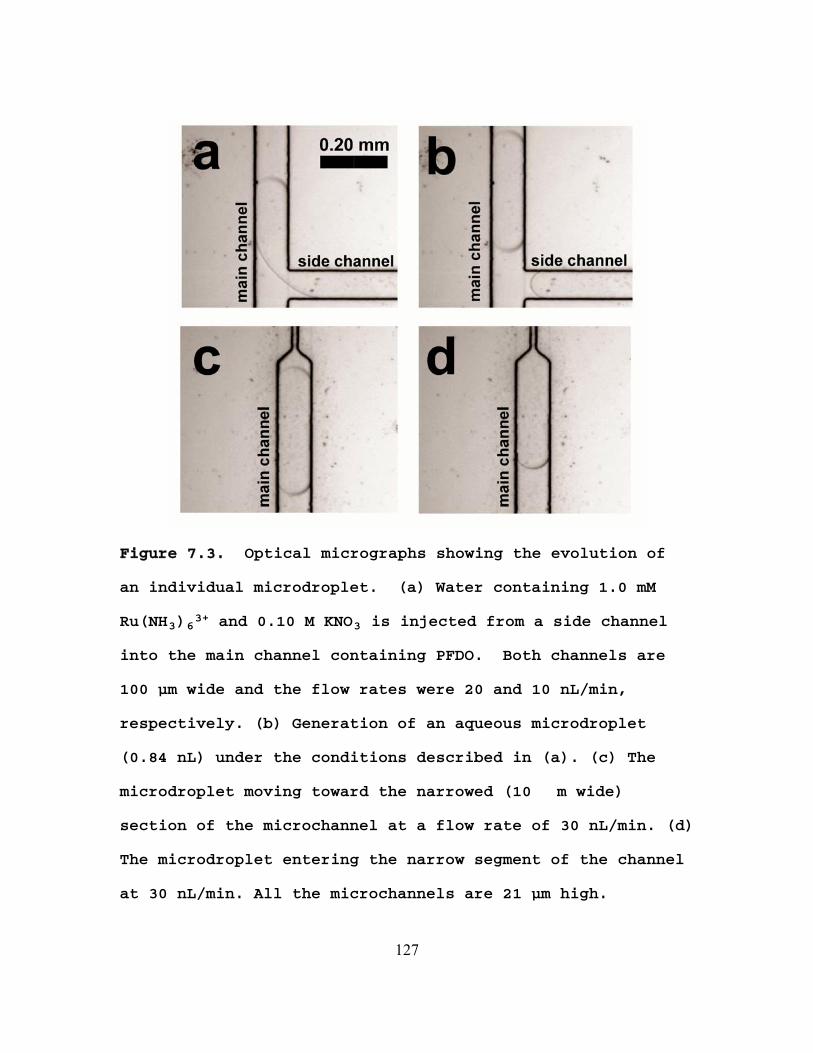
Figure 7.3. Optical micrographs showing the evolution of
an individual microdroplet. (a) Water containing 1.0 mM
Ru(NH3)63+ and 0.10 M KNO3 is injected from a side channel
into the main channel containing PFDO. Both channels are
100 μm wide and the flow rates were 20 and 10 nL/min,
respectively. (b) Generation of an aqueous microdroplet
(0.84 nL) under the conditions described in (a). (c) The
microdroplet moving toward the narrowed (10 m wide)
section of the microchannel at a flow rate of 30 nL/min. (d)
The microdroplet entering the narrow segment of the channel
at 30 nL/min. All the microchannels are 21 μm high.
127
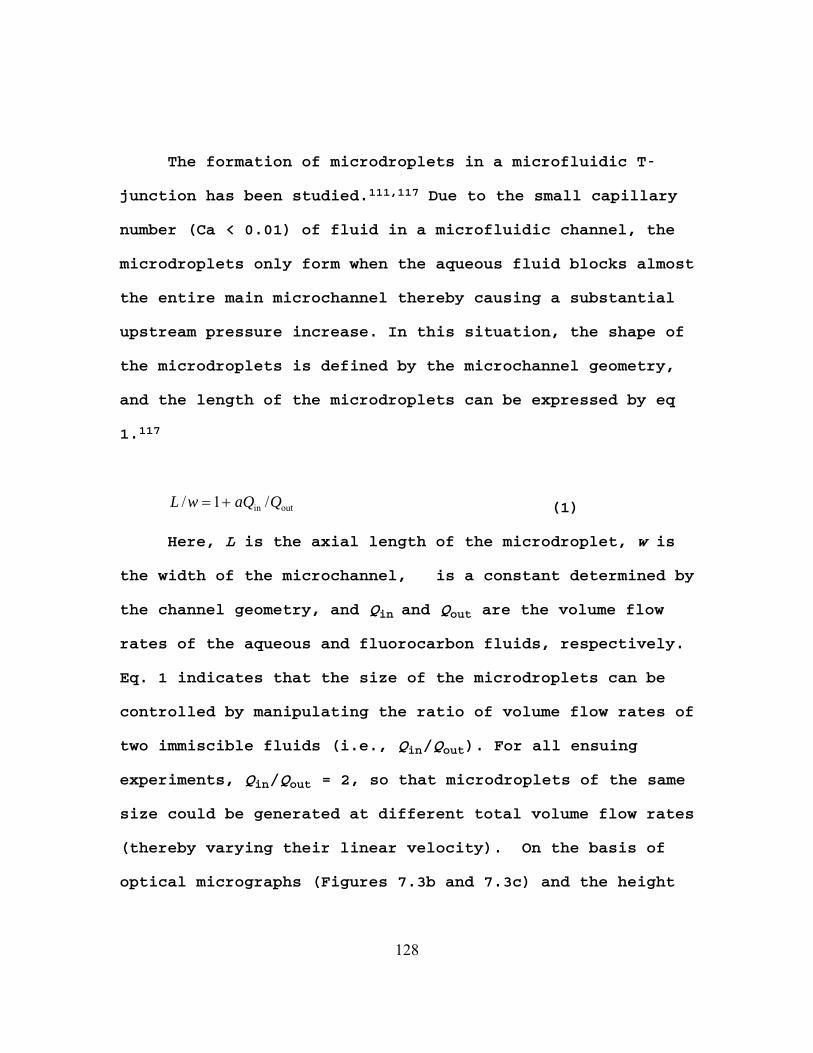
The formation of microdroplets in a microfluidic T-
junction has been studied.111,117 Due to the small capillary
number (Ca < 0.01) of fluid in a microfluidic channel, the
microdroplets only form when the aqueous fluid blocks almost
the entire main microchannel thereby causing a substantial
upstream pressure increase. In this situation, the shape of
the microdroplets is defined by the microchannel geometry,
and the length of the microdroplets can be expressed by eq
1.117
L /w 1 aQin /Qout (1)
Here, L is the axial length of the microdroplet, w is
the width of the microchannel, α is a constant determined by
the channel geometry, and Qin and Qout are the volume flow
rates of the aqueous and fluorocarbon fluids, respectively.
Eq. 1 indicates that the size of the microdroplets can be
controlled by manipulating the ratio of volume flow rates of
two immiscible fluids (i.e., Qin/Qout). For all ensuing
experiments, Qin/Qout = 2, so that microdroplets of the same
size could be generated at different total volume flow rates
(thereby varying their linear velocity). On the basis of
optical micrographs (Figures 7.3b and 7.3c) and the height
128
of the microchannel, the volume of the microdroplets was
determined to be 0.84 nL.
Stretching of microdroplets. The microdroplets
generated in the T-junction were directed into a narrow
downstream microchannel (10 μm wide and 21 μm high, Figures
7.1 and 7.4) for chronoamperometric measurement of redox
molecules entrained within the aqueous phase. Because the
cross-sectional area of the narrow segment of the main
microchannel is ten times smaller than that of the wide
segment, and because the fluids are incompressible, the
microdroplets were stretched ten-fold along the axial
direction. The presence of 1H,1H,2H,2H-perfluoro-1-octanol
in the PFDO phase, which is a surfactant, reduces the
surface tension at the water-PFDO interface.111 Therefore,
no breaking of microdroplets was observed during the
stretching process. The time required for a microdroplet to
completely enter the narrow channel was ~0.75 s and that the
time separation between two microdroplets was ~3.1 s.
Fabrication of the QRE and electrochemical
characterization. To enable chronoamperometric analysis of
the stretched microdroplets, Au microband electrodes (each
25 μm wide) were microfabricated on the glass slide and
oriented perpendicular to the narrow microchannel. As shown
in Figure 7.1, the upstream Au electrode was the working
129
electrode, the one in the middle was the QRE, and the
counter electrode was downstream. As discussed in the
Experimental Section, the QRE was prepared by
electrodepositing Ag onto the surface of the central Au
microband. As shown in Figure 7.4a, Ag electrodeposition
changed the optical contrast of the underlying Au microband,
which confirmed the presence of the Ag layer. On the basis
of the charge passed during electrodeposition (1.57 C) and
the exposed area of the microband (250 μm2), the thickness
of the electrodeposited Ag layer was ~770 nm.115 Because the
channel height is 21 μm and the working electrode is 10 μm
upstream of the QRE, the presence of the Ag layer should not
affect electrochemical measurements.
130
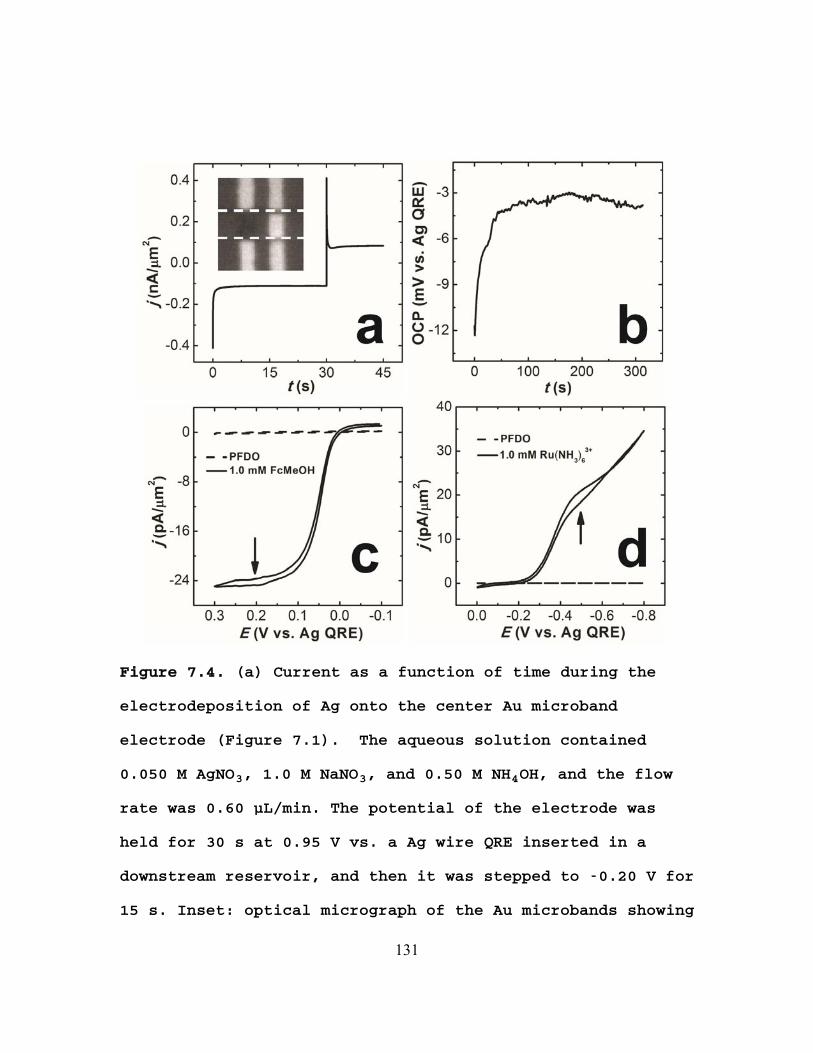
Figure 7.4. (a) Current as a function of time during the
electrodeposition of Ag onto the center Au microband
electrode (Figure 7.1). The aqueous solution contained
0.050 M AgNO3, 1.0 M NaNO3, and 0.50 M NH4OH, and the flow
rate was 0.60 μL/min. The potential of the electrode was
held for 30 s at 0.95 V vs. a Ag wire QRE inserted in a
downstream reservoir, and then it was stepped to -0.20 V for
15 s. Inset: optical micrograph of the Au microbands showing
131
Ag electrodeposited on the leftmost electrode. The location
of the microchannel is highlighted by the dashed white lines.
(b) The OCP of the Ag-coated microband electrode as a
function of time. The potential was measured using a Ag
wire QRE inserted into the downstream reservoir immediately
after electrodeposition of Ag. (c) Cyclic voltammograms
obtained in an aqueous solution containing 1.0 mM FcMeOH and
0.10 M KNO3 (solid line) or PFDO (dashed line). The flow
rate was 300 nL/min, the potential was measured using the
electrodeposited Ag QRE, and the scan rate was 10 mV/s. (d)
Cyclic voltammograms obtained in an aqueous solution
containing 1.0 mM Ru(NH3)63+ and 0.10 M KNO3 (solid line) or
in PFDO (dash line). The flow rate was 300 nL/min, the
potential was measured using the electrodeposited Ag QRE,
and the scan rate was 50 mV/s. The potentials used to obtain
the chronoamperometric measurements in Figures 7.5 and 7.6
are marked by arrows.
132
The open-circuit potential (OCP) of the
electrodeposition solution measured using the
electrodeposited Ag QRE was found to be sufficiently stable.
This measurement was made by inserting a Ag wire QRE into
the downstream reservoir, and recording the OCP as a
function of time immediately after electrodeposition of Ag.
As shown in Figure 7.4b, the potential drifted from -12 mV
to -4 mV in > 5 min.
The three-electrode system illustrated in Figure 7.1
was tested by carrying out cyclic voltammetric analysis of
1.0 FcMeOH (Figure 7.4c) and 1.0 mM Ru(NH3)63+(Figure 7.4d)
using 0.10 M KNO3 as the supporting electrolyte in a
continuous, flowing (300 nL/min) aqueous stream. The onset
of current arising from oxidation of 1.0 mM FcMeOH is at 0 V
vs. Ag QRE, and the current reaches a steady-state, mass-
transfer-limited current at ~0.200 V vs. Ag QRE. In Figure
7.4d, the onset current arising from the reduction of 1.0 mM
Ru(NH3)63+ was observed at ~ -0.200 V vs. Ag QRE. In this
case, no well-defined mass-transfer-limited current was
observed due to the onset of the ORR. The ORR is difficult
to avoid in PDMS microchannels due to its high O2
permeability.118 When the aqueous solution was replaced with
133
PFDO under the same conditions used for Figures 7.4c and
7.4d, no current was observed.
Chronoamperometry in microdroplets. Chronoamperometric
analysis of Ru(NH3)63+ in microdroplets was carried out by
holding the working electrode at the potential marked in
Figure 7.4d and measuring the resulting current. Figure 7.5
shows the chronoamperometric response obtained from a series
of microdroplets containing 1.0 mM Ru(NH3)63+ and 0.10 M KNO3
at total flow rates of 30 and 60 nL/min. First consider the
data obtained at the flow rate of 30 nL/min (Figures 7.5a
and 7.5b). A series of current transients, each lasting
~0.30 s, is observed during the time that the aqueous
microdroplets are present within the narrow microchannel
segment. The duration of these current excursions is
smaller than the overall residence time (~0.75 s) of the
microdroplets within the narrow segment of the channel.
However, the time between current pulses, ~3.0 s, is in good
agreement with the temporal separation of the microdroplets
(~3.0 s and 3.1 s, respectively). Figure 7.5b shows that the
initial current is high for each droplet, then it decreases
with time, and finally it approaches a quasi-steady-state
value of 33.7 ± 0.6 pA/ m2 (relative standard deviation =
1.8%).
134
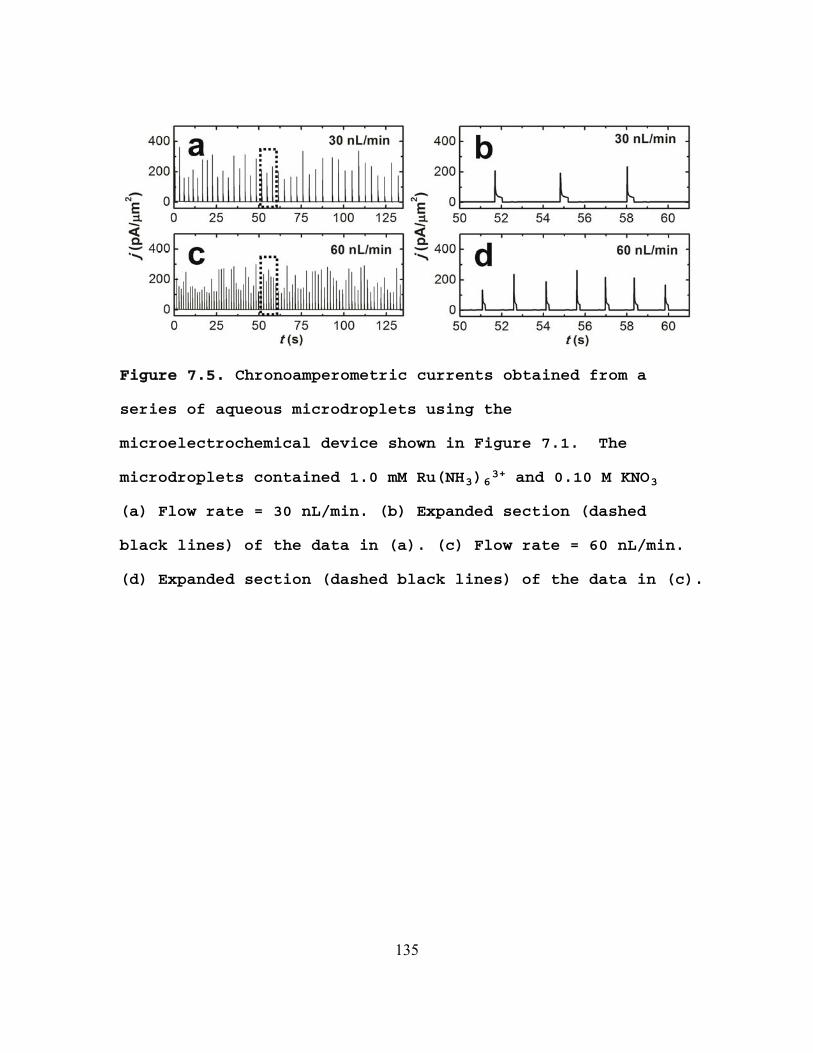
Figure 7.5. Chronoamperometric currents obtained from a
series of aqueous microdroplets using the
microelectrochemical device shown in Figure 7.1. The
microdroplets contained 1.0 mM Ru(NH3)63+ and 0.10 M KNO3
(a) Flow rate = 30 nL/min. (b) Expanded section (dashed
black lines) of the data in (a). (c) Flow rate = 60 nL/min.
(d) Expanded section (dashed black lines) of the data in (c).
135
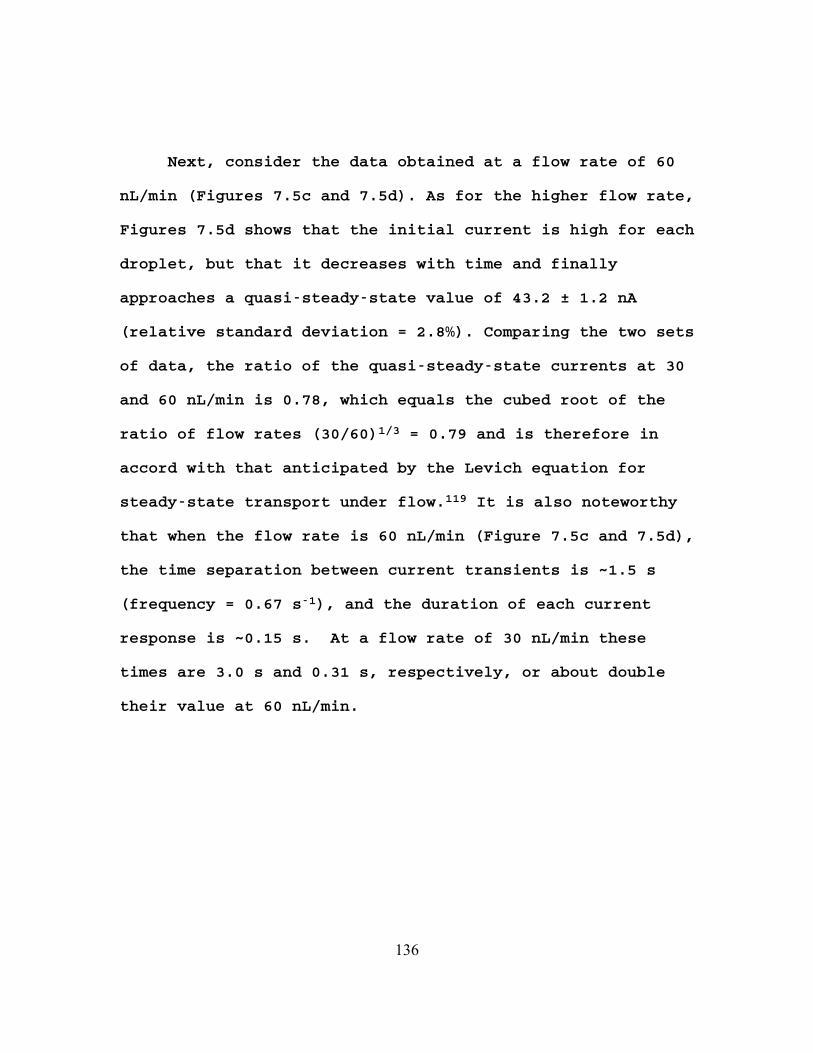
Next, consider the data obtained at a flow rate of 60
nL/min (Figures 7.5c and 7.5d). As for the higher flow rate,
Figures 7.5d shows that the initial current is high for each
droplet, but that it decreases with time and finally
approaches a quasi-steady-state value of 43.2 ± 1.2 nA
(relative standard deviation = 2.8%). Comparing the two sets
of data, the ratio of the quasi-steady-state currents at 30
and 60 nL/min is 0.78, which equals the cubed root of the
ratio of flow rates (30/60)1/3 = 0.79 and is therefore in
accord with that anticipated by the Levich equation for
steady-state transport under flow.119 It is also noteworthy
that when the flow rate is 60 nL/min (Figure 7.5c and 7.5d),
the time separation between current transients is ~1.5 s
(frequency = 0.67 s-1), and the duration of each current
response is ~0.15 s. At a flow rate of 30 nL/min these
times are 3.0 s and 0.31 s, respectively, or about double
their value at 60 nL/min.
136
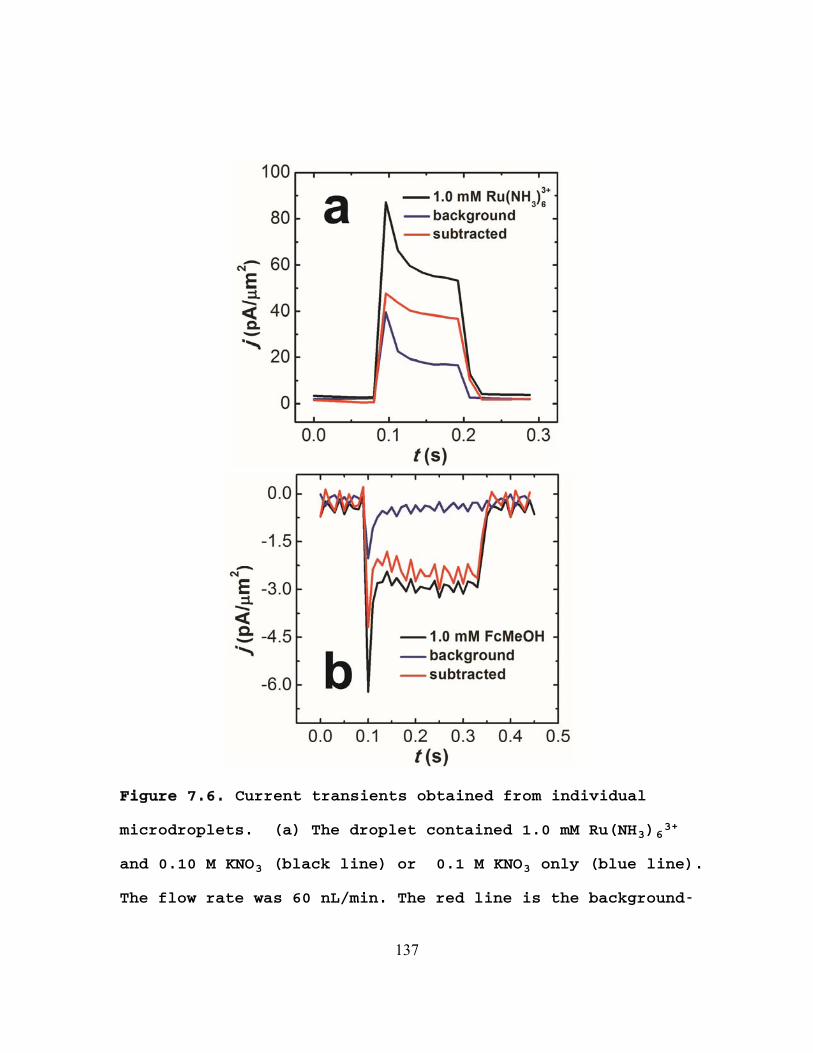
Figure 7.6. Current transients obtained from individual
microdroplets. (a) The droplet contained 1.0 mM Ru(NH3)63+
and 0.10 M KNO3 (black line) or 0.1 M KNO3 only (blue line).
The flow rate was 60 nL/min. The red line is the background-
137

subtracted current arising from reduction of Ru(NH3)63+. (b)
The droplet contained 1.0 mM FcMeOH and 0.10 M KNO3 (black
line) or 0.1 M KNO3 only (blue line). The flow rate was 30
nL/min. The red line is the background-subtracted current
arising from oxidation of FcMeOH. The working electrodes
were held at the potentials marked by the arrows in Figures
7.4d and 7.4c, respectively.
138
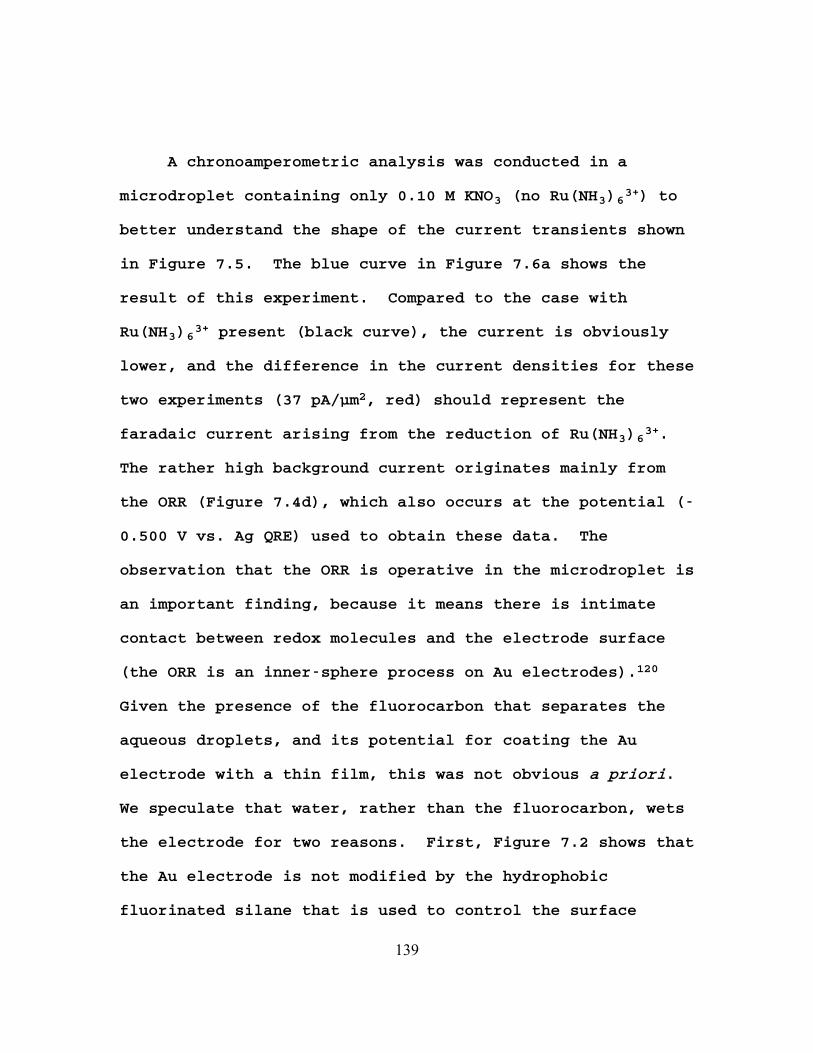
A chronoamperometric analysis was conducted in a
microdroplet containing only 0.10 M KNO3 (no Ru(NH3)63+) to
better understand the shape of the current transients shown
in Figure 7.5. The blue curve in Figure 7.6a shows the
result of this experiment. Compared to the case with
Ru(NH3)63+ present (black curve), the current is obviously
lower, and the difference in the current densities for these
two experiments (37 pA/μm2, red) should represent the
faradaic current arising from the reduction of Ru(NH3)63+.
The rather high background current originates mainly from
the ORR (Figure 7.4d), which also occurs at the potential (-
0.500 V vs. Ag QRE) used to obtain these data. The
observation that the ORR is operative in the microdroplet is
an important finding, because it means there is intimate
contact between redox molecules and the electrode surface
(the ORR is an inner-sphere process on Au electrodes).120
Given the presence of the fluorocarbon that separates the
aqueous droplets, and its potential for coating the Au
electrode with a thin film, this was not obvious a priori.
We speculate that water, rather than the fluorocarbon, wets
the electrode for two reasons. First, Figure 7.2 shows that
the Au electrode is not modified by the hydrophobic
fluorinated silane that is used to control the surface
139
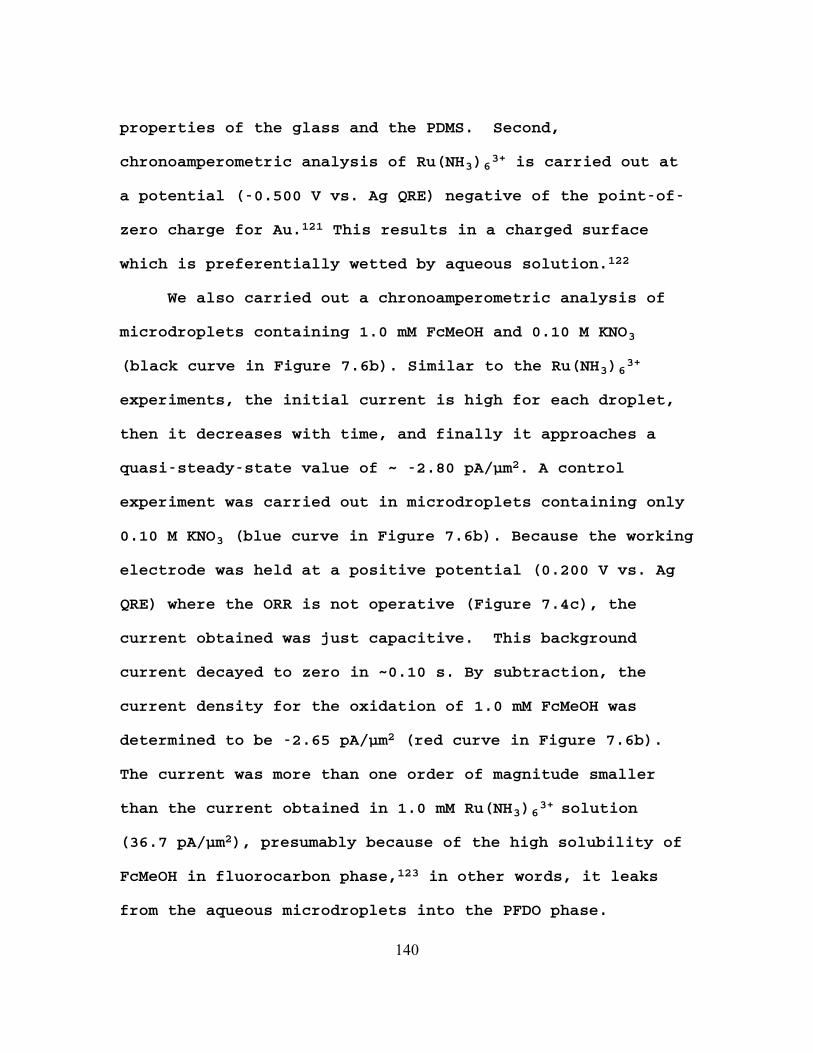
properties of the glass and the PDMS. Second,
chronoamperometric analysis of Ru(NH3)63+ is carried out at
a potential (-0.500 V vs. Ag QRE) negative of the point-of
zero charge for Au.
-
phase.
121 This results in a charged surface
which is preferentially wetted by aqueous solution.122
We also carried out a chronoamperometric analysis of
microdroplets containing 1.0 mM FcMeOH and 0.10 M KNO3
(black curve in Figure 7.6b). Similar to the Ru(NH3)63+
experiments, the initial current is high for each droplet,
then it decreases with time, and finally it approaches a
quasi-steady-state value of ~ -2.80 pA/μm2. A control
experiment was carried out in microdroplets containing only
0.10 M KNO3 (blue curve in Figure 7.6b). Because the working
electrode was held at a positive potential (0.200 V vs. Ag
QRE) where the ORR is not operative (Figure 7.4c), the
current obtained was just capacitive. This background
current decayed to zero in ~0.10 s. By subtraction, the
current density for the oxidation of 1.0 mM FcMeOH was
determined to be -2.65 pA/μm2 (red curve in Figure 7.6b).
The current was more than one order of magnitude smaller
than the current obtained in 1.0 mM Ru(NH3)63+ solution
(36.7 pA/μm2), presumably because of the high solubility of
FcMeOH in fluorocarbon phase,123 in other words, it leaks
from the aqueous microdroplets into the PFDO
140
Numerical simulation. Internal convection within a
flowing microdroplet has been simulated previously.124 The
results indicated that unless at two extremities of the
microdroplet, the mass transfer in the flowing microdroplet
is similar to a continuous pressure-driven flow. In our case,
the microdroplet has been stretched by a factor of 10, and
therefore its length is much larger than its width and
height. Consequently, the stretched microdroplet
approximates a continuous fluidic stream (i.e., not
segmented) having only parabolic axial convection. For
simplicity, the effect of the fluorocarbon phase on
convection was not considered in the treatment discussed
below.124
141
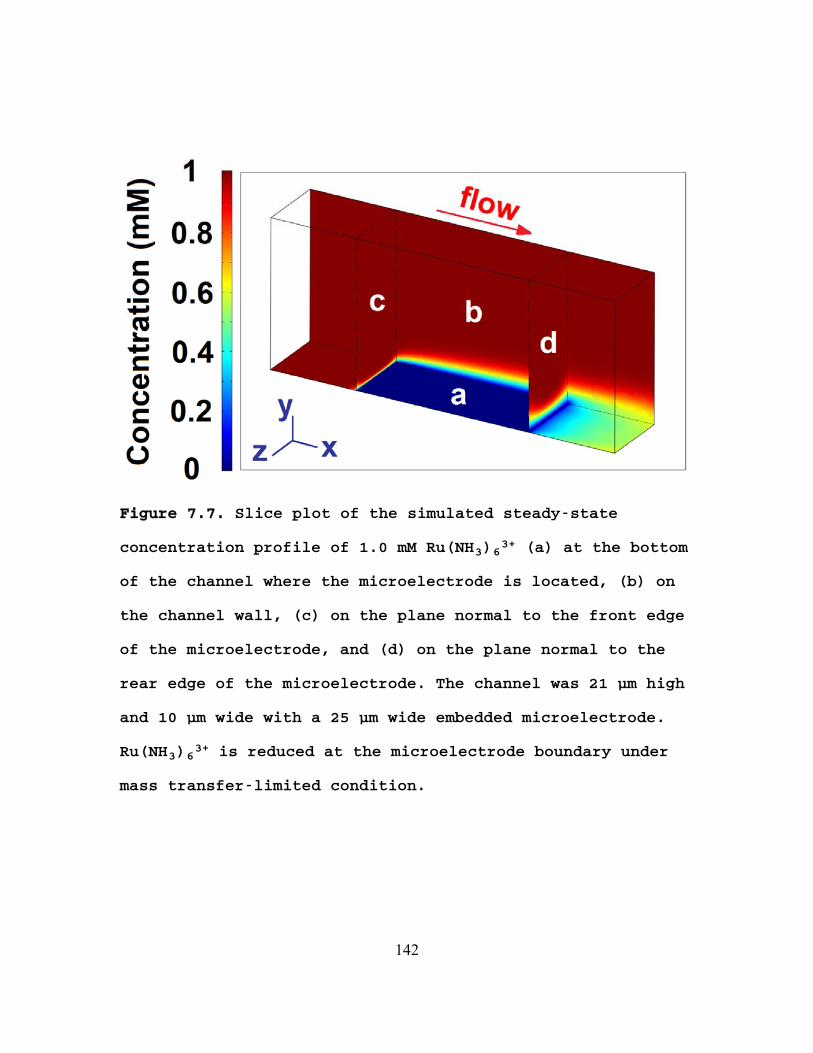
Figure 7.7. Slice plot of the simulated steady-state
concentration profile of 1.0 mM Ru(NH3)63+ (a) at the bottom
of the channel where the microelectrode is located, (b) on
the channel wall, (c) on the plane normal to the front edge
of the microelectrode, and (d) on the plane normal to the
rear edge of the microelectrode. The channel was 21 μm high
and 10 μm wide with a 25 μm wide embedded microelectrode.
Ru(NH3)63+ is reduced at the microelectrode boundary under
mass transfer-limited condition.
142
A 3-D model was constructed for the simulation of the
experiments represented in Figure 7.6a (red curve). The
slice plot of the simulated steady-state concentration
profile of Ru(NH3)63+ in the selected subdomain is shown in
Figure 7.7. Because the working electrode is held at
potential where the reduction of Ru(NH3)63+ is limited by
mass transfer (Figure 7.4d), the concentration of Ru(NH3)63+
at the electrode goes to zero. Consequently, Ru(NH3)63+ in
the bulk solution diffuses toward the electrode forming a
diffusion layer, as shown by the color gradient in Figure
7.7. Due to the parabolic flow velocity in the microchannel,
the concentration profile has a parabolic shape along the z
axis. The steady-state current density, which was calculated
based on the concentration gradient normal to the electrode
surface, is 36 pA/ m2. This value is in good agreement with
the experimentally determined, background-subtracted quasi-
steady-state current of 37 pA/ m2 (Figure 7.6a).
7.5 Summary and Conclusions
We have reported a method for highly reproducible
chronoamperometric analysis of the contents of microdroplets
generated within a microelectrochemical device. The key
finding is that stable and reproducible quasi-steady-state
143
currents are observed for microdroplets having volumes of ~1
nL if electrochemical measurements are made within a
narrowed segment of the microchannel. Under these conditions,
the microdroplets are stretched, and this leads to desirable
intradroplet mass transfer characteristics.
Importantly, the design of the microelectrochemical
device ensures direct contact between intradroplet redox
molecules and the electrode surface. That is, the
fluorocarbon separating microdroplets does interfere with
inner-sphere electrocatalytic processes such as the oxygen
reduction reaction. This means the device is appropriate
for studying electrocatalytic reactions in small volumes and
under well-defined conditions of mass transfer. Moreover,
because the droplets are so small, the concentration of even
small numbers of redox molecules within each droplet is
sufficient for electrochemical detection. Hence, this
approach also has applications to electroanalytical
chemistry. Results demonstrating these principles will be
reported in due course.
144
Chapter 8: Summary and Conclusion
In this dissertation, three types of paper-based
analytical devices for point-of-care biosensing, a
potentiometric method for analyzing percent hemoglobin A1c
(%HbA1c) and a PDMS-glass microelectrochemical device for
highly reproducible amperometric measurement in microdroplet,
are described.
The Chapter 3 describes the first paper-based sensing
device which is fabricated using the principles of origami
(paper folding). The three-dimensional (3-D) origami paper
analytical device (oPAD) is fabricated on a single sheet of
flat paper in a single photolithographic step and assembled
by simply folding the paper by hand. Following analysis, the
device can be unfolded to reveal each layer for optical
assays.
The Chapter 4 describes the second type of paper-based
device which has an integral aluminum/air battery as the
power source and reports its output using Prussian blue as
an electrochromic indicator. The integrated aluminum/air
battery powers both the electrochemical sensor and the
electrochromic read-out. The applicability of the device to
point-of-care sensing is demonstrated by qualitative
detection of glucose and H2O2 in artificial urine.
145
The Chapter 5 describes the third type of paper-based
device (oPAD 2) which uses an aptamer to recognize the
analyte, adenosine, a glucose oxidase tag to modify the
relative concentrations of an electroactive redox couple,
and a digital multimeter to transduce the result of the
assay. Adenosine is quantitatively determined using this
device with a detection limit of 11.8 M.
The Chapter 6 describes a simple and low-cost
potentiometric method for measuring HbA1c concentration,
hemoglobin (Hb) concentration, and thus %HbA1c in human
blood is developed for diagnosis and management of diabetes.
We use alizarin red s (ARS) as a redox indicator. The
potential shift of ARS owing to diol-boronic acid
complexation is used to determine the HbA1c, which is a
competitor of ARS for the complexation reaction. The
concentration of Hb is determined by reacting it with
Fe(CN)63- and measuring the potential shift arising from the
reduction of Fe(CN)63- by Hb. The results obtained for
%HBA1c in human blood are in good agreement with those
determined using a reference method.
The Chapter 7 describes a method for highly
reproducible chronoamperometric analysis of the contents of
microdroplets is developed. Aqueous microdroplets (~ 1 nL)
and separated by a fluorocarbon solvent are generated within
146
a microfluidic device using a T-shaped junction. Highly
reproducible quasi-steady-state currents are observed when
the microdroplets are stretched by a factor of 10 in a
narrowed segment of a microchannel (relative standard
deviations = ~ 2%). The stretching leads to desirable
intradroplet mass transfer characteristics. Importantly, the
design of the microelectrochemical device ensures direct
contact between intradroplet redox molecules and the
electrode surface to study inner-sphere electrocatalytic
processes such as the oxygen reduction reaction. Finite-
element simulations are presented that are in accord with
the experimental findings.
147
References
1. Biermann, C. J. Handbook of Pulping and Papermaking.
Academic Press: San Diego, 1993.
2. Klemm, D.; Heublein, B.; Fink, H. P.; Bohn, A.
Cellulose: Fascinating biopolymer and sustainable raw
material. Angew. Chem. Int. Ed. 2005, 44, 3358-3393.
3. Partington, J. R. J. L. Gay-Lussac (1778–1850). Nature
1950, 165, 708-709
4. Martinez, A. W.; Phillips, S. T.; Butte, M. J.;
Whitesides, G. M. Patterned paper as a platform for
inexpensive, low-volume, portable bioassays. Angew.
Chem. Int. Ed. 2007, 46, 1318-1320.
5. Gubala, V.; Harris, L. F.; Ricco, A. J.; Tan, M. X.;
Williams, D. E. Point of Care Diagnostics: Status and
Future. Anal. Chem. 2012, 84, 487-515.
6. Muller, R. H.; Clegg, D. L. Automatic Paper
Chromatography. Anal. Chem. 1949, 21, 1123-1125.
7. Bruzewicz, D. A.; M., R.; Whitesides, G. M. Low-Cost
Printing of Poly(dimethylsiloxane) Barriers To Define
Microchannels in Paper. Anal. Chem. 2008, 80, 3387-
3392.
148
8. Abe, K.; Suzuki, K.; Citterio, D. Inkjet-Printed
Microfluidic Multianalyte Chemical Sensing Paper. Anal.
Chem. 2008, 80, 6928–6934.
9. Li, X.; Tian, J. F.; Nguyen, T.; Shen, W. Paper-Based
Microfluidic Devices by Plasma Treatment. Anal. Chem.
2008, 80, 9131-9134.
10. Lu, Y.; Shi, W. W.; Qin, J. H.; Lin, B. C. Fabrication
and Characterization of Paper-Based Microfluidics
Prepared in Nitrocellulose Membrane By Wax Printing.
Anal. Chem. 2010, 82, 329-335.
11. Carrilho, E.; Martinez, A. W.; Whitesides, G. M.
Understanding Wax Printing: A Simple Micropatterning
Process for Paper-Based Microfluidics. Anal. Chem.
2009, 81, 7091-7095.
12. Delaney, J. L.; Hogan, C. F.; Tian, J. F.; Shen, W.
Electrogenerated Chemiluminescence Detection in Paper-
Based Microfluidic Sensors. Anal. Chem. 2011, 83,
1300-1306.
13. Olkkonen, J.; Lehtinen, K.; Erho, T. Flexographically
Printed Fluidic Structures in Paper. Anal. Chem. 2010,
82, 10246-10250.
14. Dungchai, W.; Chailapakul, O.; Henry, C. S. A low-cost,
simple, and rapid fabrication method for paper-based
149
. Analyst 2011,
136, 77-82.
15. Chitnis, G.; Ding, Z. W.; Chang, C. L.; Savran, C. A.;
Ziaie, B. Laser-treated hydrophobic paper: an
inexpensive microfluidic platform. Lab Chip 2011, 11,
1161-1165.
16. Martinez, A. W.; Phillips, S. T.; Whitesides, G. M.
Three-dimensional microfluidic devices fabricated in
layered paper and tape. Proc. Natl. Acad. Sci. U.S.A.
2008, 105, 19606-19611.
17. Martinez, A. W.; Phillips, S. T.; Whitesides, G. M.;
Carrilho, E. Diagnostics for the Developing World:
Microfluidic Paper-Based Analytical Devices. Anal. Chem.
2010, 82, 3-10.
18. Martinez, A. W.; Phillips, S. T.; Nie, Z. H.; Cheng, C.
M.; Carrilho, E.; Wiley, B. J.; Whitesides, G. M.
Programmable diagnostic devices made from paper and
tape. Lab Chip 2010, 10, 2499-2504.
19. Liu, H.; Xiang, Y.; Lu, Y.; Crooks, R. M. Aptamer-Based
Origami Paper Analytical Device for Electrochemical
Detection of Adenosine. Angew. Chem. Int. Ed. 2012, 51,
6925-6928.
20. Wang, J. Electrochemical glucose biosensors. Chem. Rev.
2008, 108, 814-825.
150

21. Dungchai, W.; Chailapakul, O.; Henry, C. S.
Electrochemical Detection for Paper-Based Microfluidics.
Anal. Chem. 2009, 81, 5821-5826.
22. Nie, Z. H.; Deiss, F.; Liu, X. Y.; Akbulut, O.;
Whitesides, G. M. Integration of paper-based
microfluidic devices with commercial electrochemical
readers. Lab Chip 2010, 10, 3163-3169.
23. Chen, L.; Magliano, D. J.; Zimmet, P. Z. The worldwide
epidemiology of type 2 diabetes mellitus-present and
future perspectives. Nat. Rev. Endocrinol. 2012, 8,
228-236.
24. Heller, A.; Feldman, B. Electrochemical glucose sensors
and their applications in diabetes management. Chem.
Rev. 2008, 108, 2482-2505.
25. Nathan, D. M.; Turgeon, H.; Regan, S. Relationship
between glycated haemoglobin levels and mean glucose
levels over time. Diabetologia 2007, 50, 2239-2244.
26. Krishnamurti, U.; Steffes, M. W. Glycohemoglobin: A
primary predictor of the development or reversal of
complications of diabetes mellitus. Clin. Chem. 2001,
47, 1157-1165.
27. Zinman, B.; Gerich, J.; Buse, J. B.; Lewin, A.;
Schwartz, S.; Raskin, P.; Hale, P. M.; Zdravkovic, M.;
151
Blonde, L. Standards of medical care in diabetes-2010
Diabetes Care 2010, 33, s4-s10.
28. Adamczyk, M.; Chen, Y. Y.; Johnson, D. D.; Mattingly, P.
G.; Moore, J. A.; Pan, Y.; Reddy, R. E.
Chemiluminescent acridinium-9-carboxamide boronic acid
probes: Application to a homogenous glycated hemoglobin
assay. Bioorg. Med. Chem. Lett. 2006, 16, 1324-1328.
29. Frantzen, F.; Grimsrud, K.; Heggli, D. E.; Faaren, A.
L.; Lovli, T.; Sundrehagen, E. Glycohemoglobin filter
assay for doctors' offices based on boronic acid
affinity principle. Clin. Chem. 1997, 43, 2390-2396.
30. Psotova, J.; Janiczek, O. Boronate Affinity-
Chromatography and the Applications. Chem. Listy 1995,
89, 641-648.
31. Eckerbom, S.; Bergqvist, Y.; Jeppsson, J. O. Improved
Method for Analysis of Glycated Hemoglobin by Ion-
Exchange Chromatography. Ann. Clin. Biochem. 1994, 31,
355-360.
32. Jenkins, M.; Ratnaike, S. Capillary electrophoresis of
hemoglobin. Clin. Chem. Lab. Med. 2003, 41, 747-754.
33. Blincko, S.; Edwards, R. Non-separation assay for
glycohemoglobin. Clin. Chem. 1998, 44, 1302-1308.
34. Frantzen, F.; Grimsrud, K.; Heggli, D. E.; Sundrehagen,
E. Soluble highly coloured phenylboronic acids and
152
. Clin. Chim.
Acta 1997, 263, 207-224.
35. Park, J. Y.; Chang, B. Y.; Nam, H.; Park, S. M.
Selective Electrochemical Sensing of Glycated
Hemoglobin (HbA(1c)) on Thiophene-3-Boronic Acid Self-
Assembled Monolayer Covered Gold Electrodes. Anal. Chem.
2008, 80, 8035-8044.
36. Son, S. U.; Seo, J. H.; Choi, Y. H.; Lee, S. S.
Fabrication of a disposable biochip for measuring
percent hemoglobin Alc (%HbAlc). Sens. Actuators, A
2006, 130, 267-272.
37. Chang, B. Y.; Chow, K. F.; Crooks, J. A.; Mavre, F.;
Crooks, R. M. Two-channel microelectrochemical bipolar
electrode sensor array. Analyst 2012, 137, 2827-2833.
38. Qu, L.; Xia, S. H.; Bian, C.; Sun, J. Z.; Han, J. H. A
micro-potentiometric hemoglobin immunosensor based on
electropolymerized polypyrrole-gold nanoparticles
composite. Biosens. Bioelectron. 2009, 24, 3419-3424.
39. Liu, S. Q.; Wollenberger, U.; Katterle, M.; Scheller, F.
W. Ferroceneboronic acid-based amperometric biosensor
for glycated hemoglobin. Sens. Actuators, B 2006, 113,
623-629.
40. Ikeda, K.; Sakamoto, Y.; Kawasaki, Y.; Miyake, T.;
Tanaka, K.; Urata, T.; Katayama, Y.; Ueda, S.; Horiuchi,
153
S. Determination of glycated albumin by enzyme-linked
boronate immunoassay (ELBIA). Clin. Chem. 1998, 44,
256-263.
41. Metus, P.; Ruzzante, N.; Bonvicini, P.; Meneghetti, M.;
Zaninotto, M.; Plebani, M. Immunoturbidimetric assay of
glycated hemoglobin. J. Clin. Lab. Anal. 1999, 13, 5-8.
42. Lenters-Westra, E.; Slingerland, R. J. Six of Eight
Hemoglobin A(1c) Point-of-Care Instruments Do Not Meet
the General Accepted Analytical Performance Criteria.
Clin. Chem. 2010, 56, 44-52.
43. Whitesides, G. M. The origins and the future of
microfluidics. Nature 2006, 442, 368-373.
44. Weibel, D. B.; Whitesides, G. M. Applications of
microfluidics in chemical biology. Curr. Opin. Chem.
Biol. 2006, 10, 584-591.
45. Thorsen, T.; Roberts, R. W.; Arnold, F. H.; Quake, S. R.
Dynamic pattern formation in a vesicle-generating
microfluidic device. Phys. Rev. Lett. 2001, 86, 4163-
4166.
46. Song, H.; Tice, J. D.; Ismagilov, R. F. A microfluidic
system for controlling reaction networks in time. Angew.
Chem. Int. Ed. 2003, 42, 768-772.
154
47. Chiu, D. T.; Lorenz, R. M.; Jeffries, G. D. M. Droplets
for Ultrasmall-Volume Analysis. Anal. Chem. 2009, 81,
5111-5118.
48. Huebner, A.; Sharma, S.; Srisa-Art, M.; Hollfelder, F.;
Edel, J. B.; Demello, A. J. Microdroplets: A sea of
applications? Lab Chip 2008, 8, 1244-1254.
49. Song, H.; Ismagilov, R. F. Millisecond kinetics on a
microfluidic chip using nanoliters of reagents. J. Am.
Chem. Soc. 2003, 125, 14613-14619.
50. Song, H.; Chen, D. L.; Ismagilov, R. F. Reactions in
droplets in microfluidic channels. Angew. Chem. Int. Ed.
2006, 45, 7336-7356.
51. Wu, D. P.; Zhao, B. X.; Dai, Z. P.; Qin, J. H.; Lin, B.
C. Grafting epoxy-modified hydrophilic polymers onto
poly(dimethylsiloxane) microfluidic chip to resist
nonspecific protein adsorption. Lab Chip 2006, 6, 942-
947.
52. Courtois, F.; Olguin, L. F.; Whyte, G.; Theberge, A. B.;
Huck, W. T. S.; Hollfelder, F.; Abell, C. Controlling
the Retention of Small Molecules in Emulsion
Microdroplets for Use in Cell-Based Assays. Anal. Chem.
2009, 81, 3008-3016.
53. Huebner, A.; Srisa-Art, M.; Holt, D.; Abell, C.;
Hollfelder, F.; Demello, A. J.; Edel, J. B.
155
Quantitative detection of protein expression in single
cells using droplet microfluidics. Chem. Commun. 2007,
12, 1218-1220.
54. Cristobal, G.; Arbouet, L.; Sarrazin, F.; Talaga, D.;
Bruneel, J. L.; Joanicot, M.; Servant, L. On-line laser
Raman spectroscopic probing of droplets engineered in
microfluidic devices. Lab Chip 2006, 6, 1140-1146.
55. Strehle, K. R.; Cialla, D.; Rosch, P.; Henkel, T.;
Kohler, M.; Popp, J. A reproducible surface-enhanced
Raman spectroscopy approach. Online SERS measurements
in a segmented microfluidic system. Anal. Chem. 2007,
79, 1542-1547.
56. Fidalgo, L. M.; Whyte, G.; Ruotolo, B. T.; Benesch, J.
L. P.; Stengel, F.; Abell, C.; Robinson, C. V.; Huck, W.
T. S. Coupling Microdroplet Microreactors with Mass
Spectrometry: Reading the Contents of Single Droplets
Online. Angew. Chem. Int. Ed. 2009, 48, 3665-3668.
57. Kelly, R. T.; Page, J. S.; Marginean, I.; Tang, K. Q.;
Smith, R. D. Dilution-Free Analysis from Picoliter
Droplets by Nano-Electrospray Ionization Mass
Spectrometry. Angew. Chem. Int. Ed. 2009, 48, 6832-
6835.
58. Han, Z. Y.; Li, W. T.; Huang, Y. Y.; Zheng, B.
Measuring Rapid Enzymatic Kinetics by Electrochemical
156

Pneumatic Valves. Anal. Chem. 2009, 81, 5840-5845.
59. Liu, S. J.; Gu, Y. F.; Le Roux, R. B.; Matthews, S. M.;
Bratton, D.; Yunus, K.; Fisher, A. C.; Huck, W. T. S.
The electrochemical detection of droplets in
microfluidic devices. Lab Chip 2008, 8, 1937-1942.
60. Sassa, F.; Laghzali, H.; Fukuda, J.; Suzuki, H.
Coulometric Detection of Components in Liquid Plugs by
Microfabricated Flow Channel and Electrode Structures.
Anal. Chem. 2010, 82, 8725-8732.
61. Bard, A. J.; Faulkner, L. R. Electrochemical Methods:
Fundamentals and Applications; 2nd edn ed. John Wiley &
Sons, Inc.: New York, 2001.
62. Han, Z. Y.; Chang, Y. Y.; Au, S. W. N.; Zheng, B.
Measuring rapid kinetics by a potentiometric method in
droplet-based microfluidic devices. Chem. Commun. 2011,
48, 1601-1603.
63. Xia, Y. N.; Rogers, J. A.; Paul, K. E.; Whitesides, G.
M. Unconventional methods for fabricating and
patterning nanostructures. Chem. Rev. 1999, 99, 1823-
1848.
64. Williams, K. R.; Gupta, K.; Wasilik, M. Etch rates for
micromachining processing - Part II. J.
Microelectromech. Syst. 2003, 12, 761-778.
157
65. Unger, M. A.; Chou, H. P.; Thorsen, T.; Scherer, A.;
Quake, S. R. Monolithic microfabricated valves and
pumps by multilayer soft lithography. Science 2000,
288, 113-116.
66. Kartalov, E. P.; Walker, C.; Taylor, C. R.; Anderson, W.
F.; Scherer, A. Microfluidic vias enable nested
bioarrays and autoregulatory devices in Newtonian
fluids. Proc. Natl. Acad. Sci. U.S.A. 2006, 103,
12280-12284.
67. Martinez, A. W.; Phillips, S. T.; Wiley, B. J.; Gupta,
M.; Whitesides, G. M. FLASH: A rapid method for
prototyping paper-based microfluidic devices. Lab Chip
2008, 8, 2146-2150.
68. Nie, Z. H.; Nijhuis, C. A.; Gong, J. L.; Chen, X.;
Kumachev, A.; Martinez, A. W.; Narovlyansky, M.;
Whitesides, G. M. Electrochemical sensing in paper-
based microfluidic devices. Lab Chip 2010, 10, 477-483.
69. Cheng, C. M.; Martinez, A. W.; Gong, J. L.; Mace, C. R.;
Phillips, S. T.; Carrilho, E.; Mirica, K. A.;
Whitesides, G. M. Paper-Based ELISA. Angew. Chem. Int.
Ed. 2010, 49, 4771-4774.
70. Osborn, J. L.; Lutz, B.; Fu, E.; Kauffman, P.; Stevens,
D. Y.; Yager, P. Microfluidics without pumps:
158

.
Lab Chip 2010, 10, 2659-2665.
71. Siegel, A. C.; Phillips, S. T.; Dickey, M. D.; Lu, N.
S.; Suo, Z. G.; Whitesides, G. M. Foldable Printed
Circuit Boards on Paper Substrates. Adv. Funct. Mater.
2010, 20, 28-35.
72. Bell, P. J. L.; Karuso, P. Epicocconone, a novel
fluorescent compound from the fungus Epicoccum nigrum.
J. Am. Chem. Soc. 2003, 125, 9304-9305.
73. Wang, J. Portable electrochemical systems. Trends Anal.
Chem. 2002, 21, 226-232.
74. Katz, E.; Buckmann, A. F.; Willner, I. Self-powered
enzyme-based biosensors. J. Am. Chem. Soc. 2001, 123,
10752-10753.
75. Germain, M. N.; Arechederra, R. L.; Minteer, S. D.
Nitroaromatic Actuation of Mitochondrial
Bioelectrocatalysis for Self-Powered Explosive Sensors.
J. Am. Chem. Soc. 2008, 130, 15272-+.
76. Zaccheo, B. A.; Crooks, R. M. Self-Powered Sensor for
Naked-Eye Detection of Serum Trypsin. Anal. Chem. 2011,
83, 1185-1188.
77. Xiang, Y.; Lu, Y. Using personal glucose meters and
functional DNA sensors to quantify a variety of
analytical targets. Nat. Chem. 2011, 3, 697-703.
159

78. Hu, L. B.; Choi, J. W.; Yang, Y.; Jeong, S.; La Mantia,
F.; Cui, L. F.; Cui, Y. Highly conductive paper for
energy-storage devices. Natl. Acad. Sci. U.S.A. 2009,
106, 21490-21494.
79. Hilder, M.; Winther-Jensen, B.; Clark, N. B. Paper-
based, printed zinc-air battery. J. Power Sources 2009,
194, 1135-1141.
80. Itaya, K.; Ataka, T.; Toshima, S.
Spectroelectrochemistry and Electrochemical Preparation
Method of Prussian Blue Modified Electrodes. J. Am.
Chem. Soc. 1982, 104, 4767-4772.
81. Lee, K. B. Urine-activated paper batteries for
biosystems. J. Micromech. Microeng. 2005, 15, S210-
S214.
82. Lee, K. B. Two-step activation of paper batteries for
high power generation: design and fabrication of
biofluid- and water-activated paper batteries. J.
Micromech. Microeng. 2006, 16, 2312-2317.
83. Araújo, A. C.; Song, Y. J.; Lundeberg, J.; Stahl, B. L.;
Brumer, H. Activated Paper Surfaces for the Rapid
Hybridization of DNA through Capillary Transport. Anal.
Chem. 2012, 84, 3311–3317.
84. Liu, J. W.; Cao, Z. H.; Lu, Y. Functional Nucleic Acid
Sensors. Chem. Rev. 2009, 109, 1948-1998.
160
85. Cho, E. J.; Lee, J. W.; Ellington, A. D., Annu. Rev.
Anal. Chem., in c. 2009. p. 241-264.
86. Navani, N. K.; Li, Y. F. Nucleic acid aptamers and
enzymes as sensors. Curr. Opin. Chem. Biol. 2006, 10,
272-281.
87. Willner, I.; Shlyahovsky, B.; Zayats, M.; Willner, B.
DNAzymes for sensing, nanobiotechnology and logic gate
applications. Chem. Soc. Rev. 2008, 37, 1153-1165.
88. Lubin, A. A.; Plaxco, K. W. Folding-Based
Electrochemical Biosensors: The Case for Responsive
Nucleic Acid Architectures. Acc. Chem. Res. 2010, 43,
496-505.
89. Liu, J. W.; Mazumdar, D.; Lu, Y. A simple and sensitive
"dipstick" test in serum based on lateral flow
separation of aptamer-linked nanostructures". Angew.
Chem. Int. Ed. 2006, 45, 7955-7959.
90. Su, S. X.; Ali, M.; Filipe, C. D. M.; Li, Y. F.; Pelton,
R. Microgel-based inks for paper-supported biosensing
applications. Biomacromolecules 2008, 9, 935-941.
91. Davies, R. J.; Eapen, S. S.; Carlisle, S. J., Lateral-
Flow Immunochromatographic Assays, in Handbook of
Biosensors and Biochips. 2008, John Wiley & Sons, Ltd.
161

92. Noh, H.; Phillips, S. T. Fluidic Timers for Time-
Dependent, Point-of-Care Assays on Paper. Anal. Chem.
2010, 82, 8071-8078.
93. Fu, E.; Lutz, B.; Kauffman, P.; Yager, P. Controlled
reagent transport in disposable 2D paper networks. Lab
Chip 2010, 10, 918-920.
94. Lutz, B. R.; Trinh, P.; Ball, C.; Fu, E.; Yager, P.
Two-dimensional paper networks: programmable fluidic
disconnects for multi-step processes in shaped paper.
Lab Chip 2011, 11, 4274-4278.
95. Vella, S. J.; Beattie, P.; Cademartiri, R.; Laromaine,
A.; Martinez, A. W.; Phillips, S. T.; Mirica, K. A.;
Whitesides, G. M. Measuring Markers of Liver Function
Using a Micropatterned Paper Device Designed for Blood
from a Fingerstick. Anal. Chem. 2012, 84, 2883-2891.
96. Schilling, K. M.; Lepore, A. L.; Kurian, J. A.;
Martinez, A. W. Fully Enclosed Microfluidic Paper-Based
Analytical Devices. Anal. Chem. 2012, 84, 1579-1585.
97. Fenton, E. M.; Mascarenas, M. R.; Lopez, G. P.; Sibbett,
S. S. Multiplex Lateral-Flow Test Strips Fabricated by
Two-Dimensional Shaping. ACS Appl. Mater. Interfaces
2009, 1, 124-129.
162
98. Liu, H.; Crooks, R. M. Three-Dimensional Paper
Microfluidic Devices Assembled Using the Principles of
Origami. J. Am. Chem. Soc. 2011, 133, 17564-17566.
99. Liu, H.; Crooks, R. M. Paper-Based Electrochemical
Sensing Platform with Integral Battery and
Electrochromic Read-Out. Anal. Chem. 2012, 84, 2528-
2532.
100. Huizenga, D. E.; Szostak, J. W. A DNA Aptamer That
Binds Adenosine and Atp. Biochemistry 1995, 34, 656-
665.
101. Nutiu, R.; Li, Y. F. Structure-switching signaling
aptamers. J. Am. Chem. Soc. 2003, 125, 4771-4778.
102. Vallon, V.; Muhlbauer, B.; Osswald, H. Adenosine and
kidney function. Physiol. Rev. 2006, 86, 901-940.
103. iMultimeter By HMB-TEC. 2011, Apple.com.
104. Wang, Y.; Hamasaki, K.; Rando, R. R. Specificity of
aminoglycoside binding to RNA constructs derived from
the 16S rRNA decoding region and the HIV-RRE activator
region. Biochemistry 1997, 36, 768-779.
105. Schumacher, S.; Nagel, T.; Scheller, F. W.; Gajovic-
Eichelmann, N. Alizarin Red S as an electrochemical
indicator for saccharide recognition. Electrochim. Acta
2011, 56, 6607-6611.
163
106. Springsteen, G.; Wang, B. H. A detailed examination of
boronic acid-diol complexation. Tetrahedron 2002, 58,
5291-5300.
107. Turcanu, A.; Bechtold, T. pH Dependent redox behaviour
of Alizarin Red S (1,2-dihydroxy-9,10-anthraquinone-3-
sulfonate) - Cyclic voltammetry in presence of
dispersed vat dye. Dyes Pigm. 2011, 91, 324-331.
108. Shoji, E.; Freund, M. S. Potentiometric saccharide
detection based on the pKa changes of poly(aniline
boronic acid). J. Am. Chem. Soc. 2002, 124, 12486-
12493.
109. Pearson, T. C. Normal ranges for packed cell volume and
haemoglobin concentration in adults: Relevance to
"apparent polycythaemia" (vol 67, pg 56, 2001). Eur. J.
Haematol. 2001, 67, 203-204.
110. Stadie, W. C. A method for the determination of
methemoglobin in whole blood. J. Biol. Chem. 1920, 41,
237-241.
111. Tice, J. D.; Song, H.; Lyon, A. D.; Ismagilov, R. F.
Formation of droplets and mixing in multiphase
microfluidics at low values of the Reynolds and the
capillary numbers. Langmuir 2003, 19, 9127-9133.
112.McDonald, J. C.; Duffy, D. C.; Anderson, J. R.; Chiu, D.
T.; Wu, H. K.; Schueller, O. J. A.; Whitesides, G. M.
164
Fabrication of microfluidic systems in
poly(dimethylsiloxane). Electrophoresis 2000, 21, 27-
40.
113. Anand, R. K.; Sheridan, E.; Knust, K. N.; Crooks, R. M.
Bipolar Electrode Focusing: Faradaic Ion Concentration
Polarization. Anal.Chem. 2011, 83, 2351-2358.
114.Chen, D.; Du, W. B.; Liu, Y.; Liu, W. S.; Kuznetsov, A.;
Mendez, F. E.; Philipson, L. H.; Ismagilov, R. F. The
chemistrode: A droplet-based microfluidic device for
stimulation and recording with high temporal, spatial,
and chemical resolution. Proc. Natl. Acad. Sci. U. S. A.
2008, 105, 16843-16848.
115. Polk, B. J.; Stelzenmuller, A.; Mijares, G.; MacCrehan,
W.; Gaitan, M. Ag/AgCl microelectrodes with improved
stability for microfluidics. Sens. Actuators, B 2006,
114, 239-247.
116. Kenis, P. J. A.; Ismagilov, R. F.; Takayama, S.;
Whitesides, G. M.; Li, S. L.; White, H. S. Fabrication
inside microchannels using fluid flow. Acc. Chem. Res.
2000, 33, 841-847.
117. Garstecki, P.; Fuerstman, M. J.; Stone, H. A.;
Whitesides, G. M. Formation of droplets and bubbles in
a microfluidic T-junction - scaling and mechanism of
break-up. Lab Chip 2006, 6, 437-446.
165
118. Theberge, A. B.; Courtois, F.; Schaerli, Y.;
Fischlechner, M.; Abell, C.; Hollfelder, F.; Huck, W. T.
S. Microdroplets in Microfluidics: An Evolving Platform
for Discoveries in Chemistry and Biology. Angew. Chem.
Int. Ed. 2010, 49, 5846-5868.
119. Levich, V. G. Physicochemical Hydrodynamics. Prentice-
Hall: Englewood Cliffs, NJ, 1962.
120. Ye, H. C.; Crooks, R. M. Electrocatalytic O-2 reduction
at glassy carbon electrodes modified with dendrimer-
encapsulated Pt nanoparticles. J. Am. Chem. Soc. 2005,
127, 4930-4934.
121. Bode, D. D.; Andersen, T. N.; Eyring, H. Anion and pH
effects on the potentials of zero charge of gold and
silver electrodes. J. Phys. Chem. 1967, 71, 792-797.
122. Pollack, M. G.; Shenderov, A. D.; Fair, R. B.
Electrowetting-based actuation of droplets for
integrated microfluidics. Lab Chip 2002, 2, 96-101.
123. Burdeniuc, J.; Crabtree, R. H. Catalytic
photodefluorination of perfluoroalkanes to
perfluoroalkenes with a ferrocene photosensitizer.
Organometallics 1998, 17, 1582-1586.
124. Rhee, M.; Burns, M. A. Drop mixing in a microchannel
for lab-on-a-chip platforms. Langmuir 2008, 24, 590-
601.
166
167
Vita
Hong Liu received his Bachelor of Science and Master of
Science degrees from Nanjing University, China in 2006 and
2009. He is expected to receive his doctoral of philosophy
degree in Chemistry under the guidance of Professor Richard
M. Crooks from The University of Texas at Austin in December
2012.
Permanent address: Room 302, Building 2, 21 Jiuhuashan,
Nanjing, Jiangsu 210008, China
This dissertation was typed by Hong Liu.