Embed Size (px)
Citation preview

Copyright
by
Bong-Su Jung
2007

The Dissertation Committee for Bong-Su Jung Certifies that this is the approved version of the following dissertation:
Fabrication and Characterization of a Plasmonic Biosensor Using Non-
Spherical Metal Nanoparticles
Committee:
Wolfgang Frey, Supervisor
H. Grady Rylander III
Keith Stevenson
Shaochen Chen
Konstantin Sokolov

Fabrication and Characterization of a Plasmonic Biosensor Using Non-
Spherical Metal Nanoparticles
by
Bong-Su Jung, B.S.; M.S.E.
Dissertation
Presented to the Faculty of the Graduate School of
The University of Texas at Austin
in Partial Fulfillment
of the Requirements
for the Degree of
Doctor of Philosophy
The University of Texas at Austin
December 2007

Dedication
To my beloved family:
Father, mother, my sisters,
and my grandmother in heaven.

Acknowledgements
I would like to sincerely thank my parents, Woon-choong Jung, Eun-sook Lee and
all my loving sisters, Su-Ah, Hyun-Ah, Jin-Ah, and Eun-Hye for their cares and prayers
for me.
I am very grateful for having had such a wonderful supervisor Dr. Wolfgang Frey
who had guided me through my studies. Whenever I experienced trouble in my research,
he always provided me with solid academic advice.
I must also thank so many of my peers in my lab, John Slater, Ted Gaubert, and
Ruben Morones for their encouragement, support and friendship. I’d like to thank Heidi
Fagerlund, the graduate coordinator in BME, UT Austin. She is not only my graduate
coordinator, but also has been such a good friend to me. We have enjoyed talks on many
topics, including different cultural ideas and scientific issues. I must also thank most of
the staff at BME, UT Austin: Vicki Stratton, Ann Armstrong, Cheryl Sandoval, Joni
Burks, Jim Pollard, Cindy Zimmerman, and Chris Cooper. They have been so helpful
over the past few years.
I would like to express my sincere gratitude to the Center for Nano and Molecular
Science and Technology at UT Austin for their facilities and Welch foundation for the
financial support they provided.
Above all, I would thank God for giving me health, strength, encouragement,
intuition and wisdom. My studies have always been a wonderful blessing right from the
very beginning until now.
v

Fabrication and Characterization of a Plasmonic Biosensor Using Non-
Spherical Metal Nanoparticles
Publication No._____________
Bong-Su Jung, Ph.D.
The University of Texas at Austin, 2007
Supervisor: Wolfgang Frey
Label-free detection techniques have an important role in many applications, such
as situations where few molecules – rather than low molarity – need to be detected, such
as in single-cell screening. While surface plasmon resonance (SPR) scattering from metal
nanoparticles has been shown to achieve significantly higher sensitivity in gene arrays,
such an approach has not been demonstrated for protein arrays. SPR-based sensors could
either use simple absorption measurement in a UV-Vis spectrometer or possibly surface-
enhanced Raman spectroscopy as the detection mechanism for molecules of interest.
However, non-spherical particles are needed to achieve high sensitivity and field
enhancement that is a requirement in both techniques, but these shapes are not easy to
produce reproducibly and preserve for extended periods of time. Here I present a carbon-
based template-stripping method combined with nanosphere lithography (NSL). This
fabrication allows to preserve the sharp features in atomically flat surfaces which are a
composite of a non-spherical metal nano-particle (gold or silver) and a transparent
embedding material such as glass. The stripping process is residue-free due to the
vi

introduction of a sacrificial carbon layer. The nanometer scale flat surface of our template
stripping process is also precious for general protein absorption studies, because an
inherent material contrast can resolve binding of layers on the 2 nm scale.
These nanocomposite surfaces also allow us to tailor well-defined SPR extinction
peaks with locations in the visible or infrared spectrum depending on the metal and the
particle size and the degree of non-symmetry. As the particle thickness is reduced and the
particle bisector length is increased, the peak position of the resonance shifts to the red.
Not only the peak position shifts, but also the sensitivity to environmental changes
increases. Therefore, the peak position of the resonance spectrum is dependent on the
dielectric environmental changes of each particle, and the particle geometries. The
resulting silver or gold nanoparticles in the surface of a glass slide are capable of
detecting thiol surface modification, and biotin-streptavidin protein binding events. Since
each gold or silver particle principally acts as an independent sensor, on the order of a
few thousand molecules can be detected, and the sensor can be miniaturized without loss
of sensitivity.
UNSL-Au metal nanoparticle (MNP) sensors achieve the sensitivity of close to
300 nm/RIU which is higher than any other report of localized surface plasmon
resonance (LSPR) sensors except gold nanocrescents. Finite-difference-time-domain
(FDTD) and finite-element-method (FEM) numerical calculations display the influence
of the sharp features on the resonance peak position. The maximum near-field intensity is
dependent on the polarization direction, the sharpness of the feature, and the near-field
confinement from the substrate. 3D FDTD simulation shows the local refractive index
sensitivity of the gold truncated tetrahedron, which is in agreement with our experimental
result. Both experimental and numerical calculations show that each particle can act as its
own sensor.
vii

Table of Contents
List of Figures ........................................................................................................ xi
Chapter 1: Introduction ............................................................................................1
1.1 Background and motivation......................................................................1
1.1.1 Proteomics.....................................................................................1
1.1.2 Localized surface plasmon resonance as a label-free detection method...........................................................................................2
1.2 Achievements of specific aims .................................................................6
1.3 Dissertation overview ...............................................................................9
1.4 References...............................................................................................10
Chapter 2: Fundamental Theory ............................................................................14
2.1 Principle of localized surface plasmon resonance ..................................14
2.2.1 Spherical metal particles .............................................................15
2.2.2 Mie theory for spherical particles ...............................................19
2.2.3 Various computational methods for Non-spherical MNPs.........22
2.2.4 Sensitivity of MNP plasmonic sensor to the dielectric environment.....................................................................................................29
2.2.5 References...................................................................................32
Chapter 3: Fabrication of carbon based template-stripping method for large scale nanopatterned atomic scale flat surfaces.......................................................36
3.1 Introduction.............................................................................................36
3.2 Experimental Methods ............................................................................39
3.3 Results and Discussion ...........................................................................42
3.3.1 Sample fabrication and characterization.....................................42
3.3.2 Selective functionalization of the nanopattern............................49
3.4 Conclusions.............................................................................................51
3.5 References...............................................................................................52
viii

Chapter 4: Plasmonic optical sensor: Sensitivity of the bulk and local refractive index change and geometrical influences ...............................................................56
4.1 Introduction.............................................................................................56
4.2 Experimental Methods ............................................................................57
4.3 Results and Discussion ...........................................................................59
4.3.1 The bulk plasma and LSPR Absorption Spectroscopy...............59
4.3.2 Role of the Geometry on the Properties of LSPR sensitivity in UNSL samples........................................................................................63
4.3.3 The bulk refractive index sensitivity of LSPR in UNSL samples65
4.3.4 The local refractive index sensitivity of LSPR in UNSL samples75
4.3.5 Comparison of the refractive index sensitivity in unit sensing area in NSL and UNSL...........................................................................81
4.4 Conclusions.............................................................................................85
4.5 References...............................................................................................87
Chapter 5: Computational modeling for near-field and far-field investigations of non-spherical triangular particles .........................................................................91
5.1 Introduction.............................................................................................91
5.2 Theoretical methods................................................................................92
5.3 Results and Discussion ...........................................................................97
5.3.1 Rayleigh scattering for a dielectric sphere..................................97
5.3.2 Far-field calculation for a free-standing truncated tetrahedron gold MNP in air...................................................................................98
5.3.3 Near-field intensity distribution near the sharp features of non-spherical MNPs.........................................................................100
5.3.4 Substrate influence of the near-field intensity of non-spherical MNPs...................................................................................................103
5.4 Conclusions...........................................................................................110
5.5 References.............................................................................................110
Chapter 6: Outlook...............................................................................................114
6.1 Summary ...............................................................................................114
6.2 Future works .........................................................................................116
6.3 References.............................................................................................117
ix

Bibliography ........................................................................................................119
Vita …………………………………………………………………………….128
x

List of Figures
Figure 1.1: Illustration of a single LSPR sensor.. .............................................................. 4
Figure 1.2: Illustration of an array type MNP LSPR sensor.............................................. 5
Figure 2.2.1: Illustration of excited particle plasmon oscillation by an electromagnetic field............................................................................................................................ 15
Figure 2.2.2: Schematic frequency dependence of the dielectric constant of a metal. .... 18
Figure 2.3.1: Illustration of the effects contributing to Mie scattering. ........................... 20
Figure 2.4.1: DDA simulated electric field contours with for various shapes. ..... 24 2|| E
Figure 2.4.2: Illustration of a Yell cell for FDTD.. ......................................................... 26
Figure 3.1: AFM image of mica residues on a classical UNSL sample with an additional carbon film on the mica template.. ............................................................................ 43
Figure 3.2: A schematic outline of the fabrication procedure of the new UNSL.. ........ 45
Figure 3.3: Characterization of dry etching step.............................................................. 48
Figure 3.4: AFM images of the ultraflat nanopatterned surface before (a) and after (b) chemical modification of the gold patterned surface with HDT for 8 h. .................. 50
Figure 4.1.1: Reflectivity spectra for silver and gold thin films of 60 nm.. .................... 60
Figure 4.1.2: Absorption spectrum in transmission of silver and gold thin films of 60 nm thickness. ................................................................................................................... 60
Figure 4.1.3: Absorption spectrum of UNSL silver and gold particles of 30 nm thickness and 93.2 nm length.. .................................................................................................. 63
Figure 4.2.1: Position of the LSPR resonance as a function of MNP thickness for different bisector lengths in air and water as labeled for Ag and Au.. ...................... 64
Figure 4.3.1: Peak shifts in absorption spectrum for gold UNSL MNPs.. ...................... 65
Figure 4.3.2: Refractive index dependence of the peak position derived from Fig 4.2.1 as a function of particle thickness.................................................................................. 67
Figure 4.3.3: Linear peak shifts vs. the refractive index changes and bisector dependency in gold UNSL MNPs.. ............................................................................................... 68
xi

Figure 4.3.4: Optimizing the bulk refractive index sensitivity by controlling bisector and thickness.. .................................................................................................................. 70
Figure 4.3.5: Peak shift of the LSPR from air to ethanol environment as a function of particle length (bisector)............................................................................................ 72
Figure 4.3.6: Contribution of the bisector and the exposed area in the bulk refractive index sensitivity......................................................................................................... 74
Figure 4.4.1: Absorption spectrum of gold UNSL MNPS.. ............................................ 76
Figure 4.4.2: Representative AFM images of UNSL-fabricated gold MNPs for chemical modification............................................................................................................... 77
Figure 4.4.3: Local refractive index dependency for the resonance peak positions. ....... 79
Figure 4.4.4: Bulk refractive index influences the local refractive index sensitivity.. .... 80
Figure 4.4.5: Multilayer adsorbate influences on the bulk refractive index sensitivity... 81
Figure 4.5.1: Comparison of the area of a NSL-fabricated and an UNSL-fabricated sample for sensing capability.. .................................................................................. 82
Figure 4.5.2: Comparison of the local refractive index sensitivity with hexadecanethiol (HDT) layer on NPs................................................................................................... 85
Figure 5.1.1 : The electric conductivity continuity between computational region and PML region................................................................................................................ 94
Figure 5.1.2 : Real (A) and imaginary parts (B) of permittivity of gold and the associated fit curves.. .................................................................................................................. 96
Figure 5.2.1: Calculated spectra of the scattering for a polystyrene sphere (n=1.56)..98
Figure 5.3.1 : 3D FDTD calculation for extinction spectra of a gold truncated tetrahedron particle with and without hexadecanethiol (HDT) surface modification on a gold MNP.. ...................................................................................................................... 100
Figure 5.4.1: Near-field enhancement simulation with triangular MNPs, with the light propagating into the plane.. ..................................................................................... 101
Figure 5.4.2 : Simulation of the influence of the shape on the scattering by gold MNPs................................................................................................................................... 102
Figure 5.4.3: Illustration of the electric near-field enhancement at sharp and rounded edges.......................................................................................................... 103
|| E
xii
Figure 5.5.1: Calculated scattering data and measured absorption data for the substrate influence on the extinction spectra for various gold MNP positions relativce to the glass substrate.......................................................................................................... 105
Figure 5.5.2: Substrate influence on the near-field distribution in cross-sectional view................................................................................................................................... 107
Figure 5.5.3: Cross-section of the near-field distribution at the air/glass interface for a NSL-Au MNP and a UNSL-Au MNP..................................................................... 109
xiii

Chapter 1: Introduction
1.1 BACKGROUND AND MOTIVATION
1.1.1 Proteomics
With the successful completion of the human DNA map, researchers discussed
that merely having a complete sequence of genomes is not enough to reveal biological
functions [1]. The reason is that there is not necessarily a direct relationship between
genes and the amount and the activity of the cellular protein content. The DNA sequence
is translated into a corresponding mRNA sequence which is used by the ribosome to
synthesize an amino acid sequence. However, a gene can undergo different splicings
during transcription, and a protein can also undergo posttranslational modifications which
result in various active forms of a protein. Discrepancies between genetic expression, i.e.
the amount of mRNA, and the amount of active proteins also occur due to differences in
the rate of degradation of proteins and gene sequences [2]. Therefore genomics has a
fundamental limitation when elucidating functions of the gene products.
Proteomics is complementary to genomics, in that, it provides tools for the
investigation of proteins, i.e. the gene products [3]. cDNA, derived from mRNA by
reverse transcriptase, is used for transcription and expression analysis in the form of
DNA arrays. In analogy to the very successful cDNA arrays, proteomic arrays promise to
be a tool for detecting, comparing and measuring the presence of biomolecules, protein
activity, binding kinetics and local concentration, which are all major parts of proteomic
analysis of cellular function.
Fluorescent marker techniques such as ELISA (Enzyme-Linked ImmunoSorbent
Assay) or GFP (green fluorescent protein) are currently popular methods in protein
1
detection. However, any fluorescent labeling technique has problems such as photo-
bleaching, and concentration dependence of the fluorescence. Fluorescence methods also
require complicated and labor intensive processing to attach the label. In one very
powerful technique, GFP is fused to the target protein and co-expressed in the cell.
However, these fusions are often transient and this method cannot be applied in cases
where transfection is not applicable. In order to systematically analyze the protein,
labeling techniques have to be complemented by powerful non-labeling techniques.
1.1.2 Localized surface plasmon resonance as a label-free detection method
Noble metal nanoparticles (MNPs) have unique optical, chemical and electrical
properties. MNPs such as silver or gold exhibit a strong absorption band in the visible
spectrum that is not found for the bulk metal [4]. The absorption is induced when the
frequency of the incident light is resonant with the collective oscillations of the
conduction electrons in the MNP. Since this excitation is localized, it is called localized
surface plasmon resonance (LSPR) [5, 6].
Noble metals, especially gold are biocompatible, relatively easy to synthesize and
chemically functionalize. Gold MNP surface modification for protein immobilization is
straight forward, using thiol chemistry. Gold has been conjugated with DNA [7, 8],
antibodies [9] and other biomolecular ligands [10]. Even more, LSPR of gold or silver
MNPs is sensitive to size [4, 5, 11, 12], and shape [4, 5, 13], and changes in the
environment [14, 15]. Due to these unique chemical, electrical, and optical properties,
spherical gold MNPs, which can be synthesized by solution chemistry have been
attractive as sensors [9, 16]. Sensors have been fabricated using colloidal gold MNPs
immobilized on glass [17, 18] or in solution for antibody- antigen binding kinetics [9].
Gold-labeled ss-DNA strands produce a different absorption spectrum depending on
whether the DNA strands are hybridized or were de-hybridized [7]. Compared to 2

fluorescent labels, such as Cy3 and Cy5, this results in a far more sensitive detection of
DNA hybridization, and is based on the relative distance of the absorption spectrum of
two gold MNPs [19, 20]. The enhanced field at LSPR MNPs allows for surface-enhanced
Raman scattering (SERS) spectroscopy to be used, a technique that potentially could
eliminate the use of capturing agents. For instance, gold MNPs were used as a probe to
detect multiple oligonucleotide targets with SERS and different Raman dyes [21].
Finally, colloidal gold nanoparticles are used as optical contrast agents for real-time, non-
bleaching in vivo imaging for cancer detection [22] and thermal ablation sources using
the optically induced heating of nanoshell structures for cancer imaging and therapy [23,
24]
LSPR is very suitable for nanoscale detection, because a single MNP can act as a
sensor [13, 25-29] (Figure 1.1). For instance, a layer of 1-hexadecanethiol (1-HDT) or
about 60,000 molecules (~100 zeptomoles), can easily be detected. Most of these
colloidal MNP sensors reach picomolar sensitivity which can detect specific antibodies
and a single epitope interaction on the ligand [9, 18]. Although the sensitivity of a sensor
is often determined by the equilibrium constant Ka of the affinity ligand, LSPR sensors
can measure very small absolute quantities of ligands in a very small sample volume.
The sensitivity of a LSPR sensor can be enhanced by the presence of higher fields
around the edges of a MNP, and non-spherical MNP sensors [30, 31], which have been
shown to have highly enhanced fields at tips and edges [32-34], are very sensitive to
changes in the dielectric constant of the environment. However, sharp features like
corners and edges often cannot be preserved during chemical modification. Thus, thermal
and solvent annealing have to be performed in order to get grounded sharp features and
make the sensor more reliable and reproducible [34, 35]. This process significantly
reduces electric fields and therefore sensitivities to the environmental changes
3

(Figure 1.1 A). Thus, in order to preserve the field enhancement and the higher
sensitivity, the sharp corners and edges of non-spherical NPs have to be preserved
(Figure 1.1 B).
Figure 1.1: Illustration of a single LSPR sensor. (a) a NSL-fabricated LSPR sensor. The LSPR is not reproducible and has reduced sensitivity due to rounded sharp corners of the truncated tetrahedron. Dotted line shows irreproducibility (b) an UNSL-fabricated LSPR sensor. The truncated tetrahedron is partially embedded into a substrate to preserve the sharp corners.
Not only can single MNPs act as individual LSPR sensors, but they can, either
individually or in small groups, be integrated into a sensor array which then requires
minimal amounts of sample and ligand and could be valuable in proteomics research.
Site-selective capture mechanism such as an affinity ligand binding is the most common
technique in protein arrays [36-38]. To achieve high-throughput in protein detection,
MNP LSPR sensor arrays require multiple areas of selective patterning and protein
immobilization, which define areas that represent a single element in the array.
Additionally, the sensor surface should prevent lateral spreading and contamination
during the spotting process (Figure 1.2).
4

This sensor can be measured with UV-Vis spectrometry, dark-field scattering, and
with optical wave guides.
Figure 1.2: Illustration of an array type MNP LSPR sensor. This array type sensor allows high-throughput protein detection by target protein immobilization and positioning. Site-selective proteins are captured by immobilized ligands in multiple protein arrays.
In order to fabricate array types of non-spherical MNPs many lithography
techniques, such as electron-beam lithography or nanosphere lithography (NSL) have
been used. However, these methods are either very slow or the particle shape, such as the
triangle tips of the NPs, degrade easily. Sensors also have been demonstrated using
solution-based synthesis of non-spherical MNPs such as cubes [30] and triangles [31].
As mentioned earlier, although these particles can reach high sensitivities, they also
suffer from rounding of their edges. Ultraflat nanosphere lithography (UNSL), which
combines NSL and carbon-based template-stripping method in this thesis not only
preserves sharp features, but also changes the MNP shape to enhance the sensitivity with
varying non-symmetrical geometries.
In this thesis we try to understand the electromagnetic field interactions of
partially embedded non-spherical MNPs of different geometrical parameters in various
5

environments, and perform numerical calculations, such as Finite-Difference-Time-
Domain (FDTD) and Finite-Element-Method (FEM).
1.2 ACHIEVEMENTS OF SPECIFIC AIMS
It was proposed to develop a highly sensitive label-free non-spherical MNP
sensor for detecting environmental changes and biomolecular binding events without
losing any sharpness features. This technique should be also a simple, fast, parallel and
cheap process to produce a large number of nanostructures that can be used for an array-
type sensor. Therefore, the specific aims in this dissertation were to (i) develop a sensor
that preserves the sharpness of the MNPs by partially embedding the particles in a
substrate, so that sharp corners and edges are stabilized while still exposed to the
chemical modification in order to achieve high sensitivity. (ii) optimize the sensitivity of
highly elongated non-spherical MNPs, and determine most sensitive array parameters
(iii) explore other implementations of sensors, such as extraordinary optical transmission
of partially embedded MNPs, or coupled LSPR and propagating SPR spectroscopy, for
use as a label free sensor, (iv) and model the near- and far-fields around the MNPs with
numerical simulations.
1: Study of the sensitivity of non-spherical and metal nanoparticles with
preserved shape to changes in the dielectric environment.
It was suggested to investigate which parameters of the non-spherical geometries
play a role in the sensitivity of the MNP plasmonic sensor. Conventional NSL and
ultraflat nanosphere lithography (UNSL) have some limitations to study this sensitivity. It
has been known that NSL-fabricated MNPs are easily rounded and causes reliability
issues. The sample surface from conventional UNSL-fabricated MNPs are often not
homogeneous due to mica shards which remained on the surface. The mica shards (which
change the dielectric constant of the ambient medium near the MNPs) induce 6

irreproducible and convoluted resonance responses in the experiments. It was very
difficult to remove the very thin residues of mica from the UNSL surface, because the
binding force between the mica substrate and the composite nanopatterned surface can be
very strong. Therefore, new a fabrication technique had to be designed to get a residue-
free and homogeneous nanopatterned surface to investigate the sensitivity of the MNP
sensor. It is then possible to create homogenously distributed tetrahedron gold MNPs
over centimeter scale using a carbon-based template stripping dry etching technique.
With this new fabrication technique, some important geometrical parameters that
change the sensor sensitivity were found. The thickness which is the side of the truncated
tetrahedron and the bisector of the triangular surface in the non-spherical MNPs were
varied to study the sensitivity response. These parameters influence the peak position of
the resonance. Thinner and longer (bisector) particles induce a red-shift of the resonance.
Not only the peak position, but also the sensitivity is influenced with those geometry
parameters. The sensitivity is significantly increased by increasing the bisector length and
reducing the particle thickness, especially if the particle becomes very thin. Tailoring
LSPR, we achieved close to 300 nm/ RIU in the bulk refractive index sensitivity with a
20 nm thick and 117 nm long particle.
2: Development and characterization of the surface plasmon-based sensor
into an array molecular sensor for protein detection.
The capability to detect proteins is one of the fundamental requirements for a
plasmonic sensor in biomedical applications. Therefore, using the sensor to detect small
changes in the near-field environment due to adsorbates, such as thiol molecules on the
nanopatterned surface or affinity ligand binding like biotin-streptavidin, was proposed.
The newly fabricated gold MNP sensor detects the local refractive index changes. With
the optimized gold UNSL sensor, it was possible to detect hexadecanethiol (HDT)
7
binding with 30 nm of red peak shift and 100 nM of streptavidin binding on the
biotinylated layer on the sensor. The gold MNP UNSL sensor detected biotin binding
with 29 nm of red shift and streptavidin binding on the biotin layer with 7 nm of the red
shift in air.
Having atomically flat surfaces, selectively grouping and separately
functionalizing MNPs to achieve an array of protein ligand patterns is possible, so that
this array of sensors can be applied in proteomics.
3: Explore other sensor implementations, such as extraordinary optical
transmission on non-perforated nanostructures, or coupling LSPR and propagating
SPR spectroscopy.
A plane wave cannot propagate through an aperture with a size smaller than half
the wavelength of the light, and the transmission signal is very weak. Contradictory to
this well-known effect, extraordinary transmission was found in subwavelength holes
surrounded by a corrugated surface or an array of holes in an opaque film of a metal that
supports propagating surface plasmons [28, 39]. It was hypothesized that localized
surface plasmon resonance also supports extraordinary transmission. To examine this
theory, non-surface plasmon supporting opaque films were fabricated. These films which
were made with Al or Ag layers with embedded gold and silver MNPs, without any holes
were measured at visible wavelengths. Although changes in the transmission were found,
no sensitivity to the environment were detected (these results are not shown in this
dissertation).
4: Modeling of the local electric fields in the vicinity of the particle and of the
total scattering and absorption cross sections.
Understanding the plasmonic resonances of non-spherical MNPs using numerical
simulations is an essential step in the study of LSPR, and enables us to compare and
8

understand the experimental results. Therefore, it was proposed to use numerical tools
such as FDTD in this research. Therefore, FEMLAB 3.3a® as FEM and XFDTD® as
FDTD were used in the numerical calculation in this dissertation. 2D in plane and cross-
sectional simulations were performed with FEMLAB 3.3a® and 3D FDTD simulation
performed with XFDTD®. The numerical calculations show that there is geometrical
influence at the sharp features and a substrate influence in the near-field. The maximum
near-field intensity always exists along the polarization direction, and is also influenced
by the substrate. The near-field intensity directly affects the far-field intensity, which is
measured experimentally by UV-Vis spectroscopy. The wavelength at which the
maximum near-field intensity is found is also the wavelength of the resonance peak
position in the far-field analysis. Understanding the plasmonic resonance with numerical
calculation also opens up future research to design different types of sensors and supports
pioneering experiments in plasmonics.
1.3 DISSERTATION OVERVIEW
The goals of this dissertation are to fabricate and preserve non-spherical features
especially sharp corners and edges using a new nanofabrication technique, and to create a
label-free plasmonic sensor and characterize and optimize the sensitivity of the sensor.
To understand the plasmonic behavior induced by the non-spherical particle features,
numerical computation was performed by Finite-Element-Method (FEM) and Finite-
Difference-Time-Domain (FDTD) and compared with the experimental results in this
dissertation
Chapter 2 describes the fundamental theory of localized surface plasmon
resonance (LSPR) for spherical metal nanopartilces (MNPs) and non-spherical MNPs.
The fundamental algorithms of FEM and FDTD are explained in Chapter 5. Chapter 2
9

also explores the study of the sensitivity in different types of non-spherical MNPs from
other groups.
Chapter 3 introduces a new fabrication method to create and preserve non-
spherical MNPs (truncated tetrahedron) in a transparent substrate. By using a carbon
sacrificial layer in the fabrication step the quality of the MNPs is improved .
Chapter 4 analyzes the experimental results of LSPR properties from non-
spherical gold and silver MNPs fabricated as described in Chapter 3. The sensor
sensitivity to the bulk and the local refractive index changes is characterized and
compared with the non-spherical MNPs from the conventional nanosphere lithography
(NSL) technique.
Chapter 5 compares some of the experimental results from Chapter 4 with
computational modeling results. FEMLAB 3.3a® as a FEM tool and XFDTD® as a
FDTD tool are used to compute the numerical calculation. These numerical tools support
the experimental results in Chapter 4 and provides valuable information about LSPR
properties from the sharp features in the non-spherical MNPs.
Chapter 6 summarizes the results and indicates future work.
1.4 REFERENCES 1. Dunham I., Shimizu N., Roe BA., Chissoe S., and et al., The DNA sequence of
human chromosome. Nature, 1999. 402: p. 489-495. 2. Gygi, S.P., Y. Rochon, B.R. Franza, and R. Aebersold, Correlation between
protein and mRNA abundance in yeast. Mol. Cell Biol., 1999. 19: p. 1720-1730. 3. Kellner, R., Proteomics. Concepts and perspectives. Fresenius J Anal Chem,
2000. 366: p. 517-524. 4. Kreibig, U. and M. Vollmer, Optical Properties of Metal Clusters. 1995, Berlin:
Springer. 5. Kelly, K.L., E. Coronado, L.L. Zhao, and G.C. Schatz, The optical properties of
metal nanoparticles: The influence of size, shape, and dielectric environment. Journal of Physical Chemistry B, 2003. 107(3): p. 668-677.
6. Englebienne, P., A.V. Hoonacker, and M. Verhas, Surface Plasmon resonance:principles,methods and applications in biomedical sciences. Spectroscopy, 2003. 17: p. 255-273.
10
7. Mirkin, C.A., R.L. Letsinger, R.C. Mucic, and J.J. Storhoff, A DNA-based method for rationally assembling nanoparticles into macroscopic materials. Nature, 1996. 382(6592): p. 607-609.
8. Ge, C.W., J.H. Liao, Y.H. Wang, K.J. Chen, and N. Gu, DNA assembly on 2-dimensional array of colloidal gold. Biomedical Microdevices, 2003. 5(2): p. 157-162.
9. Englebienne, P., Use of colloidal gold surface plasmon resonance peak shift to infer affinity constants from the interactions between protein antigens and antibodies specific for single or multiple epitope. Analyst, 1998. 123: p. 1599-1603.
10. Katz, E. and I. Willner, Integrated nanoparticle-biomolecule hybrid systems: Synthesis, properties, and applications. Angewandte Chemie-International Edition, 2004. 43(45): p. 6042-6108.
11. Foss, C.A., J.G.L. Hornyak, J.A. Stockert, and C.R. Martin, Template Synthesized nanoscopic Gold Particles: Optical spectra and the effects of particle size and shape. J. Phys. Chem, 1994. 98: p. 2963-2971.
12. Hulteen, J.C., D.A. Treichel, M.T. smith, M.L. Duval, T.R. Jensen, and R.P. VanDuyne, Nanosphere Lithography: Size-Tunable Silver Nanoparticle and Surface Cluster Arrays. J. Phys. Chem B, 1999. 103: p. 3854-3863.
13. Mock, J.J., M. Barbic, D.R. Smith, D.A. Schultz, and S.Schultz, Shape effects in plasmon resonance of individual colloidal silver nanoparticles. Journal of Chemical Physics, 2002. 116: p. 6755-6759.
14. Miller, M.M. and A.A. Lazarides, Sensitivity of metal nanoparticle surface plasmon resonance to the dielectric environment. Journal of Physical Chemistry B, 2005. 109(46): p. 21556-21565.
15. Haes, A.J. and R.P.V. Duyne, A Nanoscale Optical Biosensor: Sensitivity and Selectivity of an Approach Based on the Localized Surface Plasmon Resonance Spectroscopy of Triangular Silver Nanoparticles. J. Am. Chem. Soc., 2002. 124: p. 10596-10604.
16. Englebienne, P., A.V. Hoonacker, and J. Valsamis, Rapid Homogeneous Immunoassay for Human Ferritin in the Cobas Mira Using Colloidal Gold as the Reporter Reagent. Clinical Chemistry, 2000. 46: p. 2000-2003.
17. Nath, N. and A. Chilkoti, Label-Free Biosensing by Surface Plasmon Resonance of Nanoparticles on Glass:Optimization of Nanoparticle Size. Analytical Chemistry, 2004. 76: p. 5370-5378.
18. Nath, N. and A. Chilkoti, A colorimetric gold nanoparticle sensor to interrogate biomolecular interactions in real time on a surface. Analytical Chemistry, 2002. 74(3): p. 504-509.
19. Liu, J.W. and Y. Lu, Adenosine-dependent assembly of aptazyme-functionalized gold nanoparticles and its application as a colorimetric biosensor. Analytical Chemistry, 2004. 76(6): p. 1627-1632.
20. Storhoff, J.J., A.A. Lazarides, R.C. Mucic, C.A. Mirkin, R.L. Letsinger, and G.C. Schatz, What controls the optical properties of DNA-linked gold nanoparticle assemblies? Journal of the American Chemical Society, 2000. 122(19): p. 4640-4650.
11

21. Cao, Y.W.C., R.C. Jin, and C.A. Mirkin, Nanoparticles with Raman spectroscopic fingerprints for DNA and RNA detection. Science, 2002. 297(5586): p. 1536-1540.
22. Sokolov, k., J. Aaron, S. Kumar, V. Mack, T. Collier, L. Coghlan, A. Gillenwater, A.K. Storthz, M. Follen, and R.R. Kortum. Molecular Imaging of Carcinogenesis with Immuno-Targeted Nanoparticles. in Proceedings of the 26th Annual International Conference of the IEEE EMBS 2004. San Francisco, CA, USA.
23. Hirsch, L.R., R.J. Stafford, J.A. Bankson, S.R. Sershen, B. Rivera, R.E. Price, J.D. Hazle, N.J. Halas, and J.L. West, Nanoshell-mediated near-infrared thermal therapy of tumors under magnetic resonance guidance. Proceedings of the National Academy of Sciences of the United States of America, 2003. 100(23): p. 13549-13554.
24. Loo, C., A. Lin, L. Hirsch, M.H. Lee, J. Barton, N. Halas, J. West, and R. Drezek, Nanoshell-enabled photonics-based imaging and therapy of cancer. Technology in Cancer Research & Treatment, 2004. 3(1): p. 33-40.
25. Mock, J.J., D.R. Smith, and S. Schultz, Local refractive index dependence of plasmon resonance spectra from individual nanoparticles. Nanoletters, 2003. 3(4): p. 485-491.
26. Raschke, G., S. Kowarik, C.S. T. Franzl, T.A. Klar, and J. Feldmann, Biomolecular Recognition Based on Single Gold Nanoparticle Light Scattering. Nano letters, 2003. 3(7): p. 935-938.
27. Klar, T., M. Perner, S. Grosse, G.v. Plessen, W. Spirkl, and J. Feldmann, Surface-Plasmon Resonances in Single Metallic Nanoparticles. Physical Review Letters, 1998. 80: p. 4249-4252.
28. Grupp, D.E., H.K. Lezec, T. Thio, and T.W. Ebbesen, Beyond the bethe limit:Tunable enhanced light transmission through a single sub-wavelength aperture. Advanced materials, 1999. 11(10): p. 860-862.
29. McFarland, A.D. and R.P. Van Duyne, Signle Silver Nanoparticles as real-time optical sensors with zeptomole sensitivity. Nano letters, 2003. 3: p. 1057-1062.
30. Sherry, L.J., S.H. Chang, G.C. Schatz, R.P. Van Duyne, B.J. Wiley, and Y.N. Xia, Localized surface plasmon resonance spectroscopy of single silver nanocubes. Nano Letters, 2005. 5(10): p. 2034-2038.
31. Sherry, L.J., R.C. Jin, C.A. Mirkin, G.C. Schatz, and R.P. Van Duyne, Localized surface plasmon resonance spectroscopy of single silver triangular nanoprisms. Nano Letters, 2006. 6(9): p. 2060-2065.
32. Jensen, T., M.D. Malinsky, C.L. Haynes, and R.P.V. Duyne., Nanosphere Lithography:Tunable localized surface plasmon resonance spectra of silver nanoparticles. J. Phys. Chem B, 2000. 104: p. 10549-10556.
33. Jin, R., Y. Cao, C.A. Mirkin, K.L. Kelly, G.C. Schatz, and J.G. Zheng, Photoinduced conversion of silver nanospheres to nanoprisms. Science, 2001. 294: p. 1901-1903.
34. Haes, A.J., S.L. Zou, G.C. Schatz, and R.P. Van Duyne, A nanoscale optical biosensor: The long range distance dependence of the localized surface plasmon resonance of noble metal nanoparticles. Journal of Physical Chemistry B, 2004. 108(1): p. 109-116.
12
35. Haes, A.J., S.L. Zou, G.C. Schatz, and R.P. Van Duyne, Nanoscale optical biosensor: Short range distance dependence of the localized surface plasmon resonance of noble metal nanoparticles. Journal of Physical Chemistry B, 2004. 108(22): p. 6961-6968.
36. Niemeyer, C.M., B. Ceyhan, S. Gao, L. Chi, S. Peschel, and U. Simon, Site-selective immobilization of gold nanoparticles functionalized with DNA oligomers. Colloid and Polymer Science, 2001. 279(1): p. 68-72.
37. Phizicky, E., P.I.H. Bastiaens, H. Zhu, M. Snyder, and S. Fields, Protein analysis on a proteomic scale. Nature, 2003. 422(6928): p. 208-215.
38. MacBeath, G. and S.L. Schreiber, Printing proteins as microarrays for high-throughput function determination. Science, 2000. 289(5485): p. 1760-1763.
39. Thio, T., T.W. Ebbesen, H.J. Lezec, K.M. Pellerin, G.D. Lewen, A. Nahata, and R.A. Linke, Giant optical transmission of sub wavelength apertures: physics and applications. Nanotechnology, 2002. 13: p. 429-432.
13

Chapter 2: Fundamental Theory
2.1 PRINCIPLE OF LOCALIZED SURFACE PLASMON RESONANCE
Conventional propagating SPR spectroscopy achieves sub-picomolar detection
levels [1], but its application is not useful in high throughput screening [2]. When very
small sample volumes have to be processed, the sensing area has to be limited to sizes in
the range of (or smaller than) the decay distance of the surface plasmon. These
limitations can be overcome with colloidal nano-particle plasmon resonance which is
often called localized SPR (LSPR). LSPR is the localized collective excitation of
electrons (or resonance electron oscillation) in the conduction band in metal nanoparticles
(MNPs) by light radiation. The use of colloidal type gold or silver particle surface
plasmon resonance sensors is an emerging non-labeling method [3]. A change of
refractive index close to the surface of the MNP induces a shift in the resonance
absorption wavelength of the LSPR. The magnitude of this shift, the sensitivity of the
sensor, depends on the metal particle size and shape [4]. When MNPs are close to a
substrate or embedded in the substrate, the sensitivity is also influenced by the properties
of the substrate [5]. LSPR promises to be of great usefulness for proteomics, offering
relatively high sensitivity, but more importantly, the ability to detect very low numbers of
molecules – up to zeptomoles (1zM=10-21 mols) – for small sample volumes. In order to
understand colloidal surface plasmon resonance or localized SPR, it is important to
understand light scattering on a particle smaller or of the size of the wavelength of the
incoming light.
14
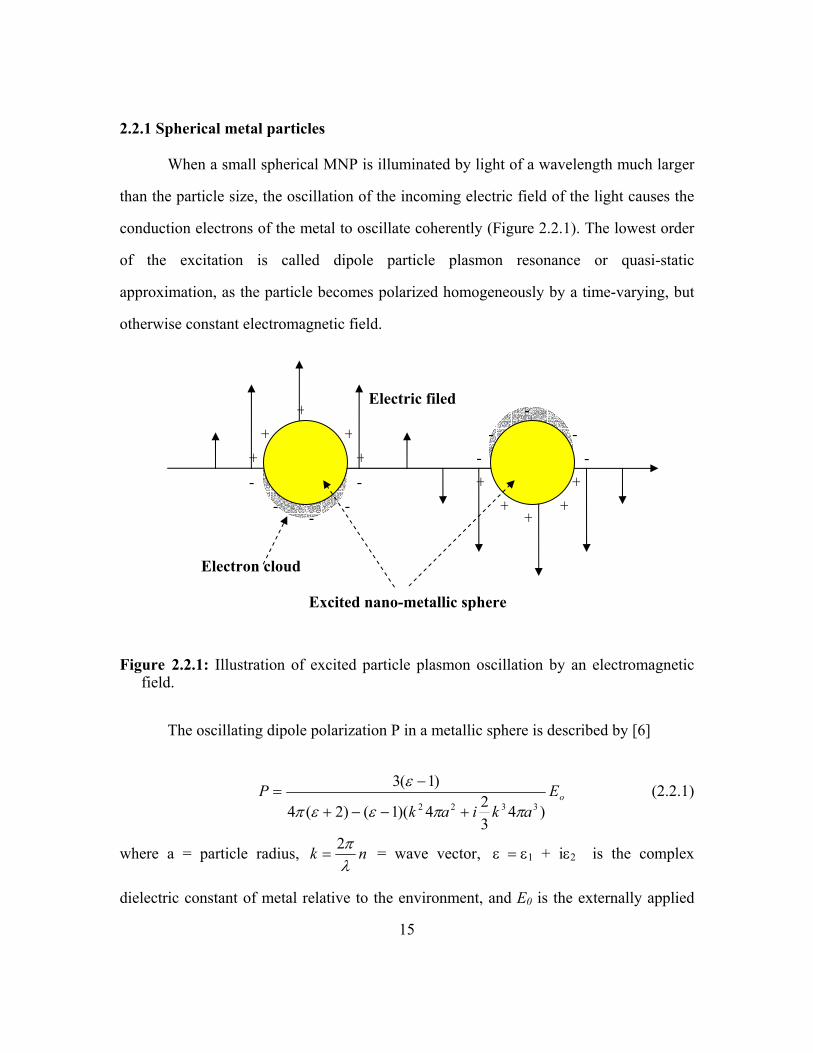
2.2.1 Spherical metal particles
When a small spherical MNP is illuminated by light of a wavelength much larger
than the particle size, the oscillation of the incoming electric field of the light causes the
conduction electrons of the metal to oscillate coherently (Figure 2.2.1). The lowest order
of the excitation is called dipole particle plasmon resonance or quasi-static
approximation, as the particle becomes polarized homogeneously by a time-varying, but
otherwise constant electromagnetic field.
Electric filed+ -
- + + -- - + +
- - + +- - + +
- +
Electron cloud
Excited nano-metallic sphere
Figure 2.2.1: Illustration of excited particle plasmon oscillation by an electromagnetic field.
The oscillating dipole polarization P in a metallic sphere is described by [6]
oEakiak
P)4
324)(1()2(4
)1(33322 ππεεπ
ε
+−−+
−= (2.2.1)
where a = particle radius, nkλπ2
= = wave vector, ε = ε1 + iε2 is the complex
dielectric constant of metal relative to the environment, and E0 is the externally applied
15
field. This equation shows that external dielectrics change the dipole polarization through
k and ε . Thus, the refractive index sensitivities can be understood by the extinction peak
position changes of the plasmon resonance.
ε
The first term of the denominator of Equation (2.2.1) indicates stationary
polarization and presents the Clausius-Mosotti result for the polarization of a sphere. The
second and third term are higher order terms in , which relate the particle size to the
wavelength and account for the finite size of a particle. The second order term of the
denominator, which depends on , expresses dynamic depolarization due to phase-
differences on larger particles. The third and imaginary part of the denominator of the
equation is the radiation-damping correction which strongly decreases the field
enhancement at large particles due to radiative losses. The real part of the dielectric
constant of the metal,
ka
22ak
)(1 ωε is responsible for the resonance peak position, whereas the
imaginary part of the dielectric constant, )(2 ωε , is related to the width of the peak. The
radiation damping for larger particles can also cause a broadening of the particle plasmon
resonance.
For small particle volumes, the third order term of the denominator can be
neglected. Then particle plasmon resonance occurs when the denominator of the
polarization becomes zero in the expression
oEakak
P]2)1([4
)1(32222 ++−
−=
επε (2.2.2)
The disappearance of the real part of the denominator in (2.2.2) creates the
surface plasmon resonance, which leads to the field enhancement [6]
ores
res Eak
P)]1([4
)1(322
2 −−
=επ
ε (2.2.3)
where res is the complex dielectric constant at the plasmon resonance frequency and
2ε is the imaginary part of the dielectric constant of the metal at that frequency.
16

Before 1900, understanding the most striking properties of metals, such as the
conduction of electricity and thermal conductivity had been very difficult. In 1900, Paul
Drude successfully formulated a model for metallic properties based on describing free
electrons in the conduction band like gas molecules. The Drude model uses the relative
permittivity at infinite frequency )(∞Dε , the plasma frequencyeff
p mde
0
2
εω =
d
, which
depends on the effective electron mass , the electron density , and the relaxation
time , which is determined by the collision of the free electrons with phonons, ions,
and impurities, to explain the so-called free electron gas molecular behavior in the
conduction band [7]. Therefore the dielectric function of certain MNPs can be described
through a Drude model by [8]
effm
Γ
ωω
ωεωε
D
pDD iΓ+
−∞= 2
2
)()( (2.2.4)
For smaller particles, the resonance is also broadened by surface scattering of the
electrons, which can be included in the Drude description via 2ε . The small size
influence on the dielectric constants of a MNP can be approximately described by [9] boundFF
c
p
bv
lv
222
2
2 )()( εωω
ωωε ++
+=
∞
(2.2.5)
The first term of Equation (2.2.5) is the free-electron contribution, namely the
Drude model (2.2.4), to the damping. is the contribution of bound electrons. v
is the Fermi velocity for the collision within the material. l means the electron free
path in the material. b is the short axis of the particle boundaries.
bound2ε F
∞
cω is the collision
frequency within the material. Thus, as the length of the free path in the material is
shortened by the smaller radius of the particle, the imaginary part of the dielectric
constant increases. As can be seen from Equation (2.2.5), as 2ε is increased due to a
smaller particle size, b, this decreases the polarization, , in Equation (2.2.3). resP
17
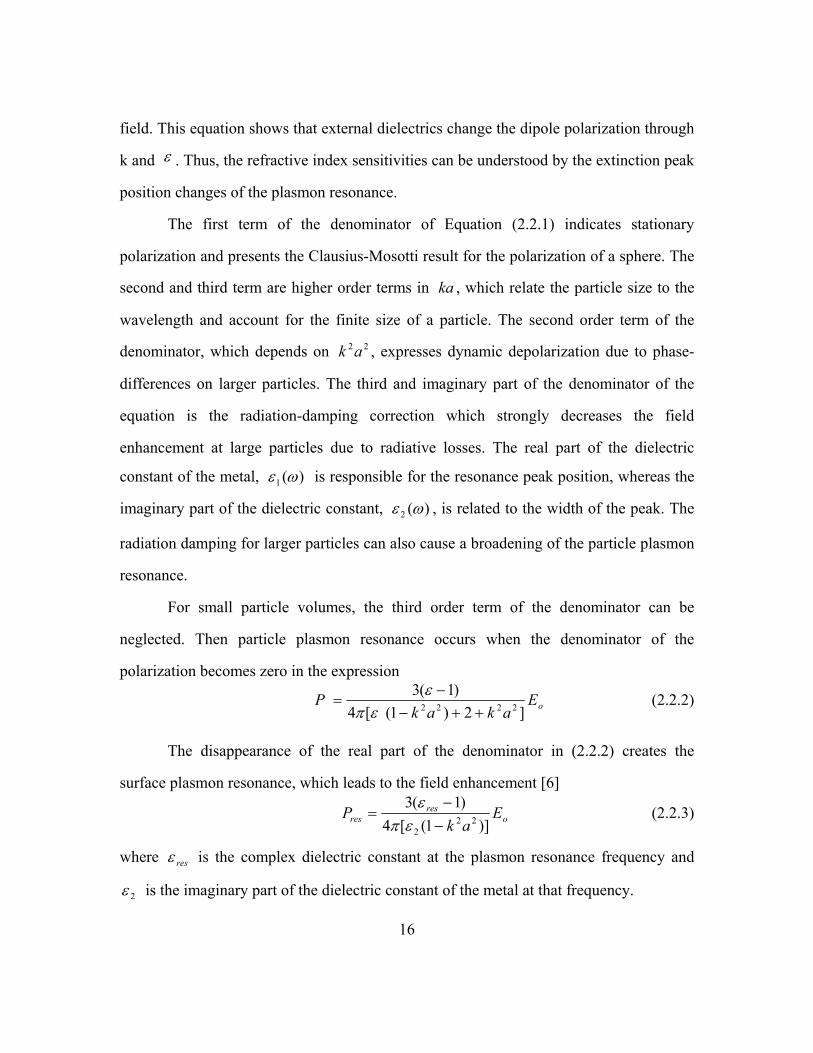
For general sizes of MNPs, the resonance condition is achieved when the
denominator of the real part in Equation (2.2.1) vanishes such as
032)2()1)(( 33
22222
1 =+++− akakak εωε (2.2.6)
Then the field enhancement is limited by the imaginary part of the denominator in
Equation (2.2.1). Increasing the particle size needs a more negative value of )(1 ωε to
retain the resonance condition. Because of the decrease of )(1 ωε toward longer
wavelengths this results in the red shift of the dipolar plasmon resonance (Figure 2.2.2).
Generally, the real part of the dielectric constant of noble metals has negative values
below the plasma frequency, whereas the imaginary part of the dielectric constant has
positive values.
)(1 ωεω
)(2 ωε
0
Figure 2.2.2: Schematic frequency dependence of the dielectric constant of a metal. )(1 is the real part of the dielectric constant for silver as function of wavelength. )(2 ωε is the imaginary part of dielectric constant for silver.
ωε
As the size of the particle increases, higher modes of the plasmon resonance are
excited, which is expressed by the secondary term of the denominator of Equation
(2.2.1), , and, for instance, a quadrupole mode will occur. The quadrupole 22ak
18
resonance is less sensitive to the particle shape and size than the dipole plasmon
resonance [10].
2.2.2 Mie theory for spherical particles
The scattering of light by a sphere the size of the wavelength of the light is well
described by Mie theory. Mie theory describes reflection, refraction, and interference of
light from different locations on the sphere. Mie theory is derived from Maxwell’s
equation for the boundary conditions of a sphere. Extinction spectra, which describe the
scattering plus absorption of light from a sphere can be calculated rather easily
(Extinction = Scattering + Absorption). Mie theory describes the scattering of light by
dust in air or by water droplets in clouds. Mie theory has to be used for spherical particles
with a radius greater than about 1/20 the wavelength of light. The Mie description
includes as a limiting case for smaller particles Rayleigh’s equation for the scattering of
light. When a small particle is exposed to an electromagnetic field whose wavelength is
much longer than the diameter of the particle, every electron in the particle experiences
the same phase of the wave, thus all of the electrons oscillate and scatter light with the
same phase. However, when the particle size is larger than the wavelength of the field,
electrons in different locations of the particle oscillate with different phase. This creates
interference of the electromagnetic field from electrons in different parts of the particle
(Figure 2.3.1). Therefore, Mie theory can be used to calculate the light radiation from
oscillating electric dipoles, quadrupoles, octopoles and higher multipoles as the particle
size increases.
19

≅
reflection
Refraction and interference effects
Sphere size light wavelength
Absorption
Figure 2.3.1: Illustration of the effects contributing to Mie scattering.
Mie theory yields the scattered electromagnetic field as an expansion in vector
spherical harmonics [7]. As the result, the total extinction coefficient Q and the
scattering coefficient can be calculated with the help of the Mie scattering
coefficients an and bn.
ext
scaQ
∑∞
=
++=1
2 )Re()12()2(n
nnext banx
Q (2.3.7)
∑∞
=
++=1
222 )|||)(|12(2
nnnsca ban
xQ (2.3.8)
where the size parameter x is
λπnakax 2
== (2.3.9)
where a is the particle radius and n is the refractive index of the medium. Re is the real
part of the complex function. From Equation 2.3.7 and 2.3.8 it is clear that the relative
20

contribution to the extinction spectrum of absorption and scattering are changed by
changing the particle size.
Finally, the scattering coefficient an, bn are expressed in terms of Bessel functions
)(')()(')()(')()(')(
nxxxnxnnxxxnxn
annnn
nnnnn ψξξψ
ψψψψ−−
= (2.3.10)
)(')()(')()(')()(')(
nxxnxnxnxxnxnx
bnnnn
nnnnn ψξξψ
ψψψψ−−
= (2.3.11)
where )(nxnψ and are the Riccati-Bessel functions defined as )(' nxnξ )()( ρρρψ nn j= ,
and . )(ρ)( ρρ = )1(ξ nn h )(ρnj and are spherical Bessel functions of the first
and second kind. The derivatives of the scattering coefficient can be expressed for
computational calculation such as
)()1( ρnh
xxn
xx nnn
)()()( 1
' ψψψ −= − (2.3.12)
xxn
xx nnn
)()()( 1
' ξξξ −= − (2.3.13)
For particles in an ambient medium other than air, the refractive index n is the
relative refractive index of the complex refractive index of the metal sphere, nm, and the
host medium refractive index, n0,
0nn
n m= (2.3.14)
an and bn express amplitudes of the scattered electric and magnetic fields for each
order of the field expansion. Note that an and bn disappear as the refractive index, n, in
Equation (2.3.14) approaches 1, i.e. the scattered field also vanishes. So, the total
transmittance and the extinction coefficient of a sphere of arbitrary radius can be
determined with Mie theory. Because this theory does not assume a particular dielectric
constant, it can be used with metallic spheres and predict resonant scattering and
absorption due to surface plasmon resonances. Mie theory calculation can be adopted to
ellipsoidal shapes[11], infinite circular cylinders [7] and nanoshells [12].
21

2.2.3 Various computational methods for Non-spherical MNPs
Non-spherical particles such as triangles [13, 14], pentagons [13], decahedra [15],
stars [16], rods [17] , cubes [18] and truncated tetrahedrons [19] have been fabricated and
characterized for optical properties. Non-spherical metal particles have similar optical
properties, but, in general, Mie theory can no longer be applied. For instance, nanorods
generally have transversal (across the rod) and longitudinal (along the rod) localized
surface plasmon excitations depending on the transversal and longitudinal polarization
direction of the exciting field. The longitudinal surface plasmon in the rod is red-shifted
from those of similar sized ellipsoids [17]. Transversal surface plasmons in nanorods,
which are independent of longitudinal surface plasmons have a much lower absorption
coefficient and the resonance is located at shorter wavelengths. Although the transversal
cross section of the rod resembles a sphere or ellipsoid in cross section and has been
calculated by Gans’ formula [17] which was derived from Mie theory for a single
ellipsoid, there is still a quantitative discrepancy between experimental values and the
modeling results due to the aspect ratio of the rods, aggregated rods, and polydisperse rod
sizes [17, 20].
The electromagnetic field distribution around other non-spherical particles, such
as a truncated tetrahedron, is very different from that of a spherical shape [10], with
intense quadrupole contributions, which are absent for spherical particles of roughly
equivalent sizes [21]. Very intense electromagnetic fields are found near the tips of the
particle along the polarization direction. This is called local field effect in non spherical
particles. The dipole resonance has maximum enhancement at the tips, while for the
quadrupole resonance the enhancement is shown at the sides [21].
The dipole resonance for the triangle shape is also substantially red-shifted
compared to a spherical particle of same size. The sensitivity of the resonance peak
22

positions to geometrical changes in the tip is very strong, so when the triangle corners are
more rounded, the spectral peak shifts to blue again [13]. Similarly, for thicker triangle
particles the spectral peak shifts to the blue region which is opposite of the behavior for
the spherical particles [19].
Since Mie theory does not generally hold for non-spherical particles, different
numerical methods have to be used to simulate theoretical aspects and compare with the
experimental results, such as the T-matrix method [22], Discrete Dipole Approximation
(DDA) [10, 21, 23], the multiple multipole method (MMP) [24], Finite-element method
(FEM) [25], surface integral equation (SIE) [26], the method of moments (MOM) [27],
and the finite difference time domain method (FDTD) [8, 28-30].
Approaches for numerical calculations of the electromagnetic field for non-
spherical shapes fall in roughly three categories. One is calculating the scattered field by
solving the differential equations of Maxwell equations in the time domain or in the
frequency domain with appropriate boundary conditions. FEM belongs to the differential
equation approach method. The other is integrating the volume or surface for the total
electric field everywhere in space with the incident field and the total field using
Maxwell’s equations. The scattered field is calculated by subtracting the incident field
from the total field. DDA, MOM and SIE belong to the integration method category. A
third category includes FDTD, T-matrix method, and hybrid techniques which merge
FDTD-FEM, or FEM-MOM, etc.
Near field simulation around non-spherical MNPs is very helpful to understand
the electromagnetic field behavior around MNPs and has been approached by many
numerical analysis tools such as DDA [10] , FEM-MOM [31], and FDTD [8, 32-34]. For
example, computational prediction in the near-field of the electric field of arbitrary
shaped particles was calculated by DDA [10]. The region of high field intensity is
23

localized to the high curvature periphery of the spheroidal particle and the tip of the
tetrahedron particle. The tetrahedron particle has the highest field intensity compared to
spherical or spheroid particles. As mentioned earlier, this is called a local field
enhancement effect in the tip region of the tetrahedron (Figure 2.4.1). The decay length
of the localized surface plasmon of the triangle is dramatically decreased compared to the
exponential decay length of the conventional SPR (Figure 2.4.1 (c)).
(b) (c) (a)
Figure 2.4.1: DDA simulated electric field contours with for various shapes. (a) The innermost contour represents the grid boundaries of a 30nm sphere. The drop in intensity is from 50 to 1. (b) 2:1 spheroid has high field intensity to the high curvature periphery of the particle. The drop in intensity is from 125 to 1. (c) The truncated tetrahedron has high field intensity near the tip. The drop in intensity is from 500 to 1. [10]
2|| E
There are many aspects such as numerical accuracy, computation time and
resource requirements, applicability to arbitrary particle shape and size, capability of near
field simulation, and far field calculation to judge which numerical tools are chosen in the
computational modeling for non-spherical MNPs. Many computational tools have their
own advantages and disadvantages for numerical simulation. However, the details of the
various available computational tools are not covered in this thesis.
For this thesis, FDTD using XFDTD 6.4® which is supported by REMCOM
(www.remcom.com) and FEM using FEMLAB 3.3a® which is commercially available
24
from COMSOL (www.comsol.com) were chosen as the computational modeling tools to
support our experimental results. These tools were chosen because of their capability of
near field and far field calculation in 3D, software availability, computational
performance, time, cost, and good user interface.
FEM solves unknown electric or magnetic fields at discretized small volume cells
called elements or mesh nodes with the partial differential equation for the vector
Helmholtz equation. As a result, FEMLAB 3.3a® can solve the scattered time harmonic
propagating electric or magnetic field. Interpolation is used to fill the data between the
nodes from the point of interest to each node. Thus assigning an optimized mesh size and
shape is very important for the numerical accuracy in FEM simulations because of the
interpolation. As the computational mesh is finer, the numerical calculation accuracy is
also improved. Typically, the mesh size should be at least 10 times smaller than the
smallest wavelength for accurate calculation. Therefore, the FEM result is dependent on
the meshing algorithm. This mesh size and shape can be non-rectangular and non-
equidistant in FEM. This is the fundamental advantage for FEM method. With this
advantage in FEM, the advantage of using FEMLAB 3.3a® is that it has a powerful user
graphic interface, allows time and distance variation in 2 D and 3D simulation including
near field and far field calculation, and it has good MATLAB® compatibility. The
disadvantage of FEMLAB 3.3a® is that it is not fully capable of calculating total fields. It
is only usable in scattering field simulation with free space. Dielectric environments such
as water/glass half-space simulation results are not disturbance-free in FEMLAB 3.3a®.
In 1966, a solution for Maxwell’s curl equations was suggested using the finite-
difference time-domain (FDTD) technique [35]. FDTD has been in extensive use only
since the end of the eighties due to the high computational and memory costs of the
25

method [36]. With modern powerful computers and low computational costs, the FDTD
technique has gained much attention for solving electromagnetic problems.
FDTD calculates the scattered field in the time domain by solving Maxwell's
time-dependent equations. The space and time derivatives of both fields in FDTD are
approximated by the space and time discretization with differences in a stair-casing way.
The electric field and magnetic field are assumed interleaved around a cell called the Yee
cell (Figure 2.4.2). Every E field is located at the edges of a Yee cell, and every H field is
located at the cube faces.
Ex
Hz
HxHy
Ey
`
Ez
Figure 2.4.2: Illustration of a Yee cell for FDTD. The electric field is located in the edges of the cube (blue arrow), and the magnetic field is located at the cube faces (bold red arrow).
Yee defines a regular orthogonal grid of coordinates (
as ( , where
),, kji
),,(),, zkyjxikji ∆∆∆= ,, yx ∆∆ and z∆ are the actual grid separations [35].
A discrete space and time function can be written
as , where ),,,(),,( tnzkyjxiFkjiF n ∆∆∆∆= t∆ is the time increment, and is the time n
26

index for central difference approximation of derivatives. The spatial and temporal
derivatives of the function can be written, using central finite difference approximations
as
xkjxFkjxF
xkjxF i
ni
ni
n
∆−−+
=∂
∂ ),,2/1(),,2/1(),,(
(2.4.1)
tkjiFkjiF
tkjiF nnn
∆−
=∂
∂ −+ ),,(),,(),,( 2/12/1
(2.4.2)
with space increments, zyx ∆=∆=∆=δ .
These difference approximations (2.4.1) and (2.4.2) can be applied to Maxwell’s
equations for FDTD calculations as [28].
Exn+1(i+1/2,j,k)= Ex
n(i+1/2,j,k) +00µε⋅∆
∆x
t [Hzn+1/2(i+1/2,j+1/2,k)-
Hzn+1/2(i+1/2,j-1/2,k)+Hy
n+1/2(i+1/2,j,k-1/2)-
Hyn+1/2(i+1/2,j,k+1/2)] (2.4.3)
Hxn+1/2(i,j+1/2,k+1/2)=Hx
n-1/2(i,j+1/2,k+1/2)+
),2/1,()1,2/1,([00
kjiEkjiEx
t ny
ny +−++
⋅∆∆
µε+Ez
n(i,j,k+1/2)-Ezn(i,j+1,k+1/2)]
(2.4.4)
If the cell size ∆ is chosen once, then the time step x t∆ has to be smaller than
0cnxt⋅
∆=∆ , where is the dimension of the simulation, n n is approximately 2 in
3D and is the speed of light in free space. Practically the time step is approximately
half of the cell size [28].
0c
From (2.4.3) and (2.4.4), it is clear that the electric field time derivatives are
dependent on the magnetic field space variation and vice versa in the Yee cell. E and H
values at the grid points for the previous and current time steps must be calculated and
stored at the next time step which is called leap-frog algorithm. Therefore, increasing the 27
memory requirement proportional to the total number of mesh points is essential. This
rectangular grid calculating method can also increase numerical errors, which can be
minimized by making the grid size smaller.
Since FDTD solves the E and H field with Maxwell’s equations in the time
domain, the time responses of the electric field and the magnetic field in the medium are
required. However, if the complex permittivity has a negative value in the real part or
imaginary part, like gold and silver, then the FDTD calculation will become unstable. To
avoid that issue, Drude or Lorentz model approximations have been adopted to fit the
experimental dielectric constants for use in FDTD [8, 34, 37].
Since FDTD is a time varying field calculation, it is intuitive, simple, and easy to
implement. Thus it is a good tool to illustrate and understand the computational results in
3D for the near field and the far field. Further details of the algorithm and theory for
FDTD are covered in Chapter 5.
To overview FEM and FDTD methods, there are many similarities and
differences between FEM and FDTD. The electromagnetic fields in FEM and FDTD are
propagated through a discretized volume, called elements or mesh. This element size
should be 10 to 20 times smaller than the smallest wavelength. The difference in the
meshing method between FDTD and FEM is that FDTD has constant intervals for a
given direction and FEM has irregular mesh sizes.
Both FEM and FDTD initially have unknown electric and magnetic fields at the
mesh nodes. To limit the number of unknown fields at mesh nodes to a certain size, FEM
and FDTD must be implemented in a finite computational domain due to computational
accuracy, time and resources.
Therefore, certain absorbing boundary conditions (ABC) for FEM and FDTD
must be required at the boundary of the computational space to limit the computation size
28

and truncate the undesired reflections that otherwise would go back into the
computational space. Mostly Perfectly Matched Layer (PML) techniques are used in both
FEM and FDTD [38].
The most advantageous feature of FEM and FDTD is that they can be applied to
arbitrary and inhomogeneous particle shapes and sizes, while some of the integral
equation methods are limited to only a few model shapes and sizes.
FEMLAB 3.3a® for FEM and XFDTD® for FDTD can simulate the near field
and far field in 2D and 3D. With near to far zone transformation techniques, such as
Stratton-Chu formula or Green’s function [39, 40], it is possible to compute the scattered far zone field. In the Stratton-Chu formula, is the calculated far field at point P. pE
∫ ⋅××−××= dSrrjkHnrEnrjk
E oooooo
p )exp()]([4
ηπ
o
(2.4.5)
where is the unit vector pointing from the origin to the field point p, is the unit
normal to the surface S,
or n
η is the free space impedance, k is the free space wave
number, is the radius vector of the surface S. The far field point p is normally taken at
1 m with spherical coordinate position
o
r
θ and φ . The far field intensity pattern is given
by . 2|p| E
In this thesis, 3D FDTD simulations and 2D FEM cross-sectional in-plane
simulations were used to explore the LSPR properties in the sharp features of the non-
spherical MNP and compare the simulated and experimental results.
2.2.4 Sensitivity of MNP plasmonic sensor to the dielectric environment
There is growing attention to the study of the localized particle plasmonic sensor
used as a detecting sensor for dielectric environmental changes. First, it has been shown
that colloidal gold particles can be used as detecting agents [41, 42]. When colloidal gold
particles coated with an antibody interact with a protein ligand, the extinction peak of the
29

surface plasmon resonance is red-shifted from 544 nm to 547 nm wavelength by slight
changes in the refractive index at the colloidal gold surface [41]. Observing the kinetics
of the binding of a protein ligand to an antibody immobilized on the surface of colloidal
gold is even possible by using the fixed wavelength of 600 nm to the red of the peak. The
smallest tested ligand size was 15 kDa for the anti-human heart fatty acid-binding protein
(hFABP) [41]. Colloidal gold particles were also used as immunoassay and compared
with other existing methods [42]. From these reports, it is understood that the SPR
wavelength change is directly related to the diameter of the spherical particle and the
refractive index change in the medium as predicted by equation (2.2.1) and Mie theory.
Mie theory predicts a linear relationship between the peak position of the plasmon
resonance and the refractive index change of the surrounding medium for a spherical
MNP. This was experimentally shown using 0.04 refractive index steps [43], and
similarly for non-spherical MNPs, specifically in triangular MNPs.
One group calculated that in quasistatic approximation the sensitivity of the
resonance to bulk refractive index changes is merely a function of the peak wavelength
[44] regardless of the structural features of the particles. The sensitivity of the peak
wavelength, *λ , to the change in refractive index n is found to be a linear function of
peak wavelength
mnndnd xε
λλ 2*2*+= (2.5.1)
wheren2 is the slope and εx is the intercept and m the slope for the linear approximation
of the real part of the dielectric function of gold or silver. The authors showed that gold
nanodisks, nanoshells, and nanocylinders have the same sensitivity as long as they have
30
the same peak positions. However, this applies only to the bulk refractive index changes.
Near-field contributions from particles with sharp features such as edges, corners, or
apexes, which show enhanced electric fields, have been shown to contribute significantly
to the sensitivity. The above equation may therefore not hold for the near field in non-
spherical MNPs, and in larger particles, where the quasi-static approximation may no
longer apply.
Nanocubes, which are an example of non-spherical MNPs, and which can have
hollow interiors and sharp corners, have been synthesized and characterized [18, 45]. The
resonance position of the cubes is dependent on the size. Smaller cubes have the peak
positions of the resonance at short wavelengths, while bigger cubes have the resonance at
longer wavelengths [18]. Another set of experiments measured the sensitivity for similar
nanocubes under different dielectric environments at an interface [45]. They found two
plasmon resonance peaks when the cubes touched a glass substrate. One peak was blue
and the other peak was found to be red. FDTD near field simulation showed that the blue
peak is related to large fields from the cube corners away from the substrate surface (top
corners) and the more red peak is related to large fields from the cube corners toward to
the surface (bottom corners). These two peaks both have an increased sensitivity to bulk
refractive index changes. However, the blue peak has larger peak shifts than the red peak
under the same bulk dielectric environmental conditions, because of the substrate
influence on the near-field distribution and intensity. Thus it is understood that different
polarization direction, the presence of corners and the position with respect to the
substrate, as well as the size, thickness of the MNP, and most importantly near field
intensity are all critical for plasmonic sensing.
Not only the bulk refractive index change, but also the localized refractive index
change gives a linear shift of the absorption peak [3, 14, 46]. Linear response of localized
31

plasmon resonance to alkanethiol chain length dependency has been shown with
triangular tetrahedron pyramid [3, 46] and triangular nanoprism [14]. As the adsorbate
layer thickness [47] or chain length increases [3, 14, 46], the peak shift is also increased
linearly in both non-spherical structures. After surface modification with hexadecanethiol
on the MNPs, the bulk refractive index sensitivity drops from 196 nm /RIU to 159 nm
/RIU [46]. It is explained by the near field intensity decrease at the sharp edges and
corners due to the chemical modification of the surface. Near field numerical simulation
with DDA supports these experimental results. It shows that the dielectric shift is largest
where the near field is largest [46, 48]. FDTD simulations for near field scanning optical
microscopy (NSOM) probes also show that the enhancement in electric field strength
from localized surface plasmon resonance in the vicinity of sharp apex is much stronger
than in other areas of the MNPs, due to strong field confinement [33].
Therefore, the understanding of the relationship between near field enhancement
and plasmonic sensing application is a crucial step for developing label-free sensing
techniques. The understanding of non-spherical MNPs for both bulk and local refractive
index changes and the associated sensitivity is also important.
2.2.5 References 1. Wink, T., S.J. VanZuilen, A. Bult and W.P. vanBennekom, Liposome-mediated
enhancement of the sensitivity in immunoasssays of proteins and peptides in surface plasmon resonance spectrometry. Analytical Chemistry, 1998. 70: p. 827-832.
2. Rademann, J. and G. Jung, Integrating Combinatorial Synthesis and Bioassays. SCIENCE, 2000. 287: p. 1947-1948.
3. Malinsky, M.D., K.L. Kelly, G.C. Schatz and R.V. Duyne, Chain Length Dependence and Sensing Capabilities of the Localized Surface Plasmon Resonance of Silver Nanoparticles Chemically Modified with Alkanethiol Self-Assembled Monolayers. J. Am. Chem. Soc., 2001. 123: p. 1471-1482.
32
4. Foss, C.A., J.G.L. Hornyak, J.A. Stockert and C.R. Martin, Template Synthesized nanoscopic Gold Particles: Optical spectra and the effects of particle size and shape. J. Phys. Chem, 1994. 98: p. 2963-2971.
5. Duyne, R.P.V., Nanosphere Lithography: Effect of substrate on the localized surface plasmon resonance spectrum of silver nanoparticles. J. Phys. Chem. B, 2001. 105: p. 2343-2350.
6. Meier, M. and A. Wokaun, Enhanced fields on large metal particles: dynamic depolarization. Optics Letters, 1983. 8: p. 581-583.
7. Huffman, D.R. and C.F. Bohren, Absorption and Scattering of Light by Small Particles. 1998, New York: John Wiley & Sons.
8. Gray, S.K. and T. Kupka, Propagation of light in metallic nanowire arrays: Finite-difference time-domain studies of silver cylinders. Physical Review B, 2003. 68(4).
9. Wokaun, A., J.P. Gordon and P.F. Liao, Radiation Damping in Surface-Enhanced Raman Scattering. Physical Review Letters, 1982. 48: p. 957-960.
10. Jensen, T., L. Kelly, A. Lazarides and G.C. Schatz, Electrodynamics of noble metal nanoparticles and nanoparticle clusters. Journal of Cluster Science, 1999. 10: p. 295-317.
11. Hamann, H.F., M. Larbadi, S. Barzen, T. Brown, A. Gallagher and D.J. Nesbitt, Extinction near-field optical microscopy. Optics Communications, 2003. 227(1-3): p. 1-13.
12. Nehl, C.L., N.K. Grady, G.P. Goodrich, F. Tam, N.J. Halas and J.H. Hafner, Scattering spectra of single gold nanoshells. Nano Letters, 2004. 4(12): p. 2355-2359.
13. Mock, J.J., M. Barbic, D.R. Smith, D.A. Schultz and S.Schultz, Shape effects in plasmon resonance of individual colloidal silver nanoparticles. Journal of Chemical Physics, 2002. 116: p. 6755-6759.
14. Sherry, L.J., R.C. Jin, C.A. Mirkin, G.C. Schatz and R.P. Van Duyne, Localized surface plasmon resonance spectroscopy of single silver triangular nanoprisms. Nano Letters, 2006. 6(9): p. 2060-2065.
15. Sanchez-Iglesias, A., I. Pastoriza-Santos, J. Perez-Juste, B. Rodriguez-Gonzalez, F.J.G. de Abajo and L.M. Liz-Marzan, Synthesis and optical properties of gold nanodecahedra with size control. Advanced Materials, 2006. 18(19): p. 2529-+.
16. Yamamoto, M., Y. Kashiwagi, T. Sakata, H. Mori and M. Nakamoto, Synthesis and morphology of star-shaped gold nanoplates protected by poly(N-vinyl-2-pyrrolidone). Chemistry of Materials, 2005. 17(22): p. 5391-5393.
17. Perez-Juste, J., I. Pastoriza-Santos, L.M. Liz-Marzan and P. Mulvaney, Gold nanorods: Synthesis, characterization and applications. Coordination Chemistry Reviews, 2005. 249(17-18): p. 1870-1901.
18. Xiong, Y.J., J.Y. Chen, B. Wiley, Y.A. Xia, Y.D. Yin and Z.Y. Li, Size-dependence of surface plasmon resonance and oxidation for pd nanocubes synthesized via a seed etching process. Nano Letters, 2005. 5(7): p. 1237-1242.
19. Jensen, T., M.D. Malinsky, C.L. Haynes and R.P.V. Duyne., Nanosphere Lithography:Tunable localized surface plasmon resonance spectra of silver nanoparticles. J. Phys. Chem B, 2000. 104: p. 10549-10556.
20. Liz-Marzan, L.M., Tailoring surface plasmons through the morphology and assembly of metal nanoparticles. Langmuir, 2006. 22(1): p. 32-41.
33
21. Coronado, E., K.L. Kelly, L.L. Zhao and G.C. Schatz, The Optical properties of metal nanoparticles: the influence of size, shape, and dielectric environment. J. Phys. Chem B, 2003. 107: p. 668-677.
22. Mishchenko, M.I., L.D. Travis and A.A. Lacis, Scattering, Absorption, and Emission of Light by Small Particles 2002: Cambridge University Press.
23. Coronado, E.A. and G.C. Schatz, Surface plasmon broadening for arbitrary shape nanoparticles: A geometrical probability approach. Journal of Chemical Physics, 2003. 119(7): p. 3926-3934.
24. Hafner, C. and N. Kuster, Computations of Electromagnetic-Fields by the Multiple Multipole Method (Generalized Multipole Technique). Radio Science, 1991. 26(1): p. 291-297.
25. Micic, M., N. Klymyshyn and H.P. Lu, Finite element method simulations of the near-field enhancement at the vicinity of fractal rough metallic surfaces. Journal of Physical Chemistry B, 2004. 108(9): p. 2939-2947.
26. Chu, H.S., W.B. Ewe, E.P. Li and R. Vahldieck, Analysis of sub-wavelength light propagation through long double-chain nanowires with funnel feeding. Optics Express, 2007. 15(7): p. 4216-4223.
27. Harrington, R.F., Field Computation by Moment Methods 1983, N.Y.: R.E. Krieger Pub. Co., .
28. Sullivan, D.M., Electromagnetic Simulation Using the FDTD Method. 2000, N.Y.: Wiley-IEEE Press.
29. Taflove, A. and S.C. Hagness, Computational Electrodynamics: The Finite-Difference Time-Domain Method (Artech House Antennas and Propagation Library) 3rd ed. 2000: ARTECH HOUSE, INC.
30. Kunz, K.S. and R.J. Luebbers, The Finite Difference Time Domain Method for Electromagnetics 1993: CRC.
31. Hao, E., R.C. Bailey, G.C. Schatz, J.T. Hupp and S.Y. Li, Synthesis and optical properties of "branched" gold nanocrystals. Nano Letters, 2004. 4(2): p. 327-330.
32. II, J.T.K., E.J. Sanchez and X.S. Xie, Design of near-field optical probes with optimal field enhancement by finite difference time domain electromagnetic simulation. Journal of Chemical Physics, 2002. 116: p. 10895-10901.
33. Milner, R.G. and D. Richards, The role of tip plasmons in near-field Raman microscopy. Journal of Microscopy-Oxford, 2001. 202: p. 66-71.
34. Saj, W.M., FDTD simulations of 2D plasmon waveguide on silver nanorods in hexagonal lattice. Optics Express, 2005. 13(13): p. 4818-4827.
35. K. S. Yee, Numerical solution of initial boundary value problems involving Maxwell's equations in isotropic media. IEEE Trans. Antennas Propag., 1966. 14: p. 302-307.
36. Shlager, K.L. and J.B. Schneider, Selective Survey of the Finite-Difference Time-Domain Literature. Ieee Antennas and Propagation Magazine, 1995. 37(4): p. 39-57.
37. Young, J.L. and R.O. Nelson, A summary and systematic analysis of FDTD algorithms for linearly dispersive media. Ieee Antennas and Propagation Magazine, 2001. 43(1): p. 61-77.
34

38. Lavrinenko, A., P.I. Borel, L.H. Frandsen, M. Thorhauge, A. Harpoth, M. Kristensen, T. Niemi and H.M.H. Chong, Comprehensive FDTD modelling of photonic crystal waveguide components. Optics Express, 2004. 12(2): p. 234-248.
39. Garcia, S.G., B.G. Olmedo and R.G. Martin, A time-domain near- to far-field transformation for FDTD in two dimensions. Microwave and Optical Technology Letters, 2000. 27(6): p. 427-432.
40. Stratton, J.A. and L.J. Chu, Diffraction Theory of Electromagnetic Waves Phys. Rev., 1939. 56: p. 99-107.
41. Englebienne, P., Use of colloidal gold surface plasmon resonance peak shift to infer affinity constants from the interactions between protein antigens and antibodies specific for single or multiple epitope. Analyst, 1998. 123: p. 1599-1603.
42. Englebienne, P., A.V. Hoonacker and J. Valsamis, Rapid Homogeneous Immunoassay for Human Ferritin in the Cobas Mira Using Colloidal Gold as the Reporter Reagent. Clinical Chemistry, 2000. 46: p. 2000-2003.
43. Mock, J.J., D.R. Smith and S. Schultz, Local refractive index dependence of plasmon resonance spectra from individual nanoparticles. Nanoletters, 2003. 3(4): p. 485-491.
44. Miller, M.M. and A.A. Lazarides, Sensitivity of metal nanoparticle surface plasmon resonance to the dielectric environment. Journal of Physical Chemistry B, 2005. 109(46): p. 21556-21565.
45. Sherry, L.J., S.H. Chang, G.C. Schatz, R.P. Van Duyne, B.J. Wiley and Y.N. Xia, Localized surface plasmon resonance spectroscopy of single silver nanocubes. Nano Letters, 2005. 5(10): p. 2034-2038.
46. Haes, A.J., S.L. Zou, G.C. Schatz and R.P. Van Duyne, Nanoscale optical biosensor: Short range distance dependence of the localized surface plasmon resonance of noble metal nanoparticles. Journal of Physical Chemistry B, 2004. 108(22): p. 6961-6968.
47. Whitney, A.V., J.W. Elam, S.L. Zou, A.V. Zinovev, P.C. Stair, G.C. Schatz and R.P. Van Duyne, Localized surface plasmon resonance nanosensor: A high-resolution distance-dependence study using atomic layer deposition. Journal of Physical Chemistry B, 2005. 109(43): p. 20522-20528.
48. Haes, A.J., S.L. Zou, G.C. Schatz and R.P. Van Duyne, A nanoscale optical biosensor: The long range distance dependence of the localized surface plasmon resonance of noble metal nanoparticles. Journal of Physical Chemistry B, 2004. 108(1): p. 109-116.
35
Chapter 3: Fabrication of carbon based template-stripping method for large scale nanopatterned atomic scale flat surfaces
3.1 INTRODUCTION
Non-spherical MNPs with sharp features enhance the electric field at corners or
edges [1]. However, sharp features like corners and edges often are not preserved in
solvents or during chemical modification. For applications as a reliable sensor the shape
has to be preserved, since changes in shape influence the resonance peak position as well
as the sensitivity to bulk and local changes in the refractive index of the environment [2,
3].
Although it is possible to produce various non-spherical MNP shapes with sharp
features, these features are never perfectly sharp after chemical modification or during
chemical synthesis. For instance, to achieve reliability and reproducibility, triangular
shapes of truncated tetrahedrons have to be annealed in a solvent or be annealed
thermally, which leads to rounded tips and edges [3, 4]. Triangular nanoprisms [5], made
by chemical synthesis, also have significant changes in shape that influence the resonance
peak. The nanoprisms often have rounded apexes and exposure to ethanol for 12 hours
for chemical functionalization leads to a blue shift induced by solvent annealing. DDA
calculations show that, as the sharp tip of the nanoprism is snipped, the resonance
spectrum is less broad. The authors suggested that if the tips are well protected, then the
nanoprism sensing performance will be improved, and a method for protecting the tips is
under development [5]. We have looked for a technique that could preserve sharp corners
and edges of non-spherical MNPs. The ultraflat nanosphere lithography (UNSL)
technique [6] embeds the MNP partially into a very flat substrate surface and so preserves
the MNP shapes.
36

Additionally, ultraflat surfaces have versatile usages. For examples, ultraflat
surfaces made from mica, highly oriented pyrolytic graphite (HOPG), and silicon play a
crucial role in many scanning probe experiments [7, 8], and in protein [9] and DNA [10-
12] adsorption investigations. Limitations in material properties, such as conductivity,
surface chemistry, and the need for flat heterogeneous materials, have led to the
development of template-stripping methods. These mostly use flat surfaces, such as mica
or silicon, as starting substrates to evaporate the desired materials onto, and retrieve a flat
surface after removing the original substrate [13]. Evaporation and sputtering techniques
are easy approaches to create surfaces of the desired materials, but high surface energies
can produce irregular grains with topography in the several-nanometer range [14].
Although control of thermal evaporation rates, the choice of the substrate, and thermal
annealing can reduce roughness [14-16], surfaces of evaporated materials often do not
achieve the flatness seen with mica, HOPG, and silicon. Template stripping is a powerful
and simple technique to create ultraflat surfaces with evaporated materials. It allows for a
variety of materials to be used as long as the adhesion forces between the flat template
and the desired sample are weaker than the adhesion forces at any other interface within
the final material, such as the surface material-to-glue interface and interfaces between
different materials in heterogeneous samples. Besides mica, glass [17], silicon [18], and
even gypsum [19] have been used for template stripping, with the resulting surfaces
showing good flatness. Examples of template-stripped ultraflat surface materials are
gold [20-27], titanium oxide [28, 29], and platinum [30, 31] for homogeneous surfaces,
and gold-glass, silver-glass [6], gold-silver [32], and cobalt-gold-titanium [33] for
composite surfaces. Applications that require ultraflat sample surfaces range from the
study of self-assembled monolayers on gold [20, 22], supported or tethered lipid bilayers
37
[34] and electrodes [35], Langmuir-Blodgett films [18], and single molecule studies [36],
to the study of model surfaces for protein and cell adsorption [28, 37] .
Although a roughness of less than 1 nm root mean square (rms) has been easily
achieved with this method over relatively large areas, for many surface materials mica
had to be used as the template, and the final stripping process was often incomplete and
irreproducible, leaving thin residual mica shards. Therefore a variety of improvements
have been developed that allow for a controlled, complete, and reproducible removal of
the template. Ultraflat gold surfaces could be detached from mica using tetrahydrofurane
(THF), but transparent glues, in particular, would not survive the treatment [22]. For gold
surfaces, the glue could be replaced with cold welding at high pressure [24] or by solid-
state bonding at elevated temperatures [27]. Alternatively, gold can be stripped from mica
templates using thiol solutions, but at the expense of the gold film being coated with a
thiol film [25]. Sacrificial layers, such as sputtered carbon films, offer an alternative by
allowing for an easy detachment and removal by oxygen plasma [28, 29]. However, mica
still has to be stripped mechanically, and, while on thick homogeneous films the residual
few-nanometer-thick mica shards may be removed by prolonged plasma etching, on
heterogeneous films this will lead to uneven etching or even the removal of one material
component. Other materials can be used for the mechanical stripping process, but the
template needs a certain bending tolerance during the mechanical stripping or the forces
that have to be applied will become too large. The problem of too much force makes thin
glass slides and silicon wafers less attractive, because, like mica, they break easily, and
thick glass slides are too rigid to allow stripping.
The new fabrication method described in this chapter improves the ultraflat
nanosphere lithography (UNSL) technique developed to create nanopatterns over cm2-
areas of two materials without associated topography, which originally used mica as the
38

template [6]. The improvements were needed because the residual mica shards had a
significant influence on the LSPR peak position, thereby making measurements very
noisy. This chapter presents here a technique to improve template stripping in general.
The focus is on UNSL in particular to achieve the goal of residue-free template-stripped
surfaces, while also being versatile in the use of materials for the final surface and
allowing for optically transparent samples. The following requirements had to be met: (1)
the template had to be flat and somewhat bendable but “unbreakable”, (2) the template
had to be very hydrophilic with water contact angles below 10° to allow for good
nanosphere self-assembly, (3) the stripping had to be gentle enough and well controlled
enough to accommodate differential adhesion between the different materials of the
patterned surfaces, and (4) the resulting surface had to be free of any contamination so
that pattern and background could be functionalized independently with the chemical
functionalities of choice. After outlining the fabrication process, we demonstrate the
power of this improved UNSL technique for nanopatterning self-assembled monolayers
(SAMs), for creating surfaces to be used as sensors, and for combining nano- and soft
lithographic techniques.
3.2 EXPERIMENTAL METHODS
Materials: Polystyrene nanospheres of 500 nm, 400 nm, and 300 nm diameter
were purchased from Interfacial Dynamics Corporation (Portland, OR). De-ionized water
with a resistivity of at least 18.0 MΩ cm was used. Methanol and ethanol (Fisher
Scientific, Houston, TX), and 1-Hexadecanethiol (Aldrich, Milwaukee, WI) were used as
purchased. Optically transparent, low-viscosity epoxy, Epo-Tek #302-3M (Epoxy
Technology Inc., Billerica, MA) or 20-3068 (Epoxies, Etc, Cranston, RI) was used for all
bonding of surfaces. Plain microscope slides (1 mm thick, 2.2 x 4.4 cm2) (Erie Scientific,
39
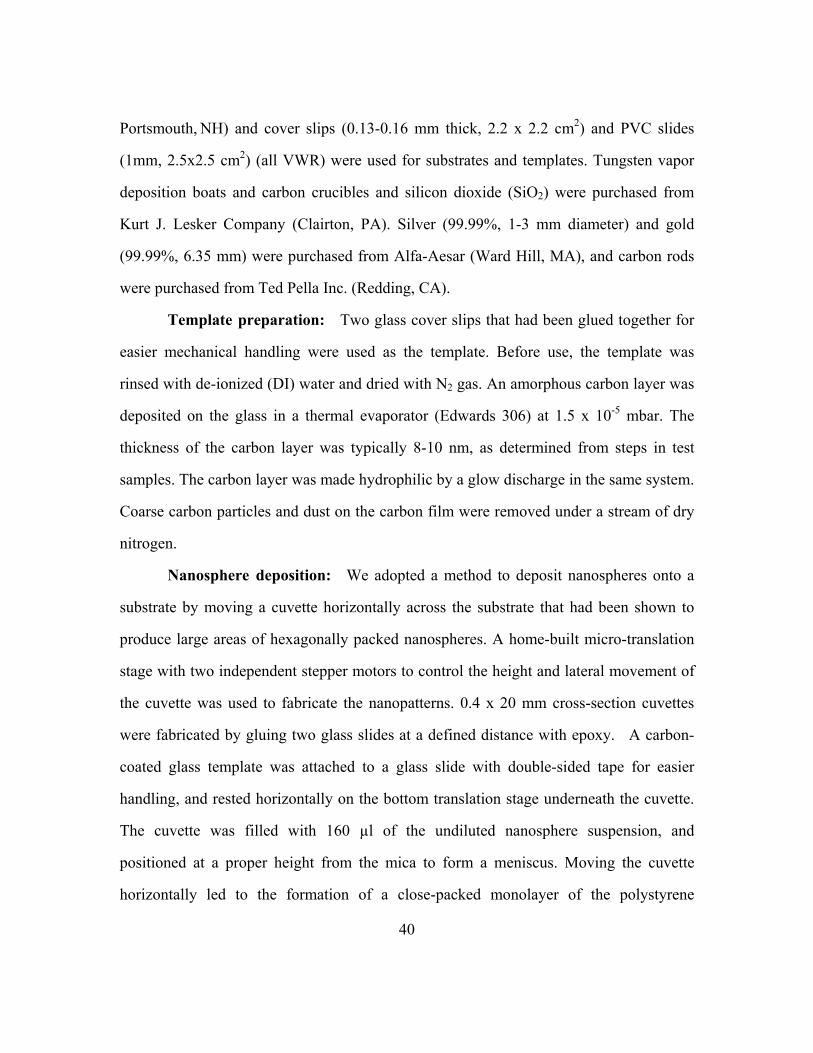
Portsmouth, NH) and cover slips (0.13-0.16 mm thick, 2.2 x 2.2 cm2) and PVC slides
(1mm, 2.5x2.5 cm2) (all VWR) were used for substrates and templates. Tungsten vapor
deposition boats and carbon crucibles and silicon dioxide (SiO2) were purchased from
Kurt J. Lesker Company (Clairton, PA). Silver (99.99%, 1-3 mm diameter) and gold
(99.99%, 6.35 mm) were purchased from Alfa-Aesar (Ward Hill, MA), and carbon rods
were purchased from Ted Pella Inc. (Redding, CA).
Template preparation: Two glass cover slips that had been glued together for
easier mechanical handling were used as the template. Before use, the template was
rinsed with de-ionized (DI) water and dried with N2 gas. An amorphous carbon layer was
deposited on the glass in a thermal evaporator (Edwards 306) at 1.5 x 10⁻⁵ mbar. The
thickness of the carbon layer was typically 8-10 nm, as determined from steps in test
samples. The carbon layer was made hydrophilic by a glow discharge in the same system.
Coarse carbon particles and dust on the carbon film were removed under a stream of dry
nitrogen.
Nanosphere deposition: We adopted a method to deposit nanospheres onto a
substrate by moving a cuvette horizontally across the substrate that had been shown to
produce large areas of hexagonally packed nanospheres. A home-built micro-translation
stage with two independent stepper motors to control the height and lateral movement of
the cuvette was used to fabricate the nanopatterns. 0.4 x 20 mm cross-section cuvettes
were fabricated by gluing two glass slides at a defined distance with epoxy. A carbon-
coated glass template was attached to a glass slide with double-sided tape for easier
handling, and rested horizontally on the bottom translation stage underneath the cuvette.
The cuvette was filled with 160 µl of the undiluted nanosphere suspension, and
positioned at a proper height from the mica to form a meniscus. Moving the cuvette
horizontally led to the formation of a close-packed monolayer of the polystyrene
40

nanospheres over the full 2.5 x 2.5 cm2 carbon layer. Lateral speed and cuvette height
need to be adjusted to match relative humidity and temperature conditions.
Nanoparticle composite fabrication: The densely packed monolayer of
spheres was used as a mask for the thermal evaporation of gold or silver at a pressure of
about 2 x 10⁻⁶ Torr and a rate of 5 Å/s in a thermal evaporator (Denton Vacuum DV-
502A, Moorestown, NJ). The desired thickness of the deposited metal was controlled by
a quartz crystal monitor. After thermal metal evaporation, the spheres were removed from
the carbon layer by sonication for 1 min in DI water with 3 degauss force in a sonication
bath (VWR Aquasonic Model-75D). Samples were rinsed in DI water and dried in a
stream of N2 gas. Following the lift-off of the spheres, 500 nm of SiO2 was deposited
onto the surface at 2 x 10—6 Torr in an electron-beam evaporator (Edwards Auto500,
Crawley, UK) at a rate of 5 Å/s.
Template stripping process: A cleaned glass slide was glued with epoxy to the
freshly evaporated nanocomposite film to provide mechanical support. In order to avoid
air bubbles that developed from dewetting in the glue between the glass support and the
evaporated SiO2, the glue was applied in two steps. First, a thin layer of the epoxy was
deposited and cured on the evaporated SiO2 surface to seal the SiO2. Then a second layer
of epoxy was used to attach the support glass slide to the first epoxy surface. A PVC
substrate was glued to the glass side of the original carbon-glass substrate to facilitate the
lift-off step. The epoxy was cured in all curing steps at 80 °C for 3 hours. After curing,
the PVC-glass-carbon substrate was peeled off from the glass substrate with a scalpel,
leaving the desired sample surface coated with a carbon film.
Removing residual carbon by O2 reactive ion etching (RIE): Oxygen plasma
was used for removing residual carbon from the stripped sample surface in a March CS-
1701 Reactive Ion Etcher (Concord, CA), at 100 W, 20 sccm, for 4 min, unless otherwise
41

noted. Finally, the reactive ion-etched UNSL surface was cleaned before use by
sonication for 1 min in DI water and then dried in a stream of N2.
Sample characterization: Samples were characterized with AFM (Asylum
Research MFP 3D, Santa Barbara, CA) in contact mode under ambient conditions at scan
speeds of 10-80 µm/s using silicon nitride probes (NP-20, Veeco Metrology, Santa
Barbara, CA). For height characterization and rms, the surface was measured over a
2x2_µm2 area at scan speeds in the range of 1.5-4 µm/s. Ultraviolet–visible (UV-Vis)
extinction spectra, measured in a Cary 5E UV-Vis-IR spectrophotometer (Varian), were
used to follow the changes in the coating of the gold or silver particles.
Thiol functionalization: Au/SiO2 UNSL samples were incubated in a 3 mM
ethanolic solution of hexadecanethiol (HDT) (Aldrich) for up to 24 hours or as specified.
Samples were rinsed in ethanol and dried under a stream of nitrogen. For microcontact
printing, polydimethoxysilane (PDMS) (Sylgard 184, DuPont) was poured onto a
template of an SU-8 (2015, Microchem) pattern on a silicon wafer and cured at 90 °C for
1 h. The PDMS stamp was then oxidized in an O2 plasma for 30 s at 50 W and 20 sccm to
minimize the transfer of PDMS residue to the glass areas [38]. A 0.1 mM ethanolic HDT
solution was applied to the surface of the stamp and dried under a stream of nitrogen.
The stamp was brought in contact with the surface for up to 2 min. Upon stamp removal,
the sample was immediately rinsed in warm ethanol (~ 30 °C) and sonicated for 1 min at
9 degauss, and finally dried under a stream of nitrogen.
3.3 RESULTS AND DISCUSSION
3.3.1 Sample fabrication and characterization
Although Rossetti et al. [29] introduced a carbon layer of 6 nm to 20 nm to
template-strip titanium oxide against a mica substrate, the prolonged high-power oxygen
42

plasma treatment needed to remove remaining mica shards from the titanium oxide was
not compatible with the composite materials used here. Figure 3.1 shows an example of
a thin mica sheet that remained on a classical UNSL sample with a mica template that
had been coated with a hydrophilic carbon layer, with the plasma etch time limited so that
exposed areas would not be overetched. The limitation of the etch times will be explained
in more detail below.
Figure 3.1: AFM image of mica residues on a classical UNSL sample with an additional carbon film on the mica template. The sample was oxygen plasma treated for 150 s. Mica shards (light area) of 9 nm (as shown here) or larger thickness can remain, covering the intended surface (dark area), and are not removed at the etch times or powers used to preserve exposed areas.
Because mica is so brittle, a different template material was necessary to assure
complete template removal. Glass slides are not elastic enough to allow mechanical lift-
off, glass cover slips are bendable but break easily, and PVC cover slips are not smooth
enough, we developed the new UNSL procedure shown in Figure 3.2. A pair of glass
cover slips, glued together, were coated with an 8-10 nm thick layer of amorphous carbon
43

that was made hydrophilic by glow discharge. The resulting surface had a flatness
comparable to glass. The carbon layer bonds strongly enough to the glass slide so that it
is not removed by organic solvents or sonication. Polystyrene nanospheres were
deposited onto the carbon surface to give a hexagonally close-packed monolayer of
spheres that forms the mask through which material 1 is deposited by thermal or electron-
beam evaporation. The density of MNPs so created was approximately
32,000_particles/mm2. The spheres are removed by sonication in water, followed by the
deposition of material 2, also by evaporation. Here we used gold or silver for material 1
and SiO2 as material 2, but we have used other materials also. In contrast to original
UNSL, no chromium layer is needed for the bonding of the gold or silver to the SiO2. A
glass slide is glued to the material 2 side for mechanical support of the final sample. The
template is further reinforced before the mechanical stripping procedure by gluing a PVC
cover slip to the bottom side, which also removes possible glass shards. The fracture
occurs in the carbon film, leaving a thin carbon residue on the final composite surface.
This residual carbon film is removed in an O2 RIE step to expose the nanopattern of
embedded nanotetrahedrons of gold or silver in a SiO2 matrix. The sample is transparent
but shows surface plasmon resonance (SPR) absorption due to the gold or silver metal
nanoparticles.
We optimized the etching process and characterized its influence on the quality of
the UNSL surface. The O2 RIE process etches the carbon with a linear rate depending on
the plasma power as determined by the absorption at 400 nm for a non-patterned carbon-
coated glass substrate (Figure 3.3a). For all the following experiments we have picked a
power of 100 W, corresponding to an etch rate of close to 0.67 nm/s. However, the
same process on an UNSL surface requires more time as shown in Figure 3.5a for a
Au/SiO2 UNSL at 500 nm wavelength for the standard etching parameters. This
44

significant difference in the etching rate may be due to a different interaction of the
evaporated materials with the carbon.
Figure 3.2: A schematic outline of the fabrication procedure of the new UNSL. The process begins with the deposition of an 8-10 nm hydrophilic carbon layer on a clean glass slide. Polystyrene nanospheres are deposited on the carbon layer to form a hexagonally closed-packed monolayer. Material 1 (here gold) is thermally evaporated onto the nanosphere mask. The spheres are removed, leaving material 1 nanoparticles, and in a second evaporation step a thick film of material 2 (here SiO2) is deposited. A mechanical support (glass slide) is glued to the silicon dioxide layer. To facilitate the complete removal of the template, the original glass cover slip is supported by a PVC slide. The template is removed mechanically, and the carbon layer is removed by oxygen RIE, revealing an embedded truncated tetrahedron metal nanoparticle MNP in a matrix of material 2. Large areas (cm2) can be fabricated with nearly atomically flat surfaces.
A more detailed picture of the etching process can be gained from UV-Vis
spectroscopy and AFM, because the metal nanoparticles in the transparent samples show
a localized surface plasmon resonance (LSPR), which is sensitive to the adjacent
45

material’s refractive index. Figure 3.3b shows the SPR spectra at different etch times
for a Au/SiO2 UNSL sample. The SPR peak is strongly damped and far to the red before
the etching, and a raised baseline indicates strong overall absorption from the carbon
layer. With increasing RIE processing time, the peak position shifts to the blue as
expected for a decreasing carbon film thickness, before a slight red shift when ablation of
the UNSL sample sets in. This peak position shift to the blue and eventually to the red is
seen for Au/SiO2 and Ag/SiO2 (Figure 3.3c), but while the minimum in the blue shift
with etching time is very flat and broad for gold, it is much narrower for silver, indicating
that silver is oxidized.
Figures 3.3d-h show AFM topographic images of the UNSL surface at three
stages of the etching process: with the carbon layer (Figure 3.3d), with the carbon layer
removed and the pattern intact, and with overetching for the Ag/SiO2 (Figures 3.3e-f) and
the Au/SiO2 (Figure 3.3g-h) samples. After template removal, but before RIE, the carbon
layer is smooth with the occasional hole, suggesting that the rupture during the stripping
procedure is mostly along the carbon-glass interface. Exposure of the sample to 270 s of
O2 RIE creates a surface with the gold nanopattern having a topography of about 1 nm
height. The overall roughness of the Au/SiO2 UNSL sample is 0.76 nm root-mean-square
(rms) over 2 µm2, and 1.0 nm over 20 µm2. After 330 s of RIE the overetching increases
the roughness to 3.2 nm rms over 2 µm2, possibly due to the preferential ablation of the
SiO2. Although an increase in roughness is seen at long etching times, the AFM results
confirm the UV-Vis results that Au/SiO2 UNSL is relatively insensitive to overetching.
In contrast the Ag/SiO2 UNSL surface is not quite as smooth as the Au/SiO2
surface after 150 s. A 2 nm topography is associated with the nanopattern, corresponding
to a roughness of 1.1 nm rms over 2 µm2. The 2 nm topography can be explained by the
oxidation of silver, which has been shown to increase the volume of silver particles [39].
46
Longer etching times again lead to overetching and to the partial or total removal of the
silver nanoparticles, and the formation of holes in the surface of the sample.
The carbon-based UNSL procedure yields ultraflat nanocomposite surfaces
containing one nanopatterned material embedded in a second material with a free choice
of materials as long as both materials can be bonded well enough to survive the lift-off of
the template. Surfaces are created without template residues over the size of a typical
cover slip. The etching process allows for the complete removal of the carbon from the
template, and etch conditions can be adjusted to achieve a window of processing times
that preserves the ultraflatness across the two materials. This window becomes very
narrow if one of the materials easily oxidizes. Modifications in the final processing that
could address this problem are changing the processing gas from oxygen to a purely
ablative etching, or replacing the dry etch process with a wet etch of a thin sacrificial
film. While we have not explored ablation so far, experiments with thin photoresist films
showed that it can be difficult to achieve the very hydrophilic surfaces needed to achieve
good nanosphere deposition. Photoresist films are also much thicker, which leads to
reduced surface flatness. Other sacrificial layers that can be etched selectively, such as a
thin metal film, are possible, as long as the epoxy is stable during the wet etch procedure.
While nontransparent UNSL combinations can use extremely stable adhesives, optically
transparent epoxies, needed for microscopic or spectroscopic applications, are less
chemically resistant.
47

Figure 3.3: Characterization of dry etching step (a) Optical density of a glass slide coated with 8 nm carbon thickness as a function of etch time for different RIE powers. (b) SPR extinction spectra for different O2 RIE times to remove the carbon layer on top of the UNSL sample: The SPR absorption peak shifts to the blue initially with the decreasing carbon thickness, i.e. increasing etch times, then between 120 s and 270 s there is no change, indicating that the carbon layer is completely removed, before finally the peak shifts red at 330 s indicating a slight etching of the gold areas. (c) SPR peak position as a function of etching time for Ag (squares, right axis) and Au (triangles, left axis). Representative AFM images of a carbon-coated UNSL surface (d), of a Ag-SiO2 UNSL at 150 s (e), and 240 s (f) etch times, and of a Au-SiO2 UNSL at 150 s (g), 270 s (h) etch times.
48

3.3.2 Selective functionalization of the nanopattern
Site-selective and chemoselective immobilization of proteins to functionalize
solid surfaces and position target molecules are of interest for instance in proteomics
research [40-43]. For the purpose of a sensor, chemical functionalization of an affinity
ligand or other capture mechanism is required. Array type sensors should also define
areas that represent a single element in the array and prevent lateral spreading and
contamination during the spotting process. In addition, the smooth and flat surface of a
solid substrate is very useful for selective protein immobilization for the purpose of easier
image scanning and compatibility with standard instrumentation in proteomics.
Suggestions for the potential usages of flat surface which can be used for site-selective
surface functionalization and surface characterization was reported [18, 22, 28, 33].
In this thesis, we functionalize gold UNSL samples with thiols to selectively
target the gold nanopattern and provide functionality. In this chapter we only show proof-
of-principle that thiols selectively attach to the gold MNPs, and that the functionalization
reaches a densely-packed self-assembled monolayer (SAM) of the expected 2 nm
thickness. UNSL samples are stable in 3 mM ethanolic thiol solution for at least 48 h.
The functionalization can be followed spectroscopically by UV-Vis spectroscopy and the
adsorbate can be imaged with AFM. The ultraflatness of the sample allows us to directly
image by AFM the change in height due to the functionalization (Figures 3.4a-b). In the
low-topography state (Figure 3.4.a), we assigned the triangular Au areas of 1-2 nm height
as no.(1)-(5) and no.(6) is assigned to the SiO2 layer. The distance between no.(2) and
no.(3) is approximately 400 nm which corresponds to the nanosphere size. Since
hexadecanethiol (HDT) selectively binds to only gold nanopatterns, the surface
topography after HDT modification is well defined as 4 nm associated with the
nanopattern-HDT areas. The observed increase of 2 nm matches the expected height of a
49

densely packed monolayer of HDT. Additionally, the result shows that the final surface is
no longer coated with carbon, and the thiol can bind selectively to the gold areas. The
nanopattern of an Au/SiO2 surface can also be selectively functionalized into micron-
sized groups of thiolated nanopatterns by microcontact printing using a standard PDMS
stamp. Again the thiol height is about 2 nm on the stamped areas (not shown), as long as
the inking solution concentration is strongly reduced to 0.1 mM or less, and the sample is
vigorously rinsed immediately after stamping in warm ethanol to remove thiols from the
glass areas. Such visualization of the topography of thiol monolayers is impossible
without ultraflat surfaces [18].
(a) (b) (c)
Figure 3.4: AFM images of the ultraflat nanopatterned surface before (a) and after (b) chemical modification of the gold patterned surface with HDT for 8 h. (a) no.(1)-no. (5) are assigned to Au-MNP, no.(6) is assigned to SiO2 layer. The maximum height between no.(4) and no.(6) is about 2 nm before chemical modification. (b) The height is about 4 nm after functionalization. Height profiles are taken along the line in the respective images. (c) UV-Vis spectrum of a Au/SiO2 UNSL surface in ethanol showing the gold nanoparticle LSPR peak shifting to the red by 2 nm after 3 h and by 25 nm after 8 h.
50
The chemical modification of the nanoislands is also confirmed by UV-Vis
absorption spectroscopy. A peak shift to the red is expected for a change in refractive
index from ethanol to a monolayer of thiol, which has a higher refractive index. Peak
shifts of 2 nm and 25 nm to the red are observed as the incubation time with HDT is
increased from 0 hours to 3 h and 8 h, respectively (Figure 3.4 c). It is interesting to
note that the shift in the extinction peak is typical for a thiol adsorption and relatively
small. This indicates that the technique is capable of preserving the anisotropic shape of
the metal nanoparticles, in contrast to simple nanosphere lithography (NSL), which
requires annealing the nanoparticles in methanol, leads to rounding of the corners, and
to an associated large peak shift [3]. The spectroscopic measurements, showing a clearly
distinguishable LSPR peak, also demonstrate the power of the new UNSL technique for
creating functional elements, such as a SPR nanoparticle nanosensors, electrodes, or
protein binding sites without any associated topography. This new technique preserves
optically transparent materials, by embedding the functional components into the glass
surface and by making use of the flexibility of the technique in choosing materials.
3.4 CONCLUSIONS
The introduction of a carbon low-adhesion layer together with an “unbreakable”
template sandwich structure has allowed us to significantly improve the UNSL procedure
by removing the template completely and reproducibly and creating nanopatterned
surfaces that are ultraflat over cm2 areas. We have shown here only gold and silver
composites with SiO2, but many other material combinations can be envisioned. The
ultraflatness allows for a thiol layer of 2 nm to be visualized for site-selective
functionalization. The transparent nature of the UNSL samples demonstrated here can be
used to perform SPR spectroscopy, which we have used to observe the processing steps.
It also allows for the use of these particles as more sensitive SPR sensors that do not 51

require annealing, as we have been able to better preserve the triangular shape of the
metal nanoparticles, unlike in NSL SPR sensors where the shape changes [44]. The
ultraflat gold nanocomposite enables us experimentally to investigate the near field
enhancement at the well-preserved sharp particle features. The bulk and local refractive
index sensitivity is covered in chapter 4 and chapter 5. The template stripping technique
demonstrated here could also be generalized to include prefabricated nanomaterials that
can be embedded into a similarly template-stripped surface and so made to be topography
free.
3.5 REFERENCES 1. Jensen, T., L. Kelly, A. Lazarides, and G.C. Schatz, Electrodynamics of noble
metal nanoparticles and nanoparticle clusters. Journal of Cluster Science, 1999. 10: p. 295-317.
2. Mock, J.J., M. Barbic, D.R. Smith, D.A. Schultz, and S.Schultz, Shape effects in plasmon resonance of individual colloidal silver nanoparticles. Journal of Chemical Physics, 2002. 116: p. 6755-6759.
3. Haes, A.J., S.L. Zou, G.C. Schatz, and R.P. Van Duyne, Nanoscale optical biosensor: Short range distance dependence of the localized surface plasmon resonance of noble metal nanoparticles. Journal of Physical Chemistry B, 2004. 108(22): p. 6961-6968.
4. Haes, A.J. and R.P. Van Duyne, A Nanoscale Optical Biosensor: Sensitivity and Selectivity of an Approach Based on the Localized Surface Plasmon Resonance Spectroscopy of Triangular Silver Nanoparticles. J. Am. Chem. Soc., 2002. 124: p. 10596-10604.
5. Sherry, L.J., R.C. Jin, C.A. Mirkin, G.C. Schatz, and R.P. Van Duyne, Localized surface plasmon resonance spectroscopy of single silver triangular nanoprisms. Nano Letters, 2006. 6(9): p. 2060-2065.
6. Frey, W., C.K. Woods, and A. Chilkoti, Ultraflat nanosphere lithography: A new method to fabricate flat nanostructures. Advanced Materials, 2000. 12(20): p. 1515-1519.
7. Weisenhorn, A.L., M. Egger, F. Ohnesorge, S.A.C. Gould, S.P. Heyn, H.G. Hansma, R.L. Sinsheimer, H.E. Gaub, and P.K. Hansma, Molecular-resolution images of langmuir-blodgett-films and dna by atomic force microscopy. Langmuir, 1991. 7(1): p. 8-12.
8. Tracz, A., G. Wegner, and J.P. Rabe, Kinetics of surface roughening via pit growth during the oxidation of the basal-plane of graphite .1. Experiments. Langmuir, 1993. 9(11): p. 3033-3038.
9. Bergkvist, M., J. Carlsson, and S. Oscarsson, Surface-dependent conformations of human plasma fibronectin adsorbed to silica, mica, and hydrophobic surfaces,
52
studied with use of Atomic Force Microscopy. Journal of Biomedical Materials Research Part A, 2003. 64A(2): p. 349-356.
10. Amrein, M., A. Stasiak, H. Gross, E. Stoll, and G. Travaglini, Scanning tunneling microscopy of RECA-DNA complexes coated with a conducting film. Science, 1988. 240(4851): p. 514-516.
11. Amrein, M., R. Durr, A. Stasiak, H. Gross, and G. Travaglini, Scanning tunneling microscopy of uncoated RECA-DNA complexes. Science, 1989. 243(4899): p. 1708-1711.
12. Noah, J.W., S. Park, J.T. Whitt, J. Perutka, W. Frey, and A.M. Lambowitz, Atomic force microscopy reveals DNA bending during group II intron ribonucleoprotein particle integration into double-stranded DNA. Biochemistry, 2006. 45(41): p. 12424-12435.
13. Chai, L. and J. Klein, Large Area, Molecularly Smooth (0.2 nm rms) Gold Films for Surface Forces and Other Studies. Langmuir, 2007. ASAP.
14. Chidsey, C.E.D., D.N. Loiacono, T. Sleator, and S. Nakahara, STM study of the surface-morphology of gold on mica. Surface Science, 1988. 200(1): p. 45-66.
15. Clemmer, C.R. and T.P. Beebe, A review of graphite and gold surface studies for use as substrates in biological scanning tunneling microscopy studies. Scanning Microscopy, 1992. 6(2): p. 319-333.
16. Putnam, A., B.L. Blackford, M.H. Jericho, and M.O. Watanabe, Surface-topography study of gold deposited on mica using scanning tunneling microscopy - effect of mica temperature. Surface Science, 1989. 217(1-2): p. 276-288.
17. Woodard, N.G. and G.P. Lafyatis, Fabrication and characterization of extremely smooth large area gold surfaces. Journal of Vacuum Science & Technology a-Vacuum Surfaces and Films, 1996. 14(2): p. 332-335.
18. Stamou, D., D. Gourdon, M. Liley, N.A. Burnham, A. Kulik, H. Vogel, and C. Duschl, Uniformly flat gold surfaces: Imaging the domain structure of organic monolayers using scanning force microscopy. Langmuir, 1997. 13(9): p. 2425-2428.
19. Priest, C.I., K. Jacobs, and J. Ralston, Novel approach to the formation of smooth gold surfaces. Langmuir, 2002. 18(6): p. 2438-2440.
20. Huang, Y.W. and V.K. Gupta, Effects of physical heterogeneity on the adsorption of poly(ethylene oxide) at a solid-liquid interface. Macromolecules, 2001. 34(11): p. 3757-3764.
21. Hegner, M., P. Wagner, and G. Semenza, Ultralarge atomically flat template-stripped au surfaces for scanning probe microscopy. Surface Science, 1993. 291(1-2): p. 39-46.
22. Wagner, P., M. Hegner, H.J. Guntherodt, and G. Semenza, Formation and in-situ modification of monolayers chemisorbed on ultraflat template-stripped gold surfaces. Langmuir, 1995. 11(10): p. 3867-3875.
23. Ederth, T., Template-stripped gold surfaces with 0.4-nm rms roughness suitable for force measurements: Application to the Casimir force in the 20-100-nm range. Physical Review A, 2000. 6206(6): p. 8.
24. Blackstock, J.J., Z.Y. Li, and G.Y. Jung, Template stripping using cold welding. Journal of Vacuum Science & Technology A, 2004. 22(3): p. 602-605.
53

25. Gupta, P., K. Loos, A. Korniakov, C. Spagnoli, M. Cowman, and A. Ulman, Facile route to ultraflat SAM-protected gold surfaces by "amphiphile splitting". Angewandte Chemie-International Edition, 2004. 43(4): p. 520-523.
26. Lussem, B., S. Karthauser, H. Haselier, and R. Waser, The origin of faceting of ultraflat gold films epitaxially grown on mica. Applied Surface Science, 2005. 249(1-4): p. 197-202.
27. Mosley, D.W., B.Y. Chow, and J.A. Jacobson, Solid-state bonding technique for template-stripped ultraflat gold substrates. Langmuir, 2006. 22(6): p. 2437-2440.
28. Cacciafesta, P., A.D.L. Humphris, K.D. Jandt, and M.J. Miles, Human plasma fibrinogen adsorption on ultraflat titanium oxide surfaces studied with atomic force microscopy. Langmuir, 2000. 16(21): p. 8167-8175.
29. Rossetti, F.F., I. Reviakine, and M. Textor, Characterization of titanium oxide films prepared by the template-stripping method. Langmuir, 2003. 19(24): p. 10116-10123.
30. Blackstock, J.J., Z.Y. Li, M.R. Freeman, and D.R. Stewart, Ultra-flat platinum surfaces from template-stripping of sputter deposited films. Surface Science, 2003. 546(2-3): p. 87-96.
31. Ohlberg, D., J.J. Blackstock, R. Ragan, S. Kim, and R.S. Williams, Optimization of in-vacuo template-stripped Pt surfaces via UHVSTM. Applied Physics a-Materials Science & Processing, 2005. 80(6): p. 1327-1334.
32. Palmer, R.E., B.J. Eves, F. Festy, and K. Svensson, Scanning probe energy loss spectroscopy. Surface Science, 2002. 502: p. 224-231.
33. Wright, J.P., O. Worsfold, C. Whitehouse, and M. Himmelhaus, Ultraflat ternary nanopatterns fabricated using colloidal lithography. Advanced Materials, 2006. 18(4): p. 421-+.
34. Naumann, R., S.M. Schiller, F. Giess, B. Grohe, K.B. Hartman, I. Karcher, I. Koper, J. Lubben, K. Vasilev, and W. Knoll, Tethered lipid Bilayers on ultraflat gold surfaces. Langmuir, 2003. 19(13): p. 5435-5443.
35. Zheng, J., L.Y. Li, H.K. Tsao, Y.J. Sheng, S.F. Chen, and S.Y. Jiang, Strong repulsive forces between protein and oligo (ethylene glycol) self-assembled monolayers: A molecular simulation study. Biophysical Journal, 2005. 89(1): p. 158-166.
36. Yadavalli, V.K., J.G. Forbes, and K. Wang, Functionalized self-assembled monolayers on ultraflat gold as platforms for single molecule force spectroscopy and imaging. Langmuir, 2006. 22(16): p. 6969-6976.
37. Zhou, D.J., X.Z. Wang, L. Birch, T. Rayment, and C. Abell, AFM study on protein immobilization on charged surfaces at the nanoscale: Toward the fabrication of three-dimensional protein nanostructures. Langmuir, 2003. 19(25): p. 10557-10562.
38. Glasmastar, K., J. Gold, A.S. Andersson, D.S. Sutherland, and B. Kasemo, Silicone transfer during microcontact printing. Langmuir, 2003. 19(13): p. 5475-5483.
39. Zeng, Y.X., L.H. Chen, Y.L. Zou, P.A. Nguyen, J.D. Hansen, and T.L. Alford, Processing and encapsulation of silver patterns by using reactive ion etch and ammonia anneal. Materials Chemistry and Physics, 2000. 66(1): p. 77-82.
54
40. Niemeyer, C.M., B. Ceyhan, S. Gao, L. Chi, S. Peschel, and U. Simon, Site-selective immobilization of gold nanoparticles functionalized with DNA oligomers. Colloid and Polymer Science, 2001. 279(1): p. 68-72.
41. Watzke, A., M. Kohn, M. Gutierrez-Rodriguez, R. Wacker, H. Schroder, R. Breinbauer, J. Kuhlmann, K. Alexandrov, C.M. Niemeyer, R.S. Goody, and H. Waldmann, Site-selective protein immobilization by Staudinger ligation. Angewandte Chemie-International Edition, 2006. 45(9): p. 1408-1412.
42. Phizicky, E., P.I.H. Bastiaens, H. Zhu, M. Snyder, and S. Fields, Protein analysis on a proteomic scale. Nature, 2003. 422(6928): p. 208-215.
43. MacBeath, G. and S.L. Schreiber, Printing proteins as microarrays for high-throughput function determination. Science, 2000. 289(5485): p. 1760-1763.
44. Haes, A.J. and R.P. Van Duyne, Preliminary studies and potential applications of localized surface plasmon resonance spectroscopy in medical diagnostics. Expert Review of Molecular Diagnostics, 2004. 4(4): p. 527-537.
55
Chapter 4: Plasmonic optical sensor: Sensitivity of the bulk and local refractive index change and geometrical influences
4.1 INTRODUCTION
Noble metal nanoparticles (MNPs) have received great attention as bleach-
resistant scattering labels, surface-enhanced raman scatterers, and potential nanoscale
label-free optical biosensors [1-11]. Materials such as silver and gold have unique optical
properties due to characteristic resonances, localized surface plasmon resonances
(LSPRs) that lead to extinction bands in the visible range of the electromagnetic
spectrum. These resonance extinctions are dependent strongly on the size, shape, and
interparticle spacing; they depend also on the dielectric constant of the environment [2-4,
6, 11-14]. Therefore LSPR can be used to detect changes in the immediate vicinity of the
MNPs by measuring the shift in the resonance position of the absorption spectrum.
Because each MNP is its own sensor, very small amounts of protein are needed to induce
a spectral change. Such sensing capability, although not as sensitive as phase-based
detection schemes, is ideally suited for label-free detection in cases where often only
small amounts of ligand are available such as in proteomics [3, 15, 16].
Spherical MNPs have been used as LSPR sensors successfully [17, 18]. However,
non-spherical MNPs have higher sensitivity to changes in the environment [16, 19, 20].
Much work has been done on triangular-shaped MNPs, which are fabricated by
nanosphere lithography (NSL)[1, 13]. It has been shown that such NSL-based LSPR
sensors can achieve zeptomole sensitivity [10], and they have been used in applications
such as detection of Alzheimer's disease [21]. However, stabilizing the sharp features in
non-spherical MNPs is not trivial, and the changes in shape lead to large variations in the
56

resonance position. Chemical functionalization rounds the sharp features, which strongly
shifts the resonance and significantly reduces the sensitivity [15].
As we have shown in the previous chapter, ultraflat nanosphere lithography
(UNSL) can preserve sharp features by embedding MNPs into a surface of another
material such as glass [22]. In this chapter we demonstrate an optimized UNSL-LSPR
sensor, which has increased sensitivity over a gold NSL-LSPR sensor for bulk changes,
and similar or better sensitivity to Ag NSL-LSPR sensors for modification at the surface.
4.2 EXPERIMENTAL METHODS
Materials: Polystyrene nanospheres of 500 nm, 400 nm, and 300 nm diameter
were purchased from Interfacial Dynamics Corporation (Portland, OR). De-ionized water
with a resistivity of at least 18.0 MΩ cm was used. Methanol and ethanol (Fisher
Scientific, Houston, TX), and 1-Hexadecanethiol (Aldrich, Milwaukee, WI) were used as
purchased. Optically transparent, low-viscosity epoxy, Epo-Tek #302-3M (Epoxy
Technology Inc., Billerica, MA) or 20-3068 (Epoxies, Etc, Cranston, RI) was used for all
bonding of surfaces. Plain microscope slides (1 mm thick , 2.2 x 4.4 cm2) (Erie Scientific,
Portsmouth, NH), cover slips (0.13-0.16 mm thick, 2.2 x 2.2 cm2) and PVC slides (1 mm,
2.5x2.5 cm2) (all VWR) were used for substrates and templates. Tungsten vapor
deposition boats and carbon crucibles and silicon dioxide (SiO2) were purchased from
Kurt J. Lesker Company (Clairton, PA). Silver (99.99%, 1-3 mm diameter) and gold
(99.99%, 6.35 mm) were purchased from Alfa-Aesar (Ward Hill, MA), and carbon rods
were purchased from Ted Pella Inc. (Redding, CA). Biotin-PEG-disulfide (Polypure,
Oslo, Norway), Streptavidin (Sigma-Aldrich, St. Louis, MO).
Carbon-based UNSL gold MNPs preparation: To fabricate gold UNSL
MNPs with preserved corners, the carbon-based template stripping method which is
described in chapter 3 in detail was used. This technique allows us to make optically 57
transparent non-spherical gold MNPs partially embedded into an ultraflat surface of
glass.
Conventional UNSL silver MNPs preparation: UNSL-fabricated silver
MNPs were made by the conventional UNSL method [22] to avoid a silver oxide layer
during the oxygen plasma etching processing step, as described in chapter 3.
Sample characterization: Samples were characterized by AFM (Asylum
Research MFP 3D, Santa Barbara, CA) in contact mode under ambient conditions at scan
speeds of 10-80 µm/s using silicon nitride probes (NP-20, Veeco Metrology, Santa
Barbara, CA). For height characterization and rms, the surface was measured over a
2x2 µm2 area at scan speeds in the range of 1.5-4 µm/s. Ultraviolet–visible (UV-Vis)
extinction spectra, measured in a Cary 5E UV-Vis-IR spectrophotometer (Varian), were
used to follow the changes in the coating of the gold or silver particles.
Hexadecanethiol functionalization: After oxygen plasma dry etching to remove
carbon from Au/SiO2 UNSL surfaces, Au/SiO2 UNSL samples were incubated in a 3 mM
ethanolic solution of hexadecanethiol (HDT) (Aldrich) for up to 48 hours or as specified.
Samples were rinsed in ethanol and dried under a stream of nitrogen.
Biotin-Streptavidin functionalization: After oxygen plasma dry etching gold
UNSL samples were incubated in 1 mM ethanolic solution of Biotin-PEG-disulfide
(MW:1539.9, Polypure) for two days. After incubating the gold MNPs with thiols, the
samples were carefully rinsed in ethanol and dried under a stream of N2 gas. Biotinylated
gold samples were incubated in a 100 nM streptavidin solution in pH 7.5 20 mM
phosphate buffered saline (PBS) for 3 hours. After the incubation, the streptavidin-biotin
gold UNSL sample was rinsed in PBS buffer twice and extinction spectra were collected
in PBS. Samples were rinsed afterwards in D.I. water twice, and completely dried under a
stream of N2 gas and UV-Vis spectra were re-measured in air.
58

4.3 RESULTS AND DISCUSSION
4.3.1 The bulk plasma and LSPR Absorption Spectroscopy
Before exploring localized surface plasmon resonances, it is good to understand
the fundamental optical response of silver and gold. Silver and gold are very similar in
not only lattice structure and lattice constants, but also the effective mass of the
conduction electrons and density [2]. The major difference between silver and gold is the
interband electron contribution in gold in the visible wavelength range, which induces the
different optical properties of these noble metals. Silver and gold have about the same
bulk plasmon frequency eff
p mde
0
2
εω =
effm
, which depends only on the free electron density,
, and the effective mass, , and therefore have the same associated plasma
wavelength λp ≈ 138 nm that determines the general frequency-dependent response of a
metal to an electomagnetic field. Metals become almost transparent above the bulk
plasma frequency range due to the inability of the free conduction electrons to follow the
external electric field. The interband transition explains the natural colors of silver and
gold. This is also experimentally shown in Figure 4.1.1. Silver and gold films of 60 nm
thickness were prepared on a quartz slide, and the reflection and the absorption for these
noble metal thin films were measured with reflection and transmission UV-Vis
spectrometry. The onset of interband transitions for gold and silver can be seen as a
transition from reflective to absorptive behavior and as a peak of the transmission. Silver
is a metallic mirror due to reflecting almost all visible wavelengths above 400 nm. The
reflectivity is greatly reduced at around 320 nm. Gold is yellowish red due to reflecting
visible wavelengths above 600 nm and the reflectivity is significantly reduced at around
500 nm wavelength because of the interband transitions at 468 nm [23].
d
59

120
100
80
60
40
20
Ref
lect
ivity
%
900800700600500400Wavelength [nm]
Ag 60 nm layer Au 60 nm layer
Figure 4.1.1: Reflectivity spectra for silver and gold thin films of 60 nm. A silver film reflects almost every visible wavelength above 400 nm. The reflectivity from the silver film is significantly reduced at 320 nm wavelength. The gold film reflects wavelengths above 600 nm, and the reflectivity is significantly reduced at 500 nm wavelength.
2.0
1.5
1.0
0.5
Abs
orpt
ion
[arb
it.u.
]
900800700600500400300Wavelength [nm]
Au 60 nm Ag 60 nm
Figure 4.1.2: Absorption spectrum in transmission of silver and gold thin films of 60 nm thickness. The absorption of the silver film and the gold film are significantly reduced at 322 nm and 502 nm wavelength, respectively, due to the respective interband transitions.
60
While the absorption of a metal film is widely spread for wavelengths below the
interband transition (Figure 4.1.2), the absorption of a non-spherical MNP exists only at a
certain wavelength range with an extinction peak, λmax,SP, due to the localized surface
plasmon resonance (Figure 4.1.3). Within the Drude approximation for a “free electron
gas” of a metal, which applies well to Au and Ag at wavelengths larger than the interband
transition, the LSPR wavelength for a small sphere can be expressed as [24]:
)2(22mppeak εελλ += ∞ (4.1.1.)
with λpeak the peak position of the LSPR, λp the bulk plasma wavelength (138 nm), ε∞ the
high frequency value of the dielectric constant of the metal (Ag ≈ 4.9, Au ≈ 13.2)
contains all the interband transitions and εm the surrounding medium dielectric constant.
Accordingly, the calculated LSPR peak for a sphere in air is at about 362 nm for Ag, and
538 nm for Au, which is relatively close to the real values. The sensitivity of the peak
shift due to changes in the dielectric constant of the environment in this approximation is
S =
∂λpeak∂εm
= λp
ε∞ + 2εm
(4.1.2)
which is higher for Ag than for Au due to the smaller infinity value of the dielectric
constant.
This estimate does not apply for larger MNPs, as already larger spheres lead to
higher sensitivity, and especially not to larger non-spherical particles. However, the
sensitivity of the localized surface plasmon resonance for nanorods, can be shown to
follow the empirical relation [25]
Rdn
dP
S
SP λλ
∝max, (4.1.3)
where λmax,SP is the extinction peak wavelength of the localized surface plasmon, is
the refractive index of the surrounding medium, and
Sn
R is the aspect ratio
(length/diameter) of the nanorod. The sensitivity of the surface plasmon peak position to
61

the refractive index change is, even for complicated particles, still determined by the bulk
plasma wavelength and the MNP geometry. The higher sensitivity of Ag compared with
Au for spherical shapes could also be expected to hold for more complex shapes.
However, the quasi-static bulk sensitivity can be linearized [20]:
+=
mndnd x
SPSS
SP ελ
λmax
max 2 (4.1.4)
where the real part of the dielectric constant, realε , at frequencies below the interband
transitions was linearized to:
λεε mxreal += (4.1.5)
Thus, the quasi-static bulk sensitivity is dependent on the real part of the gold or silver
permittivity. Therefore the sensitivity is determined by the peak wavelength, and the
slope , and the intercept of the dispersion m xε . Using Johnson and Christy data fits in
the optical range below the interband transition gives
εxAg: 18.9, mAg: – 0.058, εxAg / mAg = -326;
and
εxAu: 36.5, mAu: – 0.076, εxAu / mAu = -480.
Given that the position of the peak for gold is also further to the red, a higher sensitivity
of gold MNPs to the bulk environmental refractive index is expected.
The non-spherical MNPs of an UNSL sample show a resonance absorption peak
at a specific wavelength λmax,SP. The spectra in Figure 4.1.3 show the particle-plasmon
resonances of 30 nm thick and 93.2 nm long gold and silver UNSL MNPs with
resonances at 794 nm and 508 nm, respectively. The peak positions of the particle
resonances of the gold and silver particles are red shifted relative to those of the spherical
particles, which is consistent with other reports [2]. This shift is larger for gold MNPs
(~300 nm) than for silver MNPs (~100 nm).
62
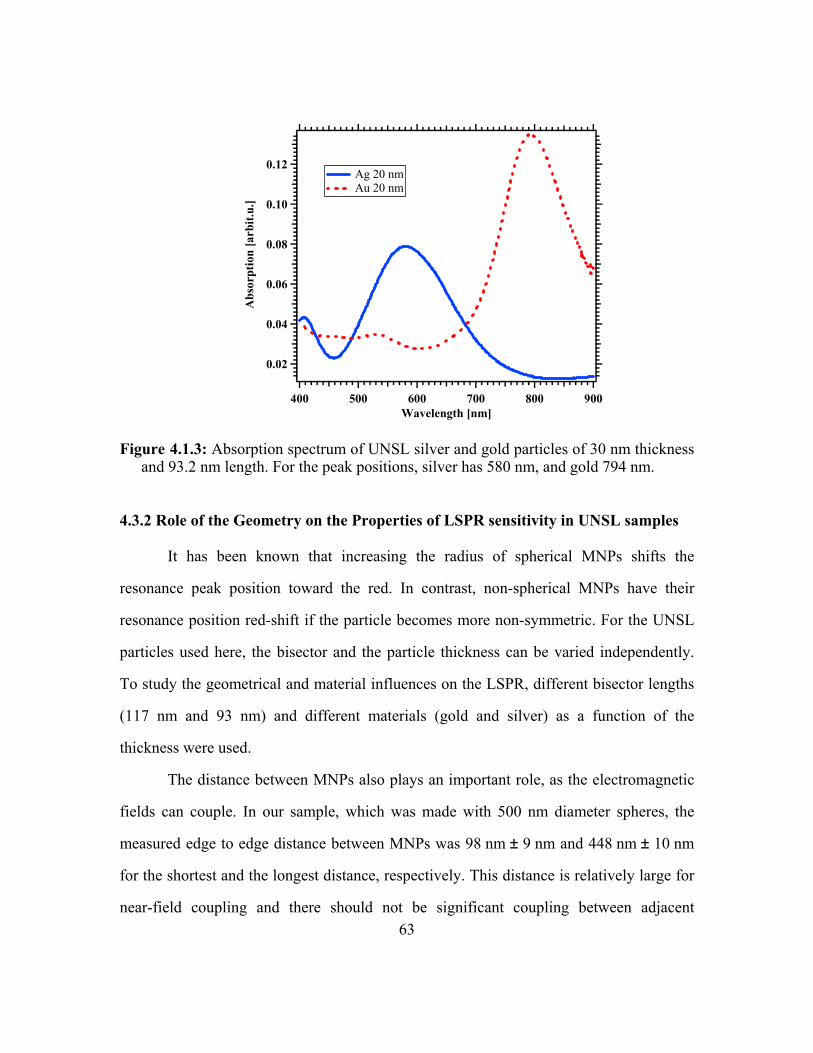
0.12
0.10
0.08
0.06
0.04
0.02
Abs
orpt
ion
[arb
it.u.
]
900800700600500400Wavelength [nm]
Ag 20 nm Au 20 nm
Figure 4.1.3: Absorption spectrum of UNSL silver and gold particles of 30 nm thickness and 93.2 nm length. For the peak positions, silver has 580 nm, and gold 794 nm.
4.3.2 Role of the Geometry on the Properties of LSPR sensitivity in UNSL samples
It has been known that increasing the radius of spherical MNPs shifts the
resonance peak position toward the red. In contrast, non-spherical MNPs have their
resonance position red-shift if the particle becomes more non-symmetric. For the UNSL
particles used here, the bisector and the particle thickness can be varied independently.
To study the geometrical and material influences on the LSPR, different bisector lengths
(117 nm and 93 nm) and different materials (gold and silver) as a function of the
thickness were used.
The distance between MNPs also plays an important role, as the electromagnetic
fields can couple. In our sample, which was made with 500 nm diameter spheres, the
measured edge to edge distance between MNPs was 98 nm ± 9 nm and 448 nm ± 10 nm
for the shortest and the longest distance, respectively. This distance is relatively large for
near-field coupling and there should not be significant coupling between adjacent 63

particles [15, 33]. The long-range positional order is also probably not good enough to
create far-field interference that would result in peak sharpening or broadening in the
absorption spectrum [34].
As the thickness is reduced in both gold and silver type UNSL particles, the
maximum peak position shifts to the red (Figure 4.2.1), which is consistent with the
characteristics of conventional NSL MNPs [1]. When the bisector of gold MNPs is
increased, the extinction peak position of the resonance is further red-shifted. DDA
calculations have predicted that increasing the bisector of the triangular pyramids and
decreasing its thickness shifts the resonance peak position to the red [12]. It is also found
that gold shows larger red shifts of the resonance peak than silver for all thicknesses. This
similar trend is also found in nanorods with high aspect ratio [25].
1100
1000
900
800
700
600
500
Wav
elen
gth
[nm
]
80706050403020Thickness [nm]
lines to guide the eye only
Au 117 nm in air
Au 93 nm in air
Au 93 nm in water
Ag 93 nm in airAg 93 nm in water
Au 117 nm in water
Figure 4.2.1: Position of the LSPR resonance as a function of MNP thickness for different bisector lengths in air and water as labeled for Ag and Au. As the particle thickness decreases, the sensitivity to the environmental changes increases in the two different gold particle bisector sizes. Below 30 nm thickness in gold particles, the sensitivity increases non-linearly. However, silver UNSL MNPs samples have no significant sensitivity changes over the whole thickness range.
64

4.3.3 The bulk refractive index sensitivity of LSPR in UNSL samples
As the bulk refractive index surrounding the MNPs is increased, the peak position
is red shifted. Figure 4.3.1 shows an example of gold MNPs that are 20 nm thick and
117 nm long. Changing the bulk refractive index from air (n = 1), to water (n = 1.33),
ethanol (n = 1.36), and oil (n = 1.52) shifts the resonance peak wavelength from 902 nm
(in air), to 961 nm (in water), 971 nm (in ethanol), and 1011 nm (in oil), and the total red
shift from air to oil is 109 nm. In comparison, one of the most sensitive, non-spherical
silver MNPs produced with conventional NSL shows a 90 nm red shift from air to
Pyridine solution (n = 1.5) [26]. This corresponds to a sensitivity of 1 nm peak change
per 0.00555 refractive index unit (RIU) change, (180 nm/RIU for the silver NSL MNPs)
compared to 1 nm per 0.00495 RIU, (202 nm/RIU for the gold UNSL MNPs).
0.12
0.10
0.08
0.06
0.04
Abs
orpt
ion
[arb
it. u
.]
120011001000900800700Wavelength [nm]
1 RIU 1.33 RIU 1.36 RIU 1.52 RIU
(a)(b)
(d)(c)
(a)
(b)
(c)
(d)
Figure 4.3.1: Peak shifts in the absorption spectrum for gold UNSL MNPs. As the bulk refractive index at the gold UNSL MNPs is increased from (a) air (n = 1), to (b) water (n = 1.33), (c) ethanol (n = 1.36), and (d) oil (n = 1.52), the resonance peak positions are also red-shifted from 902 nm (in air), to 961 nm (in water), 971 nm (in ethanol), and 1011 nm (in oil).
65
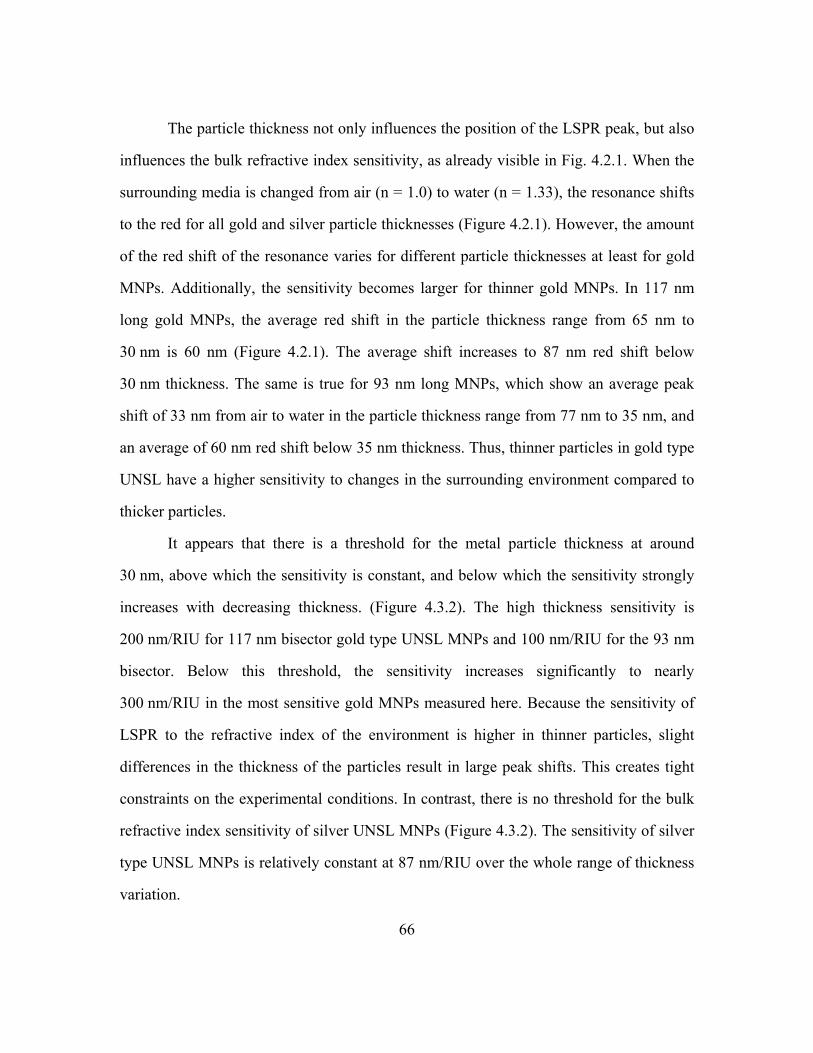
The particle thickness not only influences the position of the LSPR peak, but also
influences the bulk refractive index sensitivity, as already visible in Fig. 4.2.1. When the
surrounding media is changed from air (n = 1.0) to water (n = 1.33), the resonance shifts
to the red for all gold and silver particle thicknesses (Figure 4.2.1). However, the amount
of the red shift of the resonance varies for different particle thicknesses at least for gold
MNPs. Additionally, the sensitivity becomes larger for thinner gold MNPs. In 117 nm
long gold MNPs, the average red shift in the particle thickness range from 65 nm to
30 nm is 60 nm (Figure 4.2.1). The average shift increases to 87 nm red shift below
30 nm thickness. The same is true for 93 nm long MNPs, which show an average peak
shift of 33 nm from air to water in the particle thickness range from 77 nm to 35 nm, and
an average of 60 nm red shift below 35 nm thickness. Thus, thinner particles in gold type
UNSL have a higher sensitivity to changes in the surrounding environment compared to
thicker particles.
It appears that there is a threshold for the metal particle thickness at around
30 nm, above which the sensitivity is constant, and below which the sensitivity strongly
increases with decreasing thickness. (Figure 4.3.2). The high thickness sensitivity is
200 nm/RIU for 117 nm bisector gold type UNSL MNPs and 100 nm/RIU for the 93 nm
bisector. Below this threshold, the sensitivity increases significantly to nearly
300 nm/RIU in the most sensitive gold MNPs measured here. Because the sensitivity of
LSPR to the refractive index of the environment is higher in thinner particles, slight
differences in the thickness of the particles result in large peak shifts. This creates tight
constraints on the experimental conditions. In contrast, there is no threshold for the bulk
refractive index sensitivity of silver UNSL MNPs (Figure 4.3.2). The sensitivity of silver
type UNSL MNPs is relatively constant at 87 nm/RIU over the whole range of thickness
variation.
66
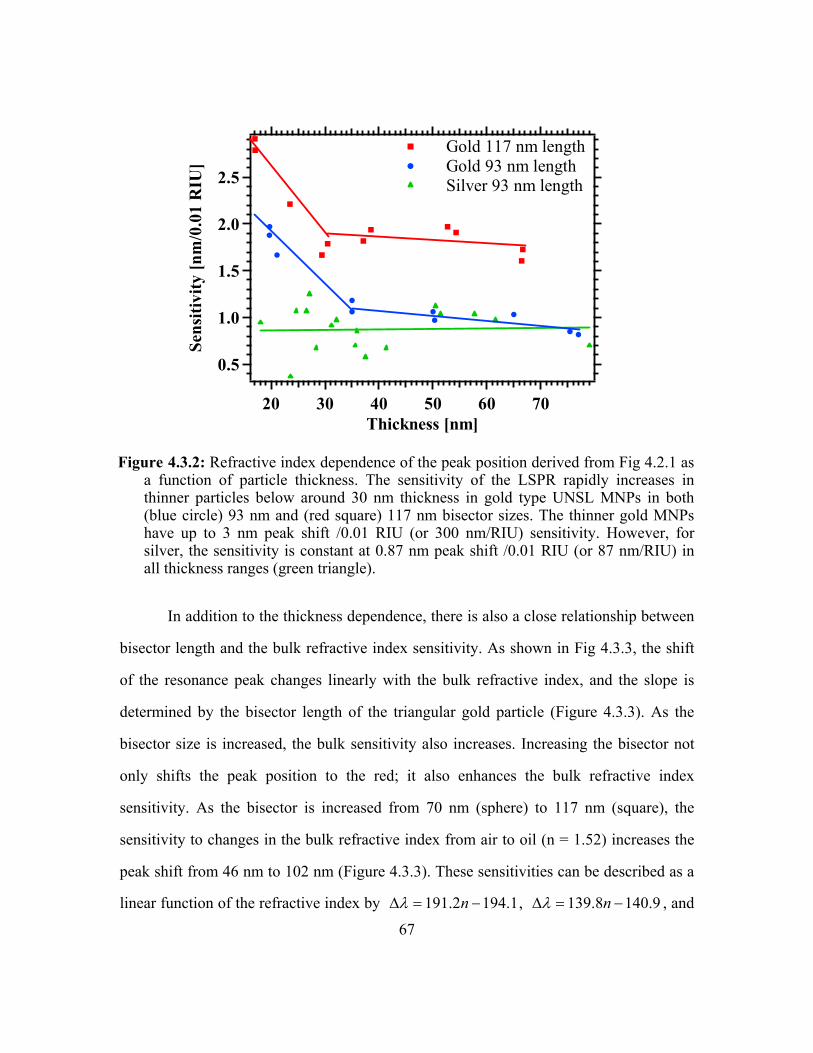
2.5
2.0
1.5
1.0
0.5
Sens
itivi
ty [n
m/0
.01
RIU
]
706050403020Thickness [nm]
Gold 117 nm length Gold 93 nm length Silver 93 nm length
Figure 4.3.2: Refractive index dependence of the peak position derived from Fig 4.2.1 as a function of particle thickness. The sensitivity of the LSPR rapidly increases in thinner particles below around 30 nm thickness in gold type UNSL MNPs in both (blue circle) 93 nm and (red square) 117 nm bisector sizes. The thinner gold MNPs have up to 3 nm peak shift /0.01 RIU (or 300 nm/RIU) sensitivity. However, for silver, the sensitivity is constant at 0.87 nm peak shift /0.01 RIU (or 87 nm/RIU) in all thickness ranges (green triangle).
In addition to the thickness dependence, there is also a close relationship between
bisector length and the bulk refractive index sensitivity. As shown in Fig 4.3.3, the shift
of the resonance peak changes linearly with the bulk refractive index, and the slope is
determined by the bisector length of the triangular gold particle (Figure 4.3.3). As the
bisector size is increased, the bulk sensitivity also increases. Increasing the bisector not
only shifts the peak position to the red; it also enhances the bulk refractive index
sensitivity. As the bisector is increased from 70 nm (sphere) to 117 nm (square), the
sensitivity to changes in the bulk refractive index from air to oil (n = 1.52) increases the
peak shift from 46 nm to 102 nm (Figure 4.3.3). These sensitivities can be described as a
linear function of the refractive index by 1.1942.191 −=∆ nλ , 9.1408.139 −=∆ nλ , and
67

30.861.83 −=∆ nλ , for 117 nm, 93 nm, and 70 nm bisector gold UNSL MNPs,
respectively.
100
80
60
40
20
0
Pea
k sh
ifts [
nm]
1.0
2.191 −=∆ nλ.861.83 −=∆ nλ
1.21.1 Refrac
Bisector length : 117 nm
93 nm
70 nm
9.1408.139 −=∆ nλ
3.861.83 −=∆ nλ
1.1942.191 −=∆ nλ
Figure 4.3.3: Linear peak shifts vs. the rein gold UNSL MNPs. As the bulk reincreased. Even more, the slope of thethe particle is increased. The 117 nsensitive peak shifts: up to 102 nm (sq1 to 1.52. The 93 nm bisector length (triangle). The 70 nm bisector length(sphere). The sensitivity to the
(177 nm bisecto30 (70 nm bisector).
1.194
Figure 4.3.4 is a summary of the
and the thickness dependence of the LSPR
index. The best sensitivity achieved is 28
sensitivity has been shown for nanorods [
refractive index sensitivity. As the rod le
1.51.41.3tive index
fractive index changes and bisector dependency fractive index is increased, the peak shifts are peak shifts is increased as the bisector length of m bisector gold UNSL MNPs gives the most uare) for the bulk refractive index change from gold UNSL MNPs has 74 nm red shift in total
gold UNSL MNPs has 46 nm red shift in total bulk refractive index is linear with r) (93 nm bisector), and
The thickness for all samples is 26 nm. 9.1408.139 −=∆ nλ
geometric optimization, showing the bisector
sensitivity to changes in the ambient refractive
0 nm/RIU. A similar length dependence of the
27], with longer nanorods having a greater bulk
ngth increases, not only is the LSPR sensitivity
68

much greater, but also the resonance peak positions shift to the IR range. The sensitivity
to changes in the bulk refractive index does not follow Equation 4.1.4; it depends on the
bisector more strongly than the difference in the maximum positions would predict. For
example, the sensitivity of a 93 nm long, 26 nm thick gold MNP measures 43 nm for the
peak shift from 752 nm in air to 795 nm in water. Equation 4.1.4, however, predicts the
peak shift as 135 nm. The fit line 9.1408.139 −=∆ nλ in Figure 4.3.3 gives 45 nm of
the peak shift. In the same way, the sensitivity of a 117 nm long, 29 nm thick gold MNP
in Figure 4.2.1 has the peak shift as 55 nm (884 nm to 939 nm). However, Equation 4.1.4
anticipates the peak shift as 200 nm at 884 nm, while the fit line of 1.1942.191 −=∆ nλ
in Figure 4.3.3 predicts 60 nm. Therefore, Equation 4.1.4, which states the peak position
determines the sensitivity regardless of the geometrical shape, is not valid here. Since,
Equation 4.1.4 assumes free-standing Au MNP, the substrate influence is at least one of
the reasons for the discrepancy between Equation 4.1.4 and the measured results. The
substrate leads to a red shift of the maximum absorption and therefore suggests a higher
sensitivity than a free-standing particle, and this reduction in sensitivity due to the
substrate was predicted by Lazarides’s group [20].
69
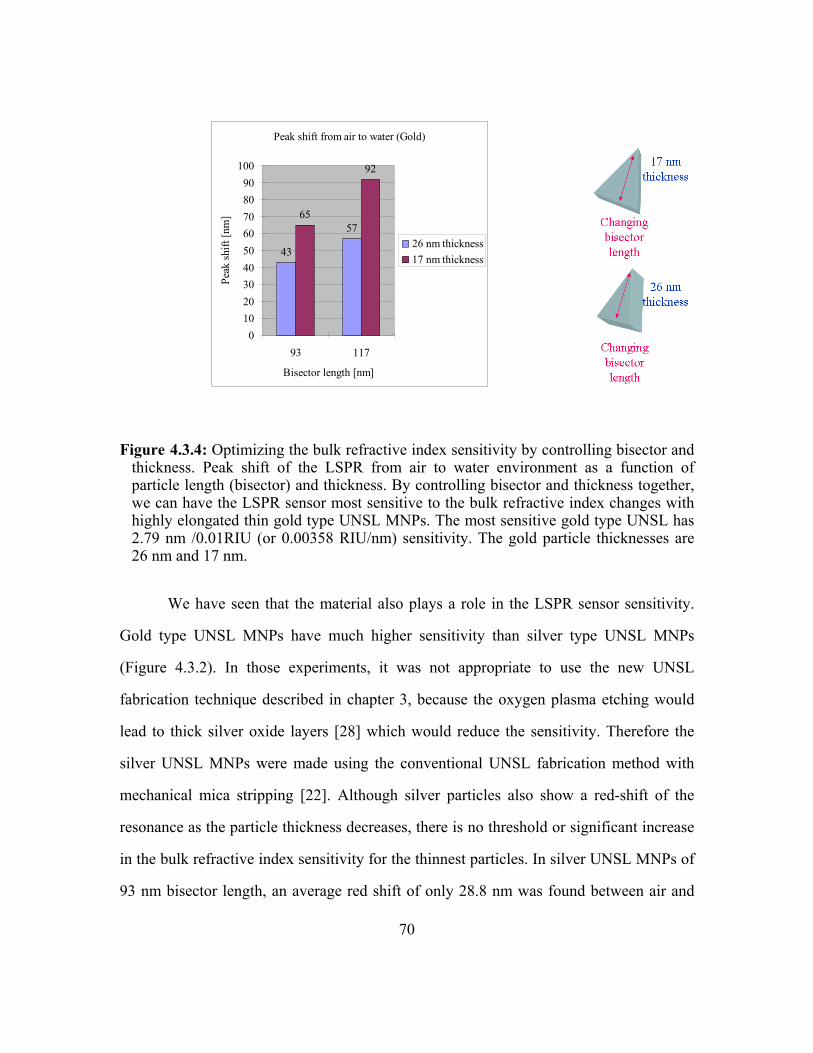
Peak shift from air to water (Gold)
43
5765
92
93 117
Bisector length [nm]
0102030405060708090
100
Peak
shift
[nm
]
26 nm thickness17 nm thickness
Figure 4.3.4: Optimizing the bulk refractive index sensitivity by controlling bisector and thickness. Peak shift of the LSPR from air to water environment as a function of particle length (bisector) and thickness. By controlling bisector and thickness together, we can have the LSPR sensor most sensitive to the bulk refractive index changes with highly elongated thin gold type UNSL MNPs. The most sensitive gold type UNSL has 2.79 nm /0.01RIU (or 0.00358 RIU/nm) sensitivity. The gold particle thicknesses are 26 nm and 17 nm.
We have seen that the material also plays a role in the LSPR sensor sensitivity.
Gold type UNSL MNPs have much higher sensitivity than silver type UNSL MNPs
(Figure 4.3.2). In those experiments, it was not appropriate to use the new UNSL
fabrication technique described in chapter 3, because the oxygen plasma etching would
lead to thick silver oxide layers [28] which would reduce the sensitivity. Therefore the
silver UNSL MNPs were made using the conventional UNSL fabrication method with
mechanical mica stripping [22]. Although silver particles also show a red-shift of the
resonance as the particle thickness decreases, there is no threshold or significant increase
in the bulk refractive index sensitivity for the thinnest particles. In silver UNSL MNPs of
93 nm bisector length, an average red shift of only 28.8 nm was found between air and
70

water medium over the whole thickness range (Figure 4.2.1). The sensitivity is constant
perhaps because of the constancy of the oxidation layer area at the surface of the silver
regardless of the thickness variation in silver thickness inside the SiO2.
Because we found that the particle thickness and bisector play a role in the
sensitivity of the gold UNSL sensor, but no dependence on thickness was found for the
silver sensor (Figure 4.3.2), we questioned whether there is the bisector dependence of
the sensitivity for the silver sensor. We deposited 300 nm, 400 nm, and 500 nm
nanospheres on a mica substrate to create different bisector sizes. Although there is no
significant thickness dependence for silver MNPs, the sensitivity depends on the bisector
length (Figure 4.3.5). The question of why there is the bisector dependence in silver
MNPs while there is no thickness dependence could be explained by the partial
embedding of the silver particles and the silver oxidation at the exposed surface. The
silver oxide layer thickness may occupy a large portion of the sensitivity range of the
silver MNPs, but changing the bisector enhances the field around the MNPs and therefore
increases the sensitivity. This is in contrast to conventional silver NSL MNPs, because in
NSL, the MNP sides are also exposed to the ambient and contribute to the sensing area
[1, 26].
Silver UNSL MNPs of 93 nm bisector shown before have an average sensitivity
of 87 nm /RIU, but the data are very noisy. (Figure 4.3.2). In an experiment to compare
different bisector lengths a thickness of 35 nm was used. The sensitivities were found to
be 25 nm /RIU, 75 nm /RIU, and 122 nm /RIU for 70 nm, 93 nm, and 117 nm bisector
length, respectively (Figure 4.3.5). These sensitivities are far lower than for gold MNPs.
71
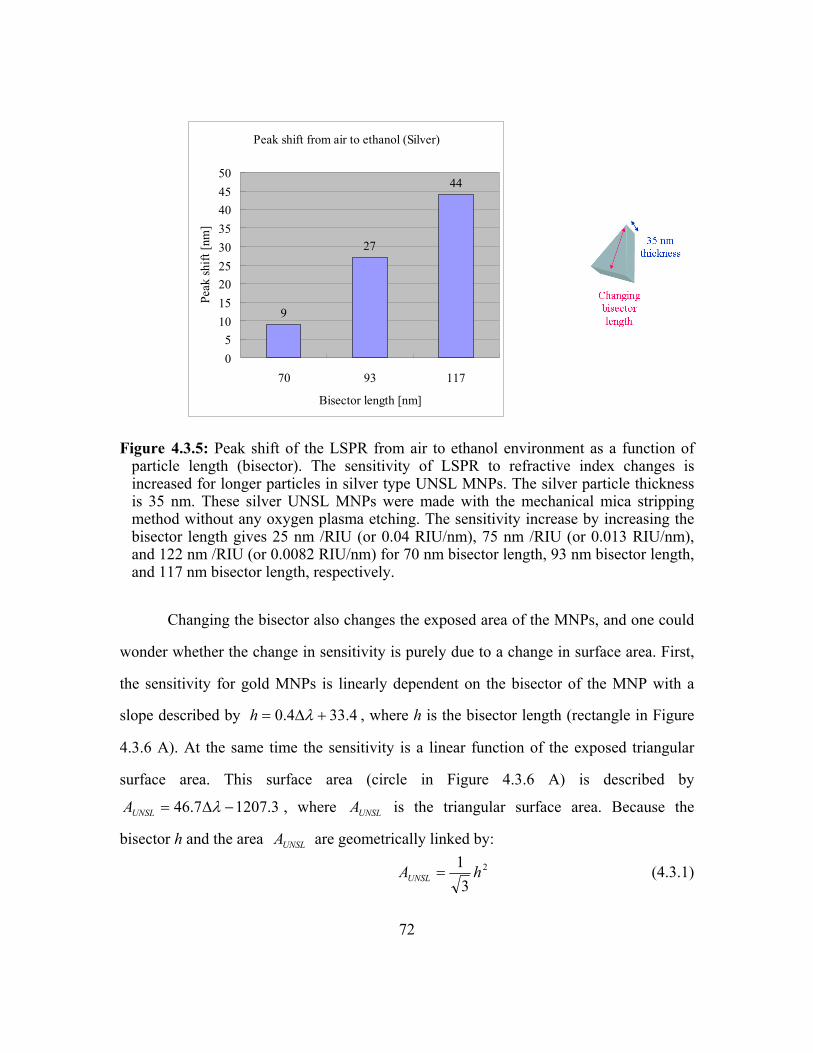
Peak shift from air to ethanol (Silver)
9
27
44
70 93 117
Bisector length [nm]
05
101520253035404550
Peak
shift
[nm
]
Figure 4.3.5: Peak shift of the LSPR from air to ethanol environment as a function of particle length (bisector). The sensitivity of LSPR to refractive index changes is increased for longer particles in silver type UNSL MNPs. The silver particle thickness is 35 nm. These silver UNSL MNPs were made with the mechanical mica stripping method without any oxygen plasma etching. The sensitivity increase by increasing the bisector length gives 25 nm /RIU (or 0.04 RIU/nm), 75 nm /RIU (or 0.013 RIU/nm), and 122 nm /RIU (or 0.0082 RIU/nm) for 70 nm bisector length, 93 nm bisector length, and 117 nm bisector length, respectively.
Changing the bisector also changes the exposed area of the MNPs, and one could
wonder whether the change in sensitivity is purely due to a change in surface area. First,
the sensitivity for gold MNPs is linearly dependent on the bisector of the MNP with a
slope described by 4.334.0 +∆= λh
3.1207
, where h is the bisector length (rectangle in Figure
4.3.6 A). At the same time the sensitivity is a linear function of the exposed triangular
surface area. This surface area (circle in Figure 4.3.6 A) is described by
7.46 −∆= λUNSLA , where is the triangular surface area. Because the
bisector h and the area are geometrically linked by:
UNSLA
UNSLA2
31 hAUNSL = (4.3.1)
72

a nonlinear dependence of the sensitivity would be expected for one of the parameters if
geometry is the determining parameter. We checked whether doubling the area causes
twice the sensitivity. The relative sensitivity as a function of relative bisector length and
relative triangular area are plotted for clear comparison in Figure 4.3.6 B. The relative
sensitivity, rλ∆ , is a linear function of the relative bisector, , with rh rr h=∆λ and the
relative exposed area, , with rUNSLA , 3.07.0 , +=∆ rUNSLr Aλ . The direct proportionality
with the bisector is similar to equation 4.1.3 for a rod, where the aspect ratio determined
the sensitivity, and a simple area dependence can be excluded.
An additional possibility of a purely area-related influence is the change in area
that is exposed relative to the area that is covered by the glass, which would contribute a
constant component to the environment the MNPs experience. With b the thickness of
the MNPs (see Figure 4.3.6), the exposed area relative to the total surface area is:
hbrelUNSLA
621
+= (4.3.2)
For 26 nm MNPs and bisectors of 70 nm, 93 nm, and 117 nm, this ratio increases with
bisector length far too slowly to account for the observed increase in sensitivity.
Although there is an area and bisector influence to the sensitivity, we can conclude that
the sensitivity increase is not determined by the additional area provided by larger MNPs.
Instead, it is most likely the result of the field distribution around the MNPs at the
resonance.
73

110
100
90
80
70
Bis
ecto
r le
ngth
[nm
]
180160140120100 Bulk refractive index sensitivity [arbit.u.]
7000
6000
5000
4000
3000
Trianglur surface area [nm
2]
Fit : y=0.4x+33.4
Fit : y=46.7x-1207.3
(A) 2.2
2.0
1.8
1.6
1.4
1.2
1.0
Rel
ativ
e se
nsiti
vity
2.52.01.51.0 Relative triangular area
2.22.01.81.61.41.2Relative bisector length
Fit: y=0.7x+0.3
Fit: y=x
(B)
Figure 4.3.6: Contribution of the bisector and the exposed area in the bulk refractive index sensitivity. (A) Linear relationship between bisector length and the bulk refractive index sensitivity. As the bisector length is increased, the bulk sensitivity also increases. The bisector length (rectangle) can be fit to a line as a function of the sensitivity described by . The exposed area also plays a role in the sensitivity. The triangular area (circle) can be fit to a line as a function of the sensitivity described by 7.46 −∆= λUNSLA . (B) The relationship between the relative bisector length and the relative exposed surface area and the bulk refractive index sensitivity. There are both bisector and area linear dependencies to the sensitivity. These data can be fit to a line described by rr∆λ for the relative bisector length (square and blue fit) and 3.0,7.0 +=∆ rUNSLr Aλ for the relative triangular area (circle and red fit).
4.334.0 +∆= λh
3.1207
h=
In summary, there is a significant influence of the particle geometry and the
material on the position of the LSPR resonance and the sensitivity to changes in the
ambient bulk refractive index. The sensitivity is a linear function of the bulk refractive
index, and of the MNP thickness and bisector length. Silver UNSL MNPs are less
sensitive than gold MNPs, at least in part due to the formation of an oxide layer.
74
4.3.4 The local refractive index sensitivity of LSPR in UNSL samples
While the sensitivity to the refractive index of the bulk medium is important for
the stability of a sensor and its background signal, most affinity binding takes place
within the 10-15 nm closest to the surface of the MNP. There local field distributions
and enhancements play a major role in determining the sensitivity.
Figure 4.4.1 shows the UV-Vis extinction spectrum for gold UNSL MNPs in air
before and after 1-hexadecanethiol, (1-HDT) incubation. The gold particle thickness used
here is 30 nm and the bisector length is 93 nm. As the 1-HDT incubation time increases,
the LSPR peak position SPmaxλ shifts to the red (Figure 4.4.1) by 6 nm from 860 nm to
866 nm after 3 hours and another 19 nm from 866 nm to 885 nm after 8 hours (total
25 nm red-shift). A red shift can be expected due to the dielectric environment change
from air (n = 1) to the SAM (ε = 2.1) in the first 2 nm around the particle.
The red shift caused by an increasing 1-HDT incubation time can be explained by
defining an effective refractive index neff that takes the local field profile into account
[29]
dzLzznL
neff )/2exp()(20∫∞
−= (4.4.1)
where is the area-averaged refractive index at distance z from the metal surface, and
the decay length of the evanescent field. This equation has been used in propagating
SPR sensors for determining the response of adsorbate layers, but it has also been
adopted for LSPR sensors [16]. The effective refractive index change can be formulated
by
)(zn
L
)(2saeff nn
Ldn −=∆ (4.4.2)
where is the effective thickness of the thin film, is the refractive index of uniformly
packed pure adsorbate on the surface, and the refractive index of solvent or medium.
d an
sn
75

Alternatively, before a complete thin film has formed on the surface, the SAM thin film
is porous and interspersed with solvent, which is ethanol in this experiment. Thus, the
effective refractive index change must be expressed by the effective thickness, , of the
thin film. The effective thickness can be formulated again by
d
))(
(2 sa
eff
nnnLd−
∆= (4.4.3)
Once the effective thickness is calculated, then the surface coverage, , can also be
calculated from the effective thickness by
C
)/()()/( 32 cmmoleculesNcmdcmmoleculesC ×= (4.4.4)
where ANMw
N ρ= is the bulk number density, ρ is the bulk mass density of the pure
saturated SAM layer, is the molecular weight of the SAM, and is Avogadro's
number. Therefore, the LSPR response due to an effective refractive index change can be
understood as the SAM coverage on the MNP surfaces. Thus Figure 4.4.1 can be
interpreted as a surface coverage increase with increasing incubation time, and the red
shift in the resonance peak is due to an increase of the effective refractive index.
Mw AN
0.18
0.16
0.14
0.12
0.10
0.08
Abs
orpt
ion
[arb
it.u.
]
12001000800600400Wavelength [nm]
HDT for 0 hours HDT for 3 hours HDT for 8 hours
Figure 4.4.1: Absorption spectrum of gold UNSL MNPS. As 3 mM of hexadecanethiol (1-HDT) is functionalized on the gold MNPs, there are red-shifts from before 1-HDT incubation which is at 860 nm (red solid line) to 866 nm (green dashed line) for 3 hours and 885 nm (blue dotted line) for 8 hours. Particle bisector size = 93 nm, Particle thickness in SiO2 = 35 nm. This is reproduced from Figure 3.4 in chapter 3.
76

To study the sensor sensitivity to local refractive index changes caused by the
adsorbed analyte, biotin-streptavidin layers were used with UNSL-fabricated gold MNPs.
UV-Vis extinction spectroscopy and AFM scanning were used to confirm the multilayer
incubation process. Figure 4.4.2 shows AFM images before (Figure 4.4.2 A) and after
incubation with a biotinylated thiol and streptavidin (SA) on UNSL-fabricated gold
MNPs, with Figure 4.4.2 B showing an average height of 2-3 nm averaged over several
line scan data (maximum height is up to 6 nm), while a densely packed SA layer is 4-
6 nm thick [30]. The average 2 nm of height is due to a loosely packed SA layer.
Figure 4.4.2: Representative AFM images of UNSL-fabricated gold MNPs for chemical modification. (A) Bare gold MNPs before chemical modification. (B) After incubation with 100 nM streptavidin for 3 hours for the biotinylated gold MNPs. Particle bisector = 117 nm. Particle thickness = 20 nm. The SA-biotin thickness is 2 nm on average due to a loosely packed SA layer. Gray scale is from -2 nm to 2 nm. Scan rate = 2 Hz in tapping mode.
Results corresponding to Figure 4.4.2 are shown in Figure 4.4.3 as the LSPR
SPmaxλ positions as a function of the local refractive index change due to adsorption of
77

biotin and SA. When the adsorbate layers, 1 mM of the biotin-PEG-thiol and 100 nM of
the streptavidin-biotin-thiol layer on the gold MNP surface, is measured in air, the
resonance peak position shifts to the red (Figure 4.4.3 A). This trend is also found in
higher bulk dielectric environments such as water or PBS buffer (Figure 4.4.3 B), but the
shift is much smaller. The LSPR peak position SPmaxλ after biotin-PEG-disulfide
attachment on the gold MNPs was measured to be 1003 nm ( λ∆ = 29 nm) in air, and
1064 nm ( λ∆ = 8 nm) in water. The LSPR peak position SPmaxλ after streptavidin
binding to the biotinylated gold MNPs is 1010 nm ( λ∆ = 7 nm) in air, and 1067 nm
( λ∆ = 3 nm) in PBS buffer.
78

Average peak position with 100 nM SA-1mM Biotin
974
10031010
950
960
970
980
990
1000
1010
1020
air Biotin in air SA in air
Peak
pos
ition
[nm
]
Average peak position with 100 nM SA-1mM Biotin
1056
10641067
1040
1045
1050
1055
1060
1065
1070
1075
water Biotin in water SA in PBS
Peak
pos
ition
[nm
]
(B)
(A)
Figure 4.4.3: Local refractive index dependency for the resonance peak positions. (A) Local refractive index influence in air for 1 mM biotin and for 100 nM SA. The peak shift from bare gold to biotin layer is = 29 nm and the peak shift from biotin to streptavidin layer is = 8 nm. (B) Same adsorbate layers with (A) in higher dielectric environment. The peak shift from bare gold to biotin layer is = 7 nm in water and the peak shift from biotin to streptavidin layer is = 3 in PBS buffer environment. The refractive index of the PBS buffer is 1.33. Particle sizes are same as in Figure 4.4.2.
λ∆λ∆
λ∆λ∆
The adsorbate-induced local refractive index sensitivity is reduced by the higher
bulk refractive index of water (n = 1.33) compared to air (n = 1) (Figure 4.4.4). This can
be explained by the relative dielectric constant, εadsorbat, rel , of the adsorbate layer, εadsorbat,
, surrounded by a medium of dielectric constant, εmedium ,
medium
adsorbatereladsorbate ε
εε =, (4.4.5)
79

The relative dielectric constant for the adsorbate in aqueous environment,
assuming for the adsorbate εadsorbate = 2.25, is therefore strongly reduced to
εadsorbat, rel = 1.69, or the refractive index is reduced from 1.5 in air to 1.3 in buffer.
Bulk refractive index influences in local refractive index sensitivity
(1mM Biotin-100nM SA)
0
0.1
0.2
0.3
0.4
0.5
bare surface Biotin layer SA layer
Adsorbate layer
Rel
ativ
e se
nsiti
vity
n=1n=1.33
Figure 4.4.4: Bulk refractive index influences the local refractive index sensitivity. The sensitivity relative to the bare surface to local refractive index changes at two steps of adding adsorbate layers (1 mM biotin, and 100 nM streptavidin) is shown. The relative local refractive index sensitivity is reduced by the higher bulk refractive index of water (n = 1.33). Particle sizes are the same as in Figure 4.4.2.
However, a fast drop in sensitivity (Equ. 4.4.1) makes this influence less
pronounced, and non-spherical MNPs with high, but short-range fields can therefore
increase the sensitivity. Indeed, already the biotin and streptavidin layers reduce the
sensitivity to the medium by more than 30 %, as can be seen from differences between air
and buffer resonance peak positions (Fig. 4.4.5). This result agrees with experiments for
silver NSL MNPs with 100 nm bisector size and 50 nm thickness, where the sensitivity to
the bulk refractive index drops (from methanol n = 1.3288 to benzene n = 1.5011) from
196 nm/RIU before to 159 nm/RIU after hexadecanethiol modification [15].
80

1mM Biotin-100nM SA influence in the bulk refractive index sensitivity (n=1 to n=1.33)
5055606570758085
bare surface Biotin layer SA layer
Adsorbate layers
Peak
shift
[nm
]
Figure 4.4.5: Multilayer adsorbate influences on the bulk refractive index sensitivity. The resonance peak position of UNSL-fabricated gold MNPs with adsorbate layers was measured in air and water (or PBS buffer). Adding adsorbate layers to the gold MNPs significantly reduces the bulk refractive index sensitivity. Bare gold MNPs have an 82.3 nm peak shift from air (n = 1) to water (n = 1.33). Biotinylated gold MNPs have a 61.3 nm peak shift, and biotin-streptavidin gold MNPs have a 56.6 nm peak shift. Particle sizes are same as in Figure 4.4.2.
In summary, the bulk refractive index sensitivity of the MNP sensor reduces the
adsorbate sensitivity, but local field engineering should be able to tailor the decay length
to reduce the bulk influence. Others have also shown that the enhanced near fields can
play an important role in the sensitivity of MNP sensors [15].
4.3.5 Comparison of the refractive index sensitivity in unit sensing area in NSL and UNSL
There are differences in the areas exposed to the ambient environment for NSL-
fabricated samples and UNSL-fabricated samples. UNSL-fabricated samples have only
one exposed surface used in sensing. However, NSL-fabricated samples have 4 exposed
surfaces. Understanding these different areas used in plasmonic sensing is essential. The
area of UNSL and NSL surface (Figure 4.5.1) is 81
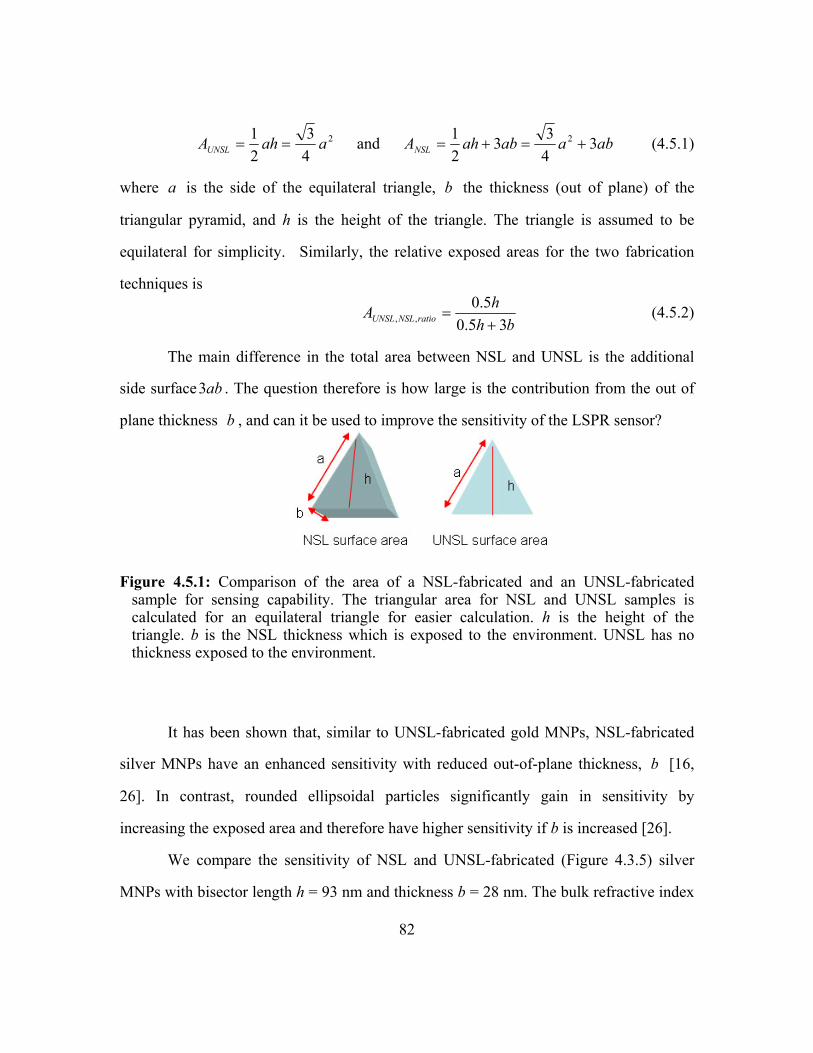
2
43
21 aahAUNSL == and abaabahANSL 3
433
21 2 +=+= (4.5.1)
where is the side of the equilateral triangle, the thickness (out of plane) of the
triangular pyramid, and h is the height of the triangle. The triangle is assumed to be
equilateral for simplicity. Similarly, the relative exposed areas for the two fabrication
techniques is
a b
bhhA ratioNSLUNSL 35.0
5.0,, +
= (4.5.2)
The main difference in the total area between NSL and UNSL is the additional
side surface . The question therefore is how large is the contribution from the out of
plane thickness , and can it be used to improve the sensitivity of the LSPR sensor?
ab3
b
Figure 4.5.1: Comparison of the area of a NSL-fabricated and an UNSL-fabricated sample for sensing capability. The triangular area for NSL and UNSL samples is calculated for an equilateral triangle for easier calculation. h is the height of the triangle. b is the NSL thickness which is exposed to the environment. UNSL has no thickness exposed to the environment.
It has been shown that, similar to UNSL-fabricated gold MNPs, NSL-fabricated
silver MNPs have an enhanced sensitivity with reduced out-of-plane thickness, [16,
26]. In contrast, rounded ellipsoidal particles significantly gain in sensitivity by
increasing the exposed area and therefore have higher sensitivity if b is increased [26].
b
We compare the sensitivity of NSL and UNSL-fabricated (Figure 4.3.5) silver
MNPs with bisector length h = 93 nm and thickness b = 28 nm. The bulk refractive index
82

sensitivity for the most sensitive silver NSL MNPs is 200 nm/RIU [26], compared to
75 nm/RIU for silver UNSL MNPs (Figure 4.3.5, h = 93 nm), or 38 % of the NSL
sensitivity. Therefore the sensitivity per unit area for silver NSL MNPs is
and for silver UNSL MNPs of the same size
, while for the most sensitive silver UNSL MNPs (h = 117 nm)
it is 1.55x10⁻² nm/RIU/nm2. As the ratio of the exposed areas of UNSL and NSL is 36 %
and the sensitivity of the UNSL MNPs is 38 %, the sensitivity appears to be determined
by the relative exposed areas and NSL has an advantage over UNSL. However, this
advantage holds only for the most insensitive UNSL MNPs, which appear to not benefit
much from reducing the out-of-plane thickness b.
22 //1042.1 nmRIUnm−×
22 //1048.1 nmRIUnm−×
Because our Ag UNSL samples show very low sensitivity, we compared the Au
UNSL samples to NSL results. For NSL the sensitivity for gold MNPs is reduced to less
than 60 % of the sensitivity of the silver NSL MNPs. Comparing the gold UNSL MNPs
of the same bisector length of h = 93 nm and thickness b = 17 nm (Figure 4.3.4) to the
silver NSL MNPs, the UNSL MNP sensitivity, which is 197 nm/RIU, is improved to
98.5 % of silver NSL MNPs. Additionally, with optimized geometry, sensitivities of
close to 300 nm/RIU for gold UNSL MNPs can be achieved by reducing the out-of-plane
thickness, as has been suggested for NSL too [26]. However, NSL MNPs that are very
thin easily become ellipsoidal and lose this advantage [26], and often much thicker NSL
MNPs are used (b = 50 ~75 nm). We therefore conclude that the exposed surface area
plays a role for silver, possibly because of the surface oxidation, but appears not
important for gold.
We also compare the local refractive index sensitivity in UNSL and NSL samples.
In section 4.3.4, we have explored the local refractive index sensitivity with short range
distance dependence of the UNSL-fabricated LSPR sensor. NSL sensors have been
83

experimentally used to understand that the enhanced near fields play an important role in
the resonance sensitivity [15].
To compare the area contribution in the local refractive index sensitivity, data
from Figure 4.4.1 was used for gold UNSL MNPs. All NSL data used here are taken
from reference [15]. Gold and silver NSL area data are for bisector h = 100 nm and
thickness b = 75 nm. Gold and silver NSL MNPs were incubated in 1mM HDT for
24 hours (Figure 4.5.2 A, D) and the thiol layer produced 38.1 nm (silver) and 13.8 nm
(gold) peak shifts to the red. Gold UNSL MNPs with h = 93 nm and b = 35 nm produced
25 nm (8 h in 3 mM HDT) and with h = 117 nm and b = 20 nm produced 30 nm (24 h in
1 mM HDT) of the peak shift (Figure 4.5.2 B).
Because the thiol packs more tightly, and is upright on silver as compared to on
gold, where it assumes a 30° angle, the thickness of the layer and the refractive index
may be slightly different. We assume constant refractive index, but compensate for the
slightly different thickness. The slope, taken as the short-range sensitivity near the
particles (Figure 4.5.2), is the largest for silver NSL MNPs with 14.6 nm shift per nm
thickness (blue solid line in Figure 4.5.2 A), closely followed by gold UNSL MNPs with
h = 117 nm and 24 h incubation with 13.7 nm shift / nm thickness (red solid line in
Figure 4.5.2 B). Gold UNSL MNPs with h = 93 nm and 8 h incubation produce 11.6 nm
shift / nm thickness (red dotted line in Figure 4.5.2 C), while gold NSL MNPs are the
least sensitive with 6.4 nm shift / nm thickness (blue dash-dotted line in Figure 4.5.2 D).
Although the analyzed gold UNSL MNPs can be made more sensitive by increasing the
bisector length, at least a similar near-range sensitivity can be achieved.
84

30
20
10
0
Pea
k sh
ifts [
nm]
2.52.01.51.00.50.0 Short range distance [nm]
NSL Ag (h=100nm) UNSL Au (h=117 nm) UNSL Au (h=93 nm) NSL Au (h=100 nm)
(a)
(c)
(d)
(b)
(a) (b) (c) (d)
Figure 4.5.2: Comparison of the local refractive index sensitivity with hexadecanethiol (HDT) layer on NPs. (a) NSL-fabricated silver MNPs (h = 100, b = 75.1 nm) has 38 nm peak shift (blue solid line) with the sensitivity slope 14.6 [peak shift(nm) / nm thickness]. (b) UNSL-fabricated gold MNPs (h = 117 nm, b = 20 nm) has 30 nm peak shift (red solid line) with the sensitivity slope 13.7 [peak shift(nm)/ nm thickness]. UNSL-fabricated gold was incubated (red solid line) with 1 mM HDT for 24 hours. (c) UNSL-fabricated gold MNPs (h = 93 nm, b = 35 nm) has 25 nm peak shift (red dotted line) with the sensitivity slope 11.6 [peak shift(nm)/ nm thickness]. UNSL-fabricated gold (h = 93, b = 35 nm) was incubated (red dotted line) with 3 mM HDT for 8 hours. (d) NSL-fabricated gold MNPs (h = 100, b = 75.1 nm) has 13.8 nm peak shift (blue dash-dotted line) with the sensitivity slope 6.4 [peak shift(nm) / nm thickness]. NSL samples were incubated with 1 mM HDT for 24 hour [15].
4.4 CONCLUSIONS
In the quasi-static approximation, the bulk plasma wavelength determines the
LSPR position and the LSPR position in turn determines the LSPR sensitivity to
adsorbed layers or bulk refractive index changes. The resonance extinction peak position
is bisector length, thickness, and material dependent in non-spherical MNPs. The peak
position is also a linear function of the bulk refractive index, and the slope or sensitivity
is a linear function of bisector length, and can be improved by reducing the thickness.
Thinner and longer, i.e. more non-spherical, particles have higher sensitivity to the bulk
environmental changes. The threshold in the LSPR sensitivity as a function of the
85

thickness of the UNSL MNP may be explained by confinement effects, which play a
significant role under 30 nm. Thus, understanding the geometrical influences on the bulk
refractive index sensitivity and optimizing the non-spherical MNP geometry are crucial
steps to make a sensitive sensor.
Functionalizing UNSL-fabricated gold MNPs with HDT and biotin-streptavidin
was used to understand the local refractive index sensitivity. The resonance peak
positions are dependent on the effective coverage of the HDT SAM or biotin-thiol and
streptavidin. On the other hand, we found that the bulk refractive index also influences
the local sensitivity to refractive index changes. A higher bulk refractive index reduces
the local refractive index sensitivity by lowering the effective dielectric constant of the
absorbate in the surrounding medium. These adsorbate layers reduce the sensitivity to the
bulk refractive index.
When non-spherical MNPs are embedded in SiO2 as with UNSL, the optical
properties are changed, especially in silver. Unlike with NSL, there is no significant
thickness dependency in bulk refractive index sensitivity in UNSL-fabricated silver
MNPs, although the sensitivity can be increased by increasing the bisector. That may be
explained by the silver oxidation on the exposed surface area.
The bulk refractive index sensitivity is also affected by the material. It was shown
that UNSL-fabricated gold MNPs have a much higher sensitivity than silver MNPs when
thickness and bisector length have been optimized.
The sensitivity of NSL and UNSL were compared for both the bulk refractive
index and the local refractive index. NSL-fabricated gold MNPs always have a lower
sensitivity than silver NSL MNPs. The exposed area in UNSL samples is significantly
smaller than that of NSL-fabricated silver samples, and the sensitivity appears to be
determined by the relative exposed areas and NSL has an advantage over UNSL.
86
However, reducing the out-of-plane thickness in UNSL samples which significantly
enhances the sensitivity overcomes this drawback. This solution is not valid in NSL
samples due to losing the sharpness at the corners and the edges.
LSPR sensors are not only limited to NSL-fabricated MNP sensors, but also
include other shapes such as nanocubes [19], triangular nanoprisms [31], nanorods [25]
and nanocrescents [32]. The most sensitive UNSL-fabricated Au MNP sensors has a bulk
refractive index sensitivity of close to 300 nm/RIU with 117 nm bisector length. A single
silver nanocube has 98 nm/RIU sensitivity to bulk refractive index changes, while a
single silver triangular nanoprism has 205 nm/RIU, and averaging over several particles
may even decrease the sensitivity. A gold nanocrescent with a diameter of 125 nm and a
resonance in the near-IR has 368 nm/RIU, but it is not clear how well the crescents would
survive chemical functionalization [31]. Therefore, our UNSL-Au MNP has a better
sensitivity compared to most MNP LSPR sensors. This sensitivity may be even increased
further by increasing the bisector to make highly elongated shapes. This trend is in
agreement with modeling for nanorods that predict even higher sensitivities under
optimized diameter and aspect ratio conditions. DDA calculations for highly elongated
nanorods have predicted the sensitivity to increase up to 491.4 nm/RIU [25].
It is also shown that increasing the exposed surface area is not effective, but using
gold material with UNSL and increasing the bisector length and lowering the thickness,
in a trend resembling the nanorod dependency on the aspect ratio, is much more effective
in achieving better plasmonic sensitivity.
4.5 REFERENCES 1. Jensen, T., M.D. Malinsky, C.L. Haynes and R.P.V. Duyne., Nanosphere
Lithography:Tunable localized surface plasmon resonance spectra of silver nanoparticles. J. Phys. Chem B, 2000. 104: p. 10549-10556.
2. Kreibig, U. and M. Vollmer, Optical Properties of Metal Clusters. 1995, Berlin: Springer.
87
3. Haes, A.J. and R.P.V. Duyne, A Nanoscale Optical Biosensor: Sensitivity and Selectivity of an Approach Based on the Localized Surface Plasmon Resonance Spectroscopy of Triangular Silver Nanoparticles. J. Am. Chem. Soc., 2002. 124: p. 10596-10604.
4. Mock, J.J., M. Barbic, D.R. Smith, D.A. Schultz and S.Schultz, Shape effects in plasmon resonance of individual colloidal silver nanoparticles. Journal of Chemical Physics, 2002. 116: p. 6755-6759.
5. Niemeyer, C.M., B. Ceyhan, S. Gao, L. Chi, S. Peschel and U. Simon, Site-selective immobilization of gold nanoparticles functionalized with DNA oligomers. Colloid and Polymer Science, 2001. 279(1): p. 68-72.
6. Raschke, G., S. Kowarik, C.S. T. Franzl, T.A. Klar and J. Feldmann, Biomolecular Recognition Based on Single Gold Nanoparticle Light Scattering. Nano letters, 2003. 3(7): p. 935-938.
7. Wink, T., S.J. VanZuilen, A. Bult and W.P. vanBennekom, Liposome-mediated enhancement of the sensitivity in immunoasssays of proteins and peptides in surface plasmon resonance spectrometry. Analytical Chemistry, 1998. 70: p. 827-832.
8. Mirkin, C.A., Nanoparticles with Raman spectroscopic fingerprints for DNA and RNA detection. SCIENCE, 2002. 297: p. 1536-1540.
9. Elghanian, R., J.J. Storhoff, R.C. Mucic, R.L. Letsinger and C.A. Mirkin, Selective colorimetric detection of polynucleotides based on the distance-dependent optical properties of gold nanoparticles. SCIENCE, 1997. 277: p. 1078-1081.
10. McFarland, A.D. and R.P.V. Duyne, Signle Silver Nanoparticles as real-time optical sensors with zeptomole sensitivity. Nano letters, 2003. 3: p. 1057-1062.
11. Nath, N. and A. Chilkoti, Label-Free Biosensing by Surface Plasmon Resonance of Nanoparticles on Glass:Optimization of Nanoparticle Size. Analytical Chemistry, 2004. 76: p. 5370-5378.
12. Hao, E., R.C. Bailey, G.C. Schatz, J.T. Hupp and S.Y. Li, Synthesis and optical properties of "branched" gold nanocrystals. Nano Letters, 2004. 4(2): p. 327-330.
13. Hulteen, J.C., D.A. Treichel, M.T. smith, M.L. Duval, T.R. Jensen and R.P. VanDuyne, Nanosphere Lithography: Size-Tunable Silver Nanoparticle and Surface Cluster Arrays. J. Phys. Chem B, 1999. 103: p. 3854-3863.
14. Mishchenko, M.I., L.D. Travis and A. Macke, Scattering of light by polydisperse, randomly oriented, finite circular cylinders. Applied Optics, 1996. 35(24): p. 4927-4940.
15. Haes, A.J., S.L. Zou, G.C. Schatz and R.P. Van Duyne, Nanoscale optical biosensor: Short range distance dependence of the localized surface plasmon resonance of noble metal nanoparticles. Journal of Physical Chemistry B, 2004. 108(22): p. 6961-6968.
16. Haes, A.J., S.L. Zou, G.C. Schatz and R.P. Van Duyne, A nanoscale optical biosensor: The long range distance dependence of the localized surface plasmon resonance of noble metal nanoparticles. Journal of Physical Chemistry B, 2004. 108(1): p. 109-116.
88

17. Englebienne, P., Use of colloidal gold surface plasmon resonance peak shift to infer affinity constants from the interactions between protein antigens and antibodies specific for single or multiple epitope. Analyst, 1998. 123: p. 1599-1603.
18. Nath, N. and A. Chilkoti, Label free colorimetric biosensing using nanoparticles. Journal of Fluorescence, 2004. 14(4): p. 377-389.
19. Sherry, L.J., S.H. Chang, G.C. Schatz, R.P. Van Duyne, B.J. Wiley and Y.N. Xia, Localized surface plasmon resonance spectroscopy of single silver nanocubes. Nano Letters, 2005. 5(10): p. 2034-2038.
20. Miller, M.M. and A.A. Lazarides, Sensitivity of metal nanoparticle surface plasmon resonance to the dielectric environment. Journal of Physical Chemistry B, 2005. 109(46): p. 21556-21565.
21. Haes, A.J., W.P. Hall, L. Chang, W.L. Klein and R.P. Van Duyne, A localized surface plasmon resonance biosensor: First steps toward an assay for Alzheimer's disease. Nano Letters, 2004. 4(6): p. 1029-1034.
22. Frey, W., C.K. Woods and A. Chilkoti, Ultraflat nanosphere lithography: A new method to fabricate flat nanostructures. Advanced Materials, 2000. 12(20): p. 1515-1519.
23. Etchegoin, P.G., E.C. Le Ru and M. Meyer, An analytic model for the optical properties of gold. Journal of Chemical Physics, 2006. 125(16).
24. Mulvaney, P., L.M. Liz-Marzan, M. Giersig and T. Ung, Silica encapsulation of quantum dots and metal clusters. Journal of Materials Chemistry, 2000. 10(6): p. 1259-1270.
25. Lee, K.S. and M.A. El-Sayed, Gold and silver nanoparticles in sensing and imaging: Sensitivity of plasmon response to size, shape, and metal composition. Journal of Physical Chemistry B, 2006. 110(39): p. 19220-19225.
26. Jensen, T., M. Duval, K.L. Kelly, A.A. Lazarides, G.C. Schatz and R.P.V. Duyne., Nanosphere Lithography: Effect of the external dielectric medium on the surface plasmon resonance spectrum of a periodic array of silver nanoparticles. J. Phys. Chem B, 1999. 103: p. 9846-9853.
27. Perez-Juste, J., I. Pastoriza-Santos, L.M. Liz-Marzan and P. Mulvaney, Gold nanorods: Synthesis, characterization and applications. Coordination Chemistry Reviews, 2005. 249(17-18): p. 1870-1901.
28. Zeng, Y.X., L.H. Chen, Y.L. Zou, P.A. Nguyen, J.D. Hansen and T.L. Alford, Processing and encapsulation of silver patterns by using reactive ion etch and ammonia anneal. Materials Chemistry and Physics, 2000. 66(1): p. 77-82.
29. Shumaker-Parry, J.S. and C.T. Campbell, Quantitative methods for spatially resolved adsorption/desorption measurements in real time by surface plasmon resonance microscopy. Analytical Chemistry, 2004. 76(4): p. 907-917.
30. Riepl, M., K. Enander, B. Liedberg, M. Schaferling, M. Kruschina and F. Ortigao, Functionalized surfaces of mixed alkanethiols on gold as a platform for oligonucleotide microarrays. Langmuir, 2002. 18(18): p. 7016-7023.
31. Sherry, L.J., R.C. Jin, C.A. Mirkin, G.C. Schatz and R.P. Van Duyne, Localized surface plasmon resonance spectroscopy of single silver triangular nanoprisms. Nano Letters, 2006. 6(9): p. 2060-2065.
89
32. Bukasov, R. and J.S. Shumaker-Parry, Highly tunable infrared extinction properties of gold nanocrescents. Nano Letters, 2007. 7(5): p. 1113-1118.
33. Salerno, M., J.R. Krenn, A. Hohenau, H. Ditlbacher, G. Schider, A. Leitner, and F.R. Aussenegg, The optical near-field of gold nanoparticle chains. Optics Communications, 2005. 248(4-6): p. 543-549.
34. Lamprecht, B., G. Schider, R.T. Lechner, H. Ditlbacher, J.R. Krenn, A. Leitner and F.R. Aussenegg, Metal nanoparticle gratings: Influence of dipolar particle interaction on the plasmon resonance. Physical Review Letters, 2000. 84(20): p. 4721-4724.
90
Chapter 5: Computational modeling for near-field and far-field investigations of non-spherical triangular particles
5.1 INTRODUCTION
The classical electromagnetic theory of spherical particles has been well known
for a century with Maxwell's equations and Mie theory [1-3]. The unique optical,
electrical, and chemical properties of noble metals such as silver or gold have been
attractive for use in biochemical sensing and detection with localized surface plasmon
resonances [4-6]. Mie theory explains clearly the size dependence of the localized surface
plasmon resonance in the spherical MNPs [1].
Recently with advanced nanotechnology, more complicated non-spherical MNPs
have been made and characterized by chemical synthesis [7-9] and lithographic
techniques[10-12]. However, Mie theory can't explain the electromagnetic field for
complicated non-spherical MNPs with sharp features. Many experimental results have
shown that the LSPR of the non-spherical MNPs is very dependent on size [10, 13-15],
shape [13, 14, 16], dielectric environment [13, 17, 18], and material [19, 20]. Many
theoretical tools such as the discrete dipole approximation (DDA) [17, 21, 22], finite
difference time domain (FDTD) [23-25], finite element method (FEM) [26, 27], and T-
matrix method [3] have been used to understand the unique properties of the LSPR of
non-spherical MNPs.
Among these methods, both FEM and FDTD initially have unknown electric and
magnetic fields at the finite elements, or mesh nodes. To limit the number of unknown
fields at mesh nodes, FEM and FDTD must be implemented in a finite computational
domain due to finite computational accuracy, time, and resources. As the computational
91

technology has advanced, FDTD and FEM have become powerful space- and time-
dependent calculation methods for the electromagnetic fields around non-spherical
MNPs. The space and time iteration method both in FDTD and FEM provides convenient
graphic user interfaces with modern powerful computational resources. FEMLAB 3.3a®
as FEM and XFDTD® as FDTD tool were used here to understand the LSPR
characteristics of the non-spherical MNPs in the near-field and the far-field and the
influence of the substrate that the MNPs are in contact with in NSL and in UNSL. The
corresponding experimental results are covered in chapter 4 in this dissertation. For this
calculation, an Intel® Xeon® Quad core 64 bit CPU and 8GB memory were used.
5.2 THEORETICAL METHODS
Numerical calculations using the finite-element package FEMLAB and the finite-
difference-time-domain package XFDTD require a virtual boundary to limit the size of
computational space, which is limited by computer resources. One way to define the
computational boundary is to create absorbing boundary conditions (ABCs). The ABCs
keep the scattering or total field calculations accurate and prevent unwanted spurious
reflections. This is most effectively achieved by the perfectly matched layer (PML)
method, the most popular condition to create ABCs in FEM and FDTD [25, 28]. If a
wave is propagating in medium A and it impinges on medium B, the reflection Γ is
determined by the impedance difference of the two media as
BA
BA
ηηηη
+−
=Γ (5.1.1)
where A
AA ε
µη = and
B
BB ε
µη = are the intrinsic impedances with magnetic
permeability µ and electric permittivity ε of the medium A and B, respectively.
92

The complex permittivity and the complex permeability can be described as
ωσ
εε εj+=∗ , ω
σµµ µj+=∗ [29], with the electric conductivity εσ , the magnetic
loss µσ , and angular frequency ω . Thus, the intrinsic impedance in the medium B is
rewritten as )1(
)1(
BB
BB
B
j
j
ωεσ
ε
ωµσ
µη
ε
µ
+
+= .
If we set an impedance matching condition as
BA εε = (5.1.2)
BA µµ = (5.1.3)
BB εσ
µσ εµ = (5.1.4)
This yields the conditions BA ηη = and 0=+−
=BA
BA
ηηηη
ε
Γ , and a reflection-free
interface between the medium A and the medium B for the impinging wave, regardless of propagation direction or wavelength, is achieved. As σ and µσ in the medium B
increase, Bη is equal to Aη because of the impedance matching condition.
In a PML medium, the electric conductivity is assumed as an m-power parabolic
profile as [28] m
dxx
)( 0max
−= σσ ε (5.1.5)
where x is the distance from the beginning of the PML, is the thickness of the PML
medium, and m = 2 is most often used.
d
93

maxσ
εσ
PML region
Computation region
PML starting point, x0
x-x0
d
Figure 5.1.1 : The electric conductivity continuity between computational region and
PML region. The conductivity is expressed as m
d)( 0
max= σσ εxx −
. As the
conductivity increases, the reflection Γ at the interface is reduced, as shown by equation 5.1.4 and equation 5.1.1.
A material parameter like the relative permittivity, rε , generally is dispersive and
varies as a function of frequency. The real part of the complex permittivity is negative for
metals. FDTD requires time responses of the electric field and the magnetic field in the
dispersive medium. However, time domain calculations like FDTD for Maxwell's
equations are unstable when using negative values in a complex permittivity. One
alternative to avoid negative permittivity for use in FDTD is to work in Fourier space
with a frequency dependent dielectric constant and conductivity. Introducing a
frequency-dependent conductivity into Maxwell's equation allows accurate wide
frequency computation of the transient electromagnetic field with FDTD for negative-
index materials in the frequency domain [23, 24, 30].
94
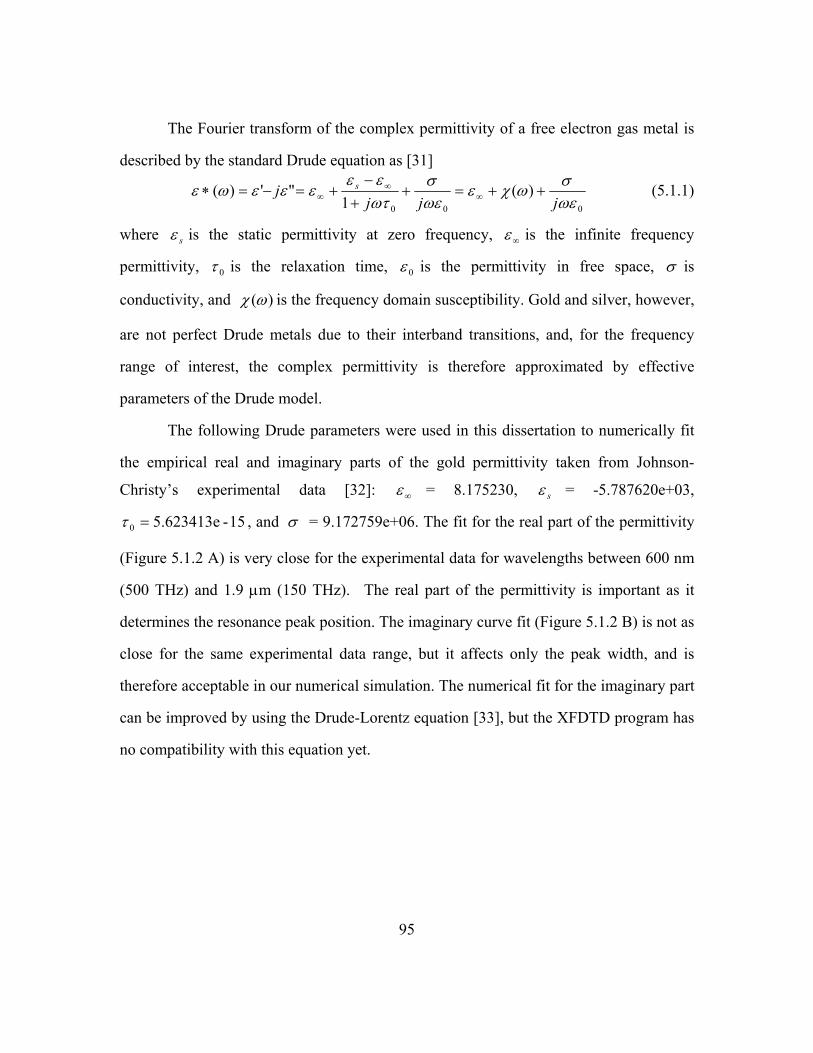
The Fourier transform of the complex permittivity of a free electron gas metal is
described by the standard Drude equation as [31]
000
)(1
"')(ωεσωχε
ωεσ
ωτεε
εεεωεjjj
j s ++=++
−+=−=∗ ∞
∞∞ (5.1.1)
where sε is the static permittivity at zero frequency, ∞ε is the infinite frequency
permittivity, 0τ is the relaxation time, 0ε is the permittivity in free space, σ is
conductivity, and )(ωχ is the frequency domain susceptibility. Gold and silver, however,
are not perfect Drude metals due to their interband transitions, and, for the frequency
range of interest, the complex permittivity is therefore approximated by effective
parameters of the Drude model.
The following Drude parameters were used in this dissertation to numerically fit
the empirical real and imaginary parts of the gold permittivity taken from Johnson-
Christy’s experimental data [32]: ∞ε = 8.175230, sε = -5.787620e+03,
15-5.623413e0 =τ , and σ = 9.172759e+06. The fit for the real part of the permittivity
(Figure 5.1.2 A) is very close for the experimental data for wavelengths between 600 nm
(500 THz) and 1.9 µm (150 THz). The real part of the permittivity is important as it
determines the resonance peak position. The imaginary curve fit (Figure 5.1.2 B) is not as
close for the same experimental data range, but it affects only the peak width, and is
therefore acceptable in our numerical simulation. The numerical fit for the imaginary part
can be improved by using the Drude-Lorentz equation [33], but the XFDTD program has
no compatibility with this equation yet.
95

Figure 5.1.2 : Real (A) and imaginary parts (B) of permittivity of gold and the associated fit curves. Blue lines are experimental data [32] and the best fit curves (red lines) were obtained from a Drude model for wavelengths from 600 nm to 1.9 µm (from 1.5e2 THz to 5e2 THz) with the following parameters ∞ε = 8.175230,
035.787620e +−=sε , 0τ = 5.623413e-15, and σ = 9.172759e+06.
Because most measurements are performed with UV-Vis spectroscopy, the
scattering or extinction spectra for the far-field need to be calculated to allow for
comparisons between model and experiment. Using the near-field data obtained from
FDTD and FEM calculations, it is possible to perform a near-to-far-field transformation.
This means there is no need to extend the FDTD or FEM grid to the far-field range. It can
be shown that the far-field calculation is determined by the interference of the tangential
components of the electric and magnetic fields on a virtual surface completely
surrounding the scattering object. As mentioned earlier in chapter 2, the transformation
that relates the local fields on the sphere to the far field at the point p is:
∫ ⋅××−××= dSrrjkHnrEnrjk
E oooooo
p )exp()]([4
ηπ
(2.4.5)
where is the unit vector pointing from the origin to the field point p, is the unit
normal to the surface S,
or n
oη is the free space impedance, k is the free space wave
number, is the radius vector of the surface S. The far field point p is taken normally at
1 m with spherical coordinate position
o
r
θ and φ . The far field intensity pattern is given
by . 2|p| E 96
5.3 RESULTS AND DISCUSSION
5.3.1 Rayleigh scattering for a dielectric sphere
We tested both FDTD and FEM programs with Rayleigh scattering test spheres.
As an example, the 3D FDTD calculation is shown for polystyrene spheres (radius 40 nm
and 150 nm, refractive index, n = 1.56) in Figure 5.2.1B, and the typical Rayleigh
scattering cross section profile of 4
1λ
σ ∝s is produced for the sphere that is small
compared to the wavelength. As the sphere size approaches the size of the wavelength,
there is significant interference between the light emanating from different locations on
the particle (Figure 5.2.1 A), and Mie scattering is found. Figure 5.2.1 C shows the far-
field calculation at wavelengths of 200 nm, 300 nm, and 800 nm for the polystyrene
(radius = 150 nm) to show the interference.
97

260x10-9
240
220
200
180
Ext
inct
ion
[arb
it.u.
]
800700600500400300200Wavelength [nm]
'300nm_polystyrene'
(A)
50x10-9
40
30
20
10
Ext
inct
ion
[arb
it.u.
]
800700600500400300200Wavelength [nm]
'80nm_polystyrene'
(B)
Figure 5.2.1: Calculated spectra of the scattering for a polystyrene sphere (n = 1.56). (a) polystyrene diameter, D = 300 nm, (b) D = 80 nm. (c) Illustration of the far-field scattering amplitude for the D = 300 nm polystyrene sphere at different wavelengths. (C.1) Polystyrene sphere image. Far-field scattering at 200 nm (C.2), 300 nm (C.3), and 800 nm (C.4) wavelength. As the wavelengths approaches the particle size, there is interference between light emanating from different areas of the particle. White arrows indicate the directions of the main lobe of the far-field. Green, blue, red arrows are x, y, z axes. 3D FDTD simulation was used for the numerical calculation.
5.3.2 Far-field calculation for a free-standing truncated tetrahedron gold MNP in air
98
Figure 5.3.1 (A) shows the calculated extinction spectrum for a gold truncated
tetrahedron MNP (b = 20 nm, h = 117 nm) using a 3D FDTD calculation. The free-
standing tetrahedron shows a resonance peak position at 740 nm wavelength (red empty
circle in Figure 5.3.1 A). This peak position is blue-shifted about 200 nm compared to

our experimental result, which is shown in Figure 4.3.1 in chapter 4. This large difference
in peak position is due to the influence of the substrate in the experimental configuration.
DDA calculations have previously shown that the influence of the substrate is crucial in
obtaining the correct resonance peak position [13]. Those calculations showed that, as the
MNP is embedded into a substrate from free standing to fully embedded in the substrate,
the resonance peak position shifts to red. The influence of the substrate will be
investigated further in section 5.3.4 below.
To calculate the local refractive index sensitivity of the particle, a 2 nm thick
hexadecanethiol (HDT) layer (ε = 2.1) was applied to the gold MNP surface, which
corresponds to the exposed surface of a gold UNSL MNP (Figure 5.3.1 B). The peak shift
is 30 nm from 740 nm to 770 nm wavelength (blue filled circle in Figure 5.3.1 A). This
calculation matches our experimental peak shift result as shown in Figure 4.5.2 in chapter
4, although the absolute positions are different due to the substrate influence. The particle
size was h = 117 nm and b = 20 nm in the experiment.
XFDTD® allows only for an air environment in the numerical calculation, and
FEMLAB® calculations with a bulk dielectric ambient are also inaccurate. Using the
relative refractive index can address homogeneous environments. For half-spaces, such as
for simulating the water-glass interface, disturbances arise, and therefore the glass
medium is approximated in this thesis by a thin layer rather than the full space.
99

14x10-9
12
10
8
6
4
Ext
inct
ion
[arb
it.u.
]
900800700600500Wavelength [nm]
'Au tetrahedron free standing' HDT functionalized Au tetrahedron
(A)
Figure 5.3.1 : 3D FDTD calculation for extinction spectra of a gold truncated tetrahedron particle with and without hexadecanethiol (HDT) surface modification on a gold MNP. (a) The plasmon resonance of a truncated gold tetrahedron particle is at 740 nm in air as in the free standing case (red empty circle and red fit curve). After HDT binding to the gold surface, the plasmon peak shifts to red to 770 nm (blue filled circle and blue fit curve). This corresponds to the 30 nm of the peak shift we found experimentally. (b) Illustration of the gold nanoparticle with a HDT layer used in the calculation. The particle bisector is h = 117 nm and thickness = 20 nm.
5.3.3 Near-field intensity distribution near the sharp features of non-spherical MNPs
FEMLAB and XFDTD simulation were used to study the near-field enhancement
in 2D and 3D for the non-spherical gold MNPs. The 2D triangular shape corresponds to
the bottom and the top of the truncated tetrahedron, and the plane wave propagates into
the plane (Figure 5.4.1). The triangle size is h = 117 nm and the side length a = 135 nm
(equilateral triangle). The resonance peak wavelength 740 nm (Figure 5.3.1) was used for
the near-field polarization study.
As the polarization direction of the light is changed, the distribution of the near-
field calculation, especially at the corners of the triangle, is changed (Figure 5.4.1 A and
B). The field enhancement always exists along the polarization direction. This agrees 100

with reports of other numerical calculations [13, 22]. Similarly, in 3D the polarization
direction also determines the location of the near-field enhancement on the non-spherical
nanoparticle (Figure 5.4.1 C and D). Un-polarized light interaction with the triangle is the
sum of these two polarized excitations, thus it must show high field enhancement at three
corners (not shown here).
Figure 5.4.1: Near-field enhancement simulation with triangular MNPs, with the light propagating into the plane. (a) and (b) show 2D out-of-plane FEMLAB simulations at
The influence of sharp corners in the near-field and far-field was studied with 2D
FEMLA
position shifts to the blue at 540 nm (green line, (2)). For comparison, a gold sphere with
740nm for the triangle surface with two different linear polarization directions of the incident light along the two different symmetry axes. (c) and (d) show 3D XFDTD simulations for the same polarized light excitations. Pairs (a) and (c) and (b) and (d) are in the same polarized light direction, respectively. Each near-field enhancement exists only in the polarization direction of the incident light. Red color in (a),(b),(c), and (d) indicates the maximum of E-near field..
B calculations. 2D FEMLAB allows far-field calculations only in the in-plane
mode (propagation in the plane), but not in the out-of-plane mode (propagation into the
plane) simulation. Therefore, in-plane simulations in 2D FEMLAB were used to
investigate the far-field and the near-field distribution around the sharp corners in the
triangle, although this is not the experimental situation. An equilateral gold triangle
(h = 117 nm) was used to show the scattering spectra for the gold triangle, rounded
triangle, and gold sphere with radius 50 nm (Figure 5.4.2). As the gold triangle with the
in-plane resonance peak position at 560 nm (red line, (1)) becomes rounded, the peak
101

50 nm radius and equal cross-sectional area has the resonance peak position at 520 nm.
The geometrical shape influence on the spectral position corresponds with others'
experimental results [16] and DDA calculations [22]. DDA calculations showed that as
the sharp edges of triangular prisms are snipped, the resonance peak shifts to the blue
[13].
3.0x10⁶ (1)
2.5
2.0
1.5
1.0
0.5
Ext
inct
ion
[arb
it.u.
]
700650600550500450400Wavelength [nm]
(1) Au triangle (2) Au snipped triangle (3) Au sphere
(2)
(3)
Figure 5.4.2 : Simulation of the influence of the shape on the scattering by gold MNPs. (1) Scattering by a gold triangle (bisector h = 117 nm, side length is a = 135 nm) with the resonance peak position at 560 nm (red curve). (2) As the gold triangle MNP
unded, the peak position shifts to the blue to 540 nm (green curve). (3) For
is shown in Figure 5.4.3. The propagation direction of the incident light is in the x
directio
becomes rocomparison, a gold sphere with 50 nm radius, which has the same cross-sectional area as the triangle has the resonance peak position at 520 nm (blue curve) The numerical calculation was done with a 2D FEMLAB simulation.
The near-field distribution corresponding for the spectrum analysis in Figure 5.4.2
n. The E fields exist only in the y direction (y-polarized). The resonance
wavelengths were chosen to investigate the maximum near-field intensity. The
maximum || E from the gold triangle is 5092 V/m at 560 nm wavelength
(Figure 5.4.3 A). When the particle edges become rounded, the maximum near-field
intensity drops to 2349 V/m at the resonance peak position of 540 nm (Figure 5.4.3 B).
102

Figure 5.4.3: Illustrarounded edges. The m
The maximum near-field value from a 50 nm gold sphere is 935 V/m at 520 nm
wavelength (Figure 5.4.3 C). The field around the triangle is enhanced by 544 % over the
sphere, but the field from the slightly rounded triangle is reduced by 46 % from the
snipped triangle. The || E of incoming E field is 376 V/m. Thus, it is clear that non-
spherical MNPs have a much higher near-field intensity, which agrees with data shown
by Schatz's group [34]. The maximum field intensity at the tip of the particle determined
from a 2D FEMLAB in-plane calculation exists along the polarization direction, which is
consistent with other reports [22, 34] and our simulations (Figure 5.4.1).
tion of
the electric near-field enhancement at sharp and aximum || E at the gold triangle of e size as the
sphere is 5092 V/m at 560 nm velength (a). The maximum field at the rounded
5.3 flu non-spherical MNPs
NSL and UNSL MNPs are in close contact with a substrate, which influences the
stribution
around
|| E the sam
wa
wtriangle is 2349 V/m at 540 nm wavelength (b). The maximum field of a 50 nm radius gold sphere is 935 V/m at 520 nm avelength (c). The field around the triangle is enhanced 544 % over the sphere, but the field from the slightly rounded triangle is reduced by 46 %. Wavelengths used for each simulation are at the resonance peak position. The || E of incoming E field is 376 V/m.
.4 Substrate in ence of the near-field intensity of
local field and possibly the sensitivity. Therefore understanding the near-field di
the corners and edges, the E-field enhancement and the relationship between the
near-field and the far-field calculation is important. How the interaction with a substrate
103

close to MNPs influences the near-field distribution is also a very important aspect in
understanding plasmonic sensors.
To investigate the near-field distribution in 2D in various geometrical settings, a
cross-s
e peak position
shifts t
UNSL and NSL MNPs show
corresp
ectional study is useful. A 2D FEMLAB in-plane calculation was used, because
the scattering calculation is only reliable in 2D FEMLAB in-plane mode. We simulated
the near-field and far-field changes induced by a glass substrate, simulated as a 40 nm
thick and 234 nm long slab at different particle positions relative to the substrate. Figure
5.5.1 shows the substrate influence on the scattering cross-section on a gold MNP with
h = 117 nm. A free-standing Au tetrahedron cross-section has the resonance peak at
590 nm wavelength (Figure 5.5.1 (1)). This is blue-shifted from our 3D FDTD
calculation result (Figure 5.3.1) presumably due to the restriction to 2D.
As the gold MNP approaches the glass substrate, the resonanc
o the red, in qualitative agreement with DDA calculations [13]. An UNSL-Au
MNP has a red-shifted peak position at 640 nm compared to the free standing
(Figure 5.5.1 (2)). a NSL-Au MNP at 645 nm (Figure 5.5.1 (3)), and a Au tetrahedron
MNP which is flipped relative to the glass substrate (called "flipped NSL-Au") at 635 nm
(Figure 5.5.1. (4)). Therefore, no matter how the gold MNP touches the glass substrate,
the resonance peak positions of these particles are close.
The experimental resonance peak positions of Au
onding results (Figure 5.5.1 B). Au NSL MNPs (h = 117 nm, b = 25 nm) have a
resonance peak position at 860 nm wavelength, while Au UNSL MNPs (bisector h =
17 nm, b = 25 nm) have a resonance peak position at 887 nm wavelength. The difference
of 27 nm between the peak positions of UNSL-Au and NSL-Au is also relatively small.
The difference in absolute peak positions for the measured data (Figure 5.5.1 B) and the
3D calculated data of a free-standing UNSL-Au MNP (Figure 5.3.1 A) is understood as
104

the substrate influence in the experiment, which causes the red-shifted resonance peaks.
A 3D DDA calculation showed that the substrate can induce about 100 nm of red-shift
[13], while our 2D FEMLAB in-plane calculation shows a 50 nm red shift.
6x10⁶ Au free standing Au UNSL
(1)(2)
(2) (A) 0.16 (B)
5
4
3
2
1
Sca
tter
ing
Eff
icie
ncy
[arb
it.u.
]
700600500400Wavelength [nm]
Au NSL Au flipped NSL
(3)(4)
(1)
(3)
(4)
0.14
0.12
0.10
0.08
0.06
0.04
0.02
Abs
orpt
ion
[arb
it.u.
]1000900800700600
Wavelength [nm]
NSL Au UNSL Au
Figure 5.5.1: Calculated scattering data and measured absorption data for the substrateinfluence on the extinction spectra for various gold MNP positions relative to the
lthough there is a small influence from the orientation of the MNP relative to the
substra
glass substrate. (A) (1) Au nanoparticle free-standing in air. The resonance peak position is at 590 nm (2) Au UNSL in air with the resonance peak position at 640 nm (3) Au NSL in air with the resonance peak position at 645 nm (4) Au flipped NSL in air with the resonance peak position at 635 nm. The particle thickness was 20 nm, the bisector of the bottom surface was 117 nm, and the bisector of the top surface was 103 nm. 2D FEMLAB in-plane calculation was used. (B) Measured absorption spectra for UNSL-fabricated Au and NSL-fabricated Au (bisector = 117 nm, thickness = 25 nm). UNSL-Au has a resonance peak positions at 887 nm wavelength and NSL-Au at 860 nm wavelength.
A
te in the far-field, this is not true in the near-field calculation. 2D FEMLAB in-
plane simulations allow us to investigate the near-field of a UNSL-Au MNP in a cross-
sectional view. The cross-section of a truncated tetrahedron is shown in Figure 5.5.2 and
shows the maximum E-field at the near-field with various substrate positions. The
105

polarization of the E-field in Figure 5.5.2 corresponds to the polarization in
Figure 5.4.1 B and D.
For the free-standing MNP, the maximum E-field intensity is at the
longest side with the sharper corners, which is the bottom face of the truncated
tetrahedron (Figure 5.5.2 A). This is our sensing surface as the exposed surface of UNSL-
fabricated MNP. The free-standing MNP has = 6607 V/m at 590 nm wavelength,
which is the resonance peak position (Table 5.1 and Figure 5.5.1 A). For a UNSL-Au
MNP, = 4999 V/m is located at the same geometrical position of the particle, but
now at the air/glass interface (Figure 5.5.2 B). Interestingly, the smaller completely
embedded side also has a higher field compared to the free-standing MNP. This is due to
the field confinement at the interface and is not found in NSL-Au on the surface pointing
away from the substrate. For NSL-Au MNPs, | = 8371 V/m at 645 nm at the
air/glass interface and also at the same geometrical position (Figure 5.5.2 C). When an
NSL-Au MNP is flipped on the glass substrate, which is called "flipped NSL-Au" here,
the position of | is changed to the smaller side, which is the top face of the
truncated tetrahedron and in contact with he air/glass interface (Figure 5.5.2 D), thereby
always staying close to the glass interface. of the flipped NSL-Au is 6586 V/m at
635 nm wavelength.
max|| E
max|| E
|E
max|E
max|| E
max
max|E
|
This cross-sectional near-field analysis of the influence of the substrate provides
valuable information. First, it shows that maximum always exists on the sharp
edges or corners at the resonance wavelength (Table 5.1 and Figure 5.5.2). Second, the
is always at the medium interface such as air/glass. Third, the location of
is not dependent on the incident wavelength. Every | value was
calculated for the whole spectrum, and the location of | did not change (
Table 5.1).
max|| E
max|| E
max|| E max|E
max|E
106

Figure 5.5.2: Substrate influence on the near-field distribution in cross-sectional view. (a) Free-standing Au pyramid in air at 590 nm wavelength. (b) UNSL-Au pyramid in the glass/ air interface at 640 nm wavelength. (c) NSL-Au pyramid at the glass/air interface at 645 nm wavelength. (d) Flipped NSL-Au pyramid at the glass/air interface at 635 nm wavelength. The pyramidal particle has a thickness of 20 nm, a bisector of the bottom surface of 117 nm, and a bisector of the top surface of 103 nm. Red color indicates the highest field intensity and blue color indicates the lowest field intensity.
Table 5.1 Maximum near field intensity, | , for various geometrical conditions.
Measured at the same location on the MNP .
max|E
Wavelength
(nm)
Free standing
(V/m)
UNSL (V/m) NSL (V/m) Flipped NSL
(V/m)
590 6607 3573 5106 4512
630 5957 4924 8005 6539
635 5830 4976 8197 6585
640 5704 4999 8319 6579
645 5581 4996 8371 6526
650 5461 4969 8358 6434
107

Figure 5.5.3 shows the near-field enhancement at the substrate interface for a
NSL-Au MNP and a UNSL-Au MNP in cross-sectional view. The enhanced fields are
located at the tips and close to the interface between glass and air. To compare the near-
field intensities for NSL and UNSL MNPs close to the edges, we analyzed the field 2 nm
and 5 nm away from the surface of the MNP along a line indicated in Figure 5.5.3. The
maximum near-field is 4950 V/m at 2 nm distance from the NSL-Au MNP, while the
maximum near-field is 2792 V/m at 2 nm distance from the UNSL-Au MNP. The
maximum near-field intensity 2 nm from the MNP is about 177 % higher for the NSL-Au
MNP than for the UNSL-Au MNP (Figure 5.5.3 C). In Figure 5.5.3 C and D the solid line
indicates the transition from air to glass for NSL, and the end of the UNSL particle, and
both transitions have been aligned. As the distance from the particle is increased, the
maximum near-field is reduced in both cases to 2600 V/m at 5 nm distance from the
NSL-Au MNP, while the maximum near-field is reduced to 1800 V/m at 5 nm distance
from the UNSL-Au MNP. The maximum near-field intensity at 5 nm distance from the
MNP is still 144 % higher for the NSL-Au MNP than for the UNSL-Au MNP
(Figure 5.5.3 D). The near-field decays faster laterally with distance from the edge of the
NSL-Au MNP than for the UNSL-Au MNP at both 2nm and 5 nm distance from the
MNP surface. Therefore, NSL-Au MNP has higher near-field than UNSL-Au MNP but
the near-field in NSL-Au MNP drops more quickly. However, in reality this sharp edge is
not easy to preserve in chemical solvents, which induce shape changes and reduce the
sensitivity [7].
108

4500
4000
3500
3000
2500
2000
Nea
r fie
ld in
tens
ity [V
/m]
62x10-9605856545250 Distance [nm]
Nearfield_UNSL Nearfield_NSL (C)
Air Glass
Au
2600
2400
2200
2000
1800
1600
Nea
r fie
ld in
tens
ity [V
/m]
-6x10⁻⁹ -4 -2 0 2 4Distance [nm]
'Nearfield_NSL' 'Nearfield_UNSL'
Air
Au
Glass
(D)
Figure 5.5.3: Cross-section of the near-field distribution at the air/glass interface for a NSL-Au MNP and a UNSL-Au MNP. (a) Near-field distribution of NSL-Au MNP with =8371 V/m at the resonance wavelength of 645 nm. (b) Near-field distribution of UNSL-Au MNP with | = 4999 V/m at the resonance wavelength of 640 nm. (c) Near-field intensity at 2 nm distance from both an UNSL (dotted line) and a NSL Au MNP (solid line), which shows a about 177 % higher for NSL-Au than for UNSL-Au. (d) Near-field intensity at 5 nm distance from both an UNSL (dotted line) and a NSL Au MNP (solid line), which shows a about 144 % higher for NSL-Au than for UNSL-Au. A solid line is shown to indicate the interface between air to glass in NSL-Au MNP and the end of the UNSL MNP.
max|| Emax|E
|| E
|| E
max
max
109

5.4 CONCLUSIONS
Numerical calculations with FEM and FDTD simulations help us to understand
what influences the LSPR in non-spherical MNPs. Our 3D FDTD calculation for the
local refractive index sensitivity with an HDT layer supports our experimental results.
The 3D FDTD and 2D FEM show that the polarization direction of the incoming light
determines the polarization and near-field distribution on the non-spherical MNP. A 2D
FEMLAB in-plane simulation was used to investigate the influence of the rounding of
sharp features on LSPR peak position. As the sharp features become rounded, the LSPR
peak position shifts to blue and is also greatly reduced. max|| E
2D FEM were used for in-plane simulations, which easily display the geometrical
influence on the LSPR, and provides explanations for the substrate influence. 2D
FEMLAB in-plane cross-sectional investigations show that there is significant interaction
between a substrate and the Au MNP. The substrate influences the | intensity
and even the position of on the MNP. always exists on the substrate
interface. Thus, | can be found at the interface with the substrate and the
polarization direction. If there is no substrate, then exists at the sharpest angles
of the truncated tetrahedron MNPs.
max|E
max|| E max|| E
|| E
max|E
max
A near-field analysis of the MNPs in cross-section shows that a NSL-Au MNP
has higher near-field intensity than an UNSL-Au MNP due to the field confinement at the
substrate. As the distance from the MNP is increased, the high near-field distribution
around an NSL-Au MNP drops more quickly than for an UNSL-Au MNP. Therefore,
these MNP geometrical aspects and the substrate contribution should be considered to
optimize non-spherical MNP plasmonic sensors.
5.5 REFERENCES
110
1. Huffman, D.R. and C.F. Bohren, Absorption and Scattering of Light by Small Particles. 1998, New York: John Wiley & Sons.
2. Kreibig, U. and M. Vollmer, Optical Properties of Metal Clusters. 1995, Berlin: Springer.
3. Mishchenko, M.I., L.D. Travis and A.A. Lacis, Scattering, Absorption, and Emission of Light by Small Particles 2002: Cambridge University Press.
4. Englebienne, P., Use of colloidal gold surface plasmon resonance peak shift to infer affinity constants from the interactions between protein antigens and antibodies specific for single or multiple epitope. Analyst, 1998. 123: p. 1599-1603.
5. Mirkin, C.A., R.L. Letsinger, R.C. Mucic and J.J. Storhoff, A DNA-based method for rationally assembling nanoparticles into macroscopic materials. Nature, 1996. 382(6592): p. 607-609.
6. Englebienne, P., A.V. Hoonacker and J. Valsamis, Rapid Homogeneous Immunoassay for Human Ferritin in the Cobas Mira Using Colloidal Gold as the Reporter Reagent. Clinical Chemistry, 2000. 46: p. 2000-2003.
7. Sherry, L.J., S.H. Chang, G.C. Schatz, R.P. Van Duyne, B.J. Wiley and Y.N. Xia, Localized surface plasmon resonance spectroscopy of single silver nanocubes. Nano Letters, 2005. 5(10): p. 2034-2038.
8. Perez-Juste, J., I. Pastoriza-Santos, L.M. Liz-Marzan and P. Mulvaney, Gold nanorods: Synthesis, characterization and applications. Coordination Chemistry Reviews, 2005. 249(17-18): p. 1870-1901.
9. Nehl, C.L., N.K. Grady, G.P. Goodrich, F. Tam, N.J. Halas and J.H. Hafner, Scattering spectra of single gold nanoshells. Nano Letters, 2004. 4(12): p. 2355-2359.
10. Hulteen, J.C., D.A. Treichel, M.T. smith, M.L. Duval, T.R. Jensen and R.P. VanDuyne, Nanosphere Lithography: Size-Tunable Silver Nanoparticle and Surface Cluster Arrays. J. Phys. Chem B, 1999. 103: p. 3854-3863.
11. Haynes, C.L. and R.P. Van Duyne, Nanosphere lithography: A versatile nanofabrication tool for studies of size-dependent nanoparticle optics. Journal of Physical Chemistry B, 2001. 105(24): p. 5599-5611.
12. Frey, W., C.K. Woods and A. Chilkoti, Ultraflat nanosphere lithography: A new method to fabricate flat nanostructures. Advanced Materials, 2000. 12(20): p. 1515-1519.
13. Kelly, K.L., E. Coronado, L.L. Zhao and G.C. Schatz, The optical properties of metal nanoparticles: The influence of size, shape, and dielectric environment. Journal of Physical Chemistry B, 2003. 107(3): p. 668-677.
14. Foss, C.A., J.G.L. Hornyak, J.A. Stockert and C.R. Martin, Template Synthesized nanoscopic Gold Particles: Optical spectra and the effects of particle size and shape. J. Phys. Chem, 1994. 98: p. 2963-2971.
15. Xiong, Y.J., J.Y. Chen, B. Wiley, Y.A. Xia, Y.D. Yin and Z.Y. Li, Size-dependence of surface plasmon resonance and oxidation for pd nanocubes synthesized via a seed etching process. Nano Letters, 2005. 5(7): p. 1237-1242.
16. Mock, J.J., M. Barbic, D.R. Smith, D.A. Schultz and S.Schultz, Shape effects in plasmon resonance of individual colloidal silver nanoparticles. Journal of Chemical Physics, 2002. 116: p. 6755-6759.
111
17. Miller, M.M. and A.A. Lazarides, Sensitivity of metal nanoparticle surface plasmon resonance to the dielectric environment. Journal of Physical Chemistry B, 2005. 109(46): p. 21556-21565.
18. Mock, J.J., D.R. Smith and S. Schultz, Local refractive index dependence of plasmon resonance spectra from individual nanoparticles. Nanoletters, 2003. 3(4): p. 485-491.
19. Haes, A.J., S.L. Zou, G.C. Schatz and R.P. Van Duyne, A nanoscale optical biosensor: The long range distance dependence of the localized surface plasmon resonance of noble metal nanoparticles. Journal of Physical Chemistry B, 2004. 108(1): p. 109-116.
20. Haes, A.J., S.L. Zou, G.C. Schatz and R.P. Van Duyne, Nanoscale optical biosensor: Short range distance dependence of the localized surface plasmon resonance of noble metal nanoparticles. Journal of Physical Chemistry B, 2004. 108(22): p. 6961-6968.
21. Jain, P.K., K.S. Lee, I.H. El-Sayed and M.A. El-Sayed, Calculated absorption and scattering properties of gold nanoparticles of different size, shape, and composition: Applications in biological imaging and biomedicine. Journal of Physical Chemistry B, 2006. 110(14): p. 7238-7248.
22. Hao, E. and G.C. Schatz, Electromagnetic fields around silver nanoparticles and dimers. Journal of Chemical Physics, 2004. 120(1): p. 357-366.
23. Young, J.L. and R.O. Nelson, A summary and systematic analysis of FDTD algorithms for linearly dispersive media. Ieee Antennas and Propagation Magazine, 2001. 43(1): p. 61-77.
24. Saj, W.M., FDTD simulations of 2D plasmon waveguide on silver nanorods in hexagonal lattice. Optics Express, 2005. 13(13): p. 4818-4827.
25. Lavrinenko, A., P.I. Borel, L.H. Frandsen, M. Thorhauge, A. Harpoth, M. Kristensen, T. Niemi and H.M.H. Chong, Comprehensive FDTD modelling of photonic crystal waveguide components. Optics Express, 2004. 12(2): p. 234-248.
26. Wang, T.J. and W.S. Lin, Electro-optically modulated localized surface plasmon resonance biosensors with gold nanoparticles. Applied Physics Letters, 2006. 89(17).
27. Grigorenko, A.N., Negative refractive index in artificial metamaterials. Optics Letters, 2006. 31(16): p. 2483-2485.
28. Tsuji, Y. and M. Koshiba, Guided-mode and leaky-mode analysis by imaginary distance beam propagation method based on finite element scheme. Journal of Lightwave Technology, 2000. 18(4): p. 618-623.
29. Cheng, D.K., Fild and Wave Electromagnetics. 2nd ed. 1989, New York: Addison-Wesley.
30. Gray, S.K. and T. Kupka, Propagation of light in metallic nanowire arrays: Finite-difference time-domain studies of silver cylinders. Physical Review B, 2003. 68(4).
31. Kunz, K.S. and R.J. Luebbers, The Finite Difference Time Domain Method for Electromagnetics 1993: CRC.
32. Johnson, P.B. and R.W. Christy, Optical Constants of the Noble Metals Phys. Rev. B, 1972. 6: p. 4370-4379.
112

33. Vial, A., A.S. Grimault, D. Macias, D. Barchiesi and M.L. de la Chapelle, Improved analytical fit of gold dispersion: Application to the modeling of extinction spectra with a finite-difference time-domain method. Physical Review B, 2005. 71(8).
34. Jensen, T., L. Kelly, A. Lazarides and G.C. Schatz, Electrodynamics of noble metal nanoparticles and nanoparticle clusters. Journal of Cluster Science, 1999. 10: p. 295-317.
113

Chapter 6: Outlook
6.1 SUMMARY
Fabrication and characterization of non-spherical truncated tetrahedron MNP
LSPR sensors have been explored in this dissertation. We achieved the following aims in
this dissertation (i) develop a sensor that preserves the sharpness of the MNPs by partially
embedding the particles in a substrate in order to achieve high sensitivity, (ii) optimize
the sensitivity of the non-spherical MNPs by optimizing material and geometric
parameters, (iii) and model the near- and far-fields around the MNPs with numerical
simulations.
Aim (i), the investigation of non-spherical geometrical parameters, is achieved
after developing a new fabrication technique, a carbon-based template-stripping method
with NSL. This new fabrication technique allows us to combine various materials. In this
dissertation, we used only SiO2 , gold, and silver, but other materials have been applied.
This method also allows us to control the non-symmetric geometry of the MNPs and so
tailor the LSPR. We can optimize the sensitivity by controlling the particle thickness and
bisector length. As the particle thickness is thinner, down to 17 nm, the sensitivity is
drastically increased. We can also systematically increase the bisector size of the MNP,
which induces an additional increase of sensitivity. Therefore, a thinner and longer MNP,
one with highly elongated shape, has significantly improved bulk refractive index
sensitivity, achieving nearly 100 nm of peak shift from air (n = 1) to water (n = 1.33). We
achieved a higher sensitivity than any other MNP sensor except gold nanocrescents with
our most sensitive UNSL-Au MNPs, which have 117 nm bisector length and nearly
300 nm/RIU sensitivity. This sensitivity could possibly be even more enhanced by
114

increasing the bisector size until reaching radiation damping. The sensitivities achieved
for the bulk and surface refractive indexes are much higher than those achieved for gold
NSL [1] and equal or higher than silver NSL [2, 3]. Further optimization of the shape
by, for instance, inducing additional edges should allow further increases in sensitivity.
The low sensitivity of silver UNSL is surprising and may be due to a higher importance
of the oxidation at the silver surface in UNSL then in NSL.
Aim (ii) the characterization of an array type sensor for protein detection by
changing the local refractive index, is shown by detecting an HDT monolayer on the
nanopattern and by a multi-layer such as the sequential binding of the biotin-streptavidin
pair. It was possible to detect HDT binding with a 30 nm shift of the peak to the red, and
the binding of streptavidin to the biotinylated monolayer on the sensor from 100 nM
solution. The gold MNP UNSL sensor detected the biotin binding event with 29 nm red
shift and the streptavidin binding event on the biotin layer with 7 nm of red shift in air.
The specific aim (iii), the numerical simulation of the LSPR of a non-spherical
MNP in near- and far-field, was studied by FDTD and FEM, and compared to
experimental results. The numerical calculation, as expected, showed that the field
enhancement is found at the sharp corners and edges. If the sharp corners are snipped,
then the field intensity is significantly reduced and the far-field calculation showed that
the resonance peak positions shift to the blue. These modeling tools also provided
understanding of plasmonic behaviors for the more complicated MNP geometries. The
maximum near-field intensity enhancement directly contributes to the far-field
distribution which is measured with an UV-Vis spectrometer. The wavelength which
induces the maximum near-field at a sharp corner is also the resonance peak position in
the far-field calculation. There is substrate influence on the field enhancement due to the
field confinement between the substrate and the particle. NSL-Au MNPs have a
115

significant substrate influence, which induces the higher near-field intensity due to the
field confinement between the substrate and the sharp edges of the Au-MNP, while
UNSL-Au MNPs have less near-field intensity because it has a different substrate
position. However, in practical situation, NSL-Au MNPs lose the benefit from this field
confinement, because of not being able to preserve sharpness in a chemical environment.
It is not shown whether or not there is a direct relationship between the enhanced
near-field distribution and the increased sensitivity. This should be covered in future
works.
6.2 FUTURE WORKS
There are still roads untaken in plasmonics, such as the tailoring of the light-metal
material interaction by inducing more complicated shapes of the MNP. However, there
are some limitations to systematically control MNP shapes and sizes in lithography,
which restrict the understanding of non-conventional plasmonics in complicated
geometrical situation. The new fabrication technique used in this dissertation may open a
chance to implement non-conventional plasmonics [4-7] and possibly exploit the
extraordinary transmission phenomenon [8] with a combination of different materials
such as silver and gold combinations, or other metallic material mixtures [9-11], and
systematically changing the geometric shapes and positions [12]. Thus, the non-
conventional plasmonics should be explored with this new fabrication technique.
Changing more complicated sharp features in the MNP shape is expected to
change sensitivity in different ways. Therefore, using not only the NSL method, but also
other lithography methods such as Step and Flash Imprint Lithography (SFIL) [13] can
provide different approaches to plasmonics. Combining the carbon-based template
stripping method with SFIL will provide new types of non-spherical shaped arrays.
116

This thesis has explored immobilized MNPs so far, but a single non-spherical
MNP can be useful as an image contrast agent. However, the sharp features of non-
spherical MNPs are often easily rounded in solvents [14, 15]. Using the carbon-based
template stripping method mentioned in this dissertation will provide opportunities to
make free-standing non-spherical MNP with protection in chemical solvents.
FEMLAB 3.3a® and XFDTD® have some limitations in dielectric environment
modeling. These tools are solid for modeling of air as a medium, but have difficulties
with complex environments. This limits the study of the bulk refractive index sensitivity
for the partially embedded non-spherical MNPs. A proper formulation of the boundary
conditions in sections of the space should allow a more accurate description of the
influence of the substrate and the enhancement of the local fields at interfaces. The direct
relationship between the enhanced near-field and the increased sensitivity is not
investigated thoroughly yet, due to the limitation to air as a medium in the modeling.
Therefore, as soon as this limitation is resolved, the relationship between the enhanced
near-field distribution and the increased sensitivity will be explored.
6.3 REFERENCES 1. Haes, A.J., S.L. Zou, G.C. Schatz, and R.P. Van Duyne, A nanoscale optical
biosensor: The long range distance dependence of the localized surface plasmon resonance of noble metal nanoparticles. Journal of Physical Chemistry B, 2004. 108(1): p. 109-116.
2. Haes, A.J., S.L. Zou, G.C. Schatz, and R.P. Van Duyne, Nanoscale optical biosensor: Short range distance dependence of the localized surface plasmon resonance of noble metal nanoparticles. Journal of Physical Chemistry B, 2004. 108(22): p. 6961-6968.
3. Jensen, T., M. Duval, K.L. Kelly, A.A. Lazarides, G.C. Schatz, and R.P.V. Duyne., Nanosphere Lithography: Effect of the external dielectric medium on the surface plasmon resonance spectrum of a periodic array of silver nanoparticles. J. Phys. Chem B, 1999. 103: p. 9846-9853.
4. Prodan, E., C. Radloff, N.J. Halas, and P. Nordlander, A hybridization model for the plasmon response of complex nanostructures. Science, 2003. 302(5644): p. 419-422.
117

5. Felidj, N., J. Aubard, G. Levi, J.R. Krenn, G. Schider, A. Leitner, and F.R. Aussenegg, Enhanced substrate-induced coupling in two-dimensional gold nanoparticle arrays. Physical Review B, 2002. 66(24).
6. Takeda, Y., T. Motohiro, T. Hioki, and S. Noda, Nonlinear-Optical Properties Due to the Thermal Effect in a Prism-Coupled Zns Thin-Film. Journal of the Optical Society of America B-Optical Physics, 1995. 12(10): p. 1905-1908.
7. Holland, W.R. and D.G. Hall, Frequency-Shifts of an Electric-Dipole Resonance near a Conducting Surface. Physical Review Letters, 1984. 52(12): p. 1041-1044.
8. Ebbesen, T.W., H.J. Lezec, H.F. Ghaemi, T. Thio, and P.A. Wolff, Extraordinary optical transmission through sub-wavelength hole arrays. Nature, 1998. 391(6668): p. 667-669.
9. Kume, T., N. Nakagawa, S. Hayashi, and K. Yamamoto, Interaction between Localized and Propagating Surface-Plasmons - Ag Fine Particles on Al Surface. Solid State Communications, 1995. 93(2): p. 171-175.
10. TAKEMORI, T., M. INOUE, and K. OHTAKA, Optical Response of a Sphere Coupled to a Metal Substrate. Journal of the Physical Society of Japan, 1987. 56(4): p. 1587-1602.
11. Pinchuk, A., A. Hilger, G. von Plessen, and U. Kreibig, Substrate effect on the optical response of silver nanoparticles. Nanotechnology, 2004. 15(12): p. 1890-1896.
12. Leitner, A., Z.S. Zhao, H. Brunner, F.R. Aussenegg, and A. Wokaun, Optical-Properties of a Metal Island Film Close to a Smooth Metal-Surface. Applied Optics, 1993. 32(1): p. 102-110.
13. Gaubert, H.E. and W. Frey, Highly parallel fabrication of nanopatterned surfaces with nanoscale orthogonal biofunctionalization imprint lithography. Nanotechnology, 2007. 18(13).
14. Sherry, L.J., R.C. Jin, C.A. Mirkin, G.C. Schatz, and R.P. Van Duyne, Localized surface plasmon resonance spectroscopy of single silver triangular nanoprisms. Nano Letters, 2006. 6(9): p. 2060-2065.
15. Jin, R., Y. Cao, C.A. Mirkin, K.L. Kelly, G.C. Schatz, and J.G. Zheng, Photoinduced conversion of silver nanospheres to nanoprisms. Science, 2001. 294: p. 1901-1903.
118
Bibliography
1 Amrein, M., A. Stasiak, H. Gross, E. Stoll, and G. Travaglini, Scanning tunneling microscopy of RECA-DNA complexes coated with a conducting film. Science, 1988. 240(4851): p. 514-516.
2 Amrein, M., R. Durr, A. Stasiak, H. Gross, and G. Travaglini, Scanning tunneling microscopy of uncoated RECA-DNA complexes. Science, 1989. 243(4899): p. 1708-1711.
3 Bergkvist, M., J. Carlsson, and S. Oscarsson, Surface-dependent conformations of human plasma fibronectin adsorbed to silica, mica, and hydrophobic surfaces, studied with use of Atomic Force Microscopy. Journal of Biomedical Materials Research Part A, 2003. 64A(2): p. 349-356.
4 Blackstock, J.J., Z.Y. Li, and G.Y. Jung, Template stripping using cold welding. Journal of Vacuum Science & Technology A, 2004. 22(3): p. 602-605.
5 Blackstock, J.J., Z.Y. Li, M.R. Freeman, and D.R. Stewart, Ultra-flat platinum surfaces from template-stripping of sputter deposited films. Surface Science, 2003. 546(2-3): p. 87-96.
6 Bukasov, R. and J.S. Shumaker-Parry, Highly tunable infrared extinction properties of gold nanocrescents. Nano Letters, 2007. 7(5): p. 1113-1118.
7 Cacciafesta, P., A.D.L. Humphris, K.D. Jandt, and M.J. Miles, Human plasma fibrinogen adsorption on ultraflat titanium oxide surfaces studied with atomic force microscopy. Langmuir, 2000. 16(21): p. 8167-8175.
8 Cao, Y.W.C., R.C. Jin, and C.A. Mirkin, Nanoparticles with Raman spectroscopic fingerprints for DNA and RNA detection. Science, 2002. 297(5586): p. 1536-1540.
9 Chai, L. and J. Klein, Large Area, Molecularly Smooth (0.2 nm rms) Gold Films for Surface Forces and Other Studies. Langmuir, 2007. ASAP.
10 Cheng, D.K., Fild and Wave Electromagnetics. 2nd ed. 1989, New York: Addison-Wesley.
11 Chidsey, C.E.D., D.N. Loiacono, T. Sleator, and S. Nakahara, STM study of the surface-morphology of gold on mica. Surface Science, 1988. 200(1): p. 45-66.
12 Chu, H.S., W.B. Ewe, E.P. Li and R. Vahldieck, Analysis of sub-wavelength light propagation through long double-chain nanowires with funnel feeding. Optics Express, 2007. 15(7): p. 4216-4223.
13 Clemmer, C.R. and T.P. Beebe, A review of graphite and gold surface studies for use as substrates in biological scanning tunneling microscopy studies. Scanning Microscopy, 1992. 6(2): p. 319-333.
14 Coronado, E., K.L. Kelly, L.L. Zhao and G.C. Schatz, The Optical properties of metal nanoparticles: the influence of size, shape, and dielectric environment. J. Phys. Chem B, 2003. 107: p. 668-677.
15 Coronado, E.A. and G.C. Schatz, Surface plasmon broadening for arbitrary shape nanoparticles: A geometrical probability approach. Journal of Chemical Physics, 2003. 119(7): p. 3926-3934.
16 Dunham I., Shimizu N., Roe BA., Chissoe S., and et al., The DNA sequence of human chromosome. Nature, 1999. 402: p. 489-495.
119

17 Duyne, R.P.V., Nanosphere Lithography: Effect of substrate on the localized surface plasmon resonance spectrum of silver nanoparticles. J. Phys. Chem. B, 2001. 105: p. 2343-2350.
18 Ebbesen, T.W., H.J. Lezec, H.F. Ghaemi, T. Thio, and P.A. Wolff, Extraordinary optical transmission through sub-wavelength hole arrays. Nature, 1998. 391(6668): p. 667-669.
19 Ederth, T., Template-stripped gold surfaces with 0.4-nm rms roughness suitable for force measurements: Application to the Casimir force in the 20-100-nm range. Physical Review A, 2000. 6206(6): p. 8.
20 Elghanian, R., J.J. Storhoff, R.C. Mucic, R.L. Letsinger and C.A. Mirkin, Selective colorimetric detection of polynucleotides based on the distance-dependent optical properties of gold nanoparticles. SCIENCE, 1997. 277: p. 1078-1081.
21 Englebienne, P., A.V. Hoonacker and J. Valsamis, Rapid Homogeneous Immunoassay for Human Ferritin in the Cobas Mira Using Colloidal Gold as the Reporter Reagent. Clinical Chemistry, 2000. 46: p. 2000-2003.
22 Englebienne, P., A.V. Hoonacker, and M. Verhas, Surface Plasmon resonance:principles,methods and applications in biomedical sciences. Spectroscopy, 2003. 17: p. 255-273.
23 Englebienne, P., Use of colloidal gold surface plasmon resonance peak shift to infer affinity constants from the interactions between protein antigens and antibodies specific for single or multiple epitope. Analyst, 1998. 123: p. 1599-1603.
24 Etchegoin, P.G., E.C. Le Ru and M. Meyer, An analytic model for the optical properties of gold. Journal of Chemical Physics, 2006. 125(16).
25 Felidj, N., J. Aubard, G. Levi, J.R. Krenn, G. Schider, A. Leitner, and F.R. Aussenegg, Enhanced substrate-induced coupling in two-dimensional gold nanoparticle arrays. Physical Review B, 2002. 66(24).
26 Foss, C.A., J.G.L. Hornyak, J.A. Stockert and C.R. Martin, Template Synthesized nanoscopic Gold Particles: Optical spectra and the effects of particle size and shape. J. Phys. Chem, 1994. 98: p. 2963-2971.
27 Frey, W., C.K. Woods and A. Chilkoti, Ultraflat nanosphere lithography: A new method to fabricate flat nanostructures. Advanced Materials, 2000. 12(20): p. 1515-1519.
28 Garcia, S.G., B.G. Olmedo and R.G. Martin, A time-domain near- to far-field transformation for FDTD in two dimensions. Microwave and Optical Technology Letters, 2000. 27(6): p. 427-432.
29 Gaubert, H.E. and W. Frey, Highly parallel fabrication of nanopatterned surfaces with nanoscale orthogonal biofunctionalization imprint lithography. Nanotechnology, 2007. 18(13).
30 Ge, C.W., J.H. Liao, Y.H. Wang, K.J. Chen, and N. Gu, DNA assembly on 2-dimensional array of colloidal gold. Biomedical Microdevices, 2003. 5(2): p. 157-162.
31 Glasmastar, K., J. Gold, A.S. Andersson, D.S. Sutherland, and B. Kasemo, Silicone transfer during microcontact printing. Langmuir, 2003. 19(13): p. 5475-5483.
32 Gray, S.K. and T. Kupka, Propagation of light in metallic nanowire arrays: Finite-difference time-domain studies of silver cylinders. Physical Review B, 2003. 68(4).
33 Grigorenko, A.N., Negative refractive index in artificial metamaterials. Optics Letters, 120

121
2006. 31(16): p. 2483-2485. 34 Grupp, D.E., H.K. Lezec, T. Thio, and T.W. Ebbesen, Beyond the bethe limit:Tunable
enhanced light transmission through a single sub-wavelength aperture. Advanced materials, 1999. 11(10): p. 860-862.
35 Gupta, P., K. Loos, A. Korniakov, C. Spagnoli, M. Cowman, and A. Ulman, Facile route to ultraflat SAM-protected gold surfaces by "amphiphile splitting". Angewandte Chemie-International Edition, 2004. 43(4): p. 520-523.
36 Gygi, S.P., Y. Rochon, B.R. Franza, and R. Aebersold, Correlation between protein and mRNA abundance in yeast. Mol. Cell Biol., 1999. 19: p. 1720-1730.
37 Haes, A.J. and R.P. Van Duyne, A Nanoscale Optical Biosensor: Sensitivity and Selectivity of an Approach Based on the Localized Surface Plasmon Resonance Spectroscopy of Triangular Silver Nanoparticles. J. Am. Chem. Soc., 2002. 124: p. 10596-10604.
38 Haes, A.J. and R.P. Van Duyne, Preliminary studies and potential applications of localized surface plasmon resonance spectroscopy in medical diagnostics. Expert Review of Molecular Diagnostics, 2004. 4(4): p. 527-537.
39 Haes, A.J., S.L. Zou, G.C. Schatz and R.P. Van Duyne, A nanoscale optical biosensor: The long range distance dependence of the localized surface plasmon resonance of noble metal nanoparticles. Journal of Physical Chemistry B, 2004. 108(1): p. 109-116.
40 Haes, A.J., S.L. Zou, G.C. Schatz and R.P. Van Duyne, Nanoscale optical biosensor: Short range distance dependence of the localized surface plasmon resonance of noble metal nanoparticles. Journal of Physical Chemistry B, 2004. 108(22): p. 6961-6968.
41 Haes, A.J., W.P. Hall, L. Chang, W.L. Klein and R.P. Van Duyne, A localized surface plasmon resonance biosensor: First steps toward an assay for Alzheimer's disease. Nano Letters, 2004. 4(6): p. 1029-1034.
42 Hafner, C. and N. Kuster, Computations of Electromagnetic-Fields by the Multiple Multipole Method (Generalized Multipole Technique). Radio Science, 1991. 26(1): p. 291-297.
43 Hamann, H.F., M. Larbadi, S. Barzen, T. Brown, A. Gallagher and D.J. Nesbitt, Extinction near-field optical microscopy. Optics Communications, 2003. 227(1-3): p. 1-13.
44 Hao, E. and G.C. Schatz, Electromagnetic fields around silver nanoparticles and dimers. Journal of Chemical Physics, 2004. 120(1): p. 357-366.
45 Hao, E., R.C. Bailey, G.C. Schatz, J.T. Hupp and S.Y. Li, Synthesis and optical properties of "branched" gold nanocrystals. Nano Letters, 2004. 4(2): p. 327-330.
46 Harrington, R.F., Field Computation by Moment Methods 1983, N.Y.: R.E. Krieger Pub. Co., .
47 Haynes, C.L. and R.P. Van Duyne, Nanosphere lithography: A versatile nanofabrication tool for studies of size-dependent nanoparticle optics. Journal of Physical Chemistry B, 2001. 105(24): p. 5599-5611.
48 Hegner, M., P. Wagner, and G. Semenza, Ultralarge atomically flat template-stripped au surfaces for scanning probe microscopy. Surface Science, 1993. 291(1-2): p. 39-46.
49 Hirsch, L.R., R.J. Stafford, J.A. Bankson, S.R. Sershen, B. Rivera, R.E. Price, J.D. Hazle, N.J. Halas, and J.L. West, Nanoshell-mediated near-infrared thermal therapy of

tumors under magnetic resonance guidance. Proceedings of the National Academy of Sciences of the United States of America, 2003. 100(23): p. 13549-13554.
50 Holland, W.R. and D.G. Hall, Frequency-Shifts of an Electric-Dipole Resonance near a Conducting Surface. Physical Review Letters, 1984. 52(12): p. 1041-1044.
51 Huang, Y.W. and V.K. Gupta, Effects of physical heterogeneity on the adsorption of poly(ethylene oxide) at a solid-liquid interface. Macromolecules, 2001. 34(11): p. 3757-3764.
52 Huffman, D.R. and C.F. Bohren, Absorption and Scattering of Light by Small Particles. 1998, New York: John Wiley & Sons.
53 Hulteen, J.C., D.A. Treichel, M.T. smith, M.L. Duval, T.R. Jensen and R.P. VanDuyne, Nanosphere Lithography: Size-Tunable Silver Nanoparticle and Surface Cluster Arrays. J. Phys. Chem B, 1999. 103: p. 3854-3863.
54 II, J.T.K., E.J. Sanchez and X.S. Xie, Design of near-field optical probes with optimal field enhancement by finite difference time domain electromagnetic simulation. Journal of Chemical Physics, 2002. 116: p. 10895-10901.
55 Jain, P.K., K.S. Lee, I.H. El-Sayed and M.A. El-Sayed, Calculated absorption and scattering properties of gold nanoparticles of different size, shape, and composition: Applications in biological imaging and biomedicine. Journal of Physical Chemistry B, 2006. 110(14): p. 7238-7248.
56 Jensen, T., L. Kelly, A. Lazarides and G.C. Schatz, Electrodynamics of noble metal nanoparticles and nanoparticle clusters. Journal of Cluster Science, 1999. 10: p. 295-317.
57 Jensen, T., M. Duval, K.L. Kelly, A.A. Lazarides, G.C. Schatz and R.P.V. Duyne., Nanosphere Lithography: Effect of the external dielectric medium on the surface plasmon resonance spectrum of a periodic array of silver nanoparticles. J. Phys. Chem B, 1999. 103: p. 9846-9853.
58 Jensen, T., M.D. Malinsky, C.L. Haynes and R.P.V. Duyne., Nanosphere Lithography:Tunable localized surface plasmon resonance spectra of silver nanoparticles. J. Phys. Chem B, 2000. 104: p. 10549-10556.
59 Jin, R., Y. Cao, C.A. Mirkin, K.L. Kelly, G.C. Schatz, and J.G. Zheng, Photoinduced conversion of silver nanospheres to nanoprisms. Science, 2001. 294: p. 1901-1903.
60 Johnson, P.B. and R.W. Christy, Optical Constants of the Noble Metals Phys. Rev. B, 1972. 6: p. 4370-4379.
61 K. S. Yee, Numerical solution of initial boundary value problems involving Maxwell's equations in isotropic media. IEEE Trans. Antennas Propag., 1966. 14: p. 302-307.
62 Katz, E. and I. Willner, Integrated nanoparticle-biomolecule hybrid systems: Synthesis, properties, and applications. Angewandte Chemie-International Edition, 2004. 43(45): p. 6042-6108.
63 Kellner, R., Proteomics. Concepts and perspectives. Fresenius J Anal Chem, 2000. 366: p. 517-524.
64 Kelly, K.L., E. Coronado, L.L. Zhao, and G.C. Schatz, The optical properties of metal nanoparticles: The influence of size, shape, and dielectric environment. Journal of Physical Chemistry B, 2003. 107(3): p. 668-677.
65 Klar, T., M. Perner, S. Grosse, G.v. Plessen, W. Spirkl, and J. Feldmann, Surface-Plasmon Resonances in Single Metallic Nanoparticles. Physical Review Letters, 1998.
122

80: p. 4249-4252. 66 Kreibig, U. and M. Vollmer, Optical Properties of Metal Clusters. 1995, Berlin:
Springer. 67 Kume, T., N. Nakagawa, S. Hayashi, and K. Yamamoto, Interaction between
Localized and Propagating Surface-Plasmons - Ag Fine Particles on Al Surface. Solid State Communications, 1995. 93(2): p. 171-175.
68 Kunz, K.S. and R.J. Luebbers, The Finite Difference Time Domain Method for Electromagnetics 1993: CRC.
69 Lamprecht, B., G. Schider, R.T. Lechner, H. Ditlbacher, J.R. Krenn, A. Leitner and F.R. Aussenegg, Metal nanoparticle gratings: Influence of dipolar particle interaction on the plasmon resonance. Physical Review Letters, 2000. 84(20): p. 4721-4724.
70 Lavrinenko, A., P.I. Borel, L.H. Frandsen, M. Thorhauge, A. Harpoth, M. Kristensen, T. Niemi and H.M.H. Chong, Comprehensive FDTD modelling of photonic crystal waveguide components. Optics Express, 2004. 12(2): p. 234-248.
71 Lee, K.S. and M.A. El-Sayed, Gold and silver nanoparticles in sensing and imaging: Sensitivity of plasmon response to size, shape, and metal composition. Journal of Physical Chemistry B, 2006. 110(39): p. 19220-19225.
72 Leitner, A., Z.S. Zhao, H. Brunner, F.R. Aussenegg, and A. Wokaun, Optical-Properties of a Metal Island Film Close to a Smooth Metal-Surface. Applied Optics, 1993. 32(1): p. 102-110.
73 Liu, J.W. and Y. Lu, Adenosine-dependent assembly of aptazyme-functionalized gold nanoparticles and its application as a colorimetric biosensor. Analytical Chemistry, 2004. 76(6): p. 1627-1632.
74 Liz-Marzan, L.M., Tailoring surface plasmons through the morphology and assembly of metal nanoparticles. Langmuir, 2006. 22(1): p. 32-41.
75 Loo, C., A. Lin, L. Hirsch, M.H. Lee, J. Barton, N. Halas, J. West, and R. Drezek, Nanoshell-enabled photonics-based imaging and therapy of cancer. Technology in Cancer Research & Treatment, 2004. 3(1): p. 33-40.
76 Lussem, B., S. Karthauser, H. Haselier, and R. Waser, The origin of faceting of ultraflat gold films epitaxially grown on mica. Applied Surface Science, 2005. 249(1-4): p. 197-202.
77 MacBeath, G. and S.L. Schreiber, Printing proteins as microarrays for high-throughput function determination. Science, 2000. 289(5485): p. 1760-1763.
78 Malinsky, M.D., K.L. Kelly, G.C. Schatz and R.V. Duyne, Chain Length Dependence and Sensing Capabilities of the Localized Surface Plasmon Resonance of Silver Nanoparticles Chemically Modified with Alkanethiol Self-Assembled Monolayers. J. Am. Chem. Soc., 2001. 123: p. 1471-1482.
79 McFarland, A.D. and R.P. Van Duyne, Signle Silver Nanoparticles as real-time optical sensors with zeptomole sensitivity. Nano letters, 2003. 3: p. 1057-1062.
80 Meier, M. and A. Wokaun, Enhanced fields on large metal particles: dynamic depolarization. Optics Letters, 1983. 8: p. 581-583.
81 Micic, M., N. Klymyshyn and H.P. Lu, Finite element method simulations of the near-field enhancement at the vicinity of fractal rough metallic surfaces. Journal of Physical Chemistry B, 2004. 108(9): p. 2939-2947.
123

82 Miller, M.M. and A.A. Lazarides, Sensitivity of metal nanoparticle surface plasmon resonance to the dielectric environment. Journal of Physical Chemistry B, 2005. 109(46): p. 21556-21565.
83 Milner, R.G. and D. Richards, The role of tip plasmons in near-field Raman microscopy. Journal of Microscopy-Oxford, 2001. 202: p. 66-71.
84 Mirkin, C.A., Nanoparticles with Raman spectroscopic fingerprints for DNA and RNA detection. SCIENCE, 2002. 297: p. 1536-1540.
85 Mirkin, C.A., R.L. Letsinger, R.C. Mucic and J.J. Storhoff, A DNA-based method for rationally assembling nanoparticles into macroscopic materials. Nature, 1996. 382(6592): p. 607-609.
86 Mishchenko, M.I., L.D. Travis and A. Macke, Scattering of light by polydisperse, randomly oriented, finite circular cylinders. Applied Optics, 1996. 35(24): p. 4927-4940.
87 Mishchenko, M.I., L.D. Travis and A.A. Lacis, Scattering, Absorption, and Emission of Light by Small Particles 2002: Cambridge University Press.
88 Mock, J.J., D.R. Smith and S. Schultz, Local refractive index dependence of plasmon resonance spectra from individual nanoparticles. Nanoletters, 2003. 3(4): p. 485-491.
89 Mock, J.J., M. Barbic, D.R. Smith, D.A. Schultz and S.Schultz, Shape effects in plasmon resonance of individual colloidal silver nanoparticles. Journal of Chemical Physics, 2002. 116: p. 6755-6759.
90 Mosley, D.W., B.Y. Chow, and J.A. Jacobson, Solid-state bonding technique for template-stripped ultraflat gold substrates. Langmuir, 2006. 22(6): p. 2437-2440.
91 Mulvaney, P., L.M. Liz-Marzan, M. Giersig and T. Ung, Silica encapsulation of quantum dots and metal clusters. Journal of Materials Chemistry, 2000. 10(6): p. 1259-1270.
92 Nath, N. and A. Chilkoti, A colorimetric gold nanoparticle sensor to interrogate biomolecular interactions in real time on a surface. Analytical Chemistry, 2002. 74(3): p. 504-509.
93 Nath, N. and A. Chilkoti, Label free colorimetric biosensing using nanoparticles. Journal of Fluorescence, 2004. 14(4): p. 377-389.
94 Nath, N. and A. Chilkoti, Label-Free Biosensing by Surface Plasmon Resonance of Nanoparticles on Glass:Optimization of Nanoparticle Size. Analytical Chemistry, 2004. 76: p. 5370-5378.
95 Naumann, R., S.M. Schiller, F. Giess, B. Grohe, K.B. Hartman, I. Karcher, I. Koper, J. Lubben, K. Vasilev, and W. Knoll, Tethered lipid Bilayers on ultraflat gold surfaces. Langmuir, 2003. 19(13): p. 5435-5443.
96 Nehl, C.L., N.K. Grady, G.P. Goodrich, F. Tam, N.J. Halas and J.H. Hafner, Scattering spectra of single gold nanoshells. Nano Letters, 2004. 4(12): p. 2355-2359.
97 Niemeyer, C.M., B. Ceyhan, S. Gao, L. Chi, S. Peschel and U. Simon, Site-selective immobilization of gold nanoparticles functionalized with DNA oligomers. Colloid and Polymer Science, 2001. 279(1): p. 68-72.
98 Noah, J.W., S. Park, J.T. Whitt, J. Perutka, W. Frey, and A.M. Lambowitz, Atomic force microscopy reveals DNA bending during group II intron ribonucleoprotein particle integration into double-stranded DNA. Biochemistry, 2006. 45(41): p. 12424-12435.
124

99 Ohlberg, D., J.J. Blackstock, R. Ragan, S. Kim, and R.S. Williams, Optimization of in-vacuo template-stripped Pt surfaces via UHVSTM. Applied Physics a-Materials Science & Processing, 2005. 80(6): p. 1327-1334.
100 Palmer, R.E., B.J. Eves, F. Festy, and K. Svensson, Scanning probe energy loss spectroscopy. Surface Science, 2002. 502: p. 224-231.
101 Perez-Juste, J., I. Pastoriza-Santos, L.M. Liz-Marzan and P. Mulvaney, Gold nanorods: Synthesis, characterization and applications. Coordination Chemistry Reviews, 2005. 249(17-18): p. 1870-1901.
102 Phizicky, E., P.I.H. Bastiaens, H. Zhu, M. Snyder, and S. Fields, Protein analysis on a proteomic scale. Nature, 2003. 422(6928): p. 208-215.
103 Pinchuk, A., A. Hilger, G. von Plessen, and U. Kreibig, Substrate effect on the optical response of silver nanoparticles. Nanotechnology, 2004. 15(12): p. 1890-1896.
104 Priest, C.I., K. Jacobs, and J. Ralston, Novel approach to the formation of smooth gold surfaces. Langmuir, 2002. 18(6): p. 2438-2440.
105 Prodan, E., C. Radloff, N.J. Halas, and P. Nordlander, A hybridization model for the plasmon response of complex nanostructures. Science, 2003. 302(5644): p. 419-422.
106 Putnam, A., B.L. Blackford, M.H. Jericho, and M.O. Watanabe, Surface-topography study of gold deposited on mica using scanning tunneling microscopy - effect of mica temperature. Surface Science, 1989. 217(1-2): p. 276-288.
107 Rademann, J. and G. Jung, Integrating Combinatorial Synthesis and Bioassays. SCIENCE, 2000. 287: p. 1947-1948.
108 Raschke, G., S. Kowarik, C.S. T. Franzl, T.A. Klar and J. Feldmann, Biomolecular Recognition Based on Single Gold Nanoparticle Light Scattering. Nano letters, 2003. 3(7): p. 935-938.
109 Riepl, M., K. Enander, B. Liedberg, M. Schaferling, M. Kruschina and F. Ortigao, Functionalized surfaces of mixed alkanethiols on gold as a platform for oligonucleotide microarrays. Langmuir, 2002. 18(18): p. 7016-7023.
110 Rossetti, F.F., I. Reviakine, and M. Textor, Characterization of titanium oxide films prepared by the template-stripping method. Langmuir, 2003. 19(24): p. 10116-10123.
111 Saj, W.M., FDTD simulations of 2D plasmon waveguide on silver nanorods in hexagonal lattice. Optics Express, 2005. 13(13): p. 4818-4827.
112 Salerno, M., J.R. Krenn, A. Hohenau, H. Ditlbacher, G. Schider, A. Leitner, and F.R. Aussenegg, The optical near-field of gold nanoparticle chains. Optics Communications, 2005. 248(4-6): p. 543-549.
113 Sanchez-Iglesias, A., I. Pastoriza-Santos, J. Perez-Juste, B. Rodriguez-Gonzalez, F.J.G. de Abajo and L.M. Liz-Marzan, Synthesis and optical properties of gold nanodecahedra with size control. Advanced Materials, 2006. 18(19): p. 2529-+.
114 Sherry, L.J., R.C. Jin, C.A. Mirkin, G.C. Schatz and R.P. Van Duyne, Localized surface plasmon resonance spectroscopy of single silver triangular nanoprisms. Nano Letters, 2006. 6(9): p. 2060-2065.
115 Sherry, L.J., S.H. Chang, G.C. Schatz, R.P. Van Duyne, B.J. Wiley and Y.N. Xia, Localized surface plasmon resonance spectroscopy of single silver nanocubes. Nano Letters, 2005. 5(10): p. 2034-2038.
116 Shlager, K.L. and J.B. Schneider, Selective Survey of the Finite-Difference Time-Domain Literature. Ieee Antennas and Propagation Magazine, 1995. 37(4): p. 39-57.
125
117 Shumaker-Parry, J.S. and C.T. Campbell, Quantitative methods for spatially resolved adsorption/desorption measurements in real time by surface plasmon resonance microscopy. Analytical Chemistry, 2004. 76(4): p. 907-917.
118 Sokolov, k., J. Aaron, S. Kumar, V. Mack, T. Collier, L. Coghlan, A. Gillenwater, A.K. Storthz, M. Follen, and R.R. Kortum. Molecular Imaging of Carcinogenesis with Immuno-Targeted Nanoparticles. in Proceedings of the 26th Annual International Conference of the IEEE EMBS 2004. San Francisco, CA, USA.
119 Stamou, D., D. Gourdon, M. Liley, N.A. Burnham, A. Kulik, H. Vogel, and C. Duschl, Uniformly flat gold surfaces: Imaging the domain structure of organic monolayers using scanning force microscopy. Langmuir, 1997. 13(9): p. 2425-2428.
120 Storhoff, J.J., A.A. Lazarides, R.C. Mucic, C.A. Mirkin, R.L. Letsinger, and G.C. Schatz, What controls the optical properties of DNA-linked gold nanoparticle assemblies? Journal of the American Chemical Society, 2000. 122(19): p. 4640-4650.
121 Stratton, J.A. and L.J. Chu, Diffraction Theory of Electromagnetic Waves Phys. Rev., 1939. 56: p. 99-107.
122 Sullivan, D.M., Electromagnetic Simulation Using the FDTD Method. 2000, N.Y.: Wiley-IEEE Press.
123 Taflove, A. and S.C. Hagness, Computational Electrodynamics: The Finite-Difference Time-Domain Method (Artech House Antennas and Propagation Library) 3rd ed. 2000: ARTECH HOUSE, INC.
124 Takeda, Y., T. Motohiro, T. Hioki, and S. Noda, Nonlinear-Optical Properties Due to the Thermal Effect in a Prism-Coupled Zns Thin-Film. Journal of the Optical Society of America B-Optical Physics, 1995. 12(10): p. 1905-1908.
125 TAKEMORI, T., M. INOUE, and K. OHTAKA, Optical Response of a Sphere Coupled to a Metal Substrate. Journal of the Physical Society of Japan, 1987. 56(4): p. 1587-1602.
126 Thio, T., T.W. Ebbesen, H.J. Lezec, K.M. Pellerin, G.D. Lewen, A. Nahata, and R.A. Linke, Giant optical transmission of sub wavelength apertures: physics and applications. Nanotechnology, 2002. 13: p. 429-432.
127 Tracz, A., G. Wegner, and J.P. Rabe, Kinetics of surface roughening via pit growth during the oxidation of the basal-plane of graphite .1. Experiments. Langmuir, 1993. 9(11): p. 3033-3038.
128 Tsuji, Y. and M. Koshiba, Guided-mode and leaky-mode analysis by imaginary distance beam propagation method based on finite element scheme. Journal of Lightwave Technology, 2000. 18(4): p. 618-623.
129 Vial, A., A.S. Grimault, D. Macias, D. Barchiesi and M.L. de la Chapelle, Improved analytical fit of gold dispersion: Application to the modeling of extinction spectra with a finite-difference time-domain method. Physical Review B, 2005. 71(8).
130 Wagner, P., M. Hegner, H.J. Guntherodt, and G. Semenza, Formation and in-situ modification of monolayers chemisorbed on ultraflat template-stripped gold surfaces. Langmuir, 1995. 11(10): p. 3867-3875.
131 Wang, T.J. and W.S. Lin, Electro-optically modulated localized surface plasmon resonance biosensors with gold nanoparticles. Applied Physics Letters, 2006. 89(17).
132 Watzke, A., M. Kohn, M. Gutierrez-Rodriguez, R. Wacker, H. Schroder, R. Breinbauer, J. Kuhlmann, K. Alexandrov, C.M. Niemeyer, R.S. Goody, and H.
126

Waldmann, Site-selective protein immobilization by Staudinger ligation. Angewandte Chemie-International Edition, 2006. 45(9): p. 1408-1412.
133 Weisenhorn, A.L., M. Egger, F. Ohnesorge, S.A.C. Gould, S.P. Heyn, H.G. Hansma, R.L. Sinsheimer, H.E. Gaub, and P.K. Hansma, Molecular-resolution images of langmuir-blodgett-films and dna by atomic force microscopy. Langmuir, 1991. 7(1): p. 8-12.
134 Whitney, A.V., J.W. Elam, S.L. Zou, A.V. Zinovev, P.C. Stair, G.C. Schatz and R.P. Van Duyne, Localized surface plasmon resonance nanosensor: A high-resolution distance-dependence study using atomic layer deposition. Journal of Physical Chemistry B, 2005. 109(43): p. 20522-20528.
135 Wink, T., S.J. VanZuilen, A. Bult and W.P. vanBennekom, Liposome-mediated enhancement of the sensitivity in immunoasssays of proteins and peptides in surface plasmon resonance spectrometry. Analytical Chemistry, 1998. 70: p. 827-832.
136 Wokaun, A., J.P. Gordon and P.F. Liao, Radiation Damping in Surface-Enhanced Raman Scattering. Physical Review Letters, 1982. 48: p. 957-960.
137 Woodard, N.G. and G.P. Lafyatis, Fabrication and characterization of extremely smooth large area gold surfaces. Journal of Vacuum Science & Technology a-Vacuum Surfaces and Films, 1996. 14(2): p. 332-335.
138 Wright, J.P., O. Worsfold, C. Whitehouse, and M. Himmelhaus, Ultraflat ternary nanopatterns fabricated using colloidal lithography. Advanced Materials, 2006. 18(4): p. 421-+.
139 Xiong, Y.J., J.Y. Chen, B. Wiley, Y.A. Xia, Y.D. Yin and Z.Y. Li, Size-dependence of surface plasmon resonance and oxidation for pd nanocubes synthesized via a seed etching process. Nano Letters, 2005. 5(7): p. 1237-1242.
140 Yadavalli, V.K., J.G. Forbes, and K. Wang, Functionalized self-assembled monolayers on ultraflat gold as platforms for single molecule force spectroscopy and imaging. Langmuir, 2006. 22(16): p. 6969-6976.
141 Yamamoto, M., Y. Kashiwagi, T. Sakata, H. Mori and M. Nakamoto, Synthesis and morphology of star-shaped gold nanoplates protected by poly(N-vinyl-2-pyrrolidone). Chemistry of Materials, 2005. 17(22): p. 5391-5393.
142 Young, J.L. and R.O. Nelson, A summary and systematic analysis of FDTD algorithms for linearly dispersive media. Ieee Antennas and Propagation Magazine, 2001. 43(1): p. 61-77.
143 Zeng, Y.X., L.H. Chen, Y.L. Zou, P.A. Nguyen, J.D. Hansen and T.L. Alford, Processing and encapsulation of silver patterns by using reactive ion etch and ammonia anneal. Materials Chemistry and Physics, 2000. 66(1): p. 77-82.
144 Zheng, J., L.Y. Li, H.K. Tsao, Y.J. Sheng, S.F. Chen, and S.Y. Jiang, Strong repulsive forces between protein and oligo (ethylene glycol) self-assembled monolayers: A molecular simulation study. Biophysical Journal, 2005. 89(1): p. 158-166.
145 Zhou, D.J., X.Z. Wang, L. Birch, T. Rayment, and C. Abell, AFM study on protein immobilization on charged surfaces at the nanoscale: Toward the fabrication of three-dimensional protein nanostructures. Langmuir, 2003. 19(25): p. 10557-10562.
127

Vita
Bong-su Jung was born in Seoul, Korea on August 10th, 1972, as the eldest son of
Woongchoong Jung and Eunsook Lee. After graduating from Junil High School in Jeon-
Ju city, Korea in February 1991 he attended the department of Biomedical Engineering,
Yonsei University, Korea. During college, from 1994 to 1996, he entered military
service. He received the degree of Bachelor of Engineering from Yonsei University in
February 1997. He joined a hardware research engineer team in the Research and
Development Center at General Electric Medical Systems in Korea. While there from
1997 to 2001, he participated in designing an ultrasound diagnosis system,
Logiq200 PRO and Logiq400 PRO. He received Best Engineer of the Year and Best
Employee of the Year in 2000 and 2001, the most prestigious awards in the company. In
September 2001, he entered the Biomedical Engineering department of the University of
Texas at Austin, where he completed an M.S. degree in 2005 and a Ph.D. in September
2007. He is a member of the Materials Research Society, the American Institute of
Chemical Engineers, Biomedical Engineering Society, and the Korean Society for
Medical and Biological Engineering. In his free time he volunteers and lead a small bible
study group for young adults at the Korean Baptist Church of Austin. Permanent address: 1103-402 Dong-Sung Apt. ,Bang-Hwa-2 Dong,
Kang Seo Gu , Seoul , Korea 157-222
This dissertation was typed by the author.
128